Multivalent Heparin Binding and Sensing Stephen Marriott Bromfield PhD University of York Chemistry September 2014

Welcome message from author
This document is posted to help you gain knowledge. Please leave a comment to let me know what you think about it! Share it to your friends and learn new things together.
Transcript

Multivalent Heparin
Binding and Sensing
Stephen Marriott Bromfield
PhD
University of York
Chemistry
September 2014

2
Abstract
Heparin therapy involves the clinical use of heparin as an anti-coagulant, for example,
during surgery. At the conclusion of treatment, systemic heparin levels must be
quantified to allow accurate dosing of a heparin antidote. This thesis details work
towards a better sensing methodology and an improved antidote.
A synthetically-simple arginine-functionalized dye – Mallard Blue (MalB) – was
synthesised and shown able to detect heparin across a clinically relevant concentration
range in biological media such as human serum. The heparin binding of MalB is
selective over structurally related glycosaminoglycans and is highly tolerant of
electrolytic competition. Indeed, the performance of MalB is comparable with the best
heparin sensors currently known and makes it the new best-in-class thionine dye.
Mallard Blue was developed into a straightforward competition assay able to report on
the relative heparin binding efficiencies of candidate molecules in competitive media,
including human serum. Using this assay in conjunction with molecular dynamics
modelling techniques, fundamental insights into the binding of poly(amidoamine)
(PAMAM) dendrimers to heparin were gained. Interestingly, the medium sized (G2-G4)
dendrimers achieved the most charge-efficient heparin binding. Comparisons against
derivatives modified with poly(phenylenevinylene) cores revealed native PAMAMs to
be exponents of adaptive multivalency, in contrast to the more rigid derivatives’ shape-
persistent multivalency.
The performance of self-assembled multivalent (SAMul) heparin binder C22G1DAPMA
was studied in different biological media and shown to be more charge-efficient than
the currently used heparin antidote under competitive conditions. Also, C22G1DAPMA
was able to reverse anti-coagulation in heparinized human plasma and degrade on a
clinically interesting timescale. Structural modifications afforded two new families of
SAMul binders, which unveiled fundamental differences in the chiral preferences of
heparin and DNA, along with probing the effects of nanoscale morphology on heparin
binding ability and aggregate-stability in serum.

3
Table of Contents
Abstract ............................................................................ 2
Table of Contents ............................................................. 3
List of Figures .................................................................. 6
List of Tables .................................................................. 16
List of Schemes .............................................................. 19
List of Equations ............................................................ 20
Acknowledgements ........................................................ 22
Declaration ..................................................................... 23
1 Introduction ........................................................... 24
1.1 From Multivalency to Self-Assembling Multivalency (SAMul) . 24
1.1.1 Multivalency ................................................................................................. 24
1.1.2 Self-Assembly ............................................................................................... 33
1.1.3 Self-Assembling Multivalency (SAMul) ..................................................... 35
1.2 Heparin Therapy............................................................................. 42
1.2.1 Heparin: the anti-coagulant of choice ........................................................ 42
1.2.2 Heparin Rescue ............................................................................................ 45
1.3 Heparin Sensing .............................................................................. 47
1.3.1 Monitoring heparin levels ........................................................................... 47
1.3.2 Electrochemical sensing .............................................................................. 49
1.3.3 Colorimetric sensing .................................................................................... 49
1.3.4 Solid/nanoparticle supported sensing ......................................................... 57
1.4 Heparin Binding .............................................................................. 59
1.4.1 Enzymatic, protein-based and polymeric systems ....................................... 59
1.4.2 Small molecules ........................................................................................... 61
1.4.3 Self-assembling systems ............................................................................... 64
1.5 Project Aims .................................................................................... 65
1.5.1 Heparin sensing ........................................................................................... 66
1.5.2 Heparin binding ........................................................................................... 66
2 Chapter 2 – A Simple Robust Heparin Sensor .... 69
2.1 Introduction ..................................................................................... 69
2.2 Considering Commercial Options ................................................. 70
2.3 A New Dye is Born .......................................................................... 76

4
2.4 Mallard Blue: Initial Studies ......................................................... 78
2.5 Mallard Blue: Establishing Clinical Relevance ........................... 83
2.6 Mallard Blue: Further Studies ...................................................... 87
2.7 Conclusions & Future Work .......................................................... 90
3 Insights into Heparin Binding .............................. 93
3.1 Introduction ..................................................................................... 93
3.2 Mallard Blue Heparin Binding Competition Assay .................... 97
3.2.1 Electrolytically Competitive Conditions ...................................................... 97
3.2.2 Clinically Relevant Conditions .................................................................... 99
3.3 Studying Generational Effects in PAMAM Dendrimers .......... 101
3.3.1 PAMAM Dendrimers ................................................................................. 101
3.3.2 Heparin Binding in Competitive Conditions ............................................ 102
3.3.3 Heparin Binding in Clinically Relevant Conditions ................................ 107
3.3.4 Summary .................................................................................................... 108
3.4 Studying Effects of Rigidity and Flexibility with Transgeden
Dendrimers .............................................................................................. 109
3.4.1 Transgeden (TGD) Dendrimers ................................................................ 109
3.4.2 Heparin Binding Studies in Competitive Conditions ............................... 111
3.5 Modified Transgeden Dendrimers .............................................. 118
3.6 Conclusion and Future Work ...................................................... 120
4 Self-Assembling Multivalent Heparin Binders I:
DAPMA-containing system ........................................ 123
4.1 Introduction ................................................................................... 123
4.1.1 Background ................................................................................................ 123
4.1.2 Preliminary Work211
................................................................................... 125
4.2 Effects of Different Media on Heparin Binding ......................... 127
4.2.1 Heparin Binding in Competitive Conditions ............................................ 127
4.2.2 Heparin Binding in Clinically Relevant Conditions ................................ 134
4.2.3 Degradation Studies ................................................................................... 138
4.3 Conclusions and Future Work .................................................... 143
5 Self-Assembling Multivalent Heparin Binders II:
Lysine-containing systems .......................................... 145
5.1 Introduction ................................................................................... 145
5.2 Generation 1 Systems ................................................................... 147
5.2.1 Synthesis of C22G1LLys and C22G1DLys ................................................... 147
5.2.2 Self-Assembly Studies ................................................................................ 152
5.2.3 Heparin Binding in Competitive Conditions ............................................ 157

5
5.2.4 Heparin Binding in Clinically Relevant Conditions ................................ 160
5.2.5 Degradation ................................................................................................ 162
5.2.6 DNA Binding .............................................................................................. 169
5.3 Generation 2 Systems ................................................................... 176
5.3.1 Synthesis of C22G2LLys and C22G2DLys ................................................... 176
5.3.2 Self-Assembly Studies ................................................................................ 179
5.3.3 Heparin Binding in Competitive Conditions ............................................ 183
5.3.4 Degradation ................................................................................................ 186
5.3.5 DNA Binding .............................................................................................. 189
5.4 Conclusions and Future Work .................................................... 191
5.4.1 Conclusions ................................................................................................ 191
5.4.2 Future Work ............................................................................................... 192
6 Hydrophobically-Enhanced Self-Assembling
Heparin Binders .......................................................... 194
6.1 Introduction ................................................................................... 194
6.2 Generation 1 (G1) Systems .......................................................... 196
6.2.1 Lysine-containing system (G1) .................................................................. 196
6.2.2 Ornithine-containing systems .................................................................... 208
6.3 Generation 2 (G2) Lysine-containing System ............................ 216
6.3.1 Synthesis of (C12)2LAspLLys(LLys)2 and (C12)2DAspDLys(DLys)2 ............ 217
6.3.2 Self-Assembly Studies ................................................................................ 218
6.3.3 Heparin Binding in Competitive Conditions ............................................ 220
6.3.4 Heparin Binding in Clinically Relevant Conditions ................................ 222
6.4 Conclusions and Future Work .................................................... 223
7 Experimental ........................................................ 226
7.1 Synthetic Materials and Methods ............................................... 226
7.2 Assay Materials and Methods...................................................... 261
Abbreviations ............................................................... 266
References .................................................................... 268
6
List of Figures
Figure 1.1 – Schematic cartoon of (a) a virus binding to cell surface and (b) a dendritic
polymer binding to DNA. ............................................................................................... 25
Figure 1.2 – Schematic representations of allosteric, chelate and interannular
cooperativity. ................................................................................................................... 27
Figure 1.3 – Example of interannular cooperativity from the work of Shinkai and co-
workers.14
........................................................................................................................ 28
Figure 1.4 – Schematic cartoon of stepwise dissociation of a multivalent binder in the
absence and presence of a competitor. ............................................................................ 30
Figure 1.5 – Schematic depiction of trivalent vancomycin host-guest complex (top)
along with comparison of monomeric vancomycin binding to D-Ala-D-Lys (bottom left)
and mutated D-Ala-lactate (bottom right). ...................................................................... 31
Figure 1.6 – Trivalent pseudorotaxanes from the group of Stoddart. Figure adapted
from reference 32
. ............................................................................................................ 32
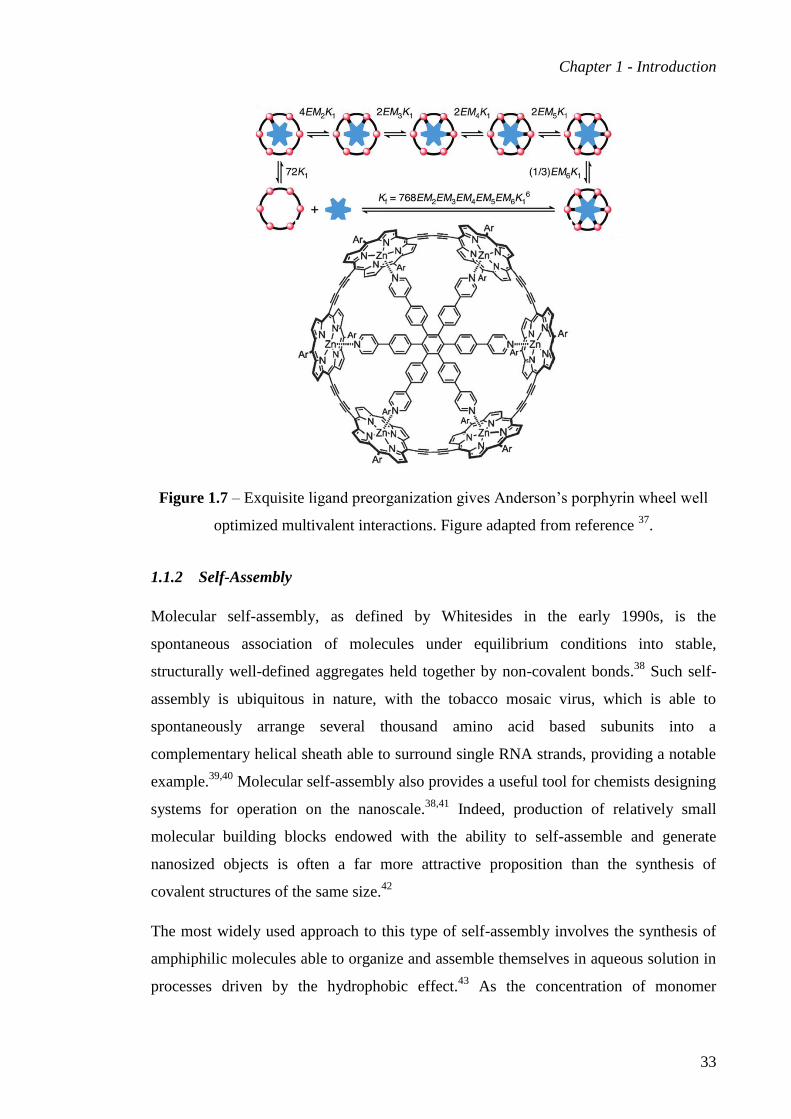
Figure 1.7 – Exquisite ligand preorganization gives Anderson’s porphyrin wheel well
optimized multivalent interactions. Figure adapted from reference 37
. ........................... 33
Figure 1.8 – The work of Israelachvili allowed aggregate morphology in aqueous
solution to be predicted as a function of critical packing parameter............................... 35
Figure 1.9 – The hydrophobically modified sialic acid derivative from the group of
Whitesides was one of the earliest examples of self-assembled multivalency (SAMul).47
......................................................................................................................................... 36
Figure 1.10 – Cartoon of Ravoo and co-workers’ cyclodextrin vesicles (large grey
structure) decorated with adamantine-maltose ligands (red and orange) for Con A
binding (green). Image reproduced from reference 49
. .................................................... 37
Figure 1.11 – Amphiphilic galactosamine-conjugate from the group of Bertozzi self-
assembled along CNTs to achieve high-affinity lectin binding.51
.................................. 37
Figure 1.12 – Self-assembling multivalent mannose-functionalised lectin-binding
discotic molecules from Brunsveld and co-workers. Figure adapted from reference 52
. 38

7
Figure 1.13 – Integrin binding systems from the work of Smith and co-workers.56
...... 40
Figure 1.14 – Example spermine-containing DNA binding systems from the groups of
(a) Cheng,64
(b) Ravoo66
and (c) Smith.65
....................................................................... 41
Figure 1.15 – An example heparin polysaccharide (top) along with the predominant
disaccharide repeat unit (bottom left) and the specific pentasaccharide sequence
required to confer anticoagulant activity (bottom right). ................................................ 42
Figure 1.16 – Schematic representation of the blood coagulation cascade. ................... 44
Figure 1.17 – An example protamine structure (a) with the prevalent arginine residues
depicted as wedges, adapted from reference 101
and (b) a molecular dynamic modelling
snapshot of protamine, taken from reference 102
. ............................................................ 45
Figure 1.18 – Schematic representation of heparin binding to Yang’s quaternary amine
functionalized membrane.135
........................................................................................... 49
Figure 1.19 – Anslyn’s heparin sensors operating (a) in an indicator displacement
regime144
and (b) using a single molecule fluorescent sensor.145
These structures are also
shown in Figure 3.2. ........................................................................................................ 51
Figure 1.20 – Fluorescent sugar-containing heparin sensors from the groups of (a)
Chen147
and (b) Bhosale.148
............................................................................................. 52
Figure 1.21 – A polyfluorene heparin sensing derivative from Liu and co-workers.154
53
Figure 1.22 – A perylene diimide sensor structure from Krämer and co-workers.158
.... 54
Figure 1.23 – Heparin orange and heparin blue, discovered via a diversity-oriented
library approach in the group of Chang.160
..................................................................... 55
Figure 1.24 – Two-component heparin sensor from Zhang and co-workers.161
............ 56
Figure 1.25 – Selective ratiometric sensors: (a) phosphorescent conjugated
polyelectrolyte structure from Zhao, Liu and Huang167
and (b) peptide structure from
Lee.168
.............................................................................................................................. 57
Figure 1.26 – Graphene-AuNPs sensing system from Chen and co-workers. Figured
adapted from reference 172
. .............................................................................................. 58
8
Figure 1.27 – Cationic heparin binding polymers: (a) Quaternary ammonium-based
cationic polymer polybrene and (b) an arginine functionalised PAH.191
........................ 61
Figure 1.28 – Delparantag is a lysine-containing penta-cationic heparin binder. .......... 62
Figure 1.29 – Calix[8]arene from Cunsolo and co-workers with structure (left) enabling
chelate effect to be maximized through adoption of ‘octopus-like’ conformation (right,
space-filled species represents calix[8]arene, stick model represents heparin). Figure
adapted from 200
............................................................................................................... 63
Figure 1.30 – An octa-cationic arginine-containing foldamer from DeGrado and co-
workers.202
....................................................................................................................... 63
Figure 1.31 – Surfen, one of the smallest synthetic heparin binders to be examined as a
potential heparin rescue agent.205
.................................................................................... 64
Figure 1.32 – A self-assembling heparin-binding lipopeptide from Stupp and co-
workers.207
....................................................................................................................... 64
Figure 1.33 – Self-assembling heparin binding compound subjected to preliminary
testing by Smith and co-workers.211
This Figure is also shown as Figure 4.2. ............... 65
Figure 1.34 – Cartoon showing the concept of self-assembled multivalency (SAMul) in
for heparin effective heparin binding. ............................................................................. 67
Figure 2.1 – A selection of dyes from the thionine family. ........................................... 71
Figure 2.2 – UV-vis absorbance spectra of thionine acetate (16 µM) in salt (150 mM)
and buffer (1 mM Tris HCl) in presence (grey) and absence (solid black) of heparin.
Thionine acetate (16 µM) in the presence of heparin with no NaCl present is included
for comparison (dashed black). ....................................................................................... 73
Figure 2.3 – UV-vis absorbance spectra of methyl green (30 µM) in salt (150 mM) and
buffer (1 mM Tris HCl) in presence (grey) and absence (solid black) of heparin. Methyl
green (30 µM) in the presence of heparin with no NaCl present is included for
comparison (dashed black). ............................................................................................. 74
Figure 2.4 – UV-vis absorbance spectra of alcian blue (38 µM) in salt (150 mM) and
buffer (1 mM Tris HCl) in presence (grey) and absence (black) of heparin. Inset:
structure of alcian blue. ................................................................................................... 76

9
Figure 2.5 – UV-vis absorbance spectrum of MalB (25 µM) in salt (150 mM) and Tris
HCl (1 mM) in the presence (grey) and absence (black) of heparin. Inset: Picture
showing colour of MalB to Mallard. .............................................................................. 79
Figure 2.6 – Binding curves resulting from titration of heparin into a solution of
methylene blue (10 µM, left) or Mallard blue (25 µM, right) in the absence (top) or
presence (bottom) of 150 mM NaCl. .............................................................................. 80
Figure 2.7 – Extent to which increasing concentrations of Buffer/Electrolyte disrupt
MalB-heparin interaction. ............................................................................................... 82
Figure 2.8 – Equilibrated MD snapshot of MalB-heparin interactions. Heparin is
represented as purple (D-glucosamine) and green (L-iduronic acid) space-filling spheres,
while MalB is shown as pink stick model. ...................................................................... 83
Figure 2.9 – Three structurally related GAGs: heparin, hyaluronic acid (HA) and
chondroitin sulfate (CS). ................................................................................................. 84
Figure 2.10 – Normalised response of MalB to glycosaminoglycans HA, CS and
heparin. ............................................................................................................................ 85
Figure 2.11 – Mallard Blue response to heparin delivered in 100% human serum (solid
circles) or 100% horse serum (open triangles) within a clinically relevant range. ......... 86
Figure 2.12 – Mallard Blue (solid circles) and Azure A (open squares) response to
heparin delivered in 100% human serum within a clinically relevant range. ................. 87
Figure 2.13 – Stability traces of MalB in the presence of light or dark under either air or
nitrogen. .......................................................................................................................... 88
Figure 2.14 – Time-lapse photographs showing development of MalB colour over time
at room temperature. ....................................................................................................... 89
Figure 2.15 – UV-visible absorbance spectra for MalB in water as concentration
increases. Inset: Plot of absorbance at λmax between 0 – 500 µM. .................................. 90
Figure 3.1 – Cartoon concept of an indicator displacement assay (IDA). ..................... 95

10
Figure 3.2 – Ansyln’s heparin sensing systems: (a) tri-boronic acid receptor and
pyrocatechol violet indicator;144
(b) modified fluorophore-containing receptor.145
These
structures are also shown in Figure 1.19. ........................................................................ 96
Figure 3.3 – UV-visible absorbance spectra for MalB (25 µM) in the absence and
presence of heparin (27 µM), and following the subsequent addition protamine in the
presence of NaCl (150 mM) and Tris HCl (10 mM). ..................................................... 97
Figure 3.4 – Heparin binding curve for protamine, with the point of 50% dye
displacement indicated. ................................................................................................... 98
Figure 3.5 – Heparin binding curves for protamine obtained from MalB assay with
heparin delivered in 10% and 100% human serum. ...................................................... 100
Figure 3.6 – Structure of G2-PAMAM with the generation levels G0 – G2 shown. The
higher generations result from larger iterations of the dendritic structure. ................... 101
Figure 3.7 – Equilibrated MD snapshots of heparin binding to selected PAMAM
dendrimers and protamine. Binders are represented as blue stick models while heparin is
shown as red and orange space-filling structures. ......................................................... 107
Figure 3.8 – Structure of Transgeden (TGD) dendrimers showing the PPV core unit and
G1-G3 PAMAM surface groups. .................................................................................. 110
Figure 3.9 – Heparin binding curve comparisons for TGD (closed shapes) and
PAMAM (open shapes) dendrimers at G1 (top left), G2 (top right) and G3 (bottom)
from MalB assay in buffer and salt. .............................................................................. 112
Figure 3.10 – MD simulations for TGD (top) and PAMAM (bottom) binding heparin at
a charge excess of 0.4 across generations 1, 2 and 3 (left-to-right). ............................. 115
Figure 3.11 – Snapshots of the mesoscale simulations between dendrimers and heparin
at CE = 0.1 for TGD (top) and PAMAM (bottom) at G1 (left), G2 (middle) and G3
(right) in each case. ....................................................................................................... 116
Figure 3.12 – Heparin titration curves for TGD dendrimers (G1-G3) in150 mM NaCl
and 10 mM Tris HCl, probed by fluorescence of PPV-core. ........................................ 117
Figure 3.13 – Heparin binding curves for TGD-dendrimers containing differing
numbers of surface amines. ........................................................................................... 119

11
Figure 4.1 – An amphiphilic integrin binder from Smith and co-workers.56
............... 125
Figure 4.2 – Structure of heparin binder C22G1DAPMA along with cartoon
representation of self-assembly. This Figure is also shown as Figure 1.33. ................. 125
Figure 4.3 – TEM images of C22G1DAPMA in absence (left, scale bar: 100 nm) and
presence (right, scale bar: 50 nm) of heparin. ............................................................... 126
Figure 4.4 – Mesoscale (top) and atomistic (bottom) representations of C22G1DAPMA
in the presence (left) and absence (right) of 150 mM NaCl. ......................................... 130
Figure 4.5 – Atomistic models of self-assembled C22G1DAPMA (top) or protamine
(bottom) binding heparin in absence (left) and presence (right) of 150 mM NaCl. ..... 132
Figure 4.6 – Heparin binding curves for PG1DAPMA, C22G1DAPMA and protamine
from MalB heparin binding assay. ................................................................................ 134
Figure 4.7 – Measured absorbance for heparin delivered into solution of
C22G1DAPMA at a (+ : –) = 0.67 in 0 – 10 % human serum. ...................................... 136
Figure 4.8 – Fluorescence intensity of NR in PBS buffer over time in the presence of
C22G1DAPMA in the absence (solid circles) and presence (open circles) of heparin.. 139
Figure 4.9 – Mass spectrometric degradation assay: observed species (top) after 0 hours
(middle) and 24 hours (bottom) incubation at 37 °C. ................................................... 142
Figure 5.1 – Target molecules C22G1LLys, C22G1DLys. ............................................. 147
Figure 5.2 – The three distinct components of G1 target molecules C22G1LLys and
C22G1DLys, where ‘PG’ represents a protecting group. ............................................... 147
Figure 5.3 – Circular dichroism spectra of target molecules C22G1LLys and C22G1DLys
(10 mM in methanol) indicating opposing chirality. .................................................... 152
Figure 5.4 – Chemical structure of hydrophobic dye probe, Nile Red (NR) ............... 153
Figure 5.5 – Nile Red encapsulation curves for C22G1LLys and C22G1DLys.............. 153
Figure 5.6 – TEM image of 200 µM C22G1LLys (scale bar: 50 nm). .......................... 155
Figure 5.7 – TEM image of 200 µM C22G1LLys in the presence of heparin (scale bar:
100 nm). ........................................................................................................................ 155

12
Figure 5.8 – TEM image of 200 µM C22G1DLys (scale bar: 50 nm). ......................... 156
Figure 5.9 – TEM image of 200 µM C22G1DLys in the presence of heparin (scale bar:
100 nm). ........................................................................................................................ 156
Figure 5.10 – Heparin binding curves for PG1LLys, C22G1LLys and C22G1DLys. ..... 158
Figure 5.11 – Heparin binding curves for C22G1DLys obtained from MalB assay carried
out (i) in salt and buffer (black) and (ii) with heparin delivered in 100% human serum
(grey). ............................................................................................................................ 161
Figure 5.12 – Time resolved degradation curve of C22G1DLys. Discontinuities are
indicated where the sample was vigorously shaken to simulate blood-flow shear forces.
....................................................................................................................................... 163
Figure 5.13 – Mass spectrometric degradation assay: observed species (top) after 0
hours (middle) and 24 hours (bottom) incubation at 37 °C. ......................................... 166
Figure 5.14 – 1H and
13C NMR spectra for C22G1DLys before (left) and after (right)
refrigeration under an inert atmosphere for 18 months. ................................................ 168
Figure 5.15 – Heparin binding curves for C22G1LLys and C22G1DLys obtained using
the MalB assay in buffer and salt initially following synthesis (black) and after 18
months of storage (grey). .............................................................................................. 169
Figure 5.16 – Segment of DNA showing the 2-deoxyribose sugar-phosphate backbone
and the hydrogen bonding interactions between the labelled nucleobases. .................. 170
Figure 5.17 – An example PNA strand containing a lysine functionalised region; a so-
called ‘chiral box’.348
.................................................................................................... 171
Figure 5.18 – Chemical structure of fluorescent dye ethidium bromide. ..................... 172
Figure 5.19 – DNA binding curves from EthBr assay for PG1LLys, C22G1LLys and
C22G1DLys. ................................................................................................................... 173
Figure 5.20 – Nile red encapsulation curve for C22G1DLys in the presence of DNA. 174
Figure 5.21 – G2 target molecules C22G2LLys and C22G2DLys. ................................. 176

13
Figure 5.22 – Circular dichroism spectra of target molecules C22G2LLys and
C22G2DLys indicating opposing chirality. .................................................................... 179
Figure 5.23 – Nile Red encapsulation curves for C22G2LLys and C22G2DLys............ 180
Figure 5.24 – TEM image of 125 µM C22G2LLys (scale bar: 50 nm). ........................ 181
Figure 5.25 – TEM image of 125 µM C22G2LLys in the presence of heparin (scale bar:
50 nm). .......................................................................................................................... 182
Figure 5.26 – TEM image of 125 µM C22G2LLys (scale bar: 50 nm). ........................ 182
Figure 5.27 – TEM image of 125 µM C22G2LLys in the presence of heparin (scale bar:
100 nm). ........................................................................................................................ 183
Figure 5.28 – Heparin binding curves for PG2LLys, C22G2LLys and C22G2DLys
obtained from MalB assay. ........................................................................................... 184
Figure 5.29 – Time resolved degradation curve for C22G2DLys. Discontinuities are
indicated where the sample was vigorously shaken to simulate blood-flow shear forces.
....................................................................................................................................... 186
Figure 5.30 – Mass spectrometric degradation assay: observed species (top) after 0
hours (middle) and 24 hours (bottom) incubation at 37 °C. ......................................... 188
Figure 5.31 – DNA binding curves from EthBr assay for PG1LLys, C22G1LLys and
C22G1DLys. ................................................................................................................... 190
Figure 6.1 – Twin-tailed G1 target molecules (C12)2LAspLLys and (C12)2DAspDLys. 195
Figure 6.2 – The three component pieces of G1 target molecules (C12)2LAspLLys and
(C12)2DAspDLys. ........................................................................................................... 196
Figure 6.3 – Circular dichroism data at different stages during the preparation of
(C12)2LAspLLys (solid lines) and (C12)2DAspDLys (dashed lines) measured at 10 mM in
methanol. ....................................................................................................................... 198
Figure 6.4 – Nile Red encapsulation curve for (C12)2DAspDLys. ................................ 198
Figure 6.5 – TEM images of 100 µM (C12)2DAspDLys (scale bars: 100 nm (left), 50 nm
(right)). .......................................................................................................................... 199

14
Figure 6.6 – TEM image of 100 µM (C12)2DAspDLys in the presence of heparin (scale
bars: 200 nm (left), 100 nm (right)). ............................................................................. 200
Figure 6.7 – Heparin binding curves for (C12)2LAspLLys and (C12)2DAspDLys obtained
from MalB assay in 150 mM NaCl and 10 mM Tris HCl. ........................................... 203
Figure 6.8 – Comparison of the relative proximity of the hydrophobic units (blue
squares) and chiral region (red circles) of (C12)2AspLys and C22G1Lys systems. ....... 204
Figure 6.9 – DNA binding curves for (C12)2LAspLLys and (C12)2DAspDLys obtained
from EthBr displacement assay. .................................................................................... 207
Figure 6.10 – Ornithine-containing twin-tailed target molecules (C12)2LAspLOrn and
(C12)2DAspDOrn. ........................................................................................................... 208
Figure 6.11 – Circular dichroism spectra for (C12)2LAspLOrn and (C12)2DAspDOrn. . 209
Figure 6.12 – Nile Red encapsulation data for (C12)2LAspLOrn and (C12)2DAspDOrn.
....................................................................................................................................... 210
Figure 6.13 – TEM images of 100 µM (C12)2LAspLOrn (scale bars: 500 nm (left), 100
nm (right)). .................................................................................................................... 210
Figure 6.14 – TEM images of 100 µM (C12)2LAspLOrn in the presence of heparin
(scale bars: 100 nm (both images)). .............................................................................. 211
Figure 6.15 – TEM images of 100 µM (C12)2LAspLOrn (scale bars: 500 nm (left), 100
nm (right)). .................................................................................................................... 211
Figure 6.16 – TEM image of 100 µM (C12)2DAspDOrn in the presence of heparin (scale
bar: 100 nm (left), 50 nm (right)). ................................................................................. 211
Figure 6.17 – Heparin binding curves for (C12)2LAspLOrn and (C12)2DAspDOrn
obtained from MalB assay. ........................................................................................... 213
Figure 6.18 – DNA binding curves for (C12)2LAspLOrn and (C12)2DAspDOrn obtained
from EthBr assay. .......................................................................................................... 215
Figure 6.19 – Two G2 aspartic acid-lysine target molecules (C12)2LAspLLys(LLys)2 and
(C12)2DAspDLys(DLys)2. ............................................................................................... 216

15
Figure 6.20 – Nile Red encapsulation curve for (C12)2DAspDLys(DLys)2. .................. 218
Figure 6.21 – TEM images of (C12)2DAspDLys(DLys)2 alone (scale bars: 50 nm (left),
200 nm (right)). ............................................................................................................. 219
Figure 6.22 – TEM images of (C12)2DAspDLys(DLys)2 in the presence of heparin (scale
bars: 100 nm (left), 50 nm (right)). ............................................................................... 219
Figure 6.23 – Heparin binding curves for (C12)2LAspLLys(LLys)2 and
(C12)2DAspDLys(DLys)2 from MalB assay in buffer and salt. ...................................... 221

16
List of Tables
Table 3.1 – Heparin binding data for protamine, calculated from MalB assay. ............. 98
Table 3.2 – Heparin binding data for protamine from MalB assay with heparin
delivered in 10 and 100% human serum. ...................................................................... 100
Table 3.3 – Heparin binding data for PAMAM dendrimers tested in MalB assay in
buffer and salt. Protamine data included for comparison. ............................................ 103
Table 3.4 – MD simulation data for PAMAM dendrimers interacting with heparin.
Protamine data included for comparison. Qtot: number of binder charges; Qeff: number of
interacting charges; 𝛥𝐺𝑏𝑖𝑛𝑑𝑒𝑓𝑓: effective free energy of binding; 𝛥𝐺𝑏𝑖𝑛𝑑𝑒𝑓𝑓/Qeff:
effective-charge-normalised free energy of binding. .................................................... 105
Table 3.5 – Heparin binding data for G2-PAMAM with heparin delivered in 100%
serum. ............................................................................................................................ 108
Table 3.6 – Heparin binding data from MalB assay in buffer and salt for G1-G3 TGD
dendritic systems, along with G1-G3 PAMAM data for comparison. .......................... 111
Table 3.7 – MD simulation binding parameters at a charge excess of 0.4. Qtot: number
of binder charges; Qeff: number of interacting charges; 𝛥𝐺𝑏𝑖𝑛𝑑𝑒𝑓𝑓: effective free
energy of binding; 𝛥𝐺𝑏𝑖𝑛𝑑𝑒𝑓𝑓/Qtot: charge-normalised free energy of binding;
𝛥𝐺𝑏𝑖𝑛𝑑𝑒𝑓𝑓/Qeff: effective-charge-normalised free energy of binding. ....................... 114
Table 3.8 – Heparin binding data for the TGD-G1 derivatives with different numbers of
surface charges. ............................................................................................................. 119
Table 4.1 – Heparin binding data for C22G1DAPMA and protamine in the absence and
presence of salt. Assay conditions: [a] 10 μM MB, 178 μM heparin, 1 mM Tris HCl. [b]
25 μM MalB, 27 μM heparin, 150 mM NaCl, 10 mM Tris HCl. ................................. 128
Table 4.2 – Experimental solution-phase diameters of C22G1DAPMA aggregates, as
measured by DLS. ......................................................................................................... 131
Table 4.3 – Modelling interpretations of effective charges per binder (Qeff), effective
free binding energy (∆𝐺𝑏𝑖𝑛𝑑𝑒𝑓𝑓) and effective charge-normalised free energy of
binding (∆𝐺𝑏𝑖𝑛𝑑𝑒𝑓𝑓/Qeff) for C22G1DAPMA and protamine. .................................... 132

17
Table 4.4 – DLS sizes observed for C22G1DAPMA in the absence and presence of
different amounts of heparin. ........................................................................................ 133
Table 4.5 – Heparin binding data from MalB assay with heparin delivered in 100%
human serum. ................................................................................................................ 135
Table 4.6 – DLS sizes observed for C22G1DAPMA-heparin aggregates in the absence
and presence of albumin (1 mg mL-1
) over time. .......................................................... 137
Table 4.7 – Plasma clotting data for C22G1DAPMA in aPTT and PT assays. ............ 138
Table 5.1 – Nile Red encapsulation assay data for PG1LLys, C22G1LLys and
C22G1DLys. ................................................................................................................... 153
Table 5.2 – DLS data for C22G1LLys and C22G1DLys under different electrolytic
conditions. ..................................................................................................................... 157
Table 5.3 – Heparin binding data from MalB assay for PG1LLys, C22G1LLys and
C22G1DLys. ................................................................................................................... 158
Table 5.4 – Heparin binding data for C22G1DLys obtained from MalB assay carried out
in salt and buffer, and with heparin delivered in 100% human serum. ......................... 160
Table 5.5 – Plasma clotting data for C22G1DLys in PT assay. ..................................... 162
Table 5.6 – Plasma clotting data for C22G1DLys in PT assay before and after
degradation. ................................................................................................................... 167
Table 5.7 – DNA binding data from EthBr assay for PG1LLys, C22G1LLys and
C22G1DLys. *EC50 and CE50 are coincidentally numerically equivalent. ..................... 173
Table 5.8 – Nile Red encapsulation assay data for PG2LLys, C22G2LLys and
C22G2DLys. ................................................................................................................... 179
Table 5.9 – Heparin binding data for PG2LLys, C22G2LLys and C22G2DLys obtained
from MalB assay. .......................................................................................................... 184
Table 5.10 – DNA binding data from EthBr assay for PG2LLys, C22G2LLys and
C22G2DLys. ................................................................................................................... 189

18
Table 6.1 – Dynamic Light Scattering (DLS) data for (C12)2LAspLLys and
(C12)2DAspDLys in 10 mM Tris HCl in the absence and presence of 150 mM NaCl. .. 201
Table 6.2 – Heparin binding data for (C12)2LAspLLys and (C12)2DAspDLys obtained
from MalB assay in 150 mM NaCl and 10 mM Tris HCl. ........................................... 202
Table 6.3 – Heparin binding data for (C12)2DAspDLys with heparin delivered in 100%
human serum. ................................................................................................................ 205
Table 6.4 – Plasma clotting data for (C12)2DAspDLys from PT and aPTT assays. ...... 206
Table 6.5 – DNA binding data for (C12)2LAspLLys and (C12)2DAspDLys obtained in
EthBr displacement assay. ............................................................................................ 206
Table 6.6 – Heparin binding data for (C12)2LAspLOrn and (C12)2DAspDOrn obtained
from MalB assay. .......................................................................................................... 212
Table 6.7 – Heparin binding data for (C12)2DAspDOrn with heparin delivered in 100%
human serum. ................................................................................................................ 214
Table 6.8 – DNA binding data for (C12)2LAspLOrn and (C12)2DAspDOrn obtained from
EthBr assay. .................................................................................................................. 214
Table 6.9 – Heparin binding data for (C12)2LAspLLys(LLys)2 and
(C12)2DAspDLys(DLys)2 from MalB assay in buffer and salt. ...................................... 220
Table 6.10 – Heparin binding data for (C12)2DAspDLys(DLys)2 from MalB assay with
heparin delivered in 100% human serum. ..................................................................... 222

19
List of Schemes
Scheme 2.1 – Molecular rearrangement of coloured methyl green to colourless carbinol.
......................................................................................................................................... 75
Scheme 2.2 – Synthesis of Mallard Blue 2.2. Although commercial, conditions for
preparation of Arg(Boc)3 also shown. ............................................................................. 78
Scheme 4.1 – Preparation of negative control molecule PG1DAPMA. ....................... 133
Scheme 5.1 – Synthesis of alkyl hydrophobic tail unit. ............................................... 148
Scheme 5.2 – Preparation of LLys(Boc)2 or DLys(Boc)2. ............................................ 148
Scheme 5.3 – Synthetic scheme for preparation of G1 linker unit.325
.......................... 150
Scheme 5.4 – Synthetic scheme showing connection of the component parts to generate
PG1LLys, C22G1LLys and C22G1DLys. ........................................................................ 151
Scheme 5.5 – Synthetic scheme showing preparation of G2-linker.325,357
................... 177
Scheme 5.6 – Synthetic scheme for production of target molecules PG2LLys,
C22G2LLys and C22G2DLys. ......................................................................................... 178
Scheme 6.1 – Preparation of G1 target molecules (C12)2LAspLLys and (C12)2DAspDLys.
....................................................................................................................................... 197
Scheme 6.2 – Preparation of modified twin-tailed SAMul systems (C12)2LAspLOrn and
(C12)2DAspDOrn. ........................................................................................................... 209
Scheme 6.3 – Preparation of (C12)2LAspLLys(LLys)2 and (C12)2DAspDLys(DLys)2. ... 217

20
List of Equations
Equation 1.1 – Calculation of Whitesides and co-workers’ multivalency enhancement
factor, β. .......................................................................................................................... 26

21
Dedication
This thesis is written in loving memory of my late father.

22
Acknowledgements
I must begin by thanking Professor David Smith, my supervisor, for his unwavering
enthusiasm for all things heparin, his many great scientific ideas and, importantly, for
giving me the opportunity and freedom to grow as a research scientist during the past 4
years. I must also acknowledge our international flavour of collaborators including
Professor Sabrina Pricl (Italy), Dr Marcelo Calderon (Germany), Professor Julián
Rodríguez-López (Spain) and Professor Jeremy Turnbull (Liverpool), without whom
this research project would not have been as fruitful.
I have been fortunate enough to work within a team containing some hugely talented
people. In particular I must thank Anna Barnard for helping me get to grips with the
world of heparin (and Athens), Will Edwards for being my partner in crime (and the
sports discussion) and Ching Wan Chan for being my personal NMR putter-on-ner. I
have also been lucky enough to supervise many undergraduate students, with Ellis
Wilde deserving a special mention for her superb ability to unearth new literature, her
excellent abilities as a research chemist and for bringing the perfect amount of crazy
(and cake) to this project.
I am also grateful for the technical support received from Karl Heaton and Helen
Robinson (MS), Heather Fish (NMR), Andrew Leech (CD), Meg Stark (TEM) and
Scott Guimond (Clotting), who together provided the foundations on which this
research is built.
On a personal level, I am deeply indebted to Kate Horner for supporting me and
distracting me so steadfastly despite everything our lives threw at us (supermarkets
never will be the same), Lizzie Smith for our many cathartic pub teas (usual table) and
Maurice Waddle for offering such valuable advice and joining me on our voyage into
the antithetical world of Monday Night Darts (it’s definitely a sausage and chips
situation).
Lastly, but most importantly, knowing that I have had the support of my Mum whatever
happened has given me great security. I can only hope that the achievements in this
volume would have made Dad proud.
23
Declaration
I declare that the work presented within this thesis is entirely my own, except where
otherwise acknowledged. Aspects of this work have been published in the following
journal articles: J. Am. Chem. Soc., 2013, 135, 2911-2914; Chem. Commun., 2013, 49,
4830-4832; Chem. Soc. Rev., 2013, 42, 9184-9195; Chem. Sci., 2014, 5, 1484-1492 and
Chem-Eur. J., 2014, 20, 9666-9674. This work has not been submitted in part or fully
for examination towards any other degrees or qualifications.
Stephen Marriott Bromfield
Chapter 1 - Introduction
24
1 Introduction
1.1 From Multivalency to Self-Assembling Multivalency (SAMul)
1.1.1 Multivalency
1.1.1.1 Concept
Velcro is arguably the most widely acknowledged exponent of multivalency. Through
establishment of many individually weak interactions between hooks on one side of the
material and loops on the other, two physically distinct materials can be reversibly
attached to each other. Within this macroscale analogy, the individual hook-loop
interactions can be thought of as a monovalent interaction between a binding ligand and
a complementary receptor site. In isolation, each single, reversible, interaction would be
unable to meaningfully adhere the materials together, but when many of these
interactions combine together, the resulting overall binding can be rather powerful.
1.1.1.2 Terminology and Thermodynamics
The concept of multivalency is widely applied across a range of scientific disciplines
although only macromolecular chemists tend to employ the term ‘multivalency.’1
Inorganic chemists refer to the same phenomenon as the ‘chelate effect,’ often with
respect to the binding of multidentate ligands within the coordination sphere of a metal
centre;2,3
while biologists tend to discuss ‘polyvalent’ interactions such as those of a
virus with a cell surface.4 For the purposes of our discussion, the term multivalency will
be taken to mean the simultaneous interaction of multiple binding groups on one species
with complementary species on another, often to achieve high-affinity binding.
Defining multivalent interactions on the molecular level must be done with care. For
example, a multivalent host – that is one with two or more binding sites – interacting
with two or more monomeric guest molecules does not constitute a multivalent
interaction as each individual guest only forms a single interaction with the host. As
soon as the guest becomes divalent (or larger), the interactions can be classed as
multivalent, so long as multiple binding groups on the guest interact with different
receptor groups on the same host molecule. When all of the receptor and/or binding

Chapter 1 - Introduction
25
sites are chemically identical, the species can be categorised as homomultivalent, while
when the interacting groups vary, it is said to be heteromultivalent.
As we shall see in the next section, multivalent binding can be utilised across a variety
of biological and chemical systems. Archetypal examples can be found in the adhesion
of a virus to the exterior of a cell wall or the interaction of a dendritic polymer with
DNA, as represented schematically in Figure 1.1.
Figure 1.1 – Schematic cartoon of (a) a virus binding to cell surface and (b) a dendritic
polymer binding to DNA.
1.1.1.3 Thermodynamics
As with all host-guest interactions, binding or association constants, K, can be
calculated for multivalent interactions, although not without some fundamental
considerations. Firstly, association constants for monovalent systems refer exclusively
to the formation of a single interaction between two physically distinct species, while
for multivalent binding it is not so simple. In changing from ‘fully unbound’ to ‘fully
bound,’ a multivalent binder will necessarily form several interactions with its host.
Despite much explanation in the literature, the misconception that a multivalent system
must form multiple interactions which individually should have a higher association
constant than the monovalent system remains.5 In fact, the individual interactions of a
successful multivalent system should bind to the host collectively in a superior manner
to the monovalent system. That is to say that the overall binding constant for a
multivalent interaction, 𝐾𝑚𝑢𝑙𝑡𝑖, referred to as the ‘avidity’ of the system, should be
superior to the binding constant of the monovalent system, 𝐾𝑚𝑜𝑛𝑜.
Whitesides and co-workers were the first to attempt to quantify the superiority (or
otherwise) of multivalent systems with respect to their monovalent counterparts.4 To do
this, they calculated a so-called ‘enhancement factor’, β, which was simply a ratio of the

Chapter 1 - Introduction
26
avidity of the multivalent system to the association constant of the monovalent system
when each system was interacting with a multivalent host, Equation 1.1. This
subsequently enabled multivalent systems to be categorized as either cooperative
(synergistic, β > 1), non-cooperative (additive, β = 1) or negatively cooperative
(interfering, β < 1).4 The simplicity of this calculation does however limit the
information which can be derived from it; for example, it is not possible to deconvolute
the effect of the number of charges on a multivalent binder – referred to as symmetry
effects – from the associated cooperativity.6 As such, β can become a useful parameter
for the comparison of multivalent systems where the exact valence of the binder is
unknown.
β = 𝐾𝑚𝑢𝑙𝑡𝑖
𝐾𝑚𝑜𝑛𝑜
Equation 1.1 – Calculation of Whitesides and co-workers’ multivalency enhancement
factor, β.
Accurately assigning cooperativity is tricky as the binding of a second (or subsequent)
ligand group of an already partially-bound multivalent guest to the host is
fundamentally different to the establishment of a new interaction between the host and a
separate guest molecule. Indeed, the first interaction serves to ‘tether’ together the host
and guest allowing subsequent interaction to be viewed as intramolecular, rather than
intermolecular, binding events.7 This tethering also positions the ligand groups of the
partially-bound system closer to the host further increasing the statistical likelihood of a
complementary binding interaction forming, and ultimately leading to cooperativity.8
This dichotomy of the first and subsequent binding interactions must be taken into
account for multivalent interactions and, as exemplified by Ercolani in 2011, the inter-
and intramolecular processes should be considered independently in order to
meaningfully assess cooperativity.9 Ercolani suggested that many systems had
incorrectly being designated as cooperative or non-cooperative based solely on the
consideration of Whitesides and co-workers enhancement factor, β.9
There have been several attempts to formalize and delineate different cooperativity
regimes. In 2008, Whitty defined allosteric and chelate/configurational regimes as the
‘two faces’ of cooperativity.10
Whitty suggested that within an allosteric system, the
binding of one ligand to a receptor site altered the affinity of a separate ligand for a

Chapter 1 - Introduction
27
different binding site, while chelate or configurational cooperativity arose from the
intramolecular nature of all but the first binding interactions within a multivalent
system. In 2009, Hunter and Anderson11
reaffirmed Whitty’s observations in their
candidly titled essay “What is cooperativity?” before Ercolani again went further and
rigorously reasoned that a third type of cooperativity regime required defining.
Ercolani’s formalised definitions of allosteric, chelate and interannular cooperativity are
depicted in Figure 1.2 and discussed below.9
Figure 1.2 – Schematic representations of allosteric, chelate and interannular
cooperativity.
The definition of allosteric cooperativity, which is the best understood of the three
categories, did not greatly change. Specifically, allosteric cooperativity was said to
pertain to two (or more) intermolecular binding sites influencing the behaviour of each
other. The most widely recognized example of this is the mechanism of oxygen binding
to haemoglobin, where binding of the first oxygen molecule induces a conformational
change promoting the binding of three further oxygen species.12,13
Chelate
cooperativity, meanwhile, is the most recognizable multivalent effect and was
formalized as arising from the establishment of one or more intramolecular binding
interaction.5 Chelate cooperativity is represented on the right-side of the middle row in
Figure 1.2.
The final regime was defined by Ercolani as interannular cooperativity, which can be
viewed as a subset of chelate cooperativity as it also arises from the interplay of

Chapter 1 - Introduction
28
intramolecular binding interactions.9 The differentiator between chelate and interannular
cooperativity is the multiplicity of the interactions involved, and it is well explained by
an instructive example from the work of Shinkai and co-workers.14
In particular, the
team led by Shinkai created a system containing two porphyrin ‘wheels’ each decorated
with pyridinyl binding sites which were able to rotate relative to each other around a
cerium ‘axle.’ When both ‘wheels’ simultaneously established interactions with a di-
carboxylic acid guest molecule, the wheels became locked in place relative to each
other, facilitating the binding of subsequent guest molecules, Figure 1.3.14
Figure 1.3 – Example of interannular cooperativity from the work of Shinkai and co-
workers.14
Much like monovalent interactions, the free energy of multivalent interactions, 𝛥𝐺𝑚𝑢𝑙𝑡𝑖,
can be calculated. It remains difficult to quantify the individual interactions between a
host and a guest, and rather easier to focus on comparisons of the free energies of the
fully bound and fully unbound states. As with all free energies, 𝛥𝐺𝑚𝑢𝑙𝑡𝑖 is composed of
enthalpic and entropic factors. Of these, it is the entropic component which courts most
literature discussion.
It is widely acknowledged that the entropy change upon binding, 𝛥𝑆𝑏𝑖𝑛𝑑, has
translational, rotational and conformational components, in addition to less well
understood contributions from the associated/surrounding solvent(s).15
The reduction in
conformational entropy associated with the formation of the first binding interaction
between the multivalent host and the guest is most often considered, although there are
contradictory models for determining the significance and/or magnitude of these
interactions.15
For example, Jencks16
suggested a maximum loss of entropy of
localization for an unrestrained rotor of 1.4 kcal mol-1
while Whitesides and co-workers

Chapter 1 - Introduction
29
suggested a much smaller value,17
although not without attracting criticism from other
authors in the process.18
Overall, the widespread consensus seems to be that entropic
factors are not as influential as has been previously thought in the past, with Huskens
and Reinhoudt going so far as to suggest that in certain situations “entropic concerns
should not be taken too seriously”7 however, in reality, the traditional view of
multivalent interactions being governed by entropy remains.15,17
The enthalpic component of the free energy of binding, 𝛥𝐻𝑏𝑖𝑛𝑑, is also difficult to
quantify for multivalent interactions, either by experimental or theoretical methods.4
The biggest challenge is to deconvolute the effects of the linker group which connects
the multiple ligand groups together from the binding groups, as the linker may itself
interact somewhat with the host. The geometry and rigidity of the linker can also affect
the relative enthalpy of interactions as, unless ligand pre-organization is highly
complementary with the host, the distortion required to establish interaction is likely to
lead to so-called enthalpically diminished binding.
As informative as these thermodynamic parameters can be, a more widely used concept
is that of effective molarity (or effective concentration), EM (or Ceff), which serves to
quantify the amount of ligand sites in close proximity to the host. In multivalent
systems, once the first ligand group has bound, the effective concentration of ligand
groups proximal to the host is increased due to the aforementioned ‘tethering’ of the
binder to the host: indeed the subsequent interactions are intramolecular rather than
intermolecular. The advantages associated with this increased EM have been
demonstrated to be mostly entropic and can be utilised to afford exceptionally high local
concentrations of ligand groups.16,19
The EM parameter has also been used to measure
the affinity enhancement associated with the use of multivalent interactions.20,21
One of the key factors influencing the enhanced binding of multivalent systems over
their monovalent counterparts is their significantly different dissociation kinetics. By
their very nature, the dissociation of a monovalent host from a guest molecule requires
only a single interaction to be broken. In a multivalent system, multiple interactions
need to be broken for host-guest dissociation back to two physically discrete species.
This rate is determined by the concentration of the host-guest complex in which the two
species are held together by only a single interaction (i.e. all other interactions have
broken). As discussed above, it is common for partially-bound multivalent guests to re-

Chapter 1 - Introduction
30
bind to the host due to the increased effective concentration, Ceff, of ligand groups
proximal to the host, and for this reason the concentration of this monovalently bound
species is often very low. This phenomenon is a key reason why multivalent
interactions are so robust.
Dissociation of a multivalent complex can be promoted through introduction of a
species which will compete for binding to the host. This competitor can be monovalent
or multivalent and can establish its’ own interactions with the host as the original
multivalent guest begins to dissociate, thereby preventing multivalent re-binding. This
leads to a step-wise dissociation process in the manner depicted in Figure 1.4.
Figure 1.4 – Schematic cartoon of stepwise dissociation of a multivalent binder in the
absence and presence of a competitor.
1.1.1.4 Multivalency in Action
Many varieties of multivalent binding arrays, ranging from systems targeted specifically
for biological applications to templates to assist in covalent synthesis, have been studied
by supramolecular chemists. For example, a programme of work in the group of
Whitesides examined the multivalent interactions of the important antibiotic drug
vancomycin through comparison against synthetically modified derivatives.22-26
‘Native’ vancomycin interacts most favourably with a D-Ala-D-Ala host through the
formation of five non-covalent interactions, however vancomycin-resistance can be
increased when the host is mutated to D-Ala-lactate, as one of the hydrogen bonding
opportunities is lost, Figure 1.5.22
In reality, the multivalency of the system still enables
vancomycin to bind to D-Ala-lactate, albeit at reduced affinity.22
Whitesides and co-
workers then developed a vancomycin dimer and trimer which were shown to exhibit
significantly enhanced binding to dimeric23,24
and trimeric hosts.25,26
Indeed, binding of
the trivalent guest to the trivalent host occurred with an association constant ten orders

Chapter 1 - Introduction
31
of magnitude higher than the native monomeric derivatives, producing one of the
strongest non-covalent interactions between small molecules ever known.25,26
Figure 1.5 – Schematic depiction of trivalent vancomycin host-guest complex (top)
along with comparison of monomeric vancomycin binding to D-Ala-D-Lys (bottom left)
and mutated D-Ala-lactate (bottom right).
Pseudorotaxanes are supramolecular constructs formed when alkyl threads possessing
dialkylammonium ions, R2-NH2+, interpenetrate the macrocyclic interior of crown ether
structures.27
Dibenzo[24]crown-8 (DB24C8) is a much studied host in this context and,
in work somewhat analogous to the vancomycin example above, the cooperativity of
binding between multiple DB24C8 species and a multivalent guest, either in linear28
or
branched29
form, has been studied. Fusions of three DB24C8 hosts around a
triphenylene core by Stoddart and co-workers generated a multivalent system in which
complexation of the alkylammonium guests within the crown ether hosts was enhanced
by the favourable stacking of aromatic rings on the host and the guest, Figure 1.6.30
Pseudorotaxanes such as this can also be ‘switchable’ owing to the pH controllability of
the dialkylammonium species, and this makes them of wide interest in the design of
molecular machines.31

Chapter 1 - Introduction
32
Figure 1.6 – Trivalent pseudorotaxanes from the group of Stoddart. Figure adapted
from reference 32
.
Other pseudorotaxane species were used in a series of works from the groups of
Hunter33
and Schalley34
to demonstrate the acute sensitivity of the multivalent
interactions to the length of the spacer unit between alkylammonium groups. Indeed,
lengthening the linker unit by only one additional methylene group from the optimum
length was enough to transform binding from positively cooperative into a non-
cooperative regime.35
Although host-guest complementarity is often very sensitive to small structural
alterations, careful molecular design can reward the chemist with remarkable positive
cooperativity. A notable example of this is found in the porphyrin wheels of Anderson
and co-workers which showcase almost perfect host-guest preorganization and,
somewhat assisted by the rigidity of the systems, form superb multivalent interactions,
Figure 1.7.36
Chapter 1 - Introduction
33
Figure 1.7 – Exquisite ligand preorganization gives Anderson’s porphyrin wheel well
optimized multivalent interactions. Figure adapted from reference 37
.
1.1.2 Self-Assembly
Molecular self-assembly, as defined by Whitesides in the early 1990s, is the
spontaneous association of molecules under equilibrium conditions into stable,
structurally well-defined aggregates held together by non-covalent bonds.38
Such self-
assembly is ubiquitous in nature, with the tobacco mosaic virus, which is able to
spontaneously arrange several thousand amino acid based subunits into a
complementary helical sheath able to surround single RNA strands, providing a notable
example.39,40
Molecular self-assembly also provides a useful tool for chemists designing
systems for operation on the nanoscale.38,41
Indeed, production of relatively small
molecular building blocks endowed with the ability to self-assemble and generate
nanosized objects is often a far more attractive proposition than the synthesis of
covalent structures of the same size.42
The most widely used approach to this type of self-assembly involves the synthesis of
amphiphilic molecules able to organize and assemble themselves in aqueous solution in
processes driven by the hydrophobic effect.43
As the concentration of monomer

Chapter 1 - Introduction
34
molecules in solution increases, the non-polar regions within their structures tend to
aggregate together, thereby excluding water molecules ‘frozen’ around their surface
from the aggregate interior. The entropy increase associated with the liberation of these
water molecules into solution is widely thought to outweigh the decrease in entropy
associated with the aggregation of the non-polar components.43
The aggregation of
amphiphilic monomers in this way is completely reversible and, as we shall see, the
type of aggregates which form are dependent on several factors such as concentration
and monomer geometry.44
The aggregates which do form often have dimensions on the
nanometer scale and so their study has many connections with colloid science; a long-
standing research area recognized by Nobel prizes as early as the 1920s.
In 1976, Israelachvili et al. published a seminal discussion of the effects of monomer
geometry and degree of hydrophobicity upon the subsequent mode of self-assembly.45
A critical packing parameter was defined, which allowed the morphology of an
aggregate to be predicted based on the relative volumes of the hydrophobic and
hydrophilic groups within the structure. As shown in Figure 1.8, when the monomer
hydrophilic group is much larger than the hydrophobe, a spherical micelle displaying
the polar groups at the surface is favoured. As the volume of the hydrophobic group is
increased with respect to the hydrophilic surface group, cylindrical morphologies
become more favourable as a means of minimising unfavourable interactions with the
aqueous solvents. When the hydrophobicity continues to increase, often through the
introduction of a second aliphatic tail, vesicles or liposomes become the optimum mode
of self-assembly. When the head and tail groups are of comparable size-in-space, planar
bilayer structures form, while when the hydrophobe is significantly larger than the tail
group, inverted micelles form with the non-polar groups expressed at the surface and the
hydrophilic groups internalised.

Chapter 1 - Introduction
35
Figure 1.8 – The work of Israelachvili allowed aggregate morphology in aqueous
solution to be predicted as a function of critical packing parameter.
1.1.3 Self-Assembling Multivalency (SAMul)
With the potential of multivalent binding and power of molecular self-assembly
established, it is not surprising that chemists have combined these two concepts in order
to generate nanoscale binding arrays for interaction with large biomolecules through so-
called ‘self-assembling multivalency’ or ‘SAMul’. As we shall see, this is often
achieved through the use of polar binding groups conjugated to an apolar hydrophobe to
generate amphiphilic species with the ability to self-assemble in aqueous conditions.
This approach carries many advantages over covalent synthesis for the generation of
nanoscale ligands arrays.
For example, self-assembling monomers are individually more synthetically tractable
than larger covalent arrays, and their subsequent assembly to generate the nanosystem is
spontaneous (under appropriate conditions). The simplified synthetic access additionally
makes structural modifications of the monomer units relatively straightforward,
introducing the potential for the polar binding groups to be tuned/altered to allow
different targets to be bound by structurally related monomers. Alteration of the apolar
hydrophobe also allows for the morphology of the resulting nanostructure to be easily
altered. These smaller monomer building blocks are typically more ‘drug-like’ than
their larger covalent counterparts, which can increase the likelihood of promising
candidates receiving clinical approval.
The SAMul binding approach also makes creation of mixed binding systems
straightforward, as different monomer units can be co-assembled into a single

Chapter 1 - Introduction
36
nanostructure leading to synergistic effects, which can be relatively difficult to achieve
using covalent methodology. A further key advantage of SAMul binding is the
reversibility of the nanosystem assembly event, which allows multivalency to be
switched-off in a controllable way. As well as ‘switching-off’ binding events, this
disassembly minimizes the persistence of the binding ligand array which, in turn, can
reduce toxicity of biologically relevant SAMul systems.
Given these multiple advantages, the employment of self-assembled multivalent
(SAMul) techniques is becoming more widely applied and the area was reviewed
recently by Barnard and Smith.46
In the following sub-sections some of the key SAMul
systems are discussed; selected examples have been chosen which fall into the
categories of sugar arrays, DNA binding arrays and ligand arrays targeting other
species.
1.1.3.1 SAMul saccharide arrays
One of the first examples of self-assembling multivalency came from the group of
Whitesides, who developed an amphiphilic system to bind the protein hemagglutinin,
Figure 1.9.47
They conjugated a sialic acid residue onto a lipid chain to promote the self-
assembly event, which increased the binding by a factor of around 100,000 over the
monovalent analogue.47
Figure 1.9 – The hydrophobically modified sialic acid derivative from the group of
Whitesides was one of the earliest examples of self-assembled multivalency (SAMul).47
Since this early work, many systems have been developed to express sugar residues on
the exterior of self-assembled nanosystems in order to bind lectin targets such as
concanavalin A (Con A). For example, Ravoo and co-workers decorated cyclodextrin
vesicular structures with maltose and other sugar residues through coupling of the
sugars with adamantane groups, which could then become encapsulated within the CD-
cavities.48
This created a sugar ligand array which exhibited considerably higher-affinity

Chapter 1 - Introduction
37
for targets than the monomeric non-assembled sugars. Interestingly, within this ternary
complex, the multivalent binding to Con A templates a further organization event for
multiple CD vesicles, Figure 1.10.49
Figure 1.10 – Cartoon of Ravoo and co-workers’ cyclodextrin vesicles (large grey
structure) decorated with adamantane-maltose ligands (red and orange) for Con A
binding (green). Image reproduced from reference 49
.
In a similar manner, Kim and co-workers decorated the surface of cucurbit[6]uril
vesicles with mannose groups although, rather than adamantane groups, the sugar
residue was conjugated to a cationic spermine group as polyamines are more readily
encapsulated by cucurbiturils.50
Carbon nanotubes (CNTs) have also been employed as
‘templates’ by Bertozzi and co-workers, who functionalised an α-N-galactose-amine
residue with an aliphatic tail such that the sugar could be ‘self-assembled’ along the
CNT surface in order to promote enhanced-affinity binding to cell surface lectins,
Figure 1.11.51
Figure 1.11 – Amphiphilic galactosamine-conjugate from the group of Bertozzi self-
assembled along CNTs to achieve high-affinity lectin binding.51

Chapter 1 - Introduction
38
Of the SAMul examples presented so far, many require some form of template such as a
cyclodextrin vesicle or CNT around which the multivalent ligand array can be
constructed. Work from the group of Brunsveld adopts a different approach by
programming monomers with the ability to self-assemble with each other rather than
with a unifying template to generate a nanoscale ligand array for effective target
binding. A particular speciality of the Brunsveld group is the production of photoactive
discotic molecules containing C3-symmetric aromatic cores consisting of three 2,2’-
bipyridine-3,3’-diamine molecules connected to a central benzene-1,3,5-tricarbonyl
unit.52
These units, being planar and aromatic, are readily able to self-assemble into
columnar stacks.53,54
The density of ligands at the assembly surface can be easily tuned
using this approach by carefully controlling the ratio of mono-, di- and/or tri-
functionalised discotics present within a ‘mixed’ columnar stack. When the core is
functionalized with water-solubilizing glycol, and suitable binding groups such as
mannose are attached, the resulting columnar stacks become able to bind targets such as
Con A with enhanced affinity over the non-assembled discotics. Brunsveld and co-
workers have adapted this approach to generate SAMul binders able to interact with
targets such as Con A and other lectins, E. coli and streptavidin, demonstrating the
tunability of the SAMul approach, Figure 1.12.52,55
Figure 1.12 – Self-assembling multivalent mannose-functionalised lectin-binding
discotic molecules from Brunsveld and co-workers. Figure adapted from reference 52
.

Chapter 1 - Introduction
39
One of the most interesting observations from the work of Brunsveld and co-workers
was that increasing the number of binding groups displayed along each stack did not
necessarily correlate with increased target binding. Indeed, in the case of their mannose-
functionalized SAMul discotics, tri-functionalization of each monomer disc offered no
valency-corrected binding enhancement over the mono-functionlaised derivative.52
As
we shall see later in this thesis, the concept of ‘more is not always better’ is a key
feature of many multivalent binding phenomena.56,57
1.1.3.2 Binding other targets
All of the examples presented above employ sugar units as the ligand groups, which
lead primarily to lectin-type species being targeted for binding. Several other groups
have developed SAMul binding approaches targeting different species. For example,
work in the group of Urbach employed cucurbit[8]uril to host self-assembly events
between scaffolds decorated with methyl viologen, and tryptophan groups,58
while
Merkx and co-workers developed self-assembling collagen binding micelles.59
The
groups of Williams and Hunter, meanwhile, developed a cholesterol-dansylamine
amphiphile in which the hydrophobic cholesterol became embedded along membrane-
water interfaces generating a multivalent display of Cu(II)-binding dansyl ligand
groups.60
This work provided a notable example of a SAMul approach being used to
bind a smaller target species, Cu(II), rather than a large biomolecule.
Work from the group of Smith and co-workers employed a similar amphiphilic design
consisting of a hydrocarbon aliphatic tail connected to a hydrophilic Arg-Gly-Asp
(RGD) ligand group.56
This ligand group was selected to endow the system with
integrin binding ability and the study directly compared the performance of this self-
assembling monomer against a non-assembling analogue and a larger non-assembling
‘multivalent’ binder, Figure 1.13. The results showed both the larger system and the
self-assembling analogue exhibited similarly enhanced binding over the non-assembling
monomer due to the multivalency of binding, however the achievement of this
enhancement by the self-assembling system required much less effort during the
synthetic preparation of the compounds.56

Chapter 1 - Introduction
40
Figure 1.13 – Integrin binding systems from the work of Smith and co-workers.56
Smith and co-workers then continued this fundamental study by modifying the
hydrophobic component of the monomers to alter the self-assembled morphologies of
the nanosystems.61
Spherical and cylindrical micelles along with rod-like vesicles were
examined, and a spherical micellar RGD array was shown to be the optimum
architecture for solution-phase integrin binding.61
This work demonstrated that the
display of multivalent binding ligands holds significant influence over integrin binding
ability.
1.1.3.3 SAMul approaches to DNA binding
DNA has been targeted by several research groups employing self-assembled binding
technologies, demonstrating wide awareness of the potential of a SAMul approach to
medicinal treatments of genetic diseases62
and even cancer.63
The naturally occurring DNA-binding ligand spermine is amongst the most often
utilised surface groups in SAMul systems and featured in notable work from both the
groups of Cheng64
of Smith.65
The approach of Cheng and co-workers directly
functionalized spermine with two oleyl hydrophobes, while Smith and co-workers
adopted a similar methodology to that used in their integrin binding work by decorating
the surface of a low-generation amphiphilic dendron with spermine. Other workers,
such as the team led by Ravoo, developed switchable SAMul DNA binders by
functionalizing spermine with an azobenzene moiety able to become encapsulated
within cyclodextrins at the surface of CD-vesicles.66
Example compounds from these
approaches are shown in Figure 1.14.

Chapter 1 - Introduction
41
Figure 1.14 – Example spermine-containing DNA binding systems from the groups of
(a) Cheng,64
(b) Ravoo66
and (c) Smith.65
The team of Smith and co-workers went on to rigorously investigate their systems
through structural modifications at the monomer surface,67
within the dendritic
branching scaffolds68,69
and of the hydrophobe,70
as well as examining the effects of co-
assembling PEG-additives into the self-assembled nanostructures.71
Overall, their most
optimized potential gene delivery agent contained a DAPMA binding group, a
degradable polyester scaffold and a reducible disulfide-containing cholesterol
hydrophobe, all of which enabled the system to controllably release its DNA payload
before itself degrading into small species with low individual DNA binding affinity.70
Other workers have developed related systems targeted at binding siRNA, with the
work of Haag, Smith and co-workers72
in particular showing good in vitro activity and
significant promise by provoking no inflammatory response during in vivo testing.73
As emphasized by the numerous works discussed in this section, the approach of self-
assembled multivalency is receiving ever more attention in the development of novel
high-affinity binding systems for a wide variety of molecular targets. From a biological
and medicinal standpoint, SAMul approaches present real pharmacological advantages
with the smaller monomer structures more easily finding regulatory approval and it is
believed by some authors that this approach may eventually lead to ‘undruggable’
conditions becoming treatable through the use of these ‘middle weight’ drugs.74

Chapter 1 - Introduction
42
1.2 Heparin Therapy
1.2.1 Heparin: the anti-coagulant of choice
Heparin is most widely known as an anti-coagulant drug and finds applications, for
example, during major surgical procedures to prevent blood clots from forming.75
Ironically, heparin was discovered by Jay McLean in 1916 during his studies of
cephalin, a suspected clotting accelerant.76,77
In the two decades following discovery,
methods were developed for the effective extraction and purification of heparin and by
1935 pure samples were being used for anti-coagulation in clinical settings, although a
reasonable understanding of the mechanism by which anti-coagulation was being
achieved was not forthcoming until the early 1970s.78,79
Heparin is a member of the glycosaminoglycan (GAG) family of linear polysaccharides
and has a molecular weight range between 2500 – 25000 Da.80
Structurally, heparin
consists primarily of 1–4 linked uronic acid and glucosamine subunits, Figure 1.15, and
the varying degrees of sulfation along these sugar components makes heparin the most
complex member of the GAG family.81
The high levels of sulfation also lead heparin to
be the most charge dense polyanion naturally occurring in biological systems, although
the absolute biological roles of heparin remain a matter of discussion.82-84
Heparin is
naturally biosynthesised as a proteoglycan and expressed in connective-tissue-type mast
cells with pharmaceutical heparin tending to be purified from bovine or porcine mucosal
tissue.75,80
Figure 1.15 – An example heparin polysaccharide (top) along with the predominant
disaccharide repeat unit (bottom left) and the specific pentasaccharide sequence
required to confer anticoagulant activity (bottom right).

Chapter 1 - Introduction
43
Given the highly polydisperse nature of heparin, it is typically fractionated into
narrower molecular weight ranges before clinical application. Low molecular weight
heparin (LMWH) consists of polysaccharides with Mrs typically between 4000 – 6000
Da while unfractionated heparin, as the name suggests, encompasses the whole Mr range
and tends to have an average Mr of ca. 15000 Da.85
Of the two, the less-polydisperse
LMWH is preferred for use in most types of general and orthopaedic surgeries, where it
is introduced either intravenously or through subcutaneous injection, as it offers a more
appealing pharmacokinetic profile.86
Typically, LMWH is metabolised with a half-life
anywhere between 3 – 6 hours, whereas the larger UFH is removed much more rapidly
in ca. 30 minutes.75
Metabolism of heparins tends to occur through two pathways: saturable binding to
receptors on endothelial cells and macrophages or renally through the kidneys, although
several factors including the degree of sulfation influence the overall rate of heparin
metabolism.86,87
Further complications in accurately predicting the dose-response of
heparin include the amount of plasma-protein binding (PPB) in which heparin becomes
involved. LMWH has a more predictable dose-response than UFH as it participates in
much less PPB.86
Indeed, greater predictability underpins the preference of LMWH for
most applications. Extracorporeal procedures such as cardiopulmonary bypass circuits
or haemodialysis provide notable exceptions, where the faster metabolism of UFH is
highly attractive. Here, the use of UFH allows the anticoagulant effect to be removed
more quickly, in some instances without the introduction of a rescue agent.88
The blood coagulation cascade in vivo is far from straightforward, although it can be
simplified into two distinct pathways, Figure 1.16. The ‘intrinsic’ pathway originates
from a surface contact trauma event while the ‘extrinsic’ pathway originates from tissue
damage.89,90
Both pathways involve a plethora of clotting factors, distinguished by
roman numerals, becoming activated or deactivated through interaction or reaction with
each other, before converging and sharing the final few steps of the cascade to
ultimately generate a fibrin-reinforced clot.91
At the convergence of this ‘common’
pathway sits Factor-Xa, which plays a key role catalysing the production of thrombin,
the species responsible for catalysing the production of the insoluble fibrin fibre and the
final clot. It is the ability of heparin to directly inhibit the catalytic activity of thrombin,
thereby retarding the production of fibrin, which primarily confers the anti-coagulant
activity.86,92
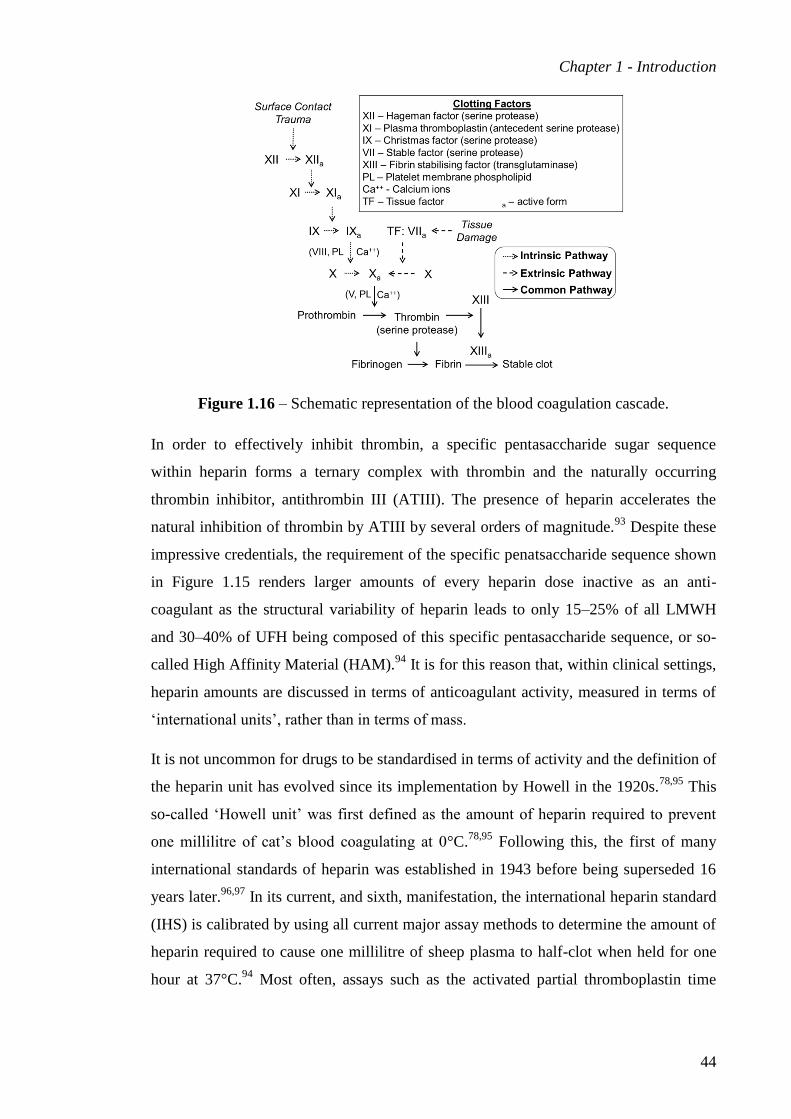
Chapter 1 - Introduction
44
Figure 1.16 – Schematic representation of the blood coagulation cascade.
In order to effectively inhibit thrombin, a specific pentasaccharide sugar sequence
within heparin forms a ternary complex with thrombin and the naturally occurring
thrombin inhibitor, antithrombin III (ATIII). The presence of heparin accelerates the
natural inhibition of thrombin by ATIII by several orders of magnitude.93
Despite these
impressive credentials, the requirement of the specific penatsaccharide sequence shown
in Figure 1.15 renders larger amounts of every heparin dose inactive as an anti-
coagulant as the structural variability of heparin leads to only 15–25% of all LMWH
and 30–40% of UFH being composed of this specific pentasaccharide sequence, or so-
called High Affinity Material (HAM).94
It is for this reason that, within clinical settings,
heparin amounts are discussed in terms of anticoagulant activity, measured in terms of
‘international units’, rather than in terms of mass.
It is not uncommon for drugs to be standardised in terms of activity and the definition of
the heparin unit has evolved since its implementation by Howell in the 1920s.78,95
This
so-called ‘Howell unit’ was first defined as the amount of heparin required to prevent
one millilitre of cat’s blood coagulating at 0°C.78,95
Following this, the first of many
international standards of heparin was established in 1943 before being superseded 16
years later.96,97
In its current, and sixth, manifestation, the international heparin standard
(IHS) is calibrated by using all current major assay methods to determine the amount of
heparin required to cause one millilitre of sheep plasma to half-clot when held for one
hour at 37°C.94
Most often, assays such as the activated partial thromboplastin time

Chapter 1 - Introduction
45
(aPTT) technique98
and anti-factor Xa assay99
are used for these purposes.92
These
procedures will be discussed in more detail in the Heparin Sensing section below.
Commercially, heparin is also sold in terms of activity rather than mass, and so each
individual batch is tested post-extraction and assigned an activity. It is possible
therefore to purchase, for example, 100 KIU (that is 100,000 IU) of heparin with a
designated activity of 185 IU mg-1
.
1.2.2 Heparin Rescue
At the conclusion of a procedure in which heparin has been used, there is usually an
immediate need to neutralise the anti-coagulant effects and allow the patient to return to
homeostasis. To do this, a so-called ‘heparin rescue’ agent is often introduced into the
patient. Currently, protamine sulfate – an arginine rich shellfish protein of ill-defined
structure – is the only licensed heparin rescue agent available in the clinic, although its
use is not without consequence.100
Structurally, the protamine protein strand is
composed of approximately 70% arginine amino acids which confer highly cationic
character and promote electrostatically driven heparin binding, Figure 1.17.101
Figure 1.17 – An example protamine structure (a) with the prevalent arginine residues
depicted as wedges, adapted from reference 101
and (b) a molecular dynamic modelling
snapshot of protamine, taken from reference 102
.
Much like UFH, protamine itself is usually introduced intravenously to the patient and
once there, it is relatively short-lived with an in vivo half-life of less than 10
minutes.103,104
This transient presence can cause problems with the use of protamine,
particularly given the previously mentioned tendency of heparin to bind to plasma
proteins (PPB).105
Often by the time such PPB-heparins are released back into the
systemic blood flow, any free protamine may have already been metabolized away. This

Chapter 1 - Introduction
46
can lead to the phenomenon of ‘heparin rebound’ where the now-released heparin
causes a second anti-coagulant event.106,107
Such rebound is widely regarded as an
associated risk of protamine use and some authors recommend a second, smaller, dose
of protamine should be administered to avoid it, although interestingly other authors go
so far as to regard heparin rebound as “much ado about nothing.”108,109
A further major problem associated with the clinical use of protamine is the toxicity risk
presented to a significant number of patients, and it is this which prevents a larger dose
of protamine being administered in the first place to negate heparin rebound. Adverse
reactions are known in up to 10% of protamine-treated patients, with up to 2.6% of
cardiac surgeries experiencing significant respiratory complications and/or
hemodynamic instability when protamine is used.110-112
Nybo and Madsen have
systematically reviewed the serious allergic reactions to protamine and demonstrated
that factors as diverse as allergy to fish and whether a patient is infertile or has
previously had a vasectomy can impact on the likelihood of an allergic response.113
Kimmel and co-workers added to this discussion by suggesting that such allergic
reactions are often under-reported and so these statistics may actually provide an under-
estimate of the true hazards associated with protamine.114
A further limitation to the clinical usefulness of protamine is its inability to fully
neutralise LMWH.115
This intermittent effectiveness has been investigated by Chan and
co-workers who found that resistance to protamine came primarily from very low
molecular weight heparin chains, which possess lower-than-normal levels of
sulfation.116
LMWH contains a higher proportion of these shorter, less anionic
polysaccharides than UFH and this accounts for the decreased effectiveness of
protamine in the neutralization of LMWH.
Given the many problems associated with protamine, it is perhaps surprising that it still
finds such prevalent use. In reality, the situation was aptly surmised by Stafford-Smith
and co-workers in 2005: “in the absence of a safer replacement, undesirable effects [are]
outweighed by its utility as the only available heparin-reversal agent.”110
As we shall
see in the Heparin Binding section below, there has been much research undertaken in
the search for an equally effective but less risky method for heparin reversal.

Chapter 1 - Introduction
47
1.3 Heparin Sensing
1.3.1 Monitoring heparin levels
1.3.1.1 During surgery
Throughout a procedure in which heparin is administered, there are two periods of time
during which it is critical to monitor the anti-coagulation level of the patient. Firstly,
whilst the procedure is in progress, suitable heparin levels must be maintained to ensure
that clotting does not begin prematurely and hinder the surgical team. To do this, a
range of so-called ‘clotting time assays’ are widely applied in the clinic.117
As the name
suggests, these record the time taken for samples of the patient’s blood to clot.118
Put
simply, a longer clotting time indicates higher levels of anti-coagulation and a higher
level of active heparin.
There are many different clotting time assays capable of monitoring the anti-coagulancy
of a clinical sample and there is much literature discussion and comparison of their
relative effectiveness and reliabilities.117,119,120
Two of the most widely used clotting
time assays are the activated partial thromboplastin time (aPTT assay)98
and the anti-Xa
assay.121
The aPTT technique specifically monitors clotting time via the ‘intrinsic’
clotting pathway, while the anti-Xa technique relies on the formation of a ternary
complex between a known excess of Factor-Xa, ATIII and heparin. Following the
introduction of a chromogenic mimic of the natural Xa substrate, the amount of non-
complexed Xa can be detected in order to indirectly calculate the amount of heparin
present.99
The reliability of each of these assays has been questioned by several authors. For
example, Rosenberg and co-workers121
pointed to limitations of the aPTT approach due
to intra- and inter-patient variability while the teams led by Ignjatovic99
and
Raymond122
shared the view that particular care must be taken to select the most
appropriate technique for the procedure being undertaken. It is widely accepted however
that the various clotting time techniques do afford reasonably accurate measures of the
anti-coagulancy of a sample and, therefore, the levels of active heparin.118,120

Chapter 1 - Introduction
48
1.3.1.2 At the conclusion of surgery
At the conclusion of a procedure in which heparin has been used, the focus of the
clinicians immediately switches from needing to know how much active heparin is
present (i.e. the level of anti-coagulancy) to how much total heparin polysaccharide is
present (i.e. irrelevant of anti-coagulant activity). The indiscriminate binding of
protamine to heparin, regardless of the polysaccharide’s activity, is the underlying
reason for this change in viewpoint. The aforementioned risks associated with incorrect
protamine dosing further emphasizes the importance of accurately quantifying the
amount of heparin remaining in the patient.123
It is perhaps surprising therefore that in
the clinic, residual heparin levels are still determined through clotting time based
techniques such as aPTT or anti-Xa measurements.
As discussed in the previous section, these techniques can each provide a good measure
of the anti-coagulant activity of heparin within a given sample.124
It is not
straightforward however to determine the global load of polysaccharide from these
values as the proportion of active heparin present in any given dose varies from batch to
batch. Consequently, there is a real need for an alternative methodology whereby the
total load of heparin polysaccharide present systemically within the patient can be
accurately and rapidly determined.
As we shall see in the sub-sections which follow, there have been a variety of
approaches to this problem, often from supramolecular chemists specializing in
controlling non-covalent interactions between different molecular species. It must be
remembered however that developing a system to interact with, or sense, heparin within
the regime described here requires the non-covalent interactions to be established
selectively with heparin within a complex biological medium such as serum, plasma or
even whole blood. This challenge is far from trivial.
The detection and quantification of polysaccharides in aqueous media is an important
task in many medicinal and industrial contexts.125
As such, there is an impressive body
of literature on sugar sensing, with much focus falling on the utilization of boronic acid
moieties.126,127
Boronic acids are particularly effective as sugar or diol targeting species,
where interactions result in the reversible formation of boronate esters.128
When suitable
chromogenic or fluorescent groups are appended onto them, the establishment of these
interactions can facilitate a sensing event, which in turn can be tuned through molecular

Chapter 1 - Introduction
49
design to respond preferentially to specific targets such as, for example, glucose129
or
fructose.130-132
As we shall see below, boronic acid derivatives were also amongst the
first synthetic systems to be investigated for heparin sensing.
1.3.2 Electrochemical sensing
Several researchers have developed systems able to exhibit a potentiometric response
upon heparin binding.133,134
Such systems were designed such that binding occurred
with all regions of the polysaccharide regardless of anti-coagulant activity, and so the
measurements could be taken as representative of the global amount of heparin within a
given sample. As an example, Yang and co-workers developed a system incorporating
cationic units into PVC membranes and films and, impressively, were able to obtain a
quantitative heparin binding response even when using relatively non-functional
quaternary ammonium groups as the cationic species within the membrane, Figure
1.18.135
Optimization of this system can be achieved by altering the cationic polymer
within the membrane, and most impressively, sensing in this manner can operate within
full human blood. A limitation of this methodology, however, is the irreversibility of
heparin binding to the membranes, as this necessitated a rinsing step between sensing
events; something of a detraction for clinicians. Nonetheless, numerous groups have
investigated this approach, with detection limits in some cases reported to be as low as
0.005 IU mL-1
.136-138
Figure 1.18 – Schematic representation of heparin binding to Yang’s quaternary amine
functionalized membrane.135
1.3.3 Colorimetric sensing
By far the most prevalent approaches to developing heparin sensors are those targeting
spectrophotometric or fluorescent dye systems, primarily due to their potential for a
simple read-out. As we shall see in some of the following examples, it is possible to
develop systems which can in some cases respond to heparin in preference to other
anionic species.

Chapter 1 - Introduction
50
Early fluorescence-based approaches monitored the inhibition activity of heparin when
binding to a fluorescent thrombin substrate.139,140
This is an example of an indirect
approach to heparin quantification as only non-heparin-bound thrombin reacted with the
substrate to generate the fluorescent response. Although this approach was relatively
fast in the clinic, with the requisite filtration and measurement of the resulting plasma
sample taking only 5 minutes, it has not widely being employed due to problems
maintaining and reliably calibrating the instruments.120
1.3.3.1 Switch-off sensors
It is preferable for heparin detection to be direct, and for that reason much attention has
focused on indicator dye systems capable of exhibiting significant switch-on or switch-
off response upon direct interaction with the heparin polysaccharide. In the same way as
the binding of protamine to heparin, direct detection in this manner can quantify the
total amount of heparin present, rather than only the anti-coagulantly active portion.
Commercial thionine-derived dyes were amongst the first to be investigated for this
purpose, although not without problems.141,142
In particular, although Azure A, a simple
commercial cationic dye, was purported to be able to monitor heparin levels in
plasma,141
it was also known to be acutely sensitive to many of the electrolytes present
in biological samples.143
These issues are examined in detail in Chapter 2.
Given the general unreliability of commercial systems, as typified by the Azure A
example, interest was fuelled in the design and development of bespoke synthetic
systems. Landmark work came in 2002 from the laboratory of Anslyn and co-workers
who synthesised a tris-boronic acid species able to indicate indirectly through
displacement of a pyrocatechol violet indicator dye.144
In order to allow for direct
heparin response, the system was elegantly modified to incorporate the fluorophore into
the binding site, Figure 1.19.145
This allowed for an association constant of 1.4 ×
108 M
-1 to be determined in 10 mM HEPES buffered at pH 7.4, and also for binding to
be observed in human serum. Upon binding to heparin within Anslyn’s system, the
associated spectroscopic signal exhibits a decrease in intensity. This type of system can
be categorized as a switch-off sensor.

Chapter 1 - Introduction
51
Figure 1.19 – Anslyn’s heparin sensors operating (a) in an indicator displacement
regime144
and (b) using a single molecule fluorescent sensor.145
These structures are also
shown in Figure 3.2.
Many switch-off sensors have been developed, with a notable example within the last
decade coming from the work of Egawa and co-workers. Their strategically sage
approach involved the functionalization of protamine with fluorescent fluorescein
moieties which, upon binding heparin, became located within the Förster distance
required for self-quenching, leading to the ‘switch-off’ of the observed signal.146
Clearly, the key advantage of this approach is that the heparin binding array is
protamine itself and so the reported binding for each sample of heparin should be
indicative of precisely what protamine will be able to bind to.
Other fluorescent switch-off sensors came from the group of Chen and co-workers who
created an array of cationic sugars by appending them onto a conjugated polymer
scaffold, Figure 1.20.147
The fluorescence of this scaffold became quenched when the
cationic groups bound to heparin as it led to aggregation of the scaffold units. A similar
approach from Bhosale and co-workers functionalized a kanamycin A derivative with a
pyrene moiety, which became quenched as the sugars bound to heparin.148
Although
effective, this system only responded at relatively high concentrations of heparin.

Chapter 1 - Introduction
52
Figure 1.20 – Fluorescent sugar-containing heparin sensors from the groups of (a)
Chen147
and (b) Bhosale.148
A particularly interesting switch-off sensor came from the work of Schrader and co-
workers, who designed a multi-binding methacrylamide polymer which, clearly inspired
by the landmark work of Anslyn,145
was decorated with o-aminomethylphenyl-boronate
derivatives, along with fluorescent dansyl groups.149
Most impressively, even in the
absence of any charge, near micromolar heparin binding was observed in the presence
of 25 mM HEPES buffer. In this system, the interactions were not strictly non-covalent
as covalent boronate-esters form between the polymer and heparin, but these bonds
were fully reversible, as demonstrated by their cleavage upon the addition of protamine.
1.3.3.2 Switch-on sensors
As insightful as the plethora of switch-off sensors can be, switch-on sensors carry the
advantage of even easier detection, as the spectroscopic signal increases from zero upon
heparin binding. Often, the signal switch-on is the result of a triggered aggregation
event. An example from Zhang, Zhu and co-workers involved the use of an ammonium
functionalized silole species which aggregated in the presence of heparin leading to a
switch-on response.150
The system was shown to be effective in the presence of sulfate
rich HEPES buffer and also in horse serum although there was a need to manually
subtract the signals from the fluorescence of serum itself. In a related, albeit more
synthetically complex, example from Wang and co-workers, a pyrene functionalized
quinine exhibited switch-on fluorescence in the presence of heparin due to the formation
of an excimer complex between two molecules of dye and the heparin biopolymer.151
Selectivity for heparin over other GAGs was demonstrated for this example and

Chapter 1 - Introduction
53
rationalised by Wang and co-workers to be due to structural compatibility between
heparin and the indicator dye.
Selective heparin binding was also achieved by Liu and co-workers who developed a
range of versatile conjugated polyelectrolyte structures appended onto a polyfluorene
backbone, Figure 1.21.152-154
Their system was able to respond to heparin either in a
switch-on, direct colorimetric or ratiometric fashion as a result of aggregation. Indeed,
the colour change upon heparin binding in 2 mM PBS was so vivid that it could be
observed by the naked eye, and was easily differentiable from binding to other GAGs
such as hyaluronic acid. Other examples of this type of aggregation-induced
fluorescence can be found in the work of Wang and co-workers, who developed similar
cationic conjugated polyfluorene systems to Liu.155
Král and co-workers, meanwhile,
focussed on the development of polymethinium salts which exhibited selective heparin
binding at the more acidic pH of 5.53 in 1 mM phosphate although it was not clear
whether the same results could be reproduced under more biologically relevant
conditions.156
Figure 1.21 – A polyfluorene heparin sensing derivative from Liu and co-workers.154
One of the main limitations of developing fluorescent sensors which are able to sense
heparin in biological conditions such as serum is the problem of serum auto-
fluorescence. Specifically, the hydrophobic regions of serum tend to exhibit
fluorescence following excitation with short wavelengths of light and, at concentrations
as low as ca. 5% serum, this effect becomes sufficient to render any sensing response
meaningless. In order to overcome this, there have been several efforts to develop

Chapter 1 - Introduction
54
sensors which fluoresce at longer wavelengths. A particularly eye-catching attempt at
this came from Nitz and co-workers with a system based around the polyelectrolyte
effect.157
They developed a cationic sensor which had its fluorescence quenched by
chloride counter ions meaning that a switch-on response was observed upon binding to
heparin, as this caused chloride anions to be expelled from the binding ensemble.
Disappointingly though, the system was too insensitive to detect heparin at clinically
relevant concentration levels. A more promising longer-wavelength fluorescent sensor
came from Krämer and co-workers who synthesised a perylene diimide species, Figure
1.22, which fluoresced at 615 nm following excitation at 485 nm and was able to
achieve meaningful detection of LMWH in up to 20 vol% of serum and/or plasma.158
Figure 1.22 – A perylene diimide sensor structure from Krämer and co-workers.158
Other researchers have employed different methods for working around serum auto-
fluorescence. For example, Yam and Yeung developed an alkynylplatinum(II) complex
which emitted in the near infra-red (NIR) region upon binding to heparin.159
Their
system also gave useful circular dichroism signals; the magnitude of which allowed
differentiation between UFH, LMWH and other GAGs such as chondroitin sulfate.
Arguably the most promising, and fundamentally impressive, switch-on fluorescent
sensor to date came from the work of Chang and co-workers, who employed a high-
throughput diversity-oriented fluorescent library approach (DOFLA) in their search for
an effective sensor.160
This approach is significantly different to the previous examples
presented above, which generally originated from some modicum of semi-rational
design. Chang’s DOFLA approach was able to screen a large number of molecules and
identified two particularly promising functionalized benzimidazolium dyes, named
heparin orange and heparin blue after their respective colours, Figure 1.23. These dyes
were able to respond significantly to clinically relevant concentrations of heparin, even
in the presence of 20% human plasma. Moreover, these sensors are only dicationic at

Chapter 1 - Introduction
55
physiological pHs which further suggests that the DOFLA approach identified well
optimized structures.
Figure 1.23 – Heparin orange and heparin blue, discovered via a diversity-oriented
library approach in the group of Chang.160
1.3.3.3 Ratiometric sensors
In addition to the work involving single sensor dyes presented above, there is a growing
interest in sensing systems involving more than one indicator dye. This approach
usually takes the form of ratiometric sensing, which involves monitoring spectroscopic
changes at two wavelengths to provide internal calibration of the system: a key
advantage over a single dye approach.
The team lead by Zhang adopted this methodology and their two component binding
ensemble provides an excellent recent example of ratiometric heparin sensing.161
The
ensembles consisted of an alkyl-ammonium functionalised anthracene derivative which
exhibited a decrease upon binding to heparin as a result of aggregation-caused
quenching (ACQ), and an alkyl-ammonium tetraphenylethene (TPE) species which
exhibited enhanced fluorescence upon binding due to aggregation-induced emission
(AIE), Figure 1.24. The unusual phenomenon of AIE is widely thought to be associated
with the enhanced conjugation which results from the coplanarisation of
photoluminescent groups, such as TPE, upon intermolecular assembly.162,163
Consequently, when both components in Zhang’s system bind to heparin, in a 10 : 11
ratio, monitoring the relative ratio of their fluorescence intensities affords ratiometric
data. Although more robust than some single-dye approaches, correction factors still
needed to be introduced when heparin sensing was carried out in serum.

Chapter 1 - Introduction
56
Figure 1.24 – Two-component heparin sensor from Zhang and co-workers.161
Similar AIE approaches have recently been adopted by other researchers such as Tang,
Liu and co-workers who developed a fluorene-based system which adopted a propeller-
like conformation to exhibit a fluorescence enhancement upon interaction with
heparin.164
A particularly selective AIE-based heparin sensor has also recently been
forthcoming from Tong and co-workers, which in addition to high selectivity, exhibited
acute sensitivity with a heparin detection limit of 57.6 ng mL-1
.165
Krämer and co-workers, meanwhile, built on their earlier approach of using long
wavelength fluorescent dyes by developing a pair of cationic ruthenium complexes in
which, upon co-assembling on heparin, the proximity of the second complex quenched
the fluorescence of the first leading to a detectable optical output at 630 nm.166
Although this system was able to detect heparin within a clinically useful concentration
range in the presence of serum, the system was not selective for heparin and so
responded somewhat to the presence of other GAGs.
Other recent attempts to work around serum-autofluorescence from Zhao, Liu and
Huang employed a phosphorescent conjugated polyelectrolyte (PCPE) containing an
Ir(III) complex which was able to selectively respond to heparin in a ratiometric manner
both in aqueous solution and in the presence of serum, Figure 1.25a.167
Most
impressively, this system was able to respond to heavily diluted samples of heparinized
human blood. In separate work, the fluorescently-labelled peptide of Lee and co-
workers was not tested directly in human blood, although it did offer remarkable
sensitivity, in the picomolar (pM) range, in aqueous solutions across a range of pHs and
also in samples containing 5% serum or plasma, Figure 1.25b.168

Chapter 1 - Introduction
57
Figure 1.25 – Selective ratiometric sensors: (a) phosphorescent conjugated
polyelectrolyte structure from Zhao, Liu and Huang167
and (b) peptide structure from
Lee.168
1.3.4 Solid/nanoparticle supported sensing
All of the heparin sensors presented so far operate within the homogeneous solution
phase, however there are a growing number of heterogeneous and/or nanoparticle
approaches to heparin sensing. For example, the aforementioned sensors developed by
Krämer and co-workers have been immobilised on SiO2 beads in an attempt to increase
the commercial appeal of the system.166
Disappointingly, this modification retarded the
heparin on-rate, decreasing the efficacy of the system and meaning further development
is still required if such a system is to become commercialised. This gives a suitable
reminder that molecular-scale chemical considerations are not the only drivers which
must be addressed in the search for viable heparin sensing systems.
The group of Martínez-Máňez, Marcos and co-workers functionalised silica
nanoparticles with both thiols and cationic amines to generate a sensing system in which
a fluorescent squaraine dye was perturbed in the absence of heparin due to the
nucleophilic attack of the surface thiols.169
In the presence of heparin, the surface
amines interacted with the polysaccharide causing it to wrap around the NPs and
prevent the thiol-induced perturbation of the squaraine, thereby leading to the detection
event. Unfortunately, the poor solubility of the NPs within this system necessitated
operation in the clinically unappealing presence of 45% DMSO and 10% CH3CN.

Chapter 1 - Introduction
58
Gold nanoparticles (AuNPs) have been investigated in heparin, and indeed protamine,
sensing situations by several groups trying to utilise the distance-dependant optical
properties of the AuNPs.170
For example, Li and Cao functionalized AuNPs with
cationic cysteamine groups and were able to observe an absorbance change at 670 nm as
the AuNPs aggregated along the heparin chain.171
This system was demonstrated to be
operable in the presence of 1% human serum with a detection limit of 0.1 µg mL-1
.
Another well thought out method involving AuNPs came from the work of Chen and
co-workers, who monitored the change in surface plasmon resonance signals as AuNPs
aggregated on a graphene oxide (GO) surface, Figure 1.26.172,173
In this example, the
AuNPs were capped with anionic citrate groups and protamine was used to bridge
between the GO and the AuNPs, assisting their aggregation along the surface. Upon the
addition of heparin, protamine was sequestered from this bridging role by forming
preferential electrostatic interactions with the polysaccharide, and the AuNPs thereby
deaggregated away from the GO surface. The resulting ‘blue-to-red’ colour shift
indicated the extent of de-aggregation, which in turn corresponded directly to the
amount of heparin present. Remarkably for such a complex-sounding methodology,
heparin could be quantified down to 1.0 µg mL-1
at pH 7.4, and also in fetal bovine
serum.
Figure 1.26 – Graphene-AuNPs sensing system from Chen and co-workers. Figured
adapted from reference 172
.
As we have seen throughout this section, there have been a variety of promising
approaches to developing a novel heparin sensing system able to accurately determine
the residual systemic amount of heparin in a biological sample, however to date none of
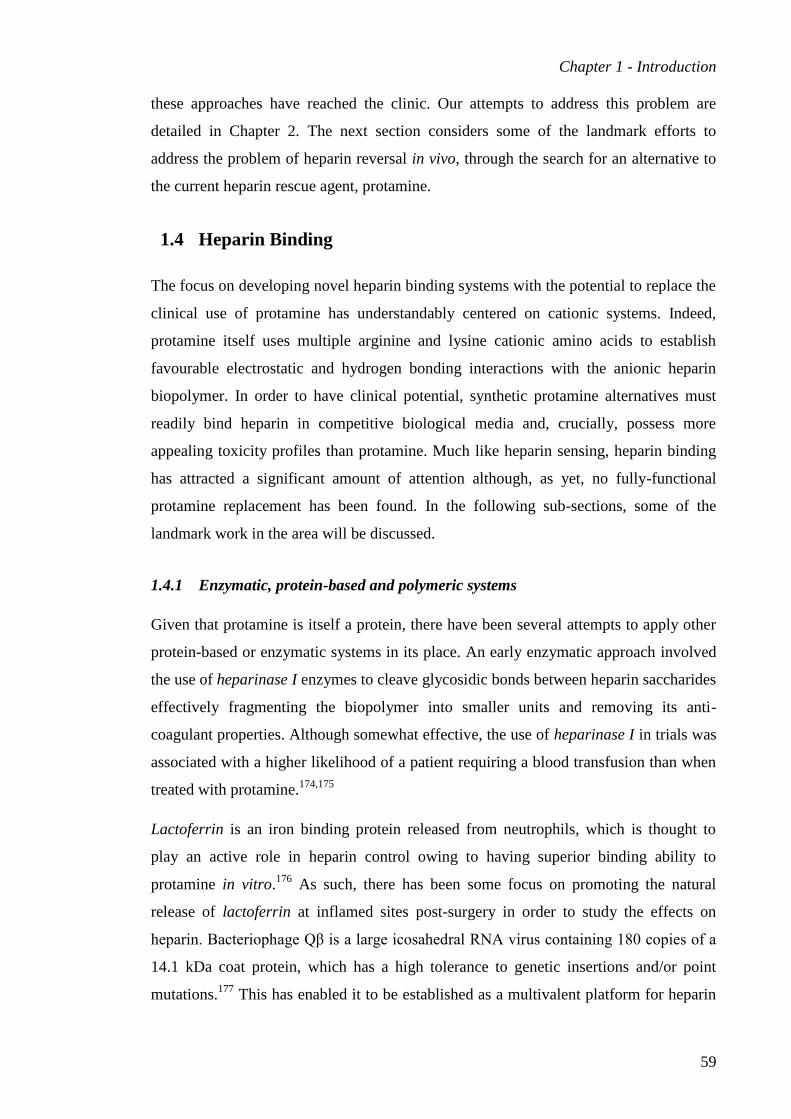
Chapter 1 - Introduction
59
these approaches have reached the clinic. Our attempts to address this problem are
detailed in Chapter 2. The next section considers some of the landmark efforts to
address the problem of heparin reversal in vivo, through the search for an alternative to
the current heparin rescue agent, protamine.
1.4 Heparin Binding
The focus on developing novel heparin binding systems with the potential to replace the
clinical use of protamine has understandably centered on cationic systems. Indeed,
protamine itself uses multiple arginine and lysine cationic amino acids to establish
favourable electrostatic and hydrogen bonding interactions with the anionic heparin
biopolymer. In order to have clinical potential, synthetic protamine alternatives must
readily bind heparin in competitive biological media and, crucially, possess more
appealing toxicity profiles than protamine. Much like heparin sensing, heparin binding
has attracted a significant amount of attention although, as yet, no fully-functional
protamine replacement has been found. In the following sub-sections, some of the
landmark work in the area will be discussed.
1.4.1 Enzymatic, protein-based and polymeric systems
Given that protamine is itself a protein, there have been several attempts to apply other
protein-based or enzymatic systems in its place. An early enzymatic approach involved
the use of heparinase I enzymes to cleave glycosidic bonds between heparin saccharides
effectively fragmenting the biopolymer into smaller units and removing its anti-
coagulant properties. Although somewhat effective, the use of heparinase I in trials was
associated with a higher likelihood of a patient requiring a blood transfusion than when
treated with protamine.174,175
Lactoferrin is an iron binding protein released from neutrophils, which is thought to
play an active role in heparin control owing to having superior binding ability to
protamine in vitro.176
As such, there has been some focus on promoting the natural
release of lactoferrin at inflamed sites post-surgery in order to study the effects on
heparin. Bacteriophage Qβ is a large icosahedral RNA virus containing 180 copies of a
14.1 kDa coat protein, which has a high tolerance to genetic insertions and/or point
mutations.177
This has enabled it to be established as a multivalent platform for heparin

Chapter 1 - Introduction
60
binding following the insertion of multiple arginine groups.178
Although this approach
did generate some systems with superior neutralisation effects than protamine in
clotting assays, their time-consuming preparation is a significant detraction, as is the
current absence of toxicology studies.
Unsurprisingly, several researchers have focussed on producing smaller shorter-chain
peptide structures. For example, Yang and co-workers developed a range of low-
molecular-weight-protamine (LMWP) systems by digesting native protamine strands
with thermolysin.179
This technique produced arginine rich peptide sequences such as
VSRRRRRRGGRRRR which could effectively neutralise heparin in vivo whilst
provoking less immunogenicity than native protamine, although the complex digestion
step again restricted genuine clinical interest.180-182
A similar study by Wakefield and
co-workers observed that a range of cationic peptides were significantly less toxic than
protamine, although they also suggested that treatment with these peptides resulted in
incomplete reversal of heparin.183
A further range of synthetic peptides has been
developed from residues 27–38 of human serum amyloid P.184
Despite not possessing a
high density cluster of basic amino acids, this specific sequence still demonstrated the
ability to bind heparin at micromolar levels. The inactivity of a sequence scrambled
version of this peptide suggested that the binding mode of residues 27–38 is
fundamentally optimised in some way, although further studies are required to better
understand this.184
Some of the earliest work in the area came in 1958, when the synthetic polymer
polybrene – hexadimethrine bromide, Figure 1.27a – was examined as a protamine
alternative.185-187
Polybrene has a much simpler cationic polymer structure than
protamine and was tested in vivo, where it showed promise but ultimately was only
around 70% as effective as protamine.188
Interestingly, development of this system
appeared to halt and it seems likely that toxicity problems hindered its progress.
Toxicity of cationic synthetic polymers can however be tempered by careful design of
the polymeric backbone. For example, dextran and hydroxypropylcellulose polymers
have been functionalised with cationic groups and shown to have relatively good
biocompatibility, with heparin binding affinity increasing with degree of cationic
decoration.189,190
A further advantage of such sugar-based systems is their wide
commercial availability.

Chapter 1 - Introduction
61
Figure 1.27 – Cationic heparin binding polymers: (a) Quaternary ammonium-based
cationic polymer polybrene and (b) an arginine functionalised PAH.191
Recently, Szczubiałka, Nowakowska and co-workers reported the preparation and
rigorous preliminary testing of an arginine functionalised poly(allylamine
hydrochloride) (PAH) polymer, Figure 1.27b.191
Impressively, across a variety of
solution phase and biological assays including in vitro plasma clotting (aPTT) and in
vivo coagulation studies in rats, the heparin neutralisation performance of the polymers
was shown to be similar or superior to protamine. Initially, the argininylated structures
also appeared to be non-toxic to cells although, as acknowledged by the authors, more
systematic pharmacokinetic and toxicity studies are still required for this promising
candidate.
A different family of cationic polymers are the commercially available
poly(amidoamine) (PAMAM) dendrimers, and these well-defined species have been
examined for their heparin binding ability.192
Xu, Cheng and co-workers observed some
insightful generational effects, where the most highly charged dendrimer was not
necessarily the best heparin binder. The binding of PAMAM dendrimers to LMWH has
also been studied in rats, although in this example no reversal of anti-coagulation was
observed.193,194
Instead, it was suggested that the PAMAM dendrimers may be used in
this setting to enhance the absorption and assist delivery of the LMWH, hinting at the
potential for use as deep vein thrombosis prevention agents. Indeed, this is an example
of how heparin binders could be developed into delivery vehicles rather than rescue
agents. Our own studies involving PAMAM (and related) dendritic systems are
presented in Chapter 3.
1.4.2 Small molecules
Despite heparin being a large somewhat polydisperse polysaccharide, there are several
examples of heparin neutralization being attempted using more traditional well-defined
‘drug-like’ small molecules. One of the earliest small molecules to be considered as a
potential heparin rescue agent was known heparin sensor methylene blue, although,
presumably owing to its monocationic nature, it was shown to be ineffective.186,195
Chapter 1 - Introduction
62
An important ‘small molecule’ system emerged in the form of Delparantag, a penta-
cationic species derived from alternating aromatic and lysine amino acid units, Figure
1.28.196,197
The lysine side-chains confer heparin binding ability while the aromatic units
confer some rigidity to the species. Impressively, an in vivo clinical trial in six male
humans, along with animal studies, suggested Delparantag was as effective as
protamine at neutralizing heparin without creating complications such as a heparin
rebound effect. Following Phase II clinical trials, considerations of the suitability of
Delparantag in different clinical situations continue.198
Figure 1.28 – Delparantag is a lysine-containing penta-cationic heparin binder.
Eye-catching work from the group of Cunsolo and co-workers developed polycationic
calix[8]arenes and demonstrated their ability to neutralise heparin in blood. In vitro
studies showed that neutralization was faster and more efficient than protamine,
although hemolysis did occur at high calix[8]arene concentrations.199,200
On the
molecular level, it was proposed that the flexibility of the scaffold maximized heparin
binding as the cationic groups had some freedom to optimize their individual
interactions with the biopolymer. Indeed, an ‘octopus-like’ chelate effect was observed
computationally, Figure 1.29. Follow-up work from the same group then immobilized
these structures onto a polymer matrix to yield a filter-like structure which may have
potential for the ‘clean-up’ of a patients’ bloodstream following a procedure such as
coronary bypass.201
It can be envisaged that the blood could be passed through the filter-
like structure, thereby avoiding the need to directly introduce antidote molecules
directly into the bloodstream.

Chapter 1 - Introduction
63
Figure 1.29 – Calix[8]arene from Cunsolo and co-workers with structure (left) enabling
chelate effect to be maximized through adoption of ‘octopus-like’ conformation (right,
space-filled species represents calix[8]arene, stick model represents heparin). Figure
adapted from 200
.
Foldamers are small peptide-protein mimics which establish well-defined
conformations. The group of DeGrado and co-workers established an octa-cationic
arylamide-derived foldamer decorated with amine and/or guanidinium groups which
exhibited heparin antagonism in vitro, Figure 1.30.202,203
Their controlled structure-
activity studies demonstrated that guanidinium cations enhanced the heparin binding of
the system 2.5-fold over simple amines. Recently published follow-up studies
demonstrated further activity of these systems against ATIII in Factor-Xa type heparin
binding assays, and the systems were also shown to be sufficiently versatile to
neutralise fondaprinux (a synthetic analogue of the specific penatsaccharide sequence
which confers heparin anti-coagulant behaviour).204
Figure 1.30 – An octa-cationic arginine-containing foldamer from DeGrado and co-
workers.202
As a final example, surfen – bis-2-methyl-4-amino-quinolyl-6-carbamide, Figure 1.31 –
was investigated as a heparin binder by Esko and co-workers in 2008.205
It was
demonstrated that protonation of the quinoline rings was sufficient to confer heparin
binding activity, despite the low molecular charge. Surfen had first been studied by

Chapter 1 - Introduction
64
Hunter and Hill in 1961, who suggested that the small amount of charge per molecule
made heparin-reversal performance inferior to protamine.206
This lower potency
ultimately leads to unacceptably high IC50 values and so further investigation of surfen
has been halted.
Figure 1.31 – Surfen, one of the smallest synthetic heparin binders to be examined as a
potential heparin rescue agent.205
1.4.3 Self-assembling systems
Given the many advantages of creating large multivalent ligand arrays from smaller,
more synthetically tractable and biologically compatible building blocks, it is perhaps
surprising that there are so few examples of self-assembling multivalent (SAMul)
approaches to heparin binding. The maiden example came from Stupp and co-workers
in 2006 with a complex lipopeptide capable of self-assembling into heparin binding
cylindrical micellar nanostructures, Figure 1.32.207-209
Structurally, a known heparin
binding sequence consisting of three lysine and one arginine group was installed within
the hydrophilic region of the self-assembling lipopeptide, while an n-alkyl chain
conferred amphiphilicity.210
In the presence of heparin, the individual self-assembled
nanofibres were able to nucleate a further assembly event to form gel-based
materials.209
Stupp and co-workers then demonstrated that the heparin within these gels
was able to stimulate the formation of new blood vessels (angiogenesis), opening up
further biomedical interest. Subsequent studies additionally showed that by co-
assembling a fluorescently-labelled lipopeptide into the system, fluorescein-tagged
heparin could be detected through a FRET mechanism.208
Figure 1.32 – A self-assembling heparin-binding lipopeptide from Stupp and co-
workers.207

Chapter 1 - Introduction
65
Other noteworthy approaches to self-assembling heparin binders came from Smith and
co-workers in 2011, who adapted a low generation analogue of a known DNA binding
SAMul dendron and demonstrated its potential for binding to the heparin biopolymer,
Figure 1.33.211
An attractive feature of this approach is the relative synthetic
accessibility of the molecular building block. The initial work from the group of Smith
established that the amphiphile self-assembled to afford nanoscale micellar structures
which appeared to bind heparin due to the multivalent cationic ligand array displayed at
the assembly surface. There were some limitations to this initial work and these are
discussed in more detail in Chapter 4.
Figure 1.33 – Self-assembling heparin binding compound subjected to preliminary
testing by Smith and co-workers.211
This Figure is also shown as Figure 4.2.
1.5 Project Aims
The overarching theme of this project is heparin therapy, the clinical use of heparin as
an anti-coagulant during surgery or other medical procedures. In particular, the focus
falls on two distinct areas: (i) heparin sensing, and the need for a more effective and/or
reliable methodology for quantifying the amount of heparin remaining within a patient
during, and at the conclusion of, treatment; and (ii) heparin binding, and the need for a
better heparin rescue agent capable of neutralizing the anti-coagulant effect of heparin at
the conclusion of surgery, without presenting risks such as those associated with the
clinical use of protamine. By considering these two clinical problems from a
supramolecular chemistry perspective, it was hoped that fundamental insights into
heparin binding and sensing might be revealed, which, in turn, may be able to inform
future developments in the area.

Chapter 1 - Introduction
66
1.5.1 Heparin sensing
The heparin sensing arm of this project adopted the goal of identifying a more suitable
methodology for the determination of the overall residual load of heparin – that is the
complete biopolymer, regardless of anti-coagulant activity – remaining systemically
within a patient at the conclusion of surgery. Building on the many promising examples
presented earlier, a colorimetric sensing regime was targeted. It was hoped that this
would offer significant advantages over clotting based techniques, which are based
exclusively on heparin activity, by binding indiscriminately to heparin in a manner more
simulative of protamine binding characteristics.
In order to maximize the clinical appeal of a potential heparin sensing system,
commercial indicator dyes were considered first to examine whether any ‘off-the-shelf’
species would be suitable for such heparin sensing applications. Should an already-
commercial option not be forthcoming, the intention was to design a bespoke heparin
sensor with a major focus on synthetic simplicity. Indeed, one of the drawbacks of even
the most promising colorimetric systems discussed previously is their often unattractive,
multi-step syntheses. The ease of uptake for a potential end-user remained a
consideration throughout the study of our sensing systems.
It is worth noting that from a supramolecular chemistry perspective, developing and
testing such a colorimetric heparin sensor is far from trivial. Establishing selective
supramolecular interactions with any target (but in our case heparin) within highly
competitive media such as high buffer and/or salt concentrations, or biological media
such as human serum or plasma, is a great challenge. Also, any output signal from the
sensor must remain quantitative, unperturbed and easy-to-calibrate within such media.
1.5.2 Heparin binding
The heparin binding part of the project aimed, ultimately, to advance the understanding
of the potential for self-assembling multivalent (SAMul) systems to be applied in
heparin rescue treatments. To do this, initially, a range of well-defined cationic species
such as commercial PAMAM dendrimers were studied for their relative heparin binding
properties. This study hoped to give insights into some fundamental binding preferences
of heparin.

Chapter 1 - Introduction
67
Subsequently, the project moved on to consider, initially through further investigation
of the previously reported SAMul heparin binder from within the Smith group, the
potential of a SAMul approach for heparin binding in competitive conditions.211
The
SAMul-heparin-binding concept is cartooned in Figure 1.34.
Figure 1.34 – Cartoon showing the concept of self-assembled multivalency (SAMul) in
for heparin effective heparin binding.
In particular, there was to be a focus on examining the effects of electrolytic
competition and biological conditions upon the heparin binding performance, and more
fundamentally, the properties of such self-assembled nanosystems. Meaningfully
probing heparin binding under such conditions may require the careful development of
a sufficiently robust assay technique, as this was a limitation previously acknowledged
by Smith and co-workers in their preliminary studies.211
Further insights into the
physical and theoretical properties of our SAMul systems were to be targeted through
collaborations with the laboratories of Dr Marcelo Calderon at Freie Universität Berlin,
Germany and Professor Sabrina Pricl at University of Trieste, Italy. It was intended that
Dr Calderon would provide solution phase insights through dynamic light scattering
techniques which would be ideal for comparison against our own microscopy imaging
and the computational molecular dynamic modelling approaches employed by Professor
Pricl.
Once some understanding of the SAMul systems had been gained, it was intended to
evolve the approach by re-designing the monomer unit(s) in response to these
observations. It was hoped that promising candidates would be subjected to clinically
relevant plasma clotting assays through collaboration with Professor Jeremy Turnbull at
University of Liverpool, UK. This application-driven design, test, review, modify
approach was intended to permit progress towards a clinically relevant understanding of

Chapter 1 - Introduction
68
the real-world requirements of SAMul systems, and allow a meaningful assessment of
the potential of SAMul approaches for use in heparin rescue treatments.

Chapter 2 – A Simple Robust Heparin Sensor
69
2 Chapter 2 – A Simple Robust Heparin Sensor
2.1 Introduction
At the conclusion of a surgical procedure involving the use of heparin as an anti-
coagulant drug, there is an immediate need to reverse the effect and allow clotting to
begin.212
This heparin reversal is achieved through introduction of the only licenced
heparin reversal agent: protamine. Due to the toxicity risks associated with the clinical
use of protamine, dosing is crucial in order to minimise the risk to patients. In order to
dose protamine appropriately, the amount of heparin remaining in the patient at the end
of surgery must be accurately quantified.
While a surgical procedure is in progress, the level of heparin in the patient must be
closely monitored in order to maintain sufficient levels of anti-coagulation. Clotting
time assays such aPTT or anti-Xa techniques can be particularly effective in this role;
giving a good measure of the active heparin levels in a blood sample, from an anti-
coagulation viewpoint.117,118
Currently, at the conclusion of surgery, these same
techniques are employed to calculate the amount of residual heparin remaining in the
patient. The use of clotting time based techniques at this stage of the process is not
ideal.122
Rather than determining the amount of heparin remaining in the patient from an
anti-coagulancy viewpoint, it would be more informative to quantify the amount of
global heparin remaining in the patient, irrespective of its activity. Protamine, the
heparin antidote, is unable to differentiate between active and inactive regions of
heparin when neutralising the anti-coagulant effects and so a measure of total amount of
heparin in the patient may help with more accurate dosing.213
Colorimetric sensors have great potential for quantifying the global amount of heparin
in a sample.212
Colorimetric detection involves an indicator dye exhibiting a change in
photospectroscopic or fluorescent signal intensity upon interaction – usually, but not
exclusively, in a non-covalent manner – with heparin. This type of measurement is able
to give a direct read-out of heparin levels by simple comparison to known standards. A
key advantage of a colorimetric approach to heparin monitoring is the ability of the dye
to bind to / interact with all of the heparin chains indiscriminately, regardless of whether
they contain the correct sequence of sugars to confer anti-coagulant activity. This leads
to quantification of the total amount of heparin – not just the amount of active heparin –

Chapter 2 – A Simple Robust Heparin Sensor
70
which in turn should allow for more accurate protamine dosing and, ultimately,
improved clinical outcomes.
A sensor dye capable of detecting heparin in a clinically relevant situation has many key
challenges to overcome. Firstly, the sensor must be able to establish interactions with
heparin. Most widely, heparin sensors contain cationic functional groups which can
establish electrostatic interactions with the anionic sulfate and carboxylate groups on the
heparin biopolymer. Secondly, the sensor must exhibit a quantifiable spectroscopic
change upon establishing these interactions with heparin either in the form of an
increase (switch-on sensing) or decrease (switch-off sensing) in signal intensity.
Thirdly, for the sensor to be of potential clinical relevance, it must be able to exhibit this
response to heparin when heparin is present at clinically relevant concentration levels,
and, most challengingly, in an electrolytically competitive media such as human
plasma.
To date, a wide variety of spectrophotometric and fluorescent heparin sensors have been
investigated, with some demonstrating a particularly impressive ability to detect and
quantify heparin levels in complex biological media such as human plasma.158,160
An
important factor for any potential heparin sensor wishing to find application at the
point-of-care in the clinic is synthetic accessibility. Understandably, this is not always
maintained as a high priority during the development of candidate sensors and so
promising molecules can often be accompanied by unwieldy synthetic baggage. Indeed,
one of the significant detractions of many of these systems is the complex, multi-step,
syntheses required in their creation. As a consequence of this, the Smith group became
interested in the challenge of identifying a synthetically-simple, or ideally already
commercial, sensor dye able to detect/respond to heparin in a clinically relevant sample.
2.2 Considering Commercial Options
Our search for an accessible heparin sensor began by considering commercially
available species, starting with the thionine family of dyes. Thionine consists of a
heteroaromatic phenothiazine-like core functionalised with two pendant amines.
Thionine is the parent member of a family of dye analogues, each of which contains the
same aromatic core functionalised to differing degrees by methylation of pendant

Chapter 2 – A Simple Robust Heparin Sensor
71
amines. At one extreme is the tetra-methylated analogue methylene blue, while at the
other is non-methylated thionine, see Figure 2.1.
Figure 2.1 – A selection of dyes from the thionine family.
Thionine dyes have been known and studied from as early as 1884214
and have been
used commercially throughout the twentieth century. In the early-to-mid part of the
century, commercial samples were routinely of unreliable purity215
and much effort had
to be put into purifying them.216-218
Thionine dyes can be readily protonated to give
cationic species, and consequently have previously been investigated in systems to bind
biological polyanions such as DNA.219
Methylene blue (MB) has been investigated as a heparin reversal agent in its own right
in several studies, although dosing was found to be unreliable,220
there were toxicity
problems221-223
and, most potently, it was widely shown to be ineffective.186,195
A
straightforward explanation of MBs inability to neutralize heparin in these clinical
studies lies with its mono-cationic nature.
The spectrophotometric study of the heparin binding site by Liu and co-workers showed
that increasing the amount of competitive electrolytes in the test system interfered with
the MB-heparin interaction, and so the spectroscopic response was reduced.142
These
observations marry-up well with the observations of Smith and co-workers, who found
the MB-heparin interaction was no longer spectroscopically evident even in the
presence of relatively low concentrations of NaCl.211
Similarly, the acute sensitivity of
di-methylated thionine analogue Azure A (AA) to increasing electrolyte concentrations
has also been well documented.143
Given this electrolytic sensitivity, reports from the teams of Klein141
and Yang224
utilising mono-cationic Azure A for heparin quantification in samples of human plasma
are somewhat surprising. Human plasma contains a plethora of charged electrolytes and
so it would be reasonable to expect the AA-heparin interactions to be disrupted. One of
the limitations in the works of Klein and Yang is the absence of attempts to control the
pH in their systems. Thionine derivatives, including Azure A, are known to exhibit

Chapter 2 – A Simple Robust Heparin Sensor
72
perturbed spectrophotometric responses under different pH regimes, and it seems likely
that in changing the relative concentrations of heparin or protamine during their assays,
Klein and Yang may have unwittingly also altered the pH of the system.225-227
This
change may account for their observed spectrophotometric responses.
Thionine – often referred to as Lauth’s violet in honour of pioneering French dye
chemist Charles Lauth – is the only member of the dye family in which neither of the
pendant amines is decorated with methyl groups. The absence of methyl groups allows
native thionine to carry two positive charges at biologically relevant pHs (e.g. pH 7).
For this reason, the ability of thionine to spectrophotometrically respond to heparin in
the presence of 5 mM KCl in the work of Baumgärtel and co-workers can begin to be
understood.228
Their work charted the change in UV-vis spectra as different amounts of
thionine were added to samples of heparin. It was suggested that the spectroscopic
signal was independent of the proportion of heparin covered by dye; that is to say an
‘all-or-none’ binding model was declared valid. One self-acknowledged limitation of
their study was the use of a relatively high concentration of thionine (200 µM). They
were concerned that the previously studied phenomenon of thionine aggregation may
have played a role in their results.229
The response of thionine to heparin in the presence
of some competitive electrolyte showed promise, although the tolerance to more
biologically relevant electrolytes (e.g. NaCl) was not studied. This was taken as the
starting point for our investigations.
The ultimate goal of this work was to identify a heparin sensor able to
spectroscopically respond to heparin in biologically relevant media such as human
serum/plasma. For initial screening, it was decided to test candidate sensors in 150 mM
NaCl. This concentration of electrolyte was chosen to somewhat mimic the electrolyte
concentration present in human plasma, which are known to be 150 mM Na+, 110 mM
Cl⁻ and HCO3⁻.230
A propensity to operate within this regime would indicate a potential
for heparin binding, and therefore spectroscopic response, in the even more competitive
conditions presented by human serum. These ‘intermediate’ salt-containing conditions
also allow sub-standard dyes to be dis-regarded without consumption of the more
expensive serum. In order to minimise any pH changes, all test solutions were buffered
at pH 7 using Tris HCl.

Chapter 2 – A Simple Robust Heparin Sensor
73
Thionine was optimised at a concentration of 16 µM, which gave a satisfactory
absorbance of ca. 1 at 595 nm. This concentration additionally ensured thionine was
operating below previously observed critical aggregation concentrations.229
As shown
in Figure 2.2, in the absence of salt, a strong ‘switch-off’ response is seen upon
introduction of heparin to a cuvette containing thionine and buffer. Disappointingly, the
same response was not observed upon addition of heparin to a cuvette additionally
containing 150 mM NaCl. This suggests that the doubly-charged thionine is unable to
out-compete the mono-cationic sodium at the heparin surface although this is perhaps
not surprising as in total there is only 0.2% as much cationic charge in the solution from
thionine (32 µM) as there is from Na+ (150 mM). Using a higher concentration of
dyestuff, in the manner of Baumgärtel and co-workers may help to overcome this
however a significant increase may lead to absorbance intensity becoming above
detectable levels.
Figure 2.2 – UV-vis absorbance spectra of thionine acetate (16 µM) in salt (150 mM)
and buffer (1 mM Tris HCl) in presence (grey) and absence (solid black) of heparin.
Thionine acetate (16 µM) in the presence of heparin with no NaCl present is included
for comparison (dashed black).
Following the failure of dicationic thionine to bind heparin in biologically relevant
concentrations of salt, a second cheap commercially available dicationic indicator dye
was studied. Methyl green (MG) is a triphenylmethane-derivative, Scheme 2.1, and
presents a different charge profile to heparin than the smaller thionine molecule.
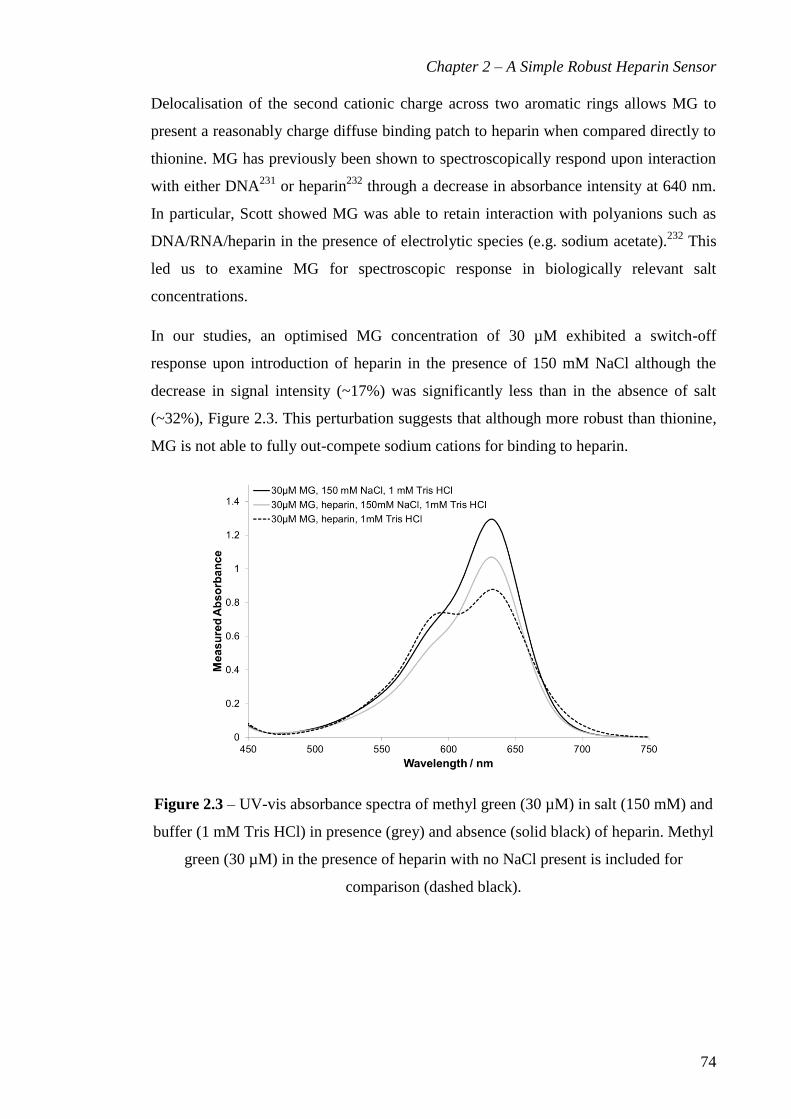
Chapter 2 – A Simple Robust Heparin Sensor
74
Delocalisation of the second cationic charge across two aromatic rings allows MG to
present a reasonably charge diffuse binding patch to heparin when compared directly to
thionine. MG has previously been shown to spectroscopically respond upon interaction
with either DNA231
or heparin232
through a decrease in absorbance intensity at 640 nm.
In particular, Scott showed MG was able to retain interaction with polyanions such as
DNA/RNA/heparin in the presence of electrolytic species (e.g. sodium acetate).232
This
led us to examine MG for spectroscopic response in biologically relevant salt
concentrations.
In our studies, an optimised MG concentration of 30 µM exhibited a switch-off
response upon introduction of heparin in the presence of 150 mM NaCl although the
decrease in signal intensity (~17%) was significantly less than in the absence of salt
(~32%), Figure 2.3. This perturbation suggests that although more robust than thionine,
MG is not able to fully out-compete sodium cations for binding to heparin.
Figure 2.3 – UV-vis absorbance spectra of methyl green (30 µM) in salt (150 mM) and
buffer (1 mM Tris HCl) in presence (grey) and absence (solid black) of heparin. Methyl
green (30 µM) in the presence of heparin with no NaCl present is included for
comparison (dashed black).

Chapter 2 – A Simple Robust Heparin Sensor
75
Scheme 2.1 – Molecular rearrangement of coloured methyl green to colourless carbinol.
A further detraction presented by MG is the practical limitation of bleaching. MG
bleaching occurs through incorporation of a hydroxyl group at the centre of the
molecule. Following molecular re-arrangement, the colourless species carbinol is
generated. This process has been well studied, for example, by the work of Nir,
Margulies and co-workers32
and Hahn30
who collectively demonstrated that dilution and
pH were important factors. In particular, Hahn suggested carbinol would be rapidly
generated at pH values above 5. Our work, which is buffered at pH 7 by 1 mM Tris
HCl, served to confirm this observation as the absorbance signal intensity at 640 nm fell
by ~25% in only 90 minutes upon standing. In line with Hahn’s observations, a control
solution buffered at pH 3 retained full colour intensity over a 7 day period.
With MG dimissed, Alcian blue (AB) was identified as a more highly charged
commercial heparin binding system. Alcian blue, Figure 2.4, is an aromatic copper
complex possessing 4 positive charges which has been widely studied as a histological
heparin stain.233
Despite prevalent histological use, influential biochemist J. E. Scott
suggested true understanding and investigation of AB was often controversially
hindered by “commercial secrecy and entrepreneurial dishonesty.”234
Whiteman has
previously shown AB to be capable of interacting with many glycosaminoglycans in
biological fluids such as urine, presumably due to guanidinium-like functionalities
which decorate its surface.235
The electrolyte tolerance of AB is also known to be high
with the aforementioned Scott and co-worker Willet reporting that AB is able to retain
interaction with heparin up to NaCl concentrations of 900 mM. More recently,
Bjornsson employed AB in spectrophotometric studies, where response was observed in
the presence of sulfated GAGs such as chondroitin-4-sulfate.236,237
In our studies, an optimised solution of 38 µM AB in 150 mM NaCl and 1 mM Tris
HCl exhibited an absorbance maximum at 618 nm, however upon addition of heparin,
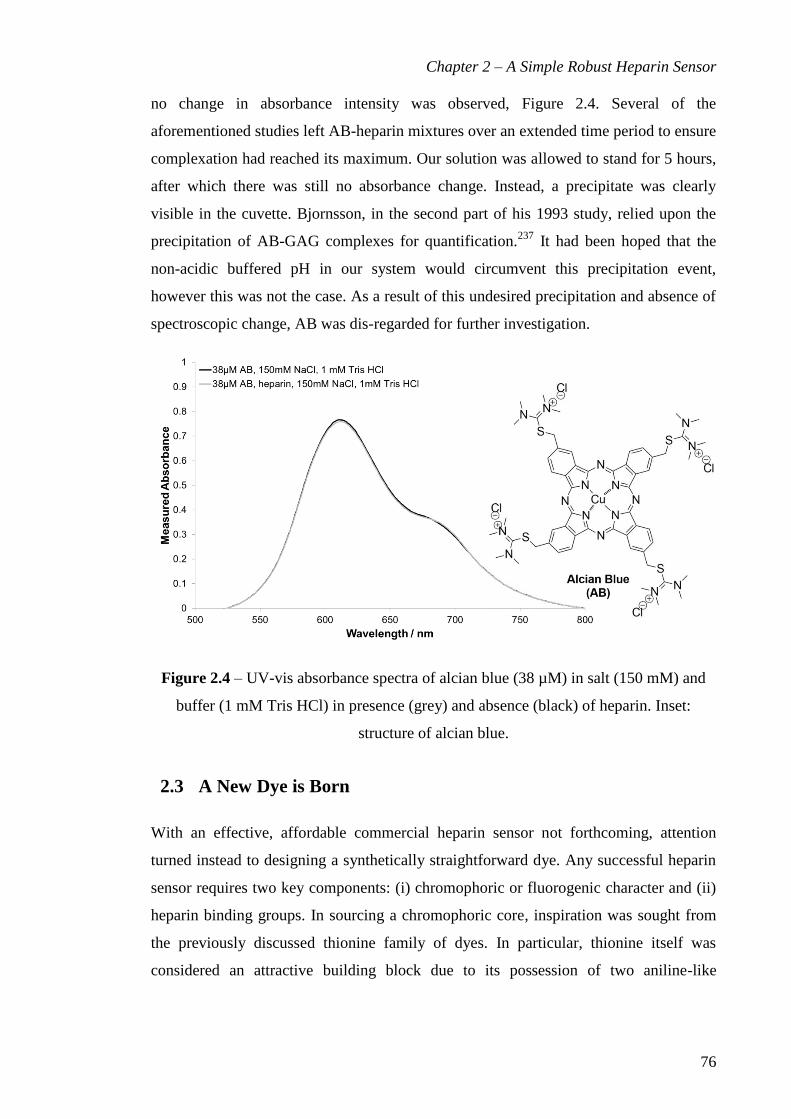
Chapter 2 – A Simple Robust Heparin Sensor
76
no change in absorbance intensity was observed, Figure 2.4. Several of the
aforementioned studies left AB-heparin mixtures over an extended time period to ensure
complexation had reached its maximum. Our solution was allowed to stand for 5 hours,
after which there was still no absorbance change. Instead, a precipitate was clearly
visible in the cuvette. Bjornsson, in the second part of his 1993 study, relied upon the
precipitation of AB-GAG complexes for quantification.237
It had been hoped that the
non-acidic buffered pH in our system would circumvent this precipitation event,
however this was not the case. As a result of this undesired precipitation and absence of
spectroscopic change, AB was dis-regarded for further investigation.
Figure 2.4 – UV-vis absorbance spectra of alcian blue (38 µM) in salt (150 mM) and
buffer (1 mM Tris HCl) in presence (grey) and absence (black) of heparin. Inset:
structure of alcian blue.
2.3 A New Dye is Born
With an effective, affordable commercial heparin sensor not forthcoming, attention
turned instead to designing a synthetically straightforward dye. Any successful heparin
sensor requires two key components: (i) chromophoric or fluorogenic character and (ii)
heparin binding groups. In sourcing a chromophoric core, inspiration was sought from
the previously discussed thionine family of dyes. In particular, thionine itself was
considered an attractive building block due to its possession of two aniline-like

Chapter 2 – A Simple Robust Heparin Sensor
77
nucleophilic functional handles, which had previously been functionalised by Barton
and co-workers.238
The search for a suitable heparin binding motif began by considering the way in which
proteins interact with heparin. Most prolifically, the amino acid arginine is used to
achieve high-affinity heparin binding, with the guanidinium group thought to play a key
role in establishing electrostatic interactions with the sulfate groups along the
polysaccharide chain.82,239
Arginine is the key heparin binding component of the
clinically used reversal agent protamine, with arginine making up around 70% of the
sequence.100,179
It was envisaged that a straightforward peptide coupling reaction
involving the nucleophilic amines on thionine and the carboxylic acid on arginine
should allow the chromogenic core to be functionalised with two arginine residues. It
was hoped that, if successful, this new member of the thionine family may have greatly
enhanced heparin binding ability, and may be robust enough to remain bound to heparin
in the presence of competitive electrolytes such as salt.
In order to maintain regioselectivity during synthesis and minimise the potential for
arginine polymerisation, the pendant primary α-amine and both amine components of
the guanidinium group required protection. It is relatively unusual to tri-protect
arginine; however with previous functionalization of thionine proceeding in relatively
low yields, it seemed prudent to increase the odds in our favour as much as possible.240
Tri-Boc-protected arginine, Arg(Boc)3, was identified as a suitable reagent because it is
commercially available and all of the amine groups are protected with the same acid-
labile tert-butoxycarbonyl (Boc) protecting group.
Although available commercially, Arg(Boc)3 can be readily prepared on a multi-gram
scale by heating arginine with an excess of di-tert-butyl dicarbonate in the presence of
sodium hydroxide. The relatively low yield of ca. 10% can be accounted for by the
well-known difficultly of installing the second protecting group on the guanidinium
moiety.241
As shown in Scheme 2.2, once in hand, two equivalents of Arg(Boc)3 were
readily appended onto thionine acetate in a TBTU-mediated peptide coupling reaction
to afford the fully protected dye molecule, after purification by silica flash column
chromatography. The yield of 30% is respectable as, although low, it is an improvement
on the 9% yield observed by Barton and co-workers for functionalization of a thionine

Chapter 2 – A Simple Robust Heparin Sensor
78
core.238
A final global Boc deprotection using HCl gas in methanol afforded the new
dye 2.2 in a near quantitative yield.
Scheme 2.2 – Synthesis of Mallard Blue 2.2. Although commercial, conditions for
preparation of Arg(Boc)3 also shown.
The preparation of this modified thionine derivative in two synthetically straightforward
steps from commercial starting materials is highly attractive, and appears reliable
enough to withstand scale-up.
2.4 Mallard Blue: Initial Studies
With new dye 2.2 in hand, it was examined by UV-visible spectroscopy. As shown in
Figure 2.5, dye 2.2 is blue in appearance and has a strong absorbance band at 615 nm.
The blue colour of the dye is remarkably similar in appearance to the livery of the
world-record-holding A4 steam locomotive Mallard 4468, which is housed at the
National Railway Museum in York. For that reason, the new dye 2.2 was christened
Mallard Blue (MalB).

Chapter 2 – A Simple Robust Heparin Sensor
79
Figure 2.5 – UV-vis absorbance spectrum of MalB (25 µM) in salt (150 mM) and Tris
HCl (1 mM) in the presence (grey) and absence (black) of heparin. Inset: Picture
showing colour similarilty of MalB and Mallard.
Mallard Blue was first tested in the manner previously applied to thionine, methyl green
and alcian blue. Pleasingly, upon introduction of heparin to a solution of MalB (25 µM)
in the presence of 150 mM NaCl, a strong spectroscopic response was observed, Figure
2.5. This response is significant when compared against the previously tested dyes. The
58% switch-off in signal intensity indicates that the introduction of the arginine groups
has dramatically increased the ability of our thionine derivative to out-compete sodium
cations at the heparin surface when compared directly to native thionine. Following this
qualitative promise, a titration experiment was set up in order to probe this response
more quantitatively.
An optimised MalB concentration of 25 µM was titrated with second portion of the
same dye solution which had additionally been endowed with heparin. The titration was
repeated in the absence and presence of 150 mM NaCl, and all solutions were buffered
at pH 7 using 1 mM Tris HCl. In order to provide a performance comparison against an
unmodified member of the thionine family, methylene blue (MB) was subjected to the
same heparin titration in the absence/presence of 150 mM NaCl. A MB concentration of
10 µM was chosen in line with previous studies by Smith and co-workers.211
The
resulting titration curves are shown in Figure 2.6.

Chapter 2 – A Simple Robust Heparin Sensor
80
Figure 2.6 – Binding curves resulting from titration of heparin into a solution of
methylene blue (10 µM, left) or Mallard blue (25 µM, right) in the absence (top) or
presence (bottom) of 150 mM NaCl.
Before discussing the binding curves, it is worth re-emphasising that the
‘concentrations’ of heparin plotted in Figure 2.6 do not refer to the global concentration
of heparin polysaccharide but rather to the concentration of the predominant
disaccharide repeat unit (Mr: 665.40 g mol-1
). For both dyes, binding to heparin results
in a decrease in spectroscopic signal intensity, however for visual appeal, the magnitude
of spectroscopic change at λmax is plotted in the binding curves.
In the absence of salt, the binding curve for MB indicates the dye is fully bound to
heparin at concentrations above ca. 22 µM, indicated by the plateau region. The
requirement for so much heparin may be a consequence of electrolytic competition from
the Tris HCl buffer for interaction with MB. This hypothesis may be supported by the
observation of no MB-heparin interaction at all in the presence of 150 mM NaCl.
In the absence of salt, 25 µM MalB appears to be fully bound to 13 µM heparin, while
in the presence of 150 mM NaCl, the value increases to ca. 27 µM. Without salt present,
the MalB-heparin binding curve does not plateau in a traditional manner. As further
heparin is added beyond 13 µM, the absorbance change value begins to decrease again

Chapter 2 – A Simple Robust Heparin Sensor
81
suggesting a reduction in the total amount of heparin-bound MalB. As more heparin is
added beyond the point of initial saturation, new interactions may form between this
‘new’ heparin and molecules of MalB which were already interacting with the heparin
present. This disruption may lead to the overall MalB-heparin interactions being
reduced as multiple heparin chains compete for binding to MalB, giving rise to the
apparent regression of saturation observed. When salt is present, however, the
disruptive effect of further heparin addition is not seen. This suggests that the sodium
cations are able to ‘screen’ newly-added heparin preventing it from disrupting already-
established MalB-heparin interactions. Consequently, in the presence of salt, the
binding curve exhibits a traditional plateau region.
Close inspection of the MalB-heparin binding curves reveals a slightly sigmoidal line
shape. This may be a consequence of the polydisperse nature of heparin, which is likely
to dictate a different binding mode for different regions of the heparin chain with
specific regions exhibiting preferential interactions. For MB, this sigmoidal character is
less evident. This is likely to be a consequence of MB interacting in a monovalent
manner with individual anionic charges on heparin rather than a larger region containing
several anionic charges, as is the case with MalB.
The significant binding of MalB to heparin in the presence of 150 mM NaCl and 1 mM
Tris HCl suggested that the MalB-heparin interaction is tolerant of electrolytic
competition. To that end, an experiment was set up to determine the effect of further
increasing concentrations of NaCl and Tris HCl buffer on the spectroscopic response of
MalB. An optimised solution of heparin-saturated MalB (25 µM MalB, 27 µM heparin)
was separately titrated with increasing amounts of NaCl or Tris HCl up to a final
electrolyte concentration of 1 M. The disruptive effect on the MalB-heparin interaction
is plotted in Figure 2.7, where disruption is normalised between the absorbance
intensity at 615 nm of a solution of MalB alone and when saturated with heparin.

Chapter 2 – A Simple Robust Heparin Sensor
82
Figure 2.7 – Extent to which increasing concentrations of Buffer/Electrolyte disrupt
MalB-heparin interaction.
The tolerance of the MalB-heparin interaction in the presence of increasing
concentrations of electrolyte is impressive. As electrolytic competition increases
though, so too does the disruption of the MalB-heparin interaction. Tris HCl causes
more perturbation than NaCl, although spectroscopic responses are still detectable up to
600 mM and 800 mM respectively. Perhaps most impressive is the minimal disruption
caused by the presence of 400 mM NaCl. In this particular scenario, sodium cations are
present in a 1600-fold excess to MalB itself, yet MalB is still able to bind to heparin
preferentially. The performance of MalB under these conditions is far superior to those
previously reported for unmodified thionine dyes, further emphasising the performance
enhancement resulting from functionalisation with arginine.143
With the MalB-heparin interaction appearing to be so robust, our collaborators led by
Professor Sabrina Pricl at University of Trieste, Italy studied the MalB-heparin
interaction using molecular dynamics (MD) modelling. Their experiments represented
heparin as a repeating sequence of the predominant disaccharide and allowed an
optimised binding trajectory to be visualised, Figure 2.8. The observed binding mode
suggests that two MalB molecules interact with a tetra-saccharide segment of the
heparin chain, in complete agreement with our observed binding stoichiometry.
Unsurprisingly, the interaction is dominated by electrostatics. In particular, the
guanidinium groups play a key anchoring role with the arginine α-amines

Chapter 2 – A Simple Robust Heparin Sensor
83
supplementing the interaction and the cationic charge on the phenzothiazine-like ring
angling towards the polysaccharide. It appears that the crescent shaped geometry of
MalB is particularly well-suited for interaction with heparin.242
Figure 2.8 – Equilibrated MD snapshot of MalB-heparin interactions. Heparin is
represented as purple (D-glucosamine) and green (L-iduronic acid) space-filling spheres,
while MalB is shown as pink stick model.
So far, Mallard Blue had demonstrated an impressive tolerance to electrolytic
competition and appeared to be well-suited for establishing robust non-covalent
interactions with heparin. The next stage was to challenge the heparin binding ability of
MalB in more biologically relevant situations.
2.5 Mallard Blue: Establishing Clinical Relevance
One of the biggest challenges facing any heparin sensor with clinical potential is
selectivity. As previously discussed, biological media is a complex mixture of
electrolytes and serum/albumin proteins.230
In addition to establishing interactions
within this electrolytically rich media, an effective heparin sensor must be able to bind
heparin selectively over structurally similar glycosaminoglycans (GAGs). In total, there
are six structurally related GAGs: heparin, heparan sulfate (HS), dermatan sulfate (DS),
chondroitin sulfate (CS), keratin sulfate (KS) and hyaluronic acid (HA).81
Influential
work from the group of Ansyln in 2005 demonstrated a heparin sensor with selectivity
over HA and CS, and so these were selected for benchmarking the performance of
MalB, Figure 2.9.145

Chapter 2 – A Simple Robust Heparin Sensor
84
Figure 2.9 – Three structurally related GAGs: heparin, hyaluronic acid (HA) and
chondroitin sulfate (CS).
In turn, each GAG was titrated into a solution of MalB (25 µM) endowed with NaCl
(150 mM) and buffered at pH 7 with Tris HCl (10 mM). The resulting absorbance
intensity at 615 nm was plotted against increasing GAG concentration, Figure 2.10. The
polydisperse nature of the GAGs along with the differing degrees of variability along
the polysaccharide chains make defining absolute concentration values difficult. For
that reason, in line with the earlier comments about heparin, the concentration values in
Figure 2.10 refer to the concentration of the most common disaccharide repeat unit
rather than the global concentration of polysaccharide.
It can be clearly seen that neither HA nor CS produce a large spectroscopic response
from MalB when compared to heparin. Of the two, MalB interacts more significantly
with CS. This is most likely due to the repeating disaccharide of CS possessing one
more sulfate group than HA and consequently presenting more anionic character to
MalB for binding. Whilst effective binding constants could be calculated from the data
in Figure 2.10, it was reasoned that any values would remain somewhat ambiguous due
to the variability in polydispersity and/or polysaccharide structures from batch to batch
of each GAG. The data show that MalB is able to match the selective heparin binding
performance of Anslyn’s benchmark work.

Chapter 2 – A Simple Robust Heparin Sensor
85
Figure 2.10 – Normalised response of MalB to glycosaminoglycans HA, CS and
heparin.
With heparin selectivity over other GAGs in the presence of biological concentrations
of NaCl demonstrated, the next challenge was for MalB to respond to heparin in a
clinically relevant sample. Human serum is a real biological fluid containing all of the
proteins (except those involved in blood clotting), antibodies, antigens, hormones and
other exogenous and endogenous species naturally present in blood. The combination of
these species with the electrolytes mentioned previously makes selective binding in
serum particularly challenging. Taking further inspiration from the work of Ansyln,145
an experiment was set up in which samples of 100% human serum were endowed with a
concentration of heparin. Aliquots (0.5 mL) of this solution were then introduced to a
cuvette containing MalB (1.5 mL, 25 µM) buffered at pH 7 with Tris HCl (20 mM). The
absorbance intensity at 615 nm could then be recorded and plotted in response to
different concentrations of heparin.
In the clinic, surgical teams dose heparin in terms of anticoagulant activity – measured
in international units per millilitre of blood (IU mL-1
) – rather than in terms of raw
amount. The clinically relevant range for cardiovascular surgery routinely lies within
the range 2 – 8 IU mL-1
.243,244
It was therefore decided to probe the ability of MalB to
detect heparin in the concentration range 0 – 10 IU mL-1
. The resulting heparin
detection curve is plotted in Figure 2.11.

Chapter 2 – A Simple Robust Heparin Sensor
86
Figure 2.11 – Mallard Blue response to heparin delivered in 100% human serum (solid
circles) or 100% horse serum (open triangles) within a clinically relevant range.
This experiment is an excellent mimic of the clinical setting, where a blood sample from
a patient could easily be filtered using a cellulose filter such as those present in the
blood electrolyte monitors carried by paramedics, thereby removing the blood cells and
affording a relatively colourless sample of heparin-containing human plasma.245
Titration of this sample into a pre-prepared Mallard Blue solution in the clinic would be
exactly analogous to the titration carried out here. Our choice of serum rather than
plasma was expected to have no material bearing on the experiment as serum is simply
plasma with some of the clotting factors (e.g. fibrinogen) removed.
Impressively, Mallard Blue showed a significant spectroscopic response upon addition
of heparin in 100% human serum. Heparin can be clearly detected down to
concentrations as low as 1 IU mL-1
. From these results, it can be envisaged that this
assay could readily be adapted to operate with different concentrations of heparin,
through increasing/decreasing amounts of MalB or by diluting the serum sample during
pre-treatment. A comparable detection range was additionally observed in horse serum,
further demonstrating the robustness of MalB for heparin detection.
In addition to matching the performance of Ansyln’s landmark work, MalB also offers
the advantage of greater synthetic accessibility. At this stage, the opportunity was taken
to re-examine the previously reported work of Klein and co-workers who detected
heparin across the same concentration range as us ‘in plasma’ using commercial

Chapter 2 – A Simple Robust Heparin Sensor
87
thionine derivative Azure A.141
For direct comparison against MalB, AA was examined
under the same conditions of our assay. Specifically, heparin-containing serum samples
were titrated into a solution of AA (25 µM) which was buffered at pH 7 with Tris HCl
(20 mM). As shown in Figure 2.12, under these conditions, AA was unable to respond
at all to the addition of heparin. Interestingly, and further in contrast to the observations
of Klein and co-workers,141
even when the buffering was removed, there was still no
observable spectroscopic change from AA upon heparin-in-serum titration, regardless of
the wavelength chosen for monitoring.
Figure 2.12 – Mallard Blue (solid circles) and Azure A (open squares) response to
heparin delivered in 100% human serum within a clinically relevant range.
The data in Figure 2.12 clearly indicate that heparin detection by MalB occurs within a
clinically relevant range and that the performance is significantly better than other
thionine dyes such as Azure A. The performance benefit of introducing arginine groups
into the thionine system is clear to see. This simple synthetic modification not only
makes Mallard Blue the best-in-class for this dye family but also makes the dye an
attractive proposition to non-synthetic chemists.246
2.6 Mallard Blue: Further Studies
In order for Mallard Blue to be used clinically, it would be desirable to incorporate it
into an ‘assay kit’ such as those routinely used in biological protein binding studies, for

Chapter 2 – A Simple Robust Heparin Sensor
88
example. Such kits are routinely prepared some time (e.g. weeks) in advance of their
use to allow for shipping, storage etc. so it was decided to scope out the potential of
MalB. A crucial property which MalB must exhibit therefore is stability. Two options
were considered for how such an assay kit may operate: (i) the MalB solution would be
provided pre-dissolved in buffer at the correct concentration, or (ii) the MalB would be
supplied as solid to be dissolved in appropriate amounts of buffered solution (which
would be supplied separately).
In order to probe the stability of MalB in solution – to simulate delivery option (i) – a
solution of MalB (25 µM) was made up in the related conditions of 150 mM NaCl and
10 mM Tris HCl and left to stand in either light or dark and under either an air or
nitrogen atmosphere. Stability was probed by monitoring the absorbance intensity at
615 nm every 24 hours, and is plotted in Figure 2.13.
Figure 2.13 – Stability traces of MalB in the presence of light or dark under either air or
nitrogen.
When exposed to light, MalB de-colours rather quickly with a half-life of approximately
30 hours regardless of the atmosphere of storage. Thionine dyes are known to be
susceptible to photo-bleaching, and the phenomenon has been studied previously.247,248
The tri-cyclic ring of methylene blue, for example, can be reduced through introduction
of a proton to generate the colourless leuco species, although oxidative bleaching of
thionines is also known.249-251
For MalB, it seems likely that in the presence of light, a
proton could transfer from either of the arginine amine or guanidinium groups onto the
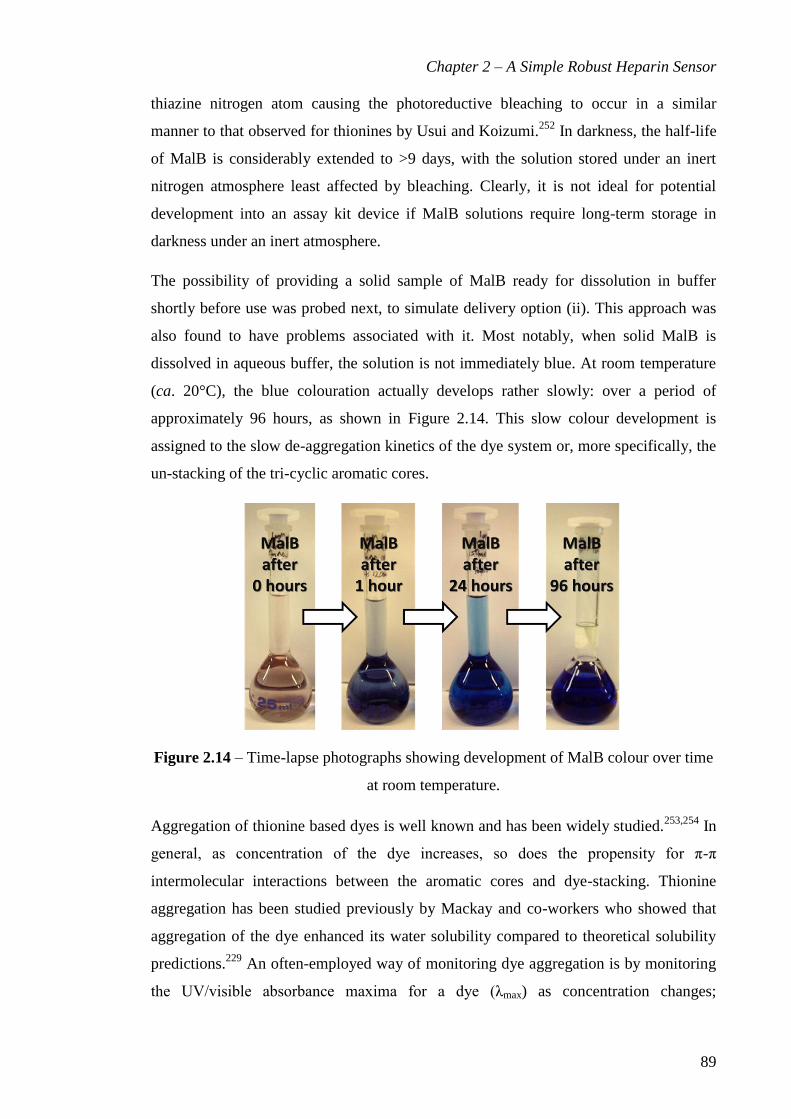
Chapter 2 – A Simple Robust Heparin Sensor
89
thiazine nitrogen atom causing the photoreductive bleaching to occur in a similar
manner to that observed for thionines by Usui and Koizumi.252
In darkness, the half-life
of MalB is considerably extended to >9 days, with the solution stored under an inert
nitrogen atmosphere least affected by bleaching. Clearly, it is not ideal for potential
development into an assay kit device if MalB solutions require long-term storage in
darkness under an inert atmosphere.
The possibility of providing a solid sample of MalB ready for dissolution in buffer
shortly before use was probed next, to simulate delivery option (ii). This approach was
also found to have problems associated with it. Most notably, when solid MalB is
dissolved in aqueous buffer, the solution is not immediately blue. At room temperature
(ca. 20°C), the blue colouration actually develops rather slowly: over a period of
approximately 96 hours, as shown in Figure 2.14. This slow colour development is
assigned to the slow de-aggregation kinetics of the dye system or, more specifically, the
un-stacking of the tri-cyclic aromatic cores.
Figure 2.14 – Time-lapse photographs showing development of MalB colour over time
at room temperature.
Aggregation of thionine based dyes is well known and has been widely studied.253,254
In
general, as concentration of the dye increases, so does the propensity for π-π
intermolecular interactions between the aromatic cores and dye-stacking. Thionine
aggregation has been studied previously by Mackay and co-workers who showed that
aggregation of the dye enhanced its water solubility compared to theoretical solubility
predictions.229
An often-employed way of monitoring dye aggregation is by monitoring
the UV/visible absorbance maxima for a dye (λmax) as concentration changes;

Chapter 2 – A Simple Robust Heparin Sensor
90
aggregation causes λmax to be shifted. For our system, titrating increasing amounts of de-
aggregated MalB into a cuvette of water, up to a final concentration of 500 µM, resulted
in the absorbance spectra shown in Figure 2.15. A linear increase in absorbance
intensity was observed as concentration increased but, importantly, there was no change
in λmax. This suggests that MalB aggregation is not playing a role at the concentrations
used in any of the heparin detection assays carried out in our studies. The critical
aggregation concentration of MalB was not determined as the CAC of native thionine is
known to be in the millimolar concentration range and so such experiments would be
compound expensive.229
Figure 2.15 – UV-visible absorbance spectra for MalB in water as concentration
increases. Inset: Plot of absorbance at λmax between 0 – 500 µM.
The MalB de-aggregation event upon dissolution can be accelerated by incubating the
MalB solution for ca. 24 hours at 50°C. Although effective, the requirement of such
preparation is not appealing from the perspective of designing an ‘assay kit.’
Nonetheless, the stability, preparation and storage studies have all served to inform the
current use of MalB, where all solutions are incubated for 24 hours at 50°C before use,
and stored in the dark.
2.7 Conclusions & Future Work
A selection of commercial cationic indicator dyes were examined and shown to be
unable to reliably respond to heparin in the presence of competitive electrolytes such as

Chapter 2 – A Simple Robust Heparin Sensor
91
150 mM NaCl. Taking inspiration from the commercial thionine family of dyes, a novel
heparin sensor was synthesised in two straightforward steps through coupling of two
arginine residues onto a thionine core. The new dye, named Mallard Blue, was not only
shown capable of responding to heparin in the presence of 150 mM NaCl – something
none of the commercial thionines can do – but also of doing so selectively over
structurally related glycosaminoglycans such as chondroitin sulfate and hyaluronic acid.
Mallard Blue was shown to be capable of responding to heparin delivered in 100%
human serum. This impressive performance matches landmark work in the heparin
sensing field and shows real clinical promise as the assay was carried out in a manner
which directly simulated the clinical setting. Crucially, heparin detection occurred
within a clinically relevant heparin concentration range. Through direct comparison
against Azure A, MalB was also shown to be the new best-in-class for the thionine
family of dyes.
The incorporation of MalB into a chemically applicable heparin-sensing assay kit was
considered. The MalB de-aggregation event upon dissolution was identified as a
limiting factor and shown to take around 96 hours at room temperature or 24 hours at
50°C. Concentration dependant aggregation of MalB in aqueous solution was shown
spectrophotometrically not to occur below 500 µM.
A time-resolved stability study of MalB revealed a gradual bleaching event which
occurred in the presence of light and was assigned to a slow photo-reduction of the
phenothiazine-like ring structure. This photo-degradation was significantly retarded
upon storing MalB in darkness.
Future work in this area could focus on increasing the commercial viability and appeal
of the sample preparation post-synthesis. This may include enhancing the photo-
stability of the dye solution or re-designing the system to reduce sample preparation
time (eg. by removing the necessity for incubation). These improvements are likely to
involve modification of the chromophoric dye core. A sensible, and convenient, starting
point may be the use of a close structural analogue of thionine such as proflavine.
Proflavine offers a slightly different heteroaromatic dye core which may have different
susceptibility to the reductive processes identified as the cause of MalB bleaching.
Much like thionine, proflavine also offers two aniline-like functional handles although it
is noteworthy that previous work from Smith and co-workers focussed on non-covalent

Chapter 2 – A Simple Robust Heparin Sensor
92
interactions between these groups and carboxylic acids, rather than direct reaction
between them.255,256
This may suggest that the different dye core affects the reactivity of
the pendant amines. Other functionalisable chromogenic or fluorescent dye cores such
as, for example, fluorescein could also be considered.

Chapter 3 – Insights into Heparin Binding
93
3 Insights into Heparin Binding
3.1 Introduction
Given the well-documented toxicity problems associated with the clinical use of
protamine for heparin neutralization, there is a growing interest in the development of
novel chemical agents which are able to provide the same neutralization role in the
absence of the associated side-effects.212
During the development of such systems, there
is a key requirement to probe the performance ability of the candidate molecules. Often,
researchers choose to move quickly to clinically relevant heparin neutralization assays
to assess potential efficacy. Techniques such as the anti-factor Xa assay, which directly
measures the inhibition of clotting Factor-Xa in the presence of heparin, or other direct
‘clotting-time’ measurements such as the activated partial thromboplastin time (aPTT
assay) or prothrombin time (PT assay) are often employed for this purpose. Indeed, as
examples, early developmental studies of foldamer systems in the work of DeGrado and
co-workers202
focused on anti-factor Xa results for compound comparisons, while ex
vivo clotting studies were heavily relied upon alongside animal testing work during the
development of delparantag.197
Although such clotting based assays are well accepted for providing measures of
anticoagulancy, and therefore provide some measure of the potential clinical
effectiveness of the candidate being tested, the results can mask more fundamental
performance information.118,257
Such clotting-based techniques typically operate in
genuine biological media such as human plasma, which is a highly competitive mixture
of serum and albumin proteins, electrolytes, antibodies, antigens and hormones, along
with other exogenous and endogenous species naturally present in blood. Successful
heparin neutralization in this medium therefore indicates the ability of a binder molecule
to selectivity form interactions with heparin in preference to the many other
aforementioned components. Conversely, in the event of a candidate molecule failing to
neutralise anticoagulation, it can be difficult to de-convolute the reason for failure in to
terms of, for example, an inability to bind heparin, or a preferential ability to bind some
other biological species in plasma (i.e. off-target binding). Consequently, most studies
additionally employ a complementary assay technique to interrogate heparin binding
ability.
Chapter 3 – Insights into Heparin Binding
94
An early report on the development of calix[8]arenes for heparin neutralisation from the
group of Cunsolo200
provides a typical example of the use of a variety of heparin
binding assays. Initially, Cunsolo and co-workers probed heparin binding performance
using a fluorescence-based indicator displacement assay in the presence of low
concentrations of buffer. Subsequently, NMR titration experiments were carried out to
validate the indicator displacement results and further interrogate the binding under
more competitive conditions containing 150 mM NaCl. Comparison of the data from
these studies gave insight to heparin binding performance.200
Interestingly, further
developments in the aforementioned work of DeGrado and co-workers developing
foldamer systems employed isothermal titration calorimetry (ITC) to probe heparin
binding in 150 mM NaCl as a complementary technique to the anti-Xa data reported
previously.204
Indeed, these two examples appear representative of researchers’ desires
to probe heparin binding in electrolytically competitive conditions alongside the more
clinically-relevant plasma clotting assays.
Although NMR titration experiments and ITC investigations are well-suited to studying
heparin binding, it can be argued that they are not ideal for initial screening of novel
heparin binding systems at the early stages of development. Each technique is relatively
compound intensive and may present unattractively high associated costs. It is perhaps
not surprising therefore that a variety of other techniques such as affinity co-
electrophoresis258
and competitive inhibition assays259
have emerged as alternative
approaches. A particularly eye-catching recent approach involved the employment of
turbidimetric screening by Koide and co-workers, where the ability of heparin to inhibit
the spontaneous formation of insoluble fibrils by collagen was the key tool in probing a
candidate’s heparin binding ability.260
Upon introduction of an effective heparin binder,
collagen fibril formation was no longer inhibited and the associated turbidity increase
could be used to quantify the relative heparin binding ability of the candidate
compound. This approach was also shown to be well suited to high-throughput
screening methods.260
Building on our interest in heparin sensing systems, we became interested in simple
spectroscopic screening methods able to quickly determine the relative heparin binding
ability of a range of candidate systems under electrolytically competitive, or even
biologically relevant, conditions. Indicator displacement assays (IDA) were identified as
well-suited for this type of monitoring owing to their requirement of a relatively small

Chapter 3 – Insights into Heparin Binding
95
amount of compound and straightforward titration-based methodology.261,262
Indeed, the
development of chemical bioprobes is an ever-expanding field, and is readily applicable
to this type of heparin binder screening.263
For a successful heparin binding IDA, a
spectroscopically active dye must exhibit a characteristic signal change when displaced
into free solution by the formation of preferable binder-heparin complexes. The IDA
concept is shown in cartoon form in Figure 3.1.
Figure 3.1 – Cartoon concept of an indicator displacement assay (IDA).
Of the many heparin sensors presented in the previous Chapter, several have explicitly
been shown to be suitable for application in an IDA regime. The commercial thionine
dyes azure A143
and methylene blue142
are both operable within such systems, although
their monocationic nature has limited their widespread use due to their intolerance of
high levels of competitive electrolytes.143,211
The landmark tris-boronic acid scaffold
from Ansyln and co-workers was amongst the first synthetic systems to be developed
into an IDA system although the sensor initially required the presence of pyrocatechol
violet as the indicator dye.144
The system was then elegantly modified to embed the
fluorophore into the host structure. Addition of protamine to a complex of this modified
sensor and heparin was shown to ‘strip’ heparin out of the scaffold binding site, leading
to the re-establishment of the initial fluorescent signal, Figure 3.2.145
Other works, for
example from the groups of Nitz157
and Chang,160
also demonstrated the reversibility of
sensor-heparin interactions by introduction of protamine and displacement of the sensor
dye, although neither group appeared to capitalise on the potential insight which could
be gained from displacement assays utilizing their robust fluorescent sensors.

Chapter 3 – Insights into Heparin Binding
96
Figure 3.2 – Ansyln’s heparin sensing systems: (a) tri-boronic acid receptor and
pyrocatechol violet indicator;144
(b) modified fluorophore-containing receptor.145
These
structures are also shown in Figure 1.19.
Arguably the most impressive heparin sensing systems published recently are the
benzimidazolium derivatives ‘heparin blue’ and ‘heparin orange’ from the work of
Chang and co-workers.160
Having exhibited fully reversible binding to both
unfractionated and low-molecular-weight heparins, these molecules ostensibly appear
ideal candidates for further development. A major drawback associated with
investigation of these compounds, however, is their multi-step syntheses. Ease-of-
preparation is a key consideration in the development of systems with the potential for
widespread applicability. In order to maximize the potential uptake of any new assay, it
was therefore reasoned to be important that the assay be composed of easily accessible
or, at the very least, synthetically tractable components. The investigation for this
purpose of an indicator dye requiring a multi-step synthesis was considered a futile
exercise and so our attention turned away from these benzimidazolium-based sensors.
As shown in the previous Chapter, we recently developed a new heparin sensor, Mallard
Blue (MalB), which demonstrated comparable heparin sensing abilities to the systems
of Chang.242
A key feature of MalB was that it could be synthesised in two
straightforward synthetic steps from commercially available starting materials, and as
such presents a much more attractive, less daunting synthetic challenge for researchers
without specialisms in synthetic chemistry. It was therefore decided to investigate our
newly developed dye, Mallard Blue, within an indicator displacement assay regime.

Chapter 3 – Insights into Heparin Binding
97
3.2 Mallard Blue Heparin Binding Competition Assay
3.2.1 Electrolytically Competitive Conditions
Although the heparin binding ability of MalB had been studied and rationalised using
molecular dynamics modelling studies, up to this point, utilizing the reversibility of
MalB-heparin interaction had not been considered. The earlier work had demonstrated
that the MalB-heparin complex could be perturbed by the titration of increasing
amounts of electrolytes – namely Tris HCl and and NaCl – and so it was reasoned that
introduction of protamine to a sample of heparin-containing MalB should result in
formation of a heparin-protamine complex and release of MalB into solution. Based on
the data from the previous Chapter, it was decided to introduce protamine into a sample
containing 25 µM MalB, 27 µM heparin, 150 mM NaCl and 10 Tris HCl. Pleasingly, as
shown in Figure 3.3, this resulted in an increase in absorbance intensity at 615 nm.
Figure 3.3 – UV-visible absorbance spectra for MalB (25 µM) in the absence and
presence of heparin (27 µM), and following the subsequent addition protamine in the
presence of NaCl (150 mM) and Tris HCl (10 mM).
Following this qualitative observation, it was decided to quantitatively titrate protamine
into a sample of MalB and heparin as this would permit the calculation of binding
parameters and thereby enable the performance of different molecular species to be
compared. Specifically, three appropriate parameters were identified: (i) CE50 – charge

Chapter 3 – Insights into Heparin Binding
98
excess, that is the number of cationic binder charges required per heparin anionic charge
at 50% dye displacement. Rationalising binding ability in terms of charge excess
enables the efficiency of each individual charge to be calculated, allowing the
performances of binders possessing different numbers of charges to be meaningfully
compared. (ii) EC50 – the effective concentration of binder at the same point. This
provides a measure of the molarity of binder present at 50% dye displacement. (iii)
Effective dose – the raw amount (mass) of binder required to displace 50% of the dye
from 100IU of heparin. This is a clinically relevant parameter. The binding curve
resulting from titration of protamine into MalB-heparin is shown in Figure 3.4 along
with the numerical data in Table 3.1.
Table 3.1 – Heparin binding data for protamine, calculated from MalB assay.
Assay Conditions EC50 / μM CE50 Dose /
mg per 100IU
25 µM MalB, 27 µM heparin, 150 mM NaCl, 10 mM Tris HCl
(2.34 ± 0.23) (0.52 ± 0.05) (0.32 ± 0.03)
Figure 3.4 – Heparin binding curve for protamine, with the point of 50% dye
displacement indicated.
The data shows that under this regime only 0.52 (± 0.05) protamine cationic charges are
required to bind to each negative charge along the heparin polysaccharide, equating to a
concentration of 2.34 (± 0.23) µM at 50% MalB displacement. Under these conditions,

Chapter 3 – Insights into Heparin Binding
99
the data suggests that 0.32 (± 0.03) mg of protamine would be able to bind to 100 IU of
heparin. It should be stressed that these values should not be taken as ‘absolute’ bona
fide binding parameters as the binding assay operates under competition and all binding
of protamine to heparin is being measured relative to the binding ability of MalB.
Calculation of values for other compounds under the same assay conditions would
however allow for valid performance comparisons between different molecular species.
3.2.2 Clinically Relevant Conditions
Having established that the MalB IDA was able to operate in the presence of 150 mM
NaCl, it was decided to investigate the robustness of the same system in the presence of
more challenging, and biologically relevant, media. Following the MalB sensing studies
in the previous Chapter, human serum was identified as a suitable biological medium. It
was also reasoned that a heparin binding assay able to operate in the presence of human
serum may provide a useful tool for assessing the clinical potential of candidate
systems, and for beginning to understand the effects of different serum components.
Practically, the IDA protocol from the MalB assay in buffer and salt was modified by
employing a multiple-cuvette approach. Rather than gradually titrating binder into a
single cuvette, several individual cuvettes were prepared with each containing a
different amount of binder, so as to correspond with different points on the overall
‘titration’ curve. Once prepared, an overly-concentrated solution of heparin in serum
was delivered into each cuvette such that the MalB-heparin conditions were 25 µM
MalB and 27 µM heparin in all samples to replicate the original assay. In this way, the
serum percentage present in the assay could be controlled through modifying the
heparin-containing solution (e.g. by dilution with buffer). In order to probe the effects
of serum on the assay, the modified protocol was applied to protamine with heparin
delivered in either 10% or 100% human serum. The results are shown in Figure 3.5 and
Table 3.2.

Chapter 3 – Insights into Heparin Binding
100
Table 3.2 – Heparin binding data for protamine from MalB assay with heparin
delivered in 10 and 100% human serum.
Assay Conditions
Protamine
EC50 / μM CE50 Dose /
mg per 100IU
Salt and Buffer (2.34 ± 0.23) (0.52 ± 0.05) (0.32 ± 0.03)
Heparin in 10% Human Serum (2.80 ± 0.26) (0.63 ± 0.06) (0.39 ± 0.04)
Heparin in 100% Human Serum (3.51 ± 0.12) (0.79 ± 0.03) (0.49 ± 0.02)
Figure 3.5 – Heparin binding curves for protamine obtained from MalB assay with
heparin delivered in 10% and 100% human serum.
The data show that the presence of human serum leads to an increase in the charge
excess and effective concentrations of protamine required to displace 50% of MalB
from heparin. This effect can be rationalised through off-target interactions between
protamine and any of the electrolytes or charged patches on serum proteins present
within the media. The progressive deterioration in protamine binding efficiency as the
percentage of serum present increases supports this. In the presence of serum,
normalized absorbance values continue above the theoretical maximum of 1 even
though the presence of serum was taken into account by its inclusion in the baseline
reading. Despite this, some signal drift away from the baseline was observed during the
experiment. This enhanced absorbance is thought to be caused by the increased turbidity
associated with the formation of heparin-protamine complexes within this medium.264

Chapter 3 – Insights into Heparin Binding
101
Indeed it is known from the work of Mäntele and co-workers that the turbidity
associated with heparin-protamine aggregates has greater influence on direct absorbance
measurements in serum than in plain salt water due to the presence, and involvement, of
plasma proteins.265
3.3 Studying Generational Effects in PAMAM Dendrimers
Having established protocols for incorporation of Mallard Blue into an indicator
displacement assay (IDA), and demonstrated that insights to heparin binding could
potentially be gained, it was decided to attempt to validate the assay by examining a
selection of known heparin binding systems for their relative binding abilities.
3.3.1 PAMAM Dendrimers
PAMAM (poly(amidoamine)) dendrimers were identified as suitable molecules with
which to validate our novel assay as they are well-known commercially available
materials and so could be easily sourced for testing. PAMAM dendrimers were first
reported by Tomalia and co-workers in 1985 and result from the tetra-functionalisation
of an ethylene diamine central core through exhaustive Michael addition with methyl
acrylate, followed by amidation of the resulting esters with further ethylene diamine,
Figure 3.6.266,267
Figure 3.6 – Structure of G2-PAMAM with the generation levels G0 – G2 shown. The
higher generations result from larger iterations of the dendritic structure.

Chapter 3 – Insights into Heparin Binding
102
In general, dendritic systems are well known to be able to mimic many aspects of
protein behaviour in both structural and functional aspects.268,269
Indeed PAMAMs have
been widely applied in biological and biomimetic applications,270-272
for example as
drug delivery vehicles able to encapsulate hydrophobic drugs within their core
branching structure273
or as macromolecular MRI contrast agents through chelation with
Gd(III) species.274
Most relevant to our current study, several previous groups have
demonstrated PAMAM dendrimers to have heparin binding ability.192,193,275
As large
cationic structures, however, it is perhaps not surprising that PAMAMs are known to
possess inappropriate toxicity profiles for clinical deployment as heparin rescue agents,
and so have not been applied for this use in a clinical setting.276,277
Here, with the focus
on validating our new assay and gaining insights into generational effects upon heparin
binding, PAMAMs offered an ideal molecular family to examine.
3.3.2 Heparin Binding in Competitive Conditions
3.3.2.1 Experimental Study
Six generations of PAMAM dendrimers (G0 – G4, and G6) were each tested for heparin
binding ability in the Mallard Blue heparin binding assay. The assay was carried out
under the previously optimised conditions of 25 µM MalB, 27 µM heparin, 150 mM
NaCl and 10 mM Tris HCl. Each titration was carried out in triplicate and the results, as
calculated from the point of 50% MalB displacement, are presented in Table 3.3.

Chapter 3 – Insights into Heparin Binding
103
Table 3.3 – Heparin binding data for PAMAM dendrimers tested in MalB assay in
buffer and salt. Protamine data included for comparison.
Compound
Heparin Binding
Charge (+) EC50 / μM CE50
Dose / mg per 100IU
Protamine 24 (2.34 ± 0.23) (0.52 ± 0.05) (0.32 ± 0.03)
G0-PAMAM 4 Not achieved - binding too weak
G1-PAMAM 8 (10.10 ± 0.32) (0.75 ± 0.02) (0.44 ± 0.01)
G2-PAMAM 16 (2.55 ± 0.32) (0.38 ± 0.04) (0.25 ± 0.03)
G3-PAMAM 32 (1.53 ± 0.21) (0.45 ± 0.06) (0.32 ± 0.04)
G4-PAMAM 64 (0.64 ± 0.04) (0.38 ± 0.02) (0.27 ± 0.02)
G6-PAMAM 256 (0.22 ± 0.04) (0.53 ± 0.09) (0.39 ± 0.06)
The first parameter of interest is the EC50, or effective concentration, for each of the
dendrimers. As generation number, and molecular size increases, the concentration
required to effectively displace 50% MalB into free solution decreases. This is a
straightforward consequence of each subsequent dendritic generation possessing
exponentially more cationic charge than the preceding one and accounts for the EC50
decrease from 10.10 (± 0.32) µM at G1 to 0.22 (± 0.04) µM at G6. Given the effects of
molecular size upon effective concentration, a more informative measure of the relative
binding performances is that of CE50, the charge excess or charge efficiency.
In order to calculate the CE50 values, the number of protonated sites per PAMAM
generation needed to be carefully considered. The 10 mM Tris HCl component of the
solutions buffers the assay at pH 7.0; a regime under which only the peripheral primary
amines of PAMAMs are protonated.278,279
This leads to the molecular charges listed in
Table 3.3.
The first striking observation is that the smallest dendrimer, G0-PAMAM, is unable to
displace 50% MalB from heparin, even when present in a concentration excess towards
the end of the titration. Ostensibly, G0-PAMAM (517 Da, 4+) and MalB (542 Da, 5+)
have comparable molecular properties, and so their markedly different heparin binding
abilities further supports the structurally optimised nature of the crescent-shaped MalB
compared to the more spherical PAMAM. In turn, this performance difference also
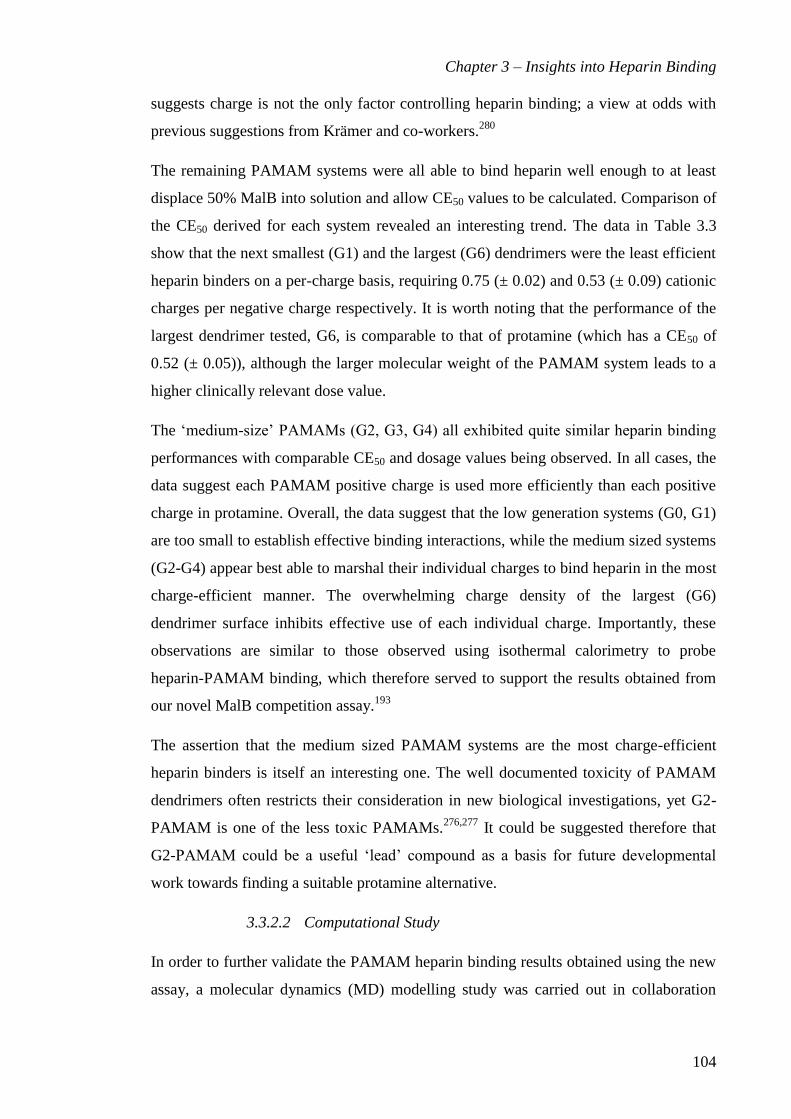
Chapter 3 – Insights into Heparin Binding
104
suggests charge is not the only factor controlling heparin binding; a view at odds with
previous suggestions from Krämer and co-workers.280
The remaining PAMAM systems were all able to bind heparin well enough to at least
displace 50% MalB into solution and allow CE50 values to be calculated. Comparison of
the CE50 derived for each system revealed an interesting trend. The data in Table 3.3
show that the next smallest (G1) and the largest (G6) dendrimers were the least efficient
heparin binders on a per-charge basis, requiring 0.75 (± 0.02) and 0.53 (± 0.09) cationic
charges per negative charge respectively. It is worth noting that the performance of the
largest dendrimer tested, G6, is comparable to that of protamine (which has a CE50 of
0.52 (± 0.05)), although the larger molecular weight of the PAMAM system leads to a
higher clinically relevant dose value.
The ‘medium-size’ PAMAMs (G2, G3, G4) all exhibited quite similar heparin binding
performances with comparable CE50 and dosage values being observed. In all cases, the
data suggest each PAMAM positive charge is used more efficiently than each positive
charge in protamine. Overall, the data suggest that the low generation systems (G0, G1)
are too small to establish effective binding interactions, while the medium sized systems
(G2-G4) appear best able to marshal their individual charges to bind heparin in the most
charge-efficient manner. The overwhelming charge density of the largest (G6)
dendrimer surface inhibits effective use of each individual charge. Importantly, these
observations are similar to those observed using isothermal calorimetry to probe
heparin-PAMAM binding, which therefore served to support the results obtained from
our novel MalB competition assay.193
The assertion that the medium sized PAMAM systems are the most charge-efficient
heparin binders is itself an interesting one. The well documented toxicity of PAMAM
dendrimers often restricts their consideration in new biological investigations, yet G2-
PAMAM is one of the less toxic PAMAMs.276,277
It could be suggested therefore that
G2-PAMAM could be a useful ‘lead’ compound as a basis for future developmental
work towards finding a suitable protamine alternative.
3.3.2.2 Computational Study
In order to further validate the PAMAM heparin binding results obtained using the new
assay, a molecular dynamics (MD) modelling study was carried out in collaboration

Chapter 3 – Insights into Heparin Binding
105
with Professor Sabrina Pricl and her team at University of Trieste, Italy. The
computational study simulated the binding interactions between different generation
PAMAM systems and a representative heparin polysaccharide, enabling the energetics
of binding to be calculated. In particular, the simulations were able to identify how
many of the available surface charges interacted directly with heparin, Qeff, as well as
determining the effective free energy of binding, 𝛥𝐺𝑏𝑖𝑛𝑑𝑒𝑓𝑓
, for each system. The
contribution of each interacting surface charge to this energy could then be deduced to
give the effective-charge-normalised free energy of binding, 𝛥𝐺𝑏𝑖𝑛𝑑𝑒𝑓𝑓
/Qeff. This
parameter is analogous to the charge excess values derived from the experimental study
and so it was hoped that comparison of these two independently obtained datasets
would reveal similar trends. The data calculated from the MD study is shown in Table
3.4.
Table 3.4 – MD simulation data for PAMAM dendrimers interacting with heparin.
Protamine data included for comparison. Qtot: number of binder charges; Qeff: number of
interacting charges; 𝛥𝐺𝑏𝑖𝑛𝑑𝑒𝑓𝑓
: effective free energy of binding; 𝛥𝐺𝑏𝑖𝑛𝑑𝑒𝑓𝑓
/Qeff: effective-
charge-normalised free energy of binding.
Compound Qtot / (+)
Qeff / (+)
𝜟𝑮𝒃𝒊𝒏𝒅𝒆𝒇𝒇
/ kcal mol-1
𝜟𝑮𝒃𝒊𝒏𝒅𝒆𝒇𝒇
/Qeff
/ kcal mol-1
Protamine 24 12 ± 1 -3.96 ± 0.41 -0.33 ± 0.04
G1-PAMAM 8 6 ± 1 -1.14 ± 0.22 -0.19 ± 0.05
G2-PAMAM 16 13 ± 1 -16.9 ± 0.5 -1.30 ± 0.11
G3-PAMAM 32 15 ± 1 -15.9 ± 0.3 -1.06 ± 0.07
G4-PAMAM 64 16 ± 3 -14.6 ± 0.8 -0.91 ± 0.18
G6-PAMAM 256 45 ± 5 -18.0 ± 1.3 -0.40 ± 0.05
In general, the computational data are in agreement with the experimental data. The Qeff
values are representative of the number of cationic charges per dendrimer which directly
interact with a single heparin polysaccharide. Comparison of these values against the
molecular charge, Qtot, gives an insight into how well each PAMAM generation is able
to marshal its charges. For example, ca. six of the eight cationic charges (75%) in G1-
PAMAM make direct contact with heparin, although the overall effective free energy of
binding 𝛥𝐺𝑏𝑖𝑛𝑑𝑒𝑓𝑓
is very low at –1.14 (± 0.22) kcal mol-1
. This leads to each binding
charge contributing only –0.19 (± 0.05) kcal mol-1
to the binding interaction. At the

Chapter 3 – Insights into Heparin Binding
106
other extreme, only 45 (± 5) of the available 256 cationic charges (18%) on G6-
PAMAM directly interact with a heparin polysaccharide. In reality, of course, it is likely
that G6-PAMAM may interact simultaneously with more than one polysaccharide chain
but owing to the computer-time-intensive nature of such simulations, this was not
modelled. The resulting 𝛥𝐺𝑏𝑖𝑛𝑑𝑒𝑓𝑓
/Qeff for G6-PAMAM, despite being double that
calculated for G1-PAMAM, was still relatively small at –0.40 (± 0.05).
Of the medium sized dendrimers (G2-G4), it was G2-PAMAM which utilised the
highest percentage of the available charges for direct interactions with heparin, with 13
(± 1) of the 16 surface amines (82%) interacting directly with the polysaccharide.
Distribution of the calculated free energy of binding, 𝛥𝐺𝑏𝑖𝑛𝑑𝑒𝑓𝑓
, between these 13 (± 1)
resulted in the most energetic individual interactions observed for any of the systems
tested with an 𝛥𝐺𝑏𝑖𝑛𝑑𝑒𝑓𝑓
/Qeff of –1.30 (± 0.11) kcal mol-1
. These data compare favourably
with the experimentally observed CE50 value, for which G2-PAMAM had the joint
lowest (i.e. most efficient) value, and confirms our initial suggestions that heparin
binding using PAMAMs is not a straightforward ‘higher generation is better’ situation.
Indeed, the concept of ‘less is more’ in multivalent binding has previously been
examined in similar studies using MD modelling to interrogate dendritic systems
interacting with DNA.281
The computational study also allowed for further comparison against the performance
of protamine, the modelling structure of which was built and refined from a consensus
protein sequence. It is interesting to note that despite being regarded as the benchmark
heparin binder, owing to its clinical application, protamine is only able to establish
interactions directly with 12 (± 1) of the 24 cationic charges (50%) within its structure.
Overall it does not interact particularly strongly either, with a 𝛥𝐺𝑏𝑖𝑛𝑑𝑒𝑓𝑓
of –3.96 (± 0.41)
kcal mol-1
leading to a per-binding-charge free energy 𝛥𝐺𝑏𝑖𝑛𝑑𝑒𝑓𝑓
/Qeff, of only –0.33 (±
0.44) kcal mol-1
. These relatively small interaction energies could be interpreted as
surprising, although as visualised below in Figure 3.7, this may be a consequence of the
relative rigidity of the protamine structure compared to the PAMAM dendrimers.

Chapter 3 – Insights into Heparin Binding
107
Figure 3.7 – Equilibrated MD snapshots of heparin binding to selected PAMAM
dendrimers and protamine. Binders are represented as blue stick models while heparin is
shown as red and orange space-filling structures.
An additional benefit of this MD modelling study is that it allowed snapshots of the
binding events to be visualised, as shown in Figure 3.7. Perhaps most clear to see from
these images is the struggle as PAMAM generation, and consequently molecular size,
increases for all the binding groups to establish interactions with the polysaccharide
chain. This is particularly clear, for example, when comparing the visibility of terminal
amine group in the snapshots of G2-PAMAM-heparin against G6-PAMAM-heparin.
The snapshot image of the heparin-protamine interaction is also insightful as it suggests
so rigid is the protamine tertiary structure, that the normally extended heparin
polysaccharide ‘wraps around’ the protein structure in an attempt to optimise the
electrostatic binding interactions.
3.3.3 Heparin Binding in Clinically Relevant Conditions
Having established that G2-PAMAM was a more charge efficient heparin binder than
protamine (and the other PAMAMs) in electrolytically competitive aqueous solution,

Chapter 3 – Insights into Heparin Binding
108
we next wanted to challenge these binding interactions in the more biological, and
clinically relevant, conditions of human serum. This enabled the newly developed MalB
assay with heparin delivered in serum to be employed. The data obtained for G2-
PAMAM are displayed in Table 3.5.
Table 3.5 – Heparin binding data for G2-PAMAM with heparin delivered in 100%
serum.
Assay Conditions
G2-PAMAM
EC50 / μM CE50 Dose /
mg per 100IU
Salt and Buffer (2.55 ± 0.32) (0.38 ± 0.04) (0.25 ± 0.03)
Heparin in 100% Human Serum (2.15 ± 0.05) (0.32 ± 0.01) (0.21 ± 0.01)
G2-PAMAM fully maintained its relative heparin binding performance in human serum
when compared against the data obtained in buffer and salt. This is particularly
impressive given the decrease in efficiency of protamine observed earlier, see Table 3.2.
Although the data appears to suggest that G2-PAMAM slightly increased its charge
efficiency, the nature of this competition assay must be remembered. It is unlikely that
G2-PAMAM actually improves in absolute terms but rather that its heparin binding
ability improves relative to MalB in this more competitive biological media.
3.3.4 Summary
Overall, the data from the MalB assay have given insights into differing generational
effects of PAMAM dendrimers when binding heparin. In particular, the ‘medium sized’
systems such as G2-PAMAM have been demonstrated as the most able to marshal their
surface charges and establish meaningful efficient interactions with heparin. Molecular
dynamics modelling corroborated the experimental findings. As mentioned above, G2-
PAMAM is one of the least toxic PAMAM dendrimers and therefore may be suitable
for consideration as a lead compound for further developmental work.

Chapter 3 – Insights into Heparin Binding
109
3.4 Studying Effects of Rigidity and Flexibility with Transgeden
Dendrimers
3.4.1 Transgeden (TGD) Dendrimers
Following the insights into generational effects for PAMAM revealed by our new MalB
heparin binding assay, we took an interest in the hybrid dendrimers being synthesised
under the direction of our collaborator Professor Julián Rodríguez-López at Universidad
de Castilla-La Mancha, Ciudad Real, Spain. For some time now, Rodríguez-López and
co-workers have been interested in the study of hybrid dendrimers,282-284
with a
particular focus on systems possessing poly(phenylenevinylidene) (PPV) character.285-
287 PPV dendrimers consist, as the name suggests, of a series of phenyl rings conjugated
through trans-alkene connections as shown in the top structure in Figure 3.8. The team
of Rodríguez-López have taken an interest in controlling the surface functionality of
PPV systems,288
for example through the introduction of specific electron-donating or
electron-withdrawing groups in order to tune the photoluminescent properties of the
system.289
Two of the most relevant approaches to our current study involved the
hybridization of PPV dendrimers with PAMAM systems, firstly with PPV-groups
installed at the PAMAM surface290
and more recently with PAMAM-groups installed at
the PPV surface.291-293
It was this lattermost family of compounds, known as
Transgeden (TGD) dendrimers, in which we took particular interest.

Chapter 3 – Insights into Heparin Binding
110
Figure 3.8 – Structure of Transgeden (TGD) dendrimers showing the PPV core unit and
G1-G3 PAMAM surface groups.
It was decided to examine the heparin binding abilities of the first three generations of
Transgeden dendrimers (TGD-G1, -G2, -G3) and to compare them against the
corresponding native PAMAM dendrimers of equivalent generations. This allowed the
increased rigidity of the TGD dendrimers conferred by the PPV cores, and more
particularly its effect on the ability of the surface PAMAM ligand array to bind heparin,
to be probed.

Chapter 3 – Insights into Heparin Binding
111
3.4.2 Heparin Binding Studies in Competitive Conditions
3.4.2.1 Experimental Study I: Mallard Blue Displacement Assay
The Transgeden dendrimers (G1-G3) were tested for their heparin binding ability using
the MalB competition assay under the same conditions as had been applied earlier to the
PAMAM dendrimers; namely 25 µM MalB, 27 µM heparin, 150 mM NaCl and 10 mM
Tris HCl (pH 7.0). The resulting data, along with that shown earlier for the native
PAMAMs, expressed in terms of dose, effective concentration and charge excess at
50% MalB displacement (EC50 and CE50 respectively) are displayed in Table 3.6.
Table 3.6 – Heparin binding data from MalB assay in buffer and salt for G1-G3 TGD
dendritic systems, along with G1-G3 PAMAM data for comparison.
Compound
Heparin Binding
Charge (+) EC50 / μM CE50
Dose / mg per 100IU
TGD-G1 9 (7.73 ± 0.32) (0.64 ± 0.03) (0.38 ± 0.02)
TGD-G2 18 (3.78 ± 0.25) (0.63 ± 0.04) (0.42 ± 0.03)
TGD-G3 36 (2.00 ± 0.15) (0.67 ± 0.05) (0.47 ± 0.04)
G1-PAMAM 8 (10.10 ± 0.32) (0.75 ± 0.02) (0.44 ± 0.01)
G2-PAMAM 16 (2.55 ± 0.32) (0.38 ± 0.04) (0.25 ± 0.03)
G3-PAMAM 32 (1.53 ± 0.21) (0.45 ± 0.06) (0.32 ± 0.04)
The data show that despite the rigidification of the dendritic core, all three generations
of TGD dendrimers were able to bind heparin effectively, and could displace MalB
during the competition assay. The EC50 for each TGD dendrimer decreased from 7.73
(± 0.32) µM at G1 to 2.00 (± 0.15) µM at G3, and this is again a straightforward
consequence of each successive generation possessing a larger number of cationic
binding sites per mole and so becoming able to out-compete MalB due to the sheer
amount of charge present at lower concentrations. In terms of required dose, TGD-G1
was suggested to be marginally the best performer although the lower molecular weight
of the smaller dendrimer exerts an influence over this observation.
In terms of the binding efficiency of each individual cationic charge, the CE50 values
suggest binding performance is essentially equivalent across all three TGD generations;
an observation in marked contrast to the PAMAM systems, which exhibit significant

Chapter 3 – Insights into Heparin Binding
112
performance improvement with increasing size to G2 and G3. Direct comparisons
between equivalent generations of the two dendritic families showed that at G1, the
TGD system was able to employ its 9 cationic charges in a more efficient manner than
the PAMAM could its 8, while in the larger G2 and G3 systems, the native PAMAMs
were the more charge efficient, despite possessing less overall charge in both cases. As
informative as these CE50 values can be, it must be remembered that they only reflect
the binding events at one specific point; namely that at which 50% MalB has been
displaced from heparin. The full binding curves for each pair of dendrimers were
therefore considered, Figure 3.9, in an attempt to rationalise the observed differences
between the dendritic systems and probe the effects of molar dendrimer/heparin ratios.
Figure 3.9 – Heparin binding curve comparisons for TGD (closed shapes) and
PAMAM (open shapes) dendrimers at G1 (top left), G2 (top right) and G3 (bottom)
from MalB assay in buffer and salt.
The binding curves for the smallest pair of dendrimers, TGD-G1 and G1-PAMAM
shows that the hybrid TGD system is the superior heparin binder throughout the whole
titration range. In this case, the single CE50 value is therefore representative of the
overall binding. On moving to the larger G2 and G3 systems, this is not necessarily the
case, as when only small amounts of dendrimer are present, the TGD systems exhibit
superior binding to the native PAMAMs. As dendrimer concentrations increase beyond

Chapter 3 – Insights into Heparin Binding
113
a charge ratio of ca. 0.2 for these systems, the TGD performance drops off, leading to
the observed superiority of PAMAM at the CE50 value. These observations suggest that
the TGD dendrimers are better optimized for forming interactions with multiple heparin
chains under the regime where heparin is present in significant excess, but when the
stoichiometry of dendrimer to heparin is more even, the PAMAM systems are better
optimized. The inherent rigidity imposed by the PPV cores upon the TGD systems may
be central to these observations as, particularly at higher charge-excess values when the
amount of heparin becomes limited, the hybrid dendrimers may be less well able to
adapt and re-organise their ligand array to interact with a single heparin chain most
optimally, while the more flexible PAMAMs may be able to more freely contort to bind
the polysaccharide.
3.4.2.2 Computational Study: MD Modelling
In an attempt to validate these experimental observations, our collaborators, led by
Professor Sabrina Pricl at University of Trieste, once again employed molecular
dynamics (MD) modelling to study the dendrimer-heparin interactions. Binding was
simulated at two different charge ratios in an attempt to understand the effect of
stoichiometry on binding performance. Firstly, atomistic modelling was undertaken at a
charge ratio of 0.4 as at this point on the binding curves the larger (G2 and G3)
PAMAMs were significantly outperforming their TGD counterparts, while at G1
differences were minimal.
In order to compare the different dendrimers at the same charge ratio, the concentration
of heparin within the simulation was kept constant and the number of individual
dendrimer molecules adjusted to afford the desired charge ratio. This approach differed
from the per-residue free energy decomposition technique employed in the previous
section and, in practice, resulted in four (or five) G1, two G2 and one G3 dendrimer
being present in each simulation. As before, the overall free energy of binding, 𝛥𝐺𝑏𝑖𝑛𝑑𝑒𝑓𝑓
,
could be calculated to give an insight to the energetics of the overall binding interaction.
The data show that each of the TGD dendrimers, along with G1-PAMAM, interact with
a free energy of around –10 kcal mol-1
. The larger PAMAM dendrimers bind more
efficiently with G2-PAMAM affording –44.7 (± 2) kcal mol-1
.
Division of these total free energy values by the total number of cationic charges
present, Qtot, in each simulation – which is coincidentally 36 for all three TGD

Chapter 3 – Insights into Heparin Binding
114
dendrimers – afforded the charge normalized free energy of binding, 𝛥𝐺𝑏𝑖𝑛𝑑𝑒𝑓𝑓
/Qtot, as
detailed in Table 3.7. These values, which are analogous to the experimentally
determined CE50 values, were equivalent at ca. 0.28 kcal mol-1
for each TGD dendrimer
and G1-PAMAM, with only the larger PAMAM systems offering more energy per
charge.
Table 3.7 – MD simulation binding parameters at a charge excess of 0.4. Qtot: number
of binder charges; Qeff: number of interacting charges; 𝛥𝐺𝑏𝑖𝑛𝑑𝑒𝑓𝑓
: effective free energy of
binding; 𝛥𝐺𝑏𝑖𝑛𝑑𝑒𝑓𝑓
/Qtot: charge-normalised free energy of binding; 𝛥𝐺𝑏𝑖𝑛𝑑𝑒𝑓𝑓
/Qeff: effective-
charge-normalised free energy of binding.
Compound Nmol Qtot / (+)
Qeff / (+)
𝜟𝑮𝒃𝒊𝒏𝒅𝒆𝒇𝒇
/ kcal mol-1
𝜟𝑮𝒃𝒊𝒏𝒅𝒆𝒇𝒇
/Qtot
/ kcal mol-1
𝜟𝑮𝒃𝒊𝒏𝒅𝒆𝒇𝒇
/Qeff
/ kcal mol-1
TGD-G1 4 36 26 ± 2 -9.6 ± 0.8 -0.27 ± 0.02 -0.37 ± 0.03
TGD-G2 2 36 21 ± 1 -9.9 ± 0.6 -0.28 ± 0.02 -0.47 ± 0.03
TGD-G3 1 36 14 ± 1 -10.1 ± 0.7 -0.28 ± 0.02 -0.72 ± 0.05
G1-PAMAM 5 40 35 ± 2 -10.2 ± 1.1 -0.26 ± 0.03 -0.29 ± 0.03
G2-PAMAM 2 32 29 ± 1 -44.7 ± 2.0 -1.40 ± 0.06 -1.54 ± 0.07
G3-PAMAM 1 32 15 ± 1 -15.9 ± 1.1 -0.50 ± 0.03 -1.06 ± 0.07
The simulations again allowed the number of dendrimer charges directly involved in
heparin interactions, Qeff, to be calculated. It is interesting to note that the smallest
TGD-G1 structure is best able to utilise its charges with 72% of the available surface
amines directly interacting with heparin. As size increases, this proportion drops to 58%
for TGD-G2 and 39% for TGD-G3. Division of the total free energy of binding, 𝛥𝐺𝑏𝑖𝑛𝑑𝑒𝑓𝑓
,
by Qeff calculates the effective ‘strength’ of each individual amine-heparin interaction
for the systems. These values indicate that TGD-G3 established the most energetic
individual amine-heparin interactions while those of TGD-G1 were the weakest.
The smaller (G1 and G2) PAMAM dendrimers were shown to be superior to any of the
TGDs at involving individual amine surface groups in direct interactions with heparin.
At G1, 87.5% of the available 40 cationic charges were directly involved in binding,
while at G2, this increased to an impressive 91% of the available 32 charges. These data
suggest the flexibility of the PAMAM core interior structures, compared to the rigid
TGD systems, significantly enhances their ability to re-organise and optimize their
interactions. We termed this process ‘adaptive multivalency.’294
Adaptive multivalency

Chapter 3 – Insights into Heparin Binding
115
is a similar concept to that previously observed for DNA binding295
with large
multivalent dendritic systems such as PAMAMs296
and PEI dendrimers.297
Further atomistic MD modelling snapshots of these interactions were captured, Figure
3.10, and these illustrate well the adaptivity of the PAMAM systems compared to the
TGD-modified dendrimers. For example, inspection of the snapshots of TGD-G2-
heparin and G2-PAMAM-heparin shows several large regions of TGD-system
positioned away from the polysaccharide while the PAMAM-system has adapted its
conformation to interact more completely with the heparin chain.
Figure 3.10 – MD simulations for TGD (red structures, top) and PAMAM (green
structures, bottom) binding heparin (light and dark blue structures) at a charge excess of
0.4 across generations 1, 2 and 3 (left-to-right).
In the second part of this study, mesoscale dissipative particle dynamics (DPD)
modelling was carried out at a charge excess of 0.1; a regime under which the MalB
data suggested the more rigid TGD dendrimers were superior heparin binders to
PAMAMs. DPD was employed for these simulations as this technique is coarse-grained
and therefore allowed multiple heparin chains in constant contact with the dendrimer,
and more complex binding stoichiometries, to be studied. Views of these simulations
are shown in Figure 3.11.

Chapter 3 – Insights into Heparin Binding
116
Figure 3.11 – Snapshots of the mesoscale simulations between dendrimers and heparin
(light and dark blue structures) at CE = 0.1 for TGD (pink structures, top) and PAMAM
(dark green structures, bottom) at G1 (left), G2 (middle) and G3 (right). In all panels,
positively charged sites are shown in light green.
At G1, mesoscale models indicated that the heparin-dendrimer interactions are well
defined, with each dendrimer appearing to interact with a single heparin polysaccharide.
For TGD-G1, it seems likely that the rigidity of the PPV core plays a key role in locally
organizing the surface groups for binding. At higher generations, meanwhile, binding is
less well defined as both G2 and G3 systems appear to interact with multiple heparin
chains simultaneously. The formation of these high-affinity interactions between
multiple heparins and each of the TGD dendrimers appears to suggest that the same
rigidity which limits effective multivalent interactions at higher CE (e.g. 0.4) is actually
beneficial at lower CE (e.g. 0.1). Indeed, it seems these locally organized regions at the
TGD surfaces are better optimized for interaction with heparin than the native
PAMAMs, but only if there is enough heparin present for them to interact with it
without having to deform their structures. We therefore categorized TGD dendrimers as
exponents of a new concept: namely ‘shape-persistent multivalency.’294
3.4.2.3 Experimental Study II: Utilizing TGD Fluorescence
An attractive feature of the TGD dendrimers over the native PAMAM systems is that
they possess a PPV core, which endows photophysical activity. As such, it was
anticipated that these structures might also be able to act as heparin sensors by self-
indicating interactions with heparin. To that end, solutions of each TGD dendrimer (1
µM) were titrated with heparin in the presence of 150 mM NaCl and 10 mM Tris HCl
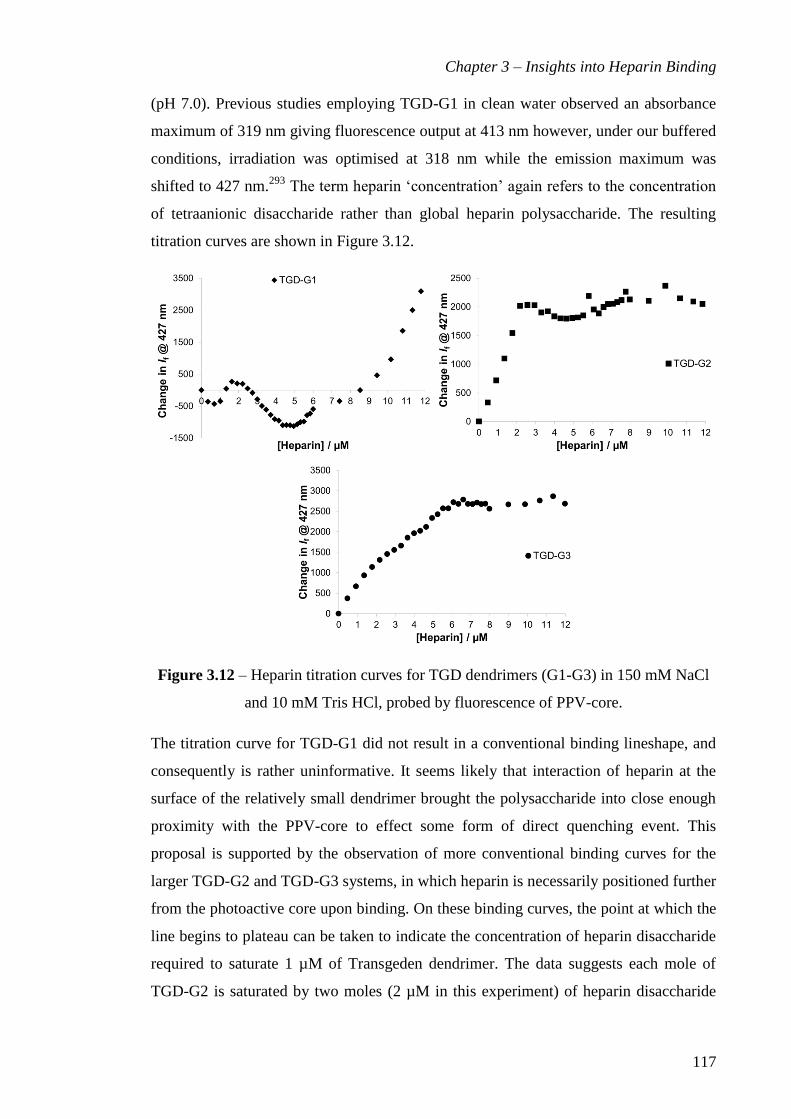
Chapter 3 – Insights into Heparin Binding
117
(pH 7.0). Previous studies employing TGD-G1 in clean water observed an absorbance
maximum of 319 nm giving fluorescence output at 413 nm however, under our buffered
conditions, irradiation was optimised at 318 nm while the emission maximum was
shifted to 427 nm.293
The term heparin ‘concentration’ again refers to the concentration
of tetraanionic disaccharide rather than global heparin polysaccharide. The resulting
titration curves are shown in Figure 3.12.
Figure 3.12 – Heparin titration curves for TGD dendrimers (G1-G3) in 150 mM NaCl
and 10 mM Tris HCl, probed by fluorescence of PPV-core.
The titration curve for TGD-G1 did not result in a conventional binding lineshape, and
consequently is rather uninformative. It seems likely that interaction of heparin at the
surface of the relatively small dendrimer brought the polysaccharide into close enough
proximity with the PPV-core to effect some form of direct quenching event. This
proposal is supported by the observation of more conventional binding curves for the
larger TGD-G2 and TGD-G3 systems, in which heparin is necessarily positioned further
from the photoactive core upon binding. On these binding curves, the point at which the
line begins to plateau can be taken to indicate the concentration of heparin disaccharide
required to saturate 1 µM of Transgeden dendrimer. The data suggests each mole of
TGD-G2 is saturated by two moles (2 µM in this experiment) of heparin disaccharide

Chapter 3 – Insights into Heparin Binding
118
while TGD-G3 requires six moles (6 µM) to be present. Interestingly, and convincingly,
these data are in agreement with the atomistic MD modelling snapshots for these
interactions, Figure 3.10, which show individual dendrimer residues appearing to bind
to the corresponding number of heparin saccharides suggested here.
Given the obvious spectroscopic responses of the larger TGD dendrimers in
electrolytically competitive conditions (150 mM NaCl and 10 mM Tris HCl), these
systems may be of interest for further heparin sensing investigations such as those
presented in the previous Chapter. Clearly, PAMAM dendrimers have no direct heparin
sensing capability owing to their lack of photoactive groups and so their modification to
yield TGD dendrimers offers significant advantages in this regards.
3.5 Modified Transgeden Dendrimers
In a final set of experiments, attempts were made to study the importance of each
individual charge within the TGD-G1 structure by removing some of them from the
system. To do this, our collaborators in the group of Professor Julián Rodríguez-López
at Universidad de Castilla-La Mancha, Ciudad Real, Spain synthesised a small family of
TGD-G1 derivatives, in which differing numbers of the surface primary amines were
replaced non-selectively with alcohol groups. This was achieved in a statistical manner
during synthesis and the degree of amine functionalization was determined using a
Kaiser test. Specifically, three compounds were produced in which 82%, 69% and 45%
of the surface amine groups were present when compared to the original TGD-G1. From
these Kaiser test values, the average molecular charge for each new dendrimer could be
estimated (+ 7.4, + 6.2 and + 4.0 respectively) and these values were used for charge
excess calculations. Each molecule, along with a completely anionic control molecule
TGD-G1(OH)9, was tested for heparin binding ability in the MalB assay in buffer and
salt. The data are reported in Table 3.8 and Figure 3.13.

Chapter 3 – Insights into Heparin Binding
119
Table 3.8 – Heparin binding data for the TGD-G1 derivatives with different numbers of
surface charges.
Compound
Heparin Binding
EC50 / μM CE50 Dose /
mg per 100IU
TGD-G1 (7.73 ± 0.32) (0.64 ± 0.03) (0.38 ± 0.02)
TGD-G1 (+7.4) (19.2 ± 2.7) (1.31 ± 0.18) (0.94 ± 0.13)
TGD-G1 (+6.2) Not achieved - binding too weak
TGD-G1 (+4.0) Not achieved - binding too weak
TGD-G1(OH)9 No binding observed
Figure 3.13 – Heparin binding curves for TGD-dendrimers containing differing
numbers of surface amines.
The data show that in all cases, the removal of surface amines decreases the heparin
binding performance. Whilst this observation may not be surprising, it is interesting to
note that removal of only ca. 20% of the surface amines decreases the heparin binding
efficiency by around half. In the previous section, MD modelling suggested that only
around 72% of the TGD-G1 surface amines actively interact with heparin upon binding,
yet here, although around ca. 80% of the amines remain present, binding efficiency is
significantly reduced. This suggests that the surface amines may be acting in pre-
organised clusters of 3 amines each on the TGD surface. Loss of even one of these
amines will significantly disturb the shape persistent multivalent binding. Furthermore,

Chapter 3 – Insights into Heparin Binding
120
when only ca. 70% of the amines are present, TGD-G1 (+ 6.2), binding is so perturbed
that less than 50% of MalB is displaced from heparin during the assay. As would be
expected, the anionic control molecule, TGD-G1(OH)9, showed no evidence of heparin
binding.
3.6 Conclusion and Future Work
Following consideration of the currently available methods for rapidly probing and
comparing the heparin binding ability of different molecules, a novel straightforward
competition assay was developed. The new assay employed our recently developed
heparin sensor Mallard Blue (MalB) in an indicator displacement assay (IDA) regime.
The performance of different candidate molecules was determined by their propensity to
displace MalB from its complex with heparin and into solution, thereby causing an
observable spectroscopic change. It was reasoned that the binding performance of new
(and existing) molecules – measured in terms of charge excess and effective
concentration at 50% MalB displacement, along with clinically relevant dose – could
then be benchmarked against the clinically used heparin rescue agent, protamine to
assess initial clinical potential.
The potential of this assay was initially demonstrated using protamine, and proved
operable both in the presence of competitive electrolytes – specifically 150 mM NaCl
and 10 mM Tris HCl – and also with the heparin component of the mixture delivered in
100% human serum. Although many existing dye systems have the potential to operate
in this manner, it is believed that this work marks the first concerted attempt to develop
such a straightforward assay for screening heparin binding under competitive
conditions. Furthermore, the ease-of-synthesis associated with MalB makes the assay an
attractive proposition for a wide range of researches, even those without specialist
knowledge in synthetic chemistry such as, for example, biologists/biochemists.
The new competition assay was then validated through a study of the commercially
available family of PAMAM dendrimers. The experimental data, supplemented by MD
modelling, gave new insights into the multivalent binding behaviour of these systems
and highlighted the importance of size dendritic size/generation for heparin binding.
The results showed that the bigger, more charge dense dendrimers (e.g. G6), were not
necessarily the best for heparin binding, while the smallest (e.g. G0, G1) were not

Chapter 3 – Insights into Heparin Binding
121
optimal either. Interestingly despite possessing a comparable number of cationic
charges to MalB, G0-PAMAM was unable to displace MalB from heparin even when
present in excess. The medium sized dendrimers (G2-G4) were shown to bind heparin
in the most charge efficient manner indicating that these systems were best able to
marshal their surface charges to maximize interactions with the polysaccharide. The
MD modelling showed that G2-PAMAM was able to utilise the highest percentage
(91%) of the available surface amines for interaction with heparin, and that each did so
in the most energetic manner of any PAMAM system tested. Importantly, from the
viewpoint of the novel assay, these results concurred with previous literature
observations, indicating the suitability of the new technique for probing the relative
performance of different binders.
Following this, in order to gain further understanding of multivalent effects in the
binding of PAMAM-type systems to heparin, a range of hybrid dendrimers containing a
rigid poly(phenylenevinylidene) (PPV) core functionalized with PAMAM surface
groups were tested. Comparisons of these so-called ‘Transgeden’ (TGD) dendrimers
with the native PAMAMs across low (G1) and medium (G2 and G3) generation sizes
unveiled some key concepts relating to the flexibility of large dendritic systems on
heparin binding. At low charge excess values – that is when heparin is present in
significant excess to the binder – the rigidity of the TGD-core was beneficial to the
relative binding performance of these systems by assisting in locally organizing ligand
binding clusters at the dendrimer surface, while under the same regime, PAMAMs were
less well organized. On moving to a larger charge excess – that is where the
stoichiometric ratio is less in favour of heparin – the rigidity of the TGD core becomes
detrimental to their performance as it reduces the extent to which the dendrimers can
adapt their shape to maximize the number of interacting sizes with heparin. Under this
latter regime, the flexibility of the PAMAM dendrimers allowed them to re-organise the
ligand array presented to heparin for binding. These two dendrimer families were
categorized a prime exponents of “shape persistent multivalency” and “adaptive
multivalency” respectively. All observations, again, were supplemented by MD
modelling data.
The rigid PPV core present within the TGD systems offered the additional benefit of
photophysical activity and was exploited to self-indicate the interactions of the TGD
dendrimers with heparin. The titration data obtained in this manner suggested that the

Chapter 3 – Insights into Heparin Binding
122
larger systems (G2 and G3) required more heparin for binding to become saturated.
Impressively, the saturation stoichiometries suggested by the data for TGD-G2 (2 : 1,
anionic disaccharide : TGD) and TGD-G3 (6 : 1) correlated closely with the values
obtained computationally during the MD modelling studies of the same systems. The
self-indicating fluorescent study of TGD-G1was unsuccessful owing to the relatively
small PAMAM surface groups being unable to enforce a large enough distance between
the PPV-core and the bound heparin to prevent a direct quenching event occurring. This
quenching interfered with the fluorescent output of the dendrimer and resulted in the
observed ‘binding curve’ being uninformative.
In a final experiment, the new assay was used to examine the relative heparin binding
abilities of a family of modified TGD-G1 dendrimers. The compounds possessed
different numbers of amines at their surface, with some groups replaced by alcohol
functionalities. Most interestingly, the absence of less than 20% of the surface amines
was sufficient to decrease the heparin binding ability of the system by greater than half.
This is particularly profound as the complementary MD modelling work of the original
TGD-G1 suggested that only 72% of the surface amines present actually interact
directly with heparin. Such a decrease in performance with around 80% of the amines
remaining intact supports the view that the loss of only one of the three amines in each
cluster is significantly detrimental to the shape persistent multivalency. The absence of
ca. 30% of the original charge is sufficient to prevent the dendrimer from displacing
MalB during the entire titration.
The insight into fundamental multivalent binding phenomena gained from further
investigations of the initial experimental data obtained from the novel MalB
displacement assay is clear. This assay will now be taken forward to probe a variety of
different compounds and molecular systems for their heparin binding potential, with a
view to identifying molecules of interest for the development of novel heparin rescue
agents. In particular, such a study could focus on self-assembling dendritic systems,
which may present clinically-relevant advantages over large covalent systems for
heparin binding.

Chapter 4 – SAMul Binders I: DAPMA
123
4 Self-Assembling Multivalent Heparin Binders I:
DAPMA-containing system
4.1 Introduction
4.1.1 Background
At the conclusion of surgery during which heparin has been used, there is an immediate
need to neutralize the anti-coagulant effect of the heparin and allow the patient to begin
clotting. This heparin neutralization, known widely as ‘heparin rescue’, involves the
introduction of a heparin antidote into the bloodstream. Currently, there is only one
licensed heparin rescue agent: protamine sulfate.100
Protamine is an arginine-rich
protein of ill-defined structure and was first demonstrated as a potential heparin rescue
agent as early as 1937.298
Although mostly effective, the use of protamine is not without
consequence as up to 10% of patients treated with the shell-fish or salmon derived
protein at the conclusion of surgery experience some adverse effects, and close to 3% of
all cardiac surgery patients experience serious problems.110
Consequently there is a
significant interest in finding an alternative heparin rescue agent which is able to confer
the desired heparin neutralization without conferring toxicity in patients.299
Much of the work to develop a novel heparin rescue agent can be categorized broadly
into one of two sub-sets: small, well-defined ‘drug-like’ molecules or larger, less well-
defined systems.212
Each approach has associated pros and cons. Small molecules, such
as surfen for example, are often very well defined and can be easily produced to a high
level of purity in large quantities.205
From a pharmacological perspective, smaller
molecules can be more appealing than larger systems as they can offer more predictable
pharmacokinetic profiles. A significant limitation of smaller systems however, can be
their limited heparin binding ability when compared against their larger counterparts.
Indeed although systems such as surfen are somewhat optimized for heparin binding,
their low molecular weight is often associated with a low molecular charge, which in
turn results in effective heparin neutralisation requiring unacceptably large amounts of
binder, as measured by IC50 values. Given these factors, it is perhaps not surprising that
relatively few small molecule heparin binders have received serious consideration in
clinical settings.

Chapter 4 – SAMul Binders I: DAPMA
124
In contrast, larger systems can offer more appeal as potential protamine alternatives
because their more massive and highly charged structures can lead to more effective and
robust heparin binding on a per molecule basis. Larger structures, such as the covalent
dendrimers discussed in Chapter 3 do not come without problems however. For
example, synthesis of larger polymeric or dendritic structures is frequently far from
trivial with purification often being troublesome. Unpredictable and unfavourable
pharmacokinetic profiles can also detract from the employment of larger heparin
binding systems. For example, the absence of a biocompatible degradation pathway can
lead to toxicity problems, often as a consequence of the persistence of large cationic
charge arrays in the bloodstream. As discussed in Chapter 3, this is one limitation to the
use of PAMAM dendrimers in a clinical setting.276,277
An effective way of generating a large ligand array whilst minimizing the synthetic
challenge can be to use molecular self-assembly. This process involves multiple copies
of the same ‘building-block’ molecule spontaneously organizing with one another to
form a larger hierarchical structure.300
Such systems are routinely held together by non-
covalent interactions and as seen in Chapter 1, self-assembly processes can be used to
multiply-up the number of binding groups from a single monomer ligand in order to
produce a self-assembled multivalent (SAMul) ligand array. Most commonly,
amphiphilic monomeric building-blocks are used to promote self-assembly as they are
able to arrange themselves in a predictable manner depending upon the solvent
conditions used.46
Self-assembling approaches have been widely used to achieve binding to biological
target molecules such as lectins,301,302
integrins56
and DNA.64
In each of these cases, the
individual monomer units contain hydrophilic binding groups attached to a hydrophobic
unit. The molecular geometry is designed such that when solubilized in aqueous
biological conditions, the apolar units are internalized as a consequence of the
hydrophobic effect leading to the display of hydrophilic binding groups at the assembly
surfaces. Of particular relevance to us is the body of work from Smith and co-workers
which has focused on developing self-assembling agents able to bind either DNA or
integrin for clinical purposes.56,303
An example of an amphiphilic binder targeted at
binding integrin from Smith and co-workers is shown in Figure 4.1. The geometry of
the building block, as dictated by the relative size of the hydrophobic and hydrophilic
domains, promotes the formation of a spherical micellar assemblies in which the

Chapter 4 – SAMul Binders I: DAPMA
125
resulting multivalent array of ligands achieve superior integrin binding compared with
the equivalent concentration of non-self-assembling ligands.56
Figure 4.1 – An amphiphilic integrin binder from Smith and co-workers.56
4.1.2 Preliminary Work211
In 2011, Smith and co-workers extended their approach of self-assembly based ligand
design to target interaction with heparin. Specifically, an amphiphilic system similar to
that presented above was designed and synthesised. The building block C22G1DAPMA,
shown in Figure 4.2, comprised several key features: (i) a twenty-two carbon aliphatic
tail, which endowed the building block with amphilicity and promoted spontaneous
formation of nanoscale assemblies in aqueous conditions; (ii) positively charged,
heparin-binding DAPMA – N,N-di-(3-aminopropyl)-N-methylamine – surface groups;
(iii) an ester-containing linker unit between the hydrophobic moiety and the hydrophilic
head group, to encourage hydrolytic degradation in biological conditions.
Figure 4.2 – Structure of heparin binder C22G1DAPMA along with cartoon
representation of self-assembly. This Figure is also shown as Figure 1.33.
It was hoped that designing the molecular building block in this way would maximize
the advantages of both small and large heparin binding systems. The self-assembled
system should be large enough (in assembled form) to establish meaningful interactions
with heparin and act as an effective binder, while minimizing the unnecessary
persistence of a cationic ligand array after administration.

Chapter 4 – SAMul Binders I: DAPMA
126
The preliminary work with C22G1DAPMA established that the system was able to self-
assemble in aqueous conditions at concentrations above ca. 4 µM.211
Transmission
electron microscopy (TEM) images of dried samples of C22G1DAPMA showed
spherical assemblies and the nanostructures were thereby categorized as micellar in
nature. The micelles were sized at approximately 8.5 (± 1.5) nm in diameter and,
importantly, appeared to remain intact upon heparin binding, Figure 4.3. The TEM
images of C22G1DAPMA in the presence of heparin appeared to show micelles aligned
in an ordered fashion along the polysaccharide surface. In reality, this patterning is
likely to arise from an integrated nanostructure composed of binder micelles distributed
throughout the heparin polysaccharide chains. Such observations are similar to those
previously observed by Kostiainen and co-workers for self-assembling systems when
binding viruses.304,305
Indeed, direct interactions between our SAMul binder and heparin
polysaccharide chains were held responsible for the observed ‘beads on a string’
binding motif.
Figure 4.3 – TEM images of C22G1DAPMA in absence (left, scale bar: 100 nm) and
presence (right, scale bar: 50 nm) of heparin.
In this previous preliminary work, having established C22G1DAPMA’s aptitude for
interaction with heparin, the relative binding efficiency of the system with respect to
protamine was probed using a methylene blue (MB) indicator displacement assay.
Under this regime, C22G1DAPMA required only 78% as much charge as protamine to
bind any given amount of heparin, indicating that the self-assembling binder was
employing each surface charge more efficiently than protamine. Whilst these results
were impressive, the MB assay limited the scope of investigation owing to the
Chapter 4 – SAMul Binders I: DAPMA
127
intolerance of MB-heparin interactions to electrolytic conditions above 1 mM Tris HCl
and 5 mM NaCl; a significant way short of biologically relevant conditions.
Overall the data from the preliminary study suggested C22G1DAPMA was a more
charge efficient heparin binder than protamine in the presence of low concentrations of
competitive electrolytes, although the SAMul system remained some way from being
established as a promising heparin rescue agent. Several important factors remained
unaddressed. For example, heparin binding performance was not studied under
biologically relevant conditions; primarily due to the lack of a sufficiently robust
straightforward assay. The role of self-assembly in conferring the apparent multivalent
heparin binding performance was not unequivocally proven either. Furthermore, despite
an ester linkage being incorporated into the scaffold to promote degradation, the validity
of this molecular design was not examined. Following the development of the Mallard
Blue heparin binding assay, presented in Chapters 2 and 3, it was decided to address
some of these outstanding questions.
The C22G1DAPMA compound used for testing was synthesised according to previously
reported methodology in the Smith group by Ana Campo Rodrigo or Ching Wan
Chan.211
4.2 Effects of Different Media on Heparin Binding
4.2.1 Heparin Binding in Competitive Conditions
4.2.1.1 Heparin Binding Assays
The Mallard Blue assay provided an ideal tool with which to investigate the effects of
different media on the heparin binding ability of C22G1DAPMA. The MalB assay
operates in the presence of 150 mM NaCl and 10 mM Tris HCl, and so provided much
sterner electrolytic competition for the SAMul system than the methylene blue assay
regime. The heparin binding data for C22G1DAPMA from both assays are presented in
Table 4.1 along with protamine for comparison.
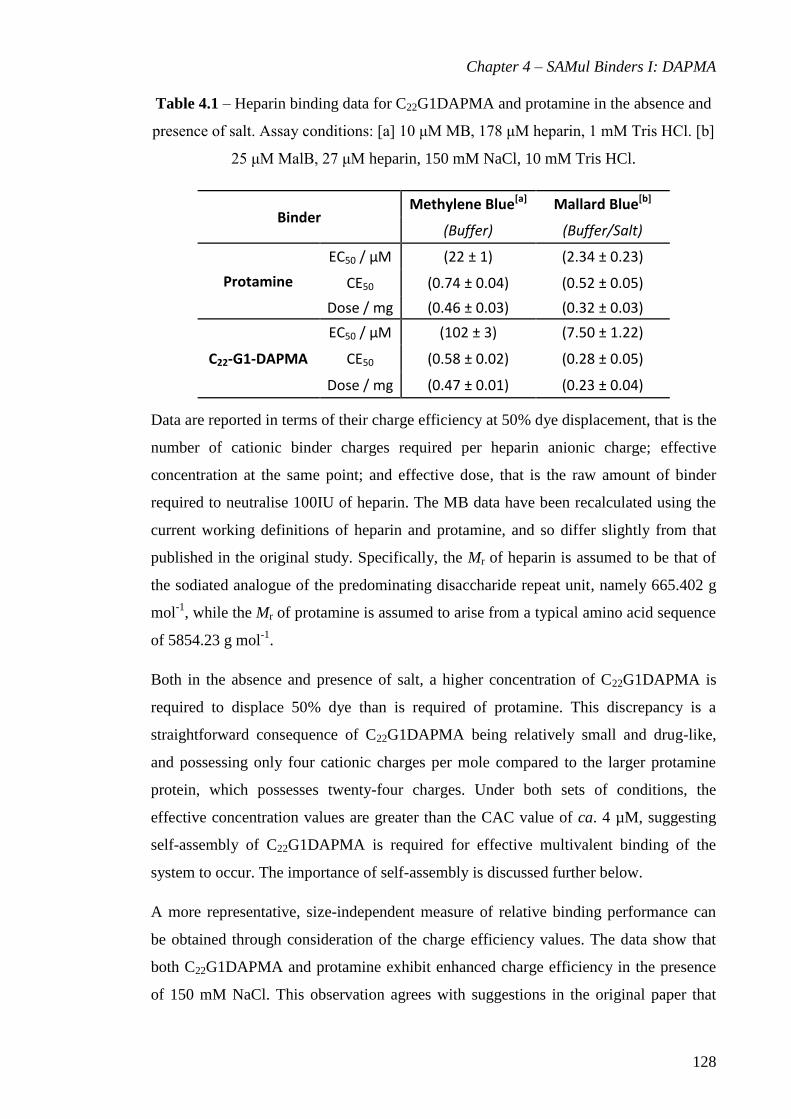
Chapter 4 – SAMul Binders I: DAPMA
128
Table 4.1 – Heparin binding data for C22G1DAPMA and protamine in the absence and
presence of salt. Assay conditions: [a] 10 μM MB, 178 μM heparin, 1 mM Tris HCl. [b]
25 μM MalB, 27 μM heparin, 150 mM NaCl, 10 mM Tris HCl.
Binder Methylene Blue[a] Mallard Blue[b]
(Buffer) (Buffer/Salt)
Protamine
EC50 / µM (22 ± 1) (2.34 ± 0.23)
CE50 (0.74 ± 0.04) (0.52 ± 0.05)
Dose / mg (0.46 ± 0.03) (0.32 ± 0.03)
C22-G1-DAPMA
EC50 / µM (102 ± 3) (7.50 ± 1.22)
CE50 (0.58 ± 0.02) (0.28 ± 0.05)
Dose / mg (0.47 ± 0.01) (0.23 ± 0.04)
Data are reported in terms of their charge efficiency at 50% dye displacement, that is the
number of cationic binder charges required per heparin anionic charge; effective
concentration at the same point; and effective dose, that is the raw amount of binder
required to neutralise 100IU of heparin. The MB data have been recalculated using the
current working definitions of heparin and protamine, and so differ slightly from that
published in the original study. Specifically, the Mr of heparin is assumed to be that of
the sodiated analogue of the predominating disaccharide repeat unit, namely 665.402 g
mol-1
, while the Mr of protamine is assumed to arise from a typical amino acid sequence
of 5854.23 g mol-1
.
Both in the absence and presence of salt, a higher concentration of C22G1DAPMA is
required to displace 50% dye than is required of protamine. This discrepancy is a
straightforward consequence of C22G1DAPMA being relatively small and drug-like,
and possessing only four cationic charges per mole compared to the larger protamine
protein, which possesses twenty-four charges. Under both sets of conditions, the
effective concentration values are greater than the CAC value of ca. 4 µM, suggesting
self-assembly of C22G1DAPMA is required for effective multivalent binding of the
system to occur. The importance of self-assembly is discussed further below.
A more representative, size-independent measure of relative binding performance can
be obtained through consideration of the charge efficiency values. The data show that
both C22G1DAPMA and protamine exhibit enhanced charge efficiency in the presence
of 150 mM NaCl. This observation agrees with suggestions in the original paper that
Chapter 4 – SAMul Binders I: DAPMA
129
salt may be acting as a screen preventing further heparin interfering with already
established heparin-binder interactions. The extra electrolytes also serve to weaken the
dye-heparin interactions with which the synthetic binder molecule (or protamine) has to
compete, artificially enhancing the apparent binder performances. Although the absolute
improvement in binding ability upon introduction of salt could therefore not be
calculated, insight could be gained from the relative improvements of C22G1DAPMA
and protamine.
On moving to 150 mM NaCl, the charge efficiency of protamine increased by around
30% from 0.74 (± 0.04) to 0.52 (± 0.05) while C22G1DAPMA improved by around 50%
from 0.58 (± 0.02) to 0.28 (± 0.05). These values suggest that C22G1DAPMA is a more
robust binder than protamine in the presence of 150 mM NaCl and may hint at some
type of ‘ligand sacrifice’ behaviour where the flexibility of the self-assembled system
allows one or more arms within the assembly to sacrifice binding interactions in order
to shield the remaining binding interactions from disruption by salt. Such effects have
previously been reported for structurally related systems.295
4.2.1.2 Modelling Heparin Binding
In an attempt to rationalise the improved performance of C22G1DAPMA relative to
protamine in the presence of more electrolytically rich conditions, a molecular dynamics
modelling study was carried out in collaboration with Professor Sabrina Pricl at
University of Trieste, Italy. The simulations allowed the assembly structure of
C22G1DAPMA to be visualised, Figure 4.4, and assisted in assessing sizes and
properties of the binding aggregates.

Chapter 4 – SAMul Binders I: DAPMA
130
Figure 4.4 – Mesoscale (top) and atomistic (bottom) representations of C22G1DAPMA
in the presence (left) and absence (right) of 150 mM NaCl.
The modelling suggested the formation of C22G1DAPMA aggregates with markedly
different sizes in the presence and absence of 150 mM NaCl. The simulations predicted
that in the absence of NaCl, C22G1DAPMA might be expected to form aggregates
containing 11 (± 3) individual molecules with an approximate aggregate diameter of 6.3
(± 0.5) nm. In the presence of 150 mM NaCl, a larger aggregate of 9.3 (± 0.1) nm in
diameter containing around 24 (± 1) molecules might be expected. Based on these
predictions, the aggregate in the presence of salt would be expected to have 96 (± 4)
cationic charges compared to only 44 (± 12) in the absence. These predictions are
significant, as the larger size of C22G1DAPMA assemblies in the presence of salt may
go some way to accounting for the relative improved performance of C22G1DAPMA
over protamine in the presence of greater electrolytic competition. Other authors have
previously observed size increases for micellar aggregates in response to an increase in
ionic strength, with the change thought to be due to a combination of charge screening
and an enhancement of the hydrophobic effect.306,307
In order to experimentally validate the predictions made computationally, dynamic light
scattering (DLS) was carried out on aggregates of C22G1DAPMA in the solution phase
both in the presence and absence of 150 mM NaCl. The data, shown in Table 4.2, was
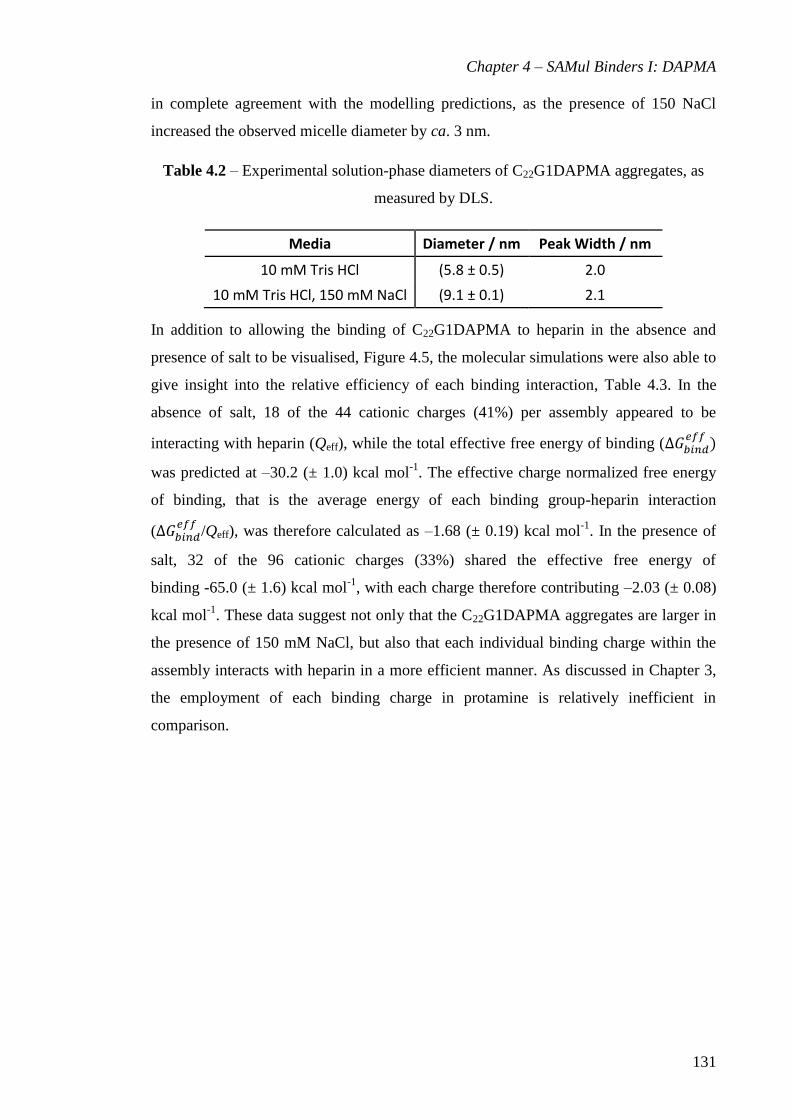
Chapter 4 – SAMul Binders I: DAPMA
131
in complete agreement with the modelling predictions, as the presence of 150 NaCl
increased the observed micelle diameter by ca. 3 nm.
Table 4.2 – Experimental solution-phase diameters of C22G1DAPMA aggregates, as
measured by DLS.
Media Diameter / nm Peak Width / nm
10 mM Tris HCl (5.8 ± 0.5) 2.0
10 mM Tris HCl, 150 mM NaCl (9.1 ± 0.1) 2.1
In addition to allowing the binding of C22G1DAPMA to heparin in the absence and
presence of salt to be visualised, Figure 4.5, the molecular simulations were also able to
give insight into the relative efficiency of each binding interaction, Table 4.3. In the
absence of salt, 18 of the 44 cationic charges (41%) per assembly appeared to be
interacting with heparin (Qeff), while the total effective free energy of binding (∆𝐺𝑏𝑖𝑛𝑑𝑒𝑓𝑓
)
was predicted at –30.2 (± 1.0) kcal mol-1
. The effective charge normalized free energy
of binding, that is the average energy of each binding group-heparin interaction
(∆𝐺𝑏𝑖𝑛𝑑𝑒𝑓𝑓
/Qeff), was therefore calculated as –1.68 (± 0.19) kcal mol-1
. In the presence of
salt, 32 of the 96 cationic charges (33%) shared the effective free energy of
binding -65.0 (± 1.6) kcal mol-1
, with each charge therefore contributing –2.03 (± 0.08)
kcal mol-1
. These data suggest not only that the C22G1DAPMA aggregates are larger in
the presence of 150 mM NaCl, but also that each individual binding charge within the
assembly interacts with heparin in a more efficient manner. As discussed in Chapter 3,
the employment of each binding charge in protamine is relatively inefficient in
comparison.

Chapter 4 – SAMul Binders I: DAPMA
132
Figure 4.5 – Atomistic models of self-assembled C22G1DAPMA (top) or protamine
(bottom) binding heparin in absence (left) and presence (right) of 150 mM NaCl.
Table 4.3 – Modelling interpretations of effective charges per binder (Qeff), effective
free binding energy (∆𝐺𝑏𝑖𝑛𝑑𝑒𝑓𝑓
) and effective charge-normalised free energy of binding
(∆𝐺𝑏𝑖𝑛𝑑𝑒𝑓𝑓
/Qeff) for C22G1DAPMA and protamine.
Simulation Conditions Qeff ∆𝑮𝒃𝒊𝒏𝒅
𝒆𝒇𝒇
/ kcal mol-1
∆𝑮𝒃𝒊𝒏𝒅𝒆𝒇𝒇
/Qeff
/ kcal mol-1
0 mM NaCl
C22G1DAPMA (18 ± 2) −(30.2 ± 1.0) −(1.68 ± 0.19)
Protamine (10 ± 1) −(2.60 ± 0.30) −(0.26 ± 0.04)
150 mM NaCl
C22G1DAPMA (32 ± 1) −(65.0 ± 1.6) −(2.03 ± 0.08)
Protamine (12 ± 1) −(3.96 ± 0.41) −(0.33 ± 0.04)
One of the limitations of the molecular dynamics simulations is that in each case only
one single binder molecule and one single heparin polysaccharide can be studied
together, and this situation is of course not totally representational of reality. Simulation
of the true solution phase picture would involve representing interactions between each
single C22G1DAPMA assembly and multiple heparin chains, which is prohibitively
computer-time-intense. In lieu of this, dynamic light scattering (DLS) was employed to
probe the aggregate size in solution at different binder:heparin ratios. DLS studies were
carried out in collaboration with Dr Marcelo Calderon at Freie Universität Berlin,
Germany. As shown in Table 4.4, as the relative amount of heparin to C22G1DAPMA is

Chapter 4 – SAMul Binders I: DAPMA
133
increased, the aggregate sizes in solution also increased. This observation supports the
proposal that individual binder micelles interact with multiple heparin polysaccharide
chains. Such aggregation processes are well known when protamine binds heparin.264,265
Table 4.4 – DLS sizes observed for C22G1DAPMA in the absence and presence of
different amounts of heparin.
Concentration
/ mg mL-1 Molar Ratio
Diameter / nm
Polydispersity Index (PDI)
Heparin 0.33 - 8.7 0.316
C22G1DAPMA 1 - 9.0 0.641
C22G1DAPMA + Heparin - 0.1 : 1 13.0 0.276
C22G1DAPMA + Heparin - 0.5 : 1 68.9 0.155
C22G1DAPMA + Heparin - 1 : 1 Too big -
4.2.1.3 Studying Self-Assembly Effects
To this point, the multivalent binding of C22G1DAPMA has been assumed to be the
result of a self-assembly event producing the cationic heparin binding ligand array
cartooned earlier in Figure 4.2. In an attempt to prove this, a non-assembling negative
control molecule was synthesised. Specifically, as shown in Scheme 4.1, a propyne-
functionalised intermediate, generated during the preparation of C22G1DAPMA, was
subjected to a Boc-deprotection using HCl gas in methanol to afford partial binder
PG1DAPMA 4.1 in a good yield, with no additional requirement for purification. The
disappearance of characteristic signals at 1.40 ppm in 1H and 79 ppm and 28 ppm in
13C
NMR spectra respectively confirmed effective removal of the protecting group.
Compound 4.1 was expected to mimic the monomeric ligand array of individual
C22G1DAPMA molecules and therefore provide a suitable comparison against the self-
assembling system.
Scheme 4.1 – Preparation of negative control molecule PG1DAPMA.

Chapter 4 – SAMul Binders I: DAPMA
134
PG1DAPMA was tested for heparin binding ability using the Mallard Blue heparin
binding assay in salt and buffer and was shown to be unable to displace MalB to any
significant extent. The respective performances of PG1DAPMA, C22G1DAPMA and
protamine can be seen in the heparin binding curves plotted in Figure 4.6.
Figure 4.6 – Heparin binding curves for PG1DAPMA, C22G1DAPMA and protamine
from MalB heparin binding assay.
These data confirm the previous observation that self-assembly of C22G1DAPMA
drives the multivalent heparin binding interactions as suggested by the earlier TEM
images, Figure 4.3, where the observed integrated nanostructure appeared to contain
intact micelles. Similarly, a new experimental determination of the C22G1DAPMA
CAC in the presence of heparin demonstrated aggregate formation was not prevented by
the presence of the polysaccharide, although the CAC value did increase to ca. 14 µM
suggesting some micelle destabilisation may have occurred. Nonetheless, aggregation of
C22G1DAPMA in the presence of heparin was clearly evident.
4.2.2 Heparin Binding in Clinically Relevant Conditions
4.2.2.1 Heparin Binding in Serum
Having demonstrated the ability of C22G1DAPMA to bind heparin more efficiently than
protamine under electrolytically competitive conditions, the next challenge was to
examine performance under more biologically relevant conditions. To do this,

Chapter 4 – SAMul Binders I: DAPMA
135
C22G1DAPMA was tested using the previously described Mallard Blue assay with
heparin delivered in 100% human serum. The data are shown in Table 4.5.
Table 4.5 – Heparin binding data from MalB assay with heparin delivered in 100%
human serum.
Compound EC50 / μM CE50 Dose
mg/100IU
PG1DAPMA Binding too weak
C22G1DAPMA (25.9 ± 1.6) (0.96 ± 0.06) (0.79 ± 0.05)
Protamine (3.51 ± 0.12) (0.79 ± 0.03) (0.49 ± 0.02)
The data show that in the presence of serum, the binding efficiency of both protamine
and C22G1DAPMA decreased, although of these two systems, protamine was least
adversely affected. The CE50 of protamine increased from 0.52 (± 0.05) in the absence
of serum to 0.79 (± 0.03) in its presence, and this performance difference can be
somewhat accounted for by consideration of off-target interactions, for example
between protamine and charged patches on serum proteins. Relatively, C22G1DAPMA
was affected to a greater extent with CE50 increasing from 0.28 (± 0.05) to 0.96 (±
0.06). Clearly, serum exerted a more disruptive effect on the ability of C22G1DAPMA
to bind heparin in a multivalent manner than it did for protamine. A likely explanation
could be the disruption of the micellar binding arrays by hydrophobic serum
components such as albumin or globulin proteins.308-310
Interestingly, C22G1DAPMA
may inadvertently be well optimized for disruption by serum as long straight alkyl
chains are known to interact effectively with albumins, and interaction of the
hydrophobic unit in this way could be envisaged as ‘pulling monomers out’ of the
micellar ligand array.311
In order to probe this disruption mechanism, attempts were
made to saturate serum albumin binding sites by introduction of 1-docosanol prior to
carrying out the heparin binding assay although the insolubility of the fatty alcohol
made these attempts unsuccessful.
The heparin binding performance of C22G1DAPMA was found to be acutely sensitive
to the presence of serum. For example, as shown in Figure 4.7, the disruptive effects of
heparin delivery in 0 – 10% human serum were roughly linear when delivered into a
cuvette containing a fixed amount of binder. Interestingly, the disruption caused by

Chapter 4 – SAMul Binders I: DAPMA
136
delivery in 10% human serum found to be broadly equivalent to that when heparin was
delivered in 100% human serum.
Figure 4.7 – Measured absorbance for heparin delivered into solution of
C22G1DAPMA at a (+ : –) = 0.67 in 0 – 10 % human serum.
Whilst the micellar assemblies of C22G1DAPMA appeared to be somewhat disrupted in
the presence of serum, the inability of PG1DAPMA to displace MalB from heparin
under these conditions, Table 4.5, nonetheless suggested that a significant amount of
C22G1DAPMA assemblies remained intact, or in other words, self-assembly was not
being completely switched-off by the presence of serum. In order to examine this
further, our collaborators led by Dr Marcelo Calderon at Freie Universität Berlin,
Germany, used dynamic light scattering (DLS) to monitor the size of a binder-heparin
complex over time in the presence of albumin. As shown in Table 4.6, the aggregates
decreased in size over time, suggesting some destabilization of the assemblies occurred,
but the aggregates clearly did not completely disassemble and heparin binding was not
completely switched-off. This retention of heparin binding ability, as indicated by
successful displacement of 50% MalB during the assay motivated us to test
C22G1DAPMA under even more challenging clinically relevant conditions.

Chapter 4 – SAMul Binders I: DAPMA
137
Table 4.6 – DLS sizes observed for C22G1DAPMA-heparin aggregates in the absence
and presence of albumin (1 mg mL-1
) over time.
C22G1DAPMA Molar Ratio
Diameter / nm
Polydispersity Index (PDI)
+ Heparin 0.5 : 1 68.9 0.155
+ Heparin + albumin 0.5 : 1 62.6 0.272
+ Heparin + albumin (after 30 min) 0.5 : 1 55.9 0.220
4.2.2.2 Plasma Clotting Assays
Despite being more adversely affected through disruption by hydrophobic serum
components than covalent protamine, the non-covalent assemblies of C22G1DAPMA
still exhibited impressive heparin binding ability (CE50 < 1). Combined with the other
advantages of a SAMul approach, this suggested clinical potential. To that end,
C22G1DAPMA was tested for its ability to neutralise heparinized plasma samples.
As insightful as the plethora of available heparin binding assays can be, the ultimate test
of a potential heparin rescue agent is its ability to reverse the anti-coagulant effect of
heparin in a clinically relevant sample. Plasma clotting assays such at the PT assay,
which monitors the prothrombim clotting time of the ‘extrinsic’ clotting pathway
originating from tissue damage, and the aPTT assay, which monitors the activated
partial thromboplastin time of the ‘intrinsic’ clotting pathway originating from surface
contact trauma are two widely employed clinical assays.312
Practically, each of these
assays involves measuring the time taken for a heparinized sample of plasma, which is
extracted from blood by centrifugation in the clinic, to clot. A longer clotting time is
indicative more anti-coagulation and higher heparin levels. For the present study,
C22G1DAPMA was tested in each of these assays for its ability to reverse anti-
coagulation. These experiments were carried out in the laboratory of Professor Jeremy
Turnbull at University of Liverpool, UK.
Firstly, a sample of human plasma was taken and allowed to clot in the absence of
heparin or binder. The sample clotted in 35.7 (± 0.7) seconds in the aPTT assay and
12.8 (± 0.8) seconds in the PT assay. When this procedure was repeated in the presence
of heparin, clotting was not observed in either assay as heparin exerted its anticoagulant

Chapter 4 – SAMul Binders I: DAPMA
138
effect. C22G1DAPMA was then introduced into these samples at an appropriate dose
and clotting was re-established, indicating functional heparin reversal. Practically,
samples in the aPTT assay contained 2.5 units of heparin and those in the PT assay
contained 5 units, while both assays had C22G1DAPMA dosed at 0.79 mg/100IU. The
results are shown in Table 4.7.
Table 4.7 – Plasma clotting data for C22G1DAPMA in aPTT and PT assays.
Compound Clotting Time / s
aPTT Assay PT Assay
Plasma only (35.7 ± 0.7) (12.8 ± 0.8)
+ Heparin No clot No clot
.+ C22G1DAPMA (81.8 ± 4.6) (13.1 ± 0.4)
The heparin rescue performance of C22G1DAPMA in these clinically relevant heparin
neutralization assays is highly significant. In particular, the re-establishment of a
clotting time of ca. 13 seconds in the PT assay indicates full heparin neutralization,
while the slight extension of the clotting time in the aPPT assay may be an artefact of
the previously observed disruption of the SAMul system by plasma components such as
albumins. Importantly, despite this perturbation of the binding nanostructures, they
remained operational in reversing the anti-coagulant effect of heparin. Clearly, if the
stability of the nanostructures in the presence of serum can be enhanced, SAMul
systems such as C22G1DAPMA could have high clinical potential as functional heparin
rescue agents.
4.2.3 Degradation Studies
Heparin binding ability is not the only important consideration when designing a
heparin rescue agent of clinical relevance. Degradability and the potential for toxicity
are important factors. As mentioned in the introduction to this Chapter, degradation of
SAMul nanostructures can occur either through straightforward disassembly of the
nanoparticles or through triggered bond cleavage. An ester group was specifically
designed into the central linker unit of C22G1DAPMA as previous work from the groups
of Smith68,69
and Fréchet313-315
had established ester hydrolysis as an effective way of
achieving temporary multivalency and minimizing the biopersistence of multivalent
ligand arrays. Hydrolysis of the ester linkage in C22G1DAPMA was expected to

Chapter 4 – SAMul Binders I: DAPMA
139
disconnect the hydrophobic and hydrophilic regions thereby negating self-assembly and
‘switching off’ the multivalent ligand array.
The degradation of C22G1DAPMA was probed using two complementary approaches.
4.2.3.1 Nile Red Release Assays
To probe the disassembly of C22G1DAPMA, a Nile Red (NR) release assay was carried
out. NR is a fluorescent hydrophobic dye, which exhibits high fluorescence output when
dissolved or encapsulated in a hydrophobic environment such as the interior of a
micelle, while fluorescence is readily quenched in aqueous conditions.
Practically, a solution of C22G1DAPMA was made up at a concentration above the
CAC – namely 50 µM – and an aliquot of NR was added. Following irradiation at 550
nm, the fluorescence intensity at 635 nm was measured at short time intervals over a 35
hour period to afford the degradation curve represented by solid circles in Figure 4.8.
Figure 4.8 – Fluorescence intensity of NR in PBS buffer over time in the presence of
C22G1DAPMA in the absence (solid circles) and presence (open circles) of heparin.
The degradation curve indicated that NR was released from the C22G1DAPMA
assemblies with a half-life of approximately 7 hours in PBS buffer, although it is not
possible to state unequivocally whether NR release is due to micelle disassembly,
molecular degradation, or a combination of both. Interestingly, and importantly, when
the experiment was repeated in the presence of heparin, NR release was significantly

Chapter 4 – SAMul Binders I: DAPMA
140
retarded with the micelles appearing to remain almost completely intact after 24 hours.
This outcome suggested NR release in the absence of heparin may be caused primarily
by molecular degradation, as this would correlate with the previously mentioned works
of Smith and Fréchet. Specifically, interaction of the surface binding groups with
heparin can be thought of as ‘tying up’ the arms of C22G1DAPMA, preventing them
folding back on themselves to intramolecularly catalyse the hydrolysis of the ester
group, thereby leading to the enhanced stability and retention of NR in the presence of
heparin.
This degradation profile is pharmacologically interesting as once C22G1DAPMA has
established interactions with heparin, thereby neutralizing anticoagulancy, the complex
formed appeared to remain stable. This would permit the binder-heparin aggregates to
be metabolized as one species, potentially in a similar process to that of heparin-
protamine aggregates.316
Meanwhile, excess C22G1DAPMA would degrade, thereby
limiting biopersistence and toxicity.
Heparin re-bound is a widely acknowledged problem associated with heparin therapy,
and particularly heparin rescue, whereby the release of plasma-protein-bound heparin
back into the systemic bloodstream confers a second anticoagulation event, some time
after initial neutralization.109
Although used clinically, protamine is not well suited for
dealing with heparin re-bound owing to its rapid in vivo half-life of ca. 8 minutes.104
Consequently, in the event of re-bound, a second protamine dose is often required as the
toxicity problems associated with a larger initial dose preclude this ‘front-loading’
approach being an option.103,104
A ca. 7 hour half-life of unbound C22G1DAPMA may
offer a suitable compromise between minimising overall biopersistence of cationicity
and remaining present long enough to deal with any potential heparin rebound events,
however it should be noted that the half-life of C22G1DAPMA in vivo may be
significantly shorter than 7 hours due to the increased competition and effects of
shear/flow processes. Despite conjecture in the literature, considerations of heparin re-
bound remain important.106,108
4.2.3.2 Mass Spectrometric Studies
To confirm that NR release over time was due to molecular degradation, a mass
spectrometric degradation assay was carried out with the aim of identifying the
evolution of molecular species over time. Practically, mass spectra of C22G1DAPMA

Chapter 4 – SAMul Binders I: DAPMA
141
were obtained in the presence of a Gly-Ala dipeptide internal standard before and after
incubation at 37°C for 24 hours.69
Degradation events were revealed through
comparison of the relative amounts of different species against the non-degradable
internal standard. The molecular species of interest, along with some example spectra
are shown in Figure 4.9.
As shown in Figure 4.9, at time zero, the molecular ions associated with C22G1DAPMA
(m/z = 433 [M]2+
and 289 [M]3+
) could be seen, along with some evidence of ester
hydrolysis (alcohol, m/z = 408 [M]1+
; carboxylic acid, m/z = 239 [M]2+
). After 24 hours,
the molecular ions for intact C22G1DAPMA had completely disappeared and the peaks
for the ester hydrolysis products were dominant, along with a new signal corresponding
to decarboxylation of the carboxylic acid hydrolysis product (m/z = 217 [M]2+
). These
data show degradation of C22G1DAPMA occurs under biologically relevant aqueous
conditions at pH 7, and support the NR released in the previous assay being due to a
triggered disassembly event induced by molecular degradation rather than an
independent disassembly event.
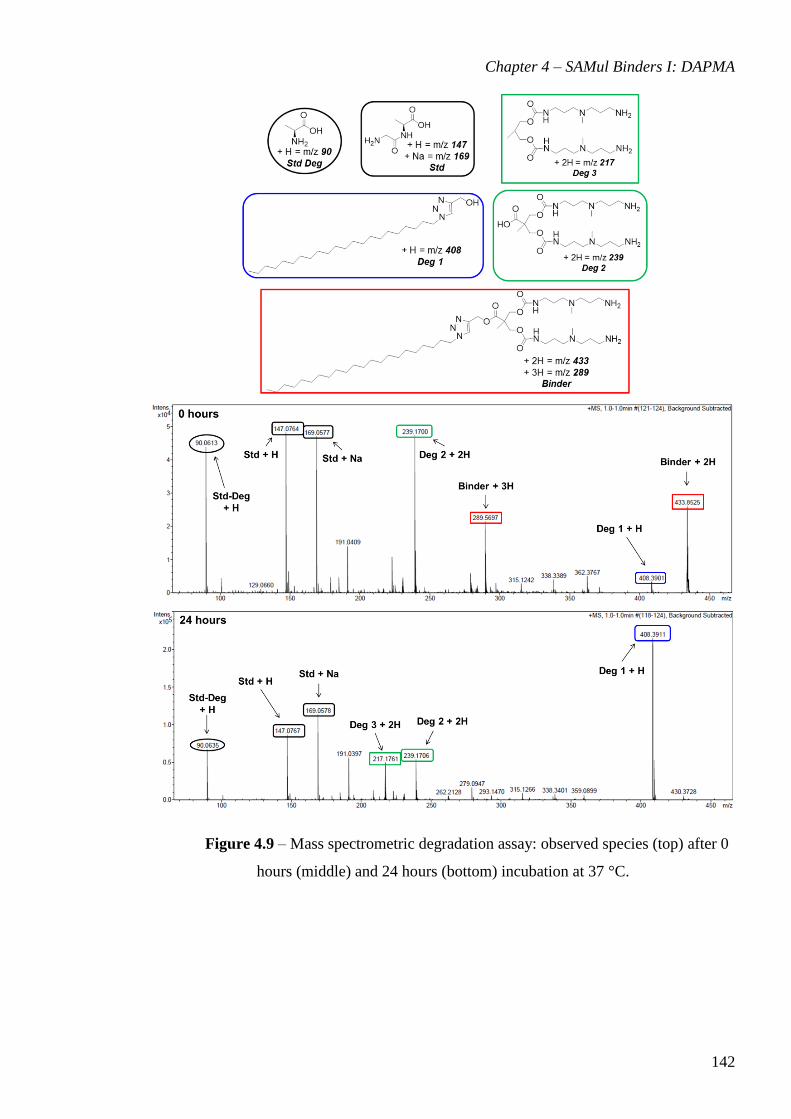
Chapter 4 – SAMul Binders I: DAPMA
142
Figure 4.9 – Mass spectrometric degradation assay: observed species (top) after 0
hours (middle) and 24 hours (bottom) incubation at 37 °C.

Chapter 4 – SAMul Binders I: DAPMA
143
4.3 Conclusions and Future Work
Following the preliminary studies from Smith and co-workers,211
the heparin binding
ability of self-assembling system C22G1DAPMA was studied in the presence of more
competitive and biologically relevant conditions using the Mallard Blue heparin binding
assay. The results showed that introducing competitive electrolytes such as 150 mM
NaCl to the system increased the apparent heparin binding efficiencies of both
C22G1DAPMA and protamine. The performance improvement of the SAMul system
over-and-above that of protamine was especially noteworthy. Molecular dynamics
modelling revealed that introduction of salt into the assay triggered an enlargement of
the self-assembled nanosystems formed by C22G1DAPMA, leading to an increased
number of monomer units coming together to form each aggregate and, consequently,
an increase in the number of cationic binding groups expressed at each assembly
surface. Experimental DLS studies corroborated these suggestions by characterising
larger aggregates in the presence of salt.
The C22G1DAPMA system was also tested for heparin binding in the presence of
human serum, where the relative performance was shown to decrease somewhat,
becoming inferior to that of protamine. Hydrophobic serum components such as
albumin proteins were shown to interfere with the aggregation and performance of
C22G1DAPMA to some extent although, significantly, control experiments
demonstrated the self-assembled nanosystem remained intact to some extent, as a non-
self-assembling control molecule was unable to interact with heparin in the presence (or
indeed absence) of serum.
Despite this disruption by serum proteins, C22G1DAPMA was shown to be effective at
reversing the anticoagulant effect of heparin in clinically relevant PT and aPTT plasma
clotting assays. This heparin neutralization performance is highly significant given the
non-covalent nature of C22G1DAPMA assemblies, and the attractive advantages over
similarly-sized covalent structures that this approach brings; for example, the relative
simplicity of synthesis.
In a final set of experiments, a Nile Red release assay was used to show that
C22G1DAPMA degraded over a clinically interesting time scale, with a half-life of ca. 7
hours. The same assay also demonstrated that the presence of heparin stabilized the

Chapter 4 – SAMul Binders I: DAPMA
144
assemblies, making the overall degradation process potentially more appealing from a
heparin re-bound perspective than protamine. A further mass spectrometric assay
indicated degradation occurred through hydrolysis of the linker unit ester groups,
validating the molecular design, and leading to disconnection of the hydrophobic and
hydrophilic regions of binder molecule. Ultimately, this led to the desired ‘switching-
off’ of self-assembled multivalency.
Future work in this area will focus on enhancing the stability of the self-assemblies
formed in the presence of serum. This could be achieved by increasing the
hydrophobicity of the aliphatic unit by, for example, introducing branching or dendritic
character into the alkyl chain. Alternative approaches could target bio-derived
hydrophobic units such as cholesterol-like steroid units or bile acids. Choosing a
hydrophobic unit of biological origin may additionally reduce the potential for toxicity
from the degradation products. Variation of the hydrophobic unit will additionally
impact upon the geometry of the binder molecule, which may in turn affect the
morphology of the assembly formed. Other modifications could include variation of the
surface binding groups to examine the effects of different cationic ligands on heparin
binding performance. Careful selection of the appropriate building blocks may permit
both stability and morphology effects on SAMul heparin binders not only to be probed
but also optimised.
Chapter 5 – SAMul Binders II: Lysine
145
5 Self-Assembling Multivalent Heparin Binders II:
Lysine-containing systems
5.1 Introduction
The use of a self-assembled multivalent approach to binding biological targets has many
advantages. As exemplified in Chapter 4, a SAMul approach allows: (i) the heparin
binding ligand array to be generated spontaneously as a consequence of molecular self-
assembly; (ii) the individual building blocks to be relatively small and ‘drug-like’, well-
defined and easy-to-make; (iii) the SAMul activity to be switched off through
disassembly which in turn can be triggered by predictable degradation of the individual
building blocks. A further key advantage of this approach is that the system is highly
tunable, making it relatively straightforward to change the heparin binding properties of
the system, for example through simple synthetic modification of the surface groups.
Following on from the C22G1DAPMA SAMul system presented in Chapter 4, it was
decided to further investigate the success of this approach by modifying the molecular
building blocks used. In particular, increasing the biomimetic character of the system
became an aim with the hydrophilic heparin binding DAPMA groups identified as a
potential region for modification. Much like in the design of Mallard Blue in Chapter 2,
the manner in which proteins establish strong interactions with heparin was
considered.82
From this consideration, the amino acid lysine was selected as a suitable
alternative surface group to use in place of DAPMA.
Much like DAPMA, lysine is able to interact effectively with heparin due to the two
cationic charges within its structure. Alongside arginine – another cationic amino acid –
lysine is present in a wide array of heparin binding proteins, including protamine.82,100
This known heparin binding ability has led to lysine been incorporated into several
noteworthy attempts to develop novel heparin rescue agents. For example, work on
calix[8]arene systems by Cunsolo and co-workers, and foldamer systems in the group of
DeGrado both demonstrated lysine to be amongst the most effective heparin binding
groups studied.200,202
Within our system, the incorporation of an amino acid such as
lysine in place of DAPMA may also reduce the potential for toxicity within our system,
as well as tuning heparin binding performance.

Chapter 5 – SAMul Binders II: Lysine
146
In order for both lysine amine groups to be available for interaction with heparin in the
final SAMul construct, the entire building block required a modest structural redesign.
Specifically, the functional group connecting the surface group to the rest of the binder
molecule was modified from a carbamate to an ester. This change was expected to
increase the (bio)degradability of the system, potentially enhancing the pharmacological
appeal of the system.
As an amino acid, lysine also introduced a new variable to our SAMul approach which
was not present within C22G1DAPMA: chirality. It was reasoned that chirality could
prove to be an interesting property for this study as the binding target heparin is itself
chiral. As mentioned in Chapter 1, the heparin polysaccharide is composed primarily of
an α-1,4-linked D-glucosamine–L-iduronic acid disaccharide repeat unit and, indeed, the
investigation of chirality effects with heparin is not new.317
Previous studies have shown
heparin to be able to discriminate between a variety of chiral substrates. For example,
several groups have used heparin as a chiral additive in capillary electrophoresis to
enantiomerically separate underivatised drugs such as anti-malarials and anti-
histamines.318-320
It was proposed that heparin was able to chirally discriminate in this
way due to a combination of ionic, hydrogen bonding and hydrophobic interactions with
a specific arrangement of nitrogen containing aromatic heterocyclic or ionisable
substituents.318
Other, more recent studies from the group of Rabenstein, showed a
sequence of exclusively D amino acids interacted with heparin in exactly the same
manner as the corresponding sequence of L amino acids.321,322
It was suggested that the
specific spatial arrangement of lysine and arginine residues in this peptide sequence
promoted heparin interaction, rather than the presence of an enantiomerically
complementary structure to heparin.321
Despite these studies, to the best of our knowledge, there has been no study in which the
chirality of the heparin binding system was expressed at the surface of a self-assembled
nanostructure. Indeed, there are no examples in which chirality effects in the binding of
self-assembled nanostructures have been explored. To investigate this new area through
the use of a more biomimetic SAMul design, an initial pair of lysine-containing target
molecules was identified for synthesis. These target molecules, C22G1LLys and
C22G1DLys, are shown in Figure 5.1.

Chapter 5 – SAMul Binders II: Lysine
147
Figure 5.1 – Target molecules C22G1LLys, C22G1DLys.
5.2 Generation 1 Systems
5.2.1 Synthesis of C22G1LLys and C22G1DLys
The synthesis of the first generation (G1) structures C22G1LLys and C22G1DLys was
achieved in a convergent manner. For the purposes of synthesis, the binder molecules
were broken up into three segments – the aliphatic tail, ester-rich linker unit and lysine
surface group, Figure 5.2 – which were each prepared separately. The linker unit was
then functionalized with two suitably-protected lysine surface groups before the
aliphatic tail was installed to afford, after removal of the remaining protecting groups,
the binder target molecules. A negative control molecule lacking hydrophobic
functionalisation was also synthesised to allow the effects of self-assembly to be
quantified for our new system.
Figure 5.2 – The three distinct components of G1 target molecules C22G1LLys and
C22G1DLys, where ‘PG’ represents a protecting group.
5.2.1.1 Preparation of the aliphatic tail211
In line with the previous work described in Chapter 4, the hydrophobic unit of the new
target molecules took the form of a twenty-two carbon n-alkyl chain. The same
methodology applied in the preparation of C22G1DAPMA was used here to prepare the
hydrophobic unit for connection to the binder scaffold. Specifically, as shown in
Scheme 5.1, commercial fatty alcohol 1-docosanol (aka. behenoyl alcohol) was reacted
with methanesulfonyl chloride in the presence of triethylamine to produce mesylate 5.1
in a good yield, characterized by the appearance of a methyl signal at 3.00 ppm in the

Chapter 5 – SAMul Binders II: Lysine
148
1H NMR spectrum. Refluxing 5.1 with sodium azide in DMF successfully transformed
the alkyl-mesylate into the desired 1-azidodocosane (aka. behenoyl azide) 5.2 in a good
yield with no need for further purification. Once in hand, species 5.2 was ready for
connection to the rest of the binder scaffold at a later stage using copper(II) mediated
click chemistry.
Scheme 5.1 – Synthesis of alkyl hydrophobic tail unit.
5.2.1.2 Preparation of the lysine surface group
Lysine possesses two primary amine groups and a carboxylic acid within its structure.
In order to facilitate connection of the lysine carboxylic acids to the alcohol termini of
the linker unit, the amine groups required suitable protection to avoid unwanted side
reactions such as lysine polymerization. The tert-butyloxycarbonyl (Boc) protecting
group was identified as suitable owing to its acid-lability, as its removal in the final step
would not expose the ester linkages present in the final binder molecule to nucleophilic
or basic conditions. This protection strategy for lysine is well-known and has been
widely utilised previously by, amongst others, Smith and co-workers.323,324
As shown in
Scheme 5.2, LLys(Boc)2 5.3 or DLys(Boc)2 5.4 can be prepared in a good yield by
treatment of lysine with di-tert-butyl-dicarbonate and sodium hydroxide in THF/water.
Scheme 5.2 – Preparation of LLys(Boc)2 or DLys(Boc)2.
The lysine carboxylic acid group was then activated to increase its reactivity to
nucleophilic attack. This activation was found to be necessary as when not activated,

Chapter 5 – SAMul Binders II: Lysine
149
reaction with the alcohol termini of the linker unit was found to be extremely slow or in
some cases non-existent. For example, DCC-mediated, TBTU-mediated and general
base-catalysed esterification conditions were all unable to successfully furnish the linker
unit with lysine surface groups 5.3 or 5.4. N-hydroxysuccinimide was chosen as a
suitable activating group and installed in a good yield through reaction with DCC in
DMF to produce activated lysine species 5.5 and 5.6, which were then carried forward
in the synthesis.
5.2.1.3 Preparation of G1 linker group
The linker unit is derived from the commercial starting material 2,2-
bis(hydroxymethyl)propionic acid (aka. bis-MPA). Ultimately, the lysine surface groups
were connected to the alcohol functionalities of bis-MPA but, initially, the carboxylic
acid of bis-MPA had to be converted to an alkyne to prepare the molecule up for
installation of the aliphatic tail via ‘click’ methodology. To do this, the methodology of
Sharpless and Hawker was applied.325
Firstly, the two alcohol groups of bis-MPA were
protected as acetal 5.7 in a moderate yield using 2,2-dimethoxypropane in the presence
of a p-toluenesulfonic acid catalyst and acetone. The appearance of two methyl signals
at 1.45 and 1.41 ppm in the 1H NMR spectrum indicated successful protection. The
remaining carboxylic acid functionality of 5.7 was then coupled to another molecule of
itself using DCC to mediate the process and generate the more reactive symmetric
anhydride 5.8 in a reasonable yield. Anhydride 5.8 was promptly reacted with propargyl
alcohol to afford propyne-functionalised species 5.9 in a near-quantitative yield.
Appearance of a 1H NMR triplet signal at 2.47 ppm indicated successful installation of
the alkyne functionality. Subsequent deprotection of 5.9 under acidic condition unveiled
the alcohol groups in a good yield to afford desired linker 5.10. The synthetic scheme is
shown in Scheme 5.3.

Chapter 5 – SAMul Binders II: Lysine
150
Scheme 5.3 – Synthetic scheme for preparation of G1 linker unit.325
5.2.1.4 Connecting the pieces
With the three components of the binder in hand, connection could now proceed.
Firstly, lysine-succinimide-ester 5.5 or 5.6 was coupled to G1-linker 5.10 in a base
catalysed esterification reaction to generate protected partial-binder 5.11 or 5.12
respectively in a reasonable yield, after purification by gel permeation chromatography
in 95:5 DCM:methanol. At this stage, a small amount of L-partial binder 5.11 was
deprotected using HCl gas in methanol to afford negative control molecule 5.13 for use
as a self-assembly comparison tool in subsequent studies. Next, the hydrophobic azide-
containing building block was introduced into the system. The pre-prepared 1-
azidodocosane 5.2 was reacted with alkyne functionalized components 5.11 or 5.12 in a
copper(II) catalysed ‘click’ reaction to generate the still-protected final binders
molecules 5.14 and 5.15 in good yields, after purification by gel permeation
chromatography in 100% DCM. The appearance of a 1H NMR signal at 8.06 ppm was
diagnostic of presence of the 1,2,3-triazole moiety. In a final step, the acid-labile Boc-
protecting groups were removed in an excellent yield using HCl gas in methanol to
afford the target molecules C22G1LLys 5.16 and C22G1DLys 5.17. The synthetic scheme
showing the connection of the component units is shown in Scheme 5.4.

Chapter 5 – SAMul Binders II: Lysine
151
Scheme 5.4 – Synthetic scheme showing connection of the component parts to generate
PG1LLys, C22G1LLys and C22G1DLys.
With the two target molecules in hand, circular dichroism spectroscopy was used to
probe the chiral character of the final products to ensure amino acid chirality had been
successfully preserved throughout the synthesis. As can be seen in Figure 5.3, at
concentrations of 10 mM, the molar ellipticity for the two systems is effectively equal
and opposite. This indicates that the two target molecules are of approximately equal
enantiopurity, and crucially that chirality has not been scrambled during synthesis.

Chapter 5 – SAMul Binders II: Lysine
152
Figure 5.3 – Circular dichroism spectra of target molecules C22G1LLys and C22G1DLys
(10 mM in methanol) indicating opposing chirality.
Now in hand, the G1 target molecules were interrogated for their ability to self-
assemble into nanosized aggregates and subsequently bind heparin.
5.2.2 Self-Assembly Studies
5.2.2.1 Nile Red Data
The amphiphilic design of the G1 lysine-containing systems should promote molecular
self-assembly in aqueous conditions. The hydrophobic aliphatic units are expected to
assemble together on the interior of the formed aggregate, leading to the heparin binding
groups being displayed at the surface. In order to experimentally probe this, and to
determine an approximate critical aggregation concentration (CAC), a Nile Red (NR)
encapsulation assay was used. NR is a hydrophobic dye, Figure 5.4, which exhibits a
fluorescence signal at 635 nm following irradiation at 550 nm.326
When ‘free’ in
aqueous solution, this NR fluorescence signal is readily quenched, for example by
nearby solvent molecules, while when solubilized in a hydrophobic environment, such
as the interior of a micelle, the signal remains intense. As the concentration of self-
assembling material C22G1LLys or C22G1DLys increases across a titration range, the
point at which aggregates form is indicated by a sharp rise in fluorescence intensity (If)

Chapter 5 – SAMul Binders II: Lysine
153
at 635 nm.The Nile Red encapsulation assay has been widely used in this manner by,
amongst others, the groups of Smith211
and Lee.327
Figure 5.4 – Chemical structure of hydrophobic dye probe, Nile Red (NR)
The data from the NR encapsulation assay for PG1LLys, C22G1LLys and C22G1DLys
are shown numerically in Table 5.1 and graphically in Figure 5.5.
Table 5.1 – Nile Red encapsulation assay data for PG1LLys, C22G1LLys and
C22G1DLys.
G1 Systems CAC / μM
P-G1-L-Lysine N/A
C22-G1-L-Lysine (29 ± 9)
C22-G1-D-Lysine (27 ± 13)
Figure 5.5 – Nile Red encapsulation curves for C22G1LLys and C22G1DLys.
Both C22G1LLys and C22G1DLys were able to assemble into nanostructures at ca. 28
µM. When compared directly against C22G1DAPMA in Chapter 4 (CAC of ca. 4 µM),
it can be seen that these lysine-containing systems have higher CAC values. This may
suggest that the increased size-in-space of the lysine residues at the surface somewhat
hinders the formation of the assembly. Additionally, the lysine-containing systems may
form assemblies composed of a greater number of individual monomer building blocks
than the DAPMA system. Nonetheless it is clear from the data that chirality does not
have any meaningful impact on CAC values observed for these systems, and nor would
it be expected to, given that chirality should only influence the ‘handedness’ of the
Chapter 5 – SAMul Binders II: Lysine
154
resulting assemblies, rather than the specifics of formation/morphology. Importantly,
the negative control molecule PG1LLys was unable to assemble up to concentrations of
1 mM, demonstrating the self-assembly process is indeed driven by the amphiphilic
nature of the structure conferred by the presence of the aliphatic tail.
The data in Table 5.1 are calculated from three runs of this self-assembly assay, with
error values reported as one standard deviation of the triplicated data. These relatively
large error values are thought to arise from a degradation event occurring on the
timescale of the assay. This is discussed further in Section 5.2.5.
Whilst the NR encapsulation data convincingly suggests C22G1LLys and C22G1DLys
self-assemble in aqueous solution, the data are unable to provide information about the
size or morphology of the assemblies formed. To that end, TEM imaging was carried
out.
5.2.2.2 TEM Images
Transmission Electron Microscopy (TEM) imaging was used in order to observe the
self-assembled morphologies of C22G1LLys and C22G1DLys. For the purpose of
imaging, solutions were prepared at concentrations of 200 µM (i.e. above [CAC]) to
ensure binders were present in their assembled form. Each binder was also imaged in
the presence of heparin. Heparin was introduced to the samples at a charge ratio (+ : –)
of 2 as, under this concentration regime, both binders exhibited significant interaction
with heparin, see section 5.2.3. Once prepared, aliquots of each solution were loaded on
a formvar grid, negatively stained with uranyl acetate and allowed to dry before
imaging. Solutions were prepared in clean water as the presence of buffer or other
electrolytes are known to interfere with the imaging process. The images for C22G1LLys
in the absence and presence of heparin are shown in Figure 5.6 and Figure 5.7
respectively, while the equivalent images for C22G1DLys are shown in Figure 5.8 and
Figure 5.9 respectively. The observations are discussed below.

Chapter 5 – SAMul Binders II: Lysine
155
Figure 5.6 – TEM image of 200 µM C22G1LLys (scale bar: 50 nm).
Figure 5.7 – TEM image of 200 µM C22G1LLys in the presence of heparin (scale bar:
100 nm).

Chapter 5 – SAMul Binders II: Lysine
156
Figure 5.8 – TEM image of 200 µM C22G1DLys (scale bar: 50 nm).
Figure 5.9 – TEM image of 200 µM C22G1DLys in the presence of heparin (scale bar:
100 nm).
As can be seen in both Figure 5.6 and Figure 5.8, each of the binders C22G1LLys and
C22G1DLys assemble into small spherical objects which decorate the grid in a uniform
manner. This is suggestive of micellar aggregation similar to that seen for the DAPMA
system in Chapter 4. Each aggregate has an approximate diameter of ca. 7 nm, which is
comparable to the size of the earlier system. In the heparin-containing samples shown in
Figure 5.7 and Figure 5.9, the larger shaped objects are assigned to be integrated binder-

Chapter 5 – SAMul Binders II: Lysine
157
heparin aggregates, with the smaller, spherical patterning recognized as the SAMul
binders distributed throughout the heparin chains. There are clearly some meaningful
interactions between the heparin and nanoscale binder assemblies as the micelles appear
organized into a pattern not dissimilar to the beads-on-a-string motif previously
observed by Smith and co-workers.211
One of the limitations of using TEM to characterize the morphology of the SAMul
aggregates in this way is that only dried samples can be imaged. Micelles (or other
aggregates) exist primarily in the solution phase and so dynamic light scattering
measurements (DLS) were carried out in collaboration with Dr Marcelo Calderon at
Freie Universität Berlin to measure the solution-phase size of C22G1LLys and
C22G1DLys. Each binder was measured under two different sets of electrolytic
conditions: 10 mM Tris HCl, and the same conditions additionally endowed with 150
mM NaCl. The results are shown in Table 5.2.
Table 5.2 – DLS data for C22G1LLys and C22G1DLys under different electrolytic
conditions.
Compound
Average Diameter / nm
10 mM Tris HCl only
10 mM Tris HCl, 150 mM NaCl
C22-G1-L-Lysine (7.6 ± 0.3) (9.0 ± 0.2)
C22-G1-D-Lysine (7.8 ± 0.2) (9.0 ± 0.2)
In the presence of 10 mM Tris HCl, the DLS results show each of C22G1LLys and
C22G1DLys to form aggregates which are ca. 7.7 nm in diameter. This sizing correlates
well with the TEM imaging. When the conditions are more electrolytically rich, the
aggregates form larger aggregates with diameters of ca. 9 nm. This increase in size with
increasing electrolyte concentration is analogous to the results observed for
C22G1DAPMA in Chapter 4 and is thought to be due to a combination of charge
screening and an enhancement of the hydrophobic effect.306,307
5.2.3 Heparin Binding in Competitive Conditions
The compounds PG1LLys, C22G1LLys and C22G1DLys were then tested for their ability
to bind heparin in competitive conditions using the Mallard Blue heparin binding assay
described in Chapter 3. As before, the data are reported in terms of charge excess at
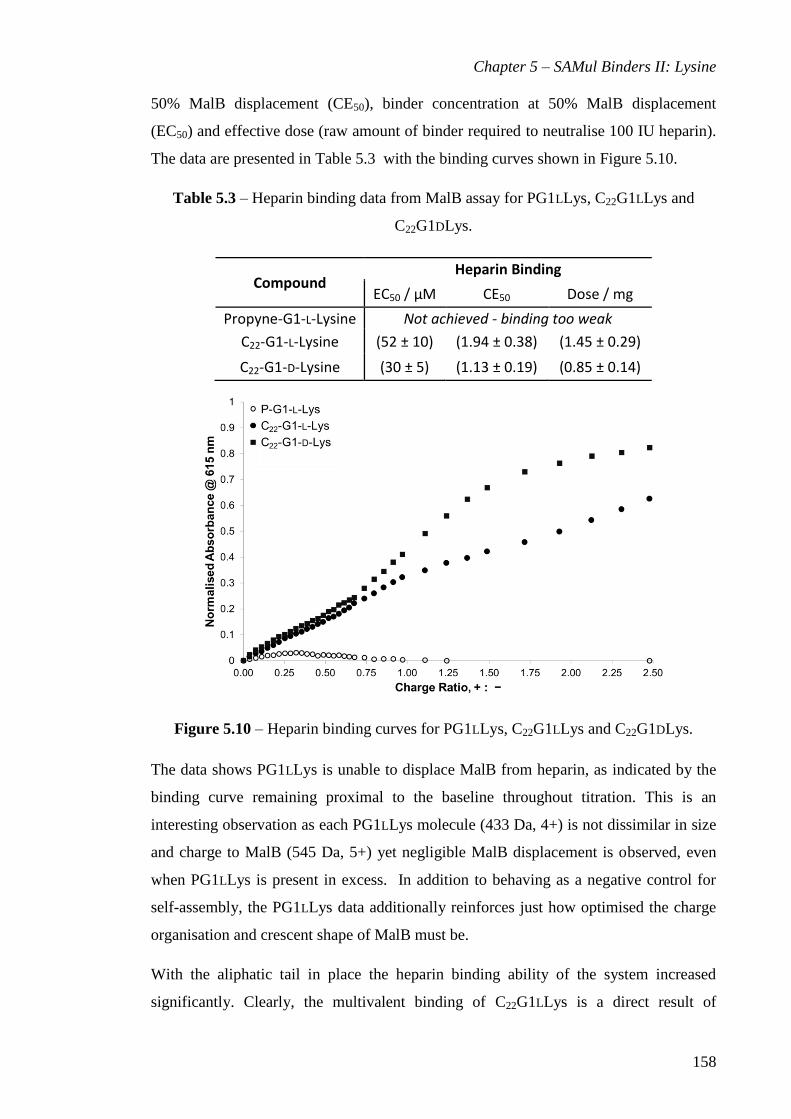
Chapter 5 – SAMul Binders II: Lysine
158
50% MalB displacement (CE50), binder concentration at 50% MalB displacement
(EC50) and effective dose (raw amount of binder required to neutralise 100 IU heparin).
The data are presented in Table 5.3 with the binding curves shown in Figure 5.10.
Table 5.3 – Heparin binding data from MalB assay for PG1LLys, C22G1LLys and
C22G1DLys.
Compound Heparin Binding
EC50 / μM CE50 Dose / mg
Propyne-G1-L-Lysine Not achieved - binding too weak
C22-G1-L-Lysine (52 ± 10) (1.94 ± 0.38) (1.45 ± 0.29)
C22-G1-D-Lysine (30 ± 5) (1.13 ± 0.19) (0.85 ± 0.14)
Figure 5.10 – Heparin binding curves for PG1LLys, C22G1LLys and C22G1DLys.
The data shows PG1LLys is unable to displace MalB from heparin, as indicated by the
binding curve remaining proximal to the baseline throughout titration. This is an
interesting observation as each PG1LLys molecule (433 Da, 4+) is not dissimilar in size
and charge to MalB (545 Da, 5+) yet negligible MalB displacement is observed, even
when PG1LLys is present in excess. In addition to behaving as a negative control for
self-assembly, the PG1LLys data additionally reinforces just how optimised the charge
organisation and crescent shape of MalB must be.
With the aliphatic tail in place the heparin binding ability of the system increased
significantly. Clearly, the multivalent binding of C22G1LLys is a direct result of

Chapter 5 – SAMul Binders II: Lysine
159
molecular self-assembly as each individual molecule possesses the same number of
cationic charges as PG1LLys yet is now able to displace MalB from heparin; a clear
SAMul effect. Despite this improvement over the negative control molecule, the heparin
binding of C22G1LLys is not especially charge efficient. The data shows 1.94 (± 0.38)
times as much cationic charge as anionic charge must be present to displace 50% of
MalB from heparin. At this point the effective concentration of C22G1LLys is 52 (± 10)
µM – well above the CAC value – and so it can confidently be asserted that the binder
is operating in micellar form. The effective dose of C22G1LLys is 1.45 (± 0.29) mg per
100IU heparin, which is relatively high compared to previously tested systems.102,328
Nonetheless, C22G1LLys is another exponent of self-assembled multivalency.
C22G1DLys, meanwhile, is able to achieve 50% MalB displacement with a charge
efficiency of 1.13 (± 0.19) at an effective concentration of 30 (± 5) µM, leading to an
effective dose of 0.85 (± 0.14) mg per 100IU. Again, these data suggest C22G1DLys is
operating in micellar form. These data are very interesting because C22G1DLys utilizes
its charges almost twice as efficiently as C22G1LLys, with only 59% as much cationic
binder charge being required to displace half of the MalB from heparin. Despite the
sizeable uncertainty values associated with each parameter (the origins of this are
discussed below), the difference between enantiomers is statistically significant; that is
to say ‘real’.
It must be noted that the data presented in Table 5.3 are calculated from a single, albeit
averaged, point during the titration: that at which exactly 50% MalB has been displaced
from heparin. As such, they only provide a limited window of insight into the overall
binding process. Consideration of the full binding curves in Figure 5.10 is more
informative and provides insights into the binding mode of the systems. The respective
lineshapes of C22G1LLys and C22G1DLys are essentially identical over the first period
of titration up to charge ratio ca. 0.65, after which the two lines diverge, almost
mirroring each other in shape as amount of binder and cationic charge increases. This
may indicate that heparin binding interactions are first established between heparin and
the outermost terminal amines of the binder and that only in the presence of sufficient
heparin do the α-amines, located 5 bonds from the binder surface, need to become
involved in the interaction with heparin. These α-amines are attached directly to the
lysine chiral centres and so it follows that the observed line shape divergence appears to
relate to these sites becoming involved in binding interactions. Importantly, this

Chapter 5 – SAMul Binders II: Lysine
160
observation suggests that the spatial arrangement of cationic charge, and not just
charge-density, is an important consideration for binding heparin with these SAMul
systems as the chirality is the only difference between C22G1LLys and C22G1DLys. This
is particularly noteworthy as is contradicts the previously mentioned observations of
Rabenstein, which suggested that only charge density played a significant role.321
Indeed we reason that these observations are of significance for all chemists involved in
micellar or nanostructure binding events.
5.2.4 Heparin Binding in Clinically Relevant Conditions
The data from the heparin binding assay carried out in the presence of buffer and salt
suggested that C22G1DLys was a more efficient heparin binder than C22G1LLys and
therefore required a lower dose per unit of heparin. For that reason, C22G1DLys was
carried forward for testing under more clinically relevant conditions. As discussed in
earlier chapters, the Mallard Blue heparin binding assay can also be carried out with
heparin delivered in 100% human serum to simulate more realistically the clinical
situation experienced by a heparin rescue agent. C22G1DLys was tested using the MalB
assay in serum and the resulting data are shown in Table 5.4 and Figure 5.11, and
discussed below.
Table 5.4 – Heparin binding data for C22G1DLys obtained from MalB assay carried out
in salt and buffer, and with heparin delivered in 100% human serum.
Assay Conditions Heparin Binding: C22-G1-D-Lysine
EC50 / μM CE50 Dose / mg
Salt and Buffer (30 ± 5) (1.13 ± 0.19) (0.85 ± 0.14)
Heparin in 100% Human Serum (68 ± 2) (2.52 ± 0.08) (1.83 ± 0.06)

Chapter 5 – SAMul Binders II: Lysine
161
Figure 5.11 – Heparin binding curves for C22G1DLys obtained from MalB assay carried
out (i) in salt and buffer (black) and (ii) with heparin delivered in 100% human serum
(grey).
The heparin binding efficiency of C22G1DLys decreases in the presence of human
serum, with more than twice as much cationic charge being required to neutralize a
given amount of heparin than in the absence of serum. It is worth noting that 50% MalB
displacement fell marginally outside the titration range and so the parameters reported
in Table 5.4 were calculated by extrapolation. It seems likely that the presence of
hydrophobic species such as albumins in serum may be disrupting the micellar ligand
array of C22G1DLys in a similar manner to that previously observed for C22G1DAPMA.
Given their similar structures, C22G1DLys and C22G1DAPMA could reasonably be
expected to have comparable propensities for disruption by serum. Impressively, despite
the disruption, C22G1DLys still showed significant heparin binding under these more
challenging conditions. Building on this promise, C22G1DLys was tested in a plasma
clotting based prothrombin assay (PT assay) to examine its ability to not only interact
with heparin, but also to neutralize its anticoagulant activity in a clinically relevant
assay. Once again, clotting studies were carried out in the laboratory of Professor
Jeremy Turnbull at University of Liverpool, UK.

Chapter 5 – SAMul Binders II: Lysine
162
Table 5.5 – Plasma clotting data for C22G1DLys in PT assay.
Compound Binder Dose, Clotting time
mg / 100IU / seconds
None - (12.8 ± 0.8)
Heparin - no clot
C22-G1-D-Lysine 0.85 (19.7 ± 2.7)
C22-G1-D-Lysine 1.83 (19.4 ± 2.6)
The PT assay results shown in Table 5.5 show that introduction of heparin to the sample
of plasma led to a suspension of clotting as heparin exerted its anticoagulant effect.
Subsequent introduction of C22G1DLys at the dose calculated from the MalB assay in
buffer and salt (0.85 mg per 100IU) resulted in clotting been reestablished, although the
clotting time was somewhat extended compared to the control sample. The extended
clotting time may be due to disruption of a portion of the binder by some of the
hydrophobic plasma components. Introduction of C22G1DLys at the higher dose
suggested by the MalB assay in serum (1.85 mg per 100IU) also resulted in clotting
being reestablished, but did not result in a shortening of the clotting time. From these
limited clotting studies, it would appear that regardless of applied dose, the clotting time
for C22G1DLys remained roughly consistent in the PT assay at around 19 seconds.
Despite this extended clotting time, it is particularly impressive that C22G1DLys, a self-
assembling binder which is less efficient in its use of individual charges than other
systems tested, is able to clot heparinized human plasma samples. It is another excellent
demonstration of the genuine potential of this simple and biocompatible SAMul
approach in the development of functional heparin rescue agents.
5.2.5 Degradation
5.2.5.1 Nile Red Release Assay
Part of the rationale behind the SAMul approach to heparin binding is the enhanced
degradability of the binder molecules compared to larger covalent systems, which gives
SAMul binders greater pharmacological appeal. To that end, the ability of C22G1DLys
to degrade and/or disassemble under biologically relevant conditions was tested. It was
hoped that comparison against data for C22G1DAPMA may give insights into the
effects of connecting the surface groups through ester linkages rather than carbamates.

Chapter 5 – SAMul Binders II: Lysine
163
Although only the D-system was tested here, in vivo each of C22G1LLys and C22G1DLys
may have subtly different degradation profiles owing to their opposing chiralities. In
particular, the D-system might be metabolized more slowly owing to the natural absence
of D-amino acids in humans. Indeed it is known that humans have no natural mechanism
for utilizing or dealing with D-lysine derivatives yet they can derive around 1% of their
nutritional intake from L-lysine derivatives.329,330
The propensity of C22G1DLys to degrade was tested using the same time-resolved Nile
Red release assay employed for C22G1DAPMA in Chapter 4. Specifically, a solution of
C22G1DLys was made up at a concentration above the CAC (50 µM) in PBS buffer at
pH 7. An aliquot of Nile Red was added to the cuvette before inversion ensured
thorough mixing. Thereafter, the fluorescence intensity (If) at 635 nm following
irradiation at 550 nm, was recorded at 10 minute intervals over 6.5 hours to monitor the
release of dye from the micellar interior. The resulting values were normalised between
If at the start of the experiment and If of a PBS-Nile Red control. The resulting
degradation curve is shown in Figure 5.12.
Figure 5.12 – Time resolved degradation curve of C22G1DLys. Discontinuities are
indicated where the sample was vigorously shaken to simulate blood-flow shear forces.
As shown in Figure 5.12, C22G1DLys degrades with a half-life (t1/2) of ca. 1.25 hours.
This half-life is significantly shorter than for C22G1DAPMA, which exhibited a half-life
of ca. 7 hours under the same conditions. Clearly, the connection of the surface groups

Chapter 5 – SAMul Binders II: Lysine
164
to the linker unit through ester bonds rather than carbamates significantly increases
degradability. It seems likely that the degradation process of C22G1DLys is driven by an
intramolecular base-catalyzed hydrolysis process, much like that previously reported by
Smith and co-workers.69
Indeed the closer proximity of the ester groups to the surface
amine in C22G1DLys may assist in this increased degradation rate over C22G1DAPMA.
The short t1/2 of C22G1DLys is significant with respect to much of the data reported
earlier in this chapter. For example, all the parameters calculated from MalB heparin
binding assays have relatively large uncertainty values associated with them; in some
cases as much as ca. 19% of the mean value. The instability of the binder molecules
would appear to account for this uncertainty because MalB heparin binding assays can
take around 3 hours to perform in triplicate, during which time the binder may have
degraded somewhat. Degradation during MalB assays will likely be slower than
suggested by the Nile Red release study however, as any solutions containing binder
also contain heparin and, as shown in Chapter 4, interaction with heparin significantly
retards degradation as the binder amines are bound to heparin and less able to
intramolecularly catalyse the hydrolytic degradation process.
An important further consideration for any potential heparin rescue agent is the effect of
dosing into the fast-flowing bloodstream. In particular, the role of shear forces is
especially important for our non-covalent assemblies. In order to simulate the effect of
shear forces on our SAMul system, the cuvette was shaken vigorously between the
acquisitions of two data points. These points are indicated in Figure 5.12. The shear
forces manifest themselves as clear discontinuities in the line shape, indicative of an
accelerated degradation event. Interestingly, the points following the shaking appear to
revert back to the initial degradation regime. Importantly, in the bloodstream such shear
forces would be constant rather than intermittent, albeit somewhat lower in intensity.
That is to say, the half-life of C22G1DLys in a flowing bloodstream would be expected
to be significantly shorter than the 1.25 hours observed in this degradation experiment.
5.2.5.2 Mass Spectrometric Studies
Whilst the Nile Red release assay is indicative of degradation, it is unable to identify
which bonds specifically are being broken, or whether indeed the assembly is simply
disrupted rather than degraded over time. A mass spectrometric degradation assay was
carried out in order to identify the species resulting from degradation. As for

Chapter 5 – SAMul Binders II: Lysine
165
C22G1DAPMA in Chapter 4, mass spectra were obtained in the presence of a Gly-Ala
non-degradable internal standard before and after incubation at 37°C for 24 hours. Some
example spectra, along with the molecular species of interest are shown in Figure 5.13.
At time zero, the molecular ions associated with C22G1DLys (m/z = 391 [M]2+
and 261
[M]3+
) were clearly visible. After 24 hours, these molecular ions had disappeared and
peaks corresponding to the hydrolysis products of the linker ester (alcohol, m/z = 408
[M]1+
; carboxylic acid, m/z = 391 [M]1+
) were now visible, albeit at low relative
intensity to the standard. This suggests that the connection of the surface groups to the
scaffold by ester groups rather than carbamates, as was the case for C22G1DAPMA,
promoted further degradation of the carboxylic acid fragment, although direct evidence
of such secondary degradants was not seen.

Chapter 5 – SAMul Binders II: Lysine
166
Figure 5.13 – Mass spectrometric degradation assay: observed species (top) after 0 hours
(middle) and 24 hours (bottom) incubation at 37°C.

Chapter 5 – SAMul Binders II: Lysine
167
5.2.5.3 Plasma Clotting Study
The Nile Red release data presented above demonstrated that molecular degradation
switched off the self-assembly processes of C22G1DLys, however it did not
unequivocally indicate a switch off in heparin binding activity. Therefore, to confirm
that a degraded sample of C22G1DLys would be unable to operate as a heparin rescue
agent (i.e. the activity had been lost), a solution of binder was made up in aqueous
solution and left to stand for 24 hours before being tested in the prothrombin plasma
clotting assay (PT assay) as before. The results, shown in Table 5.6, indicate that after
degradation, the heparin-neutralizing activity was lost and no plasma clotting was
observed.
Table 5.6 – Plasma clotting data for C22G1DLys in PT assay before and after
degradation.
Compound Binder Dose, Clotting time
mg / 100IU / seconds
C22-G1-D-Lysine 0.85 (0 hours) (19.7 ± 2.7)
C22-G1-D-Lysine 0.85 (24 hours) no clot
In a further experiment to probe binder degradability, a sample of C22G1DLys was taken
approximately 18 months after synthesis and analysed by NMR spectroscopy. Despite
refrigeration under an inert atmosphere, comparison of the spectra obtained after this
extended time period with those from immediately following synthesis indicated the
molecule had degraded somewhat. The most informative signals in the spectra
corresponded to the -CH2 positioned between the linker unit ester group and the 1,2,3-
triazole ring. As shown in Figure 5.14, the individual signals observed after synthesis in
1H spectrum (a) and
13C spectrum (c) became accompanied by new signals in spectra (b)
and (d). These new signals were assigned to the degradant product resulting from
hydrolysis of the adjacent ester group. The ratio of intact binder to hydrolysed binder
was estimated from these spectra to be approximately 3 : 1, suggesting slow degradation
had occurred during prolonged storage.

Chapter 5 – SAMul Binders II: Lysine
168
Figure 5.14 – 1H and
13C NMR spectra for C22G1DLys before (left) and after (right)
refrigeration under an inert atmosphere for 18 months.
The effect of this apparent partial-degradation on heparin binding performance was also
studied by re-testing the ‘old’ samples of C22G1LLys and C22G1DLys using the Mallard
Blue heparin binding assay in buffer and salt. As shown in Figure 5.15, the degradation
affected the performance of both binder systems. It is noteworthy, however, that the
binding curves obtained (shown in grey) mimic those obtained initially by following the
same lineshape up to a charge ratio of ca. 0.65 before diverging, with C22G1DLys again
emerging as the superior heparin binder of the pair.

Chapter 5 – SAMul Binders II: Lysine
169
Figure 5.15 – Heparin binding curves for C22G1LLys and C22G1DLys obtained using
the MalB assay in buffer and salt initially following synthesis (black) and after 18
months of storage (grey).
5.2.6 DNA Binding
5.2.6.1 A Different Chiral Biological Polyanion
Following the chiral preferences exhibited by C22G1LLys and C22G1DLys when binding
heparin, we became interested in whether such differences would be observed when
binding an alternative chiral biological polyanion. To that end, DNA was identified as a
suitable binding target.
The double-helical structure of DNA was famously first solved by Watson and Crick in
1952.331
DNA consists of a backbone of alternating phosphate groups and 2-
deoxyribose sugar residues, each of which is functionalised with a nucleobase. There
are four nucleobases, which can be categorised into two classes: the purine-bases,
adenine and guanine; and the pyrimidine bases, thymine and cytosine. Direct hydrogen
bonding interactions between pairs of these nucleobases bring together two DNA
strands. Specifically, adenine interacts with thymine, and guanine interacts with
cytosine, as shown in Figure 5.16.

Chapter 5 – SAMul Binders II: Lysine
170
Figure 5.16 – Segment of DNA showing the 2-deoxyribose sugar-phosphate backbone
and the hydrogen bonding interactions between the labelled nucleobases.
Genetic code allowing the synthesis of every protein within an organism is contained
within DNA. When errors are present within this code, an incorrect or mutated gene is
synthesised within cells, which can lead to genetic diseases such as sickle-cell anaemia
or cystic fibrosis. Gene Therapy (also known as gene delivery) is a medicinal approach
which has been developed in attempt to remedy these conditions through correcting
these genetic code errors.332,333
The process involves delivering a section of healthy
DNA into a cell, which can code for a working version of a faulty/mutated gene or a
therapeutic protein drug. Generally, delivery of such genetic material (DNA) is
achieved by vectors, which act to protect the DNA as it enters cells. Vectors tend to
‘package up’ DNA, often inside themselves, to mediate transport across cell membranes
such that once inside the cell, and access is gained to the cell-machinery, coding can
begin to produce the therapeutic protein or gene.
Over recent years, many synthetic (or non-viral) vectors have been designed to bind
DNA and facilitate gene delivery.334
Cationic polymers335
and cationic lipids336,337
are
the two largest molecular classes showing promise as effective gene delivery vectors
although dendritic systems are also becoming increasingly studied.338
Indeed, of interest
to us is work from the group of Smith, which has focussed on this dendritic approach
and produced a range of DNA binding system, some of which utilise the same self-
assembling approach to multivalent binding being targeted as part of the current
project.65,69,339,340
Chirality in DNA arises from the deoxyribose sugar moieties along its backbone and
leads to the famous right-handed double helix.331
There has been much interest in

Chapter 5 – SAMul Binders II: Lysine
171
studying and harnessing this chirality for applications ranging from enantiomeric
purifications to asymmetric catalysis. In a similar manner to that discussed earlier for
heparin, DNA has found roles in chromatographic fields where it has been employed as
a straightforward chiral selector to, amongst other things, achieve enantiomeric
separations of bovine milk proteins.341,342
Considerations have been made of how different chiral substrates interact differently
with left- and right-handed DNA.343
In a related area, the multiple works of Sforza and
Marchelli have examined in detail the propensity of individual DNA strands to act as
chiral selectors when forming a duplex with chirally-modified peptide nucleic acid
(PNA) strands.344,345
In particular, one or more lysine346
and/or arginine347
amino acids
were incorporated into identical PNA stands to endow chirality within their structure,
for example see Figure 5.17. The studies which followed convincingly rationalized that
it was generation of a PNA strand with complementary helical handedness to DNA
which dictated duplexing ability rather than the absolute amino acid chirality present in
the system.346,348
Figure 5.17 – An example PNA strand containing a lysine functionalised region; a so-
called ‘chiral box’.348
Other work has focussed on using DNA chirality as a scaffold for catalysis. For
example an early review by Roelfes showed that using DNA in stoichiometric chemical
reactions could allow enantioselection of chiral substrates.349
A more widely used
approach, however, involves a reaction catalyst being anchored onto DNA through
supramolecular interactions.350
These catalyst-DNA interactions often take the form of
intercalation events351
and can be applied successfully to a wide variety of organic
reactions provided the reagents are water soluble.352
For example, the efforts of Feringa
and Roelfes have shown this approach to be effective for Diels-Alder reactions,353
Michael additions354
and even Friedel-Craft alkylations.355

Chapter 5 – SAMul Binders II: Lysine
172
5.2.6.2 Testing C22G1LLys and C22G1DLys
In order to test the ability of C22G1LLys and C22G1DLys to bind DNA, an indicator
displacement assay involving ethidium bromide was employed. The ethidium bromide
assay is well-known, having being used for many decades, and has been utilized
previously in the Smith group.68,356
Ethidium bromide (EthBr), shown in Figure 5.18, is a planar aromatic indicator dye
which is able to intercalate between base pairs of free DNA. Once intercalated in this
manner, EthBr exhibits a strong fluorescence signal at 595 nm following excitation at
550 nm. When a DNA-binder is added to a solution of EthBr and DNA, EthBr becomes
indirectly displaced into free solution as binder-DNA interactions are established. Once
in free solution, EthBr fluorescence is readily quenched, and the change in fluorescence
intensity (ΔIf) can be used to calculate the degree of DNA-binding. Normalised binding
curves can be plotted in the same manner applied to the heparin binding studies, with
data similarly reported in terms of charge efficiency (CE50) and effective concentration
(EC50) at 50% EthBr displacement. This assay is useful for comparing families of
related molecules and quantifying their DNA binding ability.
Figure 5.18 – Chemical structure of fluorescent dye ethidium bromide.
The EthBr DNA binding assay was used to test PG1LLys, C22G1LLys and C22G1DLys
under conditions of 5.07 µM EthBr and 4 µM DNA (with respect to each base) in the
presence of SHE buffer (2 mM HEPES, 0.05 mM EDTA and 150 mM NaCl) at pH 7.5.
The resulting DNA binding data are shown numerically in Table 5.7 and graphically in
Figure 5.19.

Chapter 5 – SAMul Binders II: Lysine
173
Table 5.7 – DNA binding data from EthBr assay for PG1LLys, C22G1LLys and
C22G1DLys. *EC50 and CE50 are numerically equivalent due to experimental conditions.
Compound DNA Binding
EC50 / μM CE50
Propyne-G1-L-Lysine Not achieved - binding too weak
C22-G1-L-Lysine* (1.99 ± 0.54) (1.99 ± 0.54)
C22-G1-D-Lysine* (3.51 ± 0.37) (3.51 ± 0.37)
Figure 5.19 – DNA binding curves from EthBr assay for PG1LLys, C22G1LLys and
C22G1DLys.
The DNA binding data shows that in the absence of a hydrophobic unit, PG1LLys is
unable to displace EthBr from DNA even when there are seven times as many binder
cationic charges present as DNA anionic charges. When the alkyl chain is in place
however, DNA binding ability increases significantly with C22G1LLys displacing 50%
EthBr at a charge excess of (1.99 ± 0.54) and binder concentration of (1.99 ± 0.54) μM.
These values are numerically equivalent as, under the conditions of the assay, one mole
of DNA possesses one anionic charge and is present at 4 µM, while the SAMul binders
each possess four cationic charges per mole. The presence of the aliphatic tail is having
an effect on the DNA binding ability of C22G1LLys despite, according to the data in
Table 5.1, being present at a concentration significantly below the CAC. This may
suggest that the CAC is lowered in the presence of DNA as interactions between
individual non-assembled molecules and DNA may serve to enhance the assembly of

Chapter 5 – SAMul Binders II: Lysine
174
subsequent binder molecules, which in turn enhance DNA binding by promoting
multivalent interactions. This phenomenon may indicate that multivalency enhanced
self-assembly is a corollary of self-assembled multivalency.
In order to examine the CAC of the system in the presence of DNA, the Nile red
encapsulation assay was repeated for C22G1DLys under the conditions of the DNA
binding assay (i.e. in the presence of 4 µM per DNA base, 0.05 mM EDTA, 150 mM
NaCl and 2 mM HEPES). The resulting encapsulation curve, Figure 5.20, gave a CAC
value for C22G1DLys of 11 (± 2) µM.
Figure 5.20 – Nile red encapsulation curve for C22G1DLys in the presence of DNA.
Although the presence of DNA served to lower the CAC somewhat, this observed value
is still over three times larger than the concentration required to displace half of the
ethidium bromide in the DNA binding assay. This suggests that DNA is assisting the
formation of the self-assemblies somewhat although it appears to suggest that effective
DNA binding is being achieved in the absence of full micellar assemblies. This leads to
the possibility that in the presence of DNA, several monomers may cluster together at
the DNA surface in order to establish multivalent interactions with the polyanion. This
may account for the superior binding over the alkyne-tailed negative control molecules
while explaining the NR encapsulation data.
The charge efficiency of both C22G1LLys and C22G1DLys is significantly reduced when
binding DNA compared to binding heparin. This is most likely a straightforward
consequence of heparin being a more charge-dense polyanion and so presenting each
cationic charge with more opportunities to establish meaningful interactions than DNA.

Chapter 5 – SAMul Binders II: Lysine
175
Comparison of the DNA binding data for C22G1LLys and C22G1DLys suggests that each
enantiomer binds DNA with a significantly different charge efficiency. Specifically,
C22G1LLys is the more charge efficient of the pair requiring (1.99 ± 0.54) positive
charges per negative charge of DNA, while C22G1DLys requires (3.51 ± 1.37) positive
charges. The difference in binding efficiency between the opposing enantiomers is
likely to arise as a result of the differing interaction of each chiral centre with the
anionic target. Importantly, the observation that the L-system is the more charge
efficient DNA binder of the pair is in direct contrast to observations from the heparin
binding data, where the D-system was the more charge efficient. Excitingly, the data
therefore suggests the C22G1Lys SAMul systems have opposing chiral preferences
when binding to different biological polyanions. To the best of our knowledge, these
contrasting preferences for heparin and DNA binding have not previously been
reported; particularly not with chirality expressed at the surface of a self-assembled
nanosystem.
It is often proposed that charge density is the only factor of importance when
establishing multivalent ion-ion interactions,280
however the data presented here clearly
demonstrate the arrangement of the individual charges in space can have a significant
impact. It is perhaps not surprising that an enantiomeric pair of substrate molecules
would have different binding efficiencies when interacting with a chiral target, or,
arguably, that this preference may change for chiral binding targets. Rather more
noteworthy is that for our SAMul binders these chiral differences are brought about
only by very small changes at the molecular level. Physically, the only difference
between the systems lies at the α-carbon positions on each lysine residue, five bonds
from the surface of the assembly. Consequently for C22G1LLys and C22G1DLys, it is
only the orientation of this part of the molecules that differ, suggesting that heparin and
DNA can be acutely sensitive to the spatial arrangement of binding ligand arrays.
Interestingly this also suggests that oligosaccharides and oligonucleotides have different
chiral preferences when binding to arrays of cationic, lysine-based amino acids. This
observation may have biological or evolutionary significance.
In order gain more meaningful insights to these chiral differences, a molecular
dynamics modelling study has been carried out in collaboration with Professor Sabrina
Pricl at University of Trieste, Italy. Unfortunately the results from this study are not
available for inclusion here.

Chapter 5 – SAMul Binders II: Lysine
176
5.3 Generation 2 Systems
Following on from the exciting chiral recognition observations for the G1 lysine-
containing SAMul binders in the previous section, it was decided to design and
synthesise some larger second generation (G2) analogues. Specifically, C22G2LLys and
C22G2DLys were identified as suitable target molecules, shown in Figure 5.21. The G2
analogues differ from their G1 counterparts in the degree of dendritic branching present
within the linker unit. At G2, the additional branching points result in the surface being
decorated by four, rather than two, lysine groups. It was postulated that the larger
system, in possession of more binding groups at the assembly surface, might be capable
of more charge efficient heparin binding. Similarly sized systems have previously been
shown by the groups of Smith69
and Haag72
to be effective DNA/RNA delivery agents.
It was also hoped that increasing the number of chiral centers at the binding surface may
serve to amplify the chiral differences observed when binding to different chiral target
molecules such as heparin and DNA.
Figure 5.21 – G2 target molecules C22G2LLys and C22G2DLys.
5.3.1 Synthesis of C22G2LLys and C22G2DLys
5.3.1.1 Preparation of G2 linker group
The G2 target molecules were synthesized in the same convergent manner as the G1
systems. In order to create the extra layer of branching within the G2 linker unit,
alkyne-functionalised-diol 5.10 was reacted with symmetrical anhydride 5.8 in a
moderate yielding base-catalysed coupling reaction.325
This generated G2-
isopropylidene 5.18 which was deprotected using DOWEX-50WX2 to afford G2-linker

Chapter 5 – SAMul Binders II: Lysine
177
5.19. Although concentrated sulfuric acid was able to unveil the alcohol groups,
DOWEX resin was found to be a more reliable approach for the larger system. This
observation agrees with work from the group of Hult.357
The synthetic scheme showing
the preparation of G2-linker is shown in Scheme 5.5.
Scheme 5.5 – Synthetic scheme showing preparation of G2-linker.325,357
5.3.1.2 Connecting the pieces
In the same manner utilised in the preparation of the G1 system, the alcohol groups of
G2-linker 5.19 were coupled with either LLys(Boc)2 or DLys(Boc)2 to afford protected
partial binders 5.20 and 5.21 respectively, in good yields after purification by gel
permeation chromatography in 95:5 DCM:methanol. Once again, a small portion of
L-enantiomer 5.20 was deprotected using HCl gas in methanol to generate negative
control for self-assembly 5.22 in excellent yield. Partial binders 5.20 and 5.21 were then
connected to alkyl azide 5.2 using copper(II) mediated ‘click’ chemistry to afford, after
purification by gel permeation chromatography in 100% DCM, protected final binder
molecules 5.23 and 5.24. The yields of the G2 click reactions were very low (ca. 8 %)
when compared with the G1 systems (ca. 70%). This is thought to be due to the steric
crowding around the G2 alkyne functionality perturbing the interaction with the copper
catalyst. Hindering the alkyne-Cu interaction prevents the alkyl LUMO becoming
reduced in energy sufficiently to permit easy electron transfer from the azide HOMO.
There are also a significant number of coordinating ligands present which could provide
competitive binding sites for copper. Consequently, a low product yield of 5.23 and
5.24 is observed. Copper-free ‘click’ approaches may circumvent some of these issues,
however this was not attempted here. The material obtained was deprotected in an
excellent yield using HCl gas in methanol to afford target molecules C22G2LLys 5.25
and C22G2DLys 5.26. The reaction scheme for the preparation of these target molecules
is shown in Scheme 5.6.

Chapter 5 – SAMul Binders II: Lysine
178
Scheme 5.6 – Synthetic scheme for production of target molecules PG2LLys,
C22G2LLys and C22G2DLys.
With C22G2LLys and C22G2DLys in hand, circular dichroism spectroscopy was used to
establish whether amino acid chirality had been successfully preserved throughout the
synthesis. As can be seen in Figure 5.22, at concentrations of 10 mM, the molar
ellipticity for the two systems is essentially equal and opposite. This indicates that the
two target molecules are of approximately equal enantiopurity, and crucially that
chirality has not being scrambled during synthesis.

Chapter 5 – SAMul Binders II: Lysine
179
Figure 5.22 – Circular dichroism spectra of target molecules C22G2LLys and
C22G2DLys indicating opposing chirality.
5.3.2 Self-Assembly Studies
5.3.2.1 Nile Red Data
The self-assembling ability of C22G2LLys and C22G2DLys was tested using the Nile
Red encapsulation assay discussed earlier. The data are shown numerically in Table 5.8
and graphically in Figure 5.23.
Table 5.8 – Nile Red encapsulation assay data for PG2LLys, C22G2LLys and
C22G2DLys.
G2 Systems CAC / μM
P-G2-L-Lysine N/A
C22-G2-L-Lysine (25 ± 8)
C22-G2-D-Lysine (20 ± 6)
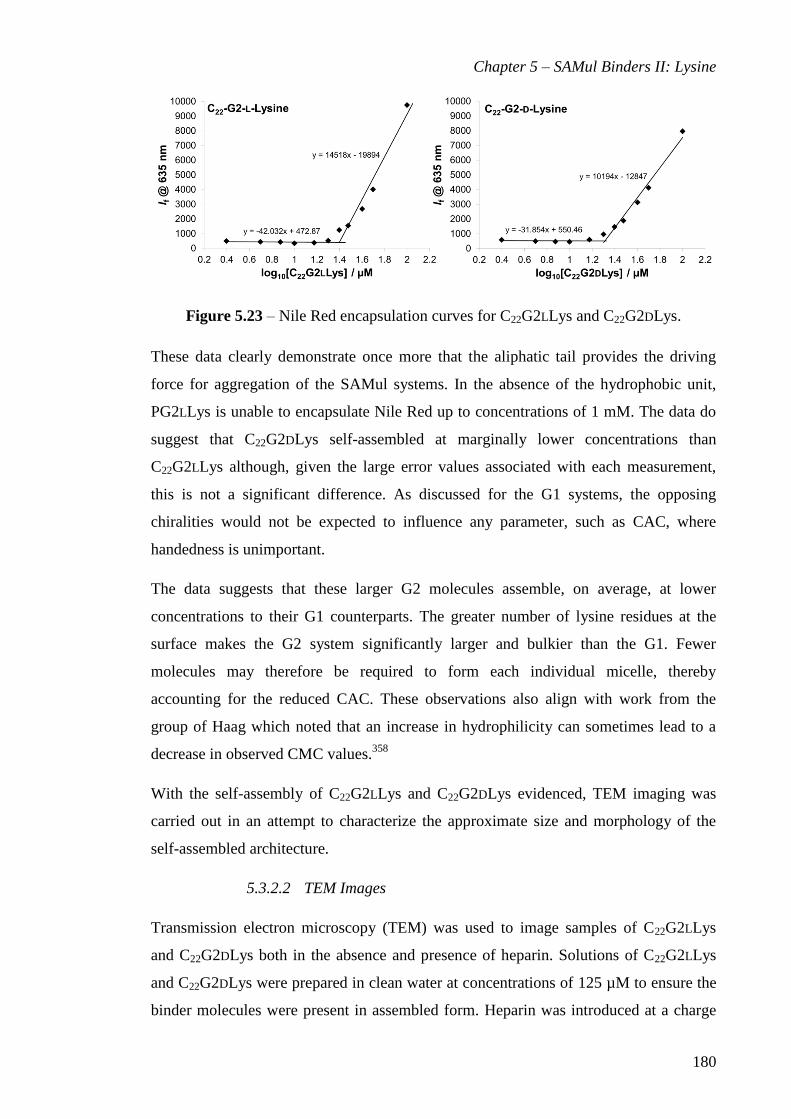
Chapter 5 – SAMul Binders II: Lysine
180
Figure 5.23 – Nile Red encapsulation curves for C22G2LLys and C22G2DLys.
These data clearly demonstrate once more that the aliphatic tail provides the driving
force for aggregation of the SAMul systems. In the absence of the hydrophobic unit,
PG2LLys is unable to encapsulate Nile Red up to concentrations of 1 mM. The data do
suggest that C22G2DLys self-assembled at marginally lower concentrations than
C22G2LLys although, given the large error values associated with each measurement,
this is not a significant difference. As discussed for the G1 systems, the opposing
chiralities would not be expected to influence any parameter, such as CAC, where
handedness is unimportant.
The data suggests that these larger G2 molecules assemble, on average, at lower
concentrations to their G1 counterparts. The greater number of lysine residues at the
surface makes the G2 system significantly larger and bulkier than the G1. Fewer
molecules may therefore be required to form each individual micelle, thereby
accounting for the reduced CAC. These observations also align with work from the
group of Haag which noted that an increase in hydrophilicity can sometimes lead to a
decrease in observed CMC values.358
With the self-assembly of C22G2LLys and C22G2DLys evidenced, TEM imaging was
carried out in an attempt to characterize the approximate size and morphology of the
self-assembled architecture.
5.3.2.2 TEM Images
Transmission electron microscopy (TEM) was used to image samples of C22G2LLys
and C22G2DLys both in the absence and presence of heparin. Solutions of C22G2LLys
and C22G2DLys were prepared in clean water at concentrations of 125 µM to ensure the
binder molecules were present in assembled form. Heparin was introduced at a charge

Chapter 5 – SAMul Binders II: Lysine
181
ratio of 2.25 as, under this concentration regime, both binders exhibited significant
interaction with heparin. Once prepared, aliquots of each solution were loaded onto a
formvar grid, negatively stained with uranyl acetate and allowed to dry before imaging.
The images for C22G2LLys in the absence and presence of heparin are shown in Figure
5.24 and Figure 5.25 respectively, while the equivalent images for C22G2DLys are
shown in Figure 5.26 and Figure 5.27 respectively. The observations are discussed
below.
Figure 5.24 – TEM image of 125 µM C22G2LLys (scale bar: 50 nm).

Chapter 5 – SAMul Binders II: Lysine
182
Figure 5.25 – TEM image of 125 µM C22G2LLys in the presence of heparin (scale bar:
50 nm).
Figure 5.26 – TEM image of 125 µM C22G2DLys (scale bar: 50 nm).

Chapter 5 – SAMul Binders II: Lysine
183
Figure 5.27 – TEM image of 125 µM C22G2DLys in the presence of heparin (scale bar:
100 nm).
The TEM images in Figure 5.24 and Figure 5.26 each show roughly spherical objects
which decorate the grid in an even manner, suggesting C22G2LLys and C22G2DLys form
micelles. Each micelle appears to be ca. 9 – 11 nm in diameter which, logically, is
slightly larger than those formed by the smaller G1 systems and equates roughly to
double the molecular length of monomer units. In the presence of heparin, the micelles
appear to be arranged throughout heparin structure suggesting an integrated nanoscale
aggregate, although the micelles appear somewhat reduced in size with apparent
diameters of ca. ≤7 nm. It is worth noting that approximate sizing of the micelles from
the TEM images was complicated by the tendency of the samples to deteriorate under
the electron beam, which had the effect of ‘blurring’ the images.
With the self-assembly of the system demonstrated and characterized, the compounds
were examined for heparin binding ability.
5.3.3 Heparin Binding in Competitive Conditions
The compounds C22G2LLys and C22G2DLys were tested for their ability to bind heparin
using the Mallard Blue heparin binding assay carried out in buffer and salt. As before,
the data were reported in term of charge efficiency and effective concentration at 50%
MalB displacement along with the effective dose of binder required to neutralize 100 IU

Chapter 5 – SAMul Binders II: Lysine
184
of heparin. The data are reported numerically in Table 5.9 with the binding curves
shown in Figure 5.28.
Table 5.9 – Heparin binding data for PG2LLys, C22G2LLys and C22G2DLys obtained
from MalB assay.
Compound Heparin Binding
EC50 / μM CE50 Dose / mg
Propyne-G2-L-Lysine Not achieved - binding too weak
C22-G2-L-Lysine (15 ± 3) (1.07 ± 0.20) (0.68 ± 0.13)
C22-G2-D-Lysine (17 ± 4) (1.28 ± 0.26) (0.81 ± 0.17)
Figure 5.28 – Heparin binding curves for PG2LLys, C22G2LLys and C22G2DLys
obtained from MalB assay.
The data again show that in the absence of hydrophobic unit, PG2LLys is unable to
displace MalB from heparin to any significant extent even when present in excess.
Close comparison of the binding curve for PG2LLys against that for PG1LLys however,
shows the additional positive charges on the larger system do increase MalB
displacement slightly, but not sufficiently to make PG2LLys a noteworthy heparin
binder in its own right.

Chapter 5 – SAMul Binders II: Lysine
185
Following introduction of the hydrophobic unit, the heparin binding ability ‘switches-
on’ with 50% MalB readily being displaced by C22G2LLys at a concentration of (15 ±
3) µM and at a charge efficiency of (1.07 ± 0.20). The binding ability is clearly driven
by the ability of the system to self-assemble although, according to the data in Table
5.8, C22G2LLys appears to be operating in a self-assembled multivalent manner at a
concentration below the apparent CAC. It is possible, as discussed in the previous
section, that the presence of heparin in the solution may assist the self-assembly leading
both to a reduction in CAC and improvement in binding ability. Comparison against
C22G1LLys – CE50 of (1.94 ± 0.38), Table 5.4 – shows the larger G2 system to be
almost twice as efficient at marshalling its charges and interacting with the anionic
biopolymer. It is possible that this increased binding efficiency indicates a better size-
matching of the larger system with heparin. Additionally, it is plausible that the greater
flexibility in the larger system aids C22G2LLys in arranging its charges into a more
favourable configuration for interaction with heparin.
The D-enantiomer, C22G2DLys, exhibits comparable heparin binding performance to
C22G2LLys with a charge efficiency of (1.28 ± 0.26) achieving 50% MalB displacement
at a concentration of (17 ± 4) µM. Within error, each of the binding parameters for
C22G2LLys and C22G2DLys can be considered the same. This equivalence is supported
by the heparin binding curves for each enantiomer in Figure 5.28 which show the same
lineshape throughout the titration; in contrast to the G1 heparin binding curves which
exhibited a discernable lineshape divergence beyond a charge ratio of ca. 0.65.
The lower charge efficiency values for the G2 systems indicate that each individual
charge is used more effectively in the larger system. This would seem to suggest that
the four amines positioned directly at the chiral centres in C22G2LLys and C22G2DLys
are more heavily involved in interacting with heparin than the two equivalent positions
in C22G1LLys and C22G1DLys yet, paradoxically, there is minimal difference in heparin
binding ability between the G2 enantiomers. It appears that despite ‘more’ chirality
being present in the G2 binders, it is less apparent to heparin upon binding. This may
suggest that the increased steric crowding at the surface of the dendritic structure masks
the subtle difference in chiral expression between C22G2LLys and C22G2DLys. The
closer proximity of the binder charges to each other may simply lead heparin to respond
to the greater electrostatic attraction, hence accounting for the more efficient binding,
without registering any difference in how the ligand array is expressed.

Chapter 5 – SAMul Binders II: Lysine
186
5.3.4 Degradation
5.3.4.1 Nile Red Release Assay
Having characterized the heparin binding ability of C22G2LLys and C22G2DLys, the
degradation profile of these larger systems was assessed. In possessing an extra layer of
branching, and double the number of surface groups, C22G2LLys and C22G2DLys each
have a total of eight ester linkages present within their structures; five more than their
G1 counterparts. For consistency, C22G2DLys was selected for testing using the Nile
Red release assay. The resulting degradation curve is shown in Figure 5.29.
Figure 5.29 – Time resolved degradation curve for C22G2DLys. Discontinuities are
indicated where the sample was vigorously shaken to simulate blood-flow shear forces.
The data show that C22G2DLys degrades with a half-life (t1/2) of ca. 1.4 hours. The
lineshape is somewhat sigmoidal in nature suggesting the initial degradation rate upon
introduction to solution is relatively slow before accelerating considerably. This initial
regime may correspond to the binder molecules being tightly packed into self-
assembled nanostructures and it being hard for nucleophilic attack of the ester groups to
occur due to their concealment away from the assembly surface. The steepest section of
the curve may correspond to a situation where some binder molecules have degraded to
an extent, for example through loss of one arm from the dendritic surface. Once
partially degraded, it may become easier for a hydrolysis event to occur in which the
hydrophobic unit is detached, removing the amphiphilicity and liberating Nile Red into
Chapter 5 – SAMul Binders II: Lysine
187
free solution. The absence of sigmoidal character in the G1 lineshape in Figure 5.12
may also hint at a more complex mechanism for the larger G2 system. This more
convoluted pathway may also account for the slightly longer observed t1/2 for
C22G2DLys compared to C22G1DLys, although this difference may also fall within
experimental error as each degradation plot was obtained from a single experimental
run.
After the half-life had been observed, the cuvette containing the sample was vigorously
shaken to simulate shear forces which would be experienced in a fast-flowing system
such as the bloodstream. The two marked discontinuities in Figure 5.29 suggest that
agitation may cause a reorganization of the remaining assemblies, during which some of
the remaining ester bonds become temporarily more accessible and so are also broken.
This assertion would seem to fit the line-shape, which reverts to the slower degradation
rate once the remaining assemblies have re-stabilised.
5.3.4.2 Mass Spectrometric Studies
In order to identify the species resulting from the degradation events, mass spectrometry
was used to probe a sample before and after 24 hours incubation at 37°C under the same
conditions applied previously. Examples spectra along with the species of interest are
shown in Figure 5.30.

Chapter 5 – SAMul Binders II: Lysine
188
Figure 5.30 – Mass spectrometric degradation assay: observed species (top) after 0 hours
(middle) and 24 hours (bottom) incubation at 37°C.

Chapter 5 – SAMul Binders II: Lysine
189
At time zero, the molecular ions associated with C22G2DLys (m/z = 424 [M]3+
and 318
[M]4+
) were clearly visible along with that of the same species having lost a lysine
residue (m/z = 381 [M]3+
). This observation of this lattermost species was assigned as a
mass spectrometric artefact as no evidence of incomplete lysine functionalization was
observed from orthogonal characterization techniques such as NMR. After 24 hours,
these molecular ions had disappeared and peaks corresponding to the hydrolysis
products of both G1 and G2 linker ester groups (alcohol, m/z = 408 [M]1+
; carboxylic
acid, m/z = 391 [M]1+
) were now visible, albeit at low relative intensity to the standard.
No evidence was seen for the presence of an intact G2-lysine carboxylic acid species
despite inspecting higher charge-to-mass ranges, which may suggest that once formed,
further degradation of such a species occurs to afford the observed G1-lysine carboxylic
acid fragment. Similarly, the relatively low intensity of the observed degradant at m/z
391 appears to suggest that further degradation, for example, through cleavage of the
ester groups connecting the lysine moieties to the scaffold occurred. Unfortunately, no
direct evidence of these lower mass species was seen. Importantly, however, the mass
spectrometric assay did demonstrate that the premise of installing ester groups within
the linker unit was valid, because direct evidence relating to cleavage of these bonds
was seen.
5.3.5 DNA Binding
The larger SAMul systems C22G2LLys and C22G2DLys were also tested for their ability
to bind to DNA in order to probe whether the chiral trends observed previously were
evident. The compounds were tested using the ethidium bromide displacement assay
and the data are reported numerically in Table 5.10 and graphically in Figure 5.31.
Table 5.10 – DNA binding data from EthBr assay for PG2LLys, C22G2LLys and
C22G2DLys.
Compound DNA Binding
EC50 / μM CE50
Propyne-G2-L-Lysine Not achieved - binding too weak
C22-G2-L-Lysine (1.07 ± 0.15) (2.15 ± 0.31)
C22-G2-D-Lysine (1.02 ± 0.12) (2.03 ± 0.25)
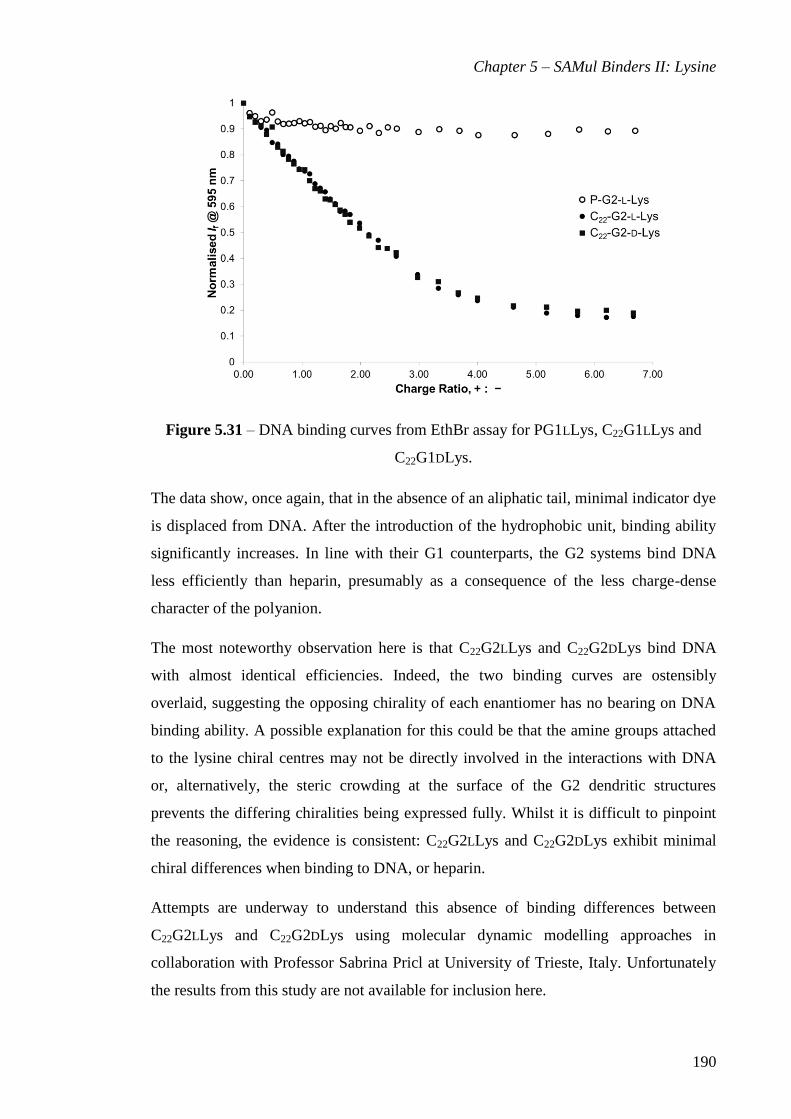
Chapter 5 – SAMul Binders II: Lysine
190
Figure 5.31 – DNA binding curves from EthBr assay for PG1LLys, C22G1LLys and
C22G1DLys.
The data show, once again, that in the absence of an aliphatic tail, minimal indicator dye
is displaced from DNA. After the introduction of the hydrophobic unit, binding ability
significantly increases. In line with their G1 counterparts, the G2 systems bind DNA
less efficiently than heparin, presumably as a consequence of the less charge-dense
character of the polyanion.
The most noteworthy observation here is that C22G2LLys and C22G2DLys bind DNA
with almost identical efficiencies. Indeed, the two binding curves are ostensibly
overlaid, suggesting the opposing chirality of each enantiomer has no bearing on DNA
binding ability. A possible explanation for this could be that the amine groups attached
to the lysine chiral centres may not be directly involved in the interactions with DNA
or, alternatively, the steric crowding at the surface of the G2 dendritic structures
prevents the differing chiralities being expressed fully. Whilst it is difficult to pinpoint
the reasoning, the evidence is consistent: C22G2LLys and C22G2DLys exhibit minimal
chiral differences when binding to DNA, or heparin.
Attempts are underway to understand this absence of binding differences between
C22G2LLys and C22G2DLys using molecular dynamic modelling approaches in
collaboration with Professor Sabrina Pricl at University of Trieste, Italy. Unfortunately
the results from this study are not available for inclusion here.

Chapter 5 – SAMul Binders II: Lysine
191
5.4 Conclusions and Future Work
5.4.1 Conclusions
A small family of lysine-containing self-assembling multivalent (SAMul) systems were
synthesized and studied for their abilities to interact with heparin under a variety of
conditions including in human plasma, and also with DNA. The effects of size, charge
and chirality were considered from a binding perspective and the degradation profile of
each system was also characterized.
The smaller enantiomeric pair of SAMul binder molecules, C22G1LLys and C22G1DLys,
were shown to form micellar aggregates in aqueous solution of ca. 7 nm diameter and to
be able to bind heparin effectively in the presence of biologically relevant salt
concentrations. Interestingly, the system containing D-lysine surface groups was able to
marshal its charges more efficiently than the system containing L-lysine surface groups
when interacting with heparin. Furthermore, when the polyanionic binding partner was
changed to DNA, rather than heparin, this chiral binding preference was shown to be
reversed, with the L-binder being the more charge efficient.
Following on from the promising heparin binding results, C22G1DLys was shown to be
able to bind heparin in the presence of human serum, although binding was less
efficient. This decrease in performance was assigned to disruption of the self-assembled
nanosystem by hydrophobic components of serum such as albumins. Despite this
performance decrease, C22G1DLys was shown to be largely able to reverse the anti-
coagulant effect of heparin in clinically relevant plasma clotting assays.
The degradation of C22G1DLys was demonstrated to occur with a first half-life of ca.
1.25 hours, and to be accelerated by shear forces. This degradation time scale would
likely be too short to be of clinical relevance due to the constant high velocity flow- and
shear-forces experienced in the systemic bloodstream. Nonetheless, the greater number
of ester groups compared to the C22G1DAPMA system reported in Chapter 4 clearly
accelerated the degradation process.
A larger pair of SAMul binders, C22G2LLys and C22G2DLys, were synthesized and
tested for heparin and DNA binding. These systems possessed four lysine surface
groups and were able to bind the anionic target molecules in a more charge efficient
Chapter 5 – SAMul Binders II: Lysine
192
manner than their G1 counterpart, presumably owing to the greater charge per self-
assembling unit and better size-matching. The micelles formed by these G2 systems
were ca. 11 nm in diameter. Interestingly, the opposing surface group chiralities were
shown to have no influence over binding ability, with C22G2LLys and C22G2DLys
exhibiting equivalent heparin and DNA binding performances. It was reasoned that the
increased crowding at the surface of the G2-system prevented the subtle difference in
ligand spatial arrangement being fully expressed. It was reasoned that in this sense the
greater charge density at the binder surfaces, rather than their specific spatial
arrangements, dictated the increased binding efficiencies of C22G2LLys and C22G2DLys
with heparin and DNA.
The C22G2DLys species was also shown to degrade with a first half-life of ca. 1.40
hours, and to be affected by shear forces caused through agitation in the same manner as
C22G1DLys.
5.4.2 Future Work
Future work in this area will include investigating the observed chiral preferences
between systems containing L-lysine and D-lysine surface groups using molecular
dynamic modelling techniques, in collaboration with Professor Sabrina Pricl at
University of Trieste. It is hoped that these modelling studies will give an insight into
why chiral preferences appear to be reversed when binding DNA as opposed to heparin;
and, additionally, why this chiral preference appears to be lost as the size of the binder
increases.
In order to understand these differing chiral preferences, it may be interesting to carry
out a control study using a straightforward monoamine such as 6-aminohexanoic acid in
place of lysine as this would afford binder molecules lacking the primary amine groups
attached to the chiral α-carbons. Performance comparison against the lysine-surfaced
binders would allow the binding contribution of the α-amines to be quantified. An
alternative approach to study this could involve use of a shorter amino acid such as
ornithine at the binder surface. The carbon backbone of ornithine is one -CH2 unit
shorter than lysine and so would position the chiral centres slightly closer to the binder
group surface without greatly affecting the overall structure. This subtle change may
serve to amplify the effects of the chiral centres.

Chapter 5 – SAMul Binders II: Lysine
193
From the perspective of developing a novel heparin SAMul heparin rescue agent, the
hydrophobic character of the next generation of binders should be enhanced in order to
increase the robustness of assemblies in the presence of hydrophobic serum
components. This could be achieved by introducing branching into the alkyl-tail moiety,
for example through use of biologically relevant hydrophobes such as dual- or tri-tailed
bile acids or cholesterol units. In making these modifications, it may be prudent to
reduce the number of ester groups present in the system as connection of the surface
groups to the linker unit through ester bonds here promoted degradation to unacceptably
fast levels.

Chapter 6 – Hydrophobically-Enhanced Binders
194
6 Hydrophobically-Enhanced Self-Assembling
Heparin Binders
6.1 Introduction
Chapter 4 established self-assembled multivalency (SAMul) as an effective approach
for developing novel heparin rescue agents, while Chapter 5 demonstrated that
employing chiral binding groups at the surface could influence the heparin binding
ability of the SAMul systems. One common feature shared by the families of SAMul
binder molecules studied in the previous chapters was possession of a single twenty-two
carbon atom aliphatic tail to promote self-assembly of the nanoscale heparin binding
architectures. Although capable of heparin binding; these aggregates were susceptible to
disruption and/or destabilisation by hydrophobic serum components such as albumin
proteins. It was postulated that the long alkyl chain making up the hydrophobic unit
may have inadvertently been rather optimised for interaction with albumin-type species,
and that this therefore promoted disruption.311
Although this disruption did not normally
prevent the SAMul systems from binding heparin in serum, it did impact on the relative
effectiveness of binding when compared against measurements made in aqueous buffer.
This disruption also manifested itself in other ways, for example by extending the
observed clotting time in clinically relevant plasma clotting assays. It was reasoned that
an alternative hydrophobic unit might be able to overcome some of this serum
disruption and help stabilise the self-assembled nanostructures.
Through its role promoting molecular self-assembly, the hydrophobic unit is also able to
influence the morphology of the nanosized aggregates formed.45
To this point, all of the
SAMul systems studied in this project have formed spherical, or roughly spherical,
assemblies as dictated by the geometry of the individual ‘building block’ monomers.
This was partly due to their mutual construction from the same ester-containing
dendritic linker unit. It was therefore decided to redesign the heparin binding building
block such that the monomer unit had a different molecular geometry, which would
then in turn be able to generate a different (i.e. non-spherical) self-assembled
architecture.
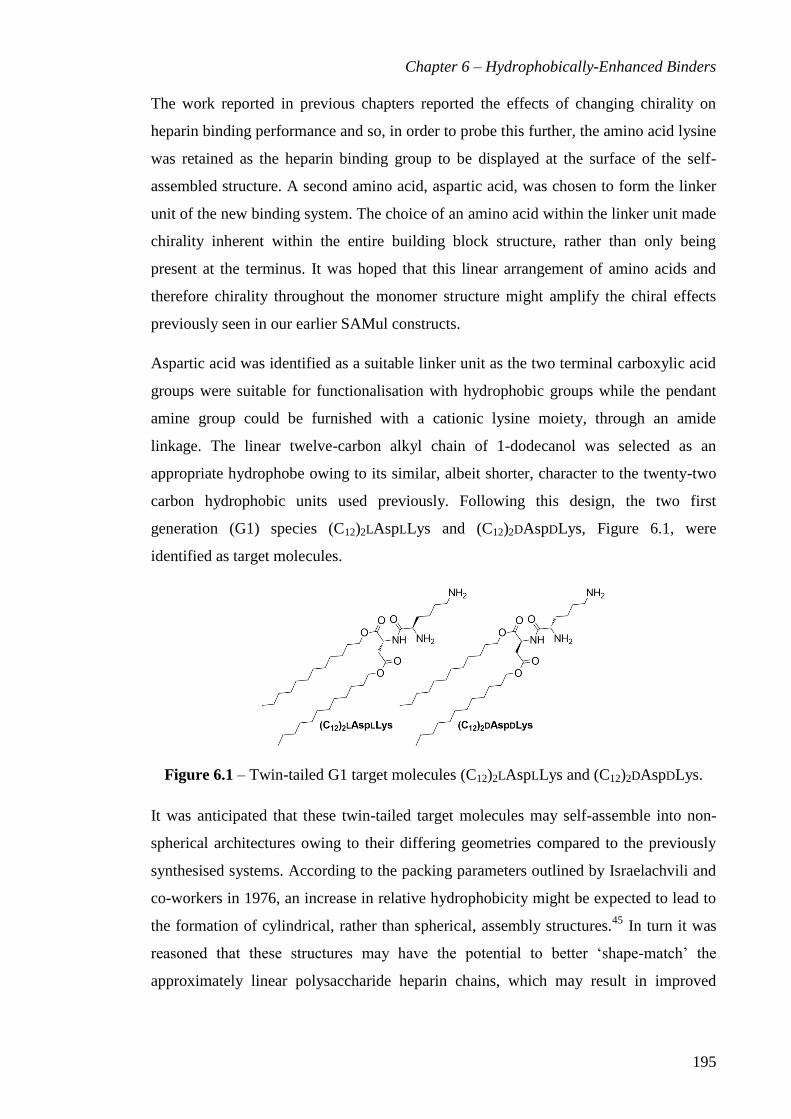
Chapter 6 – Hydrophobically-Enhanced Binders
195
The work reported in previous chapters reported the effects of changing chirality on
heparin binding performance and so, in order to probe this further, the amino acid lysine
was retained as the heparin binding group to be displayed at the surface of the self-
assembled structure. A second amino acid, aspartic acid, was chosen to form the linker
unit of the new binding system. The choice of an amino acid within the linker unit made
chirality inherent within the entire building block structure, rather than only being
present at the terminus. It was hoped that this linear arrangement of amino acids and
therefore chirality throughout the monomer structure might amplify the chiral effects
previously seen in our earlier SAMul constructs.
Aspartic acid was identified as a suitable linker unit as the two terminal carboxylic acid
groups were suitable for functionalisation with hydrophobic groups while the pendant
amine group could be furnished with a cationic lysine moiety, through an amide
linkage. The linear twelve-carbon alkyl chain of 1-dodecanol was selected as an
appropriate hydrophobe owing to its similar, albeit shorter, character to the twenty-two
carbon hydrophobic units used previously. Following this design, the two first
generation (G1) species (C12)2LAspLLys and (C12)2DAspDLys, Figure 6.1, were
identified as target molecules.
Figure 6.1 – Twin-tailed G1 target molecules (C12)2LAspLLys and (C12)2DAspDLys.
It was anticipated that these twin-tailed target molecules may self-assemble into non-
spherical architectures owing to their differing geometries compared to the previously
synthesised systems. According to the packing parameters outlined by Israelachvili and
co-workers in 1976, an increase in relative hydrophobicity might be expected to lead to
the formation of cylindrical, rather than spherical, assembly structures.45
In turn it was
reasoned that these structures may have the potential to better ‘shape-match’ the
approximately linear polysaccharide heparin chains, which may result in improved

Chapter 6 – Hydrophobically-Enhanced Binders
196
heparin binding over spherical constructs and potentially lead to more promising
candidates for development as novel protamine alternatives.
The initial syntheses of the G1 systems in this part of the project, along with the
associated heparin and DNA binding studies were undertaken, under my supervision, by
final year MChem student Ellis Wilde. Optimisation of the synthetic route to the G1-
lysine-containing systems was carried out, also under my supervision, by summer
project student Mark Dowsett.
6.2 Generation 1 (G1) Systems
6.2.1 Lysine-containing system (G1)
6.2.1.1 Synthesis of (C12)2LAspLLys and (C12)2DAspDLys
The Asp-Lys binders were synthesised in a step-wise manner from the three molecular
components shown in Figure 6.2: the hydrophobic chains of 1-dodecanol, the aspartic
acid linker unit, and heparin binding lysine group. For the purposes of synthesis,
aspartic acid was first derivatised with the alkyl tails before the lysine group was
attached.
Figure 6.2 – The three component pieces of G1 target molecules (C12)2LAspLLys and
(C12)2DAspDLys.
Initially, L-Asp(Boc) 6.1, a commercially available reagent, was identified as a suitable
starting point for synthesis owing to the potential for functionalization of both
carboxylic acid groups along with the acid lability of the amine Boc protecting group,
Scheme 6.1. This species was firstly functionalised with two molecules of 1-dodecanol
in a modestly yielding ester-forming reaction facilitated by DCC and DMAP to afford
protected intermediate 6.3. Removal of the Boc protecting group was achieved using
trifluoroacetic acid (TFA) conditions to afford intermediate salt 6.5 in an excellent
yield. With the aspartic acid amine group now available, this was next coupled with the
carboxylic acid of L-Lys(Boc)2 in a TBTU-mediated peptide coupling reaction to afford,
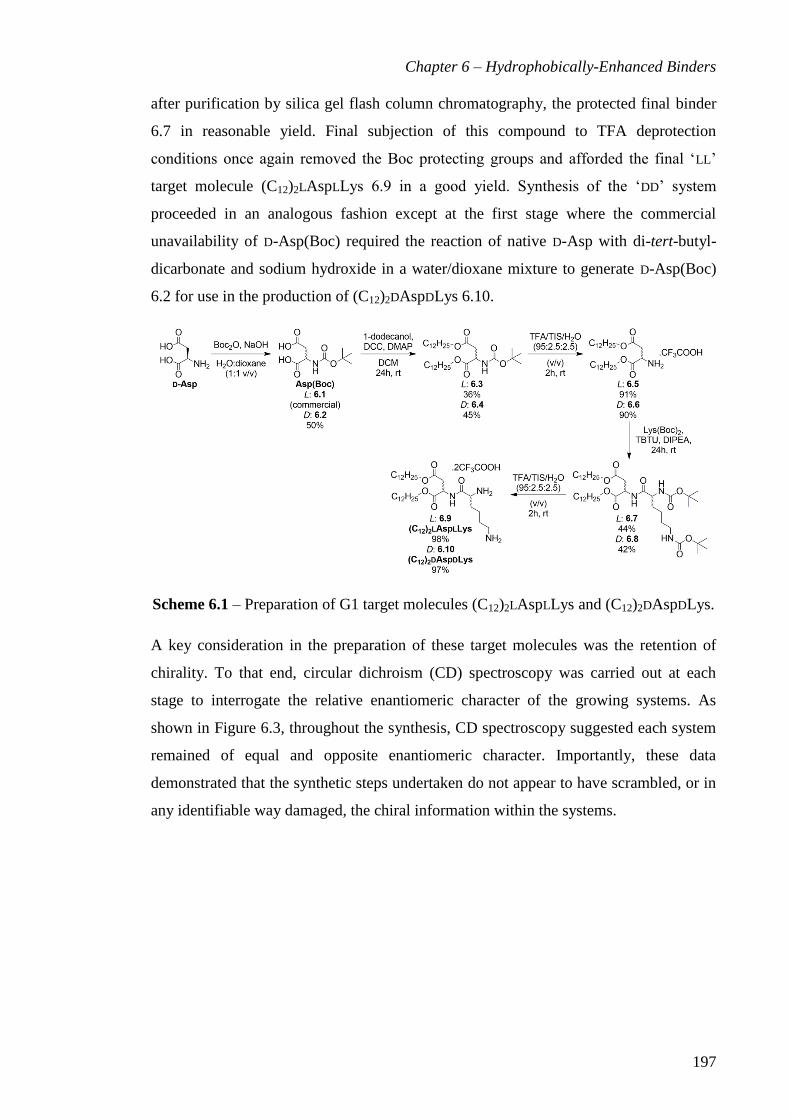
Chapter 6 – Hydrophobically-Enhanced Binders
197
after purification by silica gel flash column chromatography, the protected final binder
6.7 in reasonable yield. Final subjection of this compound to TFA deprotection
conditions once again removed the Boc protecting groups and afforded the final ‘LL’
target molecule (C12)2LAspLLys 6.9 in a good yield. Synthesis of the ‘DD’ system
proceeded in an analogous fashion except at the first stage where the commercial
unavailability of D-Asp(Boc) required the reaction of native D-Asp with di-tert-butyl-
dicarbonate and sodium hydroxide in a water/dioxane mixture to generate D-Asp(Boc)
6.2 for use in the production of (C12)2DAspDLys 6.10.
Scheme 6.1 – Preparation of G1 target molecules (C12)2LAspLLys and (C12)2DAspDLys.
A key consideration in the preparation of these target molecules was the retention of
chirality. To that end, circular dichroism (CD) spectroscopy was carried out at each
stage to interrogate the relative enantiomeric character of the growing systems. As
shown in Figure 6.3, throughout the synthesis, CD spectroscopy suggested each system
remained of equal and opposite enantiomeric character. Importantly, these data
demonstrated that the synthetic steps undertaken do not appear to have scrambled, or in
any identifiable way damaged, the chiral information within the systems.

Chapter 6 – Hydrophobically-Enhanced Binders
198
Figure 6.3 – Circular dichroism data at different stages during the preparation of
(C12)2LAspLLys (solid lines) and (C12)2DAspDLys (dashed lines) measured at 10 mM in
methanol.
6.2.1.2 Self-Assembly Studies
The twin tailed SAMul molecules (C12)2LAspLLys and (C12)2DAspDLys were tested for
their ability to self-assemble using the Nile Red encapsulation assay. The data suggested
the CAC values for each of these systems were 67 (± 10) µM for the ‘LL’ analogue and
74 (± 5) µM for ‘DD’. The encapsulation curves are shown in Figure 6.4.
Figure 6.4 – Nile Red encapsulation curve for (C12)2DAspDLys.
The CAC value is significantly larger than for the single-tailed systems reported in
previous Chapters. This is an interesting observation as thermodynamically the CAC
value might be expected to decrease as the degree of hydrophobic character within the

Chapter 6 – Hydrophobically-Enhanced Binders
199
assembling monomers increases. Such a decrease in CAC would be likely to arise from
the larger entropic benefit associated with the liberation of ‘frozen’ water molecules at
the interface with the hydrophobic groups, although an increase in CAC may be seen if
the difficulty associated with packing the charged surface groups together increases.
The CAC values for these twin-tailed systems are around 20 µM higher than for single-
tailed analogues such as C22G1Lys, which appears to suggest that that there may be
increased difficulty associated with positioning the charge surface groups close together
at the assembly surface. This seems particularly likely as qualitative macroscopic
observations, such as aqueous solubility, do not corroborate the possibility that each
monomer is ‘less’ hydrophobic in relative terms than the single-tailed systems in earlier
Chapters. In order to examine whether these structural changes have had an effect on
the morphologies of the self-assembled architectures, they were examined by
transmission electron microscopy.
6.2.1.3 TEM Images
TEM imaging was carried out on the (C12)2DAspDLys system in the absence and
presence of heparin in clean water, at a concentration of 100 µM to ensure the
compound was present in self-assembled form. Heparin was introduced at a charge ratio
(+ : –) of 2, as under this concentration regime, the binder was known to interact well
with heparin. Samples were negatively stained with uranyl acetate and allowed to dry on
the formvar grid before imaging. The images are shown in Figure 6.5 and Figure 6.6.
Figure 6.5 – TEM images of 100 µM (C12)2DAspDLys (scale bars: 100 nm (left), 50 nm
(right)).

Chapter 6 – Hydrophobically-Enhanced Binders
200
Figure 6.6 – TEM image of 100 µM (C12)2DAspDLys in the presence of heparin (scale
bars: 200 nm (left), 100 nm (right)).
The TEM images of (C12)2DAspDLys alone showed aggregates of different sizes,
ranging approximately between 80 – 140 nm in diameter. The surfaces of the aggregates
appeared textured, which may suggest the formation of closely packed lamellar
aggregates by (C12)2DAspDLys. Lamellar structures are theoretically predicted when the
critical packing parameter takes a value larger than 1; the situation when the overall
molecular volume-in-space is composed of slightly more hydrophobic than hydrophilic
domains.45
This observation suggests that the re-design of the self-assembling system
has increased the overall hydrophobicity of the monomer building blocks so
significantly that the cylindrical and vesicular-assembly morphologies – corresponding
to critical packing parameters between 0.3 and 1 – have been completely bypassed.
With the increase in relative hydrophobicity evidenced, the decrease in aqueous
solubility of the twin-tailed systems compared to their single-tailed counterparts can be
understood. The different (i.e. non-spherical) morphology may also account for the
relative increase in CAC values discussed in the previous section as surface groups must
be packed closely together in lamellae.
In the presence of heparin, the images showed a variety of textured assemblies of sizes
somewhat larger than observed in the absence of polysaccharide. This may suggest that
in the presence of heparin we are observing a mixed heparin-binder aggregate in order
to maximise binder-heparin interactions, as within a lamellar assembly some of the
surface binding groups may be less accessible to heparin. Such rearrangement processes
further emphasise the adaptability of a SAMul approach to heparin binding.

Chapter 6 – Hydrophobically-Enhanced Binders
201
6.2.1.4 DLS Measurements
In order to further assess the sizes of the aggregates formed in the absence of heparin,
(C12)2LAspLLys and (C12)2DAspDLys were probed by dynamic light scattering (DLS) in
collaboration with Dr Marcelo Calderon at Freie Universität Berlin. In line with work
reported in earlier chapters, each compound was examined in 10 mM Tris HCl both in
the absence and presence of 150 mM NaCl. The data are shown in Table 6.1.
Table 6.1 – Dynamic Light Scattering (DLS) data for (C12)2LAspLLys and
(C12)2DAspDLys in 10 mM Tris HCl in the absence and presence of 150 mM NaCl.
Compound
Average Diameter / nm
10 mM Tris HCl only
10 mM Tris HCl, 150 mM NaCl
(C12)2-L-Asp-L-Lys (138.4 ± 3.6) (172.4 ± 6.4)
(C12)2-D-Asp-D-Lys (183.4 ± 9.8) (204.1 ± 11.6)
The DLS data shows that (C12)2LAspLLys and (C12)2DAspDLys form relatively large
solution-phase aggregates of 138.4 (± 3.6) nm and 183.4 (± 9.82) nm diameters
respectively. The solution-phase diameters are somewhat larger than those observed for
dried samples by TEM imaging, which further supports the formation of vesicles or
lamellar assemblies. It is likely that in the solution phase, some aqueous solvent media
becomes encapsulated inside the vesicular assembly causing the apparent aggregate size
to ‘swell’. The observed size difference between the LL and DD systems is surprising as
the difference in chiral expression between the two systems should not impact on
assembly size. The difference may indicate a discrepancy in relative compound purity
although other spectroscopic data does not support this. Alternatively, the difference
may merely serve to highlight the variability of the aggregates of the aspartic acid-
lysine system dependent on preparation. It is also noteworthy that DLS showed the
presence of a small proportion of superaggregates measuring larger than 4 µM diameter,
which may result from the fusion and/or hierarchical aggregation of individual
assembled species. In future it may be desirable to exert more control over aggregate
size during preparation, for example, by subjecting samples to ultrafiltration or casting
the compound as a thin film prior to solubilisation. Such techniques are often employed
by colloid chemists during vesicle formation.
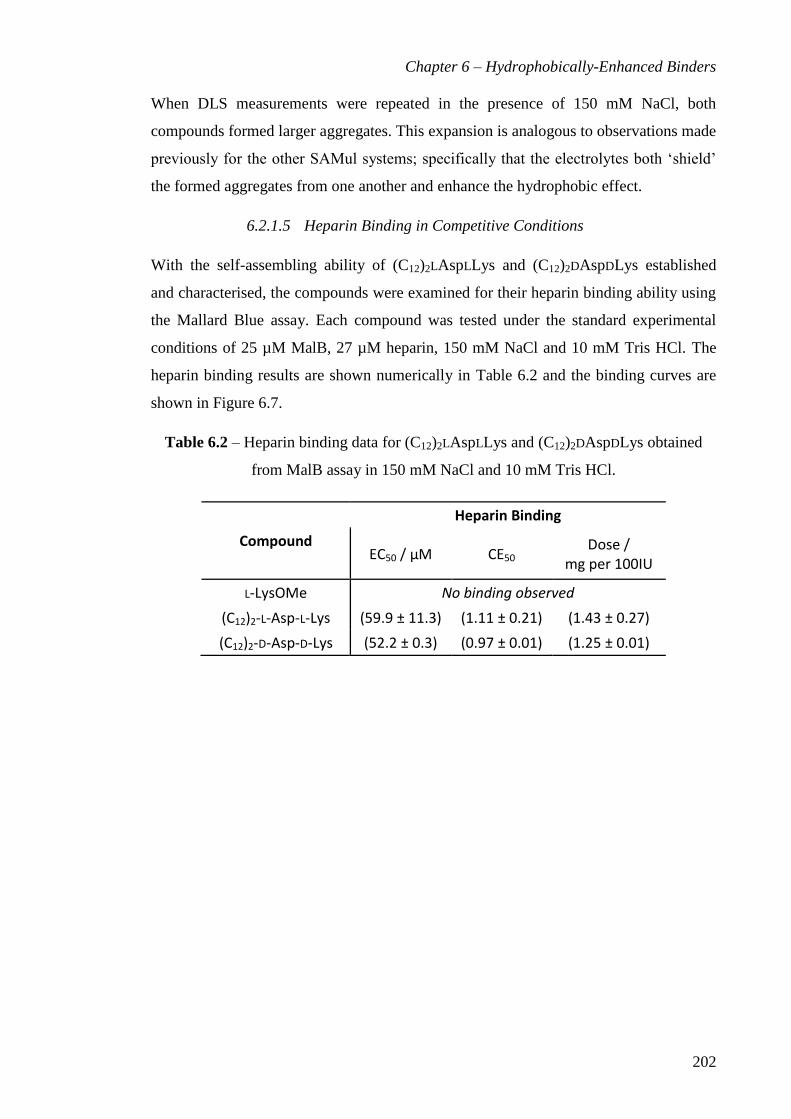
Chapter 6 – Hydrophobically-Enhanced Binders
202
When DLS measurements were repeated in the presence of 150 mM NaCl, both
compounds formed larger aggregates. This expansion is analogous to observations made
previously for the other SAMul systems; specifically that the electrolytes both ‘shield’
the formed aggregates from one another and enhance the hydrophobic effect.
6.2.1.5 Heparin Binding in Competitive Conditions
With the self-assembling ability of (C12)2LAspLLys and (C12)2DAspDLys established
and characterised, the compounds were examined for their heparin binding ability using
the Mallard Blue assay. Each compound was tested under the standard experimental
conditions of 25 µM MalB, 27 µM heparin, 150 mM NaCl and 10 mM Tris HCl. The
heparin binding results are shown numerically in Table 6.2 and the binding curves are
shown in Figure 6.7.
Table 6.2 – Heparin binding data for (C12)2LAspLLys and (C12)2DAspDLys obtained
from MalB assay in 150 mM NaCl and 10 mM Tris HCl.
Compound
Heparin Binding
EC50 / μM CE50 Dose /
mg per 100IU
L-LysOMe No binding observed
(C12)2-L-Asp-L-Lys (59.9 ± 11.3) (1.11 ± 0.21) (1.43 ± 0.27)
(C12)2-D-Asp-D-Lys (52.2 ± 0.3) (0.97 ± 0.01) (1.25 ± 0.01)

Chapter 6 – Hydrophobically-Enhanced Binders
203
Figure 6.7 – Heparin binding curves for (C12)2LAspLLys and (C12)2DAspDLys obtained
from MalB assay in 150 mM NaCl and 10 mM Tris HCl.
The heparin binding data suggest that there is little difference in heparin binding charge
efficiency (CE50) between (C12)2LAspLLys and (C12)2DAspDLys, with both compounds
requiring around one cationic charge per anionic heparin charge to displace 50% MalB
into solution. This efficiency is comparable with the performance of C22G1DLys in
Chapter 5 although the (C12)2AspLys system achieves the same effect with less charge
per monomer (2+ vs 4+). The effective concentrations of (C12)2LAspLLys and
(C12)2DAspDLys at 50% MalB displacement are 59.9 (± 11.3) µM and 52.2 (± 0.3) µM
respectively; values which are slightly below the calculated CACs. This trend matches
observations in earlier Chapters and may support the postulation that heparin serves to
artificially lower the CAC through multivalently ‘templating’ the assembly process.
In order to study the effect of self-assembly on this system, a commercial L-lysine
methyl ester (L-LysOMe) was tested using the MalB heparin binding assay. This amino
acid, which represents just the surface group of the self-assembling monomers, was
completely unable to displace MalB from heparin. The appearance of some of the
normalised absorbance values slightly below zero suggests not only that individual
lysine residues are ineffective binders but also that at higher concentrations they may
also interfere with the buffering of the system, impacting upon the spectrophotometric
properties of MalB. Despite this, the evidence clearly indicates the heparin binding
ability of (C12)2LAspLLys is primarily conferred by a SAMul process.
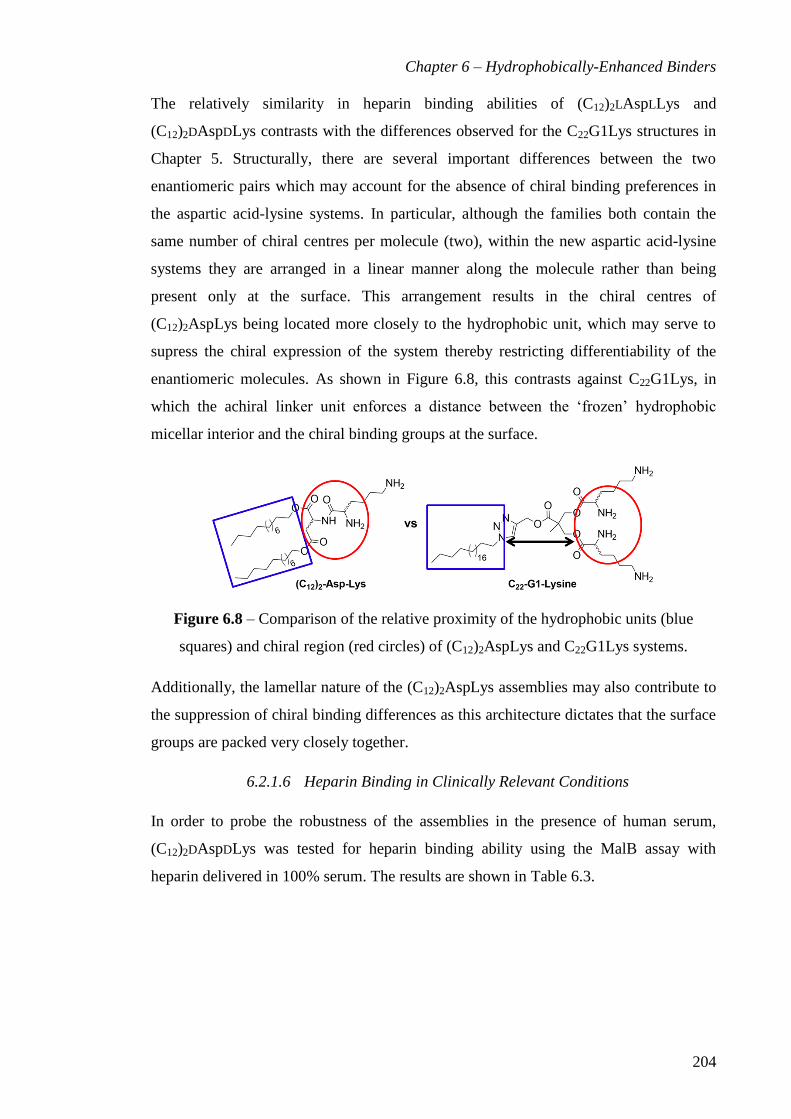
Chapter 6 – Hydrophobically-Enhanced Binders
204
The relatively similarity in heparin binding abilities of (C12)2LAspLLys and
(C12)2DAspDLys contrasts with the differences observed for the C22G1Lys structures in
Chapter 5. Structurally, there are several important differences between the two
enantiomeric pairs which may account for the absence of chiral binding preferences in
the aspartic acid-lysine systems. In particular, although the families both contain the
same number of chiral centres per molecule (two), within the new aspartic acid-lysine
systems they are arranged in a linear manner along the molecule rather than being
present only at the surface. This arrangement results in the chiral centres of
(C12)2AspLys being located more closely to the hydrophobic unit, which may serve to
supress the chiral expression of the system thereby restricting differentiability of the
enantiomeric molecules. As shown in Figure 6.8, this contrasts against C22G1Lys, in
which the achiral linker unit enforces a distance between the ‘frozen’ hydrophobic
micellar interior and the chiral binding groups at the surface.
Figure 6.8 – Comparison of the relative proximity of the hydrophobic units (blue
squares) and chiral region (red circles) of (C12)2AspLys and C22G1Lys systems.
Additionally, the lamellar nature of the (C12)2AspLys assemblies may also contribute to
the suppression of chiral binding differences as this architecture dictates that the surface
groups are packed very closely together.
6.2.1.6 Heparin Binding in Clinically Relevant Conditions
In order to probe the robustness of the assemblies in the presence of human serum,
(C12)2DAspDLys was tested for heparin binding ability using the MalB assay with
heparin delivered in 100% serum. The results are shown in Table 6.3.

Chapter 6 – Hydrophobically-Enhanced Binders
205
Table 6.3 – Heparin binding data for (C12)2DAspDLys with heparin delivered in 100%
human serum.
Assay Conditions
Heparin Binding: (C12)2-D-Asp-D-Lys
EC50 / μM CE50 Dose /
mg per 100IU
Salt and Buffer (52.2 ± 0.3) (0.97 ± 0.01) (1.25 ± 0.01)
Heparin in 10% Human Serum (57.0 ± 6.7) (1.06 ± 0.12) (1.42 ± 0.17)
Heparin in 100% Human Serum (50.5 ± 8.8) (0.93 ± 0.16) (1.25 ± 0.22)
The data suggests that in the presence of human serum, the heparin binding performance
of (C12)2DAspDLys remains, within error, approximately the same as in the absence of
serum. Interestingly, the percentage of serum present did not impact of the degree of
binding observed. This may suggest that the lamellar assemblies formed are
substantially more robust in the presence of hydrophobic serum and albumin proteins
than the spherical aggregates formed by our previous SAMul systems. Alternatively, if
the aggregates rearrange to incorporate heparin into their assemblies as hinted at by the
TEM images, the apparent lack of serum disruption may suggest interactions between
the binder and heparin are preferable to interactions between the binder and serum
components. It may also be possible that the bilayer-character of the vesicle/lamellar
walls remains intact during any rearrangement/heparin encapsulation event. If this were
the case, the tightly packed nature of the monomer units which make up the bilayer may
prevent serum components from gaining access to the ‘frozen’ hydrophobic interior of
such a bilayer to cause disruption.
It is worth emphasising that the maintenance of heparin binding performance by
(C12)2DAspDLys is noteworthy as this ligand array is held together entirely by non-
covalent interactions. When compared against our earlier SAMul systems, this
performance is most impressive, and is even superior to the covalent protamine
structure which was somewhat affected by serum/albumin proteins. The retention of
performance by (C12)2DAspDLys has so far only been matched by the larger covalent
PAMAM-G2.
6.2.1.7 Plasma Clotting Assays
Having retained heparin binding performance in human serum, (C12)2DAspDLys was
tested in both the prothrombin (PT) and activated partial thromboplastin (aPTT) plasma

Chapter 6 – Hydrophobically-Enhanced Binders
206
clotting assays in order to assess the potential for heparin neutralisation in clinically
relevant samples. These experiments were carried out in the laboratory of Professor
Jeremy Turnbull at University of Liverpool, UK. No reversal of anticoagulation was
observed, Table 6.4, although this may be due to solubility problems experienced during
the preparation of the stock solutions. These issues may have resulted in the
concentration of test compound being below the intended 1.25 mg/100IU dosed into the
assay. It is thought that if the protocol was modified to avoid the preparation of a
concentrated stock solution, the observed performance may improve.
Table 6.4 – Plasma clotting data for (C12)2DAspDLys from PT and aPTT assays.
Compound Clotting Time / s
aPTT Assay PT Assay
None (35.7 ± 0.7) (12.8 ± 0.8)
Heparin only no clot no clot
(C12)2-D-Asp-D-Lys no clot no clot
6.2.1.8 DNA Binding
Given the absence of chiral preference between (C12)2LAspLLys and (C12)2DAspDLys
when binding to heparin, the compounds were tested for their abilities to bind DNA.
The compounds were tested using the Ethidium Bromide (EthBr) displacement assay
employed in Chapter 5, using the same conditions of 5.07 μM EthBr, 4 μM DNA (with
respect to each base) in SHE buffer (2 mM HEPES, 0.05 mM EDTA and 150 mM
NaCl) at pH 7.4. The results are shown numerically in Table 6.5 while the binding
curves are shown in Figure 6.9.
Table 6.5 – DNA binding data for (C12)2LAspLLys and (C12)2DAspDLys obtained in
EthBr displacement assay.
Compound DNA Binding
EC50 / μM CE50
(C12)2-L-Asp-L-Lys (3.11 ± 0.07) (1.55 ± 0.04)
(C12)2-D-Asp-D-Lys (8.97 ± 0.32) (4.39 ± 0.16)

Chapter 6 – Hydrophobically-Enhanced Binders
207
Figure 6.9 – DNA binding curves for (C12)2LAspLLys and (C12)2DAspDLys obtained
from EthBr displacement assay.
Significantly, the data shows the enantiomeric systems bound DNA with very different
charge efficiencies. The L-system employed its positive charges much more effectively
than the D-system, as emphasised by relative CE50 values of 1.55 (± 0.04) and 4.39 (±
0.16) respectively. This performance difference is also reflected in the effective
concentration at the same point, with (C12)2DAspDLys requiring over double the amount
of binder as (C12)2LAspLLys. The EC50 values of 3.11 (± 0.07) and 8.97 (± 0.32)
suggest the twin-tailed SAMul systems are operating below their CAC values although,
as discussed in previous Chapters, the presence of DNA may be serving to artificially
lower the assembly concentration of the binders, allowing multivalent binding to occur
during this assay concentration range. The non-assembling control molecule
L-Lys-OMe was unable to displace EthBr to any significant extent during the assay
suggesting DNA binding is a SAMul-driven process.
These chiral binding preferences are interesting on several levels. Firstly, the
observation of a performance difference between the systems for DNA binding where
none was observed for heparin binding suggests DNA is more acutely sensitive to the
spatial arrangement of binding ligands. Heparin is a more charge-dense polyanion than
DNA and these data may suggest heparin is more promiscuous; being less sensitive to
spatial arrangement and/or in-space complementarity of its binding partner. The second
interesting feature of the DNA data is the relative inefficiency with which the binder

Chapter 6 – Hydrophobically-Enhanced Binders
208
molecules, particularly the D-system, are using their individual charges. Such large
values – 1.55 (± 0.04) for LL and 4.39 (± 0.16) for DD – may suggest that only one of the
two cationic charges per binder molecule interacts directly with DNA. If this is the case,
it is arguably more surprising that such profound chiral difference was observed.
6.2.2 Ornithine-containing systems
Given the interesting chiral preferences observed for the aspartic acid-lysine SAMul
systems, a family of related molecules were designed and synthesised. The new systems
contained an ornithine residue at the binder surface in place of the lysine group, Figure
6.10. Ornithine is structurally related to lysine, with the two species differing only in
one –CH2 group within the side-chain. The shortening of the alkyl chain should serve to
marginally increase the charge-density of the resulting binders, and was hoped to
increase heparin (or DNA) binding ability. Additionally, shortening the chain positioned
the outermost chiral centre closer to the extremity of the binder, and it was anticipated
that this may amplify any chiral differences exhibited upon binding with anionic
partners.
Figure 6.10 – Ornithine-containing twin-tailed target molecules (C12)2LAspLOrn and
(C12)2DAspDOrn.
6.2.2.1 Synthesis of (C12)2LAspLOrn and (C12)2DAspDOrn
(C12)2LAspLOrn and (C12)2DAspDOrn were synthesised in an analogous strategy to their
lysine-containing counterparts, as shown in Scheme 6.2. Specifically, ornithine was
Boc-protected using di-tert-butyl-dicarbonate and sodium hydroxide in dioxane to
produce 6.11 and 6.12 in a moderate yield, before the carboxylic acid was coupled to
the corresponding alkylated aspartic acid moiety 6.5 or 6.6. The resulting protected
target molecules 6.13 or 6.14 were obtained in a modest yield, after purification by
silica gel flash column chromatography. Removal of the remaining protecting groups

Chapter 6 – Hydrophobically-Enhanced Binders
209
using trifluoroacetic acid deprotection conditions proceeded in a near-quantitative yield
to afford the target molecules (C12)2LAspLOrn 6.15 and (C12)2DAspDOrn 6.16.
Scheme 6.2 – Preparation of modified twin-tailed SAMul systems (C12)2LAspLOrn and
(C12)2DAspDOrn.
Once synthesised, the compounds were examined by circular dichroism spectroscopy to
ensure that the chirality had been retained during synthesis. As shown in Figure 6.11,
the molar ellipticity traces demonstrated the equal and opposite enantiomeric character
of the two target molecules.
Figure 6.11 – Circular dichroism spectra for (C12)2LAspLOrn and (C12)2DAspDOrn.
6.2.2.2 Self-Assembly Studies
The self-assembling ability of the ornithine-containing twin-tailed systems was tested
using the Nile Red encapsulation assay. The critical aggregation concentration was
found to be 30 (± 5) µM for (C12)2LAspLOrn and 44 (± 8) µM for (C12)2DAspDOrn. The
Nile red encapsulation curves are shown in Figure 6.12.

Chapter 6 – Hydrophobically-Enhanced Binders
210
Figure 6.12 – Nile Red encapsulation data for (C12)2LAspLOrn and (C12)2DAspDOrn.
The ornithine-containing derivative self-assembled at a lower concentration than its
lysine-containing counterpart. This may be a reflection of the small difference in
hydrophobicity between the two systems. Nonetheless, with the self-assembling ability
of the twin-tailed aspartic acid-ornithine system demonstrated, TEM imaging was
employed to observe the morphology of the assemblies formed.
6.2.2.3 TEM Imaging
The compounds (C12)2LAspLOrn and (C12)2DAspDOrn were imaged both in the absence
and presence of heparin on a formvar grid following negative staining with uranyl
acetate and drying. Heparin was introduced into the samples at a charge ratio (+ : –) of
2.5 as, under this regime, the binders were known to interact favourably with heparin.
The images are shown below.
Figure 6.13 – TEM images of 100 µM (C12)2LAspLOrn (scale bars: 500 nm (left), 100
nm (right)).

Chapter 6 – Hydrophobically-Enhanced Binders
211
Figure 6.14 – TEM images of 100 µM (C12)2LAspLOrn in the presence of heparin
(scale bars: 100 nm (both images)).
Figure 6.15 – TEM images of 100 µM (C12)2LAspLOrn (scale bars: 500 nm (left), 100
nm (right)).
Figure 6.16 – TEM image of 100 µM (C12)2DAspDOrn in the presence of heparin (scale
bar: 100 nm (left), 50 nm (right)).

Chapter 6 – Hydrophobically-Enhanced Binders
212
The TEM images show the aspartic acid-ornithine structures form aggregates of
differing sizes between ca. 20 – 100 nm diameters in a similar manner to the lysine-
containing analogues. In the absence of heparin, the images are suggestive of vesicular
or lamellar assemblies. The images also appear to show some evidence of collapsed
vesicles and smaller assemblies appearing ‘inside’ larger structures, which is typical for
lamellar structures, although this could simply be a drying effect. In the presence of
heparin, the textured appearance and variety of aggregate sizes again appears indicative
of mixed binder-heparin aggregates. The difference in appearance of the species
observed in the absence and presence of heparin for the (C12)2AspOrn systems seems
much greater than for the (C12)2AspLys systems.
6.2.2.4 Heparin Binding in Competitive Conditions
The ornithine-containing systems were tested for their heparin binding ability using the
Mallard Blue assay in the presence of buffer and salt. The data are shown numerically in
Table 6.6 with the binding curves in Figure 6.17.
Table 6.6 – Heparin binding data for (C12)2LAspLOrn and (C12)2DAspDOrn obtained
from MalB assay.
Compound
Heparin Binding
EC50 / μM CE50 Dose /
mg per 100IU
(C12)2-L-Asp-L-Orn (135 ± 5) (2.50 ± 0.09) (3.29 ± 0.12)
(C12)2-D-Asp-D-Orn (125 ± 9) (2.35 ± 0.17) (3.09 ± 0.22)

Chapter 6 – Hydrophobically-Enhanced Binders
213
Figure 6.17 – Heparin binding curves for (C12)2LAspLOrn and (C12)2DAspDOrn
obtained from MalB assay.
The data show that a concentration of ornithine-containing monomer in excess of 125
µM was required to displace 50% MalB from heparin. The CE50 values of 2.50 (± 0.09)
for LL and 2.35 (± 0.17) for DD confirm this rather inefficient heparin binding. Indeed,
counter-intuitively, despite being marginally more charge dense than their lysine-
containing counterparts, the (C12)2AspOrn systems exhibit inferior heparin binding
efficiencies. Clearly, this is another example of charge density not being the only factor
controlling binding ability.
Additionally, positioning the chiral centres closer to the binder extremity did not
enhance the ability of heparin to discriminate between the enantiomeric systems. To
some extent however, this absence of discrimination may be influenced by the
inefficiency of binding and failure of the amines closest to the chiral centres to interact
with heparin.
6.2.2.5 Heparin Binding in Clinically Relevant Conditions
Although less efficiently than the lysine-containing systems, (C12)2LAspLOrn and
(C12)2DAspDOrn both successfully displaced MalB from heparin in the presence of
competitive electrolytes. Next, the robustness of the heparin binding interactions was
challenged by subjecting (C12)2DAspDOrn to the MalB assay with heparin delivered in

Chapter 6 – Hydrophobically-Enhanced Binders
214
100% human serum. For consistency with our earlier studies, the DD-system was
examined. The data are shown in Table 6.7.
Table 6.7 – Heparin binding data for (C12)2DAspDOrn with heparin delivered in 100%
human serum.
Assay Conditions
Heparin Binding: (C12)2-D-Asp-D-Orn
EC50 / μM CE50 Dose /
mg per 100IU
Salt and Buffer (127 ± 9) (2.35 ± 0.17) (3.09 ± 0.22)
Heparin in 100% Human Serum (121 ± 7) (2.23 ± 0.12) (2.94 ± 0.16)
The data show that (C12)2DAspDOrn fully maintained heparin binding performance in
the presence of human serum. This result further supports the earlier observations that
the assemblies formed by the twin-tailed systems are robust enough to maintain
effective heparin binding interactions even in the presence of serum and its many
hydrophobic components.
6.2.2.6 DNA Binding
The ornithine-containing systems were also tested for their ability to bind DNA using
the ethidium bromide assay under the same conditions previously employed. The data
are presented numerically in Table 6.8 along with the binding curves in Figure 6.18.
Table 6.8 – DNA binding data for (C12)2LAspLOrn and (C12)2DAspDOrn obtained from
EthBr assay.
Compound DNA Binding
EC50 / μM CE50
(C12)2-L-Asp-L-Orn (3.24 ± 0.19) (1.61 ± 0.10)
(C12)2-D-Asp-D-Orn (5.89 ± 0.39) (2.93 ± 0.19)

Chapter 6 – Hydrophobically-Enhanced Binders
215
Figure 6.18 – DNA binding curves for (C12)2LAspLOrn and (C12)2DAspDOrn obtained
from EthBr assay.
The DNA data are interesting as the ornithine-containing binders were able to displace
50% EthBr at comparable concentrations to their lysine-containing counterparts. In
terms of charge efficiency (CE50), the DD-ornithine-system outperformed the DD-lysine-
system while the LL-ornithine system was inferior to its LL-lysine counterpart. This
observation contrasts somewhat with the heparin binding data, where both lysine-
containing systems were significantly more charge efficient than the ornithine-
derivatives. This hints, once again, at fundamental binding differences for heparin and
DNA. Further differences between the polyanion preferences were observed when
considering the relative performance of (C12)2LAspLOrn and (C12)2DAspDOrn. With
DNA as the binding target, the LL-system was clearly a superior binder, requiring only
60% as much charge as the DD-system (1.61 (± 0.10) vs 2.93 (± 0.19)) to effectively
displace 50% of EthBr and, although striking, this discrimination is less than observed
for the lysine-containing systems (1.55 (± 0.04) vs 4.39 (± 0.16)). This LL superiority
here correlates with the aspartic acid-lysine data and again points to DNA being more
sensitive than heparin to the spatial arrangement of the interaction sites within binding
partners.

Chapter 6 – Hydrophobically-Enhanced Binders
216
6.3 Generation 2 (G2) Lysine-containing System
A limitation of the twin-tailed heparin binders presented in the previous section was
their poor raw heparin binding ability. It was reasoned that the heparin binding ability of
the system might be increased through introduction of a larger, more highly charged,
binding group at the assembly surface. This size increase was achieved through the
introduction of further lysine residues to afford a ‘G2’ version of the aspartic acid-lysine
structure presented in the previous section. An advantage of this approach was that it
increased the number of chiral centres per monomer from two to four and it was hoped
that this may enhance the ability of heparin to discriminate between the enantiomeric
systems. It was also noted that the additional lysine residues may enhance the solubility
of the binder monomers. Specifically, the target molecules shown in Figure 6.19 were
designed.
Figure 6.19 – Two G2 aspartic acid-lysine target molecules (C12)2LAspLLys(LLys)2 and
(C12)2DAspDLys(DLys)2.
Each of the new target molecules contained a dendritic lysine tri-peptide as the heparin
binding surface group. Dendritic lysine structures are well-known359
and have been
widely studied for medicinal applications.360
For example, recent work led by
Kostarelos and Al-Jamal demonstrated the ability of high generation lysine dendrimers
to delay tumour growth both through systemic antiangiogenic activity361
and the ability
of such dendrimers to complex with, and enhance the cytotoxicity of, known
chemotherapeutic drugs such as doxorubicin.362
Lysine dendrimers have also shown
potential as gene transfection agents in vitro363
and been investigated in a variety of soft
materials364
and gel-based studies.365,366
Most commonly, however, lysine moieties are
appended onto a molecular scaffold such as another dendrimer,367
a growing polymer368
or are themselves functionalised in some other way369
to generate functional species. In

Chapter 6 – Hydrophobically-Enhanced Binders
217
particular, the haemolytic compatibility of Hashida and co-workers’ PEG-functionalised
lysine dendrimers369
fuelled our optimism about the potential biocompatibility of our
enlarged aspartic acid-lysine species.
6.3.1 Synthesis of (C12)2LAspLLys(LLys)2 and (C12)2DAspDLys(DLys)2
These new target molecules were synthesised from the same 1-dodecanol, aspartic acid
and lysine building blocks as the smaller G1 systems, however the chronology of each
synthetic step required careful consideration here. It was considered that the generation
and installation of the dendritic lysine moiety at the binder surface could proceed in
either a convergent or divergent manner, whereby the tri-peptide would be either
synthesised and then attached to the binder or generated layer-by-layer once on the
‘growing’ binder molecule. As demonstrated by Smith and co-workers in 2003, only the
divergent methodology – that is the layer-by-layer approach – was appropriate here in
order to retain the chiral integrity of the lysine residues within the final structure.370
Practically, this approach involved the peptide coupling of ‘additional’ protected lysine
residues to the already-synthesised (C12)2LAspLLys 6.9 or (C12)2DAspDLys 6.10,
Scheme 6.3. The yield of this coupling was low, although it is thought that either an
increased stoichiometric excess of Lys(Boc)2, a longer reaction time and/or an increased
reaction temperature may assist in fortifying this yield. The final target molecules
(C12)2LAspLLys(LLys)2 6.19 and (C12)2DAspDLys(DLys)2 6.20 were afforded in good
yields following Boc-deprotection under trifluoroacetic acid conditions. Only a very
small amount of (C12)2LAspLLys(LLys)2 6.19 (<7 mg) was produced and this restricted
some of the studies presented below.
Scheme 6.3 – Preparation of (C12)2LAspLLys(LLys)2 and (C12)2DAspDLys(DLys)2.
Once synthesised, the relative chiral character of the systems was probed using optical
rotation and the approximately equal and opposite values (LLLL: + 8.0, DDDD: – 6.5)
confirmed the opposing chirality had been retained following the introduction of the

Chapter 6 – Hydrophobically-Enhanced Binders
218
new amino acids. Owing to the limited amount of (C12)2LAspLLys(LLys)2 available,
circular dichroism studies were not conducted.
6.3.2 Self-Assembly Studies
6.3.2.1 Nile Red Assay
The ability of the G2 twin-tailed system to self-assemble was studied using a Nile red
encapsulation assay. Again, owing to the limited amount of (C12)2LAspLLys(LLys)2
available, only the D-system was examined. In previous examples, both members of
each enantiomeric pair of molecules exhibited comparable CAC values so this was not a
concern. The data, Figure 6.20, showed the CAC to be 14 (± 3) µM.
Figure 6.20 – Nile Red encapsulation curve for (C12)2DAspDLys(DLys)2.
The introduction of the lysine tri-peptide at the surface of the monomer unit resulted in
a significant decrease in the observed CAC value. This observation appears counter-
intuitive as the additional lysine groups increase the overall monomer hydrophilicity,
which may be expected to hinder aggregation/self-assembly. The observations do agree
with other previous studies however, for example the recent work of Haag and co-
workers, which noted a decrease in CACs as hydrophilic character of their systems
increased.72
In order to assess whether aggregate architecture may be influencing the
observed CAC values, TEM imaging was carried out.
6.3.2.2 TEM Images
Having established that self-assembly was occurring, (C12)2DAspDLys(DLys)2 was
examined by transmission electron microscopy to probe the morphology of the

Chapter 6 – Hydrophobically-Enhanced Binders
219
aggregates formed. As before, samples were prepared in the absence and presence of
heparin at a charge ratio of 1 on a formvar grid, stained with uranyl acetate and allowed
to dry prior to imaging. Representative TEM images are shown in Figure 6.21 and
Figure 6.22.
Figure 6.21 – TEM images of (C12)2DAspDLys(DLys)2 alone (scale bars: 50 nm (left),
200 nm (right)).
Figure 6.22 – TEM images of (C12)2DAspDLys(DLys)2 in the presence of heparin (scale
bars: 100 nm (left), 50 nm (right)).
The TEM images of (C12)2DAspDLys(DLys)2 alone show some interesting features;
there is evidence of several different assembled morphologies. For example, across the
background of the left grid in Figure 6.21, individual micelle-like aggregates can be
seen, each ca. 5 nm in diameter. There are also larger roughly-spherical species seen in
other regions of the grid with ca. 45 nm diameter. These larger species may arise either
due to the formation of superaggregates, which result from the further co-assembly of
many individual smaller micelles. It is also possible that these larger species are vesicles
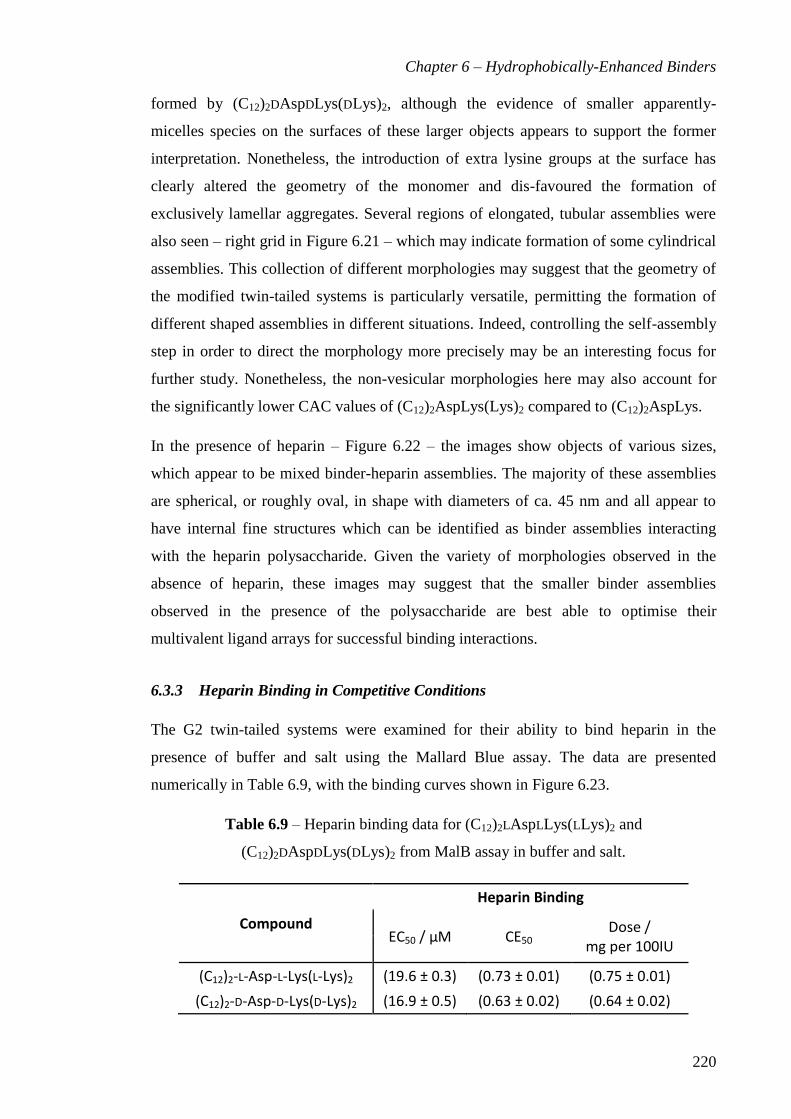
Chapter 6 – Hydrophobically-Enhanced Binders
220
formed by (C12)2DAspDLys(DLys)2, although the evidence of smaller apparently-
micelles species on the surfaces of these larger objects appears to support the former
interpretation. Nonetheless, the introduction of extra lysine groups at the surface has
clearly altered the geometry of the monomer and dis-favoured the formation of
exclusively lamellar aggregates. Several regions of elongated, tubular assemblies were
also seen – right grid in Figure 6.21 – which may indicate formation of some cylindrical
assemblies. This collection of different morphologies may suggest that the geometry of
the modified twin-tailed systems is particularly versatile, permitting the formation of
different shaped assemblies in different situations. Indeed, controlling the self-assembly
step in order to direct the morphology more precisely may be an interesting focus for
further study. Nonetheless, the non-vesicular morphologies here may also account for
the significantly lower CAC values of (C12)2AspLys(Lys)2 compared to (C12)2AspLys.
In the presence of heparin – Figure 6.22 – the images show objects of various sizes,
which appear to be mixed binder-heparin assemblies. The majority of these assemblies
are spherical, or roughly oval, in shape with diameters of ca. 45 nm and all appear to
have internal fine structures which can be identified as binder assemblies interacting
with the heparin polysaccharide. Given the variety of morphologies observed in the
absence of heparin, these images may suggest that the smaller binder assemblies
observed in the presence of the polysaccharide are best able to optimise their
multivalent ligand arrays for successful binding interactions.
6.3.3 Heparin Binding in Competitive Conditions
The G2 twin-tailed systems were examined for their ability to bind heparin in the
presence of buffer and salt using the Mallard Blue assay. The data are presented
numerically in Table 6.9, with the binding curves shown in Figure 6.23.
Table 6.9 – Heparin binding data for (C12)2LAspLLys(LLys)2 and
(C12)2DAspDLys(DLys)2 from MalB assay in buffer and salt.
Compound
Heparin Binding
EC50 / μM CE50 Dose /
mg per 100IU
(C12)2-L-Asp-L-Lys(L-Lys)2 (19.6 ± 0.3) (0.73 ± 0.01) (0.75 ± 0.01)
(C12)2-D-Asp-D-Lys(D-Lys)2 (16.9 ± 0.5) (0.63 ± 0.02) (0.64 ± 0.02)
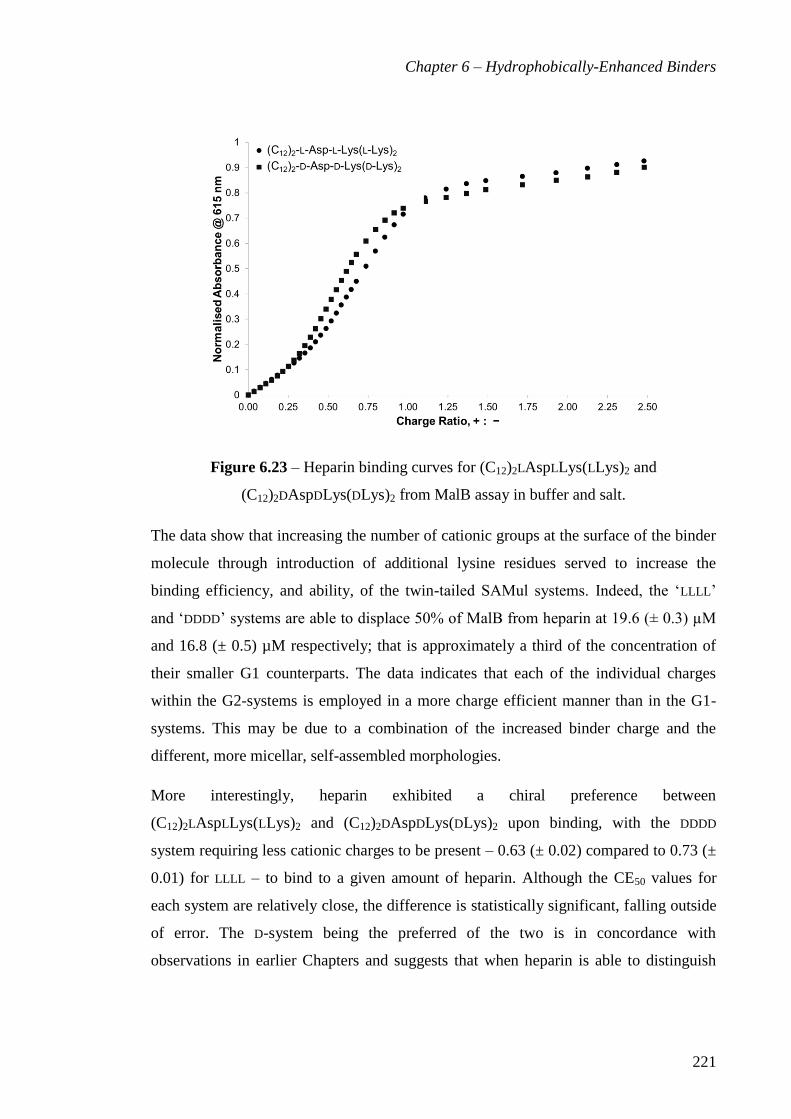
Chapter 6 – Hydrophobically-Enhanced Binders
221
Figure 6.23 – Heparin binding curves for (C12)2LAspLLys(LLys)2 and
(C12)2DAspDLys(DLys)2 from MalB assay in buffer and salt.
The data show that increasing the number of cationic groups at the surface of the binder
molecule through introduction of additional lysine residues served to increase the
binding efficiency, and ability, of the twin-tailed SAMul systems. Indeed, the ‘LLLL’
and ‘DDDD’ systems are able to displace 50% of MalB from heparin at 19.6 (± 0.3) µM
and 16.8 (± 0.5) µM respectively; that is approximately a third of the concentration of
their smaller G1 counterparts. The data indicates that each of the individual charges
within the G2-systems is employed in a more charge efficient manner than in the G1-
systems. This may be due to a combination of the increased binder charge and the
different, more micellar, self-assembled morphologies.
More interestingly, heparin exhibited a chiral preference between
(C12)2LAspLLys(LLys)2 and (C12)2DAspDLys(DLys)2 upon binding, with the DDDD
system requiring less cationic charges to be present – 0.63 (± 0.02) compared to 0.73 (±
0.01) for LLLL – to bind to a given amount of heparin. Although the CE50 values for
each system are relatively close, the difference is statistically significant, falling outside
of error. The D-system being the preferred of the two is in concordance with
observations in earlier Chapters and suggests that when heparin is able to distinguish

Chapter 6 – Hydrophobically-Enhanced Binders
222
differences between the spatial arrangement of a pair of enantiomeric binders, it finds
the charges of the D-system to be more optimally arranged.
Comparison of the performance of these G2 SAMul binders against the C22G1Lys and
C22G2Lys systems from Chapter 5 is insightful here. Both C22G1Lys and
(C12)2AspLys(Lys)2 present heparin with two lysine groups and four cationic charges
for binding yet clearly the twin-tailed systems are much superior binders. This may
suggest that the binding charges in the twin-tailed system are displayed in a more
complementary manner to the anionic charges along the heparin polysaccharide. In
terms of molecular weight, the twin-tailed systems are more massive than the C22G1Lys
monomers (858 Da vs 784 Da) and so can be argued to be less charge dense, thereby
providing another example of charge density not being the sole factor controlling
heparin binding ability. Additional comparison against the C22G2Lys monomer family
gives insights into the relative chiral expression of the two systems. Each monomer
presents heparin with four chiral centres yet the C22G2Lys systems, in which all the
chiral groups are present at the monomer/assembly surface, exhibited no discrimination
upon binding. The G2-twin-tailed system meanwhile, in which the chiral centres are
arranged linearly along the monomer structure, exhibited a small chiral difference upon
binding suggesting this arrangement promoted expression of the opposing molecular
‘handedness.’
6.3.4 Heparin Binding in Clinically Relevant Conditions
With the heparin binding ability of the twin-tailed G2 SAMul binders demonstrated in
buffer and salt, (C12)2DAspDLys(DLys)2 was examined in the presence of human serum
using the MalB assay. The data are shown in Table 6.10.
Table 6.10 – Heparin binding data for (C12)2DAspDLys(DLys)2 from MalB assay with
heparin delivered in 100% human serum.
Assay Conditions
Heparin Binding: (C12)2-D-Asp-D-Lys(D-Lys)2
EC50 / μM CE50 Dose /
mg per 100IU
Salt and Buffer (16.9 ± 0.5) (0.63 ± 0.02) (0.64 ± 0.02)
Heparin in 100% Human Serum (33.5 ± 0.7) (1.24 ± 0.03) (1.27 ± 0.03)

Chapter 6 – Hydrophobically-Enhanced Binders
223
The data show that in the presence of human serum, the performance of
(C12)2DAspDLys(DLys)2 decreased significantly, with twice as much cationic charge
required to displace 50% MalB during in the assay. This performance decrease suggests
the hydrophobic serum components may be disturbing the self-assembled aggregates,
thereby perturbing the display of a multivalent ligand array for binding. Such a
significant disruptive effect by serum is perhaps surprising given the robustness of the
smaller G1 twin-tailed aspartic acid-lysine systems in the previous section. So far, of the
systems presented in earlier Chapters, all of those perturbed by serum have adopted
spherical micellar self-assembled structures, while the G1 aspartic acid-lysine and
aspartic acid-ornithine molecules, which experienced minimal serum disruption,
adopted lamellar structures. The disruption of (C12)2DAspDLys(DLys)2, a twin-tailed
system which forms predominantly micellar assembles, appears to suggest that the
choice of hydrophobic unit is not the only factor to influence disruption, but rather that
the architecture/morphology of the self-assembled systems exerts a more controlling
role over serum stability. This suggests that serum components such as, for example,
albumin proteins are better able to gain access to the hydrophobic interior of a micelle
than penetrate the ‘double-layered’ nature of a vesicle wall in order to interfere with the
hydrophobically driven assembly. This assertion suggests that the individual monomers
are more tightly packed along the surface of a vesicle or lamellar structure than when in
a micellar formation and that this makes them less susceptible to serum/albumin
attack.308,371
6.4 Conclusions and Future Work
Three enantiomeric pairs of SAMul binder molecules were synthesised and examined
for their abilities to self-assemble and to interact with anionic targets heparin and DNA.
The first pair of molecules, (C12)2AspLys contained two twelve-carbon aliphatic tails in
their hydrophobic unit and were connected through a central aspartic acid linker unit to
a single lysine surface group. The use of a twin-tailed hydrophobe yielded
hydrophobically enhanced monomer units, which exhibited different packing
geometries to the systems examined previously. Indeed, self-assembly of these systems
was shown by TEM imagining to produce lamellar, rather than micellar, architectures,
which were shown to form spontaneously above ca. 70 µM by a Nile Red encapsulation
assay.

Chapter 6 – Hydrophobically-Enhanced Binders
224
These (C12)2AspLys systems were able to bind heparin in the presence of salt and
buffer, although performance was inferior to the previously tested C22G1Lys systems.
Importantly however, the hydrophobically enhanced (C12)2AspLys systems retained
their heparin binding performance in the presence of human serum; a feat none of the
previously tested SAMul binders achieved. Alongside these positive effects, the
increased hydrophobicity impacted negatively on the water solubility of the final
monomers, and this is thought to have affected the results of the plasma clotting assays,
where the compounds were unable to neutralise the anticoagulant action of heparin.
The pair of enantiomeric molecules exhibited identical heparin binding performances
suggesting that the spatial arrangement of charge in these systems had negligible impact
on interaction with heparin. When the same molecules were investigated for DNA
binding, however, a chiral difference was observed, with (C12)2LAspLLys binding 50%
of DNA at significantly lower concentrations, and more charge efficiently than
(C12)2DAspDLys.
In order to probe this chiral difference, a related family of twin-tailed binders containing
ornithine as the surface binding group instead of lysine were synthesised and tested. The
(C12)2AspOrn systems self-assembled to form lamellar aggregates above ca. 30 µM.
When tested for their heparin and DNA binding ability, these (C12)2AspOrn systems
were shown to bind the polyanions less efficiently than when lysine was the surface
group. Heparin exhibited minimal chiral preference between (C12)2LAspLOrn and
(C12)2DAspDOrn yet DNA bound the LL-enantiomer more efficiently than the DD, again
hinting strongly at fundamental binding differences between heparin and DNA. Despite
the poor heparin binding performance, the presence of serum caused minimal
perturbation.
In an attempt to increase the heparin binding performance of these twin-tailed systems,
a final iteration of the structure afforded a larger ‘second generation’ pair of
enantiomers (C12)2LAspLLys(LLys)2 and (C12)2DAspDLys(DLys)2, containing a lysine
tripeptide binding group at the surface. These larger monomers exhibited more charge
efficient heparin binding than their smaller ‘G1’ counterparts; however performance
was significantly perturbed in the presence of human serum. The presence of two
additional lysine groups was shown to alter the monomer geometry leading to the
formation primarily of spherical micellar assemblies. It was noted that these species

Chapter 6 – Hydrophobically-Enhanced Binders
225
shared the same morphology as the previously discussed C22G1Lys structures, which
themselves suffered significant perturbation by serum. This lead to the suggestion that
the relative stability of the smaller (C12)2AspLys and (C12)2AspOrn systems was
primarily due to their non-micellar vesicular/lamellar self-assembled architectures.
In order to investigate this suggestion more thoroughly, mesoscale modelling could be
employed to simulate the effect of, for example, an albumin protein upon the non-
covalent interactions holding the self-assembled structures together. Future
experimental work could target the synthesis of alternative monomer units with
geometries specifically designed to afford cylindrical and/or vesicular assemblies. To
achieve this, other hydrophobic units could be employed such as cholesterol-like steroid
species or multi-tailed/branched natural fatty acids and bile acids. Maintaining lysine as
the binding surface group may provide consistency within test conditions but would
also permit further studies of enantiomeric pairs of binder molecules, which may further
elucidate the fundamental binding differences between biological polyanions such as
heparin and DNA uncovered here.
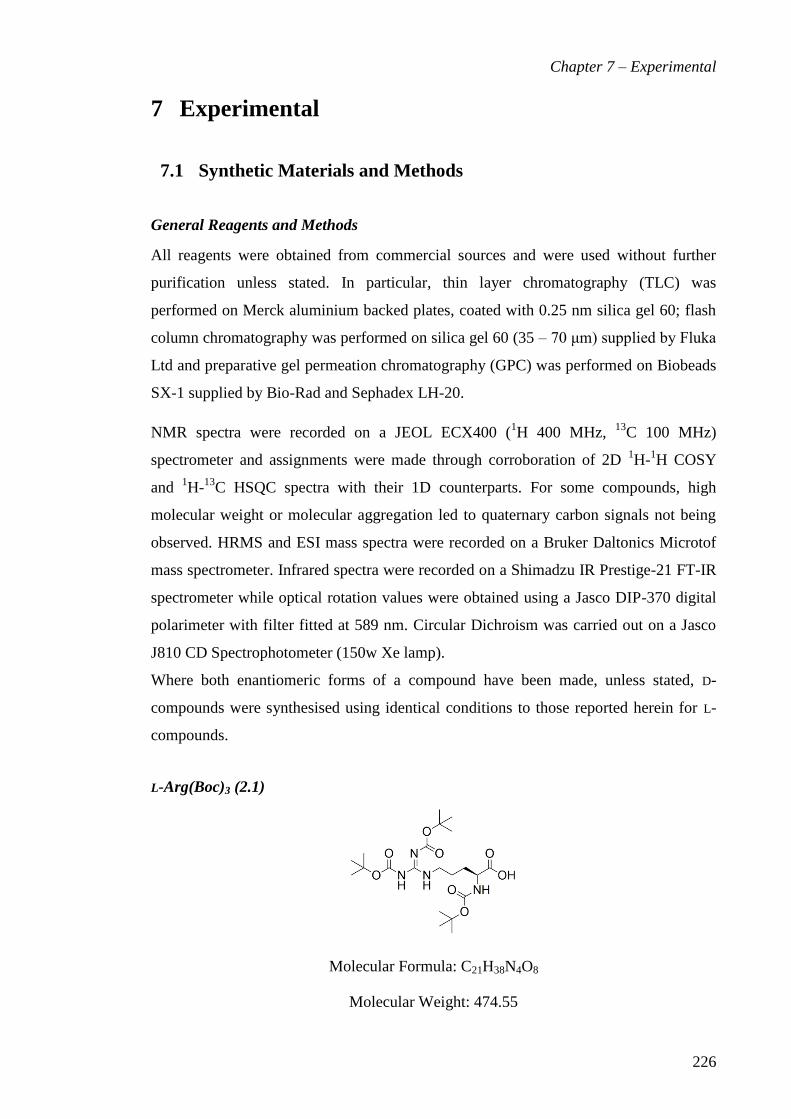
Chapter 7 – Experimental
226
7 Experimental
7.1 Synthetic Materials and Methods
General Reagents and Methods
All reagents were obtained from commercial sources and were used without further
purification unless stated. In particular, thin layer chromatography (TLC) was
performed on Merck aluminium backed plates, coated with 0.25 nm silica gel 60; flash
column chromatography was performed on silica gel 60 (35 – 70 μm) supplied by Fluka
Ltd and preparative gel permeation chromatography (GPC) was performed on Biobeads
SX-1 supplied by Bio-Rad and Sephadex LH-20.
NMR spectra were recorded on a JEOL ECX400 (1H 400 MHz,
13C 100 MHz)
spectrometer and assignments were made through corroboration of 2D 1H-
1H COSY
and 1H-
13C HSQC spectra with their 1D counterparts. For some compounds, high
molecular weight or molecular aggregation led to quaternary carbon signals not being
observed. HRMS and ESI mass spectra were recorded on a Bruker Daltonics Microtof
mass spectrometer. Infrared spectra were recorded on a Shimadzu IR Prestige-21 FT-IR
spectrometer while optical rotation values were obtained using a Jasco DIP-370 digital
polarimeter with filter fitted at 589 nm. Circular Dichroism was carried out on a Jasco
J810 CD Spectrophotometer (150w Xe lamp).
Where both enantiomeric forms of a compound have been made, unless stated, D-
compounds were synthesised using identical conditions to those reported herein for L-
compounds.
L-Arg(Boc)3 (2.1)
Molecular Formula: C21H38N4O8
Molecular Weight: 474.55

Chapter 7 – Experimental
227
L-Arginine (4.00 g, 22.96 mmol, 1 eq.) and sodium hydroxide pellets (2.75 g, 68.75
mmol, 3 eq.) were dissolved together in deionised water (70 mL). Di-tert-butyl
dicarbonate (20.00 g, 91.64 mmol, 4 eq., pre-dissolved in THF (70 mL)) was added to
the basic arginine solution dropwise in one portion over 55 minutes before the resulting
reaction mixture was stirred at 45°C under an N2 atmosphere for 4 hours. The volatiles
were removed in vacuo and the resulting residue was taken up in deionised water (300
mL) and washed with cyclohexane (100 mL). The aqueous layer was acidified to pH 3
(1.33 M NaHSO4, pH paper) before the product was extracted into ethyl acetate and
washed successively with brine (75 mL, sat.) and deionised water (75 mL). The organic
layer was collected, dried over MgSO4 and the resulting filtrate was concentrated in
vacuo to afford the product as a golden oil, which was taken up in DCM and
concentrated in vacuo once more to afford the product as a white crystalline solid (1.30
g, 2.74 mmol, 12%).
Rf = 0.56 (9 : 1, DCM : methanol, UV/ninhydrin)
1H NMR (400 MHz, CD3OD) δ: 4.10 (exp dd, app q, CHNH,
3J = 7.2 Hz, 1H); 3.88 (t,
CH2NH, 3J = 6.8 Hz, 2H); 1.90 – 1.76 (m, CHaHbCHNH, 1H); 1.67 (br s, CHaHbCHNH,
CH2CH2NH, 3H); 1.55, 1.48, 1.44 (s, C(CH3)3, 9H).
13C NMR (100 MHz, CD3OD) δ: 176.26 (C=O, acid); 158.56 (C=N); 158.15 (3 × C=O,
carbamate); 80.44, 79.85 (total 3 × C(CH3)3); 54.83 (CHNH); 41.01 (CH2NH); 30.56
(CH2CHNH); 28.86, 28.79, 28.62 (3 × C(CH3)3); 24.17 (CH2CH2NH).
ESI-MS: 475.28 [M+H]+ (100%).
HRMS: Calcd. [M+H]+ (C21H39N4O8) m/z = 475.2762, found [M+H]
+ m/z = 475.2769
(error − 1.0).
IR ν [cm-1
]: 3354br w (N–H), 2979m (O–H, C–H), 1710s (C=O, acid), 1640m (C=O,
carbamates), 1609m (C=N), 1503m (N–H), 1454w, 1391m, 1366s, 1273m, 1249s (C–
O), 1144s (C–O), 1052m, 852m, 812w.
LαD: + 17.7 (c. 1.0, CHCl3).
Thionine-(L-Arg(Boc)3)2 (aka. Mallard Blue(Boc)6)

Chapter 7 – Experimental
228
Molecular Formula: C54H82N11O14S
Molecular Weight: 1141.36
Thionine acetate (124 mg, 0.43 mmol), L-Arg(Boc)3 (450 mg, 0.95 mmol), TBTU (304
mg, 0.95 mmol) and DIPEA (330 µL, 1.90 mmol) were dissolved together in DCM (50
mL). The resulting reaction mixture was stirred at room temperature overnight before
volatiles were removed in vacuo to afford the crude product. This solid was purified by
flash column chromatography (SiO2, 3 : 2 ethyl acetate : cyclohexane) to afford the pure
product as a purple solid (145 mg, 0.13 mmol, 30%).
Rf = 0.39 (3 : 2, ethyl acetate : cyclohexane)
1H NMR (400 MHz, DMSO-d6) δ: 9.76 (br s, NH, 2H); 9.07 (br s, NH, 4H); 8.43 (br s,
NH, 2H); 7.26 (s, CHCS, 2H); 7.10 (d, ArCH, 3J = 8.3 Hz, 1H); 7.00 (d, ArCH,
3J = 8.3
Hz, 1H); 6.60 (d, ArCH, 3J = 8.3, 2H); 4.04 – 3.91 (m, 2 × CHNH, 2H); 3.80 – 3.73 (m,
2 × CH2NH, 4H); 1.66 – 1.51 (m, 2 × CH2CHCONH, 2 × CH2CH2NH, 8H); 1.43 (s,
C(CH3)3, 18H); 1.37 (s, C(CH3)3, 36H).
13C NMR (100 MHz, DMSO-d6) δ: 170.37 (2 × C=O, amides); 162.84, 159.51, 154.07
(2 × C=O, carbamates); 137.73 (C=N); 117.04 (ArCH); 115.71 (CHCS); 114.08
(ArCH); 77.92, 77.57 (3 × C(CH3)3); 51.31 (CHNH); 43.95 (CH2NH); 27.91, 27.36 (3 ×
C(CH3)3); 26.26 (CH2CHNH); 25.01 (CH2CH2NH).
ESI-MS: 1142.59 [M+H]+ (100%).
HRMS: Calcd. [M+H]+ (C54H84N11O14S) m/z = 1142.5914, found [M+H]
+ m/z =
1142.5866 (error 4.2 ppm).
IR ν [cm-1
]: 3372br m (N–H), 2978w (C–H); 1713s (C=O, amides); 1674s (C=O,
carbamates), 1605s (C=N), 1481s, 1366m, 1242s, 1142s, 1049m, 980w, 849w, 779w,
502s.
LαD: – 2.2 (c. 0.5, MeOH).
Thionine-(L-Arginine)2 (aka. Mallard Blue) (2.2)
Molecular Formula = C24H38Cl5N11O2S
Molecular Weight = 721.96
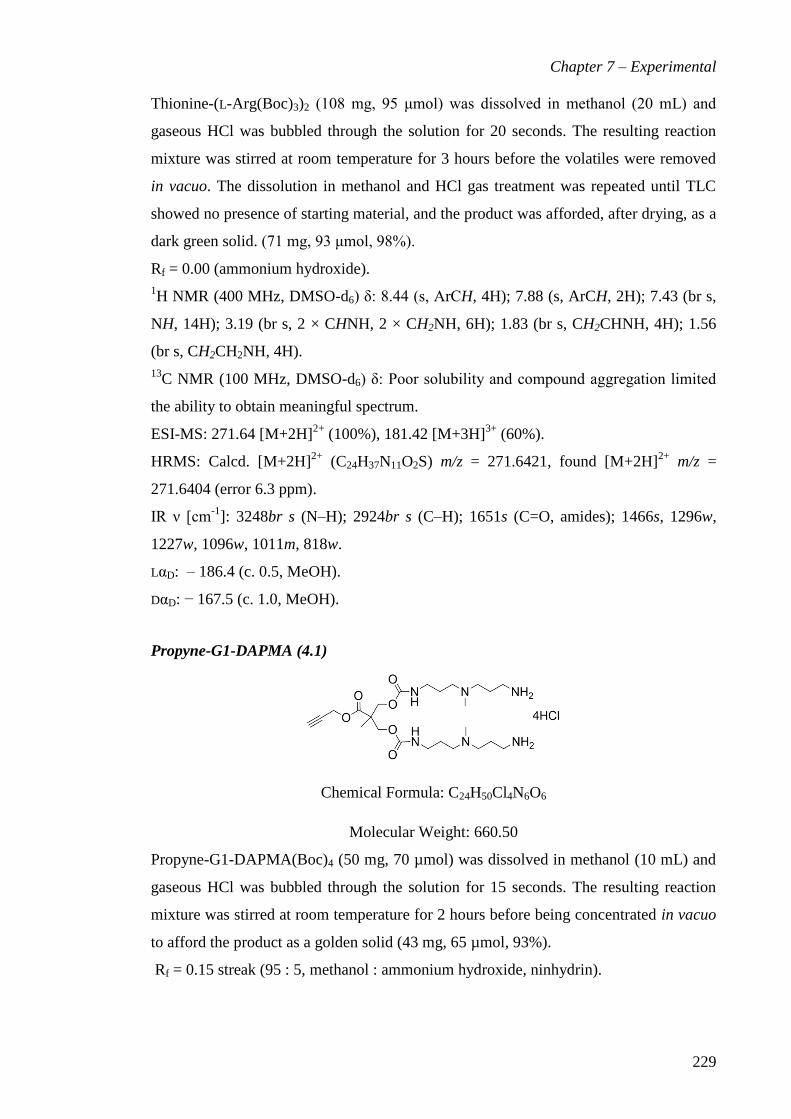
Chapter 7 – Experimental
229
Thionine-(L-Arg(Boc)3)2 (108 mg, 95 μmol) was dissolved in methanol (20 mL) and
gaseous HCl was bubbled through the solution for 20 seconds. The resulting reaction
mixture was stirred at room temperature for 3 hours before the volatiles were removed
in vacuo. The dissolution in methanol and HCl gas treatment was repeated until TLC
showed no presence of starting material, and the product was afforded, after drying, as a
dark green solid. (71 mg, 93 μmol, 98%).
Rf = 0.00 (ammonium hydroxide).
1H NMR (400 MHz, DMSO-d6) δ: 8.44 (s, ArCH, 4H); 7.88 (s, ArCH, 2H); 7.43 (br s,
NH, 14H); 3.19 (br s, 2 × CHNH, 2 × CH2NH, 6H); 1.83 (br s, CH2CHNH, 4H); 1.56
(br s, CH2CH2NH, 4H).
13C NMR (100 MHz, DMSO-d6) δ: Poor solubility and compound aggregation limited
the ability to obtain meaningful spectrum.
ESI-MS: 271.64 [M+2H]2+
(100%), 181.42 [M+3H]3+
(60%).
HRMS: Calcd. [M+2H]2+
(C24H37N11O2S) m/z = 271.6421, found [M+2H]2+
m/z =
271.6404 (error 6.3 ppm).
IR ν [cm-1
]: 3248br s (N–H); 2924br s (C–H); 1651s (C=O, amides); 1466s, 1296w,
1227w, 1096w, 1011m, 818w.
LαD: – 186.4 (c. 0.5, MeOH).
DαD: − 167.5 (c. 1.0, MeOH).
Propyne-G1-DAPMA (4.1)
Chemical Formula: C24H50Cl4N6O6
Molecular Weight: 660.50
Propyne-G1-DAPMA(Boc)4 (50 mg, 70 µmol) was dissolved in methanol (10 mL) and
gaseous HCl was bubbled through the solution for 15 seconds. The resulting reaction
mixture was stirred at room temperature for 2 hours before being concentrated in vacuo
to afford the product as a golden solid (43 mg, 65 µmol, 93%).
Rf = 0.15 streak (95 : 5, methanol : ammonium hydroxide, ninhydrin).

Chapter 7 – Experimental
230
1H NMR (400 MHz, CD3OD) δ: 4.74 (d, CH≡CCH2,
4J = 2.0 Hz, 2H); 4.21 (s, 2 ×
CH2O, 4H); 3.43 – 3.32 (m, 2 × CHNH3+, 4H); 3.31 – 3.17 (m, 4 × CH2NCH3, 8H);
3.14 – 3.07 (m, 2 × CH2NHCO, 4H); 3.04 (t, CH≡CCH2, 4J = 2.0 Hz, 1H); 2.21 – 2.10
(m, 2 × CH2CH2NH, 4H); 2.05 – 1.90 (m, CH2CH2NH2, 4H); 1.27 (s, CH3, 3H).
13C NMR (100 MHz, CD3OD) δ: 173.82 (C=O, Fréchet-ester); 158.58 (2 × C=O,
carbamates); 77.93 (HC≡CCH2); 76.93 (HC≡CCH2); 67.83, 66.94 (CH2O); 55.41, 55.33
(2 × CH2NCH3); 54.29 (2 × CH2NH2); 53.66 (HC≡CCH2); 40.63, 40.55 (NCH3); 38.75,
37.98 (CH2NHCO); 25.87, 25.40 (2 × CH2CH2N); 17.86 (CH3).
ESI-MS: 515.36 [M+H] +
(100%).
HRMS: Calcd. [M+H]+ (C24H47N6O6) m/z = 515.3557, found [M+H]
+ = 515.3571 (error
2.7 ppm).
IR ν [cm-1
]: 3375br w (N–H), 2975m (C–H), 1735m (C=O, ester), 1687s (C=O,
carbamates), 1526m, 1454w, 1365w, 1250m, 1166m, 1040m, 970w, 861w, 776w.
Behenoyl methanesulfonate372
(5.1)
Molecular Formula: C23H48O3S
Molecular Weight: 404.33
1-Docosanol (5.29 g, 16.20 mmol) was suspended in DCM (130 mL) and triethylamine
(5.23 mL, 37.52 mmol) was added. Methanesulfonyl chloride (2.00 mL, 25.84 mmol)
was added causing dissolution of the other reagents and turning the reaction mixture
yellow. The reaction mixture was stirred at room temperature for 4 hours before being
washed successively with deionised water (40 mL), HCl (40 mL, 2 M), deionised water
(40 mL), NaHCO3 (40 mL, sat.) and deionised water (40 mL). The organic phase was
collected, dried over MgSO4 and the resulting filtrate concentrated in vacuo to afford
the product as a yellow-white solid (6.10 g, 15.1 mmol, 93 %). The spectroscopic data
presented below is in agreement with that previously published.
Rf = 0.55 (9 : 1, DCM : methanol, UV).
1H NMR (400 MHz, CDCl3) δ: 4.21 (t, CH2O,
3J = 6.4 Hz, 2H); 3.00 (s, CH3SO3, 3H);
1.74 (quint, CH2CH2O, 3J = 6.4 Hz, 2H); 1.25 (s, 19 × CH2, 38H); 0.88 (t, alkylCH3,
3J
= 7.8 Hz, 3H).

Chapter 7 – Experimental
231
13C NMR (100 MHz, CDCl3) δ: 70.19 (CH2O); 37.36 (CH3SO3); 29.69, 29.67, 29.65,
29.61, 29.52, 29.42, 29.36, 29.12 (alkylCH2); 29.03 (CH2CH2O); 25.41, 22.69
(alkylCH2); 14.12 (alkylCH3).
ESI-MS: Calcd. [M+Na]+ (C23H48NaO3S) m/z = 427.3216, found [M+Na]
+ m/z =
427.3203 (error – 3.0 ppm).
IR ν [cm-1
]: 2914s (C–H), 2848m (C–H), 2161w, 2025w, 1975w, 1469m, 1335s, 1164m,
979m, 940s, 847s, 748w, 715m.
Behenoyl Azide372
(5.2)
Molecular Formula: C22H45N3
Molecular Weight: 351.36
Docosyl methanesulfonate (5.80 g, 14.34 mmol) was dissolved in DMF (100 mL) and
sodium azide (2.32 g, 35.69 mmol) was added. The reaction was stirred at room
temperature for 30 minutes before warming to 85°C for 5.5 hours. After cooling to
room temperature, hexane (100 mL) and deionised water (10 mL) were added. The
organic layer was collected and washed successively with NaHCO3 (20 mL, sat.) and
brine (20 mL, sat.). The organic layer was dried over Na2SO4 and the resulting filtrate
was concentrated in vacuo to afford the product as a sticky white solid (4.10 g, 11.66
mmol, 82%). The spectroscopic data presented below is in agreement with that
previously published.
Rf = 0.70 (9 : 1, DCM : methanol, KMnO4).
1H NMR (400 MHz, CDCl3) δ: 3.25 (t, CH2N3,
3J = 7.2 Hz, 2H); 1.59 (quint,
CH2CH2N3, 3J = 7.2 Hz, 2H); 1.25 (s, 19 × alkylCH2, 38H); 0.88 (t, alkylCH3,
3J = 6.4
Hz, 3H).
13C NMR (100 MHz, CDCl3) δ: 51.35 (CH2N3); 31.69, 29.45, 29.43, 29.41, 29.37,
29.29, 29.23, 29.11, 28.90, 28.58, 26.45 (alkylCH2); 22.40 (CH2CH3); 13.78 (CH3).
ESI-MS: Calcd. [M+H]+ (C22H45N3) m/z = 351.36. No peak found, ionisation technique
too soft.
IR ν [cm-1
]: 2916s (C–H), 2849s (C–H), 2095s (N3), 1644m, 1351w, 1255m, 1063w,
892w, 720m.
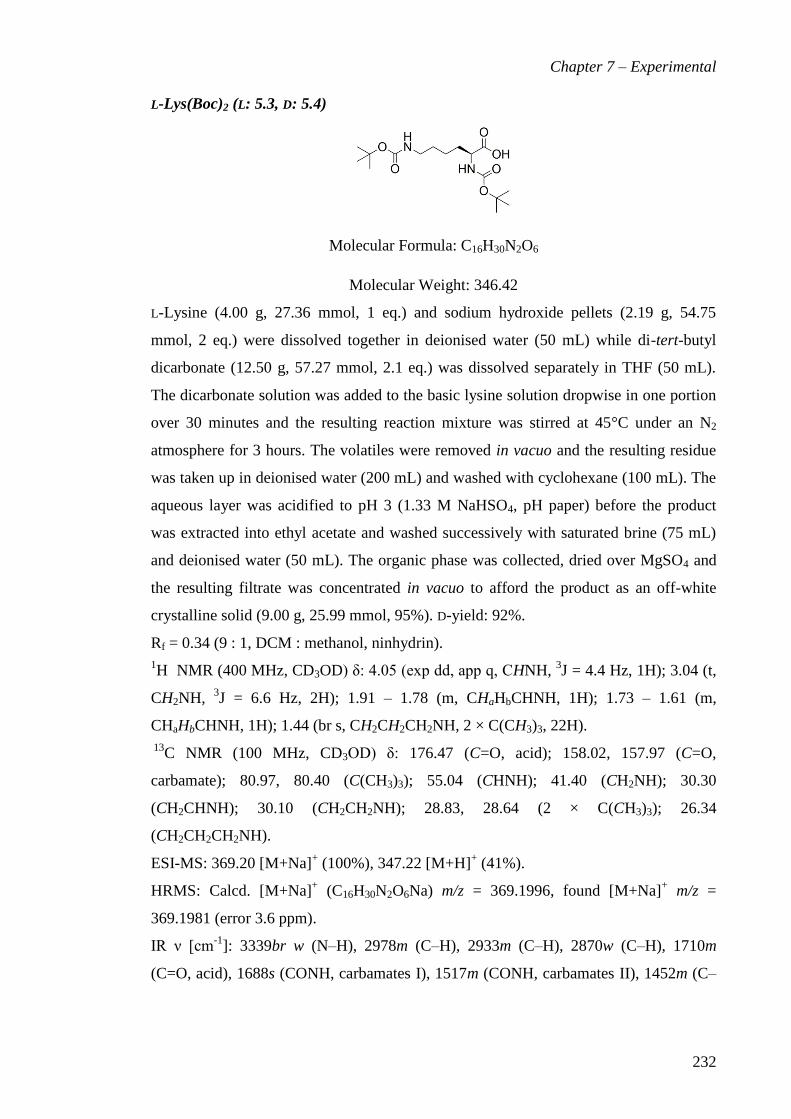
Chapter 7 – Experimental
232
L-Lys(Boc)2 (L: 5.3, D: 5.4)
Molecular Formula: C16H30N2O6
Molecular Weight: 346.42
L-Lysine (4.00 g, 27.36 mmol, 1 eq.) and sodium hydroxide pellets (2.19 g, 54.75
mmol, 2 eq.) were dissolved together in deionised water (50 mL) while di-tert-butyl
dicarbonate (12.50 g, 57.27 mmol, 2.1 eq.) was dissolved separately in THF (50 mL).
The dicarbonate solution was added to the basic lysine solution dropwise in one portion
over 30 minutes and the resulting reaction mixture was stirred at 45°C under an N2
atmosphere for 3 hours. The volatiles were removed in vacuo and the resulting residue
was taken up in deionised water (200 mL) and washed with cyclohexane (100 mL). The
aqueous layer was acidified to pH 3 (1.33 M NaHSO4, pH paper) before the product
was extracted into ethyl acetate and washed successively with saturated brine (75 mL)
and deionised water (50 mL). The organic phase was collected, dried over MgSO4 and
the resulting filtrate was concentrated in vacuo to afford the product as an off-white
crystalline solid (9.00 g, 25.99 mmol, 95%). D-yield: 92%.
Rf = 0.34 (9 : 1, DCM : methanol, ninhydrin).
1H NMR (400 MHz, CD3OD) δ: 4.05 (exp dd, app q, CHNH,
3J = 4.4 Hz, 1H); 3.04 (t,
CH2NH, 3J = 6.6 Hz, 2H); 1.91 – 1.78 (m, CHaHbCHNH, 1H); 1.73 – 1.61 (m,
CHaHbCHNH, 1H); 1.44 (br s, CH2CH2CH2NH, 2 × C(CH3)3, 22H).
13C NMR (100 MHz, CD3OD) δ: 176.47 (C=O, acid); 158.02, 157.97 (C=O,
carbamate); 80.97, 80.40 (C(CH3)3); 55.04 (CHNH); 41.40 (CH2NH); 30.30
(CH2CHNH); 30.10 (CH2CH2NH); 28.83, 28.64 (2 × C(CH3)3); 26.34
(CH2CH2CH2NH).
ESI-MS: 369.20 [M+Na]+ (100%), 347.22 [M+H]
+ (41%).
HRMS: Calcd. [M+Na]+ (C16H30N2O6Na) m/z = 369.1996, found [M+Na]
+ m/z =
369.1981 (error 3.6 ppm).
IR ν [cm-1
]: 3339br w (N–H), 2978m (C–H), 2933m (C–H), 2870w (C–H), 1710m
(C=O, acid), 1688s (CONH, carbamates I), 1517m (CONH, carbamates II), 1452m (C–

Chapter 7 – Experimental
233
H), 1392m, 1365s (C–H), 1249s (C–O), 1159s (C–O), 1047m (C–N), 1018m (C–N),
860m.
θL: + 61.5 mdeg (211 nm, 10 mM, MeOH).
θD: − 56.9 mdeg (211 nm, 10 mM, MeOH).
L-Lys(Boc)2-succinimide (L: 5.5, D: 5.6)
Molecular Formula: C20H33N3O8
Molecular Weight: 443.49
L-Lys(Boc)2 (3.50 g, 10.10 mmol), N-hydroxysuccinimide (1.16 g, 10.10 mmol) and
DCC (2.08 g, 10.10 mmol) were dissolved together in dry DMF (60 mL) and stirred at
room temperature under an N2 atmosphere for 24 hours. The DCU by-product was
removed by filtration through a celite-containing sinter funnel. The resulting filtrate was
concentration in vacuo to afford the crude product as a soft golden wax (5.10 g, 11.5
mmol, 114% crude). This crude product carried forward in synthesis, however a portion
of crude product (1.00 g) was taken for purification by flash column chromatography
(SiO2, DCM : ethyl acetate, 8 : 2) to afford product as an off-white solid (750 mg, 1.7
mmol, 86% effective yield). D-yield: 83%.
Rf = 0.44 (9 : 1 DCM : methanol, ninhydrin).
1H NMR (400 MHz, CD3OD) δ: 4.45 (dd, CHNH,
3J
3J = 8.8, 5.2 Hz, 1H); 3.05 (br s,
CH2NH, 2H); 2.83 (s, 2 × succinimideCH2, 4H); 1.98 – 1.90 (m, CHaHbCHNH, 1H);
1.86 – 1.78 (m, CHaHbCHNH, 1H); 1.52 (s, CH2CH2NH and CH2CH2CH2NH, 4H);
1.45 (s, 2 × C(CH3)3, 18H).
13C NMR (100 MHz, CD3OD) δ: 170.03 (C=O, lysine ester); 163.53 (2 × C=O,
succinimide); 157.22, 156.38 (C=O, carbamate); 79.55, 78.53 (C(CH3)3); 52.04
(CHNH); 39.60 (CH2NH); 31.08 (CH2CHNH); 29.09 (CH2CH2NH); 27.52 (2 ×
C(CH3)3); 25.21 (2 × succinimideCH2); 22.51 (CH2CH2CH2NH).
ESI-MS: 466.22 [M+Na]+ (100%), 444.24 [M+H]
+ (46%).
HRMS: Calcd. [M+Na]+ (C20H33N3O8Na) m/z = 466.2160, found [M+Na]
+ m/z =
466.2174 (error – 3.0 ppm).

Chapter 7 – Experimental
234
IR ν [cm-1
]: 3380w (N–H), 3364w (N–H), 2980w (C–H), 2936w (C–H), 1814w, 1788w,
1736s (C=O, ester), 1678s (CONH, carbamates I), 1511s (CONH, carbamates II),
1462w (C–H), 1390w, 1368m (C–H), 1341w, 1247m, 1211m, 1159s (C–O), 1086s (C–
N), 1071m (C–N), 1046w, 998m, 961m, 868m.
LαD: − 9.2 (c. 1.0, CHCl3).
DαD: + 7.0 (c. 1.0, CHCl3).
Isopropylidene-2,2,bis(hydroxymethyl)propionic acid357
(5.7)
Molecular Formula: C8H14O4
Molecular Weight: 174.19
2,2-Bis(hydroxymethyl)propionic acid (15.00 g, 111.83 mmol), 2,2-
dimethyloxypropane (20 mL, 162.65 mmol) and p-toluenesulfonic acid monohydrate
(1.00 g, 5.25 mmol) were dissolved together in acetone (60 mL) and stirred at room
temperature until TLC showed no presence of starting material (4 h). The acid catalyst
was neutralised by addition of ammonium hydroxide : ethanol (3 mL, 1 : 1) leading to
formation of a white precipitate after ten minutes. The volatiles were removed in vacuo
to afford a white sludge which was taken up in DCM (60 mL) and washed with distilled
water (2 × 30 mL). The organic layer was collected, dried over MgSO4 and the resulting
filtrate concentrated in vacuo to afford the product as a white crystalline sold (10.30 g,
59.13 mmol, 53%). The spectroscopic data presented below is in agreement with that
previously published.
Rf = 0.56 (9 : 1, DCM : methanol, UV).
1H NMR (400 MHz, CDCl3) δ: 4.18 (d, CHaxHeqO,
2J = 12.0 Hz, 2H); 3.67 (d,
CHaxHeqO, 2J = 12.0 Hz, 2H), 1.45 (s, CH3CO2, 3H); 1.41 (s, CH3CO2, 3H); 1.21 (s,
CH3CCO, 3H).
13C NMR (100 MHz, CDCl3) δ: 180.32 (C=O, acid); 98.27 (C(CH3)2); 65.77 (2 ×
CH2O); 41.70 (CCOOH); 25.10, 21.96, 18.40 (CH3).
ESI-MS: 197.08 [M+Na]+ (100%), 175.10 [M+H]
+ (51%).
HRMS: Calcd. [M+Na]+ (C8H14O4Na) m/z = 197.0784, found [M+Na]
+ m/z = 197.0781
(error 1.6 ppm).

Chapter 7 – Experimental
235
IR ν [cm-1
]: 2994br w (O–H), 2159s (C–H), 2028s (C–H), 1975br s, 1719m (C=O,
acid), 1380w (C–H), 1255s (C–O), 1073s, 862w, 826s, 718m.
Isopropylidene-2-2,bis(hydroxymethyl)propionic anhydride313
(5.8)
Molecular Formula: C16H26O7
Molecular Weight: 330.37
Isopropylidene-2,2,bis(hydroxymethyl)propionic acid (9.00 g, 51.67 mmol) was
dissolved in DCM (50 mL) before DCC (5.33 g, 25.83 mmol, pre-dissolved in DCM
(40 mL)), was added. The resulting white reaction mixture was stirred at room
temperature for 3 hours before the precipitate (DCU by-product) was filtered off
through a celite-containing sinter funnel. The filter cake washings (DCM) were
combined with the filtrate and concentrated in vacuo to afford a residue which was
taken up in ethyl acetate, causing further by-product precipitation. The precipitate was
filtered off as before to afford, after drying, the product as a golden viscous oil (5.90 g,
17.86 mmol, 69%). The spectroscopic data presented below is in agreement with that
previously published.
Rf = 0.62 (9 : 1, DCM : methanol, UV).
1H NMR (400 MHz, CDCl3) δ: 4.20 (d, CHaxHeqO,
2J = 12.0 Hz, 4H); 3.68 (d,
CHaxHeqO, 2J = 12.0 Hz, 4H); 1.43 (s, 2 × CH3CO2, 6H); 1.38 (s, 2 × CH3CO2, 6H);
1.23 (s, 2 × CH3CCO, 6H).
13C NMR (100 MHz, CDCl3) δ: 169.42 (2 × C=O); 98.27 (2 × C(CH3)2); 65.59 (4 ×
CH2O); 43.57 (2 × CCOO); 25.48, 21.48, 17.56 (3 × CH3).
ESI-MS: 353.16 [M+Na]+ (100%), 331.16 [M+H]
+ (59%).
HRMS: Calcd. [M+Na]+ (C16H26O7Na) m/z = 353.1571, found [M+Na]
+ m/z = 353.1750
(error 0.0 ppm).
IR [cm-1
]: 2991w (C–H), 2159m (C–H), 2032m (C–H), 1976m, 1812m (C=O,
anhydride), 1736m (C=O, anhydride), 1455w, 1373m, 1205m, 1152m, 1133m, 1081m,
1013s, 984m, 935w, 917w, 826s, 731w.

Chapter 7 – Experimental
236
Propyne isopropylidene-2,2-bis(hydroxymethyl) propionate325
(5.9)
Molecular Formula: C11H16O4
Molecular Weight: 212.24
Propargyl alcohol (0.73 mL, 12.54 mmol), DMAP (0.23 g, 1.88 mmol) and pyridine
(3.06 mL, 37.79 mmol) were dissolved in DCM (11 mL) and isopropylidene-2,2-
bis(hydroxymethyl)propionic anhydride (5.00 g, 15.13 mmol, pre-dissolved in DCM
(23 mL)), was added slowly in one portion. The reaction mixture was stirred overnight
at room temperature before being quenched with deionised water (5 mL), diluted with
DCM (50 mL) and washed successively with NaHSO4 (3 × 30 mL, 1.33 M), Na2CO3 (3
× 30 mL, 10%) and saturated brine (1 × 30 mL). The organic layer was collected, dried
over MgSO4 and the resulting filtrate was concentrated in vacuo to afford the product as
a pale yellow oil (2.65 g, 12.49 mmol, 98%). The spectroscopic data presented below is
in agreement with that previously published.
Rf = 0.91 (9 : 1, DCM : methanol, UV).
1H NMR (400 MHz, CDCl3) δ: 4.74 (d, CH≡CCH2,
4J = 2.4 Hz, 2H); 4.20 (d,
CHaxHeqO, 2J = 12.0 Hz, 2H); 3.70 (d, CHaxHeqO,
2J = 12.0 Hz, 2H); 2.47 (t, CH≡CCH2,
4J = 2.4 Hz, 1H); 1.43 (s, CH3CO2, 3H); 1.39 (s, CH3CO2, 3H); 1.21 (s, CH3CCO, 3H).
13C NMR (100 MHz, CDCl3) δ: 173.33 (C=O, ester); 98.01 (C(CH3)2); 77.37
(CH2C≡CH); 74.94 (C≡CH); 65.80 (CH2O); 52.25 (C≡CH); 41.77 (CCOO); 24.52,
22.48, 18.31 (CH3).
ESI-MS: 235.09 [M+Na]+ (100%), 213.11 [M+H]
+ (30%).
HRMS: Calcd. [M+Na]+
(C11H16NaO4) m/z = 235.0941, found [M+Na]+
m/z = 235.0942
(error – 0.8 ppm).
IR ν [cm-1
]: 2160br w (C≡C, C–H), 1737m (C=O, ester), 1453w, 1372w, 1251m (C–O),
1218m (C–O), 1198m, 1120m, 1078s, 1040w, 997w, 934w, 830s.

Chapter 7 – Experimental
237
Propyne-[G1]-OH325
(5.10)
Molecular Formula: C8H12O4
Molecular Weight: 172.18
Propyne isopropylidene-2,2-bis(hydroxymethyl) propionate (2.55 g, 12.01 mmol) was
dissolved in methanol (102 mL, 25 mg mL-1
) and c.H2SO4 (2.04 mL, 2% v/v) was
added. After stirring at room temperature overnight, the reaction was neutralised with
ammonium hydroxide : methanol (8 mL, 1 : 1) causing ammonium sulfate to
precipitate. After 30 minutes further stirring, the precipitate was filtered off through a
celite-containing sinter funnel and the filtrate concentrated in vacuo. This crude product
was taken up in chloroform, re-filtered as before and the resulting filtrate concentrated
in vacuo to afford the product as a yellow oil (1.56 g, 9.06 mmol, 75%). The
spectroscopic data presented below is in agreement with that previously published.
Rf = 0.60 (9 : 1, DCM : methanol, UV).
1H NMR (400 MHz, CDCl3) δ: 4.75 (d, CH≡CCH2,
4J = 2.5 Hz, 2H); 3.92 (d, CHaHbO,
2J = 8.0 Hz, 2H); 3.72 (d, CHaHbO,
2J = 8.0 Hz, 2H); 2.48 (t, CH≡CCH2,
4J = 2.5 Hz,
1H); 1.08 (s, CH3CCO, 3H).
13C NMR (100 MHz, CDCl3) δ: 174.92 (C=O, ester); 77.31 (CH2C≡CH); 75.19
(C≡CH); 66.88 (2 × CH2OH); 52.35 (C≡CH); 49.31 (CCOO); 16.95 (CH3).
ESI-MS: 195.06 [M+Na]+ (100%), 171.06 [M+H]
+ (37%).
HRMS: Calcd. [M+Na]+ (C8H12NaO4) m/z = 195.0628, found [M+Na]
+ = 195.0629
(error – 0.4 ppm).
IR ν [cm-1
]: 3279br w (C–H, alkyne), 2160m (C≡C), 2032m (C–H), 1971m, 1728m
(C=O, ester), 1451w (C–H), 1030s, 1000m, 966m, 763m.

Chapter 7 – Experimental
238
Propyne-[G1]-L-Lys(Boc)2 (L: 5.11, D: 5.12)
Molecular Formula: C40H68N4O14
Molecular Weight: 828.47
L-Lys(Boc)2-succinimide (1.00 g, 2.25 mmol, 4 eq.), DMAP (138 mg, 1.13 mmol, 2 eq.)
and DIPEA (491 μL, 2.82 mmol, 5 eq.) were dissolved together in dry DMF (15 mL).
Propyne-[G1]-OH (97 mg, 0.56 mmol, 1 eq., pre-dissolved in dry DMF (10 mL)) was
added to the reaction mixture, which was stirred at room temperature under an N2
atmosphere for 48 hours. The volatiles were removed in vacuo to afford the crude
product as a golden viscous oil. The crude product was purified in a portion-wise
manner by gel permeation chromatography (DCM : methanol, 95 : 5) to afford the pure
product as a golden foam (316 mg, 0.4 mmol, 68% effective yield). D-yield: 63%.
Rf = 0.78 (9 : 1, DCM : methanol, UV/ninhydrin).
1H NMR (400 MHz, CD3OD) δ: 4.76 (d, CH≡CCH2,
4J = 2.6 Hz, 2H); 4.35 – 4.22 (m,
2 × CH2O, 4H); 4.08 (br s, 2 × CHNH, 2H); 3.04 (t, 2 × CH2NH, 3J = 6.4 Hz, 4H); 2.99
(t, CH≡CCH2, 4J = 2.6 Hz, 1H); 1.82 – 1.73 (m, 2 × CHaHbCHNH, 2H); 1.69 – 1.57 (m,
2 × CHaHbCHNH, 2H); 1.44 (br s, 4 × C(CH3)3, 2 × CH2CH2NH, 2 × CH2CH2CH2NH,
44H); 1.30 (s, CH3, 3H).
13C NMR (100 MHz, CD3OD) δ: 173.80 (2 × C=O, lysine esters); 173.25 (C=O, Fréchet
ester); 158.56, 158.06 (2 × C=O, carbamate); 80.61, 79.88 (2 × C(CH3)3); 78.47
(CH≡CCH2); 76.97 (CH≡CCH2); 66.86, 66.81 (CH2O); 55.05 (2 × CHNH); 53.72
(CH≡CCH2); 47.73 (CCOO); 40.98 (CH2NH); 32.21 (CH2CHNH); 30.56
(CH2CH2NH); 28.89, 28.84 (2 × C(CH3)3); 24.16 (CH2CH2CH2NH); 18.09 (CH3).
ESI-MS: 851.46 [M+Na]+ (100%), 829.48 [M+H]
+ (81%).
HRMS: Calcd. [M+Na]+ (C40H68N4O14Na) m/z = 851.4624, found [M+Na]
+ m/z =
851.4609 (error 2.0 ppm).

Chapter 7 – Experimental
239
IR ν [cm-1
]: 3363w (N–H), 2975w (C–H), 1745m (C=O, ester), 1689s (CONH,
carbamates I), 1512m (CONH, carbamates II), 1454w, 1365m, 1247m, 1158s (C–O),
1101m, 865w, 781w.
Propyne-[G1]-L-Lysine (5.13)
Chemical Formula: C20H40Cl4N4O6
Molecular Weight: 574.37
Propyne-[G1]-L-Lys(Boc)2 (52 mg, 63 μmol) was dissolved in methanol (10 mL) and
gaseous HCl was bubbled through the solution for 15 seconds. The resulting reaction
mixture was stirred at room temperature for 3 hours before being concentrated in vacuo
to afford the product as an off-white crystalline solid (36 mg, 63 μmol, quantitative
yield).
Rf = 0.15 streak (95 : 5, methanol : ammonium hydroxide, ninhydrin).
1H NMR (400 MHz, CD3OD) δ: 4.81 (exp d, app s, CH≡CCH2, 2H); 4.85 – 4.40 (m, 2
× CH2O, 4H); 4.16 (exp dd, app br s, 2 × CHNH3+, 2H); 3.12 (exp t, app s, CH≡CCH2,
1H); 2.99 (exp t, app s, 2 × CH2NH3+, 4H); 1.98 (br s, 2 × CH2CHNH3
+, 4H); 1.76 (br s,
2 × CH2CH2NH, 4H); 1.59 – 1.48 (br m, 2 × CH2CH2CH2NH3+, 4H); 1.38 (s, CH3, 3H).
13C NMR (100 MHz, CD3OD) δ: 172.93 (C=O, Fréchet-ester); 170.17, 170.12 (C=O,
lysine-ester); 78.48 (CH≡CCH2); 77.35 (CH≡CCH2); 68.18, 68.09 (CH2O); 54.09
(CH≡CCH2); 53.77 (2 × CHNH3+); 47.62 (CCH3); 40.36 (CH2NH3
+); 30.97
(CH2CHNH2); 28.04 (CH2CH2NH2); 23.27 (CH2CH2CH2NH3+); 17.99 (CH3).
ESI-MS: 215.13 [M+2H]2+
(100%), 429.27 [M+H]+ (24%).
HRMS: Calcd. [M+H]+ (C20H37N4O6) m/z = 429.2708, found [M+H]
+ m/z = 429.2715
(error – 2.0 ppm).
IR ν [cm-1
]: 3380br w (N–H), 3200w (C–H, alkyne), 2917s (C–H), 2850s (C–H),
1740m (C=O, esters), 1467m, 1398w, 1216m, 1137m (C–O), 1056w, 997m, 841w.
αD: + 7.4 (c. 1.0, MeOH).

Chapter 7 – Experimental
240
C22-[G1]-L-Lys(Boc)2 (L: 5.14, D: 5.15)
Molecular Formula: C62H113N7O14
Molecular Weight: 1180.60
Propyne-[G1]-L-Lys(Boc)2 (150 mg, 181 μmol, 1.1 eq.), behenoyl azide (58 mg, 164
μmol, 1 eq.), CuSO4·5H2O (4 mg, 16 μmol, 0.1 eq.) and sodium ascorbate (7 mg, 33
μmol, 0.2 eq.) were dissolved together in a mixture of degassed THF : water (4 : 1 v/v,
10 mL). The reaction mixture was stirred at room temperature under an N2 atmosphere
for 16 hours before being concentrated in vacuo. The resulting sludge was taken up in
DCM (35 mL) and washed with deionised water (2 × 15 mL). The organic phase was
collected, dried over MgSO4 and the resulting filtrate concentrated in vacuo to afford
the crude product as an off-white sticky solid. The crude product was purified by gel
permeation chromatography (DCM) to afford the product as an off-white sticky foam
(135 mg, 114 μmol, 70%). D-yield: 80%.
Rf = 0.70 (9 : 1, DCM : methanol, ninhydrin).
1H NMR (400 MHz, CD3OD) δ: 8.06 (s, triazoleCH, 1H); 5.26 (s, (triazole)CH2O, 2H);
4.42 (t, CH2Ntriazole, 3J = 7.0 Hz, 2H); 4.34 – 4.20 (m, 2 × CH2O, 4H); 4.04 (exp dd,
app br t, 2 × CHNH, 3J = 4.0 Hz, 2H); 3.04 (t, 2 × CH2NH,
3J = 6.4 Hz, 4H); 1.91 (exp
tt, app t, CH2CH2(triazole), 3J = 7.0 Hz, 2H); 1.77 – 1.69 (m, 2 × CHaHbCHNH, 2H);
1.65 – 1.56 (m, 2 × CHaHbCHNH, 4H); 1.44 (br s, 4 × C(CH3)3, 2 × CH2CH2NH, 40H);
1.29 (br s, 19 × alkylCH2, CH3CCO, 41H); 1.26 (br s, 2 × CH2CH2CH2NH, 4H); 0.90 (t,
alkylCH3, 3J = 7.2 Hz, 3H).
13C NMR (100 MHz, CD3OD) δ: 172.39 (3 × C=O, esters); 157.19, 157.15, 156.67
(total 4 × C=O, carbamate); 142.21 (triazoleCCH2O); 124.62 (triazoleCH); 79.15, 78.45
(2 × C(CH3)3); 65.50 (2 × CH2O); 57.90 ((triazole)CH2O); 53.72, 53.68 (CHNH); 50.16
((triazole)CH2CH2); 46.04 (Fréchet-C(CH3)); 39.80, 39.67 (CH2NH); 31.84 (2 ×
CH2CHNH); 30.82 (2 × CH2CH2NH); 30.09 ((triazole)CH2CH2); 29.58 (19 ×
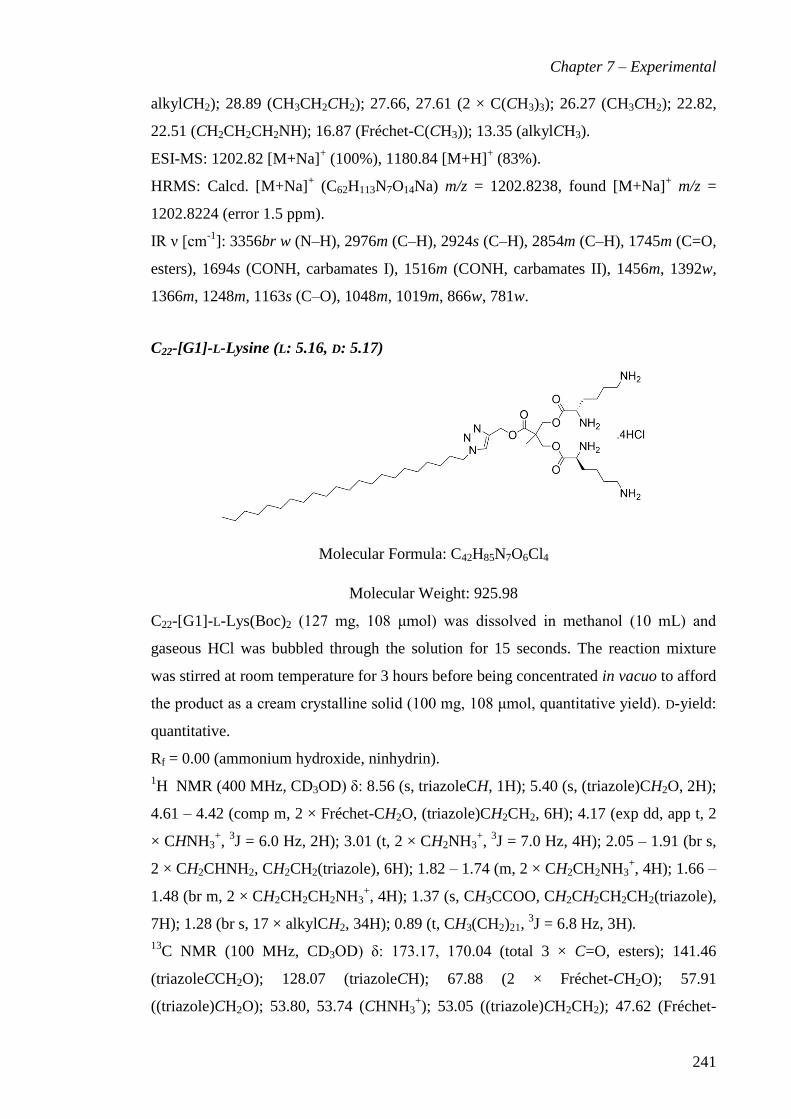
Chapter 7 – Experimental
241
alkylCH2); 28.89 (CH3CH2CH2); 27.66, 27.61 (2 × C(CH3)3); 26.27 (CH3CH2); 22.82,
22.51 (CH2CH2CH2NH); 16.87 (Fréchet-C(CH3)); 13.35 (alkylCH3).
ESI-MS: 1202.82 [M+Na]+ (100%), 1180.84 [M+H]
+ (83%).
HRMS: Calcd. [M+Na]+ (C62H113N7O14Na) m/z = 1202.8238, found [M+Na]
+ m/z =
1202.8224 (error 1.5 ppm).
IR ν [cm-1
]: 3356br w (N–H), 2976m (C–H), 2924s (C–H), 2854m (C–H), 1745m (C=O,
esters), 1694s (CONH, carbamates I), 1516m (CONH, carbamates II), 1456m, 1392w,
1366m, 1248m, 1163s (C–O), 1048m, 1019m, 866w, 781w.
C22-[G1]-L-Lysine (L: 5.16, D: 5.17)
Molecular Formula: C42H85N7O6Cl4
Molecular Weight: 925.98
C22-[G1]-L-Lys(Boc)2 (127 mg, 108 μmol) was dissolved in methanol (10 mL) and
gaseous HCl was bubbled through the solution for 15 seconds. The reaction mixture
was stirred at room temperature for 3 hours before being concentrated in vacuo to afford
the product as a cream crystalline solid (100 mg, 108 μmol, quantitative yield). D-yield:
quantitative.
Rf = 0.00 (ammonium hydroxide, ninhydrin).
1H NMR (400 MHz, CD3OD) δ: 8.56 (s, triazoleCH, 1H); 5.40 (s, (triazole)CH2O, 2H);
4.61 – 4.42 (comp m, 2 × Fréchet-CH2O, (triazole)CH2CH2, 6H); 4.17 (exp dd, app t, 2
× CHNH3+,
3J = 6.0 Hz, 2H); 3.01 (t, 2 × CH2NH3
+,
3J = 7.0 Hz, 4H); 2.05 – 1.91 (br s,
2 × CH2CHNH2, CH2CH2(triazole), 6H); 1.82 – 1.74 (m, 2 × CH2CH2NH3+, 4H); 1.66 –
1.48 (br m, 2 × CH2CH2CH2NH3+, 4H); 1.37 (s, CH3CCOO, CH2CH2CH2CH2(triazole),
7H); 1.28 (br s, 17 × alkylCH2, 34H); 0.89 (t, CH3(CH2)21, 3J = 6.8 Hz, 3H).
13C NMR (100 MHz, CD3OD) δ: 173.17, 170.04 (total 3 × C=O, esters); 141.46
(triazoleCCH2O); 128.07 (triazoleCH); 67.88 (2 × Fréchet-CH2O); 57.91
((triazole)CH2O); 53.80, 53.74 (CHNH3+); 53.05 ((triazole)CH2CH2); 47.62 (Fréchet-

Chapter 7 – Experimental
242
C(CH3)); 40.37, 40.28 (CH2NH3+); 33.07 (CH2CH2CH3); 30.79 (17 × alkylCH2); 30.48
(2 × CH2CHNH3+); 30.13 (CH2CH2NH3
+); 27.88, 27.42 (CH2CH2CH2(triazole)); 23.74,
23.16 (CH2CH2CH2NH2+); 18.00 (Fréchet-C(CH3)); 14.55 (alkylCH3).
ESI-MS: 390.82 [M+2H]2+
(100%), 274.56 [M+2Na+H]3+
(80%), 260.88 [M+3H]3+
(75%), 780.63 [M+H]+ (11%).
HRMS: Calcd. [M+2H]2+
(C42H83N7O6) m/z = 390.8197, found [M+2H]2+
m/z =
390.8179 (error 4.6 ppm).
IR ν [cm-1
]: 3393br w (N–H), 2917s (C–H), 2850s (C–H), 1743s (C=O, ester), 1600w,
1506m, 1468m, 1380w, 1280m, 1214s, 1134s, 1054w, 998m.
θL: + 38.9 mdeg (225 nm, 10 mM, MeOH).
θD: − 45.8 mdeg (225 nm, 10 mM, MeOH).
Propyne-[G2]-isopropylidene325
(5.18)
Molecular Formula: C24H36O10
Molecular Weight: 484.23
Propyne-[G1]-OH (1.53 g, 8.89 mmol) and DMAP (0.83 g, 6.79 mmol) were dissolved
together in DCM (50 mL) before pyridine (2.7 mL, 34.52 mmol) was added. To this,
isopropylidene-2,2-bis(hydroxymethyl)propionic anhydride (8.80 g, 26.64 mmol, pre-
dissolved in DCM (15 mL)) was added and the reaction was stirred overnight at room
temperature. The excess anhydride was quenched with a mixture of pyridine : deionised
water (1 : 1, 10 mL) and the reaction was stirred overnight once more. After diluting
with DCM (60 mL), the reaction mixture was washed successively with NaHSO4 (3 ×
30 mL, 1.33 M), Na2CO3 (3 × 30 mL, 10%) and saturated brine (30 mL). The organic
phase was dried over MgSO4 and the resulting filtrate was concentrated in vacuo to
afford the crude product as an opaque cream oil. This crude product was purified by
flash column chromatography (SiO2, cyclohexane : ethyl acetate, 3 : 1 1 : 1) to afford
the product as a golden oil (2.65 g, 5.47 mmol, 57 %). The spectroscopic data presented
below is in agreement with that previously published.
Rf = 0.51 (1 : 1, cyclohexane : ethyl acetate, UV).

Chapter 7 – Experimental
243
1H NMR (400 MHz, CDCl3) δ: 4.71 (d, CH≡CCH2,
4J = 2.4 Hz, 2H); 4.32 (d, 2 ×
CHaxHeqO, 2J = 12.0 Hz, 2H); 4.15 (d, 2 × CHaxHeqO,
2J = 12.0 Hz, 4H); 3.61 (d,
CHaHbO, 2J = 12.0 Hz, 4H); 2.46 (t, CH≡CCH2,
4J = 2.4 Hz, 1H); 1.40 (d, 4 × CH3,
4J =
2.4 Hz, 12H); 1.35 (s, 2 × CH3, 6H); 1.30 (s, CH3, 3H).
13C NMR (100 MHz, CDCl3) δ: 173.58, 171.92 (total 3 × C=O, ester); 98.16 (2 ×
C(CH3)2); 77.27 (CH2C≡CH); 75.40 (C≡CH); 66.02 (6 × CH2O); 52.74 (C≡CH); 46.87,
42.12 (total 3 × CCOO); 25.14, 22.22, 18.56, 17.65 (total 5 × CH3).
ESI-MS: 507.22 [M+Na]+ (100%).
HRMS: Calcd. [M+Na]+ (C24H36NaO10) m/z = 507.2201, found [M+Na]
+ m/z =
507.2196 (error 0.9 ppm).
IR ν [cm-1
]: 3264w (C–H, alkyne), 2986m (C–H), 2100w (C≡C), 1736s (C=O, esters),
1458m, 1373m, 1219s, 1118s, 1080s, 1003m, 934m, 826s.
Propyne-[G2]-OH325
(5.19)
Molecular Formula: C18H28O10
Molecular Weight: 404.17
Propyne-[G2]-isopropylidene (2.16 g, 4.46 mmol) and DOWEX-50WX2 (3.24 g, 1.5
eq. wt.) were dissolved in methanol (55 mL) and stirred at 40°C for 2 hours. The
reaction mixture was filtered through a celite-containing sinter funnel and the resulting
filtrate was concentrated in vacuo affording a sludge which was taken up in chloroform.
A precipitate was allowed to form overnight, before being collected by filtration as a
white crystalline solid (1.30 g, 3.22 mmol, 72%). The spectroscopic data presented
below is in agreement with that previously published.
Rf = 0.50 (9 : 1, DCM : methanol, UV).
1H NMR (400 MHz, CDCl3) δ: 4.74 (d, CH≡CCH2,
4J = 2.4 Hz, 2H); 4.47 – 4.25 (m, 4
× CH2O, 8H); 3.81 – 3.62 (m, 2 × CH2O, 4H); 3.24 (br s, 4 × OH, 4H); 2.49 (t,
CH≡CCH2, 4J = 2.4 Hz, 1H); 1.33 (s, CH3, 3H); 1.05 (s, 2 × CH3, 6H).

Chapter 7 – Experimental
244
13C NMR (100 MHz, CD3OD) δ: 175.87, 173.62 (total 3 × C=O); 78.52 (CH2C≡CH);
76.72 (C≡CH); 66.28, 66.78, (3 × CH2O); 53.56 (C≡CH); 51.76 (2 × G2-CCOO); 47.83
(G1-CCOO); 18.09, 17.29 (total 3 × CH3).
ESI-MS: 427.16 [M+Na]+ (100%), 405.18 [M+H]
+ (56%).
HRMS: Calcd. [M+Na]+ (C18H28NaO10) m/z = 427.1575, found [M+Na]
+ m/z =
427.1579 (error – 1.1 ppm).
IR ν [cm-1
]: 3397br w (O–H), 3256m (C–H, alkyne), 2944w (C–H), 2160m (C≡C),
1731s (C=O, esters), 1716s (C=O, ester), 1236m (C–O), 1210s (C–O), 1129s, 1065m,
1019s, 1006s, 717m, 681m, 654m.
Propyne-[G2]-L-Lys(Boc)2 (L: 5.20, D: 5.21)
Molecular Formula: C82H140N8O30
Molecular Weight: 1718.02
L-Lys(Boc)2-succinimide (1.00 g, 2.25 mmol, 8 eq.), DMAP (138 mg, 1.13 mmol, 4 eq.)
and DIPEA (442 μL, 2.54 mmol, 9 eq.) were dissolved together in dry DMF (15 mL).
Propyne-[G2]-OH (114 mg, 0.28 mmol, 1 eq., pre-dissolved in dry DMF (10 mL)), was
added to the reaction mixture, which was stirred at room temperature under an N2
atmosphere for 48 hours. The volatiles were removed in vacuo to afford the crude
product as a golden viscous oil. The crude product was purified by gel permeation
chromatography (DCM : methanol, 95 : 5) to afford the pure product as a golden foam
(400 mg, 0.20 mmol, 83%). D-yield: 90%.
Rf = 0.68 (9 : 1, DCM : methanol, UV/ninhydrin).

Chapter 7 – Experimental
245
1H NMR (400 MHz, CD3OD) δ: 4.79 (d, CH≡CCH2,
4J = 2.4 Hz, 2H); 4.37 – 4.22 (m,
6 × CH2O, 12H); 4.09 (exp dd, app br s, 4 × CHNH, 4H); 3.04 (t, 4 × CH2NH, 3J = 6.8
Hz, 8H); 2.99 (t, CH≡CCH2, 4J = 2.4 Hz, 1H); 1.83 – 1.74 (m, 4 × CHaHbCHNH, 4H);
1.69 – 1.60 (m, 4 × CHaHbCHNH, 4H); 1.51 – 1.36 (br s, 8 × C(CH3)3, 4 × CH2CH2NH,
4 × CH2CH2CH2NH, 88H); 1.33 (s, [G1]-CH3CCO, 3H); 1.29 (s, 2 × [G2]-CH3CCO,
6H).
13C NMR (100 MHz, CD3OD) δ: 173.84 (4 × C=O, lysine-esters); 173.39, 173.20 (total
3 × C=O, Fréchet-esters); 158.52, 157.98 (4 × C=O, carbamates); 80.59, 79.86 (4 ×
C(CH3)3); 78.61 (CH≡CCH2); 77.17 (CH≡CCH2); 67.09, 66.75 (total 6 × CH2O); 55.07
(4 × CHNH); 53.88 (CH≡CCH2); 48.01, 47.87 (total 3 × Fréchet-C(CH3)); 41.02
(CH2NH); 32.23 (CH2CHNH); 30.59 (CH2CH2NH); 28.93 (8 × C(CH3)3); 24.20
(CH2CH2CH2NH); 18.30, 18.15 (total 3 × Fréchet-C(CH3)).
ESI-MS: 1717.98 [M+H]+ (100%).
HRMS: Calcd. [M+H]+ (C82H141N8O30) m/z = 1717.9748, found [M+H]
+ m/z =
1717.9798 (error – 1.9 ppm).
IR ν [cm-1
]: 3368w (N–H), 2972w (C–H), 1745m (C=O, esters), 1688s (CONH,
carbamates I), 1515m (CONH, carbamates II), 1365m, 1247m, 1160s (C–O), 1011m,
866w, 763w, 763w.
Propyne-[G2]-L-Lysine (5.22)
Molecular Formula: C42H84Cl8N8O14
Molecular Weight: 1208.79
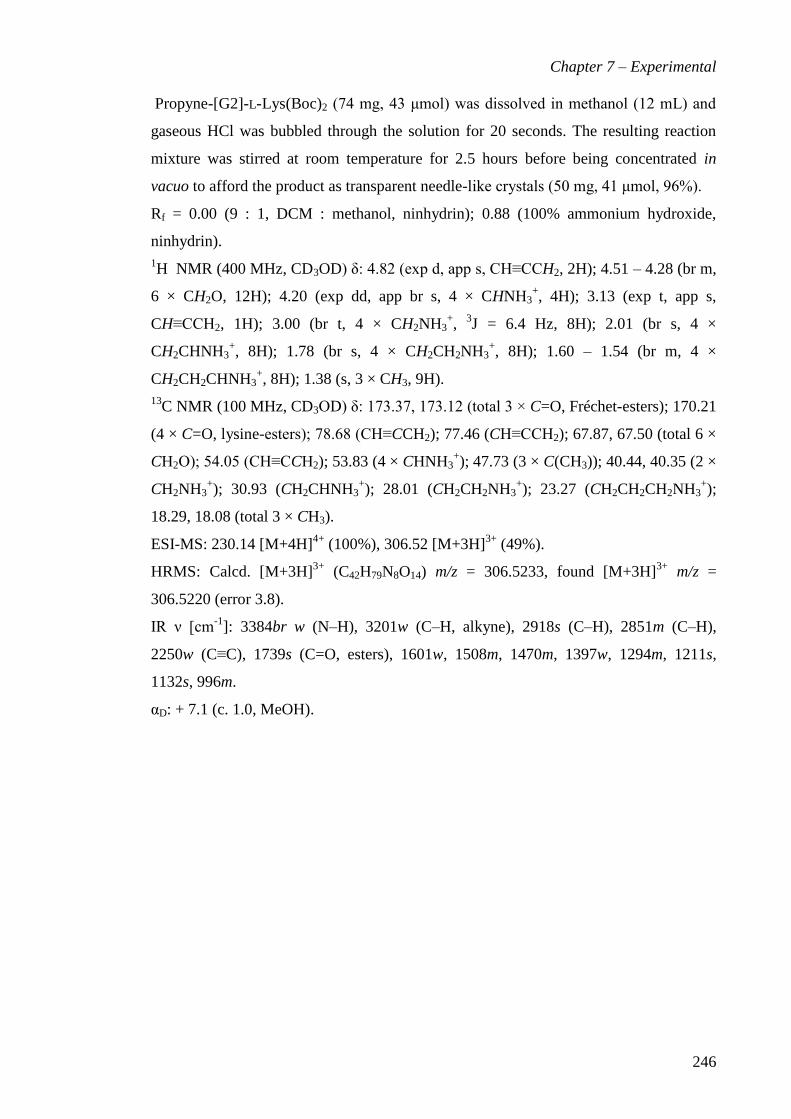
Chapter 7 – Experimental
246
Propyne-[G2]-L-Lys(Boc)2 (74 mg, 43 μmol) was dissolved in methanol (12 mL) and
gaseous HCl was bubbled through the solution for 20 seconds. The resulting reaction
mixture was stirred at room temperature for 2.5 hours before being concentrated in
vacuo to afford the product as transparent needle-like crystals (50 mg, 41 μmol, 96%).
Rf = 0.00 (9 : 1, DCM : methanol, ninhydrin); 0.88 (100% ammonium hydroxide,
ninhydrin).
1H NMR (400 MHz, CD3OD) δ: 4.82 (exp d, app s, CH≡CCH2, 2H); 4.51 – 4.28 (br m,
6 × CH2O, 12H); 4.20 (exp dd, app br s, 4 × CHNH3+, 4H); 3.13 (exp t, app s,
CH≡CCH2, 1H); 3.00 (br t, 4 × CH2NH3+,
3J = 6.4 Hz, 8H); 2.01 (br s, 4 ×
CH2CHNH3+, 8H); 1.78 (br s, 4 × CH2CH2NH3
+, 8H); 1.60 – 1.54 (br m, 4 ×
CH2CH2CHNH3+, 8H); 1.38 (s, 3 × CH3, 9H).
13C NMR (100 MHz, CD3OD) δ: 173.37, 173.12 (total 3 × C=O, Fréchet-esters); 170.21
(4 × C=O, lysine-esters); 78.68 (CH≡CCH2); 77.46 (CH≡CCH2); 67.87, 67.50 (total 6 ×
CH2O); 54.05 (CH≡CCH2); 53.83 (4 × CHNH3+); 47.73 (3 × C(CH3)); 40.44, 40.35 (2 ×
CH2NH3+); 30.93 (CH2CHNH3
+); 28.01 (CH2CH2NH3
+); 23.27 (CH2CH2CH2NH3
+);
18.29, 18.08 (total 3 × CH3).
ESI-MS: 230.14 [M+4H]4+
(100%), 306.52 [M+3H]3+
(49%).
HRMS: Calcd. [M+3H]3+
(C42H79N8O14) m/z = 306.5233, found [M+3H]3+
m/z =
306.5220 (error 3.8).
IR ν [cm-1
]: 3384br w (N–H), 3201w (C–H, alkyne), 2918s (C–H), 2851m (C–H),
2250w (C≡C), 1739s (C=O, esters), 1601w, 1508m, 1470m, 1397w, 1294m, 1211s,
1132s, 996m.
αD: + 7.1 (c. 1.0, MeOH).

Chapter 7 – Experimental
247
C22-[G2]-L-Lys(Boc)2 (L: 5.23, D: 5.24)
Molecular Formula: C104H185N11O30
Molecular Weight: 2069.64
Propyne-[G2]-L-Lys(Boc)2 (200 mg, 116 μmol, 1.1 eq.), behenoyl azide (37 mg, 106
μmol, 1 eq.), CuSO4·5H2O (3 mg, 12 μmol, 0.1 eq.) and sodium ascorbate (4 mg, 21
μmol, 0.2 eq.) were dissolved together in a mixture of degassed THF : water (4 : 1 v/v,
10 mL). The reaction mixture was stirred at room temperature under an N2 atmosphere
for 15.5 hours before being concentrated in vacuo. The resulting sludge was taken up in
DCM (35 mL) and washed with deionised water (2 × 15 mL). The organic phase was
collected, dried over MgSO4 and the resulting filtrated was concentrated in vacuo to
afford the crude product was a grey-white viscous oil. The crude product was purified
by gel permeation chromatography (DCM) to afford the product as a transparent golden
oil (18 mg, 9 μmol, 8%). D-yield: 15%.
Rf = 0.67 (9 : 1, DCM : methanol, ninhydrin).
1H NMR (400 MHz, CD3OD) δ: 8.08 (s, triazoleCH, 1H); 5.29 (s, (triazole)CH2O, 2H);
4.23 (t, CH2Ntriazole, 3J = 7.2 Hz, 2H); 4.36 – 4.15 (m, 6 × Fréchet-CH2O, 12H); 4.09
(exp dd, app br t, 4 × CHNH, 3J = 4.0 Hz, 4H); 3.04 (t, 4 × CH2NH,
3J = 6.6 Hz, 8H);
1.96 – 1.88 (m, CH2CH2(triazole), 2H); 1.82 – 1.73 (m, 4 × CHaHbCHNH, 4H); 1.68 –
1.59 (m, 4 × CHaHbCHNH, 4H); 1.44 (br s, 8 × C(CH3)3, 4 × CH2CH2NH and [G1]-
CH3, 83H); 1.33 (br s, 4 × CH2CH2CH2NH, 8H); 1.29 (s, 19 × alkylCH2, 38H); 1.23 (s,
2 × [G2]-CH3), 6H); 0.90 (t, CH3(CH2)21, 3J = 7.2 Hz, 3H).
13C NMR (100 MHz, CD3OD) δ: Absence of some signals due to large molecular
weight / small amount of material in sample. 177.83, 173.87 (total 7 × C=O, esters);

Chapter 7 – Experimental
248
158.57, 158.03, (4 × C=O, carbamate); expt ~142, not seen (triazoleCCH2O); 121.17
(triazoleCH); 80.57, 79.87 (4 × C(CH3)3); 67.11, 67.08, 66.71 (2 × Fréchet-CH2O);
60.17 ((triazole)CH2O); 55.11 (4 × CHNH); 51.42 ((triazole)CH2CH2); 48.01 (Fréchet-
C(CH3)); 41.05 (4 × CH2NH); 33.14 (4 × CH2CHNH); 32.26 (4 × CH2CH2NH); 31.41
((triazole)CH2CH2); 30.83 (18 × alkylCH2); 30.54 (CH2CH3); 28.94 (8 × C(CH3)3);
24.56 (4 × CH2CH2CH2NH); 18.26, 18.21, 17.76 (Fréchet-C(CH3)); 14.53 (alkylCH3).
ESI: 1057.64 [M+2Na]2+
(100%), 2092.31 [M+Na]+ (23%).
HRMS: Calcd. [M+Na]+ (C104H186N11O30Na) m/z = 2092.3259, found [M+Na]
+ m/z =
2092.3098 (error 9.0 ppm).
IR ν [cm-1
]: 3366br w (N–H), 2983m (C–H), 2924m (C–H), 2855m (C–H), 1741m
(C=O, esters), 1694s (CONH, carbamates I), 1514m (CONH, carbamates II), 1456m,
1392w, 1365m, 1247m, 1160s (C–O), 1047m, 1012m, 864w, 779w.
C22-[G2]-L-Lysine (L: 5.25, D: 5.26)
Molecular Formula: C64H129N11O14Cl8
Molecular Weight: 1560.40
C22-[G2]-L-Lys(Boc)2 (18 mg, 9 μmol) was dissolved in methanol (10 mL) and gaseous
HCl was bubbled through the solution for 15 seconds. The reaction mixture was stirred
at room temperature for 3 hours before being concentrated in vacuo to afford the
product as a white crystalline solid (11 mg, 7 μmol, 78%). D-yield: quantitative.
Rf = 0.00 (ammonium hydroxide, ninhydrin).
1H NMR (400 MHz, CD3OD) δ: 8.21 (s, triazoleCH, 1H); 5.31 (s, (triazole)CH2O, 2H);
4.96 – 4.27 (br m, (triazole)CH2CH2, 6 × FréchetCH2O, 14H); 4.21 (exp dd, app s, 4 ×

Chapter 7 – Experimental
249
CHNH3+, 4H); 3.01 (t, 4 × CH2NH3
+,
3J = 6.4 Hz, 8H); 2.09 – 1.90 (br m,
CH2CH2(triazole), 4 × CH2CHNH3+, 10H); 1.78 (br s, 4 × CH2CH2NH2
+, 8H); 1.66 –
1.49 (m, 4 × CH2CH2CH2NH3+, 8H); 1.35, 1.32 (s, total 3 × CH3C(CO) and
CH2CH2CH2(triazole), 11H) 1.29 (s, 18 × alkylCH2, 36H); 0.90 (t, alkylCH3, 3J = 7.2
Hz, 3H).
13C NMR (100 MHz, CD3OD) δ: Absence of some signals due to large molecular
weight / small amount of material in sample. 170.23 (total 7 × C=O, esters); expt ~145,
not seen (triazoleCCH2O); 128 (triazoleCH); 67.97, 67.93 (total 6 × Fréchet-CH2O);
exp ~ 58, not seen ((triazole)CH2O) 53.88 (4 × CH2NH3+); 51.74 ((triazole)CH2CH2);
47.73 (Fréchet-C(CH3)); 40.38 (4 × CH2NH3+); 33.12 (4 × CH2CHNH3
+); 31.00
(CH2CH2CH3); 30.81 (17 × alkylCH2); 28.06 (4 × CH2CH2NH3+); 27.64
((triazole)CH2CH2); 23.78 (CH2CH3); 23.31 (4 × CH2CH2CH2NH3+); 18.21 (3 ×
Fréchet-C(CH3)); 14.50 (alkylCH3).
ESI-MS: 634.96 [M+2H]2+
(100%), 570.91 [M–Lys+2H]2+
(99%) where Lys =
C6H13N2O and lysine-loss is a likely mass spectrometric effect.
HRMS: Calcd. [M+2H]2+
(C64H123N11O14) m/z = 634.9620, found [M+2H]2+
m/z =
634.9585 (error 5.3 ppm).
IR ν [cm-1
]: 3396br w (N–H), 2918s (C–H), 2852s (C–H), 1736s (C=O, esters), 1601w,
1504m, 1470m, 1398w, 1297w, 1212s, 1131s (C–O), 1060m, 997s.
θL: + 72.9 mdeg (225 nm, 10 mM, MeOH).
θD: − 70.6 mdeg (225 nm, 10 mM, MeOH).
D-Asp-Boc (L: 6.1, D: 6.2)
Chemical Formula: C9H15NO6
Molecular Weight: 233.22
D-Aspartic acid (1.70 g, 12.75 mmol) and NaOH pellets (1.02 g, 25.50 mmol) were
dissolved together in deionised water (20 mL) before the solution was cooled to 0°C.
Di-tert-butyl dicarbonate (3.06 g, 14.11 mmol) was dissolved separately in dioxane (20
mL) before being added to the reaction mixture dropwise in one portion over 1 hour.
The resulting reaction mixture was stirred at 0°C for 2 hours and room temperature for a

Chapter 7 – Experimental
250
further 2 hours. Volatiles were removed in vacuo, and the resulting residue was taken
up in deionised water and washed with diethyl ether. The aqueous layer was acidified to
pH 2 using NaHSO4 (1.33 M, pH paper) after which the product was extracted into
diethyl ether. This organic layer was collected, dried over MgSO4 and the resulting
filtrate concentrated in vacuo to afford the product as a white solid (1.48 g, 6.43 mmol,
50%). Rf = 0.26 (9 : 1 DCM : methanol, ninhydrin).
1H NMR (400 MHz, CD3OD) δ: 5.04 (br s, NH, 2 × OH, 3H); 4.46 (exp dd, app t,
CHNH, 3J = 5.6 Hz, 1H); 2.82 (dd,
2J
3J = 16.6 Hz, 5.2 Hz, CHaHbCHNH, 1H); 2.77 (dd,
2J
3J = 16.6 Hz, 6.4 Hz, CHaHbCHNH, 1H); 1.44 (s, C(CH3)3, 9H).
13C NMR (100 MHz, CD3OD) δ: 174.66, 174.19 (C=O, acid); 157.76 (C=O,
carbamate); 80.78 (C(CH3)3); 51.37 (CHNH); 37.27 (CH2CHN); 28.71 (C(CH3)3).
ESI-MS: 256.08 [M+Na]+ (100%).
HRMS: Calcd. [M+Na]+ (C9H15NNaO6) m/z = 256.0792, found [M+Na]
+ m/z =
256.0795 (error −1.6 ppm).
IR ν [cm-1
]: 3354w (N–H), 2978br m (O–H, C–H), 2930br m (O–H, C–H), 1703s (C=O,
acid), 1700s (C=O, acid), 1688s (CONH, carbamate I), 1533m, 1514m (CONH,
carbamate II), 1409m (C–O), 1393w, 1368w, 1336m (C–H), 1286w, 1250m (C–O),
1157s, 1060m (C–N stretch), 1031w, 1002w, 974m, 860w, 786w, 747w.
αD: + 4.6 (c. 1.0, CHCl3).
(C12)2-L-Asp-Boc (L: 6.3, D: 6.4)
Chemical Formula: C33H63NO6
Molecular Weight: 569.87
Boc-L-Asp-(OH)2 (1.00 g, 4.28 mmol, 1 eq.), 1-dodecanol (3.20 g, 17.2 mmol, 4 eq.),
DCC (1.77 g, 8.58 mmol, 2 eq.) and DMAP (1.05 g, 8.58 mmol, 2 eq.) were dissolved
together in anhydrous DCM (50 mL). The stirred mixture was kept for 10 minutes at
0°C before being allowed to warm to room temperature and left overnight under an N2
atmosphere. The DCU by-product was removed by filtration through a celite-containing
sinter funnel and the filtrate concentrated to a residue in vacuo. This residue was taken
up in DCM (60 mL) and washed successively with HCl (2 × 30 mL, 0.5 M) and

Chapter 7 – Experimental
251
NaHCO3 (30 mL, sat.). The organic phase was collected, dried over MgSO4 and the
resulting filtrate concentrated in vacuo to afford a clear yellow residue. Purification by
flash column chromatography (SiO2, 95 : 5, DCM : ethyl acetate) afforded pure product
as a white powdery solid (877 mg, 1.54 mmol, 36%). D-yield: 45%.
Rf = 0.95 (9 : 1 DCM : methanol, ninhydrin).
1H NMR (400 MHz, CDCl3) δ: 5.49 (d, NH, 1H); 4.52 (exp dd, app t, CHNH,
3J = 4.4
Hz, 1H); 4.18 – 4.10 (exp t, app m, CH2OC(O)CH2, 2H); 4.05 (t, CH2OC(O)CH, 3J =
6.8 Hz, 2H); 2.99 (dd, CHaHbCHNH, 2J
3J = 17.2 Hz, 4.4 Hz, 1H); 2.77 (dd,
CHaHbCHNH, 2J
3J = 17.2 Hz, 4.4 Hz, 1H); 1.65 – 1.59 (m, CH2CH2O, 4H); 1.44 (s,
C(CH3)3, 9H); 1.23 (br s, 18 × alkylCH2, 36H); 0.88 (t, 2 × alkylCH3, 3J = 6.4 Hz, 6H).
13C NMR (100 MHz, CDCl3) δ: 171.14, 171.03 (C=O, ester); 155.43 (C=O, carbamate);
80.00 (C(CH3)3); 65.88, 65.19 (CH2O); 49.84 (CHNH); 36.80 (CH2CHNH); 31.90,
29.62, 29.57, 29.51, 29.34, 29.23, 28.50, 28.45, 28.28 (alkylCH2); 25.84, 25.79
(CH2CH2O); 22.67 (C(CH3)3); 14.11 (alkylCH3).
ESI-MS: 592.45 [M+Na]+ (100%), 570.47 [M+H]
+ (44%).
HRMS: Calcd. [M+Na]+ (C33H63NNaO6) m/z = 592.4548, found [M+Na]
+ m/z =
592.4520 (error 3.9 ppm).
IR ν [cm-1
]: 3403w (N–H stretch), 2955w, 2918s (C–H), 2851m (C–H), 1733s (C=O,
esters), 1709s (CONH, carbamate I), 1506m (CONH, carbamate II), 1467m, 1456w,
1420w, 1393w (C–H), 1342m, 1209m, 1165s (C–N stretch), 1073w, 1055w, 1041w,
781w, 721m.
θL: + 33.6 mdeg (223 nm, 10 mM, MeOH).
θD: − 25.0 mdeg (223 nm, 10 mM, MeOH).
(C12)2-L-Asp.TFA (L: 6.5, D: 6.6)
Chemical Formula: C30H56F3NO6
Molecular Weight: 583.77
(C12)2-L-Asp-Boc (200 mg, 3.51 mmol) was dissolved in a mixture of trifluoroacetic
acid, triisopropylsilane and deionised water (500 µL, 95 : 2.5 : 2.5 v/v) before being
shaken until TLC indicated reaction to be complete (3.5 h). Following careful addition

Chapter 7 – Experimental
252
of deionised water (1.5 mL), the reaction mixture was washed with chloroform (3 × 4
mL) to extract non polar by-products. The aqueous layer was then evaporated to dryness
in vacuo to afford the product as a white powdery solid (186 mg, 3.19 mmol, 91%). D-
yield: 90%.
Rf = 0.76 (9 : 1 DCM : methanol, ninhydrin).
1H NMR (400 MHz, CDCl3) δ: 4.36 (exp dd, app t, CHNH3
+,
3J = 4.8 Hz, 1H); 4.26 –
4.15 (exp t, app m, CH2OC(O)CH2, 2H); 4.10 (t, CH2OC(O)CH, 3J = 6.8 Hz, 2H); 3.12
(d, CH2CHNH, 3J = 4.8 Hz, 2H); 1.65 – 1.58 (m, CH2CH2O, 4H); 1.25 (br s, 18 ×
alkylCH2, 36H); 0.88 (t, 2 × alkylCH3, 3J = 6.8 Hz, 6H).
13C NMR (100 MHz, CDCl3) δ: 171.74, 167.92 (C=O, ester); 161.60 (C=O, acid);
67.57, 66.39 (CH2O); 49.73 (CHNH); 33.13 (CH2CHNH); 31.91, 29.65, 29.62, 29.58,
29.49, 29.47, 29.34, 29.22, 29.15, 28.28, 28.17, 25.72, 25.59 (alkylCH2); 14.11
(alkylCH3).
ESI-MS: 470.42 [M–TFA+H]+ (100%).
HRMS: Calcd. [M+H]+ (C28H56NO4) m/z = 470.4204, found [M+H]
+ = 470.4190 (error
2.5 ppm).
IR ν [cm-1
]: 2955w, 2918s (N–H), 2850m (C–H), 1752m (C=O, ester), 1736m (C=O,
acid) 1665s, 1593w, 1466w, 1431w, 1399w, 1371w (C–H), 1245m (C–O), 1186s (C–N),
1141m, 1125m, 1092w, 803m, 766w.
θL: + 26.7 mdeg (210 nm, 10 mM, MeOH).
θD: − 27.6 mdeg (210 nm, 10 mM, MeOH).
(C12)2-L-Asp-L-Lys(Boc)2 (L: 6.7, D: 6.8)
Chemical Formula: C44H83N3O9
Molecular Weight: 798.16
L-Lys(Boc)2 (76 mg, 0.22 mmol, 1.1 eq.) was dissolved in DCM (13 mL) at 0°C and
stirred for 10 minutes before TBTU (63 mg, 0.20 mmol, 1 eq.) was added. After a

Chapter 7 – Experimental
253
further 10 minutes, (C12)2-L-Asp.TFA (100 mg, 0.21 mmol, 1 eq., pre-dissolved in
DCM (4 mL)) and DIPEA (52 mg, 0.40 mmol, 2 eq.) were added. The resulting reaction
mixture was stirred at 0°C for 20 minutes before being warmed to room temperature
and left to stir overnight. The volatiles were removed in vacuo and the resulting residue
taken up in DCM (10 mL) and washed successively with NaHSO4 (2 × 15 mL, 1.33 M),
NaHCO3 (2 × 10 mL, sat.), deionised water (3 × 15 mL) and brine (15 mL, sat.). The
organic phase was collected, dried over MgSO4 and the resulting filtrate concentrated in
vacuo to afford a white powdery solid, which was purified by flash column
chromatography (SiO2, 1 : 1 cyclohexane : ethyl acetate) to afford the product as a white
powdery solid (75 mg, 94 µmol, 44%). D-yield: 42%.
Rf = 0.85 (9 : 1 DCM : methanol, ninhydrin).
1H NMR (400 MHz, CDCl3) δ: 6.89 (d, AspNH,
3J = 8.0 Hz, 1H); 5.16 (br s,
LysCH2NH, 1H); 4.81 (exp dd, app dt, AspCHNH, 3J
3J = 8.0 Hz, 4.4 Hz, 1H); 4.67
(exp dd, app br s, LysCHNH, 1H); 4.17 – 4.06 (exp dd, app m, LysCHNH, 2 × CH2O,
5H); 3.11 (exp t, app s, CH2NH, 2H); 3.02 (dd, CHaHbCHNHAsp, 2J
3J = 17.2 Hz, 4.4
Hz, 1H); 2.80 (dd, CHaHbCHNHAsp, 2J
3J = 17.2 Hz, 4.4 Hz, 1H); 1.81 – 1.71 (m,
CH2CH2NH, 2H); 1.67 – 1.58 (m, 2 × CH2CH2O, LysCH2CHNH, 6H); 1.43 (s, (CH3)3,
18H); 1.25 (s, 18 × alkylCH2, CH2CH2CHNH, 38H); 0.87 (t, 2 × alkylCH3, 3J = 7.2 Hz,
6H).
13C NMR (100 MHz, CDCl3) δ: 171.78, 170.97 (C=O, ester); 170.44 (C=O, amide);
156.08 (2 × C=O, carbamate); 79.94, 79.93 (C(CH3)3); 66.03, 65.31 (CH2O); 48.45
(AspCHNH); 36.17 (AspCH2CHNH, AspCH2CHNH); 31.88 (CH2CH2NH); 29.62,
29.60, 29.56, 29.50 29.32, 29.23, 29.19 (alkylCH2); 28.34, 28.21 (C(CH3)3); 25.76,
25.68 (alkylCH2); 22.59 (LysCH2CHNH); 14.02 (2 × alkylCH3).
ESI-MS: 820.60 [M+Na]+ (100%).
HRMS: Calcd. [M+Na]+ (C44H83N3NaO9) m/z = 820.6022, found [M+Na]
+ = 820.5995
(error 2.8 ppm).
IR ν [cm-1
]: 3356w (N–H), 3331w (N–H), 2918s (C–H), 2850m (C–H), 1746m (C=O,
ester), 1730m (C=O, ester), 1682s (CONH, amide I), 1656s (CONH, carbamates I),
1528s (CONH, amide II), 1471w, 1403w, 1392w, 1365w, 1301m, 1275m, 1247m (C–
O), 1170s (C–N), 1087w, 1053w, 1019w, 783w, 766w, 732w, 719w.
LαD: + 13.5 (c. 1.0, CHCl3).
DαD: − 11.2 (c. 1.0, CHCl3).

Chapter 7 – Experimental
254
(C12)2-L-Asp-L-Lys.2TFA (L: 6.9, D: 6.10)
Chemical Formula: C38H69F6N3O9
Molecular Weight: 825.97
(C12)2-L-Asp-L-Lys(Boc)2 (49 mg, 61 µmol) was dissolved in a mixture of
trifluoroacetic acid, triisopropylsilane and deionised water (500 µL, 95 : 2.5 : 2.5 v/v)
before being shaken until TLC indicated reaction to be complete (2.5 h). Following
careful addition of deionised water (1.5 mL), the reaction mixture was washed with
chloroform (3 × 4 mL). The combined organic layers were dried over MgSO4 and
resulting filtrate concentrated in vacuo to afford the product as a white powdery solid
(36 mg, 60 µmol, 98%). D-yield: 97%.
Rf = 0.07 (9 : 1 DCM : methanol, ninhydrin).
1H NMR (400 MHz, CDCl3) δ: 7.82 – 7.75 (br m, CHNH3
+, 3H); 7.34 (s, CH2NH3
+,
2H); 4.89 – 4.84 (exp dd, app m, AspCHNH, 1H); 4.20 (br s, AspCHNH, 1H); 4.16 –
4.07 (exp dd, app m, CHNH3+, 1H); 4.07 – 4.00 (m, 2 × CH2O, 4H); 3.08 (exp t, app s,
CH2NH3+, 2H); 2.97 (dd, CHaHbCHNHAsp,
2J
3J = 17.4 Hz, 5.6 Hz, 1H); 2.80 (dd,
CHaHbCHNHAsp, 2J
3J = 17.4 Hz, 3.2 Hz, 1H); 1.96 (br s, CH2CHNH3
+, 2H); 1.74 (s,
CH2CH2NH3+, 2H); 1.58 (br s, 2 × CH2CH2O, CH2CH2CHNH3
+, 6H); 1.25 (s, 18 ×
alkylCH2, 36H); 0.88 (t, 2 × alkylCH3, 3J = 6.8 Hz, 6H).
13C NMR (100 MHz, CDCl3) δ: 171.80, 171.16 (C=O, esters); 170.51 (C=O, amide);
161.04 (C=O, acid); 66.86, 66.11 (CH2O); 61.09 (CHNH3+); 60.51 (CH2NH3
+); 48.10
(CHNHAsp); 39.61 (CH2CHNH3+); 34.00 (AspCH2CHNH); 31.89, 29.64, 29.62, 29.58,
29.49, 29.34, 29.24, 29.18, 28.24 (alkylCH2); 28.20 (CH2CH2NH3+); 25.71, 25.66
(alkylCH2); 14.04 (2 × alkylCH3).
ESI-MS: 598.51 [M+H]+ (100%).
HRMS: Calcd. [M+H]+ (C34H68N3O5) m/z = 598.5153, found [M+H]
+ = 598.5139 (error
2.6 ppm).
IR ν [cm-1
]: 3330w (N–H), 2917s (C–H), 2850m (C–H), 1751m (C=O, ester), 1725m
(C=O, ester), 1668s (CONH, amide I), 1539m (CONH, amide II), 1469w, 1430w,

Chapter 7 – Experimental
255
1417w, 1401w, 1362w (C–H), 1345w, 1303w, 1271w, 1201s (C–O), 1178s (C–N),
1128s, 1078w, 1064w, 1003w, 739w, 721s.
θL: + 94.4 mdeg (215 nm, 10 mM, MeOH).
θD: − 105.3 mdeg (215 nm, 10 mM, MeOH).
L-Orn(Boc)2 (L: 6.11, D: 6.12)
Chemical Formula: C15H28N2O6
Molecular Weight: 332.40
L-Ornithine (2.00 g, 11.86 mmol) and NaOH pellets (1.10 g, 27.50 mmol) were
dissolved together in deionised water (30 mL). Di-tert-butyl dicarbonate (6.25 g, 28.60
mmol) was dissolved separately in THF (30 mL) before being added to the reaction
mixture dropwise in one portion over 30 minutes. The resulting reaction mixture was
warmed to 45°C and stirred under an N2 atmosphere for 4.5 hours. Following the
removal of volatiles in vacuo, the residue was taken up in deionised water (100 mL) and
washed with cyclohexane (50 mL). The aqueous layer was acidified to pH 3 using
NaHSO4 (1.33 M, pH paper) before the product was extracted into ethyl acetate (75 mL)
and washed successively with deionised water (50 mL) and brine (50 mL, sat.). The
organic phase was dried over MgSO4 and the resulting filtrate concentrated in vacuo to
afford the product as a foamy white solid (3.25 g, 9.77 mmol, 65%). D-yield: 75%.
Rf = 0.44 (9 : 1 DCM : methanol, ninhydrin).
1H NMR (400 MHz, CDCl3) δ: 10.10 (br s, OH, 1H); 6.19 (s, NH, 1H); 4.85 (s, NH,
1H); 4.34 – 4.26 (exp dd, app m, CHNH, 1H); 3.12 (exp t, app s, CH2NH, 2H); 1.90 –
1.81 (m, CHaHbCHNH, 1H); 1.71 – 1.62 (m, CHaHbCHNH, 1H); 1.60 – 1.52 (m,
CH2CH2NH, 2H); 1.43 (s, 2 × C(CH3)3, 18H).
13C NMR (100 MHz, CDCl3) δ: 175.84 (C=O, acid); 156.35, 155.62 (C=O, carbamate);
80.00, 79.99 (C(CH3)3); 52.92 (CHNH); 39.90 (CH2NH); 30.95 (CH2CHNH); 28.33,
28.27 (C(CH3)3); 25.87 (CH2CH2NH).
ESI-MS: 355.18 [M+Na]+
(100%).

Chapter 7 – Experimental
256
HRMS: Calcd. [M+Na]+ (C15H28N2NaO6) m/z = 355.1840, found [M+Na]
+ = 355.1822
(error 4.3 ppm).
IR ν [cm-1
]: 3336w (N–H), 2977m (O–H), 2934w (C–H), 1702s (C=O, acid), 1689s
(CONH, carbamates I), 1516m (CONH, carbamates II), 1454w, 1393m, 1366s (C–H),
1248m (C–O) 1158s, 1050w (C–N), 1050w, 1020w, 856w, 778w.
LαD: + 14.2 (c. 1.0, CHCl3).
DαD: − 17.2 (c. 1.0, CHCl3).
(C12)2-L-Asp-L-Orn(Boc)2 (L: 6.13, D: 6.14)
Chemical Formula: C43H81N3O9
Molecular Weight: 784.13
L-Orn(Boc)2 (296 mg, 0.89 mmol, 1.3 eq.) was dissolved in DCM (15 mL) and cooled
to 0°C. After 10 minutes, TBTU (252 mg, 0.78 mmol, 1.1 eq.) was added. After a
further 10 minutes, (C12)2-L-Asp.TFA (400 mg, 0.69 mmol, 1 eq., pre-dissolved in
DCM (5 mL)) and DIPEA (281 µL, 1.61 mmol, 2.3 eq.) were added. The reaction
mixture was stirred for 20 minutes at 0°C before being warmed to room temperature
and left to stir for 18 hours. The reaction mixture was then concentrated in vacuo before
the resulting residue was taken up in DCM (10 mL) and washed with NaHSO4 (2 × 15
mL, 1.33 M), NaHCO3 (2 × 10 mL, sat.), deionised water (3 × 15 mL) and brine (15
mL, sat.). The organic phase was collected, dried over MgSO4 and the resulting filtrate
concentrated in vacuo to afford a white powdery solid. The solid was purified by flash
column chromatography (SiO2, 50 : 50 cyclohexane : ethyl acetate) to afford a white
powdery product (246 mg, 0.31 µmol, 35%). D-yield: 46%.
Rf = 0.93 (9 : 1 DCM : methanol, ninhydrin).
1H NMR (400 MHz, CDCl3) δ: 7.00 (d, AspNH, J = 8.0 Hz, 1H); 5.18 (d, OrnNH, J =
7.6 Hz, 1H); 4.85 – 4.81 (exp dd, app m, AspCHNH, 1H); 4.70 (br s, OrnNH, 1H); 4.21
– 4.16 (exp dd, app m, CHNHBoc, 1H); 4.14 – 4.04 (m, 2 × CH2O, 4H); 3.16 (br s,

Chapter 7 – Experimental
257
CHaHbNHBoc, 1H); 3.10 (br s, CHaHbNHBoc, 1H); 2.97 (dd, AspCHaHbCHNHOrn,
2J
3J = 17.2 Hz, 4.8 Hz, 1H); 2.79 (dd, AspCHaHbCHNHOrn,
2J
3J = 17.2 Hz, 4.8 Hz,
1H); 1.90 – 1.76 (m, CHaHbCHNHBoc, 1H); 1.61 – 1.56 (m, 2 × CH2CH2O,
CH2CH2NHBoc, CHaHbCHNHBoc, J = 6.8 Hz, 7H); 1.41 (s, 2 × C(CH3)3; 9H); 1.23 (s,
18 × alkylCH2, 36H); 0.86 (t, 2 × alkylCH3, 3J = 6.8 Hz, 6H).
13C NMR (100 MHz, CDCl3) δ: 171.73, 170.79 (C=O, ester); 170.40 (C=O, amide);
156.09, 155.44 (C=O, carbamate); 79.84, 79.13 (C(CH3)3); 65.96, 65.26 (CH2O); 53.70
(CHNHBoc); 48.47 (AspCHNHOrn); 36.13 (AspCH2CHNH); 31.85 (CH2CHNHBoc);
30.15, 29.60, 29.57, 29.53, 29.47, 29.30, 29.20, 29.16 (alkylCH2); 28.35, 28.23
(C(CH3)3); 25.97 (CH2CH2NHBoc); 25.79, 25.71 (alkylCH2); 14.06 (2 × alkylCH3).
ESI-MS: 806.58 [M+Na]+ (100%), 784.60 [M+H]
+ (19%).
HRMS: Calcd. [M+Na]+ (C43H81N3NaO9) m/z = 806.5865, found [M+Na]
+ 806.5848
(error 1.9 ppm).
IR ν [cm-1
]: 3302m (N–H), 2918s (C–H), 2850m (C–H), 1740m (C=O, esters), 1670s
(CONH, amide I), 1656s (CONH, carbamates I), 1538m (CONH, amide II), 1471w,
1429w, 1401w, 1343w, 1295w, 1202s (C–O), 1179s (C–N), 1133m, 1057w, 985w,
801m, 721w.
(C12)2-L-Asp-L-Orn.2TFA (L: 6.15, D: 6.16)
Chemical Formula: C37H67F6N3O9
Molecular Weight: 811.95
(C12)2-L-Asp-L-Orn(Boc)2 (40 mg, 51 µmol) was dissolved in a mixture of
trifluoroacetic acid, deionised water and triisopropylsilane (500 µL, 95 : 2.5 : 2.5 v/v)
and shaken until TLC indicated the reaction to be complete (3.5 h). Deionised water
(1.5 mL) was carefully added before the reaction mixture was washed with chloroform
(2 × 4 mL). The combined organic layers were concentrated in vacuo to afford a white
solid (41 mg, 50 µmol, 99%). D-yield: 98%.
Rf = 0.29 (9 : 1 DCM : methanol, ninhydrin).
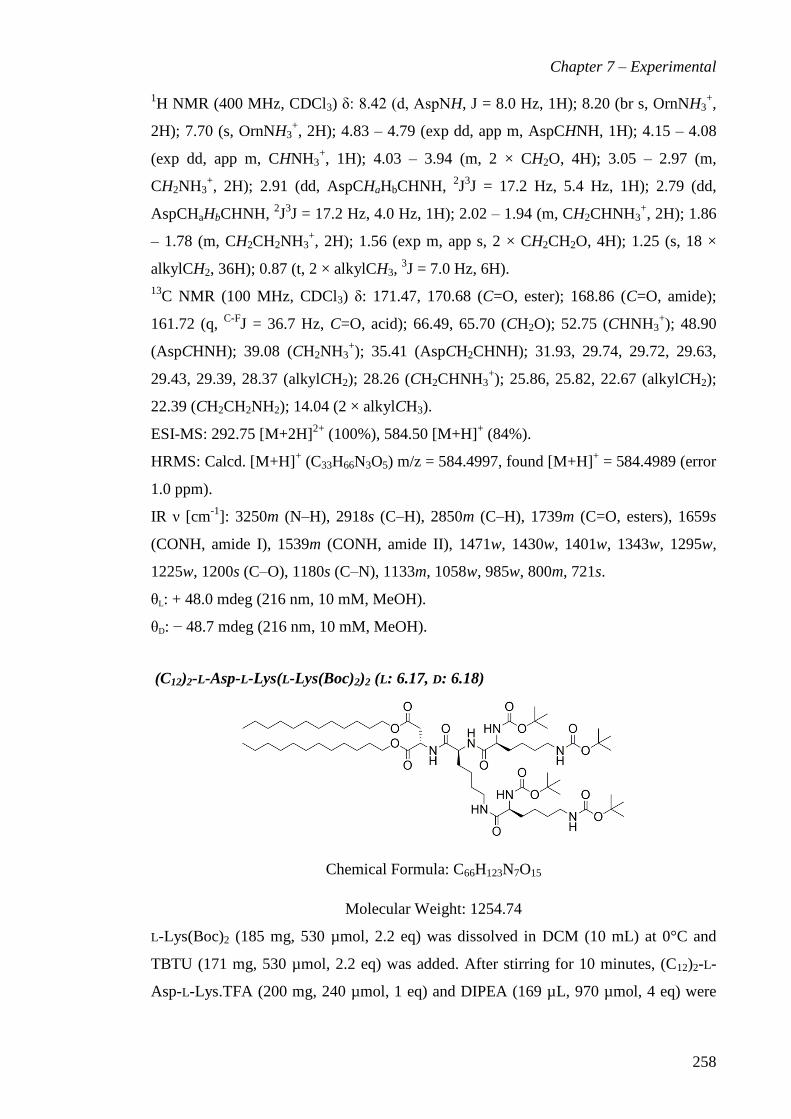
Chapter 7 – Experimental
258
1H NMR (400 MHz, CDCl3) δ: 8.42 (d, AspNH, J = 8.0 Hz, 1H); 8.20 (br s, OrnNH3
+,
2H); 7.70 (s, OrnNH3+, 2H); 4.83 – 4.79 (exp dd, app m, AspCHNH, 1H); 4.15 – 4.08
(exp dd, app m, CHNH3+, 1H); 4.03 – 3.94 (m, 2 × CH2O, 4H); 3.05 – 2.97 (m,
CH2NH3+, 2H); 2.91 (dd, AspCHaHbCHNH,
2J
3J = 17.2 Hz, 5.4 Hz, 1H); 2.79 (dd,
AspCHaHbCHNH, 2J
3J = 17.2 Hz, 4.0 Hz, 1H); 2.02 – 1.94 (m, CH2CHNH3
+, 2H); 1.86
– 1.78 (m, CH2CH2NH3+, 2H); 1.56 (exp m, app s, 2 × CH2CH2O, 4H); 1.25 (s, 18 ×
alkylCH2, 36H); 0.87 (t, 2 × alkylCH3, 3J = 7.0 Hz, 6H).
13C NMR (100 MHz, CDCl3) δ: 171.47, 170.68 (C=O, ester); 168.86 (C=O, amide);
161.72 (q, C-F
J = 36.7 Hz, C=O, acid); 66.49, 65.70 (CH2O); 52.75 (CHNH3+); 48.90
(AspCHNH); 39.08 (CH2NH3+); 35.41 (AspCH2CHNH); 31.93, 29.74, 29.72, 29.63,
29.43, 29.39, 28.37 (alkylCH2); 28.26 (CH2CHNH3+); 25.86, 25.82, 22.67 (alkylCH2);
22.39 (CH2CH2NH2); 14.04 (2 × alkylCH3).
ESI-MS: 292.75 [M+2H]2+
(100%), 584.50 [M+H]+ (84%).
HRMS: Calcd. [M+H]+ (C33H66N3O5) m/z = 584.4997, found [M+H]
+ = 584.4989 (error
1.0 ppm).
IR ν [cm-1
]: 3250m (N–H), 2918s (C–H), 2850m (C–H), 1739m (C=O, esters), 1659s
(CONH, amide I), 1539m (CONH, amide II), 1471w, 1430w, 1401w, 1343w, 1295w,
1225w, 1200s (C–O), 1180s (C–N), 1133m, 1058w, 985w, 800m, 721s.
θL: + 48.0 mdeg (216 nm, 10 mM, MeOH).
θD: − 48.7 mdeg (216 nm, 10 mM, MeOH).
(C12)2-L-Asp-L-Lys(L-Lys(Boc)2)2 (L: 6.17, D: 6.18)
Chemical Formula: C66H123N7O15
Molecular Weight: 1254.74
L-Lys(Boc)2 (185 mg, 530 µmol, 2.2 eq) was dissolved in DCM (10 mL) at 0°C and
TBTU (171 mg, 530 µmol, 2.2 eq) was added. After stirring for 10 minutes, (C12)2-L-
Asp-L-Lys.TFA (200 mg, 240 µmol, 1 eq) and DIPEA (169 µL, 970 µmol, 4 eq) were

Chapter 7 – Experimental
259
added along with more cold DCM (10 mL). After 20 minutes, the reaction mixture was
allowed to warm to room temperature, and stirred for 40 hours. The volatiles were
removed in vacuo and resulting residue taken up in DCM (20 mL) before being washed
successively with NaHSO4 (2 × 10 mL, 1.33 M), NaHCO3 (2 × 10 mL, sat.), deionised
water (3 × 10 mL) and brine (10 mL, sat.). The organic phase was collected, dried over
MgSO4 and the resulting filtrate concentrated in vacuo to afford a golden solid. This
solid was purified by flash column chromatography (SiO2, 8 : 2, ethyl acetate :
cyclohexane) to afford the product as a sticky white solid (31 mg, 25 µmol, 10%). D-
yield: 33%.
Rf = 0.69 (8 : 2 ethyl acetate : cyclohexane, ninhydrin).
1H NMR (400 MHz, CDCl3) δ: 7.09 (d, AspNH, J = 7.6 Hz, 1H); 6.92 (s, LysNH, 1H);
5.95 (s, LysNH, 1H); 5.50 (s, LysNH, 1H); 4.85 – 4.77 (exp dd, app m, AspCHNH,
1H); 4.29 (exp dd, br s, 2 × CHNHBoc, 2H); 4.13 – 3.95 (m, 2 × CH2O, LysCHNHLys
5H); 3.10 (exp m, app s, 2 × CH2NHBoc, CH2NHLys, 6H); 3.01 (dd, AspCHaHbCHNH,
2J
3J = 17.4 Hz, 4.6 Hz, 1H); 2.77 (dd, AspCHaHbCHNH,
2J
3J = 17.4 Hz, 4.6 Hz, 1H);
1.77 – 1.70 (m, 2 × CH2CHNHBoc, LysCH2CHNHLys, 6H); 1.68 – 1.62 (m, 2 ×
CH2CH2O, 4H); 1.58 – 1.46 (m, 2 × CH2CH2NHBoc, LysCH2CH2NHLys, 6H); 1.42 (s,
2 × C(CH3)3, 3 × CH2CH2CHNH, 24H); 1.41 (s, C(CH3)3, 9H) 1.40 (s, C(CH3)3, 9H);
1.25 (app s, 18 × alkylCH2, 36H); 0.87 (t, 2 × alkylCH3, 3J = 7.0 Hz, 6H).
13C NMR (100 MHz, CDCl3) δ: 173.41 (2 × C=O, ester); 171.02 (3 × C=O, amide);
156.12, 156.05 (2 × C=O, carbamate); 80.69, 79.81 (2 × C(CH3)3); 66.08, 65.33
(CH2O); 54.42, 54.02 (CH2NHBoc); 53.91, 53.86 (CHNHBoc); 48.41 (AspCHNHLys);
40.33, 40.09, 40.03 (LysCH2CHNH); 36.18 (AspCH2CHNH); 31.88 (2 ×
CH2CH2NHBoc, CH2CH2NHLys); 29.64, 29.61, 29.52, 29.41, 29.33, 29.26, 29.28,
28.49 (alkylCH2); 28.43, 28.36 (2 × C(CH3)3); 25.86, 25.79 (alkylCH2); 22.66 (2 ×
CH2CH2CHNHBoc, CH2CH2CHNHLys); 14.09 (2 × alkylCH3).
ESI-MS: 1276.89 [M+Na]+ (100%).
HRMS: Calcd. [M+Na]+ (C66H123N7NaO15) m/z = 1276.8969, found [M+Na]
+ =
1276.8930 (error 3.0 ppm).
IR ν [cm-1
]: 3301m (N–H), 2925s (C–H), 2855m (C–H), 1739m (C=O, esters), 1688s
(CONH, amide I), 1644s (CONH, carbamates I), 1520s (CONH, amide II), 1456m,
1391m, 1365s, 1272w, 1247s (C–N), 1168s (C–N), 1091w, 1046w, 1017w, 867w, 782w.
LαD: + 18.4 (c. 1.0, CHCl3).
DαD: − 22.2 (c. 1.0, CHCl3).

Chapter 7 – Experimental
260
(C12)2-L-Asp-L-Lys(L-Lys)2.4TFA (L: 6.19, D: 6.20)
Chemical Formula: C54H95F12N7O15
Molecular Weight: 1310.37
(C12)2-L-Asp-L-Lys(L-Lys(Boc)2)2 (28 mg, 22 µmol) was dissolved in a mixture of
trifluoroacetic acid, triisopropylsilane and deionised water (500 µL, 95 : 2.5 : 2.5 v/v)
before being shaken until TLC indicated reaction to be complete (2 h). Following
careful addition of deionised water (1.5 mL), the reaction mixture was washed with
chloroform (3 × 4 mL). The combined organic layers were dried over MgSO4 and the
resulting filtrate concentrated in vacuo to afford the product as a white powdery solid
(25 mg, 19 µmol, 87%). D-yield: 90%.
Rf = 0.00 (9 : 1 DCM : methanol, ninhydrin).
1H NMR (400 MHz, CD3OD) δ: 4.82 (exp dd, app t, AspCHNH,
3J = 6.4 Hz, 1H); 4.38
(exp dd, app t, LysCHNH, 3J = 5.6 Hz, 1H); 4.19 – 4.05 (m, 2 × CH2O, 4H); 3.95 (t,
CHNH3+,
3J = 5.4 Hz, 1H); 3.85 (t, CHNH3
+,
3J = 6.0 Hz, 1H); 3.29 – 3.18 (m, CH2NH,
2H); 3.00 – 2.92 (m, 2 × CH2NH3+, 4H); 2.87 (d, AspCH2CHNH,
3J = 6.4 Hz, 2H); 1.94
– 1.82 (m, 2 × CH2CHNH3+, CH2CHNH, 6H); 1.74 – 1.69 (m, 2 × CH2CH2NH3
+,
CH2CH2NH, 6H); 1.64 (exp m, app s, 2 × CH2CH2O, 4H); 1.52 – 1.43 (m, 2 ×
CH2CH2CHNH3+, CH2CH2CHNH, 6H); 1.30 (s, 18 × alkylCH2, 36H); 0.90 (t, 2 ×
alkylCH3, 3J = 6.8 Hz, 6H).
13C NMR (100 MHz, CD3OD) δ: 173.87, 172.12 (C=O, esters); 172.05, 170.09, 170.00
(C=O, amide); 77.66 (2 × CH2NH3+); 66.95, 66.42 (CH2O); 54.87 (CH2NH,
LysCHNHLys); 54.31, 53.93 (CHNH3+); 49.05 (AspCHNH); 40.48, 40.30, 40.26
(LysCH2CHN); 37.03 (AspCH2CHNH); 33.14, 32.73, 32.17 (CH2CH2N); 30.82, 30.78,
30.55, 30.50, 30.47, 29.96, 29.74, 29.71, 27.12, 27.09 (alkylCH2); 23.80, 23.02, 22.41
(CH2CH2CHN); 14.50 (2 × alkylCH3).
ESI-MS: 427.85 [M+2H]2+
(100%), 854.71 [M+H]+ (13%).

Chapter 7 – Experimental
261
HRMS: Calcd. [M+2H]2+
(C46H93N7NaO7) m/z = 427.8563, found [M+H]+ = 427.8545
(error 4.4 ppm).
IR ν [cm-1
]: 3305m (N–H), 2930s (C–H), 2855m (C–H), 1739m (C=O, esters), 1689s
(CONH, amide I), 1524s (CONH, amide II), 1455m, 1390m, 1364s, 1248s (C–N),
1168s (C–N), 1091w, 1046w, 1017w, 868w.
LαD: + 8.0 (c. 1.0, CHCl3).
DαD: – 6.5 (c. 1.0, CHCl3).
7.2 Assay Materials and Methods
Assay Materials
All materials, except novel compounds, employed in spectroscopic assays were
obtained from commercial sources and used without further purification unless stated.
Sodium salt heparin from porcine intestinal mucosa with a molecular weight between
15,000 ± 2,000 Da (1 KU = 1000 units) was obtained from Calbiochem®. Ammonium
carbonate, deoxyribonucleic acid sodium salt from calf thymus (DNA),
ethylenediaminetetraacetic acid trisodium salt hydrate (EDTA), ethidium bromide
(EthBr), Gly-Ala, N-(2-Hydroxyethyl)piperazine-N′-(2-ethanesulfonic acid) (HEPES),
human serum (from human male AB plasma), Nile red, PAMAM dendrimers,
phosphate buffered saline (PBS), protamine sulfate salt from salmon (Grade X,
amorphous powder) and Trizma® hydrochloride (Tris HCl) were obtained from Sigma
Aldrich.
UV/Vis absorbance was measured on a Shimadzu UV-2401PC spectrophotometer and
fluorescence on a Hitachi F-4500 spectrofluorimeter. All MalB solutions were
incubated at 50°C for 24 hours prior to use and stored in the dark. Unless stated, all
experiments were performed in triplicate and data is reported as a mean value plus or
minus one standard deviation.
Binding of Heparin (or other GAGs) to MalB
A cuvette was charged with 2 mL of a stock solution of MalB (25 μM) in NaCl (150
mM) and Tris HCl (10 mM). This solution was titrated with a stock solution of heparin
(or other GAG) (811 μM) in MalB (25 μM), NaCl (150 mM) and Tris HCl (10 mM) to a
final cuvette volume of 3 mL. The absorbance at 615 nm was recorded after each
addition.

Chapter 7 – Experimental
262
Interference to the MalB-Heparin Interaction By Electrolyte/Buffer
A cuvette was charged with 2 mL of a stock solution of MalB (30 μM MalB) and
heparin (27 μM) in Tris HCl (1 mM). For the electrolyte titration, the cuvette was
titrated with aliquots of the same stock solution additionally containing a concentration
of a NaCl (3 M) to a final cuvette volume of 3 mL. For the buffer titration, stock
solutions containing MalB (30 μM), heparin (27 μM) and NaCl (150 mM) were
prepared in clean water and Tris HCl (1 M). Titrating different amounts of each stock
solution into the other effected the buffer concentration in the cuvette. The absorbance
at 615 nm was recorded after each addition.
Determination of Heparin Concentration with MalB
A range of heparin stock solutions (0 U mL-1
– 10 U mL-1
) were made up in 100%
Human Serum. 0.5 mL of each heparin-in-serum stock was titrated into a cuvette
containing 1.5 mL MalB (25 μM) in Tris HCl (20 mM). The absorbance at 615 nm was
recorded.
Heparin Displacement Assay In Buffer
A cuvette containing 2 mL of MalB (25 μM), heparin (27 μM) and NaCl (150 mM) in
Tris HCl (10 mM) was titrated with binder stock solution to give the cuvette a suitable
binder-heparin charge ratio. The binder stock solution was composed of the original
MalB/heparin/NaCl/Tris HCl stock solution endowed additionally with a concentration
of binder such that, after addition of 10 μL binder stock, the cuvette charge ratio (+ : –)
is 0.037. After each addition, the cuvette was inverted to ensure good mixing and the
absorbance at 615 nm was recorded against a Tris HCl (10 mM) baseline. Absorbance
was normalised between a solution of MalB (25 μM), NaCl (150 mM) in Tris HCl (10
mM) and one containing MalB (25 μM), heparin (27 μM), NaCl (150 mM) in Tris HCl
(10 mM).
Heparin Displacement Assay In Serum
Fourteen cuvettes were charged with 1.75 mL of MalB (28.53 μM) in Tris HCl (10
mM) and a volume of binder stock solution to give the cuvette a suitable binder-heparin
charge ratio. The binder stock solution was additionally endowed with its own MalB
(25 μM), heparin (27 μM) and Tris HCl (10 mM) concentrations. The concentration of
binder in the binder stock was determined in the same manner described for the heparin

Chapter 7 – Experimental
263
displacement assay in buffer. Separately, a heparin (216 μM) solution was made in
100% human serum. Sequentially, each cuvette was titrated with 0.25 mL of the
heparin-in-serum solution and inverted to ensure thorough mixing. The absorbance was
recorded at 615 nm against a baseline of (1.75 mL 10 mM Tris HCl, 0.25 mL 100%
Human Serum) and normalised between a solution containing exclusively MalB (25
μM) and one containing MalB (25 μM) and heparin (27 μM).
Transgeden Heparin Binding Fluorescence Study
A cuvette was charged with 1 mL TGD-dendrimer (1 µM) in NaCl (150 mM) and Tris
HCl (10 mM) before being titrated with the same solution additionally endowed with
heparin (24 µM) up to a total cuvette volume of 2 mL. Following each addition, a
fluorescence spectrum was recorded following irradiation at 318 nm. All data obtained
from a single run only.
Dynamic Light Scattering (DLS)
Aggregate characteristics were determined using a Zetasizer Nano (Malvern
Instruments Ltd., Worcestershire, UK). The principle is based on the measurement of
the backscattered light fluctuations at an angle of 173° and the calculation of an
autocorrelation function. Data were recorded from 15–20 runs per single measurement,
each of which was carried out at 25°C using folded capillary cells (DTS 1060).
Monomer solutions were freshly prepared by dissolving an appropriate amount of dry
compound in filtered aqueous media (e.g. Tris HCl). All samples were agitated and
incubated at 25°C for 10 minutes prior to measurement. These studies were carried out
in the laboratory of Dr Marcelo Calderon at Freie Universität Berlin, Germany with
assistance from Dr Shashwat Malhotra.
Plasma Clotting Assays
Clotting studies employed an Axis Shield Thrombotrack coagulation analyser in
conjunction with Behnk Elektronik cuvettes and ball bearings. Technoclone normal
citrated plasma (re-suspended in HPLC grade water), Acros Organics calcium chloride
(50 mM in HPLC grade water), Celsus porcine mucosal heparin (201 IU mg-1), Siemens
Thromborel® S (re-suspended in HPLC grade water at double the manufacturers
recommended concentration) and Siemens Pathromtin SL (inverted 8 times prior to
use).

Chapter 7 – Experimental
264
Prothrombin (PT) Assay
A cylindrical cuvette, pre-warmed to 37°C on a heating block, was placed in the
coagulation analyser and charged with a ball bearing and normal citrated plasma (50
μL). Following incubation for at least 1 minute, pre-warmed (37°C) test sample (50 μL)
was added along with Thromborel® S reagent (50 μL). Upon addition of the final
reagent, the coagulation analyser was initiated. Clotting times are reported as the time at
which the coagulometer was no longer able to stir the sample. Samples remaining
unclotted after 120 seconds were recorded as ‘no clot.’ All measurements were carried
out in triplicate with error values reported as one standard deviation.
Activated Partial Thromboplastin (aPTT) Assay
A cylindrical cuvette, pre-warmed to 37°C on a heating block, was placed in the
coagulation analyser and charged with a ball bearing, normal citrated plasma (50 μL),
Pathromtin SL (50 μL) and test sample (25 μL). Following incubation for at least 2
minutes, pre-warmed (37°C) calcium chloride (25 μL) was added and the coagulation
analyser was initiated. Clotting times are reported as the time at which the coagulometer
was no longer able to stir the sample. Samples remaining unclotted after 120 seconds
were recorded as ‘no clot.’ All measurements were carried out in triplicate with error
values reported as one standard deviation.
These studies were carried out in the laboratory of Professor Jeremy Turnbull at
University of Liverpool, UK.
Nile Red Release Assay
The binder (25 µM) was dissolved in phosphate buffered saline (PBS, 0.01 M, endowed
with NaCl (138 µM) and KCl (2.7 µM)). In a cuvette, an aliquot (1 mL) of this solution
was mixed with a small amount of Nile red (1 µL, 2.5 mM in ethanol). Following
inversion to ensure mixing, fluorescence intensity at 635 nm was recorded using a 550
nm excitation wavelength. The binder stock solution was incubated at 37°C for 24 hours
before another aliquot (1 mL) was taken for fluorescence measurement as before. In the
time-resolved study, the initial solution was left in the fluorimeter and the emission was
monitored at regular time periods. For the degradation experiment in the presence of
heparin, the binder stock solution was additionally endowed with a heparin
concentration corresponding to a dosage of 0.79 mg / 100IU.

Chapter 7 – Experimental
265
Mass Spectrometric Degradation Assay
The binder was dissolved (200 µM) in ammonium carbonate (10 mM, pH 7.5). 250 µL
of this binder solution was combined with 250 µL of a Gly-Ala standard (1 mM, in 10
mM ammonium carbonate) for mass spectrometric analysis. Following incubation of the
binder solution for 24 hours at 37°C, the same analysis was repeated.
Nile Red Encapsulation Assay326
A dendron stock solution was prepared at a suitable concentration in PBS buffer (0.01
M, endowed with NaCl (138 μM) and KCl (2.7 μM)). In a cuvette, the dendron stock
solution was diluted to 1 mL final volume with PBS buffer to afford the required
concentration. To the cuvette was added 1 μL Nile Red (2.5 mM, prepared in ethanol).
Following inversion to ensure mixing, fluorescence intensity at 635 nm was recorded
using a 550 nm excitation wavelength.
TEM Imaging
Monomer solutions were prepared in clean water at concentrations above previously-
calculated CAC values to ensure compounds were present in their assembled form. For
samples imaged in the presence of heparin, the polysaccharide was introduced at a
charge ratio (+ : –) under which the binder had previously exhibited significant
interaction with it. Once prepared, aliquots of each solution were loaded on a formvar
grid, negatively stained with uranyl acetate and allowed to dry before imaging.
DNA Binding Assay356,373
A cuvette containing 2 mL of EthBr (5.07 μM) and DNA (4 μM with respect to each
base (assumed RMM: 330 g mol-1
)) in SHE Buffer (HEPES (2 mM), EDTA (0.05 mM)
and NaCl (150 mM)) was titrated with binder stock solution to give the cuvette a
suitable binder-heparin charge ratio. The binder stock solution was composed of the
original EthBr/DNA/SHE Buffer stock solution endowed additionally with a
concentration of binder such that, after addition of 10 μL binder stock, the cuvette
charge ratio (+ : –) is 0.1. After each addition, the cuvette was inverted to ensure good
mixing and the fluorescence at 595 nm was recorded using a 540 nm excitation
wavelength. Fluorescence was normalised between a solution of EthBr (5.07 μM) and
DNA (4 μM) in SHE Buffer and one containing EthBr (5.07 μM) alone in SHE Buffer
(0.01 M).

266
Abbreviations
AA Azure A
AB Alcian Blue
ACQ Aggregation-caused quenching
AIE Aggregation-induced emission
app Apparent (NMR)
aPTT Activated partial thromboplastin time
ATIII Antithrombin III
bis-MPA 2,2-bis(hydroxymethyl)propionic acid
Boc tert-butyloxycarbonyl
CAC Critical Aggregation Concentration
CD Circular dichroism or Cyclodextrin
CE50 Charge excess or charge efficiency at 50% binding
Ceff Effective concentration
CMC Critical Micelle Concentration
CNT Carbon nanotubes
Con A Concanavalin A
CS Chondroitin sulfate
d doublet (NMR)
DAPMA N,N-di-(3-aminopropyl)-N-methylamine
DCC N,N’-dicyclohexylcarbodiimide
DCM Dichloromethane
Deg Degradation peak (Mass Spectrometry)
DLS Dynamic light scattering
DMF Dimethylformamide
DNA Deoxyribose nucleic acid
DOFLA Diversity-oriented fluorescent library approach
DPD Dissipative particle dynamics
EC50 Effective concentration at 50% binding
EDTA Ethylenediaminetetraacetic acid
EM Effective molarity
EthBr Ethidium bromide
FRET Fluorescence resonance electron transfer
GAG Glycosaminoglycan
GO Graphene oxide
Gx Generation x
HA Hyaluronic acid
HEPES N-(2-hydroxyethyl)piperazine-N’-(2-ethanesulfonic acid)
HS Heparan sulfate
IC50 Concentration at 50% inhibition
IDA Indicator displacement assay
IHS International heparin standard
ITC Isothermal titration calorimetry
LMWH Low molecular weight heparin
LMWP Low molecular weight protamine
m medium (IR)
m multiplet (NMR)
MalB Mallard blue

267
MB Methylene blue
MD Molecular dynamics
MG Methyl green
Mr Relative molecular mass
MRI Magnetic resonance imaging
NIR Near infrared
NMR Nuclear magnetic resonance
NP Nanoparticles
NR Nile red
PAH Poly(allylaminehydrochloride)
PAMAM Poly(amidoamine)
PBS Phosphate buffered saline
PCPE Phosphorescent conjugated polyelectrolyte
PDI Polydispersity index (DLS)
PEG Poly(ethyleneglycol)
PEI Poly(ethyleneimine)
PNA Peptide nucleic acid
PPB Plasma-protein binding
PPV Poly(phenylenevinylidene)
PT Prothrombin
PVC Polyvinyl chloride
q quartet (NMR)
RGD Arginine-glycine-aspartic acid tripeptide
RNA Ribose nucleic acid
s strong (IR)
s singlet (NMR)
SAMul Self-assembled multivalency
siRNA Small interfering RNA
Std Standard peak (MS)
t triplet (NMR)
TA Thionine acetate
TBTU O-(Benzotriazol-1-yl)-N,N,N′,N′-tetramethyluronium tetrafluoroborate
TEM Transmission electron microscopy
TGD Transgeden
THF Tetrahydrofuran
TPE Tetraphenylethene
UFH Unfractionated heparin
UV Ultra-violet
w weak (IR)

268
References
1. J. Huskens, Curr. Opin. Chem. Biol., 2006, 10, 537-543.
2. R. W. Saalfrank, H. Maid and A. Scheurer, Angew. Chem. Int. Edit., 2008, 47,
8794-8824.
3. K. Bowman-James, Accounts Chem. Res., 2005, 38, 671-678.
4. M. Mammen, S. K. Choi and G. M. Whitesides, Angew. Chem. Int. Edit., 1998,
37, 2755-2794.
5. G. Ercolani, J. Am. Chem. Soc., 2003, 125, 16097-16103.
6. S. W. Benson, J. Am. Chem. Soc., 1958, 80, 5151-5154.
7. A. Mulder, J. Huskens and D. N. Reinhoudt, Org. Biomol. Chem., 2004, 2,
3409-3424.
8. B. Perlmutter-Hayman, Accounts Chem. Res., 1986, 19, 90-96.
9. G. Ercolani and L. Schiaffino, Angew. Chem. Int. Edit., 2011, 50, 1762-1768.
10. A. Whitty, Nat. Chem. Biol., 2008, 4, 435-439.
11. C. A. Hunter and H. L. Anderson, Angew. Chem. Int. Edit., 2009, 48, 7488-
7499.
12. W. A. Eaton, E. R. Henry, J. Hofrichter and A. Mozzarelli, Nat. Struct. Biol.,
1999, 6, 351-358.
13. M. F. Perutz, Q. Rev. Biophys., 1989, 22, 139-236.
14. M. Takeuchi, M. Ikeda, A. Sugasaki and S. Shinkai, Accounts Chem. Res., 2001,
34, 865-873.
15. J. J. Lundquist and E. J. Toone, Chem. Rev., 2002, 102, 555-578.
16. M. I. Page and W. P. Jencks, P. Natl. Acad. Sci. USA, 1971, 68, 1678-&.
17. M. Mammen, E. I. Shakhnovich and G. M. Whitesides, J. Org. Chem., 1998, 63,
3168-3175.
18. G. Ercolani, J. Org. Chem., 1999, 64, 3350-3353.
19. C. Galli and L. Mandolini, Eur. J. Org. Chem., 2000, 3117-3125.
20. H. L. Anderson, S. Anderson and J. K. M. Sanders, J. Chem. Soc. Perk. T. 1,
1995, 2231-2245.
21. F. Felluga, P. Tecilla, L. Hillier, C. A. Hunter, G. Licini and P. Scrimin, Chem.
Commun., 2000, 1087-1088.
22. J. H. Rao, I. J. Colton and G. M. Whitesides, J. Am. Chem. Soc., 1997, 119,
9336-9340.
23. J. H. Rao and G. M. Whitesides, J. Am. Chem. Soc., 1997, 119, 10286-10290.

269
24. J. H. Rao, L. Yan, J. Lahiri, G. M. Whitesides, R. M. Weis and H. S. Warren,
Chem. Biol., 1999, 6, 353-359.
25. J. H. Rao, J. Lahiri, L. Isaacs, R. M. Weis and G. M. Whitesides, Science, 1998,
280, 708-711.
26. J. H. Rao, J. Lahiri, R. M. Weis and G. M. Whitesides, J. Am. Chem. Soc., 2000,
122, 2698-2710.
27. P. R. Ashton, P. J. Campbell, E. J. T. Chrystal, P. T. Glink, S. Menzer, D. Philp,
N. Spencer, J. F. Stoddart, P. A. Tasker and D. J. Williams, Angew. Chem. Int.
Edit., 1995, 34, 1865-1869.
28. T. Chang, A. M. Heiss, S. J. Cantrill, M. C. T. Fyfe, A. R. Pease, S. J. Rowan, J.
F. Stoddart and D. J. Williams, Org. Lett., 2000, 2, 2943-2946.
29. H. W. Gibson, N. Yamaguchi, L. Hamilton and J. W. Jones, J. Am. Chem. Soc.,
2002, 124, 4653-4665.
30. V. Balzani, M. Clemente-Leon, A. Credi, J. N. Lowe, J. D. Badjić, J. F. Stoddart
and D. J. Williams, Chem-Eur. J., 2003, 9, 5348-5360.
31. A. H. Flood, R. J. A. Ramirez, W. Q. Deng, R. P. Muller, W. A. Goddard and J.
F. Stoddart, Aust. J. Chem., 2004, 57, 301-322.
32. J. D. Badjić, A. Nelson, S. J. Cantrill, W. B. Turnbull and J. F. Stoddart,
Accounts Chem. Res., 2005, 38, 723-732.
33. M. C. Misuraca, T. Grecu, Z. Freixa, V. Garavini, C. A. Hunter, P. van
Leeuwen, M. D. Segarra-Maset and S. M. Turegat, J. Org. Chem., 2011, 76,
2723-2732.
34. W. Jiang, K. Nowosinski, N. L. Low, E. V. Dzyuba, F. Klautzsch, A. Schäfer, J.
Huuskonen, K. Rissanen and C. A. Schalley, J. Am. Chem. Soc., 2012, 134,
1860-1868.
35. C. A. Hunter, M. C. Misuraca and S. M. Turega, J. Am. Chem. Soc., 2011, 133,
582-594.
36. H. J. Hogben, J. K. Sprafke, M. Hoffmann, M. Pawlicki and H. L. Anderson, J.
Am. Chem. Soc., 2011, 133, 20962-20969.
37. C. Fasting, C. A. Schalley, M. Weber, O. Seitz, S. Hecht, B. Koksch, J.
Dernedde, C. Graf, E. W. Knapp and R. Haag, Angew. Chem. Int. Edit., 2012,
51, 10472-10498.
38. G. M. Whitesides, J. P. Mathias and C. T. Seto, Science, 1991, 254, 1312-1319.
39. A. Klug, Angew. Chem. Int. Edit., 1983, 22, 565-582.
40. D. Philp and J. F. Stoddart, Angew. Chem. Int. Edit., 1996, 35, 1155-1196.
41. J. M. Lehn, Science, 1993, 260, 1762-1763.
42. J. P. Mathias and J. F. Stoddart, Chem. Soc. Rev., 1992, 21, 215-225.
43. D. Chandler, Nature, 2005, 437, 640-647.

270
44. X. L. Chi, A. J. Guerin, R. A. Haycock, C. A. Hunter and L. D. Sarson, J. Chem.
Soc. Chem. Comm., 1995, 2563-2565.
45. J. N. Israelachvili, D. J. Mitchell and B. W. Ninham, J. Chem. Soc. Farad. T. 1,
1976, 72, 1525-1568.
46. A. Barnard and D. K. Smith, Angew. Chem. Int. Edit., 2012, 51, 6572-6581.
47. J. E. Kingery-Wood, K. W. Williams, G. B. Sigal and G. M. Whitesides, J. Am.
Chem. Soc., 1992, 114, 7303-7305.
48. J. Voskuhl, M. C. A. Stuart and B. J. Ravoo, Chem-Eur. J., 2010, 16, 2790-
2796.
49. R. V. Vico, J. Voskuhl and B. J. Ravoo, Langmuir, 2011, 27, 1391-1397.
50. H. K. Lee, K. M. Park, Y. J. Jeon, D. Kim, D. H. Oh, H. S. Kim, C. K. Park and
K. Kim, J. Am. Chem. Soc., 2005, 127, 5006-5007.
51. X. Chen, U. C. Tam, J. L. Czlapinski, G. S. Lee, D. Rabuka, A. Zettl and C. R.
Bertozzi, J. Am. Chem. Soc., 2006, 128, 6292-6293.
52. K. Petkau-Milroy and L. Brunsveld, Eur. J. Org. Chem., 2013, 3470-3476.
53. S. Laschat, A. Baro, N. Steinke, F. Giesselmann, C. Haegele, G. Scalia, R.
Judele, E. Kapatsina, S. Sauer, A. Schreivogel and M. Tosoni, Angew. Chem.
Int. Edit., 2007, 46, 4832-4887.
54. A. R. A. Palmans, J. Vekemans, H. Fischer, R. A. Hikmet and E. W. Meijer,
Chem-Eur. J., 1997, 3, 300-307.
55. K. Petkau-Milroy, M. H. Sonntag, A. Colditz and L. Brunsveld, Int. J. Mol. Sci.,
2013, 14, 21189-21201.
56. D. J. Welsh and D. K. Smith, Org. Biomol. Chem., 2011, 9, 4795-4801.
57. D. Deniaud, K. Julienne and S. G. Gouin, Org. Biomol. Chem., 2011, 9, 966-
979.
58. J. J. Reczek, A. A. Kennedy, B. T. Halbert and A. R. Urbach, J. Am. Chem. Soc.,
2009, 131, 2408-2415.
59. S. W. A. Reulen, P. Y. W. Dankers, P. H. H. Bomans, E. W. Meijer and M.
Merkx, J. Am. Chem. Soc., 2009, 131, 7304-7312.
60. E. L. Doyle, C. A. Hunter, H. C. Phillips, S. J. Webb and N. H. Williams, J. Am.
Chem. Soc., 2003, 125, 4593-4599.
61. D. J. Welsh, P. Posocco, S. Pricl and D. K. Smith, Org. Biomol. Chem., 2013,
11, 3177-3186.
62. U. Griesenbach, D. M. Geddes, E. Alton and U. K. C. F. G. T. Co, Gene Ther.,
2006, 13, 1061-1067.
63. B. L. Fang and J. A. Roth, Cancer Biol. Ther., 2003, 2, S115-S121.
64. N. P. Gabrielson and J. Cheng, Biomaterials, 2010, 31, 9117-9127.
271
65. S. P. Jones, N. P. Gabrielson, D. W. Pack and D. K. Smith, Chem. Commun.,
2008, 4700-4702.
66. S. K. M. Nalluri, J. Voskuhl, J. B. Bultema, E. J. Boekema and B. J. Ravoo,
Angew. Chem. Int. Edit., 2011, 50, 9747-9751.
67. S. P. Jones, G. M. Pavan, A. Danani, S. Pricl and D. K. Smith, Chem-Eur. J.,
2010, 16, 4519-4532.
68. D. J. Welsh, S. P. Jones and D. K. Smith, Angew. Chem. Int. Edit., 2009, 48,
4047-4051.
69. A. Barnard, P. Posocco, S. Pricl, M. Calderon, R. Haag, M. E. Hwang, V. W. T.
Shum, D. W. Pack and D. K. Smith, J. Am. Chem. Soc., 2011, 133, 20288-
20300.
70. A. Barnard, P. Posocco, M. Fermeglia, A. Tschiche, M. Calderon, S. Pricl and
D. K. Smith, Org. Biomol. Chem., 2014, 12, 446-455.
71. A. Barnard, M. Calderon, A. Tschiche, R. Haag and D. K. Smith, Org. Biomol.
Chem., 2012, 10, 8403-8409.
72. A. Tschiche, A. M. Staedtler, S. Malhotra, H. Bauer, C. Bottcher, S. Sharbati,
M. Calderon, M. Koch, T. M. Zollner, A. Barnard, D. K. Smith, R. Einspanier,
N. Schmidt and R. Haag, J. Mater. Chem. B, 2014, 2, 2153-2167.
73. Y. Zhang, J. Chen, C. S. Xiao, M. Q. Li, H. Y. Tian and X. S. Chen,
Biomacromolecules, 2013, 14, 4289-4300.
74. P. M. Levine, T. P. Carberry, J. M. Holub and K. Kirshenbaum, Med. Chem.,
2013, 4, 493-509.
75. S. Middeldorp, Thromb. Res., 2008, 122, 753-762.
76. J. McLean, Am. J. Physiol., 1916, 41, 250-257.
77. J. McLean, Circulation, 1959, 19, 75-78.
78. W. H. Howell, Am. J. Physiol., 1925, 71, 553-562.
79. R. D. Rosenberg and P. S. Damus, J. Biol. Chem., 1973, 248, 6490-6505.
80. D. L. Rabenstein, Nat. Prod. Rep., 2002, 19, 312-331.
81. T. R. Rudd, M. A. Skidmore, M. Guerrini, M. Hricovini, A. K. Powell, G.
Siligardi and E. A. Yates, Curr. Opin. Struc. Biol., 2010, 20, 567-574.
82. I. Capila and R. J. Linhardt, Angew. Chem. Int. Edit., 2002, 41, 390-412.
83. R. Sasisekharan and G. Venkataraman, Curr. Opin. Chem. Biol., 2000, 4, 626-
631.
84. R. Raman, V. Sasisekharan and R. Sasisekharan, Chem. Biol., 2005, 12, 267-
277.
85. J. Hirsh and R. Raschke, Chest, 2004, 126, 188S-203S.

272
86. J. Hirsh, R. Raschke, T. E. Warkentin, J. E. Dalen, D. Deykin and L. Poller,
Chest, 1995, 108, S258-S275.
87. R. J. Kandrotas, Clin. Pharmacokinet., 1992, 22, 359-374.
88. P. Brunet, N. Simon, A. Opris, V. Faure, A. M. Lorec-Penet, H. Portugal, B.
Dussol and Y. Berland, Am. J. Kidney Dis., 2008, 51, 789-795.
89. E. W. Davie and O. D. Ratnoff, Science, 1964, 145, 1310-1312.
90. R. G. Macfarlane, Nature, 1964, 202, 498-&.
91. E. W. Davie, K. Fujikawa and W. Kisiel, Biochemistry, 1991, 30, 10363-10370.
92. J. Hirsh, T. E. Warkentin, S. G. Shaughnessy, S. S. Anand, J. L. Halperin, R.
Raschke, C. Granger, E. M. Ohman and J. E. Dalen, Chest, 2001, 119, 64S-94S.
93. M. Petitou, B. Casu and U. Lindahl, Biochimie, 2003, 85, 83-89.
94. H. C. Hemker and S. Beguin, Thromb. Haemostasis, 1993, 70, 724-728.
95. W. H. Howell, Am. J. Physiol., 1923, 63, 434.
96. S. Wessler and S. N. Gitel, Blood, 1979, 53, 525-544.
97. D. R. Bangham and M. V. Mussett, B. World Health Organ., 1959, 20, 1201-
1208.
98. D. Basu, J. Cade, A. Gallus and J. Hirsh, New Engl. J. Med., 1972, 287, 324-
327.
99. V. Ignjatovic, R. Summerhayes, A. Gan, J. Than, A. Chan, A. Cochrane, M.
Bennett, S. Horton, F. Shann, G. Lane, M. Ross-Smith and P. Monagle, Thromb.
Res., 2007, 120, 347-351.
100. R. Balhorn, Genome Biol., 2007, 8, 227.
101. F. P. Ottensmeyer, R. F. Whiting and A. P. Korn, P. Natl. Acad. Sci. USA, 1975,
72, 4953-4955.
102. S. M. Bromfield, P. Posocco, M. Fermeglia, S. Pricl, J. Rodríguez-López and D.
K. Smith, Chem. Commun., 2013, 49, 4830-4832.
103. J. Butterworth, Y. A. Lin, R. C. Prielipp, J. Bennett, J. W. Hammon and R. L.
James, Ann. Thorac. Surg., 2002, 74, 1589-1595.
104. J. Butterworth, Y. A. Lin, R. Prielipp, J. Bennett and R. James, Anesth. Analg.,
2002, 94, 514-522.
105. K. H. Teoh, E. Young, C. A. Bradley and J. Hirsh, Circulation, 1993, 88, Ii420-
425.
106. A. Galeone, C. Rotunno, P. Guida, B. Assunta, G. Rubino, L. d. L. T. Schinosa
and D. Paparella, J. Cardiothor. Vasc. An., 2013, 27, 853-858.
107. C. Hermans and D. Claeys, Curr. Med. Res. Opin., 2006, 22, 471-481.

273
108. P. Martin, F. Horkay, N. K. Gupta, C. Gebitekin and D. R. Walker, Blood
Coagul. Fibrin., 1992, 3, 187-191.
109. K. H. T. Teoh, E. Young, M. H. Blackall, R. S. Roberts and J. Hirsh, J. Thorac.
Cardiovasc. Surg., 2004, 128, 211-219.
110. M. Stafford-Smith, E. A. Lefrak, A. G. Qazi, I. J. Welsby, L. Barber, A. Hoeft,
A. Dorenbaum, J. Mathias, J. J. Rochon and M. F. Newman, Anesthesiology,
2005, 103, 229-240.
111. R. Porsche and Z. R. Brenner, Heart Lung, 1999, 28, 418-428.
112. Y. Q. Chu, L. J. Cai, D. C. Jiang, D. Jia, S. Y. Yan and Y. Q. Wang, Clin. Ther.,
2010, 32, 1729-1732.
113. M. Nybo and J. S. Madsen, Basic & Clinical Pharmacology & Toxicology,
2008, 103, 192-196.
114. S. E. Kimmel, M. A. Sekeres, J. A. Berlin, L. R. Goldberg and B. L. Strom, J.
Clin. Epidemiol., 1998, 51, 1-10.
115. J. J. van Veen, R. M. Maclean, K. K. Hampton, S. Laidlaw, S. Kitchen, P. Toth
and M. Makris, Blood Coagul. Fibrin., 2011, 22, 565-570.
116. M. A. Crowther, L. R. Berry, P. T. Monagle and A. K. C. Chan, Br. J.
Haematol., 2002, 116, 178-186.
117. G. J. Despotis, G. Gravlee, K. Filos and J. Levy, Anesthesiology, 1999, 91,
1122-1151.
118. P. D. Raymond, M. J. Ray, S. N. Callen and N. A. Marsh, Perfusion-UK, 2003,
18, 269-276.
119. D. J. Murray, W. J. Brosnahan, B. Pennell, D. Kapalanski, J. M. Weiler and J.
Olson, J. Cardiothor. Vasc. An., 1997, 11, 24-28.
120. D. P. Prisco, R, Thromb. J., 2003, 1, 1 - 10
121. A. F. Rosenberg, M. Zumberg, L. Taylor, A. LeClaire and N. Harris, J. Pharm.
Pract., 2010, 23, 210-216.
122. P. D. Raymond, M. J. Ray, S. N. Callen and N. A. Marsh, Perfusion-UK, 2003,
18, 277-281.
123. J. C. Horrow, Anesth. Analg., 1985, 64, 348-361.
124. N. Sadeghi, D. Hoppensteadt, O. Iqbal, W. Jeske, J. M. Walenga and J. Fareed,
Faseb J., 2010, 24, 1.
125. T. D. James and S. Shinkai, in Host-Guest Chemistry: Mimetic Approaches to
Study Carbohydrate Recognition, ed. S. Penades, Springer-Verlag Berlin,
Berlin, 2002, vol. 218, pp. 159-200.
126. K. Sandanayake and S. Shinkai, J. Chem. Soc. Chem. Comm., 1994, 1083-1084.
127. R. Nishiyabu, Y. Kubo, T. D. James and J. S. Fossey, Chem. Commun., 2011,
47, 1106-1123.

274
128. S. D. Bull, M. G. Davidson, J. M. H. Van den Elsen, J. S. Fossey, A. T. A.
Jenkins, Y. B. Jiang, Y. Kubo, F. Marken, K. Sakurai, J. Z. Zhao and T. D.
James, Accounts Chem. Res., 2013, 46, 312-326.
129. Y. J. Huang, W. J. Ouyang, X. Wu, Z. Li, J. S. Fossey, T. D. James and Y. B.
Jiang, J. Am. Chem. Soc., 2013, 135, 1700-1703.
130. J. P. Lorand and J. O. Edwards, J. Org. Chem., 1959, 24, 769-774.
131. J. Yoon and A. W. Czarnik, J. Am. Chem. Soc., 1992, 114, 5874-5875.
132. J. Yan, G. Springsteen, S. Deeter and B. H. Wang, Tetrahedron, 2004, 60,
11205-11209.
133. S. C. Ma, V. C. Yang and M. E. Meyerhoff, Anal. Chem., 1992, 64, 694-697.
134. J. A. Wahr, J. H. Yun, V. C. Yang, L. M. Lee and M. E. Meyerhoff, J.
Cardiothor. Vasc. An., 1996, 10, 447-450.
135. S. C. Ma, V. C. Yang, B. Fu and M. E. Meyerhoff, Anal. Chem., 1993, 65, 2078-
2084.
136. S. Amemiya, Y. Kim, R. Ishimatsu and B. Kabagambe, Anal. Bioanal. Chem.,
2011, 399, 571-579.
137. H. Qi, L. Zhang, L. Yang, P. Yu and L. Mao, Anal. Chem., 2013, 85, 3439-3445.
138. Y. Chen, R. N. Liang and W. Qin, Chinese Chem. Lett., 2012, 23, 233-236.
139. J. Umlas, R. H. Taff, G. Gauvin and P. Swierk, Anesth. Analg., 1983, 62, 1095-
1099.
140. G. Gauvin, J. Umlas and N. Chin, Med. Instrum., 1983, 17, 165-168.
141. M. D. Klein, R. A. Drongowski, R. J. Linhardt and R. S. Langer, Anal.
Biochem., 1982, 124, 59-64.
142. Q. C. Jiao, Q. Liu, C. Sun and H. He, Talanta, 1999, 48, 1095-1101.
143. Q. C. Jiao and Q. Liu, Anal. Lett., 1998, 31, 1311-1323.
144. Z. L. Zhong and E. V. Anslyn, J. Am. Chem. Soc., 2002, 124, 9014-9015.
145. A. T. Wright, Z. L. Zhong and E. V. Anslyn, Angew. Chem. Int. Edit., 2005, 44,
5679-5682.
146. Y. Egawa, R. Hayashida, T. Seki and J.-i. Anzai, Talanta, 2008, 76, 736-741.
147. Q. Chen, Y. Cui, J. Cao and B.-H. Han, Polymer, 2011, 52, 383-390.
148. S. V. Nalage, S. V. Bhosale and S. K. Bhargava, Tetrahedron Lett., 2012, 53,
2864-2867.
149. W. Sun, H. Bandmann and T. Schrader, Chem-Eur. J., 2007, 13, 7701-7707.
150. M. Wang, D. Q. Zhang, G. X. Zhang and D. B. Zhu, Chem. Commun., 2008,
4469-4471.

275
151. L. T. Zeng, P. F. Wang, H. Y. Zhang, X. Q. Zhuang, Q. Dai and W. M. Liu,
Org. Lett., 2009, 11, 4294-4297.
152. K. Y. Pu and B. Liu, Macromolecules, 2008, 41, 6636-6640.
153. K.-Y. Pu and B. Liu, Adv. Funct. Mater., 2009, 19, 277-284.
154. K. Pu, R. Zhan, J. Liang and B. Liu, Science China-Chemistry, 2011, 54, 567-
574.
155. B. Xu, X. Wu, H. Li, H. Tong and L. Wang, Polymer, 2012, 53, 490-494.
156. T. Bříza, Z. Kejík, I. Císařová, J. Králová, P. Martásek and V. Král, Chem.
Commun., 2008, 1901-1903.
157. J. C. Sauceda, R. M. Duke and M. Nitz, ChemBioChem, 2007, 8, 391-394.
158. H. Szelke, S. Schübel, J. Harenberg and R. Krämer, Chem. Commun., 2010, 46,
1667-1669.
159. M. C.-L. Yeung and V. W.-W. Yam, Chem-Eur. J., 2011, 17, 11987-11990.
160. S. L. Wang and Y. T. Chang, Chem. Commun., 2008, 1173-1175.
161. X. Gu, G. Zhang and D. Zhang, Analyst, 2012, 137, 365-369.
162. J. D. Luo, Z. L. Xie, J. W. Y. Lam, L. Cheng, H. Y. Chen, C. F. Qiu, H. S.
Kwok, X. W. Zhan, Y. Q. Liu, D. B. Zhu and B. Z. Tang, Chem. Commun.,
2001, 1740-1741.
163. N. B. Shustova, T. C. Ong, A. F. Cozzolino, V. K. Michaelis, R. G. Griffin and
M. Dinca, J. Am. Chem. Soc., 2012, 134, 15061-15070.
164. R. T. K. Kwok, J. L. Geng, J. W. Y. Lam, E. G. Zhao, G. Wang, R. Y. Zhan, B.
Liu and B. Tang, J. Mater. Chem. B, 2014, 2, 4134-4141.
165. H. L. Liu, P. S. Song, R. R. Wei, K. Li and A. J. Tong, Talanta, 2014, 118, 348-
352.
166. H. Szelke, J. Harenberg and R. Krämer, Thromb. Haemostasis, 2009, 102, 859-
864.
167. H. F. Shi, H. B. Sun, H. R. Yang, S. J. Liu, G. Jenkins, W. Feng, F. Y. Li, Q.
Zhao, B. Liu and W. Huang, Adv. Funct. Mater., 2013, 23, 3268-3276.
168. D. H. Kim, Y. J. Park, K. H. Jung and K. H. Lee, Anal. Chem., 2014, 86, 6580-
6586.
169. E. Climent, P. Calero, M. D. Marcos, R. Martínez-Máňez, F. Sancenon and J.
Soto, Chem-Eur. J., 2009, 15, 1816-1820.
170. B. K. Jena and C. R. Raj, Biosens. Bioelectron., 2008, 23, 1285-1290.
171. R. Cao and B. X. Li, Chem. Commun., 2011, 47, 2865-2867.
172. X. L. Fu, L. X. Chen and J. H. Li, Analyst, 2012, 137, 3653-3658.

276
173. X. L. Fu, L. X. Chen, J. H. Li, M. Lin, H. Y. You and W. H. Wang, Biosens.
Bioelectron., 2012, 34, 227-231.
174. R. Godavarti and R. Sasisekharan, J. Biol. Chem., 1998, 273, 248-255.
175. T. Ammar and C. F. Fisher, Anesthesiology, 1997, 86, 1382-1386.
176. H. F. Wu, R. L. Lundblad and F. C. Church, Blood, 1995, 85, 421-428.
177. A. K. Udit, C. Everett, A. J. Gale, J. R. Kyle, M. Ozkan and M. G. Finn,
ChemBioChem, 2009, 10, 503-510.
178. A. Luganini, A. Giuliani, G. Pirri, L. Pizzuto, S. Landolfo and G. Gribaudo,
Antivir. Res., 2010, 85, 532-540.
179. Y. Byun, V. K. Singh and V. C. Yang, Thromb. Res., 1999, 94, 53-61.
180. L. C. Chang, H. F. Lee, Z. Q. Yang and V. C. Yang, AAPS Pharmsci, 2001, 3,
art. no.-17.
181. L. C. Chang, J. F. Liang, H. F. Lee, L. M. Lee and V. C. Yang, AAPS Pharmsci,
2001, 3, art. no.-18.
182. L. M. Lee, L. C. Chang, S. Wrobleski, T. W. Wakefield and V. C. Yang, AAPS
Pharmsci, 2001, 3, art. no.-19.
183. T. W. Wakefield, P. C. Andrews, S. K. Wrobleski, A. M. Kadell, A. Fazzalari,
B. J. Nichol, T. Vanderkooi and J. C. Stanley, J. Surg. Res., 1994, 56, 586-593.
184. M. J. Hernaiz, L. A. LeBrun, Y. Wu, J. W. Sen, R. J. Linhardt and N. H. H.
Heegaard, Eur. J. Biochem., 2002, 269, 2860-2867.
185. W. A. Weiss, J. S. Gilman, A. J. Catenacci and A. E. Osterberg, JAMA-J. Am.
Med. Assoc., 1958, 166, 603-607.
186. M. Kikura, M. K. Lee and J. H. Levy, Anesth. Analg., 1996, 83, 223-227.
187. G. Montalescot, W. M. Zapol, A. Carvalho, D. R. Robinson, A. Torres and E.
Lowenstein, Circulation, 1990, 82, 1754-1764.
188. C. W. Lillehei, L. P. Sterns, D. M. Long and D. Lepley, Ann. Surg., 1960, 151,
11-16.
189. K. Kamiński, M. Płonka, J. Ciejka, K. Szczubiałka, M. Nowakowska, B.
Lorkowska, R. Korbut and R. Lach, J. Med. Chem., 2011, 54, 6586-6596.
190. B. Kalaska, E. Sokolowska, K. Kaminski, K. Szczubialka, K. Kramkowski, A.
Mogielnicki, M. Nowakowska and W. Buczko, Eur. J. Pharmacol., 2012, 686,
81-89.
191. K. Kamiński, B. Kałaska, P. Koczurkiewicz, M. Michalik, K. Szczubiałka, A.
Mogielnicki, W. Buczko and M. Nowakowska, Med. Chem., 2014, 5, 489-495.
192. S. H. Bai, C. Thomas and F. Ahsan, J. Pharm. Sci., 2007, 96, 2090-2106.
193. X. Y. Feng, Y. Y. Cheng, K. Yang, J. H. Zhang, Q. L. Wu and T. W. Xu, J.
Phys. Chem. B, 2010, 114, 11017-11026.

277
194. S. Bai and F. Ahsan, Pharm. Res., 2009, 26, 539-548.
195. S. Metz, J. C. Horrow, I. P. Goel, M. L. R. Kuretu and C. Bellwoar, J.
Cardiothor. Vasc. An., 1996, 10, 474-476.
196. R. E. McAllister, Circulation, 2010, 122.
197. J. Kuziej, E. Litinas, D. A. Hoppensteadt, D. H. Liu, J. M. Walenga, J. Fareed
and W. Jeske, Clin. Appl. Thromb.-Hem., 2010, 16, 377-386.
198. C. E. Mahan, J. Thromb. Thrombolys., 2014, 37, 271-278.
199. F. Cunsolo, G. M. L. Consoli, C. Geraci and T. Mecca, Abiotic Heparin
Antagonists, 2005, WO/2005/028422.
200. T. Mecca, G. M. L. Consoli, C. Geraci, R. La Spina and F. Cunsolo, Org.
Biomol. Chem., 2006, 4, 3763-3768.
201. T. Mecca and F. Cunsolo, Polym. Advan. Technol., 2010, 21, 752-757.
202. S. Choi, D. J. Clements, V. Pophristic, I. Ivanov, S. Vemparala, J. S. Bennett, M.
L. Klein, J. D. Winkler and W. E. DeGrado, Angew. Chem. Int. Edit., 2005, 44,
6685-6689.
203. C. Kelly, S. Khaja, A. Vena, A. Yu and J. M. Esson, Anal. Chim. Acta, 2010,
681, 1-7.
204. G. L. Montalvo, Y. Zhang, T. M. Young, M. J. Costanzo, K. B. Freeman, J.
Wang, D. J. Clements, E. Magavern, R. W. Kavash, R. W. Scott, D. H. Liu and
W. F. DeGrado, ACS Chem. Biol., 2014, 9, 967-975.
205. M. Schuksz, M. M. Fuster, J. R. Brown, B. E. Crawford, D. P. Ditto, R.
Lawrence, C. A. Glass, L. C. Wang, Y. Tor and J. D. Esko, P. Natl. Acad. Sci.
USA, 2008, 105, 13075-13080.
206. D. T. Hunter and J. M. Hill, Nature, 1961, 191, 1378-1379.
207. K. Rajangam, H. A. Behanna, M. J. Hui, X. Q. Han, J. F. Hulvat, J. W.
Lomasney and S. I. Stupp, Nano Lett., 2006, 6, 2086-2090.
208. H. A. Behanna, K. Rajangam and S. I. Stupp, J. Am. Chem. Soc., 2007, 129,
321-327.
209. K. Rajangam, M. S. Arnold, M. A. Rocco and S. I. Stupp, Biomaterials, 2008,
29, 3298-3305.
210. A. D. Cardin and H. J. R. Weintraub, Arteriosclerosis, 1989, 9, 21-32.
211. A. C. Rodrigo, A. Barnard, J. Cooper and D. K. Smith, Angew. Chem. Int. Edit.,
2011, 50, 4675-4679.
212. S. M. Bromfield, E. Wilde and D. K. Smith, Chem. Soc. Rev., 2013, 42, 9184-
9195.
213. G. R. Jones, R. Hashim and D. M. Power, Biochim. Biophys. Acta., 1986, 883,
69-76.

278
214. J. H. Stebbins, J. Am. Chem. Soc., 1884, 6, 304-305.
215. P. N. Marshall, Histochem. J., 1979, 11, 489-493.
216. P. N. Marshall and S. M. Lewis, Stain Technol., 1975, 50, 375-381.
217. R. W. Mowry and F. H. Kasten, Biotech. Histochem., 1975, 50, 65-81.
218. W. Löhr, I. Sohmer and D. Wittekind, Stain Technol., 1974, 49, 359-366.
219. E. Tuite and J. M. Kelly, Biopolymers, 1995, 35, 419-433.
220. E. M. Sloand, C. M. Kessler, C. L. McIntosh and H. G. Klein, Thromb. Res.,
1989, 54, 677-686.
221. E. H. Flewellen, Tex. Med., 1980, 76, 49-51.
222. J. G. Whitwam, A. R. Taylor and J. M. White, Anaesthesia, 1979, 34, 181-182.
223. N. Blass and D. Fung, Anesthesiology, 1976, 45, 458-459.
224. V. C. Yang, Y. Y. Fu, C. L. C. Teng, S. C. Ma and J. N. Shanberge, Thromb.
Res., 1994, 74, 427-434.
225. V. E. Nicotra, M. F. Mora, R. A. Iglesias and A. M. Baruzzi, Dyes Pigments,
2008, 76, 315-318.
226. M. Havelcová, P. Kubát and I. Nĕmcová, Dyes Pigments, 1999, 44, 49-54.
227. K. Ahmed, R. Azmat, F. Uddin and M. Q. Fatmi, Chinese J. Chem., 2011, 29,
643-649.
228. R. Nothelfer, J. Ruprecht, Heyl and H. Baumgärtel, Biopolymers, 1986, 25,
1273-1281.
229. W. C. Lai, N. S. Dixit and R. A. Mackay, J. Phys. Chem., 1984, 88, 5364-5368.
230. R. A. Rhoades and D. R. Bell, Medical Physiology: Principles for Clinical
Medicine, Lippincott, Williams and Wilkins, Philadelphia, PA, 2008.
231. A. K. Krey and F. E. Hahn, Biochemistry, 1975, 14, 5061-5067.
232. J. E. Scott, Histochemistry, 1967, 9, 30-47.
233. J. E. Scott, G. Quintarelli and M. C. Dellovo, Histochemistry, 1964, 4, 73-85.
234. J. E. Scott, Eur. J. Oral Sci., 1996, 104, 2-9.
235. P. Whiteman, Biochem. J., 1973, 131, 343-350.
236. J. E. Scott and I. H. Willett, Nature, 1966, 209, 985-&.
237. S. Bjornsson, Anal. Biochem., 1993, 210, 282-291.
238. T. T. Williams, C. Dohno, E. D. A. Stemp and J. K. Barton, J. Am. Chem. Soc.,
2004, 126, 8148-8158.
239. R. E. Hileman, J. R. Fromm, J. M. Weiler and R. J. Linhardt, Bioessays, 1998,
20, 156-167.

279
240. A. Isidro-Llobet, M. Álvarez and F. Albericio, Chem. Rev., 2009, 109, 2455-
2504.
241. P. A. Wender, T. C. Jessop, K. Pattabiraman, E. T. Pelkey and C. L. VanDeusen,
Org. Lett., 2001, 3, 3229-3232.
242. S. M. Bromfield, A. Barnard, P. Posocco, M. Fermeglia, S. Pricl and D. K.
Smith, J. Am. Chem. Soc., 2013, 135, 2911-2914.
243. J. C. van Kerkhof, P. Bergveld and R. B. M. Schasfoort, Biosens. Bioelectron.,
1995, 10, 269-282.
244. K. Gaus and E. A. H. Hall, Biosens. Bioelectron., 1998, 13, 1307-1315.
245. J. F. Callan, A. P. de Silva and D. C. Magri, Tetrahedron, 2005, 61, 8551-8588.
246. Z. Shriver and R. Sasisekharan, Nat. Chem., 2013, 5, 644-646.
247. L. Zhang and G. Q. Tang, J. Fluoresc., 2013, 23, 303-310.
248. B. S. Fujimoto, J. B. Clendenning, J. J. Delrow, P. J. Heath and M. Schurr, J.
Phys. Chem., 1994, 98, 6633-6643.
249. G. Somer and A. Temizer, Photochem. Photobiol., 1984, 40, 575-580.
250. A. Mills and J. Wang, J. Photoch. Photobio. A, 1999, 127, 123-134.
251. A. H. Gemeay, I. A. Mansour, R. G. El-Sharkawy and A. B. Zaki, J. Chem.
Technol. Biot., 2004, 79, 85-96.
252. Y. Usui and M. Koizumi, B. Chem. Soc. Jpn., 1961, 34, 1651-1658.
253. A. Chakraborty, M. Ali and S. K. Saha, Spectrochim. Acta A, 2010, 75, 1577-
1583.
254. A. Czímerová, J. Bujdák and A. Gáplovský, Colloid Surface A, 2004, 243, 89-
96.
255. D. K. Smith, Chem. Commun., 1999, 1685-1686.
256. G. M. Dykes, L. J. Brierley, D. K. Smith, P. T. McGrail and G. J. Seeley, Chem-
Eur. J., 2001, 7, 4730-4739.
257. G. J. Despotis, J. H. Joist, C. W. Hogue, A. Alsoufiev, D. JoinerMaier, S. A.
Santoro, E. Spitznagel, J. I. Weitz and L. T. Goodnough, Thromb. Haemostasis,
1996, 76, 902-908.
258. B. P. Schick, D. Maslow, A. Moshinski and J. D. San Antonio, Blood, 2004,
103, 1356-1363.
259. J. D. Zhang, G. Rivers, Y. Y. Zhu, A. Jacobsen, J. Peyers, G. Grundstrom, P.
Burch, S. Hussein, A. Marolewski, W. Herlihy and J. Rusche, Bioorg. Med.
Chem., 2001, 9, 825-836.
260. A. Sekiya, S. Oishi, N. Fujii and T. Koide, Chem. Pharm. Bull., 2012, 60, 371-
376.
280
261. S. L. Wiskur, H. Ait-Haddou, J. J. Lavigne and E. V. Anslyn, Accounts Chem.
Res., 2001, 34, 963-972.
262. B. T. Nguyen and E. V. Anslyn, Coordin. Chem. Rev., 2006, 250, 3118-3127.
263. N. Y. Kang, H. H. Ha, S. W. Yun, Y. H. Yu and Y. T. Chang, Chem. Soc. Rev.,
2011, 40, 3613-3626.
264. P. Rossmann, K. Matoušovic and V. Horáček, Virchows Arch. B, 1982, 40, 81-
98.
265. J. Maurer, S. Haselbach, O. Klein, D. Baykut, V. Vogel and W. Mäntele, J. Am.
Chem. Soc., 2011, 133, 1134-1140.
266. D. A. Tomalia, H. Baker, J. Dewald, M. Hall, G. Kallos, S. Martin, J. Roeck, J.
Ryder and P. Smith, Polym. J., 1985, 17, 117-132.
267. D. A. Tomalia, A. M. Naylor and W. A. Goddard, Angew. Chem. Int. Edit.,
1990, 29, 138-175.
268. D. K. Smith and F. Diederich, Chem-Eur. J., 1998, 4, 1353-1361.
269. C. Liang and J. M. J. Frechet, Prog. Polym. Sci., 2005, 30, 385-402.
270. R. Esfand and D. A. Tomalia, Drug Discov. Today, 2001, 6, 427-436.
271. W. D. Jang, K. M. K. Selim, C. H. Lee and I. K. Kang, Prog. Polym. Sci., 2009,
34, 1-23.
272. N. T. Pourianazar, P. Mutlu and U. Gunduz, J. Nanopart. Res., 2014, 16, 38.
273. A. E. Beezer, A. S. H. King, I. K. Martin, J. C. Mitchell, L. J. Twyman and C. F.
Wain, Tetrahedron, 2003, 59, 3873-3880.
274. R. Z. Xu, Y. L. Wang, X. L. Wang, E. K. Jeong, D. L. Parker and Z. R. Lu, Exp.
Biol. Med., 2007, 232, 1081-1089.
275. B. Klajnert, M. Cangiotti, S. Calici, M. Ionov, J. P. Majoral, A. M. Caminade, J.
Cladera, M. Bryszewska and M. F. Ottaviani, New J. Chem., 2009, 33, 1087-
1093.
276. R. Duncan and L. Izzo, Adv. Drug Deliv. Rev., 2005, 57, 2215-2237.
277. N. Malik, R. Wiwattanapatapee, R. Klopsch, K. Lorenz, H. Frey, J. W. Weener,
E. W. Meijer, W. Paulus and R. Duncan, J. Control. Release, 2000, 65, 133-148.
278. P. K. Maiti, T. Cagin, S. T. Lin and W. A. Goddard, Macromolecules, 2005, 38,
979-991.
279. Y. Liu, V. S. Bryantsev, M. S. Diallo and W. A. Goddard, J. Am. Chem. Soc.,
2009, 131, 2798-2799.
280. H. Szelke, S. Schübel, J. Harenberg and R. Krämer, Bioorg. Med. Chem. Lett.,
2010, 20, 1445-1447.
281. P. Posocco, S. Pricl, S. Jones, A. Barnard and D. K. Smith, Chem. Sci., 2010, 1,
393-404.
281
282. E. Díez-Barra, J. C. García-Martínez and J. Rodríguez-López, J. Org. Chem.,
2003, 68, 832-838.
283. A. R. Cano-Marín, E. Díez-Barra and J. Rodríguez-López, Tetrahedron, 2005,
61, 395-400.
284. C. Hadad, J. C. García-Martínez and J. Rodríguez-López, J. Org. Chem., 2012,
77, 6223-6230.
285. E. Díez-Barra, J. C. Garcia-Martínez, R. del Rey, J. Rodríguez-López, F.
Giacalone, J. L. Segura and N. Martín, J. Org. Chem., 2003, 68, 3178-3183.
286. J. C. García-Martínez, E. Díez-Barra and J. Rodríguez-López, Curr. Org. Synth.,
2008, 5, 267-290.
287. J. C. Garcia-Martínez, C. Atienza, M. de la Peña, A. C. Rodrigo, J. Tejeda and J.
Rodríguez-López, J. Mass Spectrom., 2009, 44, 613-620.
288. J. Tolosa, C. Romero-Nieto, E. Díez-Barra, P. Sánchez-Verdú and J. Rodríguez-
López, J. Org. Chem., 2007, 72, 3847-3852.
289. E. Díez-Barra, J. C. García-Martínez, S. Merino, R. del Rey, J. Rodríguez-
López, P. Sánchez-Verdú and J. Tejeda, J. Org. Chem., 2001, 66, 5664-5670.
290. M. Martin-Zarco, S. Toribio, J. C. Garcia-Martinez and J. Rodriguez-Lopez, J.
Polym. Sci. A1, 2009, 47, 6409-6419.
291. A. C. Rodrigo, I. Rivilla, F. C. Pérez-Martínez, S. Monteagudo, V. Ocaña, J.
Guerra, J. C. García-Martínez, S. Merino, P. Sánchez-Verdú, V. Ceña and J.
Rodríguez-López, Biomacromolecules, 2011, 12, 1205-1213.
292. G. M. Pavan, S. Monteagudo, J. Guerra, B. Carrion, V. Ocana, J. Rodríguez-
López, A. Danani, F. C. Perez-Martínez and V. Cena, Curr. Med. Chem., 2012,
19, 4929-4941.
293. J. Guerra, A. C. Rodrigo, S. Merino, J. Tejeda, J. C. García-Martínez, P.
Sánchez-Verdú, V. Ceña and J. Rodríguez-López, Macromolecules, 2013, 46,
7316-7324.
294. S. M. Bromfield, P. Posocco, M. Fermeglia, J. Tolosa, A. Herreros-López, S.
Pricl, J. Rodríguez-López and D. K. Smith, Chem-Eur. J., 2014, 20, 9666-9674.
295. G. M. Pavan, A. Danani, S. Pricl and D. K. Smith, J. Am. Chem. Soc., 2009,
131, 9686-9694.
296. G. M. Pavan, L. Albertazzi and A. Danani, J. Phys. Chem. B, 2010, 114, 2667-
2675.
297. C. B. Sun, T. Tang and H. Uludag, J. Phys. Chem. B, 2012, 116, 2405-2413.
298. E. Chargaff and K. B. Olson, J. Biol. Chem., 1937, 122, 153-167.
299. M. Schapira and B. W. Christman, Circulation, 1990, 82, 1877-1879.
300. C. A. Palma, M. Cecchini and P. Samori, Chem. Soc. Rev., 2012, 41, 3713-3730.

282
301. L. Brunsveld, B. G. G. Lohmeijer, J. A. J. M. Vekemans and E. W. Meijer,
Chem. Commun., 2000, 2305-2306.
302. M. K. Müller and L. Brunsveld, Angew. Chem. Int. Edit., 2009, 48, 2921-2924.
303. D. K. Smith, Chem. Commun., 2006, 34-44.
304. M. A. Kostiainen, C. Pietsch, R. Hoogenboom, R. J. M. Nolte and J.
Cornelissen, Adv. Funct. Mater., 2011, 21, 2012-2019.
305. J. Mikkilä, H. Rosilo, S. Nummelin, J. Seitsonen, J. Ruokolainen and M. A.
Kostiainen, ACS Macro Lett., 2013, 2, 720-724.
306. J. M. Chen, T. M. Su and C. Y. Mou, J. Phys. Chem., 1986, 90, 2418-2421.
307. V. K. Aswal and P. S. Goyal, Chem. Phys. Lett., 2002, 364, 44-50.
308. J. Lu, S. C. Owen and M. S. Shoichet, Macromolecules, 2011, 44, 6002-6008.
309. T. Miller, A. Hill, S. Uezguen, M. Weigandt and A. Goepferich,
Biomacromolecules, 2012, 13, 1707-1718.
310. S. Kim, Y. Z. Shi, J. Y. Kim, K. Park and J. X. Cheng, Expert Opin. Drug Del.,
2010, 7, 49-62.
311. J. K. Choi, J. Ho, S. Curry, D. H. Qin, R. Bittman and J. A. Hamilton, J. Lipid
Res., 2002, 43, 1000-1010.
312. S. M. Bates and J. I. Weitz, Circulation, 2005, 112, E53-E60.
313. E. R. Gillies and J. M. J. Fréchet, J. Am. Chem. Soc., 2002, 124, 14137-14146.
314. E. R. Gillies, E. Dy, J. M. J. Fréchet and F. C. Szoka, Mol. Pharm., 2005, 2,
129-138.
315. C. C. Lee, E. R. Gillies, M. E. Fox, S. J. Guillaudeu, J. M. J. Fréchet, E. E. Dy
and F. C. Szoka, P. Natl. Acad. Sci. USA, 2006, 103, 16649-16654.
316. G. Stehle, A. Wunder, H. Sinn, H. H. Schrenk, E. A. Friedrich, C. E. Dempfle,
W. Maierborst and D. L. Heene, J. Surg. Res., 1995, 58, 197-204.
317. R. J. Linhardt, J. Med. Chem., 2003, 46, 2551-2564.
318. R. M. C. Sutton, K. L. Sutton and A. M. Stalcup, Electrophoresis, 1997, 18,
2297-2304.
319. H. Nishi and Y. Kuwahara, J. Biochem. Bioph. Meth., 2001, 48, 89-102.
320. A. M. Stalcup and N. M. Agyei, Anal. Chem., 1994, 66, 3054-3059.
321. J. Wang and D. L. Rabenstein, Biochemistry, 2006, 45, 15740-15747.
322. J. Wang and D. L. Rabenstein, Biochim. Biophys. Acta., 2009, 1790, 1689-1697.
323. K. S. Partridge, D. K. Smith, G. M. Dykes and P. T. McGrail, Chem. Commun.,
2001, 319-320.
324. W. Edwards and D. K. Smith, J. Am. Chem. Soc., 2013, 135, 5911-5920.

283
325. P. Wu, M. Malkoch, J. N. Hunt, R. Vestberg, E. Kaltgrad, M. G. Finn, V. V.
Fokin, K. B. Sharpless and C. J. Hawker, Chem. Commun., 2005, 5775-5777.
326. M. C. A. Stuart, J. C. van de Pas and J. Engberts, J. Phys. Org. Chem., 2005, 18,
929-934.
327. Y. B. Lim, E. Lee and M. Lee, Angew. Chem. Int. Edit., 2007, 46, 9011-9014.
328. S. M. Bromfield, P. Posocco, C. W. Chan, M. Calderon, S. E. Guimond, J. E.
Turnbull, S. Pricl and D. K. Smith, Chem. Sci., 2014, 5, 1484-1492.
329. M. Friedman, J. Agr. Food Chem., 1999, 47, 3457-3479.
330. M. Friedman and C. E. Levin, Amino Acids, 2012, 42, 1553-1582.
331. J. D. Watson and F. H. C. Crick, Nature, 1953, 171, 737-738.
332. R. Srinivas, S. Samanta and A. Chaudhuri, Chem. Soc. Rev., 2009, 38, 3326-
3338.
333. X. Guo and L. Huang, Accounts Chem. Res., 2012, 45, 971-979.
334. M. A. Mintzer and E. E. Simanek, Chem. Rev., 2009, 109, 259-302.
335. S. Y. Wong, J. M. Pelet and D. Putnam, Prog. Polym. Sci., 2007, 32, 799-837.
336. P. P. Karmali and A. Chaudhuri, Med. Res. Rev., 2007, 27, 696-722.
337. S. C. De Smedt, J. Demeester and W. E. Hennink, Pharm. Res., 2000, 17, 113-
126.
338. D. K. Smith, Curr. Top. Med. Chem., 2008, 8, 1187-1203.
339. J. G. Hardy, M. A. Kostiainen, D. K. Smith, N. P. Gabrielson and D. W. Pack,
Bioconjugate Chem., 2006, 17, 172-178.
340. S. P. Jones, N. P. Gabrielson, C. H. Wong, H. F. Chow, D. W. Pack, P. Posocco,
M. Fermeglia, S. Pricl and D. K. Smith, Mol. Pharm., 2011, 8, 416-429.
341. M. Michaud, E. Jourdan, A. Villet, A. Ravel, C. Grosset and E. Peyrin, J. Am.
Chem. Soc., 2003, 125, 8672-8679.
342. M. A. Rehder-Silinski and L. B. McGown, J. Chromatogr. A, 2003, 1008, 233-
245.
343. X. G. Qu, J. O. Trent, I. Fokt, W. Priebe and J. B. Chaires, P. Natl. Acad. Sci.
USA, 2000, 97, 12032-12037.
344. S. Sforza, G. Haaima, R. Marchelli and P. E. Nielsen, Eur. J. Org. Chem., 1999,
197-204.
345. S. Sforza, T. Tedeschi, R. Corradini and R. Marchelli, Eur. J. Org. Chem., 2007,
5879-5885.
346. S. Sforza, R. Corradini, S. Ghirardi, A. Dossena and R. Marchelli, Eur. J. Org.
Chem., 2000, 2905-2913.

284
347. A. Calabretta, T. Tedeschi, R. Corradini, R. Marchelli and S. Sforza,
Tetrahedron Lett., 2011, 52, 300-304.
348. V. Menchise, G. De Simone, T. Tedeschi, R. Corradini, S. Sforza, R. Marchelli,
D. Capasso, M. Saviano and C. Pedone, P. Natl. Acad. Sci. USA, 2003, 100,
12021-12026.
349. G. Roelfes, Mol. Biosyst., 2007, 3, 126-135.
350. A. J. Boersma, R. P. Megens, B. L. Feringa and G. Roelfes, Chem. Soc. Rev.,
2010, 39, 2083-2092.
351. G. Roelfes, A. J. Boersma and B. L. Feringa, Chem. Commun., 2006, 635-637.
352. S. Park and H. Sugiyama, Molecules, 2012, 17, 12792-12803.
353. A. J. Boersma, B. L. Feringa and G. Roelfes, Org. Lett., 2007, 9, 3647-3650.
354. D. Coquière, B. L. Feringa and G. Roelfes, Angew. Chem. Int. Edit., 2007, 46,
9308-9311.
355. A. J. Boersma, B. L. Feringa and G. Roelfes, Angew. Chem. Int. Edit., 2009, 48,
3346-3348.
356. B. F. Cain, B. C. Baguley and W. A. Denny, J. Med. Chem., 1978, 21, 658-668.
357. H. Ihre, A. Hult, J. M. J. Fréchet and I. Gitsov, Macromolecules, 1998, 31,
4061-4068.
358. B. Trappmann, K. Ludwig, M. R. Radowski, A. Shukla, A. Mohr, H. Rehage, C.
Böttcher and R. Haag, J. Am. Chem. Soc., 2010, 132, 11119-11124.
359. B. J. Boyd, L. M. Kaminskas, P. Karellas, G. Krippner, R. Lessene and C. J. H.
Porter, Mol. Pharm., 2006, 3, 614-627.
360. S. E. Stiriba, H. Frey and R. Haag, Angew. Chem. Int. Edit., 2002, 41, 1329-
1334.
361. K. T. Al-Jamal, W. T. Al-Jamal, S. Akerman, J. E. Podesta, A. Yilmazer, J. A.
Turton, A. Bianco, N. Vargesson, C. Kanthou, A. T. Florence, G. M. Tozer and
K. Kostarelos, P. Natl. Acad. Sci. USA, 2010, 107, 3966-3971.
362. K. T. Al-Jamal, W. T. Al-Jamal, J. T. W. Wang, N. Rubio, J. Buddle, D.
Gathercole, M. Zloh and K. Kostarelos, ACS Nano, 2013, 7, 1905-1917.
363. M. Ohsaki, T. Okuda, A. Wada, T. Hirayama, T. Niidome and H. Aoyagi,
Bioconjugate Chem., 2002, 13, 510-517.
364. C. S. Love, A. R. Hirst, V. Chechik, D. K. Smith, I. Ashworth and C. Brennan,
Langmuir, 2004, 20, 6580-6585.
365. A. R. Hirst, J. E. Miravet, B. Escuder, L. Noirez, V. Castelletto, I. W. Hamley
and D. K. Smith, Chem-Eur. J., 2009, 15, 372-379.
366. J. G. Hardy, A. R. Hirst and D. K. Smith, Soft Matter, 2012, 8, 3399-3406.

285
367. E. Durán-Lara, L. Guzmán, A. John, E. Fuentes, M. Alarcón, I. Palomo and L.
S. Santos, Eur. J. Med. Chem., 2013, 69, 601-608.
368. S. Boye, D. Appelhans, V. Boyko, S. Zschoche, H. Komber, P. Friedel, P.
Formanek, A. Janke, B. I. Voit and A. Lederer, Biomacromolecules, 2012, 13,
4222-4235.
369. T. Okuda, S. Kawakami, N. Akimoto, T. Niidome, F. Yamashita and M.
Hashida, J. Control. Release, 2006, 116, 330-336.
370. M. Driffield, D. M. Goodall and D. K. Smith, Org. Biomol. Chem., 2003, 1,
2612-2620.
371. O. Freund, J. Amédee, D. Roux and R. Laversanne, Life Sci., 2000, 67, 411-419.
372. M. Pittelkow, R. Lewinsky and J. B. Christensen, Synthesis-Stuttgart, 2002,
2195-2202.
373. H. Gershon, R. Ghirlando, S. B. Guttman and A. Minsky, Biochemistry, 1993,
32, 7143-7151.
Related Documents