Multiscale Gene Network Analysis Bin Zhang, PhD Jun Zhu, PhD Department of Genetics & Genomic Sciences Icahn Institute of Genomics and Multiscale Biology Icahn School of Medicine at Mount Sinai, New York, USA Email: [email protected] Web: http://research.mssm.edu/multiscalenetwork 2013 Network Analysis Course, UCLA, 7/18/2013 Lecture I

Welcome message from author
This document is posted to help you gain knowledge. Please leave a comment to let me know what you think about it! Share it to your friends and learn new things together.
Transcript
Multiscale Gene Network Analysis
Bin Zhang, PhD
Jun Zhu, PhD Department of Genetics & Genomic Sciences
Icahn Institute of Genomics and Multiscale Biology
Icahn School of Medicine at Mount Sinai, New York, USA
Email: [email protected]
Web: http://research.mssm.edu/multiscalenetwork
2013 Network Analysis Course, UCLA, 7/18/2013
Lecture I

Icahn School of Medicine at Mount Sinai Icahn School of Medicine at Mount Sinai Quick Facts
Dean – Dennis S. Charney, MD Chartered – 1963 U.S. News and World Report Ranking of Best Medical
Schools – #18 Full-time, Part-time and Voluntary Faculty – 3,968 Full-time MSSM Employees excluding Faculty – 4,182 Annual Budget – $1.5B
Education Medical Students – 607 MD/PhD Students – 102 PhD Students – 211 Masters Students – 230 Postdoctoral Fellows – 510 MSH Residents and Fellows – 943 Affiliate-based Residents and Fellows – 776
Research FY 2011 Total Sponsored Funding – $375M
Clinical Care Annual Patient Visits to Faculty Practices (2011) – 771,021 Physicians named in New York Magazine's "Best Doctors"
Issue – 129
http://icahn.mssm.edu/education/residencies-and-fellowships/consortium-of-graduate-medical-education
http://icahn.mssm.edu/education/residencies-and-fellowships/consortium-of-graduate-medical-education
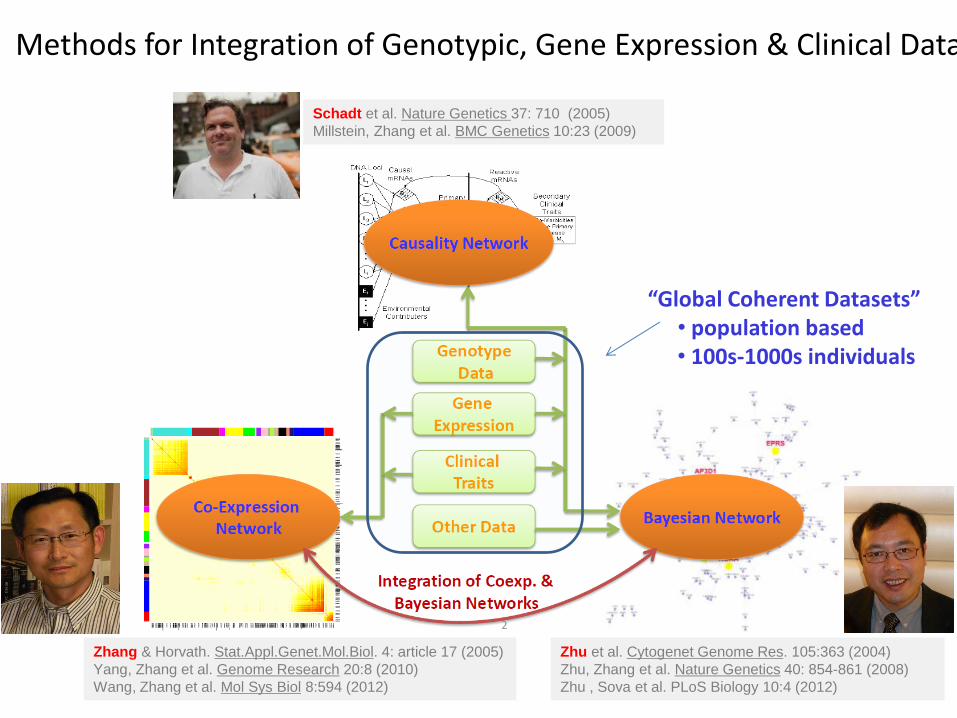
Methods for Integration of Genotypic, Gene Expression & Clinical Data
Schadt et al. Nature Genetics 37: 710 (2005)
Millstein, Zhang et al. BMC Genetics 10:23 (2009)
Zhang & Horvath. Stat.Appl.Genet.Mol.Biol. 4: article 17 (2005)
Yang, Zhang et al. Genome Research 20:8 (2010)
Wang, Zhang et al. Mol Sys Biol 8:594 (2012)
Zhu et al. Cytogenet Genome Res. 105:363 (2004)
Zhu, Zhang et al. Nature Genetics 40: 854-861 (2008)
Zhu , Sova et al. PLoS Biology 10:4 (2012)
“Global Coherent Datasets” • population based • 100s-1000s individuals

4
Define a Gene Co-expression Similarity
Define a Family of Adjacency Functions
Determine the AF Parameters
Define a Measure of Node Distance
Identify Network Modules (Clustering)
Relate the Network Concepts to
External Gene or Sample Information
Gene CoExpression Network Analysis
Zhang B & Horvath S. Stat Appl Genet Mol Biol 2005
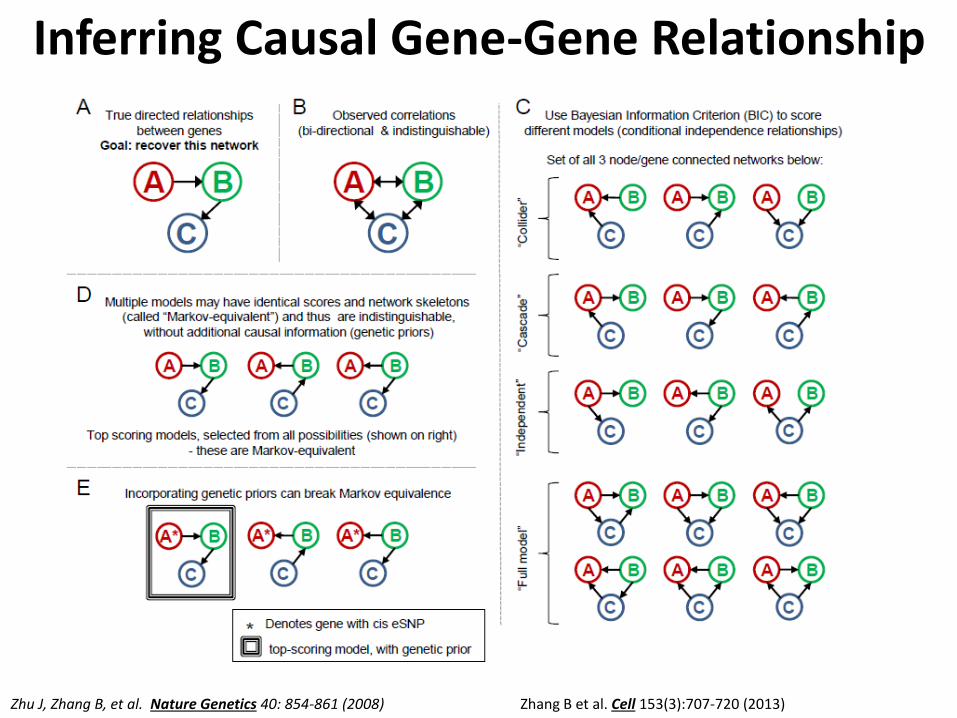
Zhang B et al. Cell 153(3):707-720 (2013) Zhu J, Zhang B, et al. Nature Genetics 40: 854-861 (2008)
Inferring Causal Gene-Gene Relationship

Key Driver Analysis • Identify key regulators for a list of genes h and a network N • Check the enrichment of h in the downstream of each node in N • The nodes significantly enriched for h are the candidate drivers
Bin Zhang and Jun Zhu, Key Driver Analysis of Causal Networks, WCE 2013
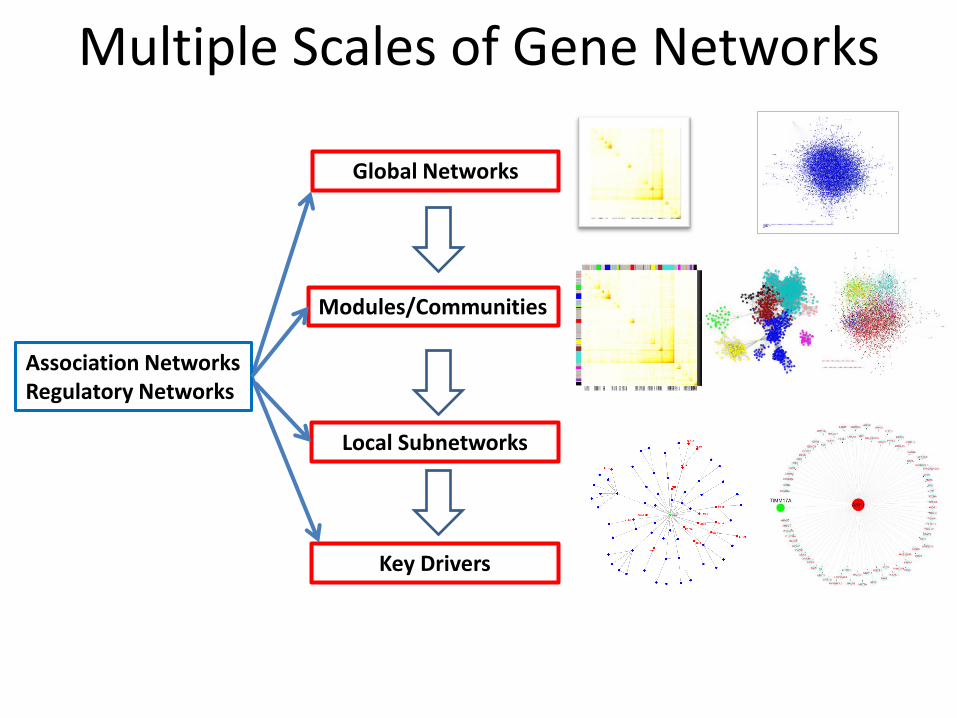
Multiple Scales of Gene Networks
Global Networks
Modules/Communities
Local Subnetworks
Association Networks Regulatory Networks
Key Drivers
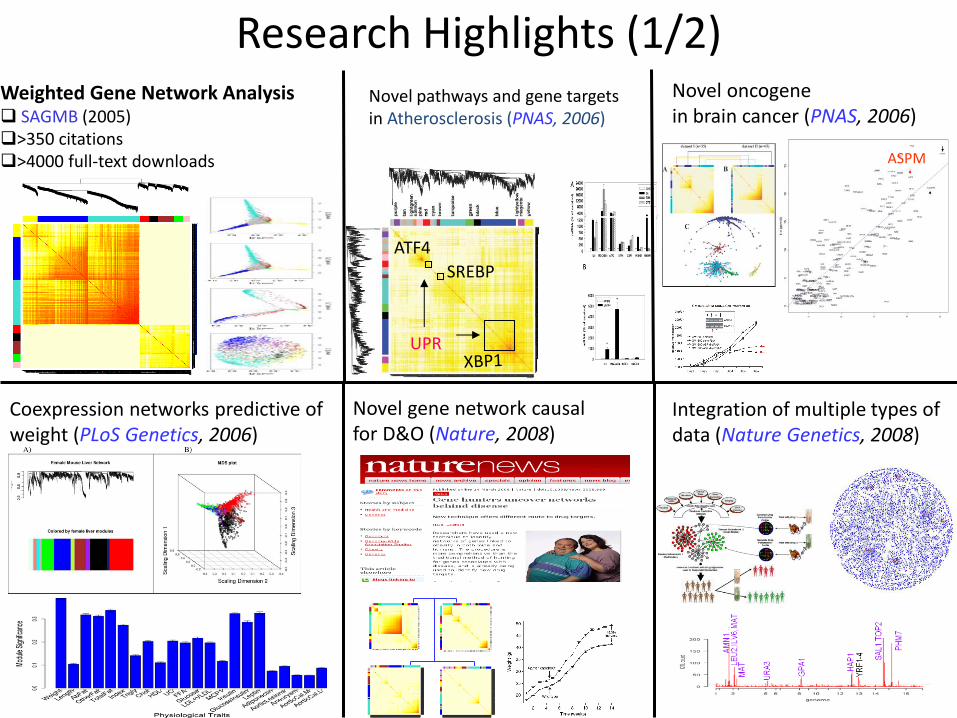
Research Highlights (1/2) Novel oncogene in brain cancer (PNAS, 2006)
ASPM
SREBP
ATF4
UPR
Novel pathways and gene targets in Atherosclerosis (PNAS, 2006)
Novel gene network causal for D&O (Nature, 2008)
Integration of multiple types of data (Nature Genetics, 2008)
Weighted Gene Network Analysis SAGMB (2005) >350 citations >4000 full-text downloads
Coexpression networks predictive of weight (PLoS Genetics, 2006)
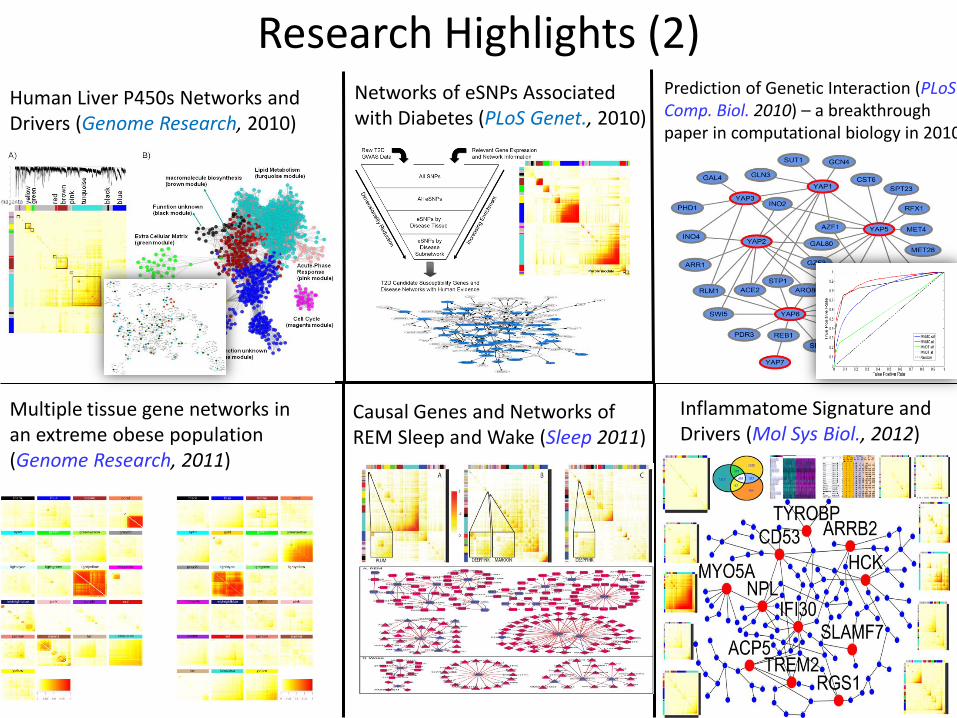
Research Highlights (2)
Inflammatome Signature and Drivers (Mol Sys Biol., 2012)
Multiple tissue gene networks in an extreme obese population (Genome Research, 2011)
Human Liver P450s Networks and Drivers (Genome Research, 2010)
Causal Genes and Networks of REM Sleep and Wake (Sleep 2011)
Networks of eSNPs Associated with Diabetes (PLoS Genet., 2010)
Prediction of Genetic Interaction (PLoS Comp. Biol. 2010) – a breakthrough paper in computational biology in 2010

10
Module relevance to BMI
1. A macrophage-enriched metabolic network (MEMN) associated with obesity & diabetes
Chen Y, Zhu J et al., Nature 2008
Emilsson V, Thorleifsson G, Zhang B et al., Nature,2008
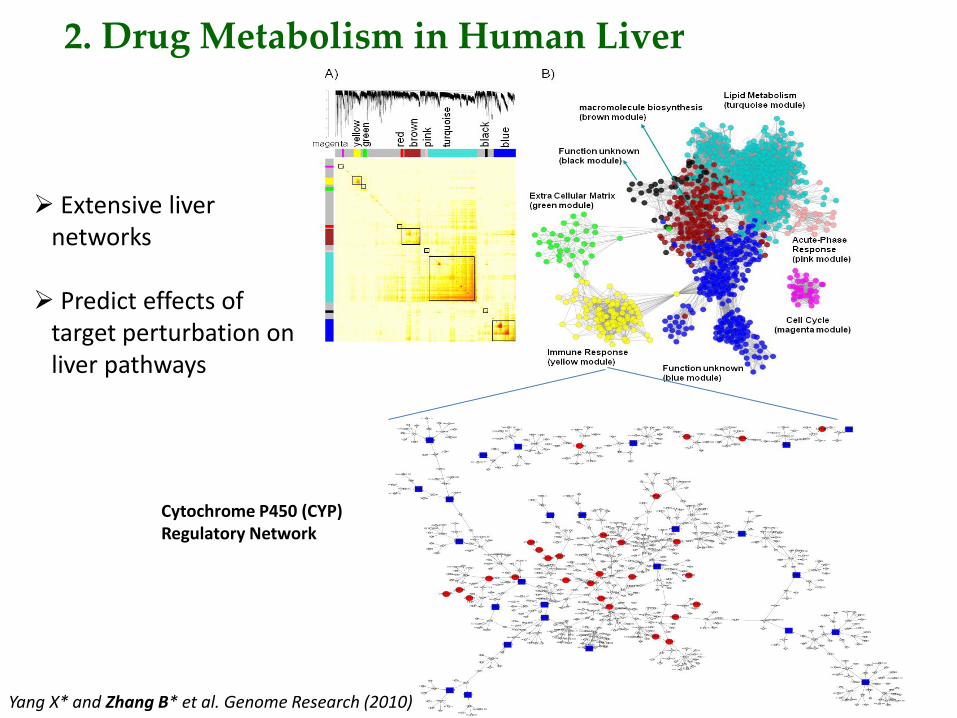
Cytochrome P450 (CYP) Regulatory Network
Extensive liver networks
Predict effects of target perturbation on liver pathways
Yang X* and Zhang B* et al. Genome Research (2010)
2. Drug Metabolism in Human Liver

3. A Common Inflammatome Gene Signature
Disease Model Species Tissue profiled # of Cases # of Controls # of Total Arrays
Asthma OVA Mouse Lung 5 4 9
COPD IL-1b Tg Mouse Lung 5 3 8
Fibrosis TGFb Tg Mouse Lung 4 4 8
Atherosclerosis ApoE KO HFD Mouse Aorta 3 3 6
Diabetes db/db Mouse Adipose 3 3 6
Diabetes db/db Mouse Islet 5 5 10
Obesity ob/ob Mouse Adipose 3 3 6
Multiple LPS Rat Liver 4 4 8
Stroke MCAO Rat Brain 4 4 8
Neuropathic pain Chung Rat DRG 4 4 8
Inflammation pain CGN Rat Skin 4 5 9
Sarcopenia Aged vs. Young Rat Muscle 5 5 10
Wang IM*, Zhang B*, Yang X* et al. (2012) Systems Analysis of Eleven Rodent Disease Models Reveals an Inflammatome Signature and Key Drivers. Molecular Systems Biology 8:594

Inflammatome Signature Conserved in Disease Gene Networks
Wang IM*, Zhang B*, Yang X* et al. (2012) Systems Analysis of Eleven Rodent Disease Models Reveals an Inflammatome Signature and Key Drivers. Molecular Systems Biology 8:594

Inflammatome Networks in Human Liver and Adipose

A Conserved Inflammatome Network
Group No. of genes No. of gene tested in
the MGI phenotype
database
No. of genes with MGI
phenotype(s)
% tested genes with
phenotype(s)
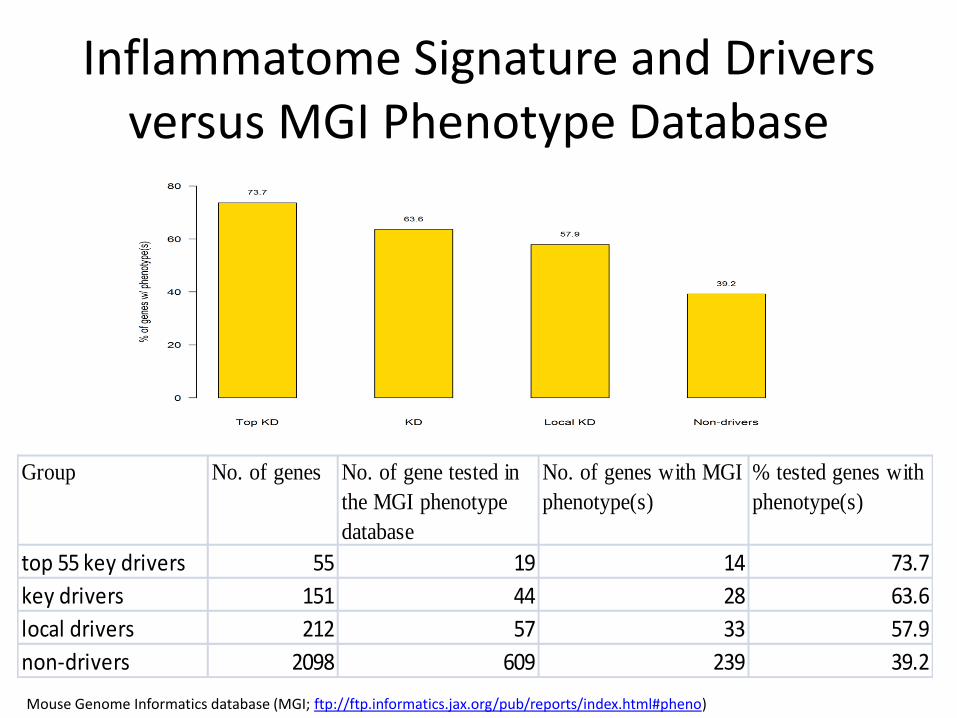
top 55 key drivers 55 19 14 73.7
key drivers 151 44 28 63.6
local drivers 212 57 33 57.9
non-drivers 2098 609 239 39.2
Inflammatome Signature and Drivers versus MGI Phenotype Database
Mouse Genome Informatics database (MGI; ftp://ftp.informatics.jax.org/pub/reports/index.html#pheno)

Inflammatome Signature and Drivers versus Other Inflammation Signatures
signature source size non-
driver
(2098)
Key
Driver
(151)
top Key
Driver
(55)
non-
driver
Key
Driver
top Key
Driver
non-driver Key Driver top Key
Driver
Cluster1 Gilchrist et al. 2006 137 11 0 0 0.957 0 0 0.483 1 1
Cluster10 Gilchrist et al. 2006 215 34 12 5 1.884 9.241 10.571 1.14E-04 6.91E-10 7.70E-06
Cluster11 Gilchrist et al. 2006 61 13 0 0 2.539 0 0 0.000427 1 1
Cluster2 Gilchrist et al. 2006 167 23 5 4 1.641 4.957 10.887 6.61E-03 5.44E-04 3.33E-05
Cluster3 Gilchrist et al. 2006 64 4 4 2 0.745 10.348 14.205 6.32E-01 4.30E-05 3.82E-04
Cluster4 Gilchrist et al. 2006 140 26 7 3 2.213 8.278 9.74 3.59E-05 2.24E-06 2.57E-04
Cluster5 Gilchrist et al. 2006 42 8 2 0 2.27 7.884 0 7.13E-03 2.09E-03 1.00E+00
Cluster6 Gilchrist et al. 2006 18 1 2 0 0.662 18.396 0 0.453 0.000165 1
Cluster7 Gilchrist et al. 2006 178 18 5 3 1.205 4.651 7.661 0.166 0.00076 0.000638
Cluster8 Gilchrist et al. 2006 146 25 11 4 2.04 12.474 12.453 1.95E-04 9.32E-11 1.74E-05
Cluster9 Gilchrist et al. 2006 36 3 1 1 0.993 4.599 12.626 0.358 0.02 0.00285
FANTON-TF FANTON, 2008 47 10 1 0 2.535 3.523 0 0.00145 0.0328 1
HostResponse Jenner & Young 2005 511 90 22 11 2.099 7.128 9.785 4.76E-12 6.51E-14 9.24E-10
LPS-TF-cluster1 Litvak et al. 2009 21 3 3 1 1.702 23.652 21.645 9.39E-02 7.07E-06 9.72E-04
LPS-TF-cluster2 Litvak et al. 2009 57 7 0 0 1.463 0 0 0.102 1 1
macrophage-regulated Nilson et al. 2006 1552 208 39 17 1.597 4.16 4.979 2.52E-12 2.26E-15 2.70E-09
Sepsis Pankla et al., 2009 37 9 1 1 2.899 4.475 12.285 0.000716 0.021 0.00301
TNF-signature Hao & Baltimore 2009 89 26 6 2 3.481 11.162 10.215 2.10E-09 1.16E-06 1.00E-03
Combined I.M. Signature Union of all signatures 3576 468 74 30 1.559 3.426 3.813 1.99E-25 5.10E-25 4.23E-13
Overlap Fold Enrichment FET p-value
18 inflammatory response gene signatures based on gene expression patterns in blood or various hematopoietic cell lineages from different inflammatory conditions/diseases (Jenner and Young 2005; Gilchrist, Thorsson et al. 2006; Nilsson, Bajic et al. 2006; Hao and Baltimore 2009; Litvak, Ramsey et al. 2009; Pankla, Buddhisa et al. 2009; Suzuki, Forrest et al. 2009).

5. Inferring Causal Genomic Alterations in Breast Cancer
Tran L*, Zhang B* et al. (2011) BMC Systems Biology
𝐹𝜔(𝑎, 𝑠) = 𝑓 𝑡 𝜔𝑎 ,𝑠 𝑡 𝑑𝑡∞
−∞
𝑓 𝑡 =1
𝐶 𝐹𝜔(𝑎, 𝑠)𝜔𝑎 ,𝑠 𝑡
∞
−∞
𝑑𝑎𝑑𝑠
𝑎2
𝜔𝑎 ,𝑠 𝑡 = |𝑎|−1/2𝜔(𝑡 − 𝑠
𝑎)

Identification of Recurrent CNV Regions

Wavelet Analysis of CNV by Expression
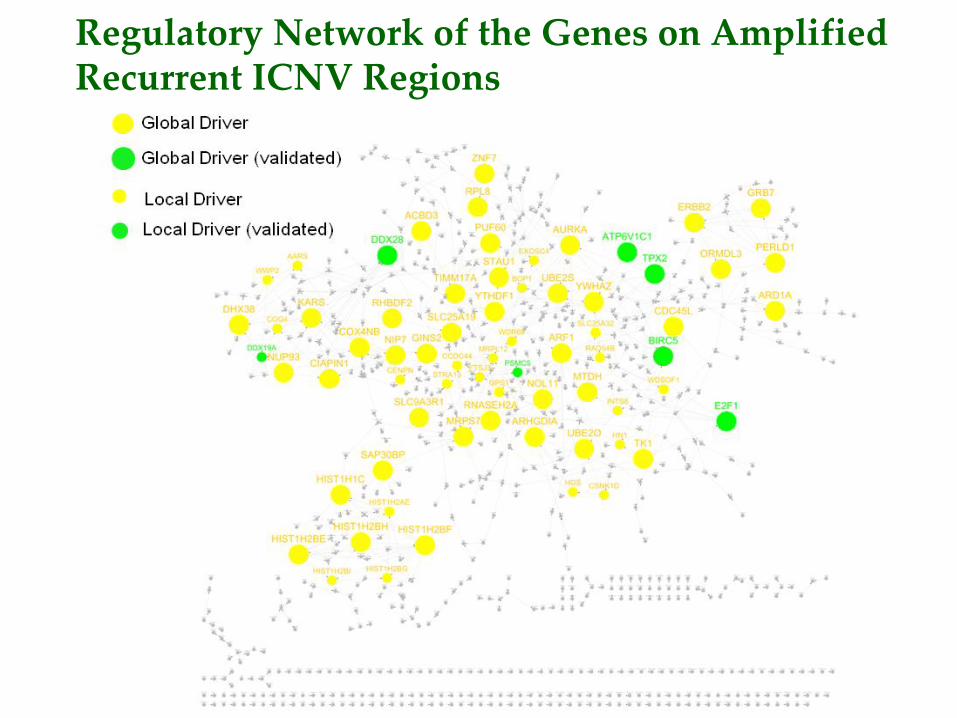
Regulatory Network of the Genes on Amplified Recurrent ICNV Regions

Validation of Predicted Key Drivers of Amplified Recurrent ICNV Regions

6. Multiscale Network based Prediction
This paper was identified as one of the breakthroughs in the field of computational biology in 2010, Nature Biotechnology 29, 45 (2011)

Synthetic Sick/Lethal Interactions
• Important for understanding how an organism tolerates random mutation, i.e., genetic robustness – Functional prediction – Drug development
• Substantial fraction of
known SL interactions can be explained by between- and within-pathway relationships
Kelly & Ideker, 2005
Cells live Cells live
Cells die or grow slowly
Gene X Gene Y
Gene X Gene Y
Gene X Gene Y
Figure from Prof Fritz Roth’s talk at Rosetta in 2004

Overview of the known SL network
# of links # of genes links/gene scale R 2̂ trunc. R 2̂ slope
9994 2502 7.99 0.9 0.9 -1.79gene degree
YPL240C 275
YHR129C 171
YER016W 158
YLR200W 158
YGR078C 156
YLR262C 154
YML094W 154
YLR039C 137
YMR294W 135
YEL003W 128
YNL153C 127
YPR135W 120
YLR418C 117
YMR236W 108
YHR030C 104
YNL271C 104
YOR026W 104
YNL298W 103
YEL061C 102
YLR103C 100
YJL030W 99
YLR085C 99
YKL113C 97
YPR141C 90
YOL012C 87
YAL021C 84
YGL058W 84
YGR229C 82
YLR342W 82
YJL168C 80
A perfect scalefree network
hubs

Features Extraction • Functional Annotation
– Semantic similarity-based similarity of annotation vectors
– Number of functions shared
• Protein Complex – Located in same complex or not
• PPI network – Clique membership – community membership – Topological Overlap – Shortest Distance
• Evolution – Similarity of phylogenetic profiles
• Co-expression Networks (four cohorts) – Correlation – Topological Overlap (cc.in, cc.total) – Module membership
• Co-membership in KEGG pathways • QTL
– With common QTL or not
• Transcription Factor Binding Sites – Co-regulated by the same TF – One as TF which binds to another
• Sequence similarity • Others
A B
N1 N2
?
…..
C1 C2 ….. Cn
Network Overlay Features

Discriminative Power of Features

Prediction of SL Interactions • Under-sampling of majority class (nonSL) to same size as majority class (SL) to
handle rare class problem • Combination of classifiers (implemented in Weka)
– K-Nearest Neighbor – SVM – Decision Tree – Random Forest – RIPPER: rule-based classifier – Neural network
• Combination of prob(SL) using noisy-AND
i
i
i
i pp

Predicted SL Interactions between TFs

7. Multiscale Gene Networks in Alzheimer’s Disease
Zhang B et al. (2013) Integrated Systems Approach Identifies Genetic Nodes and Networks in Late-Onset Alzheimer’s Disease. Cell 153(3):707-720
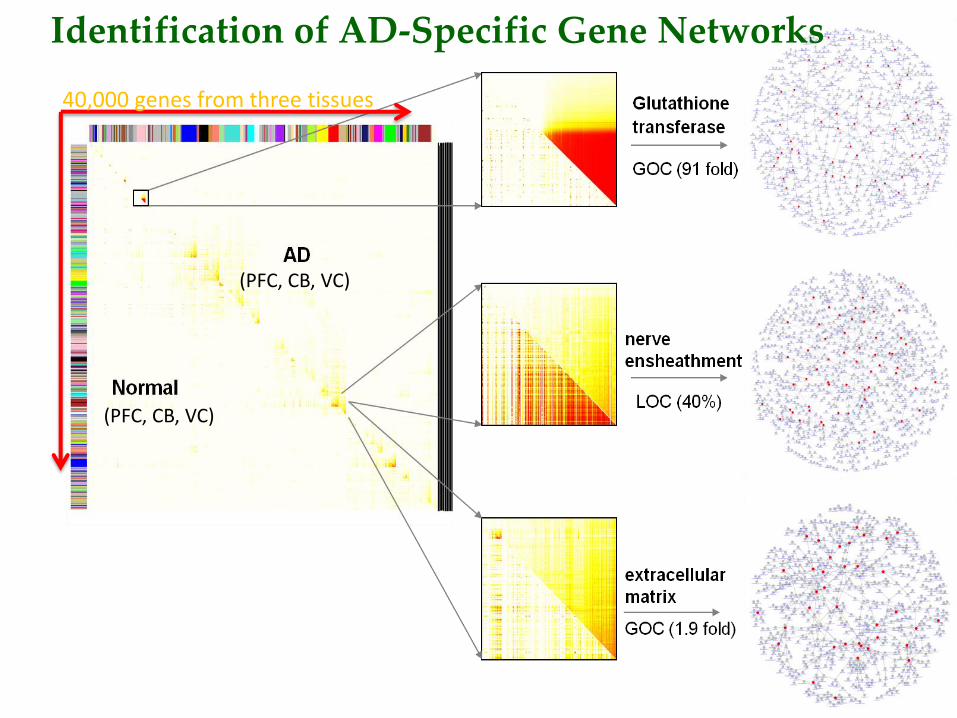
Identification of AD-Specific Gene Networks
40,000 genes from three tissues
(PFC, CB, VC)
(PFC, CB, VC)
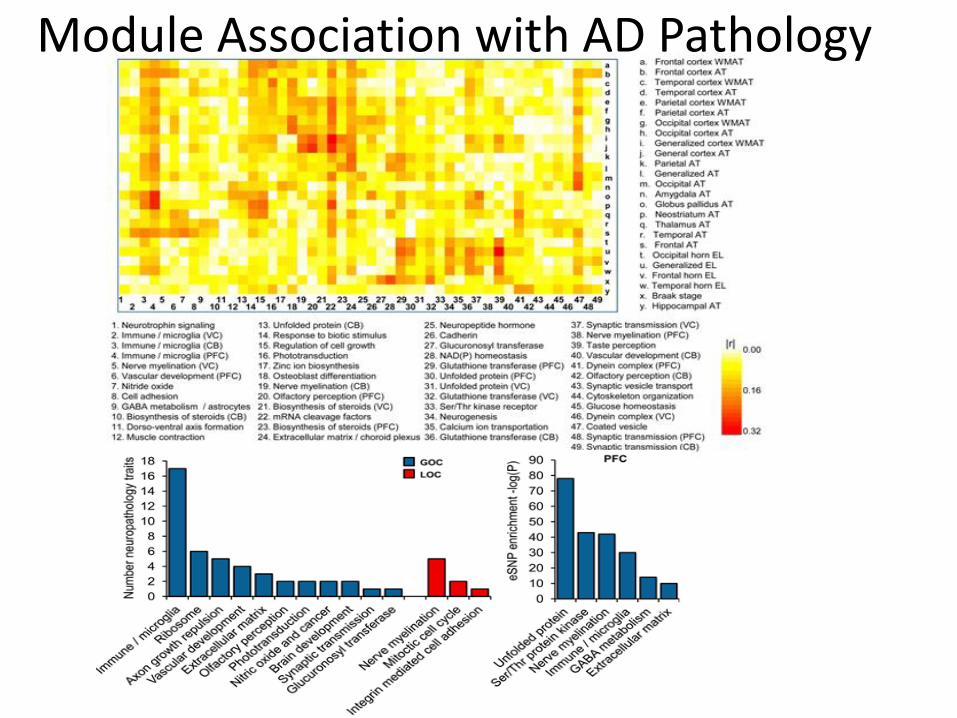
Module Association with AD Pathology

Validation of TYROBP Networks

Summary • Biological networks based on large scale genetic and
genomic data are capable of painting a global landscape of interactomes that contribute to a variety of clinical endpoints
• Novel pathways and targets have been identified through the multiscale network analysis
• Many key regulators predicted by the multiscale network analysis have been validated at various stages
• With increasingly available large scale genetic and genomic data, multiscale biological networks will be more predictive and thus will play an important role in clinical research and drug development, and more generally in understanding biological systems and mechanisms underlying human disease
Acknowledgements • Jonh Lamb • Radu Dobrin • Chunsheng Zhang • Eugene Fluder • Tao Xie • Joshua McElwee • Alexei A. Podtelezhnikov • Cliona Molony • David J. Stone • Stacey Melquist
• Manikandan Narayanan
Rosetta, Merck & Co.
• Liviu-Gabriel Bodea
• Harald Neumann
• Amanda J. Myers University of Miami
Icelandic Heart Association
• Valur Emilsson
Sage Bionetworks
• Chris Gateri
• Zhi Wang
• Christine Suver
• Linh Tran (UCLA)
University of Bonn
• Jun Zhu
• Eric Schadt
• Xudong Dai
• Hardik Shah
• Milind Mahajan
Mount Sinai
• Bruce Clurman Fred Hutchinson Cancer Research Center
• Steve Horvath
• Stan Nelson
• Paul Mischel
• Marc Carlson (FHCRC)
• Peter Langfelder
• Aldons J. Lusis
• Thomas A. Drake
• Peter S. Gargalovic
• Anatole Ghazalpour
• Sudheer Doss
• Leslie Ingram-Drake
UCLA
• Erin Smith
• Leonid Kruglyak
Princeton University
• Becky Drees
• Roger Bumgarner
Univ. of Washington
UC Berkley • Rachel Brem
Wayne State University
• Guojun Wu
• Fanyan Meng

Multiscale Network Modeling Laboratory http://research.mssm.edu/multiscalenetwork
Openings for Postdoctoral Fellow & Senior Scientist Positions in Computational Neuroscience & Cancer Biology
Group Members
Dr. Christian Forst Assist. Professor
Dr. Yongzhong Zhao Senior Scientist
Dr. Xiandong Lin Scientist
Dr. Won-min Song Postdoc Fellow
Igor Katsyv PhD Student
Andrew McKenzie PhD Student
http://research.mssm.edu/multiscalenetwork/Opportunities.html
Dr. Bin Zhang (PI)
Assoc. Professor

Stay Connected with Us!
37
@IcahnInstitute
Related Documents