1 Multiresolution Remote Sensing Image Clustering Cédric Wemmert and Anne Puissant and Germain Forestier and Pierre Gançarski * Abstract—With the multiplication of satellite images with com- plementary spatial and spectral resolution, a major issue in the classification process is the simultaneous use of several images. In this context, the objective of this letter is to propose a new method which uses information contained in both spatial resolution. The main idea is that on one hand, the semantics level associated with an image depends on its spatial resolution, and on the other hand, information given by these images are complementary. The goal of this multiresolution image method is to automatically build a classification using knowledge extracted from both images, by unsupervised way and without pre-processing image fusion. The method is tested by using a Quickbird (2.8m) and a SPOT-4 (20m)images on the urban area of Strasbourg (France). The experiments have shown that the results are better than a classical unsupervised classification on each image, and comparable to a supervised region-based classification on the HSR image. Index Terms—multiresolution, clustering, remote sensing image analysis, high spatial resolution. I. I NTRODUCTION With the recent development of remote sensing technology, a large amount of satellite images is available with a comple- mentary spatial, spectral and time resolution. These data are valuable for mapping urban areas at different scales. There is a wide range of object nomenclatures such as the Corine Land Cover nomenclature defined for Landsat images (30m spatial resolution), the SPOT Thema nomenclature defined for Spot images (5m to 20m) or the French national land cover database BDCartoIGN (defined for aerial photographs and SPOT images). These existing products enable to map urban areas respectively from 1:100,000 (Corine Land Cover nomenclature) to 1:50,000 and 1:25,000 (SPOT Thema and BDCarto nomenclatures). The production of these maps is often based on manual image interpretation or semi-automatic techniques (combined with per-pixel algorithm). With High Spatial Resolution (HSR - 1 to 5m) satellite images, it is possible to extract urban objects (e.g. house, garden and road) using object-oriented approach based on a segmentation step [3]. This allows to map individual objects at scale from 1:10,000 to 1:5,000. In the domain of urban planning and management, some users also need to map the territory at the scale of the urban blocks (which can be defined as a minimal cycle closed by communication way) corresponding to a scale near of 1:10,000. In this case, there is no existing available land cover/use product. Medium Spatial Resolution (MSR from 30 to 10m spatial resolution) satellite images have a too large spatial resolution and HSR images have a too fine spatial resolution to map urban blocks. In this context, a question is how to reconstruct urban blocks from individual objects and how to help end-user to extract automatically these blocks ? *University of Strasbourg, France. This problem can be treated as a classification problem where images with different spatial resolutions can be used si- multaneously in an unsupervised way. To address this problem, the question of the number of clusters on each image is not straightforward. In MSR images, urban areas can be classified into 5 to 7 clusters associated to land cover classes referring to the identification of ’urban zone’ (Table I, left column). In HSR images, the number of clusters is higher (10 to 15 classes) referring to materials of each urban objects (Table I, right column). For instance, buildings can be differentiated by the materials and the roofs color (Table I, right column). To be able to offer to end-users a 1:10,000 mapping of urban areas, the number of semantic classes must range between 7 and 9 classes (for instance, Table I, middle column). However, these semantic classes cannot be directly obtained by a classification process from unique MSR or HSR images. In this context, the objective of this paper is to propose a new method which simultaneously uses the information contained in both MSR and HSR images. This multiresolution image analysis takes into account the different numbers of clusters obtained on each image at very different spatial resolutions. The sequel of this article is structured in three sections. The multiresolution remote sensing images analysis is briefly introduced and the new multiresolution clustering process is detailed in Section II. Some experiments performed on a HSR and MSR multispectral images on the urban area of Strasbourg (France) are presented. These images are issued from (1) different sensors (Spot and Quickbird) and (2) a degradation process from the Quickbird image (Section III). Some conclusions are then drawn in Section IV. II. MULTIRESOLUTION REMOTE SENSING IMAGES ANALYSIS In [9], we proposed a framework of collaborative clustering, called SAMARAH which enables several clustering methods (referred here as classifiers) to collaborate, in order to produce an unique solution from a set of images. These images can have different resolutions. Each classifier deals with an image from this set. All the classifiers work together to end up at an agreement on their clustering. Each classifier modifies its results according to all the other clusterings until all the clusterings proposed by the classifiers are strongly similar. Thus, they can be more easily unified, for example, through a voting algorithm. This unified result represents a consensus among all the knowledge extracted from the different sources. Furthermore, the voting algorithm highlights the agreement and the disagreement between the clustering methods. These two informations, as well as the result produced by each clustering method, lead to a better understanding of the scene by the expert.

Welcome message from author
This document is posted to help you gain knowledge. Please leave a comment to let me know what you think about it! Share it to your friends and learn new things together.
Transcript

1
Multiresolution Remote Sensing Image ClusteringCédric Wemmert and Anne Puissant and Germain Forestier and Pierre Gançarski *
Abstract—With the multiplication of satellite images with com-plementary spatial and spectral resolution, a major issue in theclassification process is the simultaneous use of several images. Inthis context, the objective of this letter is to propose a newmethodwhich uses information contained in both spatial resolution. Themain idea is that on one hand, the semantics level associatedwithan image depends on its spatial resolution, and on the other hand,information given by these images are complementary. The goalof this multiresolution image method is to automatically builda classification using knowledge extracted from both images, byunsupervised way and without pre-processing image fusion.Themethod is tested by using a Quickbird (2.8m) and a SPOT-4(20m)images on the urban area of Strasbourg (France). Theexperiments have shown that the results are better than a classicalunsupervised classification on each image, and comparable to asupervised region-based classification on the HSR image.
Index Terms—multiresolution, clustering, remote sensingimage analysis, high spatial resolution.
I. I NTRODUCTION
With the recent development of remote sensing technology,a large amount of satellite images is available with a comple-mentary spatial, spectral and time resolution. These data arevaluable for mapping urban areas at different scales. Thereis a wide range of object nomenclatures such as the CorineLand Cover nomenclature defined for Landsat images (30mspatial resolution), the SPOT Thema nomenclature definedfor Spot images (5m to 20m) or the French national landcover database BDCartorIGN (defined for aerial photographsand SPOT images). These existing products enable to mapurban areas respectively from 1:100,000 (Corine Land Covernomenclature) to 1:50,000 and 1:25,000 (SPOT Thema andBDCarto nomenclatures). The production of these maps isoften based on manual image interpretation or semi-automatictechniques (combined with per-pixel algorithm). With HighSpatial Resolution (HSR - 1 to 5m) satellite images, it ispossible to extract urban objects (e.g. house, garden androad) using object-oriented approach based on a segmentationstep [3]. This allows to map individual objects at scale from1:10,000 to 1:5,000.
In the domain of urban planning and management, someusers also need to map the territory at the scale of the urbanblocks (which can be defined as a minimal cycle closedby communication way) corresponding to a scale near of1:10,000. In this case, there is no existing available landcover/use product. Medium Spatial Resolution (MSR from 30to 10m spatial resolution) satellite images have a too largespatial resolution and HSR images have a too fine spatialresolution to map urban blocks. In this context, a question ishow to reconstruct urban blocks from individual objects andhow to help end-user to extract automatically these blocks ?
*University of Strasbourg, France.
This problem can be treated as a classification problemwhere images with different spatial resolutions can be usedsi-multaneously in an unsupervised way. To address this problem,the question of the number of clusters on each image is notstraightforward. In MSR images, urban areas can be classifiedinto 5 to 7 clusters associated to land cover classes referringto the identification of ’urban zone’ (Table I, left column).In HSR images, the number of clusters is higher (10 to 15classes) referring to materials of each urban objects (Table I,right column). For instance, buildings can be differentiated bythe materials and the roofs color (Table I, right column). Tobeable to offer to end-users a 1:10,000 mapping of urban areas,the number of semantic classes must range between 7 and 9classes (for instance, Table I, middle column). However, thesesemantic classes cannot be directly obtained by a classificationprocess from unique MSR or HSR images.
In this context, the objective of this paper is to proposea new method which simultaneously uses the informationcontained in both MSR and HSR images. This multiresolutionimage analysis takes into account the different numbers ofclusters obtained on each image at very different spatialresolutions.
The sequel of this article is structured in three sections.The multiresolution remote sensing images analysis is brieflyintroduced and the new multiresolution clustering processisdetailed in Section II. Some experiments performed on aHSR and MSR multispectral images on the urban area ofStrasbourg (France) are presented. These images are issuedfrom (1) different sensors (Spot and Quickbird) and (2) adegradation process from the Quickbird image (Section III).Some conclusions are then drawn in Section IV.
II. M ULTIRESOLUTION REMOTE SENSING IMAGES
ANALYSIS
In [9], we proposed a framework of collaborative clustering,called SAMARAH which enables several clustering methods(referred here as classifiers) to collaborate, in order to producean unique solution from a set of images. These images canhave different resolutions. Each classifier deals with an imagefrom this set. All the classifiers work together to end upat an agreement on their clustering. Each classifier modifiesits results according to all the other clusterings until alltheclusterings proposed by the classifiers are strongly similar.Thus, they can be more easily unified, for example, througha voting algorithm. This unified result represents a consensusamong all the knowledge extracted from the different sources.Furthermore, the voting algorithm highlights the agreementand the disagreement between the clustering methods. Thesetwo informations, as well as the result produced by eachclustering method, lead to a better understanding of the sceneby the expert.
2
TABLE ITYPOLOGIES USED TO MAP URBAN AREA ONMSR AND HSR IMAGES AND TYPOLOGY USED BY END-USERS AT1:10,000
1:100,000-1:25,000 1:10,000 1:5,000MSR imagery (30 to 5 m) Semantic class based on urban blocks HSR imagery (3 to 1 m)
’area level’ ’block level’ ’object level’
• High-density urban fabric• Low-density urban fabric• Industrial areas• Forest zones• Agricultural zones• Water surfaces• Bare soil
• Continuous urban blocks• Discontinuous urban blocks
- Individual urban blocks- Collective urban blocks
• Industrial urban blocks• Urban vegetation• Forest• Agricultural zones• Water surfaces• Road
• Building/roofs:- red tile roof- light gray residential roof- light commercial roof
• Vegetation:- green vegetation- non-photosynthetic vegetation
• Transportation areas:- streets- parking lots
• Water surfaces:- river- natural water bodies
• Bare soil• Shadow
This method was experimented on two study cases whereall the classifiers generated the same number of clustersin order to produce a unique result. The first experiment1
was the analysis of SPOT-5 images (panchromatic - 5m andmultispectral - 10m with four spectral bands - red, green, blueand near infra-red) of the urban area of Strasbourg (France).The second experiment2 was performed on four images of acoastal zone (Normandy Coast, Northwest of France). Thisarea is especially interesting since it is periodically affectedby natural and anthropic phenomena. Four images issuedfrom three different satellites and with different spatialandspectral resolutions were used (SPOT-4 multispectral at 20mand panchromatic at 10m, SPOT-5 panchromatic at 2.5m andASTER multispectral at 15m).
Results of these experiments were better than those pro-duced from panchromatic band only, multispectral bands onlyor pan-sharpened images. However, the geographic objects toidentify depends on the spatial resolutions, especially inthecontext of urban images classification. So another method ispresented here that enables to use simultaneously two imageswith very different spatial resolutions, and for which eachclassifier does not necessarily search the same number ofclusters.
A. Multi-source clustering
A first way to classify multi-source objects is to combineall the descriptions of the objects associated to the differentsources. Each object has a new description composed of (all)3
the attributes (also called features or characteristics) of all thesources [6], [5]. For instance, all the radiometric informationgiven by the different sensors are used to describe the objects.Unfortunately, due to thecurse of dimensionality[1], mostof the classical distance-based algorithms are not sufficient toanalyze objects having many attributes: the distances betweenthese objects are not enough different to correctly determinethe nearest objects. In addition, with the increase of thespectral dimensionality, some problems appear like the Hughes
1FoDoMuSt project:http://fodomust.u-strasbg.fr2ECOSGIL project (JC05-50539):http://ecosgil.u-strasbg.fr3Depending on the redundancy of these attributes
phenomena [10] which shows that classifier performance ac-tually decreases with increasing data dimensionality objects.
A second way [2], [4], [8] to classify multi-source objectsis to independently classify each data sets. Then a newdescription of each object is built, using the labels of thecluster to which the object belongs in each classification.Finally, a new clustering is done using the new descriptionof the objects. The aim of the first clustering is to reduce thedata space for the final clustering, making it more effective.This approach is similar to thestackingmethod [11] whichis known as outperforming the methods based on the directcombination of attributes. Thus, the method we propose, isbased on this second approach that we have adapted to theanalysis of remote sensing images.
B. Multi-source remote sensing image clustering
1) Notations: An imageI can be viewed as a function
I : E ⊂ Z2 → Z
b
p → I(p)(1)
where I(p) = 〈I1(p), . . . , Ia(p) . . . , Ib(p)〉 with b ∈ N∗
the number of spectral bands of the image andIa(p) theradiometric information associated to the pixel on thea-thband.
A clustering imageC from a clustering of the imageI isdefined as
C : E ⊂ Z2 → [1, K], K ∈ Z
p → C(p)(2)
whereC(p) is the cluster label associated to the pixelp by theclustering algorithm (e.g., the number of the cluster to whichthe pixel belongs) andK the number of clusters.
From such an image, a connected componentOi (also calledregion or object) is defined as
Oi = {p, q ∈ I : C(p) = C(q) ∧ connected(p, q) = 1} (3)
where connected is the classical 8-connectivity functionin I (let p(x, y) and q(x′, y′) two pixels in the image,connected(p, q) = 1 if max(|x− x′|, |y − y′|) = 1). Note thatthe number of regions depends on the clustering and cannotbe a priori defined. LetNr be the number of regions.

3
The region imageR built from a clustering result imageCis defined as
R(C) = {On, ∀n ∈ [1, Nr]} (4)
In the following, we only focus on the case where we havetwo imagesIn and In′
having the resolutionsrn and rn′
with rn > rn′ .Let λn,n′ be a correspondence function, associating one pixelfrom In to its corresponding pixel inIn′
. λn,n′ can be easilydefined using the georeferencing of the two images.Let Cn (resp.Cn′
) be the clustering image associated toIn
(resp.In′
), kn (resp.kn′ ) be the number of clusters inCn
(resp.Cn′
) andRn (resp.Rn′
) be the region image associatedto Cn (resp.Cn′
).
2) The method: Our method is object-oriented. It consists
in four sequential steps. First, a per-pixel clustering is doneon both the images. Then, for each image, regions are builtand characterized using the per-pixel clusterings. Then, thesecharacterized regions are clustered.The four steps of our approach are:
• Step 1 -Initial clusterings: both images are independentlyclassified to obtain clustering images (Eq. 2).
• Step 2 - Regions building: both corresponding regionimages are built (Eq. 4).
• Step 3 -Regions characterization: each regionOni ∈ Rn
from an image is characterized according to its clusterscomposition in the clustering imageCn′
(resp.On′
i , Rn′
and Cn): for each regionOni ∈ Rn, we calculate a
composition histogram representing the distribution of thelabels associated to the pixels ofIn′
corresponding to thepixels of On
i using the correspondence functionλn,n′ .The composition histogramHn′(On
i ) associated to aregion On
i according to clustering imageCn′
is definedby:
Hn′(Oni ) = 〈hn′
i,1, . . . , hn′
i,kn′〉, On
i ∈ Rn (5)
wherekn′ is the number of clusters inCn′
and
hn′
i,j =| {q = λn,n′(p) : Cn′
(q) = j, ∀p ∈ Oni } | (6)
.• Step 4 -Object-oriented classification: for each region
imageRn (resp.Rn′
), a clustering algorithm is inde-pendently applied on all its objects (i.e. characterizedregions) using the composition histograms. LetCn′(On
i )the class label associated to the objectOn
i characterizedusing a clustering imageCn′
(resp. Cn(On′
i ) and Cn)Then, the final clustering imageFn′(n) (resp.Fn(n′)) isdefined as
F : E ⊂ Z2 → [1, Kn]
p → Cn′(Oni ), p ∈ On
i
(7)
whereKn is the number of clusters expected in the finalclustering of the imageIn (resp.Kn′ andIn′
).Note thatKn can be different ofkn because the firstclassification is pixel-oriented while the second one isobject-oriented. Commonly,kn > Kn.
(a) HSR - multispectral Quickbirdimage at 2.8 m
(b) MSR - multispectral SPOT-4image at 20m
Fig. 1. Extract of the urban area of Strasbourg (France)
III. R ESULTS
A. Experiments
Some experiments are performed on two multispectral ima-ges with different spatial resolutions (2.8m and 20 m) onthe urban area of Strasbourg (France), acquired: (1) fromtwo different sensors (Quickbird4 and Spot-45, respectively inMay and July 2001) and (2) from a Quickbird image anda resampled image at 20m spatial resolution. The Quickbirdmultispectral image is available in four spectral bands (blue,green, red and near-infrared bands). The multispectral SPOT-4image has three spectral bands (green, red, near-infrared).
These images (Fig.1(a) and Fig.1(b)) present an extractof the urban area of Strasbourg (France) which is a typicalsuburban area with some water surfaces (in the center), forestarea in the South, industrial areas, agricultural zones withdifferent spectral responses due to the seasons (bare soil inthe HSR image - May can appear in red on the MSR image- July) and some individual or collective housing blocks (inred, black and white textured on the MSR image, in red, blueand white textured in the HSR image).
The experiments have consisted to perform the four stepsdescribed in Section II-B2.
• Step 1 - Initial classifications: in all experiments, eachimage is classified using the classical K-means algorithm[12] with a number of classes depending on the spatialresolution. Note that any algorithm which can deal withnumeric data would be used. For MSR image, a lot ofprevious works shown that urban areas can be classified in6 classes. For HSR image, the number of clusters dependson the materials of the urban objects (cf. above). In orderto find the best number of cluster according to the studyzone, three experiments with respectively 10, 15 and 20classes are carried out.These experiments have shown that:
4 c©DigitalGlobe Inc.5 c©CNES (Isis program)
4
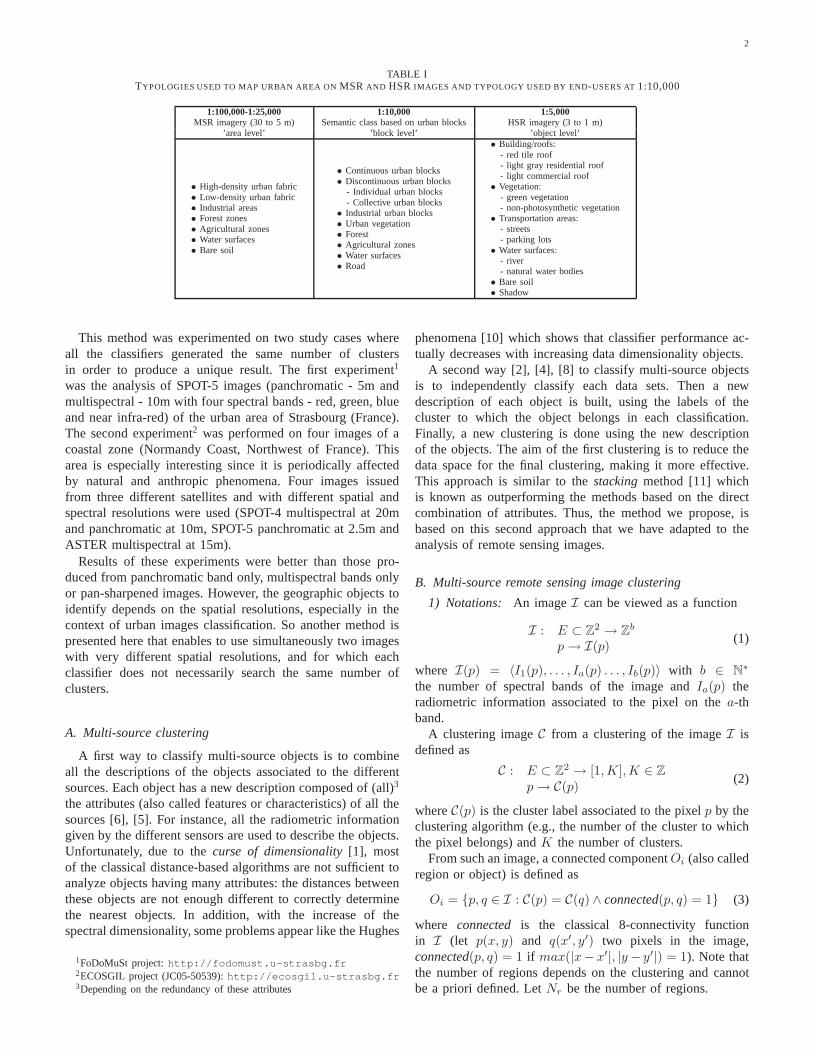
(a) HSR image (b) MSR image
The colors affected to the regions have no semantic and have been randomly choosen
Fig. 2. Regions built from the initial clusterings (Step 2)
(a) Extracted image (b) Groundtruth map
Industrial urban blocks Discontinuous urban blocks Water surface
Road Agricultural zones Urban vegetation Forest
Fig. 3. Subset of the studied zone with the groundtruth map (BDOCS 2000CIGAL 2003)
– with 10 classes, the regions are too large and thereare not enough regions to classify;
– with 20 classes, the regions are too small and theyare too close of the pixels (each region contains only3 to 6 pixels).
The best result is obtained with 15 classes.• Step 2 - Regions building: from both classified images,
the regions are built, integrating into a same region theconnected pixels having the same class label. Fig. 2 showsthe region maps.
• Step 3 - Regions characterization: All the compositionhistograms have been computed.
• Step 4 - Objects classification: After having computedanother K-means algorithm on the region images, weobtain the final clusterings in the both spatial resolutions.
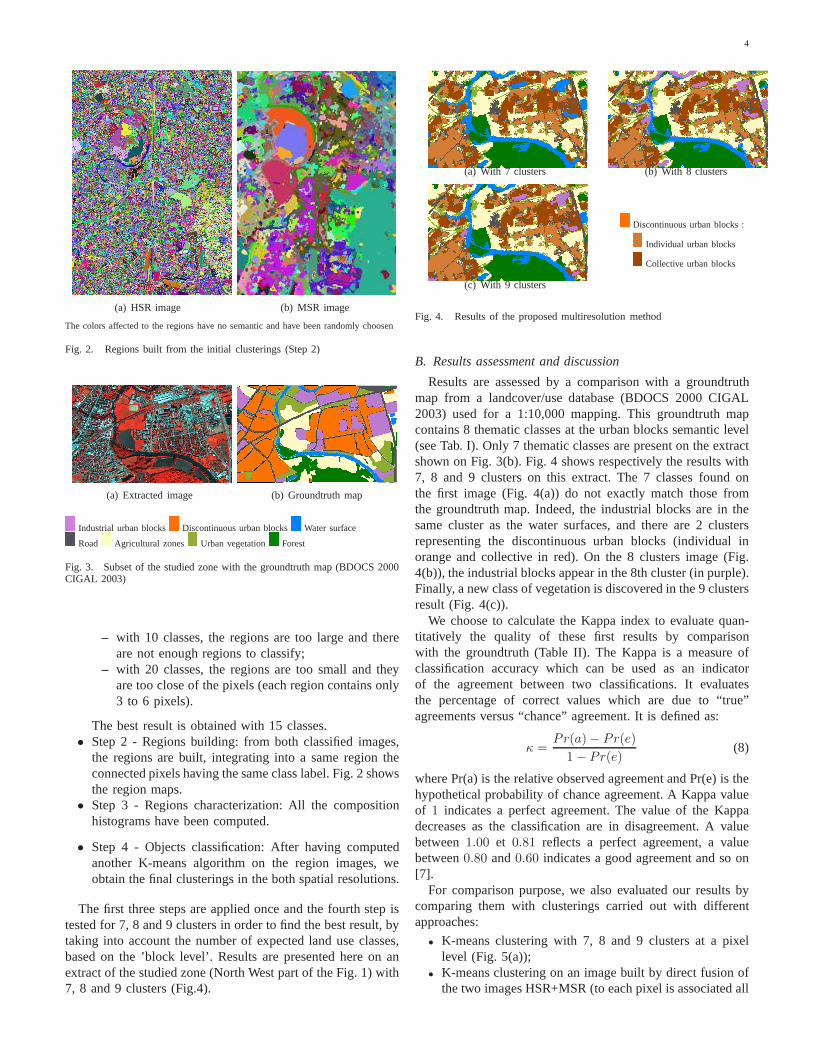
The first three steps are applied once and the fourth step istested for 7, 8 and 9 clusters in order to find the best result, bytaking into account the number of expected land use classes,based on the ’block level’. Results are presented here on anextract of the studied zone (North West part of the Fig. 1) with7, 8 and 9 clusters (Fig.4).
(a) With 7 clusters (b) With 8 clusters
(c) With 9 clusters
Discontinuous urban blocks :
Individual urban blocks
Collective urban blocks
Fig. 4. Results of the proposed multiresolution method
B. Results assessment and discussion
Results are assessed by a comparison with a groundtruthmap from a landcover/use database (BDOCS 2000 CIGAL2003) used for a 1:10,000 mapping. This groundtruth mapcontains 8 thematic classes at the urban blocks semantic level(see Tab. I). Only 7 thematic classes are present on the extractshown on Fig. 3(b). Fig. 4 shows respectively the results with7, 8 and 9 clusters on this extract. The 7 classes found onthe first image (Fig. 4(a)) do not exactly match those fromthe groundtruth map. Indeed, the industrial blocks are in thesame cluster as the water surfaces, and there are 2 clustersrepresenting the discontinuous urban blocks (individual inorange and collective in red). On the 8 clusters image (Fig.4(b)), the industrial blocks appear in the 8th cluster (in purple).Finally, a new class of vegetation is discovered in the 9 clustersresult (Fig. 4(c)).
We choose to calculate the Kappa index to evaluate quan-titatively the quality of these first results by comparisonwith the groundtruth (Table II). The Kappa is a measure ofclassification accuracy which can be used as an indicatorof the agreement between two classifications. It evaluatesthe percentage of correct values which are due to “true”agreements versus “chance” agreement. It is defined as:
κ =Pr(a) − Pr(e)
1 − Pr(e)(8)
where Pr(a) is the relative observed agreement and Pr(e) is thehypothetical probability of chance agreement. A Kappa valueof 1 indicates a perfect agreement. The value of the Kappadecreases as the classification are in disagreement. A valuebetween1.00 et 0.81 reflects a perfect agreement, a valuebetween0.80 and0.60 indicates a good agreement and so on[7].
For comparison purpose, we also evaluated our results bycomparing them with clusterings carried out with differentapproaches:
• K-means clustering with 7, 8 and 9 clusters at a pixellevel (Fig. 5(a));
• K-means clustering on an image built by direct fusion ofthe two images HSR+MSR (to each pixel is associated all

5
(a) HSR image (b) HSR+MSR combined image
(c) Degraded image (ratio 1/2) (d) Degraded image (ratio 1/3)
Fig. 5. Per-pixel clustering using K-means with 9 clusters
(a) K-means (b) Supervised object-oriented me-thod
Fig. 6. Regions classification on HSR image, with 9 clusters
the radiometric information from HSR and MSR images)(Fig. 5(b));
• K-means clustering on two degraded images of the HSRimage with a resolution ratio of 1/2 and of 1/3 (Fig. 5(c)and 5(d));
• K-means clustering with 7, 8 and 9 clusters at an objectlevel using only spectral information (the objects werecreated from a clustering with 15 clusters) (Fig. 6(a));
• Supervised object-oriented approach with Definiens Pro-fessional software, using only spectral information6 (Fig.6(b)).
Fig. 5 illustrates results obtained by the per-pixel classifi-cation with 9 clusters expected. Fig. 6 shows results obtainedby the object-oriented classifications with 9 clusters expected.
TABLE IIKAPPA VALUES OF THE DIFFERENT EXPERIMENTS
7 8 9Multiresolution proposed method 0.73828 0.74259 0.74501
K-means on HSR image 0.70805 0.70412 0.71832K-means on HSR+MSR combined image0.68772 0.70412 0.71831
K-means on degraded image (1/2) 0.68729 0.70396 0.71645K-means on degraded image (1/3) 0.68569 0.70536 0.71620
K-means region classification 0.67864 0.68051 0.69002Supervised object-oriented method 0.70604 0.72811 0.73843
The Kappa index was computed using the groundtruthmap. It was computed for all the different results (II). The
6http://www.definiens.com/
analysis of this global quality indicator shows that the resultsof the multiresolution proposed method are comparable to thesupervised object-oriented method, and outperforms the otherones.
IV. CONCLUSION
One of the challenging issues in remote sensing imageinformation mining is the multiple uses of the acquired imagedata. Indeed, satellite images are now easier to acquire andconsequently, a large amount of heterogeneous images isnow available. If a classification on a MSR image givesnot enough information, a classification on a HSR bringstoo much heterogeneous information (salt-pepper effect).Toobtain aggregate information, users have to be apply a post-classification process (class merging). In order to help usersto obtain directly this aggregate information for a land covermapping at 1:10,000 for instance, we have presented here anew method which automatically combine information fromtwo satellite images with very different spatial resolutions.This method offers the ability to discover new knowledge fromthese two images. These first experiments on the urban area ofStrasbourg have shown very interesting results. In the futurewe wish to integrate the method into the SAMARAH frameworkof collaborative clustering. We also planed to extend themethod in order to make it able to simultaneously deal withmore than two images.Acknowledgment.This work is supported by the french Cen-tre National d’Etudes Spatiales (CNES Contract 70904/00).
REFERENCES
[1] R.E. Bellman.Adaptive Control Processes. 1961.[2] J.A. Benediktsson and I. Kanellopoulos. Classificationof multisource
and hyperspectral data based on decision fusion.IEEE Transactions onGeoscience and Remote Sensing, 37(3):1367–1377, 1999.
[3] U. C. Benz, P. Hofmann, G. Willhauck, I. Lingenfelder, and M. Heynen.Multi-resolution, object-oriented fuzzy analysis of remote sensing datafor gis-ready information. ISPRS Journal of Photogrammetry andRemote Sensing, 58(3-4):239 – 258, 2004. Integration of Geodata andImagery for Automated Refinement and Update of Spatial Databases.
[4] L. Bruzzone, R. Cossu, and G. Vernazza. Combining parametric andnon-parametric algorithms for a partially unsupervised classification ofmultitemporal remote-sensing images.Image Fusion, 3:289–297, 2002.
[5] Y.-L. Chang, L.-S. Liang, C.-C. Han, J.-P. Fang, W.-Y. Liang, and K.-S.Chen. Multisource data fusion for landslide classificationusing general-ized positive boolean functions.IEEE Transactions on Geoscience andRemote Sensing, 45(6), 2007.
[6] Y. Chibani. Selective synthetic aperture radar and panchromatic imagefusion by using the a trous wavelet decomposition.EURASIP Journalon Applied Signal Processing, (14):2207–2214, 2005.
[7] R.G Congalton. A review of assessing the accuracy of classificationsof remotely sensed data.Remote Sensing of Environnnment, 37:35–46,1991.
[8] M. Fauvel, J. Chanussot, and J.A. Benediktsson. Decision fusion forthe classification of urban remote sensing images.IEEE Transactionson Geoscience and Remote Sensing, 44(10):2828–2838, 2006.
[9] G. Forestier, C. Wemmert, and P. Gançarski. Multi-source imagesanalysis using collaborative clustering.EURASIP Journal on Advancesin Signal Processing - Special issue on Machine Learning in ImageProcessing, 2008:11, 2008.
[10] G. F. Hughes. On the mean accuracy of statistical pattern recognizers.IEEE Transactions on Informations Theory, 14(1):55–63, 1968.
[11] L. I. Kuncheva.Combining Pattern Classifiers: Methods and Algorithms.Wiley-Interscience, July 2004.

6
[12] J. B. MacQueen. Some methods for classification and analysis ofmultivariate observations. In L. M. Le Cam and J. Neyman, editors,Proc. of the fifth Berkeley Symposium on Mathematical Statistics andProbability, volume 1, pages 281–297. University of California Press,1967.
Related Documents