Please cite this article in press as: F. Pl¨ ossl et al., J. Chromatogr. A (2006), doi:10.1016/j.chroma.2006.09.033 ARTICLE IN PRESS +Model CHROMA-346839; No. of Pages 8 Journal of Chromatography A, xxx (2006) xxx–xxx Multiresidue analytical method using dispersive solid-phase extraction and gas chromatography/ion trap mass spectrometry to determine pharmaceuticals in whole blood Florian Pl ¨ ossl ∗ , Martin Giera, Franz Bracher Department Pharmazie – Zentrum f ¨ ur Pharmaforschung, Ludwig-Maximilans-Universit¨ at M ¨ unchen, Butenandtstrasse 5-13, 81377 Munich, Germany Received 28 July 2006; received in revised form 8 September 2006; accepted 13 September 2006 Abstract A convenient analytical method for the simultaneous determination of more than 40 pharmaceuticals belonging to various therapeutic categories in whole blood has been developed. Exemplarily, the method was fully validated for eight different pharmaceuticals. The procedure entails addition of acetonitrile, magnesium sulfate and sodium chloride to a small amount of blood, then the mixture is shaken intensively and centrifuged for phase separation. An aliquot of the organic layer is cleaned up by dispersive solid-phase extraction employing bulk sorbents as well as magnesium sulfate for the removal of residual water. This method was based on the QuEChERS approach developed for pesticide residue analysis in food. Gas chromatography/ion trap mass spectrometry (GC/MS) with electron (EI) and chemical (CI) ionisation was then used for qualitative and quantitative determination of the pharmaceuticals. The dispersive SPE with PSA (sorbent functionalized with primary and secondary amines) was found more suitable than aminopropyl and a styrene-divinylbenzene sorbent for sample clean-up before drug level determination in whole blood and plasma, as it was found that most of endogenous matrix components were removed and the analytes were isolated from spiked samples with recoveries above 80%. Variation coefficients of the repeatability typically smaller than 10% have been achieved for a wide range of the investigated substances. The used analytical conditions allowed to separate successively a variety of drugs and poisons with the typical limit of detection at <20 ng mL −1 levels using 1 L injection of equivalent blood sample in whole blood. The method is simple, rapid, cheap and very effective for therapeutic drug monitoring and forensic chemistry. © 2006 Published by Elsevier B.V. Keywords: Dispersive SPE; QuEChERS; Ion trap gas chromatography–mass spectrometry 1. Introduction The determination of plasma levels of various pharmaceuti- cals has been practised in clinical laboratories for many years by the use of various techniques. The importance of thera- peutic drug monitoring in the field of clinical treatments with anticonvulsants, immunosuppressant, chemotherapeutics and other drugs is unchallenged [1–3]. The three mainly used tech- niques for the determination are immunoassays, HPLC and GC-methods [4,5]. Usually the chromatographic methods need a complex sample preparation procedure. But in combination with mass spectral detection chromatographic methods are still ∗ Corresponding author. Tel.: +49 89 218077092; fax: +49 89 218077171. E-mail address: fl[email protected] (F. Pl¨ ossl). the first choice for many applications, by reason of their flexibil- ity, selectivity, wide analytical scope, qualitative and quantitative utility and sensitivity. Beside the classic liquid–liquid-extraction (LLE), solid- phase extraction (SPE) has been used in the last few years as a result of its considerable advantages. The SPE often shows better extraction efficiencies than the LLE, especially for polar compo- nents or metabolized drugs [6,7]. Due to limitations in the type of sorbents available, for a long time no really fast and easy mul- tiresidue sample preparation was possible. In the last years, after development of polymeric phases, the SPE made up this disad- vantage [8]. Nowadays polymeric or mixed-moded sorbents are able to separate acidic, neutral and basic drugs from different biological samples by hydrophobic or ion-exchange interac- tions. Through this, a multiresidual determination of pharma- ceuticals in body specimens is possible. 0021-9673/$ – see front matter © 2006 Published by Elsevier B.V. doi:10.1016/j.chroma.2006.09.033

Welcome message from author
This document is posted to help you gain knowledge. Please leave a comment to let me know what you think about it! Share it to your friends and learn new things together.
Transcript

C
A
iopscdsi8Tlm©
K
1
cbpaonGaw
0d
ARTICLE IN PRESS+ModelHROMA-346839; No. of Pages 8
Journal of Chromatography A, xxx (2006) xxx–xxx
Multiresidue analytical method using dispersive solid-phase extraction andgas chromatography/ion trap mass spectrometry to determine
pharmaceuticals in whole blood
Florian Plossl ∗, Martin Giera, Franz BracherDepartment Pharmazie – Zentrum fur Pharmaforschung, Ludwig-Maximilans-Universitat Munchen,
Butenandtstrasse 5-13, 81377 Munich, Germany
Received 28 July 2006; received in revised form 8 September 2006; accepted 13 September 2006
bstract
A convenient analytical method for the simultaneous determination of more than 40 pharmaceuticals belonging to various therapeutic categoriesn whole blood has been developed. Exemplarily, the method was fully validated for eight different pharmaceuticals. The procedure entails additionf acetonitrile, magnesium sulfate and sodium chloride to a small amount of blood, then the mixture is shaken intensively and centrifuged forhase separation. An aliquot of the organic layer is cleaned up by dispersive solid-phase extraction employing bulk sorbents as well as magnesiumulfate for the removal of residual water. This method was based on the QuEChERS approach developed for pesticide residue analysis in food. Gashromatography/ion trap mass spectrometry (GC/MS) with electron (EI) and chemical (CI) ionisation was then used for qualitative and quantitativeetermination of the pharmaceuticals. The dispersive SPE with PSA (sorbent functionalized with primary and secondary amines) was found moreuitable than aminopropyl and a styrene-divinylbenzene sorbent for sample clean-up before drug level determination in whole blood and plasma, ast was found that most of endogenous matrix components were removed and the analytes were isolated from spiked samples with recoveries above0%. Variation coefficients of the repeatability typically smaller than 10% have been achieved for a wide range of the investigated substances.
he used analytical conditions allowed to separate successively a variety of drugs and poisons with the typical limit of detection at <20 ng mL−1evels using 1 �L injection of equivalent blood sample in whole blood. The method is simple, rapid, cheap and very effective for therapeutic drugonitoring and forensic chemistry.2006 Published by Elsevier B.V.
ectro
tiu
preno
eywords: Dispersive SPE; QuEChERS; Ion trap gas chromatography–mass sp
. Introduction
The determination of plasma levels of various pharmaceuti-als has been practised in clinical laboratories for many yearsy the use of various techniques. The importance of thera-eutic drug monitoring in the field of clinical treatments withnticonvulsants, immunosuppressant, chemotherapeutics andther drugs is unchallenged [1–3]. The three mainly used tech-iques for the determination are immunoassays, HPLC and
Please cite this article in press as: F. Plossl et al., J. Chromatogr. A (2006)
C-methods [4,5]. Usually the chromatographic methods needcomplex sample preparation procedure. But in combinationith mass spectral detection chromatographic methods are still
∗ Corresponding author. Tel.: +49 89 218077092; fax: +49 89 218077171.E-mail address: [email protected] (F. Plossl).
tdvabtc
021-9673/$ – see front matter © 2006 Published by Elsevier B.V.oi:10.1016/j.chroma.2006.09.033
metry
he first choice for many applications, by reason of their flexibil-ty, selectivity, wide analytical scope, qualitative and quantitativetility and sensitivity.
Beside the classic liquid–liquid-extraction (LLE), solid-hase extraction (SPE) has been used in the last few years as aesult of its considerable advantages. The SPE often shows betterxtraction efficiencies than the LLE, especially for polar compo-ents or metabolized drugs [6,7]. Due to limitations in the typef sorbents available, for a long time no really fast and easy mul-iresidue sample preparation was possible. In the last years, afterevelopment of polymeric phases, the SPE made up this disad-antage [8]. Nowadays polymeric or mixed-moded sorbents are
, doi:10.1016/j.chroma.2006.09.033
ble to separate acidic, neutral and basic drugs from differentiological samples by hydrophobic or ion-exchange interac-ions. Through this, a multiresidual determination of pharma-euticals in body specimens is possible.

IN+ModelC
2 atog
sdc
TC
D
L
M
T
A
B
D
C
D
T
ARTICLEHROMA-346839; No. of Pages 8
F. Plossl et al. / J. Chrom
Please cite this article in press as: F. Plossl et al., J. Chromatogr. A (2006)
In 2003, Anastassiades et al. reported a rapid and inexpen-ive method to the analysis of pesticides in foods [9–14]. Theescribed method comprises an extraction of the residual pesti-ides with acetonitrile. Water and proteins are removed from the
rsao
able 1hemical structures and properties of selected pharmaceuticals
rug Structure CAS numbe
idocaine 137-58-6
ethylphenobarbital 115-38-8
ramadole 27203-92-5
mitriptyline 50-48-6
iperidene 514-65-8
iethylstilbestrol 56-53-1
odeine 76-57-3
iazepam 439-14-5
he method was validated exemplarily for these substances.
PRESSr. A xxx (2006) xxx–xxx
, doi:10.1016/j.chroma.2006.09.033
aw extract by salting out with sodium chloride and magnesiumulfate. As next step, the dried crude extract is cleaned up byddition of a small amount of SPE sorbent material to an aliquotf the extract. This step is similar to the matrix solid-phase
r pKa Log P (o/w) Therapeutic use
8.0 2.48 Local anaesthesic antiarrhytmic
7.8 1.92 Anticonvulsant
9.4 2.95 Analgesic
9.4 4.61 Antidepressant
8.8 3.85 Anticholinergic
pk1a = 9.3 4.77 Hormone
pk2a = 10.0
8.21 1.81 Opioid
3.4 2.99 Anticonvulsant

IN+ModelC
atog
dTa[pf
us
F1
ARTICLEHROMA-346839; No. of Pages 8
F. Plossl et al. / J. Chrom
ispersion, where matrix is homogenized with bulk sorbents.he authors named this new method QuEChERS, which is the
Please cite this article in press as: F. Plossl et al., J. Chromatogr. A (2006)
bbreviation of Quick, Easy, Cheap, Effective, Rugged and Safe9]. The authors reported outstanding recoveries for differentesticide classes [9]. In 2005, Posyniak et al. reported a methodor the determination of sulfonamides in chicken muscles and
n
aw
ig. 1. Recovery versus used sorbent mass. Also typical chromatograms in EI-Mode ob= Lidocaine, 2 = methylphenobarbital, 3 = tramadole, 4 = triphenylmethane (I.S.), 5 =
PRESSr. A xxx (2006) xxx–xxx 3
sed a dispersive solid-phase extraction of the sulfonamides asample clean-up step [15]. A similar approach for the determi-
, doi:10.1016/j.chroma.2006.09.033
ation of antibiotics in bovine kidney tissue is described in [16].This paper describes the extension of the QuEChERS
pproach to determination of pharmaceuticals and toxins inhole blood. Similar to the original QuEChERS approach a
tained with 25 mg sorbent and analyte concentration of 100 ng mL−1 are shown.amitriptyline, 6 = biperidene, 7 = diethylstilbestrol, 8 = codeine, 9 = diazepam.

IN+ModelC
4 atog
vdae
ARTICLEHROMA-346839; No. of Pages 8
F. Plossl et al. / J. Chrom
Please cite this article in press as: F. Plossl et al., J. Chromatogr. A (2006)
ery easy, cheap and fast approach for the analysis of severalrugs and poisons with no need of expensive equipment fornalysis is presented. The recovery data for more than 40 differ-nt drugs and poisons from spiked whole blood samples were
eFcw
Fig. 2. Methodical deviation between instrument linearity (calibration da
PRESSr. A xxx (2006) xxx–xxx
, doi:10.1016/j.chroma.2006.09.033
valuated using GC/MS (ion trap in both EI and CI modes).inally the validation and the resulting data of eight pharma-euticals with different chemical and pharmaceutical propertiesere conducted.
ta from matrix-matched standards) and recovery at different levels.
IN+ModelC
atog
2
2
mB
a
pdwcA
mLel
2
MeT
emai
2
mr
2
arh(tTtwAt2satm
2
CeegMcctgaitT3amwtuttttt3af
bessmT
3
3
setactsBde
ARTICLEHROMA-346839; No. of Pages 8
F. Plossl et al. / J. Chrom
. Experimental
.1. Materials
Acetonitrile (MeCN), tert-butylmethylether (TBME) andethanol (MeOH) were purchased from Acros Organics (Geel,elgium) and VWR Prolab (Leuven, Belgium) in HPLC grade.
Magnesium sulfate and sodium chloride in powder form andnalytical grade were obtained from Grussing, Germany.
The solid-phase extraction sorbents Bondesil NH2 (amino-ropyl), PSA (primary and secondary amine) and PPL (styrene-ivinylbenzene) in powder form with a particle size of 40 �mere obtained from Varian (Harbor City, USA). C18 (octade-
ylsilane), alumina and silica gel were obtained from Sigmaldrich (Steinheim, Germany).Drugs were obtained from Synopharm (Barsbuttel, Ger-
any), Sigma Aldrich (Seelze, Germany) and Caesar andorentz (Hilden, Germany). The internal standard (I.S.) triph-nylmethane (TPM) was purchased from Fluka (Buchs, Switzer-and).
.2. Standard solutions
All mentioned drugs and toxic substances were dissolved ineCN. These stock solutions were used as standards for the
xperiments and stored at −20 ◦C. A solution of 1 �g mL−1
PM in MeCN was used as I.S. in the experiments.The full validation was performed with eight differ-
nt pharmaceuticals (lidocaine, methylphenobarbital, tra-adole, amitriptyline, biperidene, diethylstilbestrol, codeine
nd diazepam). Table 1 shows those substances and their chem-cal properties.
.3. Sample preparation equipment
A refrigerated centrifuge type Verifuge 3.0 (Heraeus, Ger-any) and a mixing apparatus Vortex Genie 2 (Scientific Appa-
atus, USA) were used for separating and mixing steps.
.4. Sample preparation
For our experiments, we used whole blood from healthynd adult pigs. The blood was obtained from a local butcheright after slaughtering and was deep-frozen until analysis. Twoundred fifty milligrams (±5%) sodium chloride and 500 mg±5%) magnesium sulfate were filled into a 15 mL centrifugeube and 2000 �L MeCN and 10 �L I.S. solution were added.hen, 1000 �L of the whole blood sample was added. The mix-
ure was shaken vigorously and vortexed for 1 min. The mixtureas centrifuged for 5 min at 4000 revolutions per minute (rpm).n aliquot of 1000 �L extract was transferred into a microcen-
rifuge tube, which contained 25 mg (±3 mg) Bondesil PSA and5 mg (±3 mg) magnesium sulfate for a final drying step. The
Please cite this article in press as: F. Plossl et al., J. Chromatogr. A (2006)
uspension was vortexed for 1 min and then centrifuged for 3 mint 4000 rpm. The supernatant was separated from the solids andransferred into an autosampler vial. The time effort is approxi-
ately 30 min for eight different samples.
assI
PRESSr. A xxx (2006) xxx–xxx 5
.5. GC/MS system
A Varian ion trap Saturn 2100 with MSn-option and multi-I-option was coupled with a Varian 3800 gas chromatographquipped with a Varian 8400 autosampler. The system wasquipped with a 1177 splitt/splittless injector and a 1079 pro-rammable temperature vaporization (PTV) injector. Varian’sS workstation software Version 6.6 was used for instrument
ontrol and data analysis. Varian VF-5ms and Varian VF-Xmsapillary columns of 30 m, 0.25 mm I.D. and 0.25 �m filmhickness were employed throughout the studies. The chromato-raphic conditions for GC-method 1 at the VF-5 ms column weres following: helium (99.999%) constant flow of 1.0 mL min−1,nlet temperature 250 ◦C, injection volume 1 �L (splitless). MSransfer line temperature 270 ◦C, ion trap temperature 200 ◦C.emperature program of 50 ◦C for 1 min, then a ramp of0 ◦C min−1 to 200 ◦C followed by a 5 ◦C min−1 ramp to 280 ◦Cnd a ramp of 40 ◦C min−1 to 300 ◦C (held for 5 min). The chro-atographic conditions the method 2 at the VF-Xms columnere as following: helium constant flow of 1.0 mL min−1, inlet
emperature at the moment of injection 65 ◦C and injection vol-me 2 �L. Starting in splitless mode, one minute after injectionhe split valve was set to a ratio of 1:100. Two minutes after injec-ion the split was switched to 1:25. The temperature program ofhe injector was 65 ◦C for 1 min, then a ramp of 200 ◦C min−1
o 250 ◦C (held for the whole run). The temperature program ofhe chromatographic system was 65 ◦C for 1 min, then a ramp of0 ◦C min−1 to 200 ◦C followed by 5 ◦C min−1 ramp to 280 ◦Cnd a ramp of 40 ◦C min−1 to 300 ◦C (held for 5 min). MS trans-er line temperature 270 ◦C, ion trap temperature 200 ◦C.
The ion trap was operated in full scan mode detecting ionsetween 50 m/z and 650 m/z. Ionisation was performed withlectron ionisation for method development and chemical ioni-ation with liquid MeOH for quantitative determinations. The CItorage level was 19.0 m/z, maximum ionisation time 2000 �s,aximum reaction time 40 ms and the target TIC 5000 counts.he ejection amplitude was set to 19 V.
. Results and discussion
.1. Sample clean-up development
Among the solid-phase materials tested were one polymericorbent (Bondesil PPL) and two sorbents with weak anionxchange and polar capabilities (Bondesil NH2 and PSA). Fur-hermore, we tested very polar sorbents as silica and aluminand apolar sorbents as C18. Various solvents (MeOH, TBME,hloroform) were tested. On the basis of these preliminary inves-igations, we extracted the drugs with MeCN and the polymericorbent Bondesil PPL and the two modified silica sorbentsondesil NH2 and PSA. The Bondesil PPL material is a styrene-ivinylbenzene (PS-DVB) polymer with very hydrophobic prop-rties. It is designed for retaining very polar substances from
, doi:10.1016/j.chroma.2006.09.033
queous samples and gives very clean extracts [17,18]. In con-equence of its specific properties PPL retains sugars, fatty acids,terols and the pharmaceuticals independent of their structure.n our studies primarily cholesterol was retained by PPL.

Pleasecite
thisarticle
inpress
as:F.Plossletal.,J.Chrom
atogr.A(2006),doi:10.1016/j.chrom
a.2006.09.033
AR
TIC
LE
IN P
RE
SS
+Model
CH
RO
MA
-346839;N
o.ofPages8
6F.P
lossletal./J.Chrom
atogr.Axxx
(2006)xxx–xxx
Table 2Recovery of the dispersive solid-phase extraction, chromatographic and mass spectral data obtained by the two GC/MS methods for all tested pharmaceuticals as well as selected ions for quantification and qualification
Drug data Recovery dataSpiking level: 100 ng mL−1 (n = 3)
GC data MS Data [m/z](relative intensity)
Name MR Recovery (%) RSD (%) Retention time [min] RTT Electronic ionisation Chemical ionisation reactant: liquid MeOH
VF-5 ms VF-X ms Base peak Prominent ions Base peak Prominent ions
Acetaminophen 151 90.7 10.1 8.19 8.24 0.72 108.9 150.8 (42.2) 80.0 (41.7) 80.9 (20.6) 152.0 152.9 (9.6) 61.0 (1.7) 110.0 (1.4)Amitriptyline 277 95.6 5.8 14.11 14.12 1.24 58.0 202.3 (4.6) 59.0 (4.4) 55.0 (2.5) 278.2 58.0 (60.3) 279.1 (23.1) 233.0 (4.9)Articaine 284 98.1 11.2 12.40 12.34 1.09 85.9 170.9 (23.0) 138.8 (10.7) 165.9 (10.7) 285.1 85.9 (69.6) 286.0 (15.9) 55.8 (7.2)Atropine 289 101.7 8.9 14.18 14.38 1.25 124.0 82.0 (26.7) 93.9 (20.7) 83.0 (16.9) 124.0 290.3 (21.5) 124.9 (9.6) 67.0 (6.4)Benzocaine 265 99.2 6.3 7.46 7.45 0.66 119.9 165.0 (40.2) 64.9 (27.5) 91.9 (25.6) 165.9 64.9 (11.6) 166.9 (9.9) 120.0 (6.8)Biperidene 311 102.9 7.9 15.33 15.42 1.35 98.0 218.2 (18.2) 54.9 (8.7) 77.0 (8.8) 312.2 97.9 (34.8) 313.3 (22.7) 294.3 (5.4)Caffeine 194 87.1 12.3 9.65 9.85 0.85 194.0 54.9 (38.2) 67.0 (28.4) 108.8 (26.9) 195.0 54.9 (19.4) 67.0 (18.3) 196.0 (9.9)Cholesterol 386 a a 27.31 27.16 2.39 301.3 213.3 (67.2) 386.3 (63.9) 368.5 (66.6) 369.4 370.3 (27.3) 54.9 (7.5) 243.2 (4.6)Codeine 299 95.7 9.8 17.03 17.50 1.54 299.0 162.1 (43.7) 229.1 (27.4) 214.2 (28.2) 282.1 300.2 (32.7) 283.1 (19.1) 301.1 (7.0)Diazepam 284 103.7 6.2 17.74 18.21 1.60 256.0 283.2 (78.1) 257.3 (53.1) 221.2 (45.5) 285.1 287.1 (34.8) 286.0 (18.1) 288.1 (6.5)Dienestrol 266 92.5 11.3 15.81 16.14 1.42 266.1 251.0 (73.2) 237.2 (57.0) 77.0 (33.9) 267.1 173.0 (22.9) 268.1 (19.9) 121.0 (6.1)Diethylstilbestrol 268 89.9 15.7 15.57 15.85 1.40 268.0 145.1 (74.5) 239.2 (91.9) 107.1 (44.2) 268.9 134.9 (38.2) 270.0 (19.7) 174.9 (20.5)Diphenhydramine 255 98.9 7.0 9.91 9.75 0.86 58.0 165.1 (15.2) 167.0 (6.5) 157.0 (5.7) 58.0 167.0 (29.4) 168.0 (4.3) 59.0 (3.0)Doxepine 279 97.8 8.2 14.54 14.67 1.29 58.0 165.2 (3.3) 59.0 (3.5) 178.1 (2.9) 58.0 280.3 (35.0) 281.3 (7.5) 59.0 (3.7)Escitalopram 324 93.5 12.4 17.09 17.21 1.52 58.0 238.1 (6.2) 324.2 (6.3) 325.2 (3.1) 58.0 325.3 (20.7) 58.9 (3.8) 26.3 (4.4)Estradiol 272 85.0 14.1 20.08 20.80 1.83 272.2 213.1 (49.3) 171.9 (34.2) 160.0 (29.1) 273.1 255.2 (93.6) 256.3 (18.1) 274.0 (18.1)Imipramine 280 98.1 5.2 14.46 14.54 1.28 243.3 235.2 (86.0) 59.0 (84.2) 193.2 (38.1) 281.3 86.0 (96.6) 58.0 (80.5) 282.2 (20.7)Lidocaine 234 103.1 11.2 10.02 9.87 0.87 86.0 57.9 (19.0) 87.0 (13.4) 77.0 (8.0) 235.1 236.0 (15.3) 86.0 (8.3) 88.8 (6.7)Memantine 179 103.5 7.2 5.81 b b 122.0 108.0 (95.0) 107.0 (16.7) 92.9 (12.8) b b b b
Methylphenobarbital 246 94.3 13.1 10.40 10.50 0.93 218.0 117.0 (22.2) 146.0 (10.5) 160.0 (5.7) 246.9 87.8 (29.6) 248.0 (15.4) 88.8 (8.2)Nicotine 162 99.2 11.1 6.17 b b 84.0 133.0 (29.9) 163.0 (19.0) 161.0 (17.3) b b b b
Papaverine 339 90.2 18.9 23.30 23.91 2.11 324.2 338.3 (89.5) 339.3 (42.0) 308.2 (25.6) 340.3 341.3 (22.0) 342.3 (3.1) 54.8 (1.0)Paroxetine 329 94.1 7.3 19.78 20.29 1.79 192.1 70.7 (46.2) 329.2 (44.3) 138.0 (38.9) 330.3 331.3 (20.9) 70.0 (2.7) 68.0 (2.6)Phenobarbital 232 101.2 13.3 11.14 11.46 1.01 204.1 117.0 (17.2) 161.0 (14.2) 205.0 (11.8) 233.0 234.2 (14.3) 62.9 (2.5) 235.1 (1.6)Phenytoine 252 95.9 8.2 16.25 – – 180.0 209.0 (73.3) 223.0 (59.8) 103.9 (49.4) 253.1 254.1 (17.1) 174.9 (7.3) 93.8 (1.3)Pridinol 295 101.3 9.8 15.71 15.92 1.29 98.0 77.0 (19.6) 105.0 (18.4) 84.0 (14.5) 98.0 296.3 (79.5) 297.2 (16.7) 54.9 (6.5)Prilocaine 220 98.6 7.4 9.60 9.49 0.84 85.9 77.0 (7.6) 105.9 (7.2) 86.9 (6.2) 221.0 85.9 (26.9) 221.9 (14.1) 55.8 (5.2)Procaine 236 94.3 7.9 11.85 12.00 1.06 86.0 119.9 (27.7) 98.9 (26.3) 64.9 (17.0) 237.2 99.9 (29.7) 238.1 (14.8) 55.9 (9.9)Scopolamine 303 94.8 13.0 15.97 16.35 1.44 93.8 137.9 (67.1) 108.0 (38.2) 153.9 (28.8) 137.9 304.3 (40.4) 156.0 (12.5) 138.9 (8.9)Sparteine 234 98.4 12.2 9.42 9.31 0.83 235.2 137.0 (80.6) 98.0 (56.9) 234.1 (37.2) 235.2 233.3 (28.5) 236.2 (16.0) 234.3 (15.0)Strychnine 334 86.0 15.1 29.21 29.92 2.64 334.3 335.3 (25.7) 333.5 (16.0) 130.0 (14.9) 335.4 336.5 (23.5) 337.4 (3.0) 333.5 (2.2)Testosterone propionate 344 91.0 14.3 23.34 23.81 2.10 123.9 146.9 (65.2) 228.2 (50.7) 56.8 (46.0) 345.3 271.2 (27.7) 346.2 (23.1) 56.8 (13.8)Theobromine 180 90.8 11.9 9.90 10.22 0.90 180.0 67.0 (35.8) 54.9 (35.2) 108.8 (20.6) 181.1 67.0 (8.4) 54.9 (8.9) 182.1 (8.9Theophylline 180 86.2 13.3 11.11 11.59 1.02 180.0 94.8 (34.7) 52.9 (23.2) 67.9 (23.1) 181.0 182.1 (9.2) 67.9 (2.8) 67.0 (2.0)Thiopental 242 103.2 9.1 9.90 10.32 0.91 156.9 172.8 (75.5) 171.9 (63.6) 68.8 (11.9) 243.0 172.9 (18.8) 243.9 (13.4) 54.9 (4.8)Tiamulin 493 56.0 17.8 30.90 – – 86.0 58.0 (7.2) 86.9 (5.8) 119.0 (4.0) 492.5 192.2 (41.5) 439.5 (30.6) 494.5 (10.2)Tiapride 328 73.9 13.1 23.14 23.89 2.11 86.0 58.0 (91.1) 86.9 (6.0) 199.0 (3.8) 329.5 330.3 (18.5) 58.0 (10.1) 331.3 (6.8)Tramadole 263 92.3 11.2 10.94 10.89 0.96 58.0 77.0 (8.0) 262.8 (5.4) 55.0 (13.6) 58.0 264.0 (14.1) 55.8 (12.3) 58.9 (4.5)Triphenylmethane 244 a a 11.34 11.36 1.00 244.0 165.2 (59.5) 167.1 (47.7) 243.5 (35.2) 167.0 168.0 (13.9) 64.9 (1.1) –Tropine 141 102.1 7.4 5.53 b b 82.0 96.0 (70.7) 83.0 (49.3) 124.0 (24.0) b b b b
Xylazine 220 92.1 7.2 11.31 11.56 1.02 205.1 220.1 (49.2) 177.1 (31.4) 146.1 (24.6) 329.5 330.3 (18.5) 58.0 (10.1) 331.3 (6.8)
a Recovery of cholesterol and triphenylmethane (I.S.) not tested.b Signal appears before solvent cut.

IN+ModelC
atog
atasf
wtTAtso
uimaaurefgo
3
mdosa[
3
p
a
stefiDrtsssqaol0
twtpaccb
iescFisd
(b[Ga
TV
N
LMTBADCD
ARTICLEHROMA-346839; No. of Pages 8
F. Plossl et al. / J. Chrom
The Bondesil NH2 material is a modified silica with anminopropyl group retaining sugars and other polar substanceshrough hydrogen bonding and acidic compounds like free fattycids through anion exchange. In comparison to the other usedorbents, Bondesil NH2 results in unclean extracts and wasound not suitable for the experiments.
The Bondesil PSA material is a modified silica functionalizedith ethylenediamine groups. Through this PSA is very similar
o the NH2 material, but has a higher ionic capacity than NH2.hrough the bidentate structure, PSA has a high chelating effect.s a result of the secondary and primary amino groups the reten-
ion of free fatty acids and other polar matrix compounds is verytrong. PSA also gives very clean extracts with a lower retentionf cholesterol than PPL (Fig. 1).
Fig. 1 shows the recoveries depending on sorbent types andsed sorbent masses and typical chromatograms with electroniconisation and 25 mg sorbent used in each case. Using the basic
aterials Bondesil NH2 and PSA, the recoveries of the acidicnalytes declined rapidly. Also the recovery of neutral and basicnalytes is fading with the use of higher sorbent masses. By these of the polymeric sorbent Bondesil PPL, all analytes wereemoved from the extract independent on their chemical prop-rties, as expected. Therefore, we used the Bondesil PSA forurther experiments, because the material is able to remove inor-anic ions and sugars very effectivly. For the experiments 25 mgf the sorbent were used.
.2. Qualitative results
To demonstrate the multiresidual ability of the introducedethod, we tested the total recoveries of more than 40 different
rugs and poisons at fixed level of 100 ng mL−1. The resultsf threefold measurements and all chromatographic and masspectral data are shown in Table 2. Mass spectral data are listedccording to the European Commission Decision 2002/657/EC19].
.3. Method validation
Please cite this article in press as: F. Plossl et al., J. Chromatogr. A (2006)
The suitability of the method was tested with eight differentharmaceuticals.
For verification of selectivity, the extracts from ten differentnalyte free blood samples were analysed.
gTtw
able 3alidation data of the eight model substances
ame Instrument precision(n = 6) RSD (%)
Method precision(n = 6) RSD (%)
idocaine 5.0 6.6ethylphenobarbital 3.5 10.4
ramadole 7.4 12.0iperidene 4.3 10.3mitriptyline 3.3 6.8iethylstilbestrol 4.7 16.1odeine 6.3 13.3iazepam 7.3 6.4
PRESSr. A xxx (2006) xxx–xxx 7
The linearity of the assay was proven according to regres-ion line by the method of least squares and expressed byhe coefficient of determination (R2). Mathematically the lin-arity of the assay was checked by comparing a linear curvet and a non-linear curve fit with a Mandel test according toIN 38402 [20]. For all pharmaceuticals, a linear curve fit
esults in the best fitting. Six-point matrix-matched calibra-ion curves were evaluated by spiking of analyte free bloodamples with increasing amounts of each of the model sub-tances. Calibration curves were obtained for each model sub-tance by plotting the recorded peak area (ion counts) of theuantifier ions versus the corresponding concentrations of thenalytes in concentrations between 25 and 250 ng mL−1. Webserved linearity in the whole range. All values of the corre-ation factors R2 of the calibration curves are all higher than.99.
Precision of the instrument and repeatability (precision ofhe method) were measured with analyte free blood sampleshich were spiked with model substances to a concentra-
ion of 100 ng mL−1. The spiked samples were analysed andrecision of the instrument and repeatability were calculateds relative standard deviation (RSD). The variation coeffi-ients of the instrument precision were smaller than 8% in allases. The RSD of inter-day repeatability tests were generallyelow 20%.
The recovery (trueness) of the method was also measuredn blank blood samples which were spiked with the same lev-ls as used for determination of linearity. The spiked bloodamples were analysed and the recoveries were calculated byomparison of the measured concentration to the spiked samples.ig. 2 shows the plots of calibration curves versus recover-
es at the tested levels. This test is an excellent indicator forystematic errors. Obviously no methodical deviation could beetected.
The limit of detection (LOD, CC�), the limit of decisionCC�) and the limit of quantification (LOQ) were determinedy using the calibration curve procedure according to DIN 3264515]. Only 1 �L of equivalent sample was injected into theC/MS. A lower limit of detection could be achieved by usinglarge volume injection (LVI) in combination with the pro-
, doi:10.1016/j.chroma.2006.09.033
rammable temperature vaporation injector or retention gaps.he limit of detection was calculated with a statistical cer-
ainty of 1 – β (β = 0.05), the limit of decision was calculatedith a certainty of 1 – α (α = 0.05). The limit of quantification
R2 LOD (CC�)(ng mL−1)
LOQ(ng mL−1)
Recovery (%)
0.9912 14.4 24.0 103.10.9972 8.3 21.5 94.30.9981 5.6 11.3 92.30.9913 12.2 29.8 102.90.9928 11.1 27.5 95.60.9943 17.2 39.0 89.90.9931 12.9 28.1 95.70.9945 11.7 28.7 103.7
ARTICLE IN+ModelCHROMA-346839; No. of Pages 8
8 F. Plossl et al. / J. Chromatog
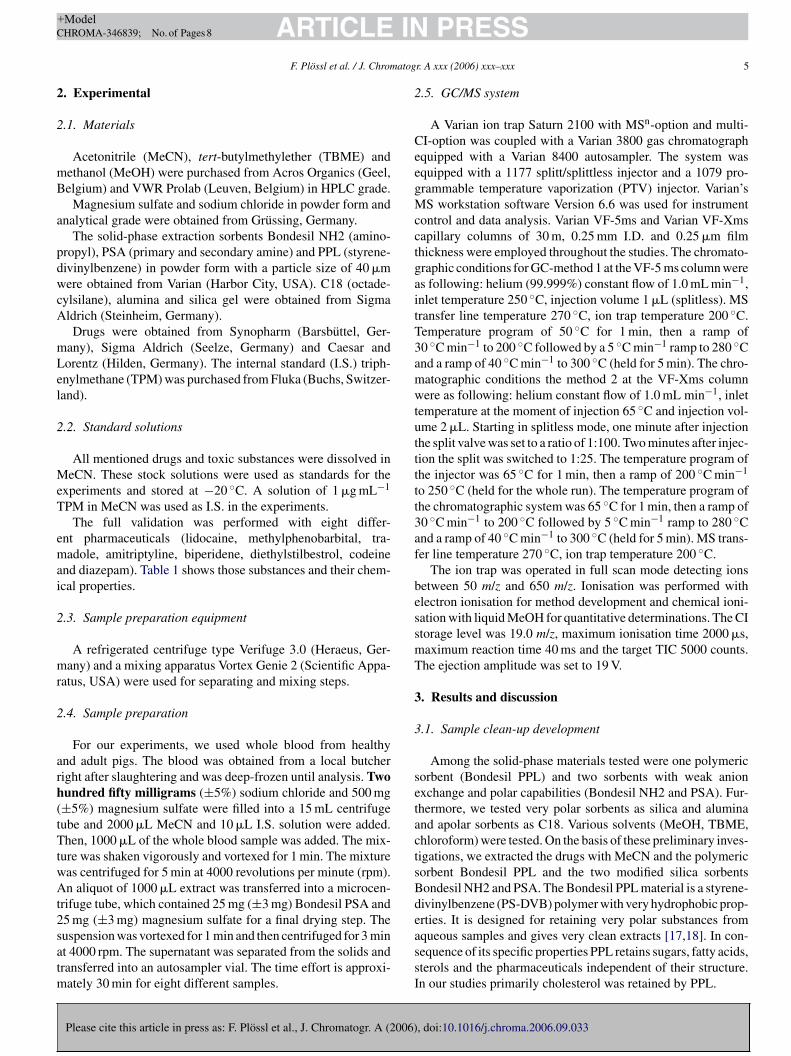
Fig. 3. Typical chromatogram in CI mode with methanol as reactant obtainedat an analyte concentration of 100 ng mL−1 in whole blood after clean-up withthe described method and 25 mg used sorbent mass. 1 = Lidocaine, 2 = methyl-pb
woaiF
4
umdictl
R
[[
[[[
[
[
[[[
[
henobarbital, 3 = tramadole, 4 = triphenylmethane (I.S.), 5 = amitriptyline, 6 =iperidene, 7 = diethylstilbestrol, 8 = codeine, 9 = diazepam.
as calculated with 1 – β (β = 0.05) and a relative uncertaintyf 33.3% according to DIN 32645 [21]. All values mentionedbove are shown in Table 3. A typical chromatogram with chem-cal ionisation with liquid methanol as reactant is shown inig. 3.
. Conclusion
A simple, rapid and inexpensive extraction and sample clean-p using the QuEChERS approach has been developed. Theethod has high throughput capabilities and could be used for
etection and quantification of pharmaceuticals and several tox-
Please cite this article in press as: F. Plossl et al., J. Chromatogr. A (2006)
ns. Since this method affords no special equipments for samplelean-up, needs only minimum amounts of solvents and minimalime, it should be very useful for analytical chemists in clinicalaboratories and forensic scientists.
[
PRESSr. A xxx (2006) xxx–xxx
eferences
[1] M.J. Burke, S.H. Preston, Clin. Pharmacokinet. 37 (1999) 147.[2] E.J. Begg, M.L. Barclay, C.J. Kirkpatrick, Br. J. Clin. Pharmacol. 47 (1999)
23.[3] M. de Jonge, A. Huitema, J. Schellens, S. Rodenhuis, J. Beijnen, Clin.
Pharmacokinet. 44 (2005) 147.[4] D.J. Speed, S.J. Dickson, E.R. Cairns, N.D. Kim, J. Anal. Toxicol. 24 (2000)
685.[5] S. Ulrich, T. Isensee, U. Pester, J. Chromatogr. B 685 (1996) 81.[6] S. Paterson, R. Cordero, S. Burlinson, J. Chromatogr. B 813 (2004) 323.[7] M.A. Martınez, C. Sanchez de la Torre, E. Almerza, J. Anal. Toxicol. 27
(2003) 353.[8] A. Takeda, H. Tanaka, T. Shinohara, I. Ohtake, J. Chromatogr. B 758 (2001)
235.[9] M. Anastassiades, S.J. Lehotay, D. Stajnbaher, F.J. Schenk, J. AOAC Int.
86 (2003) 4121.10] F.J. Schenk, J.E. Hobbs, Bull. Environ. Contam. Toxicol. 73 (2004) 24.11] S.J. Lehotay, A. de Kok, M. Hiemstra, P. van Bodegraven, J. AOAC Int. 88
(2005) 595.12] S.J. Lehotay, K. Mastovska, A.R. Lightfield, J. AOAC Int. 88 (2005) 615.13] S.J. Lehotay, K. Mastovska, S.J. Yun, J. AOAC Int. 88 (2005) 630.14] A. Hercegova, M. Domotorova, D. Kruzlicova, E. Matisova, J. Sep. Sci. 29
(2006) 1102.15] A. Posyniak, J. Zmudzki, K. Mitrowska, J. Chromatogr. A 1087 (2005)
259.16] C.K. Fagerquist, A.R. Lightfield, S.J. Lehotay, Anal. Chem. 77 (2005)
1473.17] D. Martens, Soil Sci. Soc. Am. J. 66 (2002) 1240.18] E. Tomaszweska, V.R. Hebert, J. Agric. Food Chem. 51 (2003) 6103.19] European Commission Decision 2002/657/EC of 12 August 2002 imple-
menting Council directive 96/23EC concerning the performance of analyt-ical methods and interpretation of results.
20] DIN 38402 Teil 51, German standard methods for the examination ofwater, waste water and sludge; general information (group A); calibrationof analytical methods, evaluation of analytical results and linear calibration
, doi:10.1016/j.chroma.2006.09.033
functions used to determine the performance characteristics of analyticalmethods (A 51), Beuth Verlag, 1986.
21] DIN 32645, Chemical analysis; decision limit; detection limit and determi-nation limit; estimation in case of repeatability; terms, methods, evaluation,Beuth Verlag 1996.
Related Documents