[42] TRANSCRIPTIONAL REGULATION OF Trx AND arx PATHWAYS 441 [42] Multiplex Reverse Transcription-Polymerase Chain Reaction for Determining Transcriptional Regulation of Thioredoxin and Glutaredoxin Pathways By CARMEN PUEYO, JUAN JURADO, MARIA-JOSt~ PR1ETO-/~AMO, FERNANDO MONJE-CASAS, and JUAN LOPEZ-BAREA Introduction Thioredoxins (Trxs) and glutaredoxins (Grxs) are small redox-active proteins that have been isolated as hydrogen donors for ribonucleotide reductase (RRase), the key enzyme for deoxyribonucleotide and DNA biosynthesis. Trxs and Grxs contain two redox-active cysteine thiols, which by dithiol-disulfide interchange reduce an acceptor disulfide in the active center of RRase.l,2 Escherichia coli has two Trxs (Trxl and Trx2), three Grxs (Grxl, Grx2, and Grx3), a novel redoxin with Trx-like activity but Grx-like amino acid sequence (NrdH), and two aerobic class I RRases (NrdAB and NrdEF). Grxl and Trxt are the two main reductants of the NrdAB enzyme and NrdH is the specific hydrogen donor of the NrdEF system. Trxl, Trx2, Grxl, Grx2, and Grx3 are encoded by the trxA, trxC, grxA, grxB, and grxC genes, respectively.3 The nrdA and nrdB genes that encode the NrdAB class Ia reductase constitute a transcription unit that does not include the genes for either Trxs or Grxs. However, the nrdE and nrdF genes that encode the NrdEF class Ib reductase form a conserved nrdHIEF operon that includes the gene encoding the NrdH redoxin. 2 Trxs and Grxs differ in their reductive pathways, although ultimately reducing equivalents come from NADPH. The thioredoxin system is composed of NADPH, the flavoprotein thioredoxin reductase (the product of trxB), and Trx; the glutare- doxin system consists of NADPH, the flavoprotein glutathione reductase (the prod- uct of gorA), the ubiquitous tripeptide glutathione (GSH), and Grx. 1 Different inducible responses are critical in protecting E. coli from oxidative damage. The two best characterized oxidative stress responses are controlled by the OxyR and SoxR transcriptional activators of E. coll.4 In addition to the classic func- tion of acting as reductants for RRase, several components of the Trx and Grx/GSH pathways are involved in the oxidative response of the OxyR and SoxR transcrip- tion factors during their regulatory cycles.5,6 Therefore, (1) OxyR is activated 1 A. Holmgren, J. BioL Chem. 264, 13963 (1989). 2 A. Jordan and R Reichard, Annu. Rev. Biochem. 67, 71 (1998). 3 A. Rietsch and J. Beckwith, Annu. Rev. Genet. 32, I63 (1998). 4 G. Storz and J. A. Imlay, Curr. Opin. Microbiol. 2, 188 (1999). 5 M. Zheng, E/~slund, and G. Storz, Science 279, 1718 (1998). 6 H. Ding and B. Demple, Biochemistry 37, 17280 (1998). Copyright © 2002by Academic ?tess. AU rights of reproduction in anyformreserved. METHODS IN ENZYMOLOGY, VOL.347 0076-6879/02 $35.00

Welcome message from author
This document is posted to help you gain knowledge. Please leave a comment to let me know what you think about it! Share it to your friends and learn new things together.
Transcript

[42] TRANSCRIPTIONAL REGULATION OF T r x AND a r x PATHWAYS 441
[42] Multiplex Reverse Transcription-Polymerase Chain Reaction for Determining Transcriptional Regulation of
Thioredoxin and Glutaredoxin Pathways
By CARMEN PUEYO, JUAN JURADO, MARIA-JOSt~ P R 1 E T O - / ~ A M O ,
FERNANDO MONJE-CASAS, a n d JUAN LOPEZ-BAREA
I n t r o d u c t i o n
Thioredoxins (Trxs) and glutaredoxins (Grxs) are small redox-active proteins that have been isolated as hydrogen donors for ribonucleotide reductase (RRase), the key enzyme for deoxyribonucleotide and DNA biosynthesis. Trxs and Grxs contain two redox-active cysteine thiols, which by dithiol-disulfide interchange reduce an acceptor disulfide in the active center of RRase.l,2
Escherichia coli has two Trxs (Trxl and Trx2), three Grxs (Grxl, Grx2, and Grx3), a novel redoxin with Trx-like activity but Grx-like amino acid sequence (NrdH), and two aerobic class I RRases (NrdAB and NrdEF). Grxl and Trxt are the two main reductants of the NrdAB enzyme and NrdH is the specific hydrogen donor of the NrdEF system. Trxl, Trx2, Grxl, Grx2, and Grx3 are encoded by the trxA, trxC, grxA, grxB, and grxC genes, respectively. 3 The nrdA and nrdB genes that encode the NrdAB class Ia reductase constitute a transcription unit that does not include the genes for either Trxs or Grxs. However, the nrdE and nrdF genes that encode the NrdEF class Ib reductase form a conserved nrdHIEF operon that includes the gene encoding the NrdH redoxin. 2
Trxs and Grxs differ in their reductive pathways, although ultimately reducing equivalents come from NADPH. The thioredoxin system is composed of NADPH, the flavoprotein thioredoxin reductase (the product of trxB), and Trx; the glutare- doxin system consists of NADPH, the flavoprotein glutathione reductase (the prod- uct of gorA), the ubiquitous tripeptide glutathione (GSH), and Grx. 1
Different inducible responses are critical in protecting E. coli from oxidative damage. The two best characterized oxidative stress responses are controlled by the OxyR and SoxR transcriptional activators of E. coll. 4 In addition to the classic func- tion of acting as reductants for RRase, several components of the Trx and Grx/GSH pathways are involved in the oxidative response of the OxyR and SoxR transcrip- tion factors during their regulatory cycles. 5,6 Therefore, (1) OxyR is activated
1 A. Holmgren, J. BioL Chem. 264, 13963 (1989). 2 A. Jordan and R Reichard, Annu. Rev. Biochem. 67, 71 (1998). 3 A. Rietsch and J. Beckwith, Annu. Rev. Genet. 32, I63 (1998). 4 G. Storz and J. A. Imlay, Curr. Opin. Microbiol. 2, 188 (1999). 5 M. Zheng, E/~slund, and G. Storz, Science 279, 1718 (1998). 6 H. Ding and B. Demple, Biochemistry 37, 17280 (1998).
Copyright © 2002 by Academic ?tess. AU rights of reproduction in any form reserved.
METHODS IN ENZYMOLOGY, VOL. 347 0076-6879/02 $35.00

442 THIOREDOXIN [42]
(in the absence of added H202) by oxidation of the cellular thiol-disulfide state, caused by the simultaneous impairment of Trx and Grx/GSH systemsV,8; (2) this OxyR activation, involving the formation of an intramolecular disulfide bond, is reversed by the cellular disulfide-reducing machinery, with particular dependence on GrxlS; and (3) genes that encode components of both Trx and Grx/GSH systems are upregulated by OxyR (see data in Table II), thus ensuring that this transcription factor is active for a defined period of time.
Here we described a method to quantitate the in vivo expression of most known components of the E. coli thioredoxin (trx genes) and glutaredoxin/GSH (grx and gorA genes) pathways, of related enzymes (nrd genes), and of key members of the OxyR (oxyS) and SoxR/S (soxS) regulons.
RNA
RNA Isolation
Escherichia coli cultures (25 ml), harvested at the indicated time or OD600 value, are frozen in liquid nitrogen. Immediately after, total RNA is prepared by the hot phenol extraction method of Emory and Belasco 9 with slight modi- fications. Pelleted cells are suspended in 0.125 ml (culture at OD600 of 0.2) or 0.250 ml (culture at OD600 of 0.7) of ice-cold 0.3 M sucrose, 0.01 M sodium ac- etate buffer (pH 4.5). After addition of 0.125 or 0.250 ml of 2% (w/v) sodium dodecyl sulfate (SDS) in the same buffer, the cell suspension is heated for 3 min at 70 ° and extracted for 3 min at 70 ° with 0.25 or 0.50 ml of hot phenol at pH 4.5 (Amresco, Solon, OH). The RNA is then ethanol precipitated and treated for 60 min at 37 ° with RNase-free DNase I (>50 U; Roche Diagnostics, Mannheim, Germany) in 0.1 M sodium acetate, 5 mM MgSO4 (pH 5.0), to remove contaminat- ing genomic DNA. After that, the RNA is phenol extracted, ethanol precipitated, quantified spectrophotometrically, and stored at - 8 0 ° in diethyl pyrocarbonate (DEPC) treated water until use. We have observed no appreciable deterioration of RNA samples stored for up to 1 year. The quality of the preparation can be checked by electrophoresis of 5/zg of RNA in a 1% agarose gel containing 2.2 M formaldehyde. Lack of DNA contamination must be checked by polymerase chain reaction (PCR) amplification of RNA samples. No fluorescent bands should be visible from these reactions. At least two independent RNA isolations should be accomplished for each experimental condition.
In Vitro RNA Synthesis
The external standard RNA (CYP1A transcript in this work) is synthesized in vitro from an insert cloned into a vector containing a T7 polymerase-binding
7 E/~slund, M. Zheng, J. Beckwith, and G. Storz, Proc. Natl. Acad. Sci. U.S.A. 96, 6161 (1999). 8 M. J. Prieto-Alamo, J. Jurado, R. Gallardo-Maduefio, F. Monje-Casas, A. Holmgren, and C. Pueyo,
J. Biol. Chem. 275, 13398 (2000).
[42] TRANSCRIPTIONAL REGULATION OF Trx AND Grx PATHWAYS 443
site, by means of a commercial RNA transcription kit (Stratagene, La Jolla, CA). The DNA template, still present after the transcription reaction, is removed with RNase-free DNase I (3 U/rig DNA, 15 rain at 37°). The synthesized RNA is phenol extracted, ethanol precipitated, quantified spectrophotometrically, and stored at - 8 0 ° until use. The external standard RNA is mixed with total RNA before the reverse transcription step.
cDNA
Synthesis of cDNA is carried out with the GeneAmp RNA PCR kit (Applied Biosystems, Foster City, CA). In short, 1 ttg of total RNA plus 16 pg of external standard RNA are incubated for 10 rain at 25 ° and then retrotranscribed for 15 rain at 42 ° with 50 U of routine leukemia virus (MuLV) reverse transcriptase, using random hexamers. The enzyme is inactivated by heating for 5 rain at 99 °. Each RNA sample is retrotranscribed on an average of three separate occasions. We synthesize cDNA in a 20-td reaction and then use 1 /~1 of the cDNA solution in each multiplex PCR amplification tube.
P r i m e r s
Primer Design
Primers (20- to 30-mers) must be exactly complementary to the desired tem- plate location while preventing the formation of internal secondary structures. Primers were designed with Oligo 6.1.1/98 software (Molecular Biology Insights, Plymouth, MN). To obtain the highest specificity and acceptability for use in mul- tiplex PCR reactions, primers are chosen to have high Tm and optimal 3 / AG values (Table I).
Primer Label
One primer of each pair is labeled at the 5 t end with a fluorescent dye. Up to three different fluorescent dyes can be used (a fourth dye color is reserved for labeling tile size standard). By making use of differences in color, fragments of identical sizes can be distinguished. 10 Nevertheless, on the basis of our experience we recommend labeling the primers with the same dye label and, thus, distinguishing the fragments by differences in size. Fragments differing by about 6 bases in length (Fig. 1) are easily separated and quantified, under both standard and highly induced conditions (Table II).
9 S. A. Emory and J. G. Belasco, J. Bacteriol. 172, 4472 (1990). 10 R. Gallardo-Maduefio, J. E M. Leal, G. Dorado, A. Holmgren, J. L6pez-Barea, and C. Pueyo,
J. Biol. Chem. 273, 18382 (1998).

444 THIOREDOXIN [42]
TABLE I PCR PRIMER CHARACTERISTICS
Fragment Tm b 31A G c Primers a size (bp) Sequence (°C) (kcal/mol)
gorA* 87 gorA CYPAI* 93 CYPA1 oxyS* 99 oxyS grxB* 105 grxB grxC* 112 grxC grxA* 118 grxA nrdA* 124 nrdA trxA * 130 trxA soxS* 136 soxS gapA* 143 gapA trxC* 152 trxC trxB* 157 trxB nrdE* 164 nrdE
51-GGCACCTGCGTAAATGTTGGCTGTG 80.9 -3.0 5~-CGGGCCGTACATATGGATCGCTTCA 81.8 -3.0 51-TCCTTCAACCCAGACCGTTTCCTCA 79.5 - - 5~-CCGCTTTCCCAAGCCAAAAACCATC 81.3 - 1.0 51-GGAGCGGCACCTCTTTTAACCCTTG 79.2 -3.0 51-TCCTGGAGATCCGCAAAAGTTCACG 80.0 -6.9 51-ATCCCCGTCGAATTACATGTTCTGCTCA 80.7 -6.4 51-ATAGCGGCTGTCATCTTTTTGCAGAATGG 80.5 -3.7 5~-AAGAGATGATCAAACGCAGCGGTCG 80.1 -3.4 51-TCCAGTCCACCACGTGCATCCAAT 80.5 -3.3 5~ -GCTGAGAAATTGAGCAATGAACGCGATG 81.8 -3.3 51-GCACGGTTTCTACGGGTTTACCTGCCTTT 81.6 -3.7 51-GACGCCTATGAGCTGCTGTGGGAAA 80.1 -8.0 51-GGAAGCGTGACGGATCGTAGTTGG 78.6 -4.2 5~-TCGTCGATTTCTGGGCAGAGTGGTG 79.0 -5.2 51-GCAGTGCCAGGGTTTTGATCGATG 79.5 -5.2 51-GAC GCATCAGACGCTTGGCGATT 80.3 -3.4 51-GCGGGAGAAGGTCTGCTGCGAGA 81.8 -3.4 5/-C GTTCTGGGCTACACCGA AGATGACG 81.1 -3.0 Y -AACCGGTTTCGTTGTCGTACCAGGA 79.1 -3.6 5r -CCAATTTTTGAAGATGTCGCGCAAGAGC 82.0 -4.2 51-AGCATGTCGACAACCTGACCGTFTTTGA 81.6 -4.9 5~-CTGGAAGAAGTGACCGGCGATCAAA 80.0 -8.0 51-CCAGTrCCAGCTGCCCTTCGAAA 79.4 -5.2 5t -CCTCGGGGCATGGAAGTTYFACACC 79.8 -2.5 5/-AGCGTCCTGACAGCATTTCATC GGT 79.7 -5.9
a Forward primers, labeled with 4,7,2 ~,4 t, 5/,7 / -hexachloro-6-carboxyfluorescein, are marked with asterisks.
b Tm (melting temperature) values (calculated by the nearest-neighbor method) give the dissociation temperature of each primer/template duplex.
c 3lAG values (calculated by multiplex analysis) report the free energy of cross-dimerization be- tween each primer and the primer forming the most stable dimer. A 3 / dimer AG value greater than - 1.0 (meaning no likelihood of dimerization) is indicated by a dash.
Pr imer Specificity
A highly specific mul t ip lex P C R generates only P C R products o f the pre-
dicted sizes. Never theless , the P C R products can be further ver if ied by nucleot ide
sequencing. Pr imer design and P C R condi t ions are adjusted for m a x i m u m speci-
ficity. To e l iminate compe t ing side react ions and unspecif ic P C R products, the use
o f a D N A po lymerase that is suppl ied in an inact ive fo rm and becomes activated
by heat ing the react ion mixture is h igh ly r ecommended .

[42] TRANSCRIPTIONAL REGULATION OF Trx AND Grx PATHWAYS 445
Fragment size (nucleotides)
_=
FIG. 1. GeneScan electropherogram display of one representative sample. Peak height is shown on the y axis and fragment size is shown on the x axis. Solid peaks are identified by the name of each gene. Size standards are open peaks. The sample loaded corresponds to untreated wild-type bacteria (Table II). Primers were at the following concentrations: 0.02 #M (grxB), 0.03 IzM (CYP1A), 0.04/zM (gorA, nrdA), 0.05 IzM (gapA), 0.06 tzM (grxC), 0.08 ¢zM (soxS), 0.12 lzM (grxA, trxB), 0.24/xM (oxyS, trxA), and 0.32 lzM (trxC, nrdE). Forward and reverse primers were at identical concentrations. Coamplification took place for 27 cycles.
M u l t i p l e x P o l y m e r a s e C h a i n R e a c t i o n
Standard Conditions
The standard reaction mixture (25-#1 final volume) contains MPCR buffer 3 (Maxim Biotech, San Francisco, CA) supplemented with 1 m M MgCI2, a 250 # M concentration of each dNTR a 0.08 # M concentration of each primer, 1 #1 of cDNA solution, and 1.25 units of AmptiTaq Gold (Applied Biosystems). The so- called standard reaction mixture is regarded as the point of departure to explore modifications and potential improvements. In particular, the primer concentrations must be adjusted (see legend to Fig. 1) so that all genes yield quantifiable fluorescent signals over a wide range of expression levels (Table II). Before running the PCR amplification, the AmpliTaq Gold is activated by heating for 10 rain at 95 °. Each PCR cycle consists of 1 rain of denaturation at 94 °, and 45 sec of annealing and extension at 70 °. The number of PCR cycles is fixed by means of a C-type multiplex PCR (Fig. 2).
Quantification o f Polymerase Chain Reaction Products
After amplification, 0.25/xl of the multiplex PCR solution is mixed with 0.5 ttl of deionized formamide, 0.125/zl of Prism Genescan-350 Tamra ladder (fragment

446 THIOREDOXIN [421
TABLE II INDUCTION BY OXIDATIVE STRESS OF EXPRESSION OF GENES ENCODING KNOWN
COMPONENTS OF THIOREDOXIN AND GLUTAREDOXIN]GSH PATHWAYS AND
RELATED ENZYMES
Gene Wild-type basal levels a Wild-type induced levels a OxyR c mutant basal levels b
grxA 1.54 + 0.04 c 65.59 -4- 2.92 (42.6)* 41.84 -4- 2.22 (27.2)* grxB 0.27 -4- 0.02 0.34 4- 0.04 (1.3) 0.27 4- 0.02 (1.0) grxC 2.12 4- 0.06 2.68 + 0.14 (1.3) 1.46 -4- 0.05 (0.7) gorA 0.91 4- 0.02 6.31 4- 0.32 (6.9)* 2.76 + 0.18 (3.0)* trxA 7.95 -4- 0.47 9.31 -t- 0.55 (1.2) 10.67 4-4- 0.45 (1.3) trxC 1.44 4-4- 0.07 44.69 4- 1.25 (31.0)* 38.64 4-4- 1.37 (26.8)* trxB 4.08 ± 0.07 12.61 -t- 0.89 (3.1)* 7.15 -4- 0.41 (1.8)* nrdA 4.21 -4- 0.17 2.57 4- 0.20 (0.6) 5.03 -4- 0.21 (1.2) nrdE 1.55 -4- 0.03 5.29 4- 0.44 (3.4)* 0.54 + 0.03 (0.3)* oxyS 2.42 -4- 0.07 239.95 4- 8.10 (99.2)* 87.91 -4- 5.21 (36.3)* soxS 3.25 4- 0.09 67.46 -4- 3.83 (20.8)* 1.64 4- 0.06 (0.5)* CYP1A 2.45 -4- 0.06 2.71 -4- 0.22 (1.1) 3.91 :t: 0.31 (1.6)
a Wild-type bacteria (UC5710) grown in M9 minimal medium to reach an OD600 of 0.2 were treated (induced levels) or not treated (basal levels) with 30/zM H202 for 1 rain.
b Untreated OxyR c mutant (UC 1394). c Data represent the mean -t- SEM (n = 6) of the fluorescence signal of each PCR product
relative to that of the control gapA gene. Values relative to those of untreated wild-type bacteria are indicated in parentheses. Statistical significance (p < 0.01) is marked with an asterisk. Coamplification took place for 27 cycles.
size standard), and 0 . 1 2 5 / x l o f loading buffer (blue dextran, 50 m g / m l ; EDTA,
25 mM). Samples are denatured at 92 ° for 3 min and run on a denaturat ing 4 .25%
(w/v) p o l y a c ~ l a m i d e gel at 750 V in an A B 1 3 7 7 D N A sequencer (Appl ied Biosys-
tems). Data are co l lec ted and analyzed with A B I Pr i sm 377 Col lec t ion 2.1/97 and
GeneScan Analys is 2.0.2/95 sof tware (Appl ied Biosys tems) , respectively. The
GeneScan sys tem sizes and quanti tates D N A fragments by automated fluores-
cence detect ion. The results are d isp layed as e lec t ropherograms, as tabular data,
or as a combina t ion o f both. E lec t ropherograms show f luorescence as a funct ion
o f f ragment size (Fig. 1) and tabular data provide detai led sizing and quanti tat ive
informat ion. The relat ive concentra t ions o f dif ferent-s ized f ragments in a sample
can be de te rmined by compar ing ei ther the peak heights or peak areas g iven in the
tabular data. We normal ize putat ive differences among mul t ip lex P C R ou tcomes
by dividing the f luorescent signal strength (peak area) o f each target f ragment by
the f luorescent signal strength o f the standard (see below) in the same reaction.
Standard
In semiquant i ta t ive or relat ive reverse t ranscript ion (RT)-PCR, the amounts o f
the target gene transcripts are quantif ied in relat ion to the level o f a coampl i f ied
[42 ] TRANSCRIPTIONAL REGULATION OF Yrx AND Grx PATHWAYS 447
( a ) (b )
0.8
0.4
. ~ 0.0
-0.4
~ -0.8 O
-1.2
y = 0.16x - 4.50 0 .5 '
r 2 = 0.98 0.0,
* -02; '
-1.0,
-1.5,
-2.0 '
- 2 . 5
-3.0 22 24 26 28 30 32
P C R cycles
y = l.OOx - 3.10 r 2 = 0.98 •
0.5 1.0 1.5 2.0 2.5 3.0
log R N A f r o m WT
(c) 0.0.
-0.5.
-1.0'
-1.5'
-2.0'
-2.5.
-3.0.
-3.5'
y = 1.05x - 3.62 r 2 = 1.00 / /
0.5 1.0 t.s 2.0 2.5 3.0
log R N A f r o m WT
(d) 3.0'
2.5.
2.0.
1.5.
1.0.
0.5.
0.0'
000x9 180
- l . 0 - 0 . 5 0.0 0.5 1.0 1.5
log CYP1A R N A
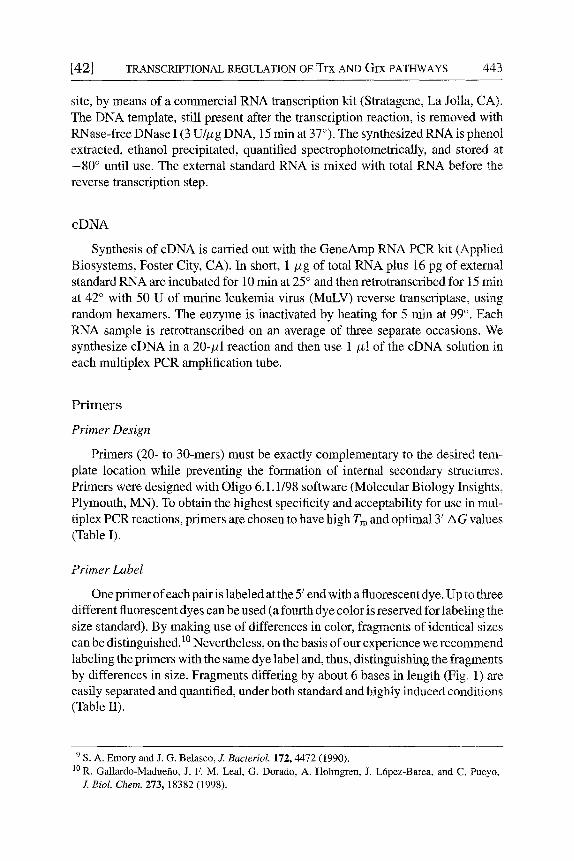
FIG. 2. C-type (a) T-type (b-d) multiplex PCR. In (a), a single cDNA sysnthesis reaction was undertaken with a fixed amount (1 #g) of total RNA from wild-type bacteria (UC5710) and a fixed amount (16 pg) of the extemai standard (CYP1A). Synthesized cDNA was then amplified for 22 to 32 cycles. To analyze the results, the log values of the ratios of the fluorescent signal of each sequence to that of gapA (internal standard) were plotted against the number of PCR cycles. Data are illustrated by representing the regression line of the grxA/gapA ratio plot. The slope values ranged from 0.07 (grxC/gapA) to 0.22 (oxyS/gapA); correlation coefficient values were r 2 > 0.97. In (b) and (c), six separate cDNA synthesis reactions were undertaken with increasing amounts (ng) of total RNA from wild-type bacteria (UC5710). The final amount of RNA was kept equal to 1 #g by adding decreasing quantities of RNA from a AgrxA mutant (UC848) (b) or decreasing quantities of human lung RNA (c). In (b), the log values of the grxAIgapA ratio were plotted against the log values of the amount of total RNA from UC5710. In (c), the log values of the ratios of the fluorescent signal of each sequence to that of CYP1A (external standard) were plotted against the log values of the amount of total tLNA from UC5710. Data are illustrated by representing the regression line of the grxA/CYP1A ratio plot. The slope values ranged from + 1.04 (grxC/CYP1A) to + 1.15 (nrdA/CYP1A); correlation coefficient values were r 2 _< 0.97. In (d), six separate cDNA synthesis reactions were undertaken with increasing amounts (pg) of the external standard (CYP1A) and a fixed amount of total RNA (1/xg) from wild-type bacteria (UC5710). The log values of the ratios of the fluorescent signal of each sequence to that of CYP1A were plotted against the log values of the amount of CYP1A RNA. Data are illustrated by representing the regression line of the grxA/CYP1A ratio plot. The slope vaiues ranged from -0.89 (nrdA/CYP1A) to - 1.04 (trxC/CYP1A); correlation coefficient values were r a > 0.96. Coamplification took place for 27 cycles in (b), (c), and (d).

448 THIOREDOXlN [42]
standard. The best standard is a gene whose expression level remains constant un- der the experimental conditions studied. We routinely use as internal standard (also named reference, control, or housekeeping gene) the gapA gene, which encodes D-glyceraldehyde-3-phosphate dehydrogenase, a key enzyme of both the glycolytic and gluconeogenic pathways. Nevertheless, it cannot be taken for granted that the control gene will maintain a steady level of expression under all circumstances, n Hence, an in vitro-synthesized RNA must also be included as external standard to control, by means of either competitive or noncompetitive RT-PCR strategies, the potential variability of the reference gene. As external standard we have used a frag- ment of a gene (CYPIA which encodes cytochrome P4501A from Liza aurata) with no homology with the bacterial genome and/or a laboratory-engineered fragment of the gapA gene. 8,u Although the CYPIA noncompetitor heterologous standard is as useful as the gapA competitor to monitor changes in the expression level of the reference gene, the competitor has the additional advantage of sharing with the reference gene idential PCR primer-binding sites.
Statistical Analysis
Samples for comparison of different experimental conditions or different bacte- rial strains must be handled in parallel. Data are presented as the means 4- standard errors of the means (SEM) from n _> 6 multiplexed PCR amplifications. Statis- tical comparisons are done by a hierarchical analysis of variance test that consider treatment (or bacterial mutant strain) and RNA as sources of variations.
O p t i m i z a t i o n of Mul t ip l ex Reve r se T r a n s c r i p t i o n - P o l y m e r a s e C h a i n R e a c t i o n
Any attempt to quantitate mRNA levels by PCR must be limited to the anal- ysis of products generated only during the exponential phase of amplification. Theoretically, within the exponential phase, PCR products accumulate according to Eqs. (1) and (2),
Zn = T0(I + ET) n (l)
S, = S0(1 + ES)" (2)
where the initial amounts (before PCR) of T (target) and S (standard) sequences are designated as To and So, the amounts of products following a number n of PCR cycles as Tn and Sn, and the mean efficiencies as E T and E s, respectively. Making a ratio of both equations and taking the logarithm, we obtain
log(Tn/Sn) = log To - log So + n log[(1 + ET)/(1 + Es)] (3)
11 M. Manchado, C. Mich~n, and C. Pueyo, Z Bacteriol. 182, 6842 (2000).

[42] TRANSCRIPTIONAL REGULATION OF Trx AND G r x PATHWAYS 449
The exponential phase of the multiplex RT-PCR is defined by using two variants (C- and T-type) of RT-PCR, which were initially developed for absolute quantifi- cation of mRNA level. 12
C-Type and T-Type Multiplex Polymerase Chain Reaction
In the C-type RT-PCR variant, the amounts of target RNA and standard RNA are kept constant and the number of PCR cycles is altered. According to Eq. (3), straight lines having slope values within the range - log 2 (E T = 0 and E s = 1) to +log 2 (E T = 1 and E s = 0) are expected if E z and E s values remain constant in the course of the PCR amplification process. As exemplified in Fig. 2a for the grxA/gapA ratio, data from the C-type variant must be consistent with these theoretical predictions, hence demonstrating that PCR amplification efficiencies for all targets and standards remain unchanged in the reactions along the 10 PCR cycles that were undertaken.
In the T-type RT-PCR variant, the amount of target RNA (or external stan- dard RNA) in the RT-PCR is altered, keeping the amount of standard RNA (or target RNA) and the number of PCR cycles constant. According to Eq. (3), straight lines having a slope of +1 in case of serial dilutions for To or a slope of - 1 in the case of serial dilutions for So, are expected if E T and E s values remain con- stant (or change in such a way that the ratio [(1 + ET)/(1 + ES)] remains constant). As exemplified in Fig. 2b for the grxA/gapA ratio, and in Fig. 2c and d for the grxA/CYP1A ratio, data from the T-type variant must fulfill these theoretical pre- dictions. Of particular note is that, in contrast to C-type RT-PCR, T-type reactions detect changes in the efficiency of both cDNA synthesis and PCR amplification.
Both C- and T-type variants must be undertaken to test the fundamental assumption of RT-PCR: the initial ratio of target RNA copies to standard RNA copies is maintained throughout the RT-PCR process.
App l i ca t i on
Once the multiplex RT-PCR is optimized and the exponential amplification phase is precisely defined, the methodology can be used with confidence to detect from small variations to an at least 100-fold difference in the in vivo expression of the selected target genes. The examples in Table II serve to illustrate the potency of this technique.
Table II analyzes the expression profile of the genes in response to oxidative stress by H 2 0 2. As shown, treatment with H202 ( 3 0 / . t m , 1 min) did not have the same effect on all RNA species. Hence, while no significant changes in mRNA levels were found for 4 (grxB, grxC, trxA, and nrdA) of the 11 target genes, highly
12 j. Zhang, M. Desai, S. E. Ozanne, C. Doherty, C. N. H~es, and C. D. Byrne, Biochem. Z 321, 769 (1997).

450 THIOREDOXlN [421
significant (p < 0.01) variations (from 3.1- to 99.2-fold) were quantified for the transcripts of the remaining 7 (grxA, gorA, trxC, trxB, nrdE, oxyS, and soxS) loci.
The role of OxyR in the upregulation of grxA, gorA, trxC, trxB, and nrdE genes on exposure to H202 was further explored by studying the effect of the constitutive oxyR2 mutant allele on basal levels of expression. As shown in Table II, transcription ofgrxA, gorA, trxC, and trxB is upregulated in the constitutive strain, thus indicating an OxyR-dependent regulation. In contrast, no upregulation ofnrdE gene is observed in the strain with the constitutive oxyR2 mutation, indicating that OxyR is not involved in its response to H202. Transcription of oxyS was as expected from an OxyR-regulated gene, and transcription of soxS was in agreement with our finding that the SoxR/S response, which protects cells against superoxide toxicity, is triggered also by H202, in an OxyR-independent, yet SoxR-dependent, manner.11
It is important to note that the ratio of the fluorescent signal of the CYPIA RNA (external standard) to that of the gapA transcript (internal standard) remained constant in the experiments outlined in Table II, hence ensuring that changes detected with reference to the housekeeping gapA gene are properly attributed to variations in the expression levels of the target genes under analysis.
F ina l R e m a r k s
The main goals in gene expression studies are to compare the steady state levels of a group of specific transcripts among cell types or strains, and to quantify the effect of particular stimuli on the expression of these genes. As shown here, our multiplex RT-PCR procedure is in practice a quick, reliable, and robust method- ology for precise relative quantification of in vivo gene expression. In addition, because of the PCR amplification step, our method displays a much higher sen- sitivity than that of current techniques for mRNA quantitation, such as Northern blotting or primer extension analyses.
By employing the multiplex RT-PCR technique, as detailed above, we have obtained evidences that transcription of genes that encode several components of both thioredoxin (trxC and trxB) and glutaredoxin/GSH (grxA and gorA) systems are induced by oxidative stress, in an OxyR-dependent manner. 8 In contrast, tran- scription of the nrdAB operon is not induced by oxidative stress, yet it is induced by hydroxyurea (an inhibitor of RRase) or when the NrdAB enzyme must operate in the absence of its two main reductants (Trx 1 and Grx 1).8' 10 Comparatively, tran- scription of the nrdHIEF operon is readily induced by oxidative stress, although in both an OxyR- and SoxR/S-independent manner. 13 Our multiplex RT-PCR protocol is a versatile technique that should be easily applicable to many other situations and cell types in which it would be desirable to measure accurately and
13 E Monje-Casas, J. Jurado, M. J. Prieto-.Alamo, A. Holmgren, and C. Pueyo, J. Biol. Chem. 276, 18031 (2001).
[43] THIOREDOXIN REDUCTASE AND CELL SIGNALING 45 t
reproducibly differences in the transcript levels of genes encoding proteins that protect cells against reactive oxygen species toxicity and for related enzymes.
A c k n o w l e d g m e n t s
This work was subsidized by Grant PB98-1627 (DGES). J. lurado and M.-J. Prieto-Alamo are recipients of postdoctoral contracts from the Ministerio de Educaci6n y Cultura, and F. Monje-Casas is a predoctoral fellow from the Junta de Andalucfa. We thank M. Manchado and G. Dorado for helpful
discussions regarding the method.
[43] Redox Regulation of Cell Signaling by Thioredoxin Reductases
By QI-AN SUN and VADLM N. GLADYSHEV
I n t r o d u c t i o n
Mammalian thioredoxin reductases (TRs) are central enzymes in the thiore- doxin (Trx) redox pathway. These proteins are FAD-containing pyridine nucleotide disulfide oxidoreductases that utilize NADPH for reduction of active-site disul- fide of Trx.1 Three mammalian TR isozymes and their alternative splicing forms have been identified, 2'3 with TR14 (also called TRa 5 and TrxR16) being a cytoso- lic enzyme, TR3 (also called TRfl 5 and TrxR26) being a mitochondrial enzyme, and TR2 (also called Trx and glutathione reductase, TGR 7) being an isozyme that has been detected only in mouse testes. 2'7 The three mammalian TRs contain conserved selenocysteine (Sec), encoded by TGA, at the C-terminal penultimate position, which is essential for catalytic activities of the enzymes (Fig. l). The rea- sons why this rare amino acid residue rather than cysteine (Cys) is utilized for TR function are beginning to emerge. Sec is a better nucleophile than sulfur and, under
1 A. Holmgren, J. Biol. Chem. 264, 13963 (1989). 2 Q.-A. Sun, Y. Wu, E Zappacosta, K.-T. Jeang, B. J. Lee, D. L. Hatfield, and V. N. Gladyshev,
J. Biol. Chem. 274, 24522 (1999). 3 Q.-A. Sun, E Zappacosta, V. M. Factor, R J. Wirth, D. L. Hatfield, and V. N. Gladyshev, J. Biol.
Chem. 276, 3106 (2001). 4 V. N. Gladyshev, K.-T. Jeang, and T. C. Stadtman, Proc. Natl. Acad Sci. U.S.A. 93, 6146 (1996). 5 R Y. Gasdaska, M. M. Berggren, M. J. Berry, and G. Powis, FEBS Letr 442, 105 (1999). 6 S.-R. Lee, J.-R. Kim, K.-S. Kwon, H W. Yoon, R. L. Levine, A. Ginsburg, and S. G. Rhee, J. Biol.
Chem. 274, 4722 (1999). 7 Q.-A. Sun, L. Kirnarsky, S. Sherman, and V. N. Gladyshev, Proc. Natl. Acad. Sci. U.S.A. 98, 3673
(2001).
Copyright © 2002 by Academic Press. AII rights of reproduction in any form reserved.
METHODS IN ENZYMOLOGY. VOL. 347 0076-6879/02 $35.00
Related Documents