Signal Processing 87 (2007) 1772–1780 Multiple STFT-based approach for chaos detection in oscillatory circuits Igor Djurovic´ , Vesna Rubezˇic´ Electrical Engineering Department, University of Montenegro, Podgorica 81000, Montenegro Received 25 September 2006; received in revised form 10 December 2006; accepted 29 January 2007 Available online 11 February 2007 Abstract This paper deals with the recently proposed detector of chaotic states in nonlinear oscillatory circuits. [V. Rubezˇic´, I. Djurovic´, M. Dakovic´, Time-frequency representations based detector of chaos in oscillatory circuits, Signal Processing 86(9) (September 2006) 2255–2270]. The detector is based on time-frequency (TF) representations of signals generated by oscillators. It can be realized by using cross-terms free (or reduced) representations such as the short-time Fourier transform (STFT). It has been noticed that its accuracy substantially depends on the applied window width used in the TF representation. The subject of this paper is the accuracy analysis of such detector in the noisy environment with respect to the window width in the TF representation. Based on this analysis a multiple STFT-based approach has been proposed producing better results than its single window counterpart. r 2007 Elsevier B.V. All rights reserved. Keywords: Chaos detection; Spectrogram; Time-frequency signal analysis; Window function 1. Introduction Nonlinear systems may exhibit chaotic behavior under specific conditions. Chaos has been noticed in electric circuits and systems, mechanical, optical and other systems, as well as in nature [1–5]. Detection and possible prediction of chaotic beha- vior have attracted significant attention of research- ers for a long time. There are several techniques for chaos detection. The most frequently used techni- que is calculation of Lyapunov’s exponents [6–8]. Existence of at least one positive Lyapunov’s exponent confirms chaos. Calculation of these exponents requires a signal of long duration. In addition, these exponents are very sensitive to noise influence. This makes them unsuitable for classifica- tion of signals with fast variations in time. Chaos detection based on topological and information measures of attractors reconstructed from the available data is analyzed in [9]. Alternative techniques, based on detection of nonlinearity and short-term predictability, are proposed in [10–12]. The main disadvantage of these techniques is calculation complexity. Nonlinear oscillatory circuits are an important group of nonlinear systems that could have chaotic behavior. In periodic regime these circuits produce signals that can be represented as a sum of several sinusoidal components, i.e., as a sum of Dirac pulses ARTICLE IN PRESS www.elsevier.com/locate/sigpro 0165-1684/$ - see front matter r 2007 Elsevier B.V. All rights reserved. doi:10.1016/j.sigpro.2007.01.028 Corresponding author. Tel.: + 381 67 257 155; fax: + 381 81 244 921. E-mail addresses: [email protected] (I. Djurovic´), [email protected] (V. Rubezˇ ic´ ).

Welcome message from author
This document is posted to help you gain knowledge. Please leave a comment to let me know what you think about it! Share it to your friends and learn new things together.
Transcript
ARTICLE IN PRESS
0165-1684/$ - se
doi:10.1016/j.si
�Correspondfax: +381 81 2
E-mail addr
Signal Processing 87 (2007) 1772–1780
www.elsevier.com/locate/sigpro
Multiple STFT-based approach for chaos detection inoscillatory circuits
Igor Djurovic�, Vesna Rubezic
Electrical Engineering Department, University of Montenegro, Podgorica 81000, Montenegro
Received 25 September 2006; received in revised form 10 December 2006; accepted 29 January 2007
Available online 11 February 2007
Abstract
This paper deals with the recently proposed detector of chaotic states in nonlinear oscillatory circuits. [V. Rubezic, I.
Djurovic, M. Dakovic, Time-frequency representations based detector of chaos in oscillatory circuits, Signal Processing
86(9) (September 2006) 2255–2270]. The detector is based on time-frequency (TF) representations of signals generated by
oscillators. It can be realized by using cross-terms free (or reduced) representations such as the short-time Fourier
transform (STFT). It has been noticed that its accuracy substantially depends on the applied window width used in the TF
representation. The subject of this paper is the accuracy analysis of such detector in the noisy environment with respect to
the window width in the TF representation. Based on this analysis a multiple STFT-based approach has been proposed
producing better results than its single window counterpart.
r 2007 Elsevier B.V. All rights reserved.
Keywords: Chaos detection; Spectrogram; Time-frequency signal analysis; Window function
1. Introduction
Nonlinear systems may exhibit chaotic behaviorunder specific conditions. Chaos has been noticed inelectric circuits and systems, mechanical, opticaland other systems, as well as in nature [1–5].Detection and possible prediction of chaotic beha-vior have attracted significant attention of research-ers for a long time. There are several techniques forchaos detection. The most frequently used techni-que is calculation of Lyapunov’s exponents [6–8].Existence of at least one positive Lyapunov’s
e front matter r 2007 Elsevier B.V. All rights reserved
gpro.2007.01.028
ing author. Tel.: +381 67 257 155;
44 921.
esses: [email protected] (I. Djurovic),
u (V. Rubezic).
exponent confirms chaos. Calculation of theseexponents requires a signal of long duration. Inaddition, these exponents are very sensitive to noiseinfluence. This makes them unsuitable for classifica-tion of signals with fast variations in time. Chaosdetection based on topological and informationmeasures of attractors reconstructed from theavailable data is analyzed in [9]. Alternativetechniques, based on detection of nonlinearity andshort-term predictability, are proposed in [10–12].The main disadvantage of these techniques iscalculation complexity.
Nonlinear oscillatory circuits are an importantgroup of nonlinear systems that could have chaoticbehavior. In periodic regime these circuits producesignals that can be represented as a sum of severalsinusoidal components, i.e., as a sum of Dirac pulses
.
ARTICLE IN PRESSI. Djurovic, V. Rubezic / Signal Processing 87 (2007) 1772–1780 1773
in spectral domain. In a chaotic regime, numerousadditional components in spectral domain can beobserved and signal spectrum is broadband andnoise-like. This difference between spectral contentof signals from nonlinear chaotic oscillators is usedin [1], where an efficient algorithm for detection ofchaotic states in nonlinear oscillatory circuits hasbeen recently proposed. The proposed detector isbased on the specific measure of concentration oftime-frequency (TF) signal representation. Theshort-time Fourier transform (STFT) has been usedin [1] for design of the detector but other TF ortime-scale distributions can be used with the sameor slightly different algorithm setup. Here, resultsobtained using the S-method [13,14] are demon-strated. An interesting favorable property of thisdetector is a fact that its application is not limited tononlinear oscillators, since similar behavior ofsignals in spectral domain can be observed in someother common chaotic systems such as Lorenz,Rossler, Duffing and logistic map.
Influence of the window width, applied in thecalculation of the TF representations, to thedetector accuracy for noisy environment is analyzedin this paper. It has been shown that a widerwindow in the TF representations produces resultsrobust to noise influence. However, a wide windowcan produce wrong classification of instants close tothe periodic regime border. Narrower windowproduces an opposite behavior. The influence ofnoise is more emphatic for narrow windows, whilesamples close to the periodic state borders areclassified with higher accuracy. This suggestsexistence of an optimal window width for a givencircuit and noisy environment. Optimal windowcould accurately classify samples from the periodicregime close to the border under influence ofmoderate amount of additive noise. However,determination of the optimal window width is nota trivial task. Instead of an elaborate procedure fordetermination of the optimal window width, wepropose here a multiple STFT-based approach fordetection of chaotic states. In this algorithm theSTFT-based detector of the chaotic state is appliedwith different window widths used in the STFT.Results obtained with different STFTs are com-bined in order to classify samples of the signals fromchaotic oscillators. This is different from thetraditional multiwindow techniques [15–18], wherefeature of signals are extracted from a TF repre-sentation obtained as a weighted sum of the STFTcalculated with different window functions. The
proposed approach outperforms the constant win-dow size detectors in our experiments.
The paper is organized as follows. A briefoverview of the STFT-based detector of chaoticstate is presented in Section 2. Influence of theapplied window width is studied in Section 3.Multiple STFT-based approach is proposed inSection 4. Numerical examples and accuracy ofdetector study is presented in Section 5. Concludingremarks are given in Section 6.
2. Detector based on the STFT—an overview
Here we briefly review the chaos detector basedon the STFT proposed in [1]. By varying some ofthe circuit parameters chaotic oscillators can passthrough different periodic and chaotic states. Inperiodic regime, chaotic oscillator produces signalthat can be represented as a sum of severalsinusoidal components. In chaotic regime, signal isbroadband and noise like with numerous additionalcomponents. Details on spectral behavior of chaoticsignals can be found in [19].
Detector proposed in [1] estimates oscillator statebased on specific concentration measure of the partof the TF representation between the directcomponent and the main harmonic. The STFT, asa cross-term free TF representation, is used in [1]as a main tool in this detector. The STFT is definedas [20]:
STFTðt; f Þ ¼
Z 1�1
xðtþ tÞwðtÞe�j2pf t dt, (1)
where xðtÞ is signal of interest (in this paper, it is avoltage or a current from the electric circuit), andwðtÞ is the window function, where wðtÞ ¼ 0 forjtj4T=2 and T is window width. In order toavoid complex-valued STFT, we use its squaredmagnitude, i.e., the spectrogram SPECðt; f Þ ¼jSTFTðt; f Þj2. Within numerical study we willconsider a bilinear representation from the Cohenclass called the S-method that can be realized basedon the STFT without signal oversampling [13,14]:
SMðt; f Þ ¼
Z 1�1
PðyÞSTFTðt; f þ yÞSTFTnðt; f � yÞdy.
(2)
A frequency window PðyÞ determines fundamentalproperties of the S-method. Namely, for PðyÞ ¼pdðyÞ the spectrogram follows. This is a cross-termsfree (or reduced) representation, but signal compo-nents in the TF plane are not highly concentrated.
ARTICLE IN PRESS
1Half of the DC is in negative frequency region.
I. Djurovic, V. Rubezic / Signal Processing 87 (2007) 1772–17801774
However, a wide frequency window, PðyÞ ¼ 1,produces the Wigner distribution with highlyconcentrated components but with emphatic cross-terms [13]. Then, window of relatively small widthPðyÞ ¼ 1 for jyjpY, and PðyÞ ¼ 0 for jyj4Y, cancause that we obtain highly concentrated signalcomponents as in the Wigner distribution butwithout cross-terms.
We assume that a signal in periodic regime isrepresented with a sum of finite number of sinusoids(or signals with slight variations in frequency).However, the signal in the chaotic regime is broad-band and noise like. It means that in spectraldomain the signal content for periodic regime wouldbe spread over the entire frequency domain. Thisconsideration motivates the specific measure ofchaotic state for signals from oscillatory circuitsbased on counting samples with high energybetween DC (direct current—frequency f ¼ 0) anddominant frequency component (or just the firstharmonic component). Note that the proposedalgorithm is efficient and it can separate chaoticregime from the moderate amount of noise, as it willbe shown in the simulations section.
The concentration measure of TF representationsdefined in [1] is given as
mðtÞ ¼
Z f mðtÞ
0
uOðtÞðt; f Þdf , (3)
where f mðtÞ is a frequency of the main spectralcomponent, determined as the position of theTFðt; f Þ maxima:
f mðtÞ ¼ arg maxf
TFðt; f Þ. (4)
Function uOðtÞðt; f Þ is given as
uOðtÞðt; f Þ ¼1; TFðt; f ÞXOðtÞ;
0 elsewhere;
((5)
where threshold OðtÞ is selected in such a mannerthat values of the TF representation with magnitudegreater than OðtÞ contain the given percentage ofsignal energy, typically 99:5299:9%. Decision of thesystem state is made by comparing detectorresponse function mðtÞ with detector threshold CðtÞ:
dT ðtÞ ¼1 for mT ðtÞXCT ðtÞ chaotic regime;
0 for mT ðtÞoCT ðtÞ periodic regime;
(
(6)
where index T indicates that both detector responseand threshold depend on the window width used in
the STFT calculation. Note that both representa-tions, the spectrogram and the S-method, arecalculated using the STFT. Detection thresholdCT ðtÞ is calculated as an arithmetic mean betweenthe expected detector responses in chaotic andperiodic regimes. In chaotic regime we expect thatthe TF representation in the entire interval 0; f mðtÞ
� �is above the threshold OðtÞ. Then, the expecteddetector response for this regime is f mðtÞ. For theperiodic regime we assume that only the mainspectral and DC components are above OðtÞ in theconsidered interval, producing the expected detec-tion response for this regime approximately1:5FwðTÞ,
1 where FwðTÞ is the width of the mainlobe of the window function in spectral domain thatdepends on the used window type wðtÞ and its widthT. Then, the detector threshold is
CT ðtÞ ¼f mðtÞ þ 1:5FwðTÞ
2. (7)
The algorithm is summarized in Table 1.
3. Influence of window width to detector accuracy
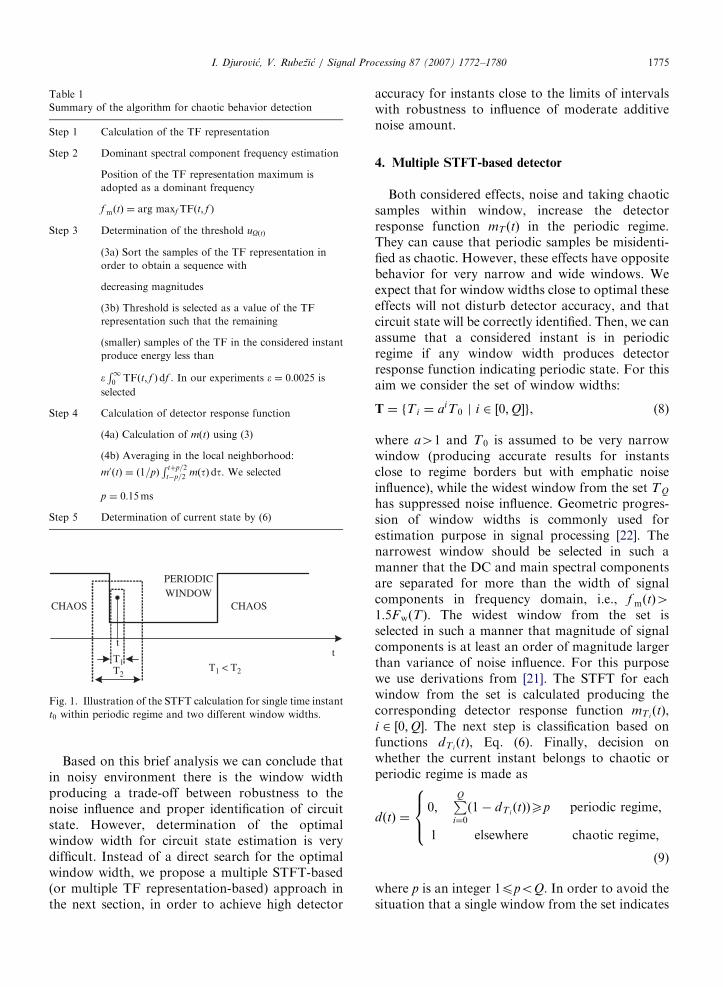
Influence of window width to the detectoraccuracy will be considered within a demonstrativeexample. Let us consider the time instant t0 that isclose to the periodic regime border in Fig. 1. Thewide window ðT2Þ contains samples from bothperiodic and chaotic regimes. This causes that thedetector response function mT ðtÞ increases and if itincreases above the detector threshold CT ðtÞ thissample can be misidentified as chaotic. However,narrow window (T1) contains only samples fromperiodic regime. Then, for narrow window instant t0would be properly identified as being withinperiodic regime. From this analysis follows thatthe narrow windows are optimal for periodic regimedetection. However, this conclusion is valid only fornon-noisy environment. Note that a very importantproperty of chaos detection systems is to distinguishchaos regime from noise. Namely, it has been shownin [21] that ability of feature extraction from theSTFT for noisy environment improves with increas-ing the window width. This behavior is caused byincreasing the ratio of the amplitude of signalcomponents in the TF representation to the noisevariance by increasing the width of the used windowfunction [21].
ARTICLE IN PRESS
Table 1
Summary of the algorithm for chaotic behavior detection
Step 1 Calculation of the TF representation
Step 2 Dominant spectral component frequency estimation
Position of the TF representation maximum is
adopted as a dominant frequency
f mðtÞ ¼ arg maxf TFðt; f Þ
Step 3 Determination of the threshold uOðtÞ
(3a) Sort the samples of the TF representation in
order to obtain a sequence with
decreasing magnitudes
(3b) Threshold is selected as a value of the TF
representation such that the remaining
(smaller) samples of the TF in the considered instant
produce energy less than
eR10 TFðt; f Þdf . In our experiments e ¼ 0:0025 is
selected
Step 4 Calculation of detector response function
(4a) Calculation of mðtÞ using (3)
(4b) Averaging in the local neighborhood:
m0ðtÞ ¼ ð1=pÞR tþp=2
t�p=2 mðtÞdt. We selected
p ¼ 0:15ms
Step 5 Determination of current state by (6)
CHAOS CHAOS
t
T1T2
PERIODICWINDOW
t
T1 < T2
Fig. 1. Illustration of the STFT calculation for single time instant
t0 within periodic regime and two different window widths.
I. Djurovic, V. Rubezic / Signal Processing 87 (2007) 1772–1780 1775
Based on this brief analysis we can conclude thatin noisy environment there is the window widthproducing a trade-off between robustness to thenoise influence and proper identification of circuitstate. However, determination of the optimalwindow width for circuit state estimation is verydifficult. Instead of a direct search for the optimalwindow width, we propose a multiple STFT-based(or multiple TF representation-based) approach inthe next section, in order to achieve high detector
accuracy for instants close to the limits of intervalswith robustness to influence of moderate additivenoise amount.
4. Multiple STFT-based detector
Both considered effects, noise and taking chaoticsamples within window, increase the detectorresponse function mT ðtÞ in the periodic regime.They can cause that periodic samples be misidenti-fied as chaotic. However, these effects have oppositebehavior for very narrow and wide windows. Weexpect that for window widths close to optimal theseeffects will not disturb detector accuracy, and thatcircuit state will be correctly identified. Then, we canassume that a considered instant is in periodicregime if any window width produces detectorresponse function indicating periodic state. For thisaim we consider the set of window widths:
T ¼ fTi ¼ aiT0 j i 2 ½0;Q�g, (8)
where a41 and T0 is assumed to be very narrowwindow (producing accurate results for instantsclose to regime borders but with emphatic noiseinfluence), while the widest window from the set TQ
has suppressed noise influence. Geometric progres-sion of window widths is commonly used forestimation purpose in signal processing [22]. Thenarrowest window should be selected in such amanner that the DC and main spectral componentsare separated for more than the width of signalcomponents in frequency domain, i.e., f mðtÞ41:5FwðTÞ. The widest window from the set isselected in such a manner that magnitude of signalcomponents is at least an order of magnitude largerthan variance of noise influence. For this purposewe use derivations from [21]. The STFT for eachwindow from the set is calculated producing thecorresponding detector response function mTi
ðtÞ,i 2 ½0;Q�. The next step is classification based onfunctions dTi
ðtÞ, Eq. (6). Finally, decision onwhether the current instant belongs to chaotic orperiodic regime is made as
dðtÞ ¼0;
PQi¼0
ð1� dTiðtÞÞXp periodic regime;
1 elsewhere chaotic regime;
8><>:
(9)
where p is an integer 1ppoQ. In order to avoid thesituation that a single window from the set indicates
ARTICLE IN PRESSI. Djurovic, V. Rubezic / Signal Processing 87 (2007) 1772–17801776
periodic regime p41 is used in our experiments.This is very important in order to keep accurateestimation of chaotic state, as it will be shown in thenext section.
5. Numerical study
We consider Chua’s circuit given in Fig. 2a withthe function of the corresponding nonlinear elementgiven in Fig. 2b, within so-called period doublingroute to chaos (for details related to this circuit androute to chaos see [19]). This route to chaos isproduced by varying parameter G (conductance of alinear resistor from the circuit). Increase of G causesthat circuit moves from periodic to chaotic regime.However, numerous periodic regions could existwithin chaotic regime. In our case we consider theChua circuit with the following set of parameters:L1 ¼ 18mH, C1 ¼ 10 nF, C2 ¼ 100 nF, Ga ¼
�757:576mS, Gb ¼ �409:091mS, E ¼ 1V, R0 ¼
12:5O. Periodic and chaotic regimes are created byvarying the parameter G. For G ¼ 530:12 mS wehave the circuit in the periodic regime while for G ¼
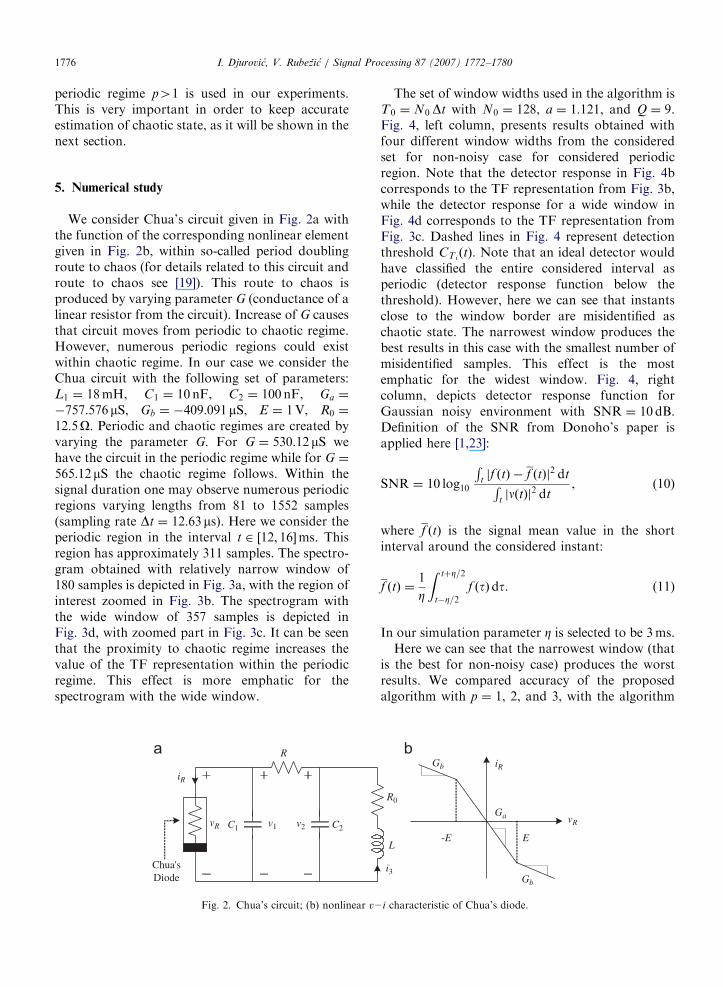
565:12mS the chaotic regime follows. Within thesignal duration one may observe numerous periodicregions varying lengths from 81 to 1552 samples(sampling rate Dt ¼ 12:63ms). Here we consider theperiodic region in the interval t 2 ½12; 16�ms. Thisregion has approximately 311 samples. The spectro-gram obtained with relatively narrow window of180 samples is depicted in Fig. 3a, with the region ofinterest zoomed in Fig. 3b. The spectrogram withthe wide window of 357 samples is depicted inFig. 3d, with zoomed part in Fig. 3c. It can be seenthat the proximity to chaotic regime increases thevalue of the TF representation within the periodicregime. This effect is more emphatic for thespectrogram with the wide window.
vR C1 C2
iR
v2v1
R
Chua'sDiode
a
Fig. 2. Chua’s circuit; (b) nonlinear v2
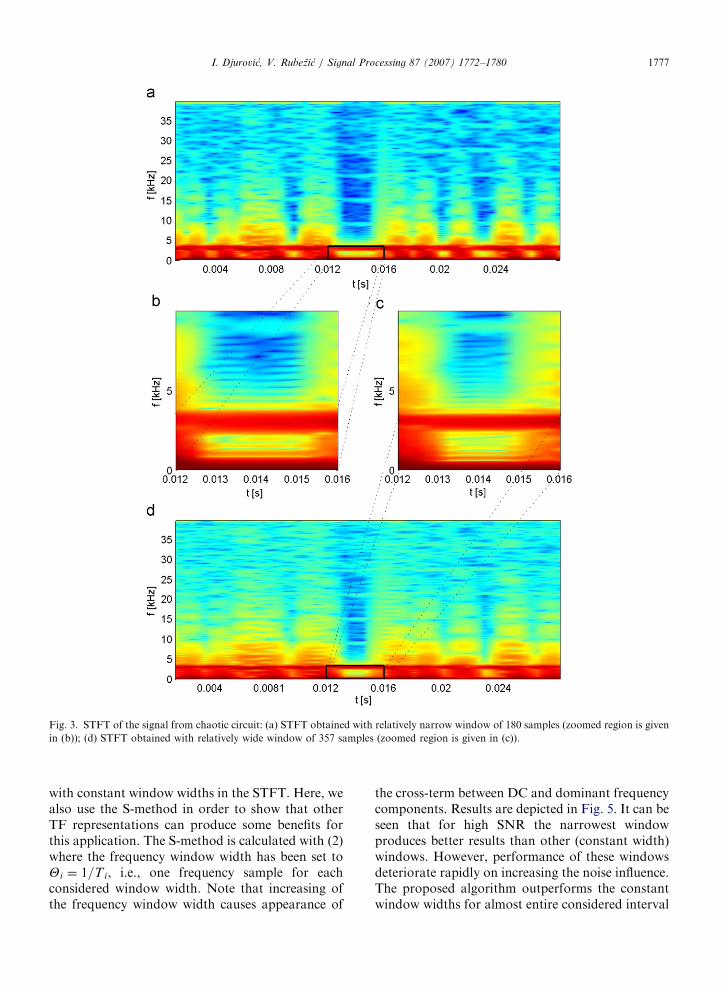
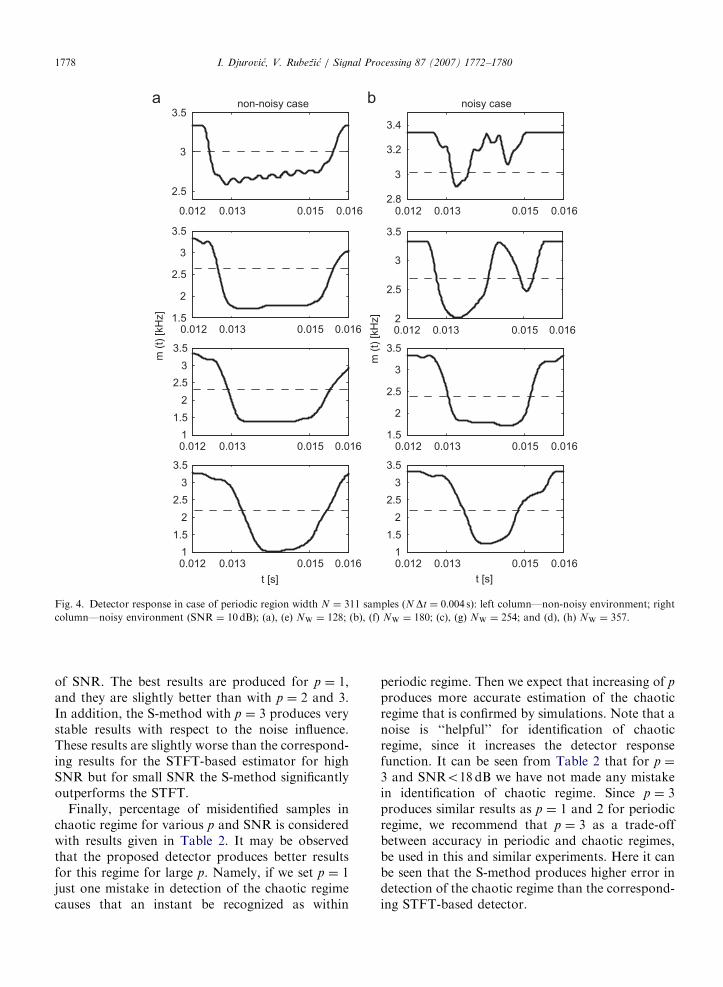
The set of window widths used in the algorithm isT0 ¼ N0 Dt with N0 ¼ 128, a ¼ 1:121, and Q ¼ 9.Fig. 4, left column, presents results obtained withfour different window widths from the consideredset for non-noisy case for considered periodicregion. Note that the detector response in Fig. 4bcorresponds to the TF representation from Fig. 3b,while the detector response for a wide window inFig. 4d corresponds to the TF representation fromFig. 3c. Dashed lines in Fig. 4 represent detectionthreshold CTi
ðtÞ. Note that an ideal detector wouldhave classified the entire considered interval asperiodic (detector response function below thethreshold). However, here we can see that instantsclose to the window border are misidentified aschaotic state. The narrowest window produces thebest results in this case with the smallest number ofmisidentified samples. This effect is the mostemphatic for the widest window. Fig. 4, rightcolumn, depicts detector response function forGaussian noisy environment with SNR ¼ 10 dB.Definition of the SNR from Donoho’s paper isapplied here [1,23]:
SNR ¼ 10 log10
Rtjf ðtÞ � f ðtÞj2 dtR
tjnðtÞj2 dt
, (10)
where f ðtÞ is the signal mean value in the shortinterval around the considered instant:
f ðtÞ ¼1
Z
Z tþZ=2
t�Z=2f ðtÞdt. (11)
In our simulation parameter Z is selected to be 3ms.Here we can see that the narrowest window (that
is the best for non-noisy case) produces the worstresults. We compared accuracy of the proposedalgorithm with p ¼ 1, 2, and 3, with the algorithm
R0
L
i3
Gb
Gb
vR
iR
Ga
E-E
b
i characteristic of Chua’s diode.
ARTICLE IN PRESS
Fig. 3. STFT of the signal from chaotic circuit: (a) STFT obtained with relatively narrow window of 180 samples (zoomed region is given
in (b)); (d) STFT obtained with relatively wide window of 357 samples (zoomed region is given in (c)).
I. Djurovic, V. Rubezic / Signal Processing 87 (2007) 1772–1780 1777
with constant window widths in the STFT. Here, wealso use the S-method in order to show that otherTF representations can produce some benefits forthis application. The S-method is calculated with (2)where the frequency window width has been set toYi ¼ 1=Ti, i.e., one frequency sample for eachconsidered window width. Note that increasing ofthe frequency window width causes appearance of
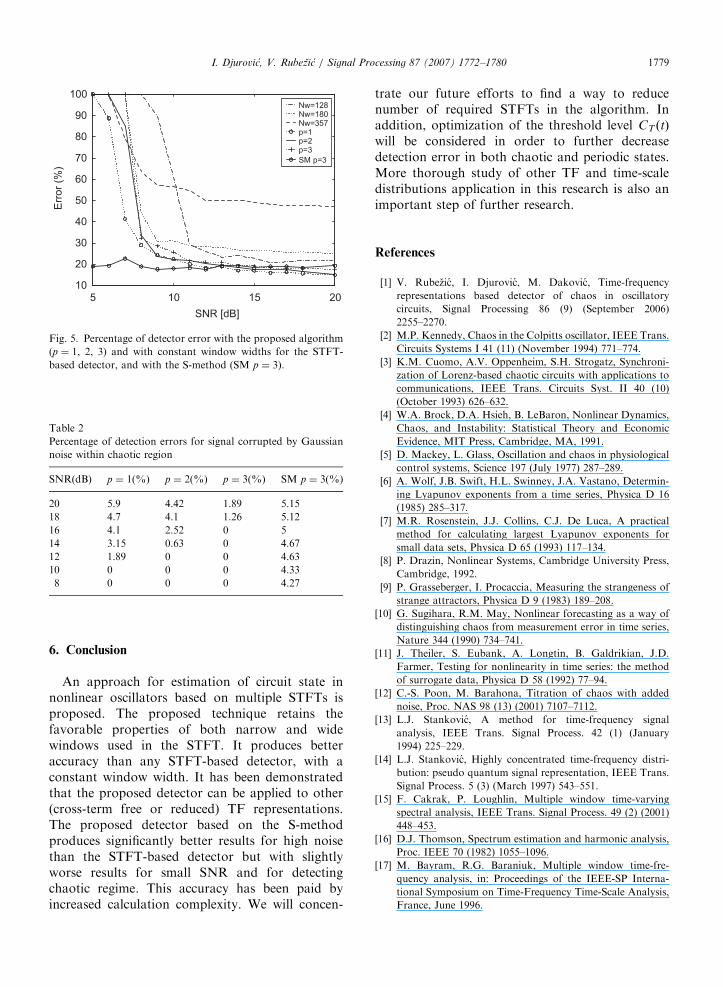
the cross-term between DC and dominant frequencycomponents. Results are depicted in Fig. 5. It can beseen that for high SNR the narrowest windowproduces better results than other (constant width)windows. However, performance of these windowsdeteriorate rapidly on increasing the noise influence.The proposed algorithm outperforms the constantwindow widths for almost entire considered interval
ARTICLE IN PRESS
0.012 0.013 0.015 0.016
2.5
3
3.5
0.012 0.013 0.015 0.0161.5
2
2.5
3
3.5
0.012 0.013 0.015 0.0161
1.5
2
2.5
3
3.5
0.012 0.013 0.015 0.0161
1.5
2
2.5
3
3.5
0.012 0.013 0.015 0.0162.8
3
3.2
3.4
0.012 0.013 0.015 0.0161.5
2
2.5
3
3.5
0.012 0.013 0.015 0.0161
1.5
2
2.5
3
3.5
0.012 0.013 0.015 0.0162
2.5
3
3.5
non-noisy case noisy case
m (
t) [kH
z]
m (
t) [kH
z]
t [s] t [s]
a b
Fig. 4. Detector response in case of periodic region width N ¼ 311 samples (N Dt ¼ 0:004 s): left column—non-noisy environment; right
column—noisy environment ðSNR ¼ 10 dBÞ; (a), (e) NW ¼ 128; (b), (f) NW ¼ 180; (c), (g) NW ¼ 254; and (d), (h) NW ¼ 357.
I. Djurovic, V. Rubezic / Signal Processing 87 (2007) 1772–17801778
of SNR. The best results are produced for p ¼ 1,and they are slightly better than with p ¼ 2 and 3.In addition, the S-method with p ¼ 3 produces verystable results with respect to the noise influence.These results are slightly worse than the correspond-ing results for the STFT-based estimator for highSNR but for small SNR the S-method significantlyoutperforms the STFT.
Finally, percentage of misidentified samples inchaotic regime for various p and SNR is consideredwith results given in Table 2. It may be observedthat the proposed detector produces better resultsfor this regime for large p. Namely, if we set p ¼ 1just one mistake in detection of the chaotic regimecauses that an instant be recognized as within
periodic regime. Then we expect that increasing of p
produces more accurate estimation of the chaoticregime that is confirmed by simulations. Note that anoise is ‘‘helpful’’ for identification of chaoticregime, since it increases the detector responsefunction. It can be seen from Table 2 that for p ¼
3 and SNRo18 dB we have not made any mistakein identification of chaotic regime. Since p ¼ 3produces similar results as p ¼ 1 and 2 for periodicregime, we recommend that p ¼ 3 as a trade-offbetween accuracy in periodic and chaotic regimes,be used in this and similar experiments. Here it canbe seen that the S-method produces higher error indetection of the chaotic regime than the correspond-ing STFT-based detector.
ARTICLE IN PRESS
5 10 15 2010
20
30
40
50
60
70
80
90
100
Err
or
(%)
Nw=128Nw=180Nw=357p=1p=2p=3
SM p=3
SNR [dB]
Fig. 5. Percentage of detector error with the proposed algorithm
(p ¼ 1, 2, 3) and with constant window widths for the STFT-
based detector, and with the S-method (SM p ¼ 3).
Table 2
Percentage of detection errors for signal corrupted by Gaussian
noise within chaotic region
SNR(dB) p ¼ 1(%) p ¼ 2(%) p ¼ 3(%) SM p ¼ 3(%)
20 5.9 4.42 1.89 5.15
18 4.7 4.1 1.26 5.12
16 4.1 2.52 0 5
14 3.15 0.63 0 4.67
12 1.89 0 0 4.63
10 0 0 0 4.33
8 0 0 0 4.27
I. Djurovic, V. Rubezic / Signal Processing 87 (2007) 1772–1780 1779
6. Conclusion
An approach for estimation of circuit state innonlinear oscillators based on multiple STFTs isproposed. The proposed technique retains thefavorable properties of both narrow and widewindows used in the STFT. It produces betteraccuracy than any STFT-based detector, with aconstant window width. It has been demonstratedthat the proposed detector can be applied to other(cross-term free or reduced) TF representations.The proposed detector based on the S-methodproduces significantly better results for high noisethan the STFT-based detector but with slightlyworse results for small SNR and for detectingchaotic regime. This accuracy has been paid byincreased calculation complexity. We will concen-
trate our future efforts to find a way to reducenumber of required STFTs in the algorithm. Inaddition, optimization of the threshold level CT ðtÞ
will be considered in order to further decreasedetection error in both chaotic and periodic states.More thorough study of other TF and time-scaledistributions application in this research is also animportant step of further research.
References
[1] V. Rubezic, I. Djurovic, M. Dakovic, Time-frequency
representations based detector of chaos in oscillatory
circuits, Signal Processing 86 (9) (September 2006)
2255–2270.
[2] M.P. Kennedy, Chaos in the Colpitts oscillator, IEEE Trans.
Circuits Systems I 41 (11) (November 1994) 771–774.
[3] K.M. Cuomo, A.V. Oppenheim, S.H. Strogatz, Synchroni-
zation of Lorenz-based chaotic circuits with applications to
communications, IEEE Trans. Circuits Syst. II 40 (10)
(October 1993) 626–632.
[4] W.A. Brock, D.A. Hsieh, B. LeBaron, Nonlinear Dynamics,
Chaos, and Instability: Statistical Theory and Economic
Evidence, MIT Press, Cambridge, MA, 1991.
[5] D. Mackey, L. Glass, Oscillation and chaos in physiological
control systems, Science 197 (July 1977) 287–289.
[6] A. Wolf, J.B. Swift, H.L. Swinney, J.A. Vastano, Determin-
ing Lyapunov exponents from a time series, Physica D 16
(1985) 285–317.
[7] M.R. Rosenstein, J.J. Collins, C.J. De Luca, A practical
method for calculating largest Lyapunov exponents for
small data sets, Physica D 65 (1993) 117–134.
[8] P. Drazin, Nonlinear Systems, Cambridge University Press,
Cambridge, 1992.
[9] P. Grasseberger, I. Procaccia, Measuring the strangeness of
strange attractors, Physica D 9 (1983) 189–208.
[10] G. Sugihara, R.M. May, Nonlinear forecasting as a way of
distinguishing chaos from measurement error in time series,
Nature 344 (1990) 734–741.
[11] J. Theiler, S. Eubank, A. Longtin, B. Galdrikian, J.D.
Farmer, Testing for nonlinearity in time series: the method
of surrogate data, Physica D 58 (1992) 77–94.
[12] C.-S. Poon, M. Barahona, Titration of chaos with added
noise, Proc. NAS 98 (13) (2001) 7107–7112.
[13] L.J. Stankovic, A method for time-frequency signal
analysis, IEEE Trans. Signal Process. 42 (1) (January
1994) 225–229.
[14] L.J. Stankovic, Highly concentrated time-frequency distri-
bution: pseudo quantum signal representation, IEEE Trans.
Signal Process. 5 (3) (March 1997) 543–551.
[15] F. Cakrak, P. Loughlin, Multiple window time-varying
spectral analysis, IEEE Trans. Signal Process. 49 (2) (2001)
448–453.
[16] D.J. Thomson, Spectrum estimation and harmonic analysis,
Proc. IEEE 70 (1982) 1055–1096.
[17] M. Bayram, R.G. Baraniuk, Multiple window time-fre-
quency analysis, in: Proceedings of the IEEE-SP Interna-
tional Symposium on Time-Frequency Time-Scale Analysis,
France, June 1996.
ARTICLE IN PRESSI. Djurovic, V. Rubezic / Signal Processing 87 (2007) 1772–17801780
[18] G. Frazer, B. Boashash, Multiple window spectrogram and
time-frequency distributions, in: Proceedings of IEEE
ICASSP, vol. 4, 1994, pp. 293–296.
[19] M.P. Kennedy, Three steps to chaos—Part II: a Chua’s
circuit primer, IEEE Trans. Circuits Systems 40 (10)
(October 1993) 657–674.
[20] B. Boashash (ed), Time frequency Signal Analysis and
Applications, Elsevier, Amsterdam, 2003.
[21] L.J. Stankovic, M. Dakovic, V. Ivanovic, Performance of
spectrogram as IF estimator, Electron. Lett. 37 (12) (June
2001) 797–799.
[22] V. Katkovnik, L.J. Stankovic, Periodogram with varying
and data-driven window length, Signal Processing 67 (3)
(June 1998) 345–358.
[23] D.L. Donoho, I.M. Johnstone, Adapting to unknown smooth-
ness via wavelet shrinkage, JASA 90 (432) (1995) 1200–1224.
Related Documents