Multiple States in Coastal Lagoons and Estuaries Next Steps Toward Understanding the Lagoons of the Yaqui Valley Next Steps Toward Understanding the Lagoons of the Yaqui Valley ldo Valle-Levinson do Valle-Levinson S. Monismith S. Monismith Juan Delgado Juan Delgado Esther Cruz Esther Cruz Bob C Bob C for Coastal Physical Oceanogr. Stanford University ITMAR Guaymas CECARENA Rutgers , Earth and Atmos. Sci. Dept. Guaymas University ominion University New Brunswick lk, Virginia N.J.

Multiple States in Coastal Lagoons and Estuaries Next Steps Toward Understanding the Lagoons of the Yaqui Valley Arnoldo Valle-LevinsonS. MonismithJuan.
Dec 20, 2015
Welcome message from author
This document is posted to help you gain knowledge. Please leave a comment to let me know what you think about it! Share it to your friends and learn new things together.
Transcript

Multiple States in Coastal Lagoons and Estuaries
Next Steps Toward Understanding the Lagoons of the Yaqui ValleyNext Steps Toward Understanding the Lagoons of the Yaqui Valley
Arnoldo Valle-LevinsonArnoldo Valle-Levinson S. MonismithS. Monismith Juan DelgadoJuan Delgado Esther CruzEsther Cruz Bob ChantBob ChantCtr. for Coastal Physical Oceanogr. Stanford University ITMAR Guaymas CECARENA RutgersOcean, Earth and Atmos. Sci. Dept. Guaymas UniversityOld Dominion University New BrunswickNorfolk, Virginia N.J.

(From Hearn and Sidhu, 2003)
When and how does the system switch?
Depends on density contrast

Inverse Estuary
Classical EstuaryLooking into the lagoon
Red = outflow
Blue = inflow
Guaymas Bay
OUT
OUTOUT
IN
IN

Mean Flow at Transect 4
red is inflow; blue is outflow (looking seaward)
NeapTides
Interface slope, spring tides ~ 2.5e-03 (25 m in 10 km)
Interface slope, neap tides ~ 2.0e-03 (18 m in 9 km)
Distance from Transect Origin (km)
WetSeason:Classical
DrySeason:Inverse
Importance:
Water and Soil(?) Quality
Climate Variability
OUT
OUT
IN
IN

The Global Heat and Salt Conveyor Belt
(From Broecker,1990; in Pinet, 1998)

Conservation of Salt and Heat
Relative influence of salinity and temperature on density gradients
Q
Freshwater
Precipitation
Outflow
Inflow
Se, Te
So, To
Heating
CLASSICAL
Q
Freshwater
Evaporation
Outflow
Inflow
Se, Te
So, To
Cooling
INVERSE

Relative influence of salinity and temperature on density gradients
Salinity influence
Temperature influence
Net influence
Q
In reality: kQ
Salinity influence
Temperature influence
Net influence
Q
T mode
S mode
Multiple states --- Stommel Transitions

Response dominated by salinity Response dominated by temperature

Salinity influence
Temperature influence
Net influence
Q
Critical response for multiple states
qQ 10
WDgQ 23
41
LWDg
Q
12
4
Guess for Tobari and Lobos

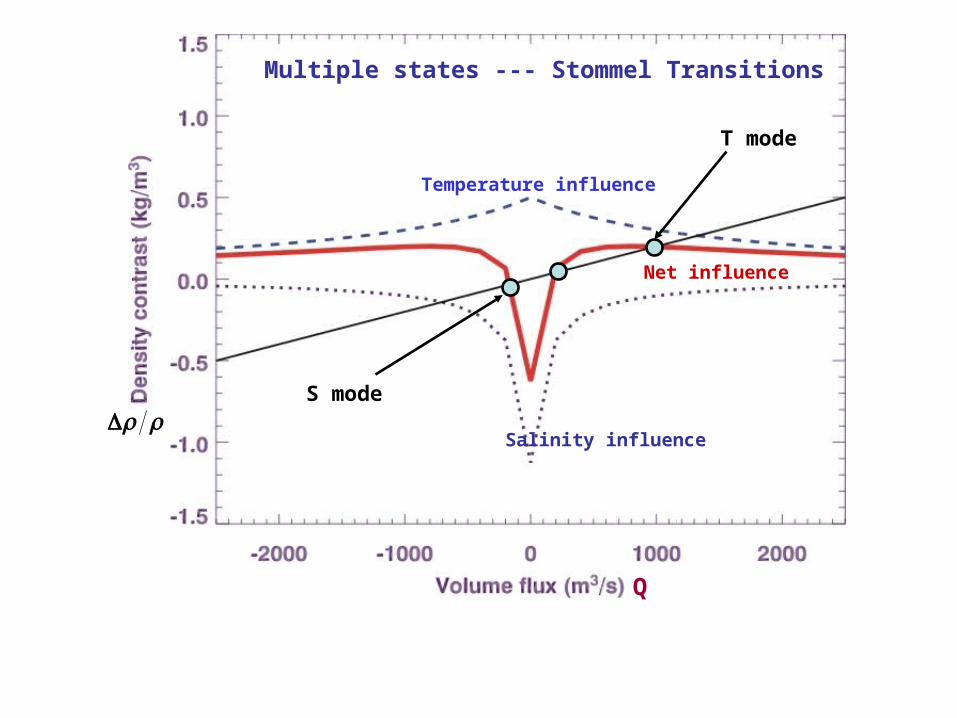
(Indicates Evaporation)(From Hearn and Sidhu, 2003)

(Indicates Evaporation)(From Hearn and Sidhu, 2003)

(From Hearn and Sidhu, 2003)
(From Hearn and Sidhu, 2003)

(Indicates Evaporation)
L = 15 km
L = 0.85*15 km
(From Hearn and Sidhu, 2003)

Shortening basin may prevent it from becoming INVERSE
(From Hearn and Sidhu, 2003)

Tobari’s causeway

Do Yaqui Valley lagoons/estuaries show ‘Stommel Transitions’?
Implications for water and soil quality…
Does causeway prevent INVERSE conditions?
What is the time scale of the Transitions?
Natural laboratory to examine climate variations
Are the systems in the Yaqui Valley more VULNERABLE to drought?
Related Documents