NATIONAL COOPERATIVE HIGHWAY RESEARCH PROGRAM REPORT MULTIPLE-SERVICE-LEVEL HIGHWAY BRIDGE RAILING SELECTION PROCEDURES AREAS OF INTEREST: FACILITIES DESIGN STRUCTURES DESIGN ANO PERFORMANCE (HIGHWAY TRANSPORTATION) (PUBLIC TRANSIT) CRAIL TRANSPORTATION) TRANSPORTATION RESEARCH BOARD NATIONAL RESEARCH COUNCIL WASHINGTON, D.C. NOVEMBER 1981 M. E. BRONSTAD AND J. D. MICHIE Southwest Research Institute San Antonio, Texas RESEARCH SPONSORED BY THE AMERICAN ASSOCIATION OF STATE HIGHWAY AND TRANSPORTATION OFFICIALS IN COOPERATION WITH THE FEDERAL HIGHWAY ADMINISTRATION

Welcome message from author
This document is posted to help you gain knowledge. Please leave a comment to let me know what you think about it! Share it to your friends and learn new things together.
Transcript
NATIONAL COOPERATIVE HIGHWAY RESEARCH PROGRAM 2~9 REPORT ~
MULTIPLE-SERVICE-LEVEL HIGHWAY BRIDGE RAILING SELECTION PROCEDURES
AREAS OF INTEREST:
FACILITIES DESIGN
STRUCTURES DESIGN ANO PERFORMANCE
(HIGHWAY TRANSPORTATION)
(PUBLIC TRANSIT)
CRAIL TRANSPORTATION)
TRANSPORTATION RESEARCH BOARD NATIONAL RESEARCH COUNCIL
WASHINGTON, D.C. NOVEMBER 1981
M. E. BRONSTAD AND J. D. MICHIE
Southwest Research Institute San Antonio, Texas
RESEARCH SPONSORED BY THE AMERICAN
ASSOCIATION OF STATE HIGHWAY AND
TRANSPORTATION OFFICIALS IN COOPERATION
WITH THE FEDERAL HIGHWAY ADMINISTRATION
NATIONAL COOPERATIVE HIGHWAY RESEARCH PROGRAM
Systematic, well-designed research provides the most effective approach to the solution of many problems facing highway administrators and engineers. Often, highway problems are of local interest and can best be studied by highway departments individually or in cooperation with their state universities and others. However, the accelerating growth of highway transportation develops increasingly complex problems of wide interest to highway authorities. These problems are best studied through a coordinated program of cooperative rese<irch. In recognition of these needs, the highway administrators of the American Association of State Highway and Transportation Officials initiated in 1962 an objective national highway research program employing modern scientific techniques. This program is supported on a continuing basis by funds from participating member states of the Association and it receives the full cooperation and support of the Federal Highway Administration, United States Department of Transportation. The Transportation Research Board of the National Research Council was requested by the Association to administer the research program because of the Board's recognized objectivity and understanding of modem research practices. The Board is uniquely suited for this purpose as: it maintains an extensive committee structure from which authorities on any highway transportation subject may be drawn; it possesses avenues of communications and cooperation with federal, state, and local governmental agencies, universities, and industry; its relationship to its parent organization, the National Academy of Sciences, a private, nonprofit institution, is an insurance of objectivity; it maintains a full-time research correlation staff of specialists in highway transportation matters to bring the findings of research directly to those who are in a position to use them. The program is developed on the basis of research needs identified by chief administrators of the highway and transportation departments and by committees of AASHTO. Each year, specific areas of research needs to be included in the program are proposed to the Academy and the Board by the American Association of State Highway and Transportation Officials. Research' projects to fulfill these needs are defined by the Board, and qualified research agencies are selected from those that have submitted proposals. Administration and surveillance of research contracts are the responsibilities of the Academy and its Transportation Research Board. The needs for highway research are many, and the National Cooperative Highway Research Program can make significant contributions to the solution of highway transportation problems of mutual concern to many responsible groups. The program, however, is intended to complement rather than to substitute for or duplicate other highway research programs.
NCHRP REPORT 239
Project 22-2(3) FY '78 ISSN 0077-5614 ISBN 0-309-03274-1
L. C. Catalog Card No. 81-85847
Price: $10.40
NOTICE
The project that is the subject of this report was a part of the National Cooperative Highway Research Program conducted by the Transportation Research Buaul with lhe approval uf the Governing Board uf the National Research Council, acting in behalf of the National Academy of Sciences. Such approval reflects the Governing Board's judgment that the program concerned is of national importance and appropriate with respect to both the purposes and resources of the National Research Council. The members of the technical committee selected to monitor this project and to review this report were chosen for recognized scholarly competence and with due consideration for the balance of disciplines appropriate to the project. The opinions and conclusions expressed or implied are those of the research agency that performed the research, and, while they have been accepted as appropriate by the technical committee, they are not necessarily those of the Transportation Research Board, the National Research Council, the National Academy of Sciences, or the program sponsors. Each report is reviewed and processed according to procedures established and monitored by the Report Review Committee of the National Academy of Sciences. Distribution of the report is approved by the President of the Academy upon satisfactory completion of the review process. The National Research Council was established by the National Academy of Sciences in 1916 to associate the broad community of science and technology with the Academy's purposes of furthering knowledge and of advising the Federal Government. The Council operates in accordance with general policies determined by the Academy under the authority of its congressional charter of 1863, which establishes the Academy as a private, nonprofit , selfgoverning membership corporation. The Council has become the principal operating agency of both the National Academy of Sciences and the National Academy of Engineering in the conduct of their services to the government, the public, and the scientific and engineering communities. It is administered jointly by both Academies and the Institute of Medicine. The National Academy of Engineering and the Institute of Medicine were established in 1964 and 1970, respectively, under the charter of the National Academy of Sciences. The Transportation Research Board evolved from the 54-year-old Highway Research Board. The TRB incorporates all former HRB activities and also performs additional functions under a broader scope involving all modes of transportation and the interactions of transportation with society.
Special Notice The Transportation Research Board, the National Academy of Sciences, the Federal Highway Administration, the American Association of State Highway and Transportation Officials, and the individual states participating in the National Cooperative Highway Research Program do not endorse products or manufacturers. Trade or manufacturers' names appear herein solely because they are considered essential to the object of this report.
Published reports of the
NATIONAL COOPERATIVE HIGHWAY RESEARCH PROGRAM
are available from:
Transportation Research Board National Academy of Sciences 2101 Constitution Avenue, N.W. Washington, D.C. 20418
Printed in the United States of America.
I
FOREWORD By Staff
Transportation Research Board
This report contains the findings of an extensive analytical and experimental investigation intended to advance procedures for development of bridge railing systems. A lower cost bridge railing system, intended for use when warranted by particular site conditions, was developed and evaluated by full-scale crash tests. Furthermore, an approach was developed for selecting the appropriate category of railing system based on a classification of conditions at the particular bridge site. These findings are recommended for immediate application and will be of interest to bridge engineers and others concerned with design and performance of bridge railings and vehicle barrier systems in general.
Current design specifications for bridge railing systems are predicated on a general performance requirement of ensured containment. The "average" vehicle referred to in AASHTO specifications is not defined, but is generally considered to be a full-size domestic passenger car. Impacts by 4,000- to 4,500-lb (1,820 to 2,040 kg) vehicles at speeds in the 50- to 70-mph (80.5 to 112.6 kph) range with impact angles of up to 25° have been considered to be appropriate full-scale crash test conditions. Excessive vehicle decelerations or penetration of the bridge railing under these test conditions have been considered to constitute unacceptable performance.
Bridge railing systems used on primary and Interstate highways can be categorized as "normal service level" railings and must meet the foregoing performance requirements. These are generally designed through application of static-elastic design criteria expressed in the AASHTO Standard Specifications for Highway Bridges. The resulting designs may have substantial structural integrity and a concomitant substantial cost. Routine verification of these designs through full-scale impact testing is not required by AASHTO specifications.
Many secondary or local roads are designed for and subjected to operating speeds, traffic volumes, vehicle weights, and possibly vehicle-barrier impact angles that are somewhat less than the normal service level. These roadways can be considered to serve a "lower service" need and, in the view of some, the application of normal service level bridge railing design criteria may not be cost-effective in these instances.
There are also situations where circumstances call for a higher level of performance than usual on primary or on Interstate highways. This may be due to heavy traffic volume, a preponderance of truck traffic, severe geometric conditions, or vulnerable habitation beneath the bridge. In these cases designers may consider using a high-performance railing.
Accordingly, the development of an array of service levels, performance criteria, and design criteria would prove useful to those desiring to use more appropriate and cost-effective bridge railings.
The objectives of this project were (1) to identify and document realistic performance criteria and correlated design criteria for bridge railing systems on roadways providing various levels of service; and (2) to develop a lower-cost bridge railing system, based on criteria for a lower service level, and to validate this system using analytical and full-scale testing methods.
This report contains detailed information on a newly developed, lower-cost bridge railing system. The system was evaluated by full-scale crash tests with cars and a school-type bus. In addition, recommendations are offered for modification of the current AASHTO specifications on bridge railings. The proposed modifications would require performance testing and adoption of a multiple-service-level approach. The results of this research were presented at the regional meetings of the AASHTO Subcommittee on Bridges and Structures in 1981.
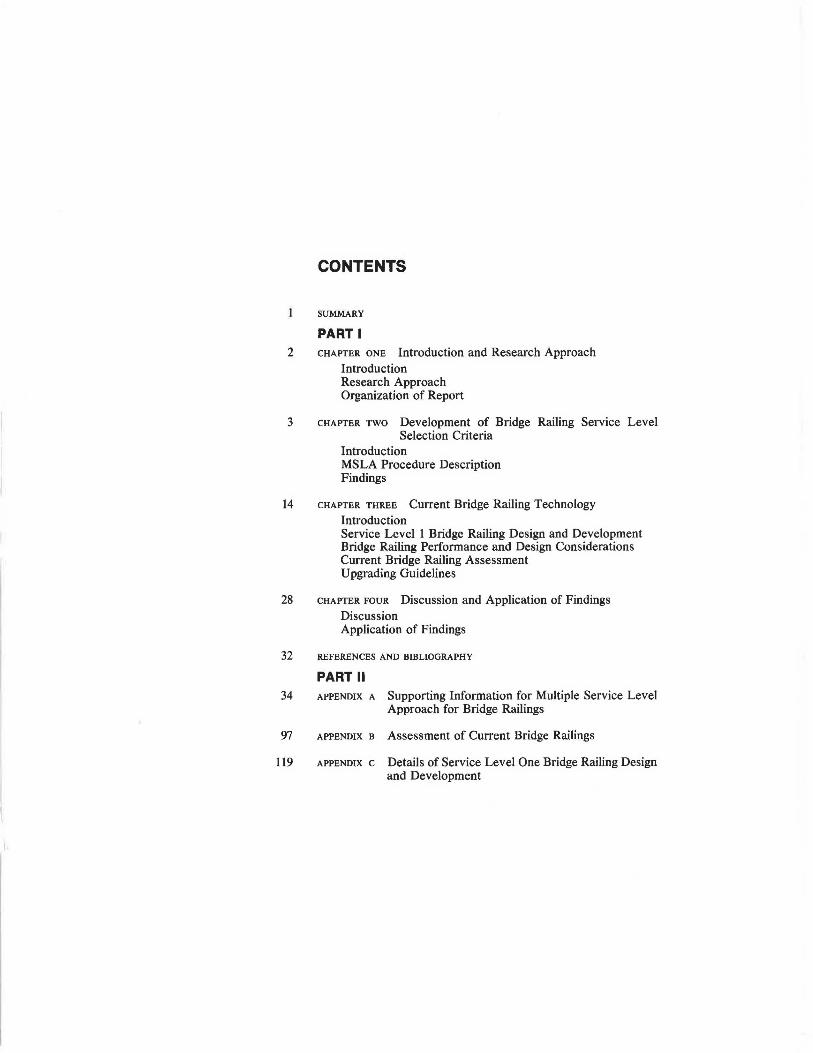
CONTENTS
SUMMARY
PART I 2 CHAPTER ONE Introduction and Research Approach
Introduction Research Approach Organization of Report
3 CHAPTER Two Development of Bridge Railing Service Level Selection Criteria
Introduction MSLA Procedure Description Findings
14 CHAPTER THREE Current Bridge Railing Technology Introduction Service Level 1 Bridge Railing Design and Development Bridge Railing Performance and Design Considerations Current Bridge Railing Assessment Upgrading Guidelines
28 CHAPTER FOUR Discussion and Application of Findings Discussion Application of Findings
32 REFERENCES AND BIBLIOGRAPHY
PART II 34 APPENDIX A Supporting Information for Multiple Service Level
Approach for Bridge Railings
97 APPENDIX B Assessment of Current Bridge Railings
119 APPENDIX c Details of Service Level One Bridge Railing Design and Development
ACKNOWLEDGMENTS
The research reported herein was performed under NCHRP Project 22-2(3) by Southwest Research Institute , with Maurice E. Bronstad, Manager, Transportation Structural Research, as principal investigator. A special ad hoc committee of NCHRP Panel C-22-2(3), consisting of William A. Goodwin (Panel Chairman), Tennessee Technological University; Malcolm D. Graham, New York State Department of Transportation; Eric F . Nordlin, California Department of Transpmiation; James H. Hallon, Roger W. Hove, and John G. Viner, Federal Highway Auminislralion; and Hayes E. Ross, Texas A&M University, is recognized for guidance and direction given during the cour e of lhe project. Other members of !he NCHRP Panel reviewed the progress of the project and !he fina l report draft . These members in~luded J. N. Clary , Richmond, Vir· ginia; W. B. Drake , Kentucky Oepartmenl ofTranspo.nation; Duane Dunlap, Cnawlaecan, Inc., Ann Arbor, Michigan; A. L. Elliott, Sacramento, California; D. W. Loutzenhei ·er, Arlington, Virginia; F. W. Thorstenson, St. Paul, Minnesota; and Dr. Charles Y. Warner, Provo, Utah.
For Southwest Research Institute, the computer formulations of R. E. Kirksey and Dr. L. R. Calcote are acknowledged . Experimi:ntal investigations were conducted under the supervision of Mr. C. E. Kimball, Jr. and Mr. G. W. Deel.

SUMMARY
MULTIPLE-SERVICE-LEVEL HIGHWAY BRIDGE RAILING
SELECTION PROCEDURES
This report presents procedures that permit the rapid service level selection for a bridge site based on functional classification and traffic volume. The multipleservice-level approach (MSLA) of this project is formulated from consideration of frequency and severity of bridge railing collisions. By comparing the benefits of bridge railing with the cost of bridge railing, benefit and cost (B/C) ratios are determined for typical bridge sites. Determination of service level is readily achieved by using these B/C ratios as a basis.
As a result of the research conducted under Project 22-2(3), a new low-cost ($10/linear ft, installed) bridge railing was designed, developed, and evaluated by crash test. Crash test evaluations involved cars and a school bus. On the basis of the project findings, use of these new railings could be widespread on low-volume roads.
An in-depth investigation of all aspects of bridge railing technology was conducted. Findings include the recommendation for performance testing of bridge railings. Static load or force criteria for bridge railings are not recommended.
Current bridge railings are assessed for service level designation and estimated installed cost. The full range of four service levels is represented by bridge railing systems with crash test experience.
The current AASHTO bridge railing specification is discussed and recommendations made for revision and additions. These recommendations, which include performance testing, are consistent with an observed national trend toward the adoption of a limited number of carefully developed and demonstrated barrier systems.
Guidelines are presented that will aid a user agency in applying the MSLA procedures to existing construction. Use of these guidelines will enable the agency to develop a priority procedure for upgrading bridge railings with demonstrated inadequate capacity.
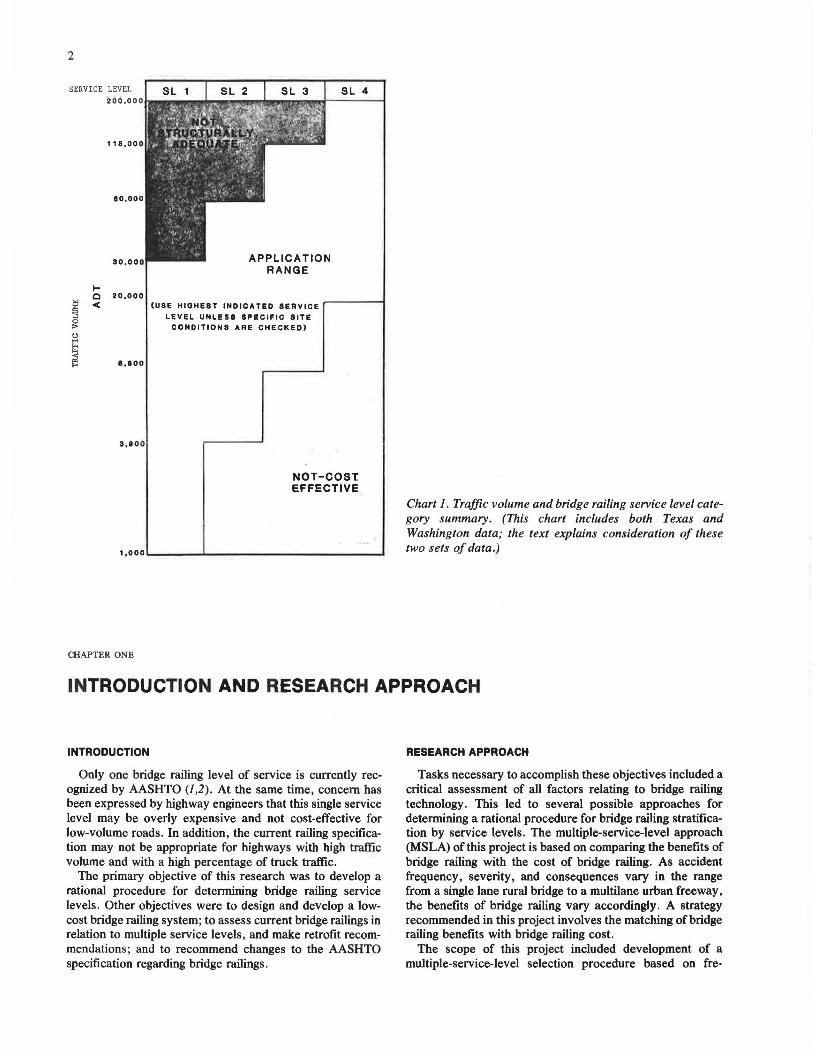
Traffic volume at a bridge site was identified as generally the most important variable with regard to service level designation. Thus, Chart 1 summarizes the service level designation according to traffic volume. A more in-depth service level identification is contained in the selection tables of Chapter Two and in the discussion in Appendix A.
2
SERVICE LEVEL 206,000
118,000
80 , 000
30,000
I-C 20,000
APPLICATION RANGE
SL 4
< (USE HIGHEST INDICATED SERVICE
8 , 800
3,800
LEVEL UNLESS SPECIFIC SITE CONDITIONS ARE CHECKED)
NOT-COSl: EFFECTIVE
1.000.._ _______________ __.
CHAPTER ONE
Chart J. Traffic volume and bridge railing service level category summary. (This chart includes both Texas and Washington data; the text explains consideration of these two sets of data.)
INTRODUCTION AND RESEARCH APPROACH
INTRODUCTION
Only one bridge railing level of service is currently recognized by AASHTO (1 ,2). At the same time, concern has been expressed by highway engineers that this single service level may be overly expensive and not cost-effective for low-volume roads. In addition, the current railing specification may not be appropriate for highways with high traffic volume and with a high percentage of truck traffic.
The primary objective of this research was to develop a rational procedure for determining bridge railing service levels . Other objectives were to design and develop a lowcost bridge railing system; to assess current bridge railings in relation to multiple service levels , and make retrofit recommendations; and to recommend changes to the AASHTO specification regarding bridge railings.
RESEARCH APPROACH
Tasks necessary to accomplish these objectives included a critical assessment of all factors relating to bridge railing technology. This led to several possible approaches for determining a rational procedure for bridge railing stratification by service levels . The multiple-service-level approach (MSLA) of this project is based on comparing the benefits of bridge railing with the cost of bridge railing. As accident frequency, severity, and consequences vary in the range from a single lane rural bridge to a multilane urban freeway, the benefits of bridge railing vary accordingly. A strategy recommended in this project involves the matching of bridge railing benefits with bridge railing cost.
The scope of this project included development of a multiple-service-level selection procedure based on fre-
quency and severity of bridge railing collisions and on bridge railing costs (accident, installation).
During the development of the MSLA, a large number of parameters were examined and their relationship to the overall cost-effectiveness of bridge railing selection was ascertained. In some cases, published data, previous research, and accident statistics were used to support elements of the MSLA; in other cases, the authors relied on rational developments. Much of the technology of the MSLA involves derivation of relationships heretofore not used by the highway community. The final product is a rational selection procedure for determining different levels of service according to bridge site conditions and bridge railing(s) performance/cost.
Computer simulations, component testing, crash test evaluations for car and bus impacts, and cost analyses were used in the design and development of a low-cost bridge railing system for a level of service below the current AASHTO requirements.
Bridge railings with known crash test experience were analyzed for performance and cost, and subsequently rated for service level designation. Factors relating to bridge railing upgrading were also examined.
On the basis of the findings of the project, recommendations for changes in the AASHTO specification regarding bridge railings are made. Design drawings and specifications are included.
CHAPTER TWO
3
ORGANIZATION OF REPORT
The MSLA procedures are presented in Chapter Two. (They are described in detail in Appendix A along with the supporting data. Although the probabilistic model that predicts occurrence and severity of vehicle impact is complex, the procedures to be used by design engineers in determining appropriate service levels are simple and require a matter of minutes.
Chapter Three contains a general discussion of bridge railing performance and design based on current technology; drawings and specifications along with a brief discussion of the development of the low-cost bridge railing are included. (Details on the design and development of the systems are contained in Appendix C.) The assessment of current railings as to service level designation and retrofit guidelines is also discussed in this chapter (design drawings are included in Appendix B).
Chapter Four contains an appraisal of the project and suggested application of the findings; also included are recommendations for revisions to the AASHTO bridge railing specification.
To expedite publication the appendixes included herein are reproduced as submitted by the research agency.
DEVELOPMENT OF BRIDGE RAILING SERVICE LEVEL SELECTION CRITERIA
INTRODUCTION
The multiple-service-level approach (MSLA) for selecting appropriate bridge rail designs for particular highway sites is presented in this chapter. The finalized procedures are the result of an in-depth investigation of bridge railing technology; these procedures are believed to represent the best approach based on available data.
Elements of the MSLA can be conveniently grouped by referring to a collision model, a barrier assessment model, and a cost model.
The collision model is structured to project bridge railing impacts and quantify the frequency and severity of the impacts. The barrier assessment model relates barrier capacity to impact severity. The cost model interprets the performance of a range of bridge rail service levels, thus permitting a comparison of bridge railing accident costs with bridge railing costs (i.e., a benefit and cost ratio can be determined).
Although the MSLA probabilistic collision model is comprehensive, it has been applied for a complete range of typical urban and rural highway ~onditions and results have been summarized in tabular form. With these tables, a designer knowing the bridge functional classification and traffic volume can determine the appropriate service level in a
matter of minutes. For unusual bridge sites that deviate significantly from the typical, guidelines are provided at the end of this chapter and in Appendix A.
This chapter is intended to describe briefly the MSLA procedures and present the findings. Details and supporting information are contained in Appendix A.
MSLA PROCEDURE DESCRIPTION
The MSLA developed in this project is based on cost/benefit technology as shown in Figure 1. The beginning of the formulations involves a series of complex equations relating to frequency and severity of vehicle impacts with bridge railings (collision model). Bridge railing performance is measured by the number of projected collisions (i.e., critical impacts or penetrations) that exceed the railing capacity for a specified period of time. Thus, at a given bridge site, the number of critical impacts depend on the capacity of the bridge railing. The MSLA concept involves the comparison of bridge railing requirements (distribution of impacts) with bridge railing capacity to contain a certain number of the projected impacts.
The benefits of bridge railing are expressed in terms of dollars by comparing accident costs with and without the

4
BARRIER ASSESSMENT MODEL
BRIDGE RAILING (BR) CAPACITY
NO BRIDGE RAILING
SL 1 BR
SL 2 BR
SL 3 BR
SL 4 BR
Figure l. MSLA f ormulation diagram.
benefit of bridge railing containment of the impacting vehicle. By using this comparison with railings of different capacities, the incremental benefits are derived from the difference in accident costs. The incremental benefit and cost ratio is obtained by dividing benefit increments by bridge railing cost increments as shown in Figure 1.
Collision Model
Bridge railings in service are subjected to a wide range of impacts represented by various vehicles (cars, buses, trucks, and the like) and impact conditions (speed, angle). A collision model was constructed for this project to predict the number and severity distribution of bridge railing accidents.
Frequency
The frequency of bridge railing accidents is dependent on the rate of vehicles leaving the traveled way (encroachment rate) and the distance from the traveled way to the barrier (lateral travel distribution). These two factors (defined as follows) combined with the average daily traffic (ADT) determine the number of bridge railing collisions:
1. Enchroachment rate-vehicle departure from the traveled way; expressed in this project as encroachments per 10 miles per 10 years per ADT as determined from bridge railing accident statistics.
2. Lateral travel distribution-all encroachments do not produce bridge railing accidents if sufficient distance is available for the vehicle to recover before striking the barrier. Thus, the greater the lateral distance, the greater the chance of vehicle recovery. The lateral distance distribution was determined from state-of-the-art data. For bridge railings, this lateral distance is generally the same as the shoulder width.
/ NUMBER OF CRITICAL IMPACTS -i.e., impacts exceeding BR capacity
CO.'iT llOllEI.
ACCIDENT COSTS
BRIDGE RAILING BENEFIT (BRB) COMPUTATION
BRB (SL 1 - 0)
BRC (SL 1) = B/C, SL l
BRB ( SL2 - SL 1 ) "' B/C, SL 2
BRC (SL2 - SL 1)
BRB (SL 3 - SL 2 J "' B/C, SL 3
HKC (SLJ - SL 2 J
BRB !SL4 - SL 3)
BRC (SL4 - SL 3) • B/C, SL 4
Severity
The term severity as used here relates to barrier loading. Because a wide range of impact possibilities exists, it was necessary to first develop an expression for determining equivalent impacts (e.g., at what speed and angle does a 40,000-lb (18,000-kg) bus impact with the same severity as a 4500-lb (2040-kg) car at 60 mph (95 km/h) and a 25-deg angle). A great deal of effort was expended in this project to develop an expression referred to as the Redirection Index (RT). The RI value for an impact is a linear momentum expression for impact severity in terms of barrier loading. With this expression, distribution of impact probabilities are quantified and directly related.
The distribution of impact severities is a measure of the probabilities dependent on the following: traffic distribution (truck percentage, etc.); and impact conditions (vehicle size, impact speed, impact angle).
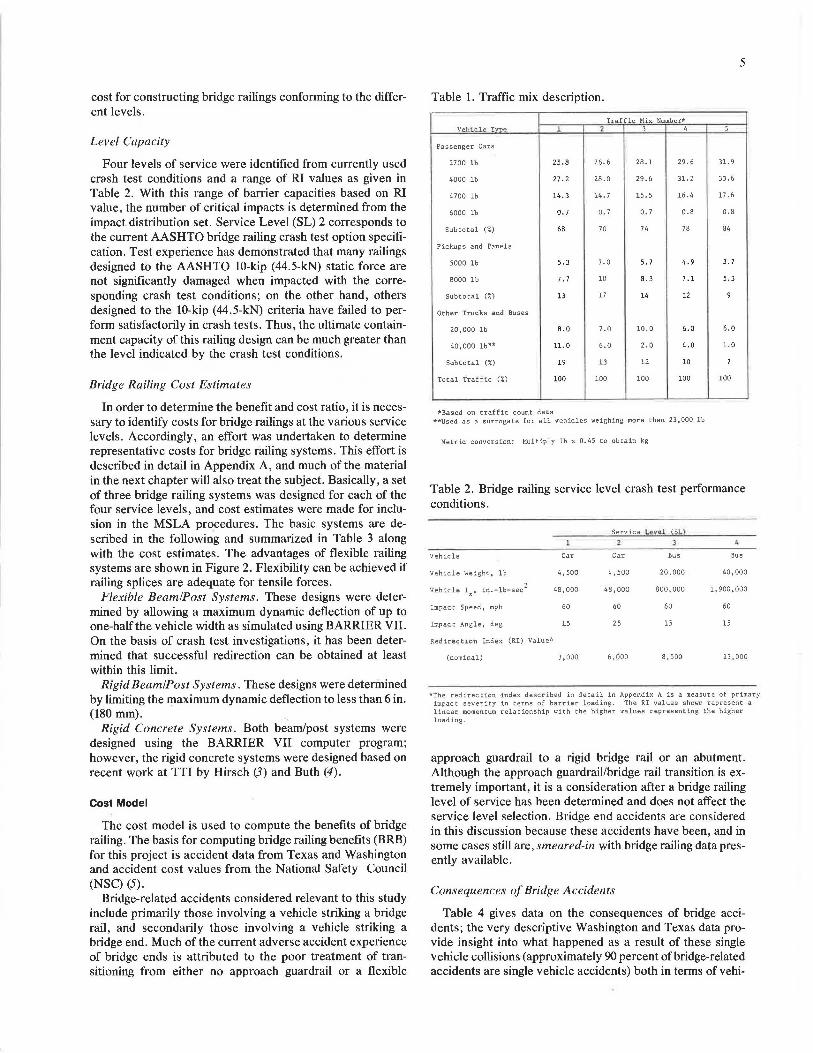
The traffic distribution determined from sales and vehicle count data identified five traffic mixes composed of eight vehicle types as being typical (see Table 1). The appropriate traffic mix for a bridge is identified from the roadway functional classification. A 40,000-lb (18,000-kg) bus is used as a surrogate for all heavy vehicles as discussed in Appendix A.
Impact conditions are determined from a point mass model that has been used by many researchers to predict impact angle distribution for given speed and distance from the barrier. A distribution of vehicle impacts is computed by using this expression and the percentages of eight vehicle types for five traffic mixes. The RI expression permits the quantification of the range of impacts predicted.
Barrier Assessment Model
This model includes the stratification of bridge railing service level by capacity and provides a basis for estimating the
cost for constructing bridge railings conforming to the different levels.
Level Capacity
Four levels of service were identified from currently used crash test conditions and a range of RI values as given in Table 2. With this range of barrier capacities based on RI value, the number of critical impacts is determined from the impact distribution set. Service Level (SL) 2 corresponds to the current AASHTO bridge railing crash test option specification. Test experience has demonstrated that many railings designed to the AASHTO 10-kip (44.5-kN) static force are not significantly damaged when impacted with the corresponding crash test conditions; on the other hand, others designed to the 10-kip (44.5-kN) criteria have failed to perform satisfactorily in crash tests. Thus, the ultimate containment capacity of this railing design can be much greater than the level indicated by the crash test conditions.
Bridge Railing Cost Estimates
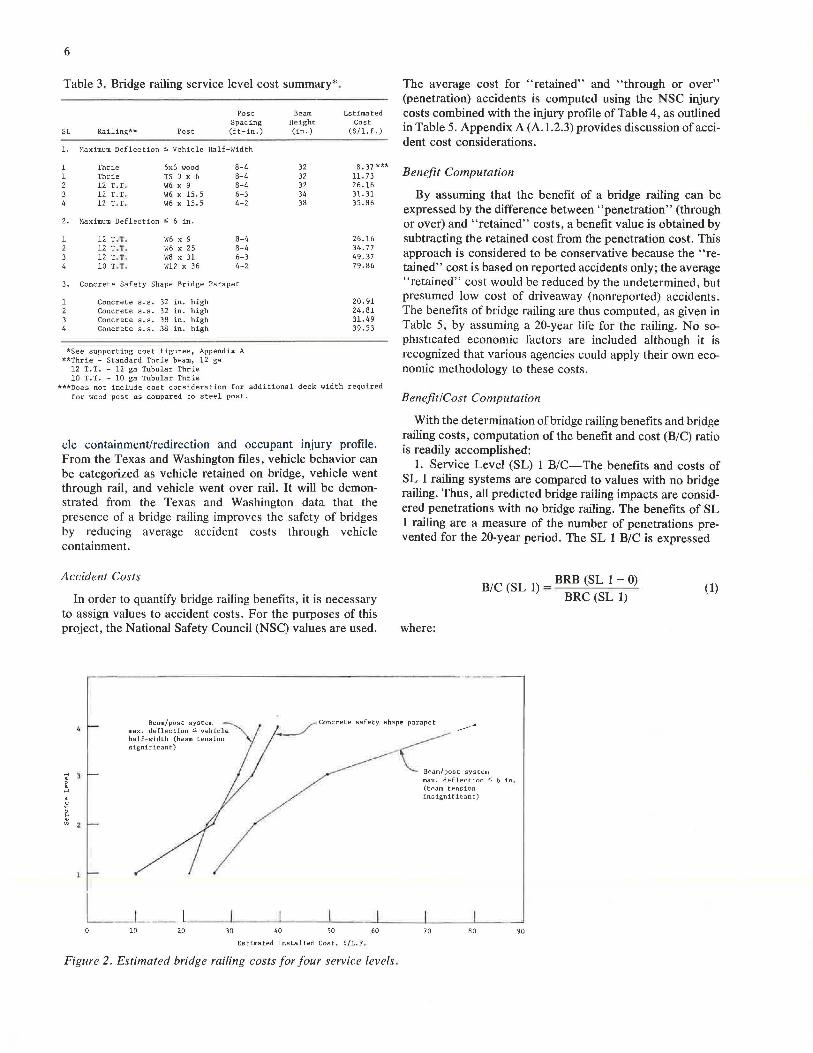
In order to determine the benefit and cost ratio, it is necessary to identify costs for bridge railings at the various service levels. Accordingly, an effort was undertaken to determine representative costs for bridge railing systems. This effort is described in detail in Appendix A, and much of the material in the next chapter will also treat the subject. Basically, a set of three bridge railing systems was designed for each of the four service levels, and cost estimates were made for inclusion in the MSLA procedures. The basic systems are described in the following and summarized in Table 3 along with the cost estimates. The advantages of flexible railing systems are shown in Figure 2. Flexibility can be achieved if railing splices are adequate for tensile forces.
Flexible Beam/Post Systems. These designs were determined by allowing a maximum dynamic deflection of up to one-half the vehicle width as simulated using BARRIER VII. On the basis of crash test investigations, it has been determined that successful redirection can be obtained at least within this limit.
Rigid Beam/Post Systems. These designs were determined by limiting the maximum dynamic deflection to less than 6 in. (180 mm).
Rigid Concrete Systems. Both beam/post systems were designed using the BARRIER VII computer program; however, the rigid concrete systems were designed based on recent work at TTI by Hirsch (3) and Buth (4).
Cost Model
The cost model is used to compute the benefits of bridge railing. The basis for computing bridge railing benefits (BRB) for this project is accident data from Texas and Washington and accident cost values from the National Safety Council (NSC) (5).
Bridge-related accidents considered relevant to this study include primarily those involving a vehicle striking a bridge rail, and secondarily those involving a vehicle striking a bridge end. Much of the current adverse accident experience of bridge ends is attributed to the poor treatment of transitioning from either no approach guardrail or a flexible
5
Table 1. Traffic mix description.
Traffic Mix Number* Vehic..le Tvoe l ';: 3 4 5
Passenger Cars
2700 lb 25.8 26. 6 28.1 29. 6 31.9
4000 lb 27. 2 28.0 29. 6 31. 2 33.6
4700 lb 14. 3 14. 7 15. 5 16.4 17 .6
6000 lb o. 7 0. 7 o. 7 0.8 0.8
Subtotal (7.) 68 70 74 78 84
Pickups and Panels
5000 lb 5.3 7. 0 5. 7 4.9 3. 7
8000 lb 7. 7 10 8.3 7 .1 5.3
Subtotal (%) 13 17 14 12 9
Other Trucks and Buses
20,000 lb 8.0 7 .o 10. 0 6.0 6.0
40,000 lb"'* 11. 0 6.0 2. 0 4.0 1.0
Subtotal (%) 19 13 12 10 7
Total Traffic (%) 100 100 100 100 100
*Based on traffic count data **Used as a surrogate fat" all vehicles weighing more than 23,000 lb
Metric conversion: Multiply lb x 0. 45 to obtain kg
Table 2. Bridge railing service level crash test performance conditions.
Service Lcvf!...l ($L)
Vehicle Car Car Bus Bus
Vehicle Weight, lb 4' 500 4' 500 20' 000 40' 000
Vehicle I in.-lb-sec 2
48' 000 48' 000 800, 000 1,900.000 z'
Impact Speed, mph 60 60 60 60
Impacc A4lgle, deg 15 25 15 15
Redirection Index (RI) Value:~
(nominal) 3 ,000 6, 000 8' 500 13' 000
"'The redirection index described in detail in Appendix A is a rneasure of primary impact severity in terms of barrier loading. The RI values show represent a linear momentum relationship with the higher values representing the higher loading.
approach guardrail to a rigid bridge rail or an abutment. Although the approach guardrail/bridge rail transition is extremely important, it is a consideration after a bridge railing level of service has been determined and does not affect the service level selection. Bridge end accidents are considered in this discussion because these accidents have been, and in some cases still are, smeared-in with bridge railing data presently available.
Consequences of Bridge Accidents
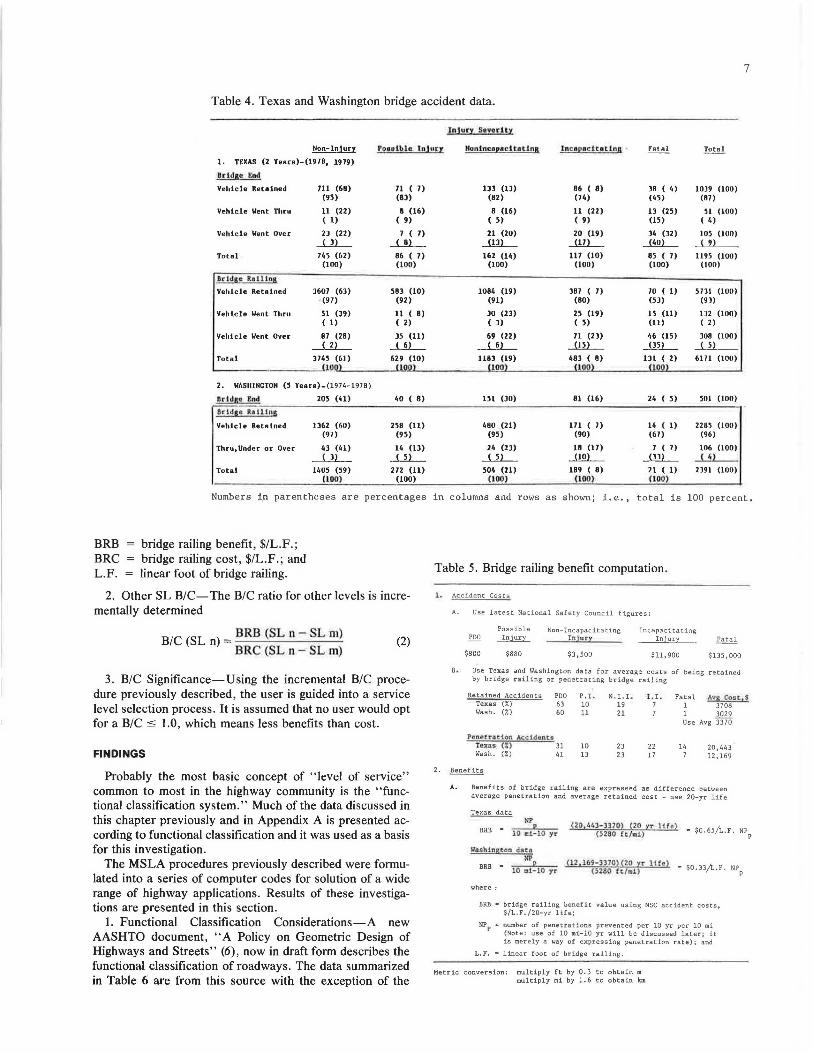
Table 4 gives data on the consequences of bridge accidents; the very descriptive Washington and Texas data provide insight into what happened as a result of these single vehicle collisions (approximately 90 percent of bridge-related accidents are single vehicle accidents) both in terms of vehi-
6
Table 3. Bridge railing service level cost summary* .
SL
1.
2.
3.
l 2 3 4
Railing** Post
Post Spacing (ft-in.)
Maximum Deflection s Vehicle Half-Width
Thrie 6x6 wood 8-4 Thrie TS 1 x 6 8-4 12 T.T . W6 x 9 8-4 12 T. T. W6 x 15. 5 6-3 12 T. T . W6 x 15.5 4-2
Maximum Deflection :;; 6 in.
12 T.T. W6 x 9 8-4 12 T. T. W6 x 25 8-4 12 T. t. W8 x 31 6-3 10 T.T. Wl2 x 36 4-2
Concrete Safety Shape Bridge Parapet
Concrete s. s. 32 in. high Concrete s. s. 32 in. high Concrete s. s. 38 in. high Concrete s. s. 38 in. high
*See supporting cost t igures, Appendix A **Thrie - Standard Thrie beam, 12 ga
12 T. T. - 12 ga Tubular Thrie 10 T. T. - 10 ga Tubular Thrie
Beam Height (in.)
32 32 32 34 38
Estimated Cost
($/1. f.)
8. 37 ••• 11. 73 26.16 31. 31 35. 86
26.16 34. 77 49.37 79. 86
20. 91 24. 81 31. 49 39. 53
***Does not include cost consideration for additional deck width required for wood post as compared to steel post.
de containment/redirection and occupant injury profile. From the Texas and Washington files, vehicle behavior can be categorized as vehicle retained on bridge, vehicle went through rail, and vehicle went over rail. It will be demonstrated from the Texas and Washington data that the presence of a bridge railing improves the safety of bridges by reducing average accident costs through vehicle containment.
Accident Costs
In order to quantify bridge railing benefits, it is necessary to assign values to accident costs. For the purposes of this project, the National Safety Council (NSC) values are used.
Beam/post system --. max. deflection $ vehicle "\, half-width (beam tension \ significant)
The average cost for "retained" and "through or over" (penetration) accidents is computed using the NSC injury costs combined with the injury profile of Table 4, as outlined in Table 5. Appendix A (A.1.2.3) provides discussion of accident cost considerations.
Benefit Computation
By assuming that the benefit of a bridge railing can be expressed by the difference between "penetration" (through or over) and "retained" costs, a benefit value is obtained by subtracting the retained cost from the penetration cost. This approach is considered to be conservative because the ''retained" cost is based on reported accidents only; the average "retained" cost would be reduced by the undetermined, but presumed low cost of driveaway (nonreported) accidents. The benefits of bridge railing are thus computed, as given in Table 5, by assuming a 20-year life for the railing. No soph1st1cated economic factors are included although it is recognized that various agencies could apply their own economic methodology to these costs.
Benefit/Cost Computation
With the determination of bridge railing benefits and bridge railing costs, computation of the benefit and cost (B/C) ratio is readily accomplished:
1. Service Level (SL) 1 B/C-The benefits and costs of SL l railing systems are compared to values with no bridge railing. Thus, all predicted bridge railing impacts are considered penetrations with no bridge railing. The benefits of SL 1 railing are a measure of the number of penetrations prevented for the 20-year period. The SL 1 B/C is expressed
where:
B/C (SL l) = BRB (SL 1 - 0) BRC (SL 1)
Beam/post system max. deflection ,:::;; 6 in . (beam tension insignif leant)
(1)
L_L - l _ _j_____J___---'-- -1._-.l.----'-----'
10 20 30 40 so 60 70 80 90
Estimated Installed Cost, $/L.F .
Figure 2. Estimated bridge railing costs for four service levels .
7
Table 4. Texas and Washington bridge accident data.
ln!urr Severity
Non-lnjul'y
l. TEXAS (2 Yearo)-(1978, 1979)
ro .. tble. ln!orr Honlnc1pac i tatlna lnc• pac it.otlns
Brldge End
Vehicle Retained 711 (68) (95)
Vehicle Went Thr-u 11 (22) ( 1)
Vehicle Went Over 2J (22) _Lll_
Total 10 (62) (100)
Brld&e RAlllnB
VehJcle Retained 1607 (63) (91)
Vehicle Went Thl'U 51 (J9) ( 1)
Vehicle Went Over 87 (28) ___lll__
Total 3145 (61) (lUOl
2. WASHINGTON (5 Yeare)-(1974-1978)
Drldaa End 205 (U)
Brld ga Railing
Vehicle Reto lned 1362 (60) (97)
Thru,Under or Over 41 (41) ____LlL_
Total 1405 (59) (100 )
1l ( 1) (83)
8 (16) ( 9)
1 ( 1) __i_!l_
86 ( 7) (100)
583 (10) (92)
11 ( 8) ( 2)
35 (11) __LlL_ 629 (10)
l!!l.Rl
40 ( 8)
258 (11) (95)
14 (ll) __LlL__ 272 (11)
(100)
lJ] (lJ) (82)
8 (16) ( 5)
21 (20) _illL__
162 (14) (100)
1084 (19) (91)
JO (2J) ( J)
69 (22) __LlL_ 118] (19)
UOOl
Ul (30)
480 . (21) (95)
24 (23) __LlL__ 504 (21)
(100)
86 ( 8) J8 ( 4) 1019 (100) (H) (45) (87)
11 (22) lJ (25) 51 (100) ( 9) (15) ( 4)
20 (19) J4 (32) 105 (100) _fill_ _Jill__ ! 9!
117 (10) 85 ( 7) 1195 (100) (100) (100) (100)
J87 ( 7) 70 ( 1) 57Jl (100) (80) (5J) (9J)
25 (19) 15 (11) 1J2 (100) ( 5) (11) ( 2)
71 (2J) 46 (15) JOB (100) _fill_ _illL__ ! 5)
483 ( 8) lll ( 2) 6171 (100) 1100\ ll QR\
81 (16) 24 ( 5) 501 (100)
171 ( 7) 14 ( 1) 2285 (100) (90) (67) (96)
18 (17) 1 ( 7) 106 (100) .J!QL_ __!llL_ ! •1 189 ( 8) 21 ( 1) 2191 (100)
(100 ) (100 )
Numbers i.n parentheses are percentages in columns and rows as shown; i.e., total is 100 percent.
BRB BRC L.F.
bridge railing benefit, $/L.F.; bridge railing cost, $/L.F. ; and linear foot of bridge railing.
2. Other SL B/C-The B/C ratio for other levels is incrementally determined
B/C (SL n) = BRB (SL n - SL m) BRC (SL n - SL m)
(2)
3. B/C Significance-Using the incremental B/C procedure previously described, the user is guided into a service level selection process. It is assumed that no user would opt for a B/C ~ 1.0, which means less benefits than cost.
FINDINGS
Probably the most basic concept of "level of service" common to most in the highway community is the "functional classification system." Much of the data discussed in this chapter previously and in Appendix A is presented according to functional classification and it was used as a basis for this investigation.
The MSLA procedures previously described were formulated into a series of computer codes for solution of a wide range of highway applications. Results of these investigations are presented in this section.
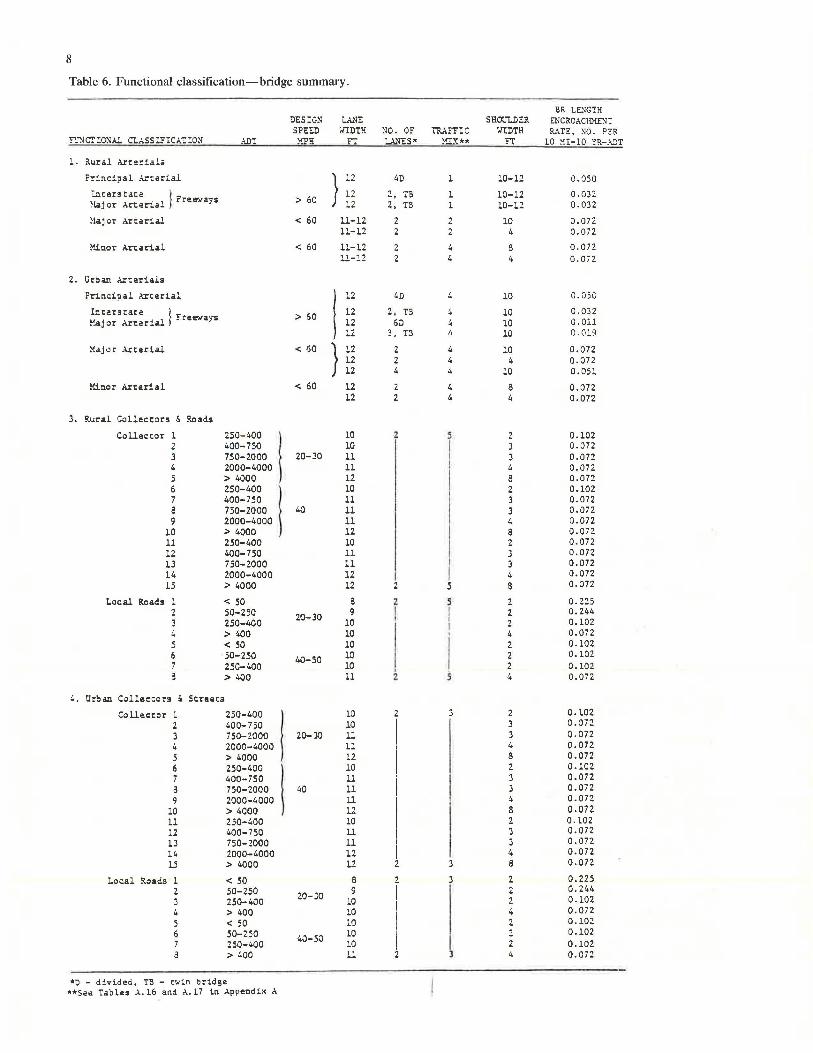
l. Functional Classification Considerations-A new AASHTO document, "A Policy on Geometric Design of Highways and Streets" (6), now in draft form describes the functional classification of roadways. The data summarized in Table 6 are from this source with the exception of the
Table 5. Bridge railing benefit computation.
L Accident Costs
A. Use latest National Safety Council figures:
B.
Possible PDO ~
$800 $880
Non-lncapacitat ing lnlun
$3. 500
Incapacitating Injury ~
$11,900 $135,000
Use Texas and Washington data for average costs of being retained by bridge railing or penetrating bridge railing
Retained Accidents Texas (%) Wash. (%)
Pt!!ner.ration Acc:ldenu
PDQ P. I. 63 10 60 11
T•;ui.s (%) 31 10 13 Wash. (%) 41
N. I. I. 19 21
23 23
t. I. 7 7
22 17
Fatal Avg Cost , $ 1 3708 l 3029 Use Avg J370
14 7
20,443 12, 169
2.~
A. Benefits of bridge railing are expressed as difference between average penetration and average retained cost - use 20-yr life
Texas data NP
(20 , 443-3370) (20 yr Ufo) / NP (5280 ft/11li) " $0.65 L.F. P BRB " 10 .. ~-10 yr
W'uhif'gc:on d.aro
BRB • (12,169-3370)(20 Yr life) - $0.33/L.F. NP 10 !Oi-10 yr (5280 ft/IDi) p
where :
BRB = bridge railing benefit value using NSC accident costs, $/L.F./20-yr life;
NP p "' number of penetrations prevented per 10 yr per 10 mi (Note: use of 10 mi-10 yr will be discussed later; it is merely a way of expressing penetration rate); and
L.F. == linear foot of bridge railing.
Metric conver9ion: multiply ft by O. 3 to obtain m multiply 1ni by 1. 6 to obtain km
8
Table 6. Functional classification-bridge summary.
BR LENGTH DESIGN U.'IE SHOULDER ENCROAC!ll1ENT SPEED w"!DTH llO. OF l"R....\.FFIC '..TIDTH RATE, llO. PER
""~rcr:::oN . .\.L a.;.ss:nc;.r:o11 ADT :-!PH FT L\NES* :1l.."<** IT 10 MI-10 YR-ADT
1. Rural Arte:-ials
Principal Arterial } 12 40 l .!.0-12 o.oso Cntsrs tata J - > 60
12 2, 7B l 10-12 0.032 'laj .i. . 1 r ree' .. ays 12 2, TB l 10-12 0.032 . or . rter..a
~laj or ..\.r t a r ial < 60 11-12 2 2 10 0.072 11- 12 2 2 4 0.072
~nor ..\.rt:arial < 60 11-12 4 8 0.072 ll-!.2 4 4 O.Oi2
2. tirb an Ar:: erials
Principal A'.rterial 12 4D 4 10 0.050
Int:erstata l " > 60 12 2 . TB 4 10 0.032 ~j or Ari:arial • reeways 12 6D 4 10 a.au
12 3, T:l 10 0.019
:-!ajar Arterial < 60 } 12 2 4 10 0.072 12 2 4 4 0.072 12 4 4 10 0.051
~nor Art:erial < 60 12 2 4 8 0.072 12 2 4 4 0.072
J. Rural C-Ollectors & Roads
Collect:or 1 250- 400 10 2 5 2 0.102 2 400- 750 10
I J 0.072
3 750-2000 20-JO 11 3 0.072 4 2000-4000 11 4 0.072 5 > 4000 12 8 0.072 6 250-400 10 2 0.102 7 400-750 11 3 0.072 e 750-2000 40 11 3 0.072 9 2000-4000 11 4 0.072
10 > 4000 12 8 0.072 11 250-400 10 2 0.072 12 400-750 11 3 0.072 lJ 750-2000 11 3 0.072 14 2000-4000 12 4 0.072 15 > 4000 12 2 3 e 0.072
Local Road9 l < 50 8 2 5 0.225 2 50-250 20- 30 9 I I 2 0.244
250-400 10 I 2 0.102 > 400 10
j
4 0.072 5 < so 10 2 0.102 6 50-250 40-50 10 2 0.102 7 250-400 10 2 0.102 3 > 400 ll z 3 4 0.072
4. Urban Collectors i Streets
Collector l 250-400 10 2 3 2 0.102
2 400-750 10 3 0.072
3 750-2000 20-JO ll 3 0.072 4 2000-4000 ll 4 0.072 5 > 4000 12 a 0.072 6 250-400 10 2 0.102 7 400-750 ll
i 3 0.072
3 750-2000 40 11 3 0.072 9 2000-4000 ll
I
4 0.072
10 > 4000 12 8 a.on 11 250-400 10 2 0.102 12 400-750 ll 3 0.072
l3 750-2000 11 I 3 0.072 I
14 2000-4000 12 I 4 0.072
l3 > 4000 12 z 3 8 0.012
Local Roads l < 50 8 2 0.225 2 50-250 9 I 2 0.244
3 250-400 20-JO
10 2 0.102 I 4 > 400 10
I
4 0.072
s < 50 10 2 0.102
6 50-250 10 2 0.102 7 250-400
40-50 10 I 2 0.102
a > 400 ll 2 3 4 0.072
*D - divided, TB - twin bridge **See Tables A.16 and A.17 in Appendix A
9
traffic mix and encroachment rate. These were determined from other sources as stated previously.
The data in this table represent the input necessary for using the MSLA, with the following exceptions: no ADT values are given for the arterials (1and2), and no cost values are given.
2. Service Level Determination for Typical Roadways - Traffic volume values for typical roadways were determined from 1978 Highway Statistics (7) (see Table 7). These values were used as input for the arterials described in Table 6. A range of traffic volume for each classification is provided by using the highest FHWA regional average, the national average, and the lowest FHWA regional average. Costs used included Texas and Washington accident costs and the flexible (set 1) bridge railing costs of Table 3. Data from all roadways described by functional classification in Table 6 were used to generate a series of tables as described in Table 8. This table presents benefits and incremental B/C ratios for the range of ADT values. Also, at the lower part of the table an ADT value is shown that produces a B/C = 1.0.
The data of Table 8 are summarized in Table 9 by selecting the lowest cost bridge railing that produces a B/C ratio ~ 1.0. By knowing the ADT, the SL can be determined.
Another way of summarizing the SL designation is to present a summary of the ADT value at a given bridge site for B/C ratio = 1.0 as shown in Table 10. Only the Texas data are given in Table 10 because the ADT values for Washington accident costs would be almost twice the Texas value because of the linear relationship with bridge railing benefit value. Table 10 can also be used to consider B/C ratios greater than 1.0 (e.g., ifa B/C ratio of3.0 is desired, the ADT value from Table 10 would be three times that given in the table).
3. Other Site Conditions-For sites where bridge characteristics differ significantly from those described in Table 6, basic tables can be used to determine a more appropriate SL designation if desired.
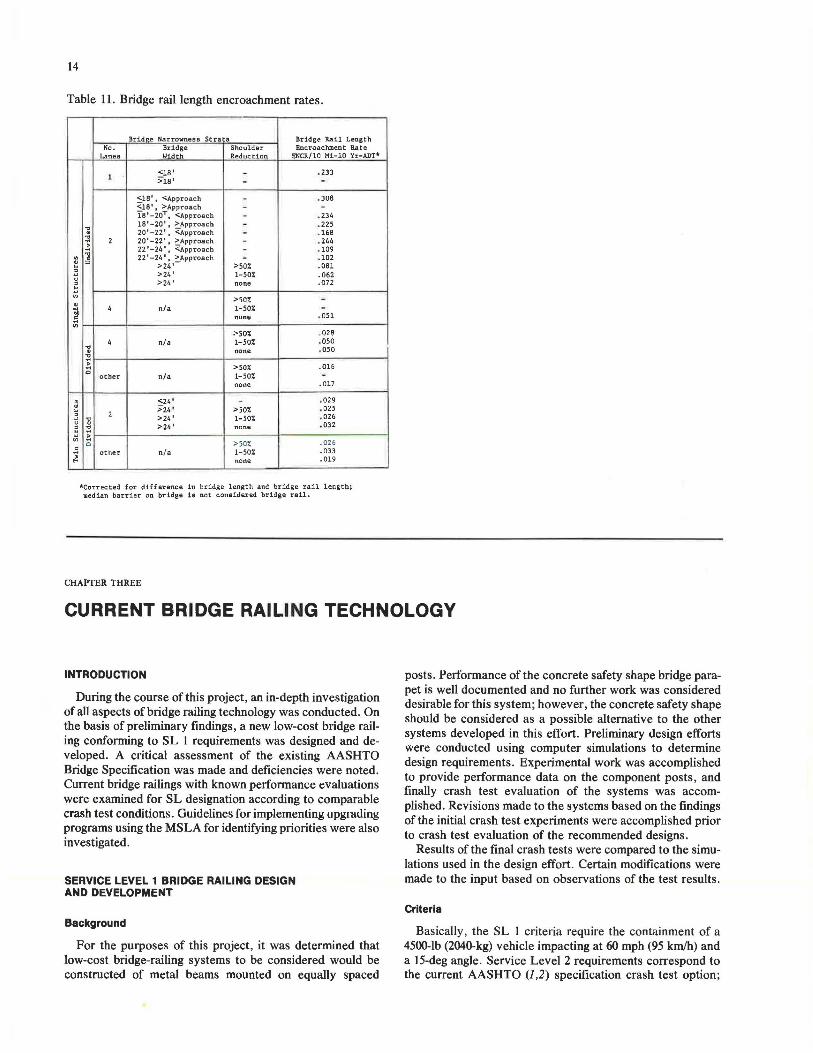
a. Other Encroachment Rates-Table 11 contains the complete set of encroachment data as developed for this project. Data which were not shown in Table 6 are shown for bridges not covered by that table.
b. Critical Impact Tables-Table 12 contains an example of collision model summary for a given roadway. These basic tables have been generated for bridges with 8-, 9-, 10-, 11-, and 12-ft (2.4-, 2.7-, 3.1-, 3.4-, and 3.7-m) lanes with shoulder widths from 0-10 ft (0-3.1 m). The table lists the number of hits in the far right column. This number of hits corresponds to the number of critical impacts (penetrations) occurring with no bridge rail. The number of penetrations prevented (NPP) by each railing service level is listed for all traffic mixes and incremental shoulder widths for a bridge with two 12-ft wide lanes. Use of this table to generate data for non typical bridges is illustrated in the Table 12 Example. For comparison, the example corresponds to a typical roadway as shown in Table 8. With the complete set of tables in Appendix A, almost all conceivable roadways could be investigated if typical values such as in Tables 8, 9, and 10 were not considered appropriate.
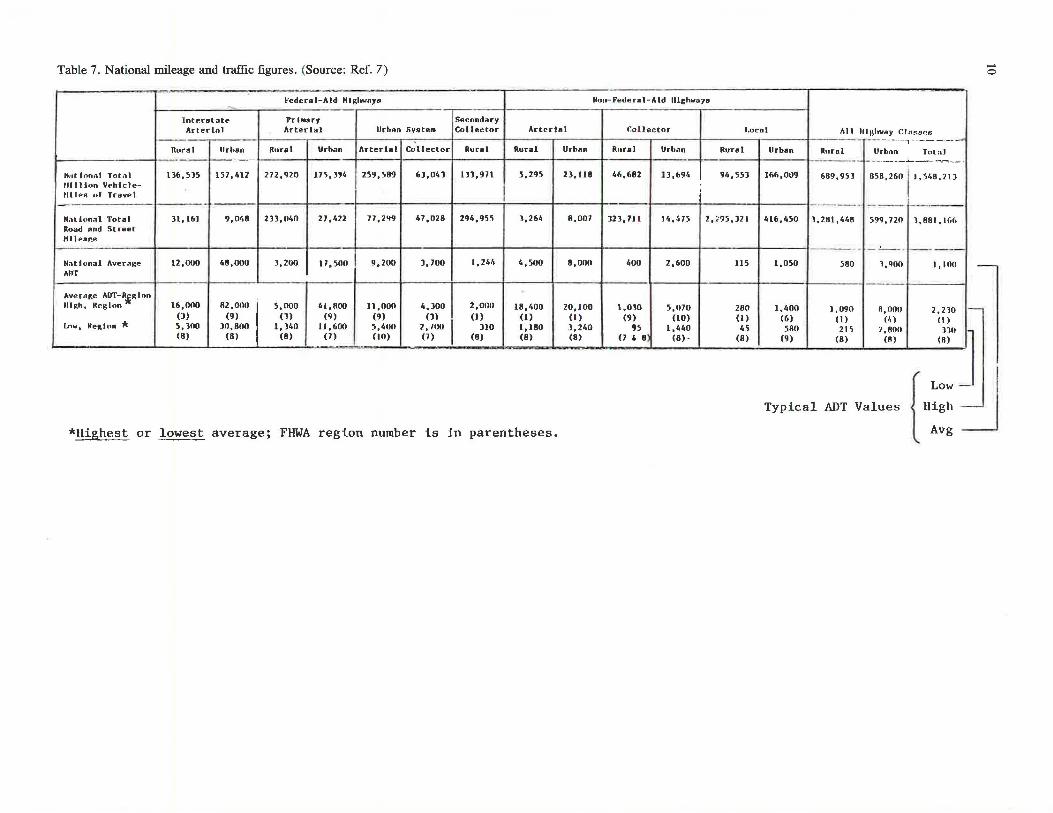
Table 7. National mileage and traffic figures. (Source: Ref. 7)
-Federal-Aid Hlghwnye -
InteTstatl" rrh•ary Secondary Arterlnl Arterial Urban Svste• Collector Arteria l
-Rural Urban Rural Urban Arter la I Collector Rural Rural Ur ban
-Hatl onal Tot a l ll6,515 157,4\2 272,'120 17~,194 259,589 61,041 111,971 5,295 21 ,11 8 llllllon Vt•hlcle-Hl lf!R of Travel
-No1 t l o nnl Total JI, 161 9,048 2JJ,040 21,1.22 77,2'19 47,028 294,955 1,264 8 ,007 Road And St .-eet
Hllea"e - ·
Nati onal Average 12,000 48,000 J,200 17,500 9,200 l,700 l .2'•" 4,500 8,000 All'f
Ave r nge ADT-R_g11 l on lllgh , Region 16,000 82,000 5,llOO 41,HOO 11,000 4,300 2,000 18,400 20 ,J OO
(J) (9) (l) (9) (9) (l) (I) (1) (I) Low, Ke~lon * 5, 100 J0,800 l, 340 11,600 5,400 2.100 I llO 1,180 l ,240
(8) (8) (8) (7) (lO) (7) (8) (8) (8 )
*Highest or lowest average; FHWA region number is in parentheses.
Non- Federal-Aid lllghwu7e
r.ollector l..ocol Al I lll1~hw-ay Clnss<!B
RuraJ Urban Rural
46 ,682 11,694 94,551
'
123, 711 14,475 2,~95,321
400 2,600 us
1,0]0 5,070 280 (9) (10) (I)
95 1,440 45 (7 ' 8' (8)- (8)
-- -----, - --- - -- .....zr
Urban Rural Urbnn Tota] ·- - ~ -----..._...............,.._·~----=---·
166,009 689,951 658,260 1,548,21)
- --- - L--- ·---416,450 J, 281, 4118 '>99, 720 l,881,1(,6
-- - -·- - --- - - -1,050 580 1,900 I, 100
l,400 1,090 R,000 2,210 (6) (I) (4) (I) 580 215 2,800 no
(9) (8) (R) (8)
Typ ical ADT Values i High
Avg
-0
~
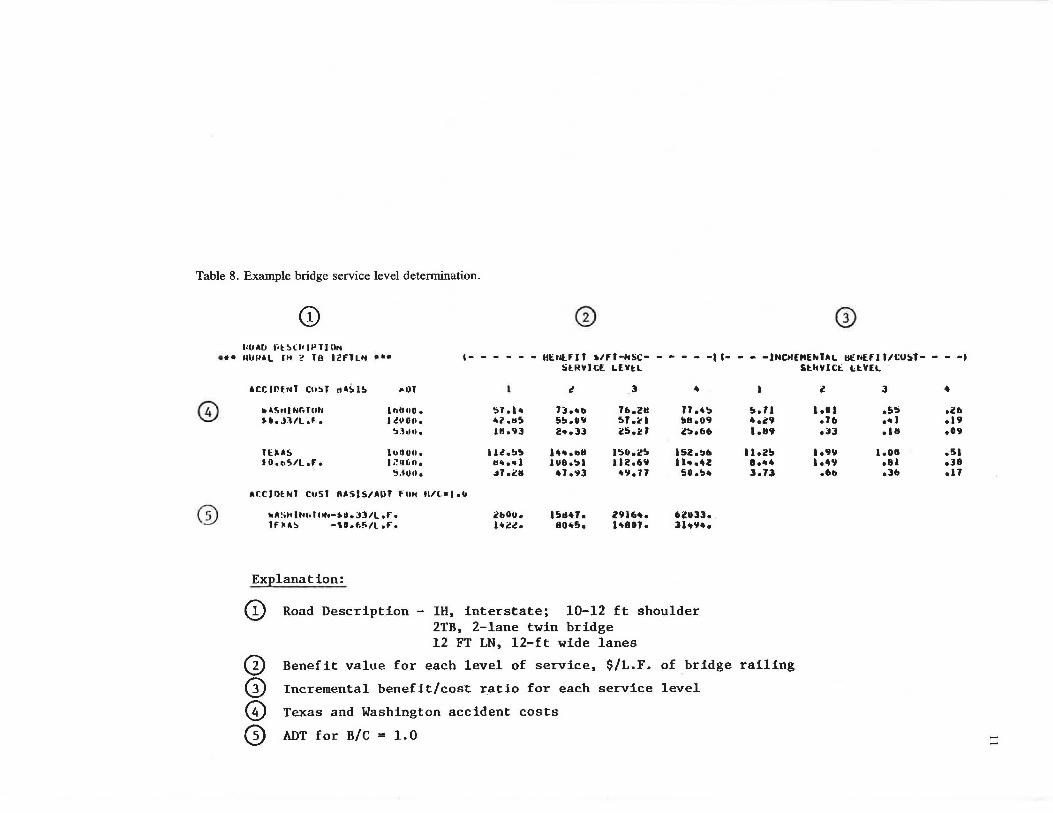
Table 8. Example bridge service level determination.
@ 0 0 l;OAIJ f•t~Cl• ll'TI o ...
••• Nlll/Al IH ? TB 12fTLlll ••• ,_ - - - Ht:tll.F IT '1f.f-NSC- - - - - -11- - - -INClfEMENTlll.. HE NE.fl UCU!tT- - - •I
©
G)
ACC IUtlllT COST rt .. ~ I~ IOOT
11 &SttJ NG TUN ~fl. Jlll of•
nus tD.b51L.Fo
lhUUOo Jt~oo.
~l~u.
l1>CIUU • J ;!CJlill o
o;.tu11.
!Hoh ...... its lffo9l
lll.!Jb ., .... , .j1 .11 ..
St.Hlr I CE 1..EVt.l
' 3 4
7~ ... b 76.Zlt Ho4!11 S!!»oO'il ST oi<' l bBo09 2•oll c5.U l!lio66
......... aso.z!t asz.-:,e. I U8 o!lil 112.6\1 ll•.42
47o'l3 4'1o11 50 .!> ..
11r.CllllNT COST fU.SlSIAl>T Fow ti/( •I ofl
1111:;11 (Nc. Tllff-•U• 3l/L of• lf)AS -IU.6~/lofo
Explanation:
(!) Road Description
iibOU 0
1" i!it. 1Sd4To 8045.
2916 ... l480J.
6i!ll33. 3l<t¥4o
IH, interstate; 10-12 ft shoulder 2TB, 2-lane twin bridge 12 FT LN, 12-f t wide lanes
l
!to 11 4oot9 loB9
llo2!!» ..... 3.73
(3) Benefit value for each level of service, $/L.F. of bridge railing
G) Incremental benefit/cost r.atio for each service level
~ Texas and Washington accident costs
~ ADT for B/C = 1.0
St.kV 1 Ct Lt.YEI..
l J 4
loOl ofl!> oi!ll • 76 ..... ol9 .JJ .... .09
··"'"' a.ott .51 I o4'il .el 038
o6b o3e. .n
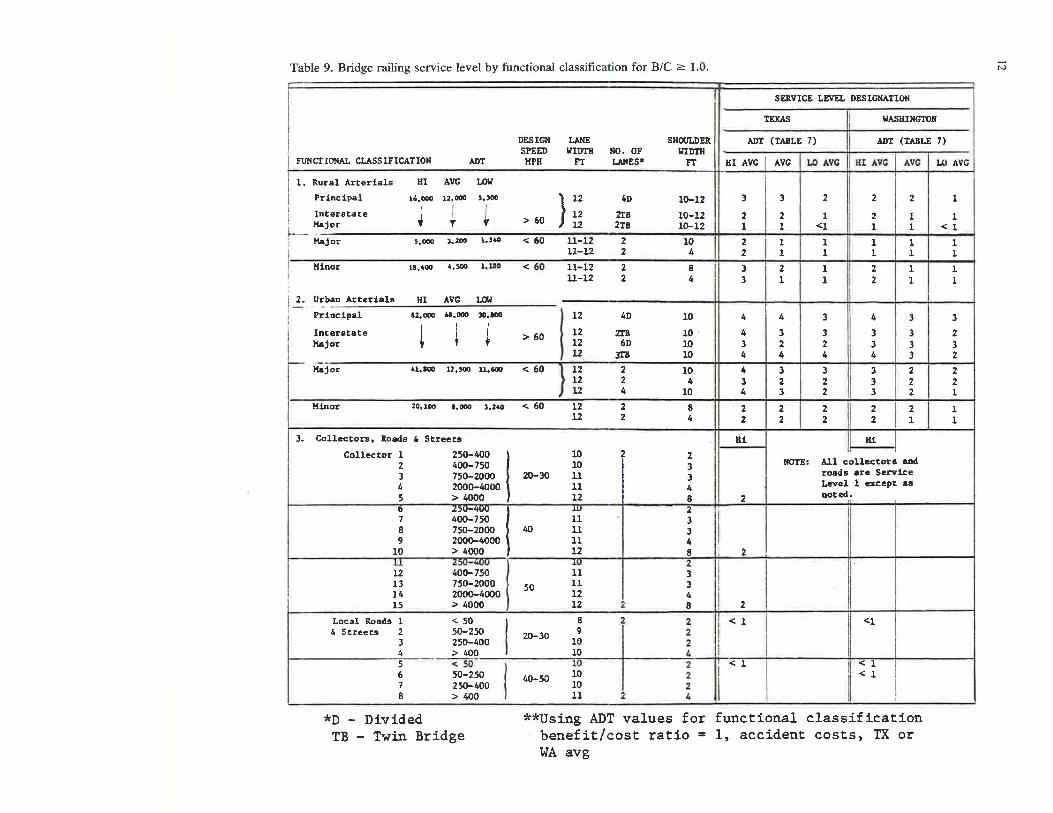
Table 9. Bridge railing service level by functional classification for B/C ~ 1.0.
SERVICE LEVEL DESIGNATION
TEXAS
ADT (TABLE 7)
I II
WASHINGTON
ADT (TABLE 7)
I FUNCTIONAL CLASSIFICATION AM
DESIGN SPEED
MPH
LANE \llDTH
FT NO . OF LANES*
SHOULDER WIDTH
FT HI AVG I AVG I LO AVG HI AVG I AVG I LO AVG
I I 1. Rural Arterials HI AVG LOW
I Principal 1,.000 12.000 5.Joo } 12 4D 10-12 3 3 2 2 2 1
! Interstate I I L 6
12 2TB 10-12 2 2 1 2 1 1 L- ~jor T T' V > O 12 2TB 10-12 1 1 <l 1 1 < 1
1..:.· I
~
Major 5.ooo J.200 l.l•O < 60 11-12 2 10 2 ] 1 1 1 1 1 11-U 2 4 2 1 1 1 1 1
Minor
Urban Arterials
Principal
Inter11tate Major
Major
Minor
19.400 •.500 l. JJO
HI AVG LOW
u.ooo ... ooo 30.800
i r f
41. 100 17. 500 ll, iOO
za.100 a.ooo J.2•0
< 60
> 60
< 60
< 60
11-12 2 a II 3 I 2 I 1 II 2 I 1 I 1 11-12 2 4 3 1 1 2 1 1
12
12 12 12
12 12 12
12 12
4D
ZIB 6D
3T1I
2 2 4
2 2
10
10 . 10 10
10 4
10
8 4
4
4 3 4
4 3 4
2 2
4
3 2 4
3 2 3
2 2
3
3 2 4
3 2 2
2 2
4
3 3 4
3 3 3
2 2
3
3 3 3
2 2 2
2 1
3
2 3 2
2 2 1
1 1
3. Collectors, Ioads & Streets Hi Hi
Collector 1 2 3 4 5 fl 7 8 9
10 ll 12 13 14 15
Local Roads l & Streets 2
3 4 5 6 7 8
*D - Divided
250-400 I 400-750 750-2000 2000-4000 > 4000 Z.50-'tUU 400-750 750-2000 2000-4000 > 4000 :Z.50-400 400-750 750-2000 2000-4000 > 4000
20-30
40
50
10 2 2 10 3 11 3 11 4 12 8 2 lll ~ - 2
11 3 11 3 11 4 12 8 2
lll I 2 .
1 11 3 11 3 I i2 4 I 12 2 8 . 2
< 50 I 8 2 2 I < 1 50-250 9 2 250-400 zo-3o 10 2 > 400 lo 4 I
NOTE: All collectors and roads are Service Level 1 except as noted.
<1
·- < 50- I 10 2 I < 1 ·1 < 1 I 50-2so
40_
50 io 2 . < 1 I
2so-400 io 2 [ I > 400 11 2 4 I
TB - Twin Bridge **Using ADT values for functional classification
benefit/cost ratio = 1, accident costs, TX or WA avg
...... N
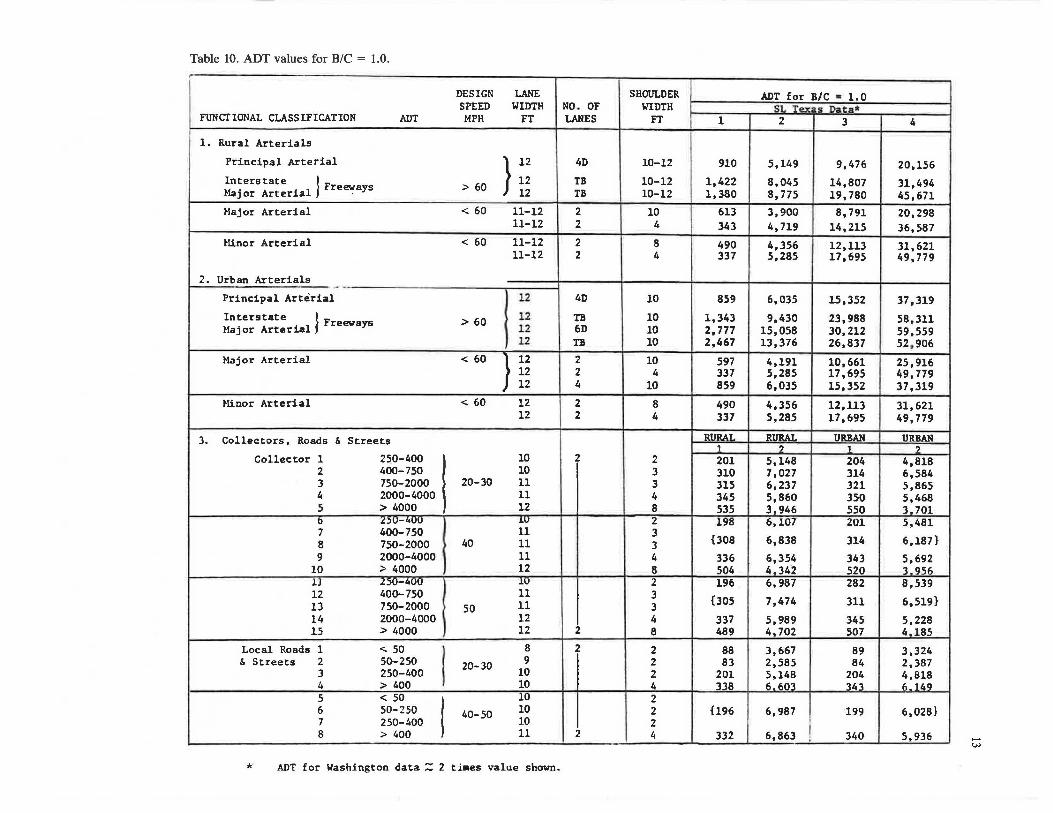
Table 10. ADT values for B/C = 1.0.
DESIGN LANE SPEED WIDTH NO. OF
FUNCf IONAL CLASSIFICATION ADT MPH FT LANES
1. Rural Arterials
Principal Arterial } 12 4D
Interstate J Freewa s > 60 12 TB Major Arterial · y 12 TB
Major Arterial < 60 11-12 2 11-12 2
Minor Arterial < 60 11-12 2 11-12 2
2. Urban Arterials -Principal Arterial 12 4D
Interstate } Freeva > 60 12 TB Major Arterial ys 12 6D
12 TB
Major Arterial < 60 12 2 t 12 2
12 '
4
Minor Arterial < 60 12 2 12 2
3. Collectors, Roads & Streets
Collector 1 250-400 I 10 2
2 400-750 10 3 750-2000 20-30 11 4 2000-4000 11 5 > 4000 12 0 250-lfUU J.U 7 400-750 11 8 750-2000 40 11 9 2000-4000 11
10 > 4000 12 11 250-400 J.O 12 400-750 11 13 750-2000 so 11 14 2000-4000 12 15 > 4000 12 2
Local Roads 1 < 50
I 8 2
& Streets 2 50-250 20-30 9 3 250-400 10 4 > 400 10 5 < 50
I 10
6 50-250 40-50 10 7 250-400 10 8 > 400 11 2
* ADT for Washington data::: 2 times value shown.
SHOULDER WIDTH
FT 1
10-12 910
10-12 1,422 10-12 1,380
10 613 4 343
8 490 4 337
10 859
10 1,343 10 2,777 10 2,467
10 597 4 337
10 859
8 490 4 337
RURAT 1
2 201 3 310 3 315 4 345 8 535 2 198 3 {308 3 4 336 8 504 2 196 3 {305 3 4 337 8 489
2 88 2 83 2 201 4 338 2 2 {196 2 4 332
ADT for B/C • 1.0 •a Texas Data* 2 3
5,149 9,476
8,045 14,807 8,775 19,780
3,900 8,791 4, 719 14,215
4,356 12,113 5,285 17,695
6,035 15,352
9,430 23,988 15,058 30,212 13,376 26,837
4,191 10,661 5,285 17,695 6,035 15,352
4,356 12,113 5,285 17,695
RURAL URBAN
' 1
5,148 204 7,027 314 6,237 321 5,860 350 3 946 550 6,107 201
6,838 314
6,354 343 4.342 520 6,987 282
7,474 311
5,989 345 4,702 507
3,667 89 2,585 84 5,148 204 6.603 343
6,987 199
6,863 ! 340
4
20,156
31,494 45,671
20,298 36,587
31,621 49, 779
37,319
58,311 59,559 52 , 906
25,916 49, 779 37,319
31,621 49,779
URBAN 2
4,818 6,584 5,865 5,468 3 701 5,481
6,187}
5,692 3 956 8,539
6,519}
5,228 4,185
3,324 2,387 4,818 6. 149
6,028}
5,936 -<.;.>
14
Table 11. Bridge rail length encroachment rates.
. . .. 3 u
" ~ !i Oil
~
. . .. ~ " ~ .s ~
Brid oe Narrownes s Strata Bridge Rail Length No . Bridge Slloulder Encroachment Rate
Lanes Width Reduction ENCR/10 Mi-10 Yr-ADT•
1 <1s 1 - . 233 >1e' - -
< 18 ' , <Approach - . 308 ~18 1 , ~Approach - -18'-20' , <Approach - . 234
"' 18 1 -20 1
1 ~Approach - . 225 . 20'-22', <Approach - .168 "' 2 20'-22', ~Approach - .244 ... .;: 22 '-24', <Approach - . 109 "' c 22 ' -24', ~Approach - .102
"' >24' >50% .081 >24 ' 1-50% .062 >24 ' none .072
>50% -4 n/a 1-50% -
none . 051
:-so% . 0?8 4 n/a 1-50% . 050
"' none .oso . ::i > >50% . 016 ...
0 other n/a 1-50% -
none • 017
<24 1 - .029 >"24 ' >50% . 025
2 >24' 1-50% . 026 -g ::i >24 1 none . 032
~ >50% .026 0
other n/a 1- 50% . 033 none .019
"Corrected for difference in bridge length and bridge rail length; median barrier on bridge is not considered bridge rail.
CHAPTER THREE
CURRENT BRIDGE RAILING TECHNOLOGY
INTRODUCTION
During the course of this project, an in-depth investigation of all aspects of bridge railing technology was conducted. On the basis of preliminary findings, a new low-cost bridge railing conforming to SL 1 requirements was designed and developed. A critical assessment of the existing AASHTO Bridge Specification was made and deficiencies were noted. Current bridge railings with known performance evaluations were examined for SL designation according to comparable crash test conditions. Guidelines for implementing upgrading programs using the MSLA for identifying priorities were also investigated.
SERVICE LEVEL 1 BRIDGE RAILING DESIGN AND DEVELOPMENT
Background
For the purposes of this project, it was determined that low-cost bridge-railing systems to be considered would be constructed of metal beams mounted on equally spaced
posts. Performance of the concrete safety shape bridge parapet is well documented and no further work was considered desirable for this system; however, the concrete safety shape should be considered as a possible alternative to the other systems developed in this effort. Preliminary design efforts were conducted using computer simulations to determine design requirements. Experimental work was accomplished to provide performance data on the component posts, and finally crash test evaluation of the systems was accomplished. Revisions made to the systems based on the findings of the initial crash test experiments were accomplished prior to crash test evaluation of the recommended designs .
Results of the final crash tests were compared to the simulations used in the design effort. Certain modifications were made to the input based on observations of the test results.
Criteria
Basically, the SL l criteria require the containment of a 4500-lb (2040-kg) vehicle impacting at 60 mph (95 km/h) and a 15-deg angle. Service Level 2 requirements correspond to the current AASHTO (J ,2) specification crash test option;
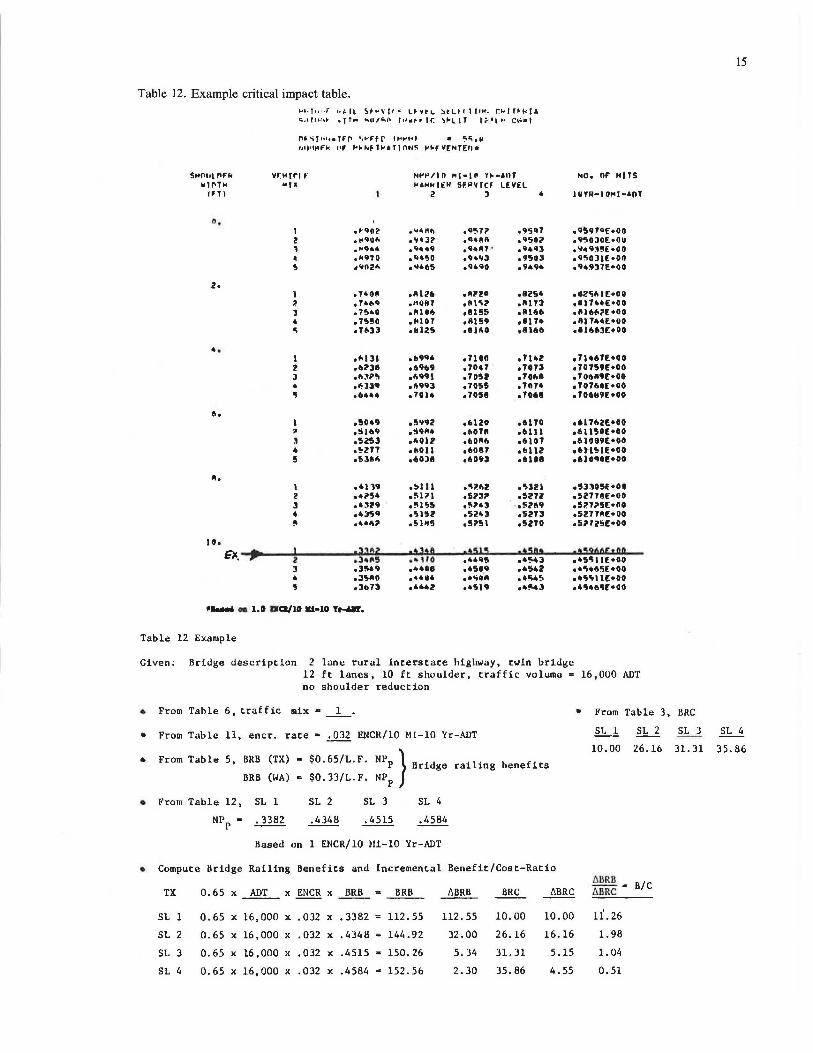
Table 12. Example critical impact table. ~1.J11 .. r '•I.IL~,....,._,,., Lf-Ytt... ~tlt-1lt1tt. r."'Jff-h[.I :;.,qh1,t -.JT,., "'111er-.f\ l•'•t-t- IC '>"'LIT li-•t to• C'••I
OF~f1;1.-TFr" '11-'F'tl' O•..,t•I ~~.u
r1tl•l"f'~ l•F "" Nf T,_ AT I Ori~ l'~F YfNTEO *
5 .. f'lol l'FI< Yf:M(rl f Nl' .. /Jn Ml•ln Y~·•OT "Oo OF' HITS ~Jl'TM .. , ~ !'AHl<Jt:H Sfl>YIC:f LEVEL
!FT l 2 J • lUYR•IOMl•AOT
n, 1 ,PQO~ •"-4ttb oQ!'7i" o9SQ7 o9~97G£o00 z ,l'QU., o'tO? •q•AR ,'1501 o9'50JOE•OU 1 .-.. ... ·""'"'' ·"""' . o'l4QJ o'l4'1J5E•OO ~ o1<9l0 ,Co4SO o'l•'IJ 09503 o'l'iOJIEoOO '!I •"Ill .. ,'1465 094'10 09494 ·"•937£•00
lo l 0 74811 011126 olll2CI 0112!14 o825#i I E•OO I! oT•fl'I 01111117 olll'il ,111n ,817UE•OO l • 7!!>•0 ,11106 .uss ,11)66 olll6fll'E•OO
• , T'!ISO ,,.IOT ,11159 ,81 T4 ,81 T44E•OO 'i • Tfl33 .1112s oll#iO ollU.6 .11663[+00
•• I ·"Ill ,6994 oTIOCI , Tl42 , 7H6TE•OO 2 .6138 ·•9•9 ,TOU e70Tl e7GTS9E+OO J ... ~?!I ·"•91 ,T0!2 ,TOf>ll ,706119[•00
• ,,,,, . ,6993 ,1oss ,7074 e 10760[•00 'I ,6••• ,7014 ,70511 .7068 .70.119[•00
"· I .5049 ,5'192 ,6120 .6170 o61Tfl2E•OO ~ ,Sll•'I .!i'l114 of>OTll .61 ll e6l150E•OO ~ e!i253 ,,.Oil e60116 o610T .61089[•00 4 o'!>ZTT eflOl l ,60117 .11112 e6H'!l1E•OO 5 o'!llll" .6038 .11093 .6108 o6lD•OE•OO
llo \ .41l9 o!il 11 o'li!#i2 ... 321 .~JUSf'-00 2 ·•?54 e'lli'I ,S?J? .szn e52TTllE•OO 3 04:129 ,!1155 ,!1?43 oSl.'119 o!ii!7?SE•OO 4 ,4359 ... l!il.' o5l4l ,52T3 0521711[•00
" ,44,.;o .s111s e!ii''!ll .sno o5172!iE•OO
JO,
9. ~ I ,;13~2 .~l!I .~51~ .s:.aSi S5i66E1121 l .3•115 ..110 04495 ··~43 ,4S'lllE•OO J .3!';•• ··•01 .4509 ,4542 e4'146'1E•OO
• .3!11111 ·-•@• .. -;,; .. ·•!'14!'> ..'1 .. 11[•00 '5 .lc.73 04442 ·•519 ·•!143 o4'1•6'1f'.•00
...... • 1.0 DCl/10 IU.-10 T ......
Table 12 Example
Given: Bridge description 2 lane rural interstate highway, twin bridge
.. •
•
•
•
From
From
From
From
12 ft lanes, 10 ft shoulder, traffic volume = 16, OUO AD'f no shoulder reduction
Table 6, traffic mix • 1 • From Table 3,
Table 11, encr. rate = . 032 ENCR/10 Ml-10 Yr-ADT SL l SL 2
10.00 26.16 Table 5, BRB (TX) • $0.65/L.F. NPP} Bridge railing benefits
BRB (WA) • $0.33/L.F. NPP
Table 12, SL 1 SL 2 SL 3 SL 4
NPP = ~ .4348 .4515 .4584
Based on l ENCR/10 Hi-10 Yr-ADT
Compute Bridge Railing Benefits and Incremental Benefit/Cost-Ratio ti ll RB B/C
TX 0.65 x AD'f x ENCR x BRB BRB l'iBRB BRC /l.BRC LiBRC =
SL 1 0.65 x 16,000 x . 032 x • 3382 = 112.55 112.55 10.00 10.00 ll.26
SL 2 0.65 x 16,000 x .032 x . 4348 144.92 32.00 26.16 16.16 1.98
SL 3 0.65 x 16 ,000 x .032 x .4515 = 150.26 5.34 31. 31 5.15 1.04
SL 4 0.65 x 16,000 x .032 x .4584 = 152.5b 2.30 35.86 4.55 0.51
15
BRC
SL 3 SL 4
31.31 35.86
16
barriers designed to the AASHTO barrier criteria are known to be essentially unyielding barriers for these test conditions. Thus, SL 1 system performance requirements are considerably less demanding than the current crash test specification option of AASHTO and even less demanding than the design load criteria. The crash test option of AASHTO also requires conformance with the small car impact severity test of TRB Circular 191 (8). No known bridge railing system has been shown to meet this part of the criteria, although this was a design goal of the SL 1 system of this project.
Current Systems
A limited investigation of current systems that might be candidates for SL 1 application was conducted. This investigation did not result in candidate selection for further investigation.
Design Considerations
For this design effort, beam on post concepts were considered exclusively. Appendix C describes in detail the systematic design, development, and evaluation of the two SL 1 bridge railing systems. The systems are constructed of thrie beams mounted on posts spaced at 8'4" (25 cm) centers. The post and attaching hardware represent the significant difference in the two systems; one used steel posts and the other wood. These new railing designs essentially meet the acceptance criteria ofTRB Circular 191(8) with the exception of the new structural adequacy test requirements.
The concrete safety shape has recently become a widely used bridge barrier system. Performance of this barrier is documented in numerous reports. Installation costs have varied widely, but it seems reasonable that any new barrier system, including the SL 1 systems described in the following, should be compared on a local level with the safety shape for both performance and economics.
Evaluation Findings
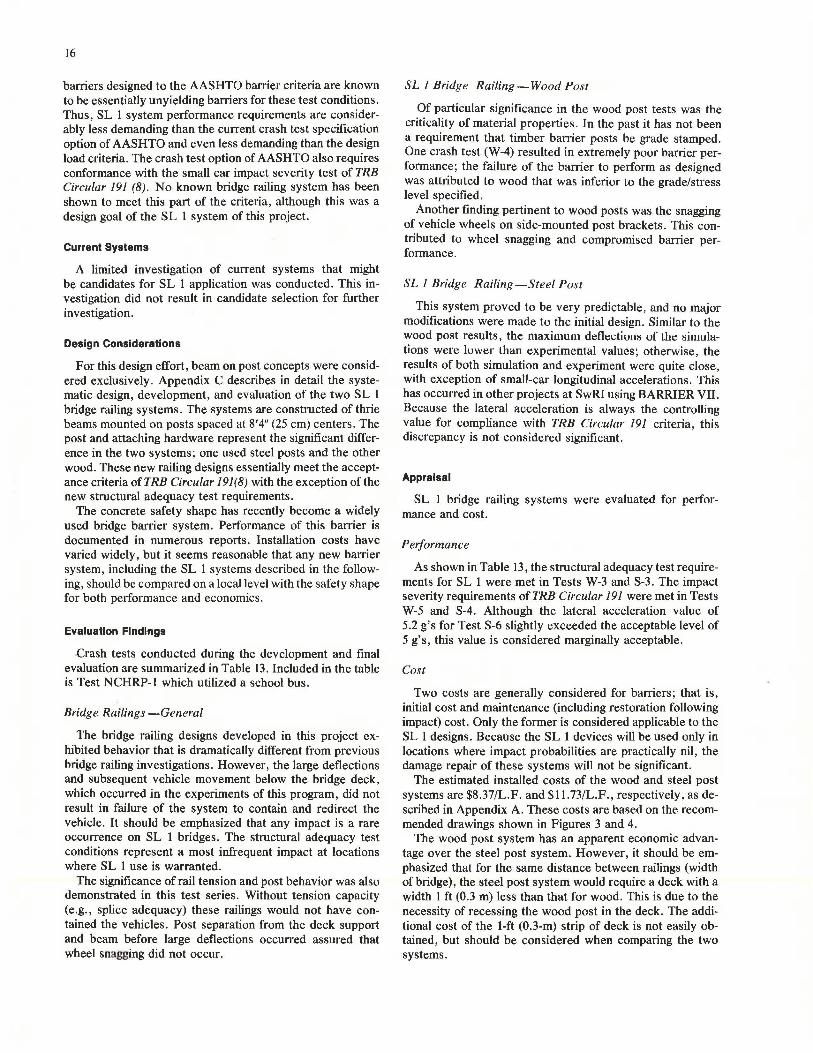
. Crash tests conducted during the development and final evaluation are summarized in Table 13. Included in the table is Test NCHRP-1 which utilized a school bus.
Bridge Railings-General
The bridge railing designs developed in this project exhibited behavior that is dramatically different from previous bridge railing investigations. However, the large deflections and subsequent vehicle movement below the bridge deck, which occurred in the experiments of this program, did not result in failure of the system to contain and redirect the vehicle. It should be emphasized that any impact is a rare occurrence on SL 1 bridges. The structural adequacy test conditions represent a most infrequent impact at locations where SL 1 use is warranted.
The significance of rail tension and post behavior was also demonstrated in this test series. Without tension capacity (e.g., splice adequacy) these railings would not have contained the vehicles. Post separation from the deck support and beam before large deflections occurred assured that wheel snagging did not occur.
SL 1 Bridge Railing-Wood Post
Of particular significance in the wood post tests was the criticality of material properties. In the past it has not been a requirement that timber barrier posts be grade stamped. One crash test (W-4) resulted in extremely poor barrier performance; the failure of the barrier to perform as designed was attributed to wood that was inferior to the grade/stress level specified.
Another finding pertinent to wood posts was the snagging of vehicle wheels on side-mounted post brackets. This contributed to wheel snagging and compromised barrier performance.
SL 1 Bridge Railing-Steel Post
This system proved to be very predictable, and no major modifications were made to the initial design. Similar to the wood post results, the maximum deflectiuus uf the simulations were lower than experimental values; otherwise, the results of both simulation and experiment were quite close, with exception of small-car longitudinal accelerations. This has occurred in other projects at SwRI using BARRIER VII. Because the lateral acceleration is always the controlling value for compliance with TRB Circular 191 criteria, this discrepancy is not considered significant.
Appralsal
SL 1 bridge railing systems were evaluated for performance and cost.
Performance
As shown in Table 13, the structural adequacy test requirements for SL 1 were met in Tests W-3 and S-3. The impact severity requirements of TRB Circular 191 were met in Tests W-5 and S-4. Although the lateral acceleration value of 5.2 g's for Test S-6 slightly exceeded the acceptable level of 5 g's, this value is considered marginally acceptable .
Cost
Two costs are generally considered for barriers; that is, initial cost and maintenance (including restoration following impact) cost. Only the former is considered applicable to the SL 1 designs. Because the SL 1 devices will be used only in locations where impact probabilities are practically nil, the damage repair of these systems will not be significant.
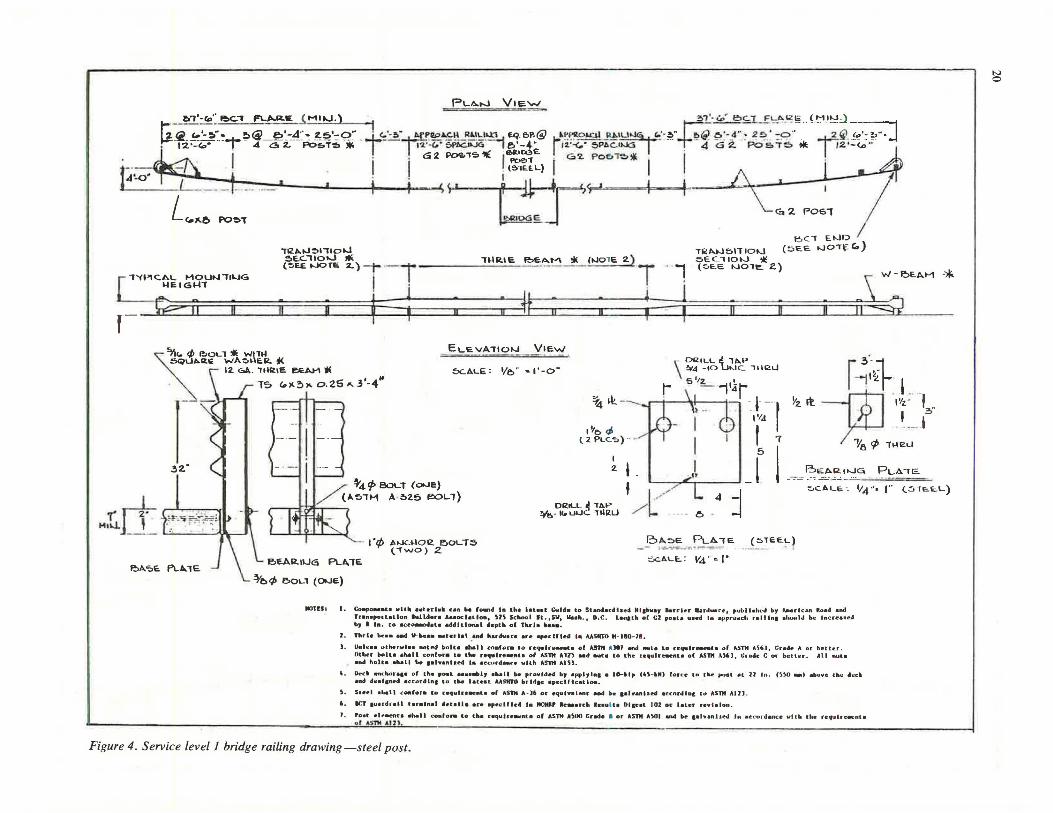
The estimated installed costs of the wood and steel post systems are $8.37/L.F. and $11.73/L.F., respectively, as described in Appendix A. These costs are based on the recommended drawings shown in Figures 3 and 4.
The wood post system has an apparent economic advantage over the steel post system. However, it should be emphasized that for the same distance between railings (width of bridge), the steel post system would require a deck with a width 1 ft (0.3 m) less than that for wood. This is due to the necessity of recessing the wood post in the deck. The additional cost of the 1-ft (0.3-m) strip of deck is not easily obtained, but should be considered when comparing the two systems.
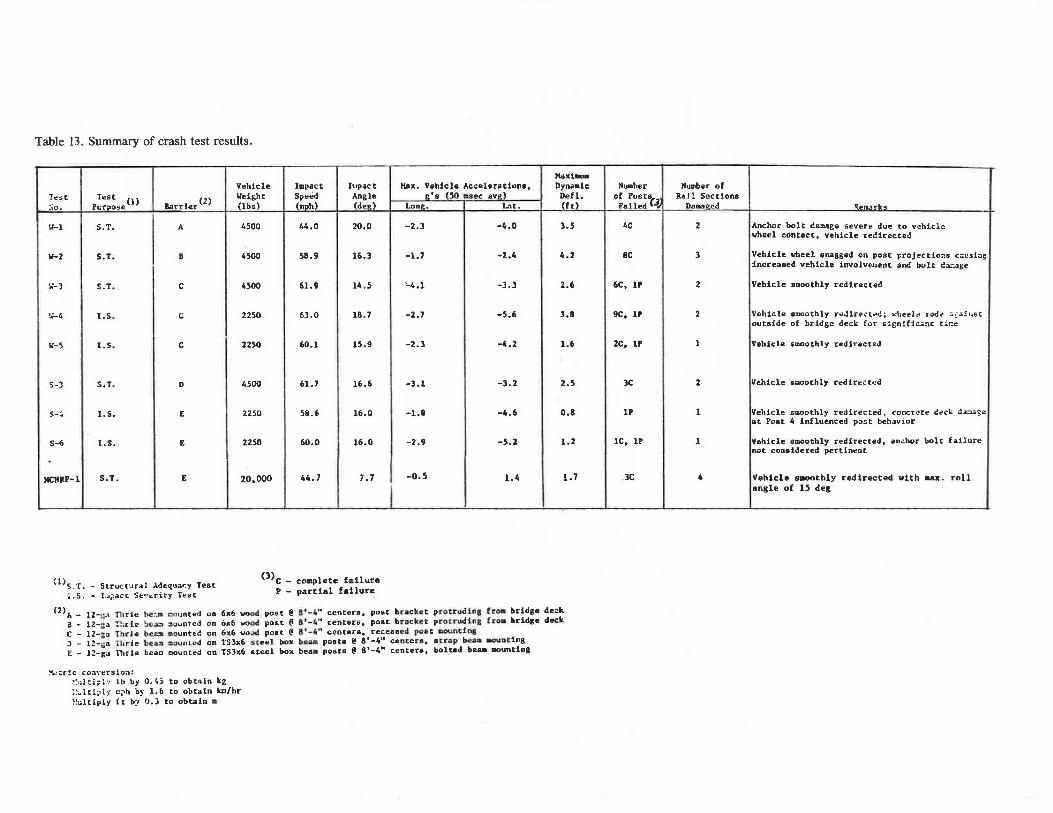
Table 13. Summary of crash test results.
!est Tt!st (1) Barrier <2> :;o. P~r11ose
11-1 S.T. A
11-2 S.T. II
',;-] S.T. c
?;-4 1.S. c
11-5 I.S. c
S-3 s.r. D
S-!t 1.S. E
S-6 1.S. E
NCHRP-1 S.T. E
'l) ' S.T. - Structural Adequar.y Test l.S. - l~;act. s~v~rity T~st
Vehicle Impact h1pact lleight Speed Angle (lbs) (mph) (dee)
4500 44.0 20.0
4500 58.9 16.3
4500 61.9 14.5
2250 63.0 18.7
2250 60.l 15.9
4500 61.7 16.6
2250 58.6 16.0
2250 60.0 16.0
20,000 44.7 1.1
(l)C - complete failure P - partial failure
Haxt .... Max. Vehicle Accelerations, Dynamic
.,•s (50 ".sec ave) Defl. Lon1>. L~t. (ft\
-2.3 -4.0 3.5
-1.7 -2.4 4.2
'-4.1 -3.l 2.6
-2.1 -5.6 l.8
-2.l -4.2 1.6
-].l -].2 2.5
-1.8 -4.6 0.8
-2.9 -5.2 1.2
-0.5 1.4 1.7
(Z) t. - 12-1;.1 TI1 rie loc:.JO "'' unted on 6x6 wood post @ 8'-4" centers, post bracke t protrudln9 fr- bridge deck a - 12-:;a l?,rlc ~C:.a::t. 30\JOted on 6.x6 wood post @ 8 1 -4°1 center&, post bracket protruding fro• bridge deck C - 12-z.a Thrie be.~ mountf"(! on 6x6 wo.xl poet @ 8'-4" centers, recessed past DOUntins: l - 12-:b:i Tlt rie bea:a muunted on TSJx6 steel box beaa posts @ 8 1 -~ 11 ceateca, strop beam mounting E - 12-ga lbrie beac ciounted on TS3x6 steel box hea• posts @ 8'-4" centera, bol_ted be .. mounting
~-.!:r!c conversio:i: ~:1;lti;:l.~1 lb by 0~'•> to obtain kg ::-.lti~ly c;-h i>y 1.6 to obtain kc/hr ~!c.:ltiply ft b;- 0.) to obtain•
Number Number of of Posts Ral! Sections Felled(~ Damucd S.emarkc
4C 2 Anchor bolt damage severe due to vehicle wheel contact, vehicle redirected
BC 3 Vehicle wheel snagged on post Frojections c~cslng increased vehicle involvement and bolt da=.age
6C, lP 2 Vehicle smoothly redirected
9C, lP 2 Vehicle amoothly r~Jire.:t-.?di l.."h2ela rod.? .'.i_;ainst. outs1de of bridge deck fur si&nificant tir.e
2C, lP 1 Vehicle smoothly redirected
JC 2 Vehicle sgoochly redire~tcd
lP 1 Vehicle s:ROothly redirected, concrete C.~ck d~se at Post 4 influenced post behavior
lC, lP 1 Vehicle •moothly redirected, anchor bolt failure not coaaiJered pertinent
. JC 4 Vehicle S110othly redirected with max. roll angle of 1.5 deg
18
Application
The SL 1 bridge railing systems are recommended for installation where warranted according to the criteria of Chapter Two. The recommended design drawings are shown in Figures 3 and 4. Limited information regarding bridge deck design is shown on the drawings. Because bridge deck designs will vary considerably, a working stress design force of 10 kips (45 kN) applied at 22 in.(550 mm) above the deck is recommended in the drawing notes. Use of this design force and working stresses should assure the designer that no significant bridge deck damage occurs during an impact (i.e., the failure load of the post will control).
BRIDGE RAILING PERFORMANCE AND DESIGN CONSIDERATIONS
Background
During the course of this project, a comprehensive bridge rail investigation was being conducted at the Texas Transportation Institute (TTI) for the FHWA (4). This project could, and probably will, advance the state of the art significantly regarding bridge railing behavior and dynamic force interactions. Because of the large amount of data gathered and the timing with respect to this project, much of the insight to be gained from this effort is yet to be realized. Nevertheless, the reader is encouraged to follow the progress of this contract and some of the findings are cited in this report. Some of the statements made in this chapter may be dated in light of this recent work; however, based on the author's knowledge at this time, the following is offered.
Currently, bridge railing systems are designed to the AASHTO specification (1,2). This specification uses a basic 10-kip (44.5-kN) force which is applied to the beam and posts according to relationships described in the specification. An alternate way of qualifying bridge railing designs is by crash test. The crash test criteria as specified in TRB Circular 191 have been revised in NCHRP Report 230 (9).
There is apparently no relationship between AASHTO load criteria and the crash test requirement. Although not stated as a design objeclivt!, tht! static force criterion is generally believed to guarantee little or no damage to the railing system during the severe strength crash test (4500-lb (2040-kg) car, 60 mph (95 km/h), 25 deg)(JO). The ultimate containment capacity of these railing systems is not known. Furthermore, the margin of safety to which the system has been designed to this static criterion will influence its ultimate capacity. In other words, the AASHTO static force is a lower limit and overdesigned bridge railings are not prohibited. The current AASHTO specification does not specify behavior of the barrier past the elastic range. The failure of a post, for example, could occur either above the deck or within the deck itself. Designs with forces limited by deck failure are considered to be unsatisfactory for a number of reasons:
1. The failure mechanism in the concrete deck is complex and therefore cannot be reasonably predicted.
2. Bridge deck repair is a costly item compared to simple replacement of posts and beam.
3. Deck damage may go unnoticed until a more severe impact causes noticeable failure. The weakened structure will not perform as designed.
Other railing components such as beams and hardware should also be considered for ultimate performance. A bridge railing system that performs well in the elastic/small deflection range, but breaks down far below its ultimate capacity because of some undesirable failure mechanism (e.g., lowered system height allowing vaulting, beam splice failure due to fastener inadequacy, etc.) represents inefficient use of materials.
Careful study of the relative merits of the AASHTO "prescriptive" design method and the performance standards approach has led to a number of observations and conclusions. After 12 years of intensive barrier development and testing using all available tools, design methods, computer simulations, laboratory experiments and full-scale vehicle crash tests, the authors are convinced that the prescriptive design approach is inadequate to effect barriers with predictable containment and safety performance. On the other hand, with pt!rfuuuauct! stamlanl approach, a trnrnl is furt!St!t!H toward a limited number of carefully developed standard barrier designs; this trend will be accompanied with a decrease in design time spent by every agency in devising its own unique systems, a reduction in material costs because of standardization and smaller number of inventory items, and an improvement in safety performance because of the more comprehensively developed barrier designs.
A pertinent example of use of computer simulation and/or crash test methods is the concrete safety shape. On the basis of design load criteria, there could be no selection of the standard New Jersey profile over the General Motors profile (both can be constructed to the same structural requirements). Crash tests and computer simulations (HVOSM) demonstrated that vehicle rollover occurred with a subcompact vehicle impacting the GM barrier at 57 mph (91 km/h) and 16-deg angle). A similar test with the New Jersey barrier (59 mph (94 km/h) and 16-deg angle) resulted in smooth redirection of the vehicle with a roll angle of 20 deg.
Bridge Railing Performance
Bridge railing systems function satisfactorily by containing <1nd redirecting impacting vehicles. The performanc.e. of a system may be measured by the threshold impact conditions where the system could be expected to fail. The development of a redirection index described in detail in Appendix A facilitates the calculation of equivalent impacts. Thus, critical impacts are determined that describe the performance limit of a particular design based on a defined impact.
Performance Goals
Bridge railing performance must be quantified to provide a basis for evaluation; i.e., does this barrier system perform satisfactorily at the desired service level? Two criteria are primarily used to evaluaty longitudinal barrier systems (8,9):
1. Occupant risk-Ideally, the bridge railing will redirect (without rollover) small passenger cars with minimal occupant injury potential. This criterion as recently changed (9) generally represents less demanding performance of bridge railings than the previous criterion(8). The occupant injury criterion is based on impacts occurring at 60 mph (95 km/h) and a 15-deg angle in recognition that impacts of higher angle are infrequent at this speed.
2. Structural adequacy-Unlike occupant risk, barrier

PL6..tJ VIE'\r./ _~,·~, FL.A.U. ~·~· !!"J'.(..:__~s,!_f:l.,,_~~-{!:"'~":J__j_ __ _
~Qy'-?>''• r~~~.26'·0" --- ·-~· Pr~ !WU~. E.Q.6P. lnQof>'\.I !1J,.'4!:JGi ir.'·?I" ~_.!il_~ 'l• z5'·0" _ _ 2 -~~@<..'·bJ . l:Z'-t..•• 5 <lR.2. PO~,e(llllrE•) 12."-C.." ~11..i~,Q e,•.4· ri2.'-<.." C:>l'l-::.ltJO. I 1-1,_.:, OIZ.2. PO~T5 r· 12.' - c..- '
-~- i i GR."2. ~T5 _. !)!.~~£ i Gll.2. po:,~ll'i i . ~ r.;::;i f\ , b ~ _ _ 1 r, r _ _ _ ~ I • , '- BC, ENO •
~-- -' - • I I I i1 == ~ r,~ I I I - I ' ... ..,,. ~ \.",..f!, ~T I \ .. GR.~ PO~"T
l!IR.• E •
"TUl.J~l"TIOIJ "TR.A...,~ITIOtJ 5EC. "TI 0 oJ f TlllU E l!,ISA.M t 51EC. 'Tl OU ..
(~liE i..10,.: 2.) I J 1 ·~ (:>EE !Jo,&: 2.)
["T'iPl~~IG~~··nn.Ju . . . . . r 'W- ~EAM•
' Cj( ii ii ii ii ii ~ ~ : * : : ~ f ii ii ii ii ii=TI1 ELE.VA.'llOIJ V1•w
SC.A.LIE: \!" •• 1'·0°
IZ. GA. 'fMQI~ IJEAA (I ~ ....
~P..
(o (j1 1 --r----,
'\ • Al.JC.I.lo£ e.c>L"T&
~ L6..G ~t;;.W
-- · ~~~· __j ~
~ W'OOO 5PACIER
'. - 2."
SEE 1=' A.·nACllt'l~t.JT ,.._.;;. OE "TA.IL "A.·' -
y1-1 _:1/ 91"
L, . ,,_ 2. t. ·1~
e>E ... R.11.JC. etR.A.C..l(.El lflY/rl
~"" j ,. l_j ""<::::::.:::7 2
az•
<.1tC. ' ~'P. WOOD P051' - - '~ 10
.... (
j = TYP OFZ. RAIUIJG (..a.,.~ .)
M~ J 7• _l fAe>atCA.TE FllOI-'\
!& 7
:_J I "' Y& !;."T~EI.. fl.
!lo'1:.: ftA.D. "T'IP.
~ • -i ~p uoe.e. 511~· o.._. e.oLT-=>* , 2 1 • ~I.JO 5Q. WA~MER tll
o/o DIA. ~ Lf - OF <!i-:l. e,.ti.RA.IER..
-- A, , l\C~ME"-1, De.TA.IL • A·--
· ·~A.\..E: 11,.,"• I" \. l~·~~ l (Coo.JC.R.E..,E.)
- -C:.Ol>J£:R.E"'l"E. MA.U~C.1-1 ~ 3 (.WOOD) (.OR WOOD l!IUX.I( 801..,EO '10 ~c.K.)
1•-0• ~
'Jft1 r21;~zj:1 ~=H+-~·. ~-· I~ ~OL.li& -
(Tlllt.H)
e>s.A.R.l....iG r>R.A.Cl(.E 1 ( t'>C:AU,: !{_)
("T~ £11. ?>>I 0.1~&)
mortt: * l. CaepotMHlt• wtt• .. t•rh• c•• e.. fUUIMI I• the l•t••t C.lde to lt•Dda.-4he4 llP.r 1.rl'IH •r.,•H .... ll•he41 •r Amnlc•• load aBd Tre .. portatlu. ......... beoclatlo•t 5:15 School St.,sw, V.at.., e.c. LPnath ol CU poeta .... la •nroach ralllq •• .,.. .... IMl'h•_. •r IP. to aeco_,..ata mddltlonal ... th of Ilaria h-.
l. Thrfe he•• and V-"•- -terlal anll hairdvar• a1·e •pttrlll• In AASllTO Hll0-11. ll~·a .. ~pl t,·1•111 a1·1· p••rntil I rtl l1t•I wr~r11 l"•StR.
J. UnleH othervha noted ltolt• .... ll con(or. to r.,uh~h of ASlH A]01 .... nuta to l'elJuln.-nt• of AS111 A5i.J. Cuda A or lte-tt•r. Otht!'r hit. ahll confor• to the requh~nh of A.Slit AJZS ....t •H•lm to the re,utr~nl• ol AS1M AS6J. Gr.te C or ••tt•r. All ... o and holte ehall .,., plwanh.d I• acconllNIC• 11lth ASlN AISJ.
4. nee-• anchon1e ol the pnat ... ..a.1, •hall "• prn.ldrd .,, applytn1 a 10-Up (4'-k") force tn tha poat •t U In. (SSO .-) al.nw• the ••c• and ...... ed accnrdl•• to tt. htf'•t AA51R'O brld1e •p•r.lfh:atlnn.
S. Sr.rel 11l1all cnnfor• to l"l!'1Hh~nt11 of ASlll A-J6 nr ~lv•l•nt anti be aalv ... hed accortllna to A.c;nt AUl.
6. IM(T KUH"drall ter•l11al tl•hlh .re 11rcUtH I• llCllltr IPa•arcll IH•IU Dl1eat 102 nr hter reTl•lon. OtMor apprn.ch r•llln1 •et•ll• are •hmlft tn Jt11 MSHTO Gulde for S.lrctl111, l.nrAtlnR an• DHl1al111 Tnfltc .. rrlen or btHt v•nloa.
1. Stnactunl tHbln1 ahaJI confor• to the rPqulr..eRta of AMII Asoct, Cu4• 0
1 or AS'IM ASOI •nd "• 1•h,..h .. In HCOl"d•~• vlth the .-.quhf'M'nt• ol AS111 AUJ.
I. =~~~· 1::8:.! •. :"" c:::• t=~.::::~: .. ':. .. :O.;.,' S:~..:r:r •='~!" .. :!::.: ::~:u~; .. z::h:~ =~!:; .. ::t. • .!!!: ,:::.:~ .. , ;,,.~~8:::• .. :~~ • .::.. •: .. ·~:'"!::• • 4t ..... alnn•I tolt-tlnM"• of t_l/4" H •hnvn 011 drawl.._. All tl_..r .. hat I rtt11he a pre .. erv.t he treal-•l 111 accord~• vllh AA!'l:llTO 0.11lp111 Ion •111.
Figure 3. Service level 1 bridge railing drawing-wood post.
PLt...N VIE~
r.,·-ro·: ~, ~"'-RE ( M1i..J.) I ?>'1 '~.S:.L.E~-~ 1§ . ~~·~.J ___
ti .~- ~·-~·~ ..... ~@-~~-::4'' ". ?:,~'::Q'.' _~·- ~-tto.t'f'.11P~~_R~!::,1.~ Eq. e.P.@ .... !'.~Ou:.! iu.~·;>"+~@. ~'.-.. 4" ~ ~~,' :P" -r2~. ~·:~ ... J , 12·-<..· 1 .4 a.:z.. PO~T~"" I 12·· v " &P6C.JIJC> 1e.'--4-•
112·-<.· 5Pa.ci~. I 4 G2.. Po&T5 fll: 1~ ·-<o=A"
. ~ I . . G:Z Po'Q-rS11f: J·e.=E I G 7. PoC."T"e>lJ 1· .
f.·- - . . I I . l~lE.EcL} I 1 ..t•o• t . I . D - 7
. I • I • * - '.'ti II IHJ--'JT-'* ~ t~ ! I
C:, 2. POG'l <.JllO PO~'T ~§.
!!>C, E "10 I "JIZ&..IJ:>l"JIOU "TRA."151"1101-J (::.E.E. >.JO"T~ G.) ::>E.C."JI0'--1 ii< "Jl,.IR.IE P->E.A.M ~ (i...IOl E 2.) SE.C."TIOl-J ll( l ~EE ....ioTE :z..) -r - T T · · 1 ( ::.E.E !JOU~. 2.)
r"J '(l'IC.AL MOUN"Jlt..JG I . ~W-~E.A.M -~ HE1G1-n · · J
.L.---FQ:::;: jj k ___ ±_s_L=! ___ :_ ; # ~ - : ! -_j____ n n n n~ r-ELE VA"TIOl-..I VIEW
12. GA. 1Hll.IE e.EAM ~ ~'Yu. "' e.oLl * W\lH
.&..21i WA~~ ER.~
\_£1'=' ~A.3'-•" ~Al..E : 1/o" -1·-o·
~~ - !t2. It
l~;~ L
-w. tYz:l
\ 012.ILL fl. 111..P \ ~<I -to Lit.Jc. ,, 112.u
r s''L -j1Jl
j \ 1 I -J--r
'( r+ M1U j_J_ L.::__J.L_J
P.>A.<;:.E. Pl.A. "TE
?,"
' v6 9" ,.~~ 2~j 1•14
1\tc. </> - I V f l 2 PLC.-;,)-· - I 7
~ l . _15 1 Be:A.i:l. I >JC:. PLA"TE.
~4 <I> 6oLT (oo-JE) (A5'Tt<1 A· ~Z5 ec>L"T) ' l'' 4 j
~C.AL&. ·. l/4 "• f" (.51&.E.L)
l'rp A'-IC~I02 ~OLT5 (."l'WO) 2.
DRILL~ 'TAP ¥e.· 11. Ul.JC lllR.U / ... . 0 .
E:iA.!:>E PLA.'TE (:51EE.~}
P.>EARllJG f'LA.'TE
~t>t/> f>OLl (a.JE)
$C.Al..E.: Va ' ~ I"
llO'THa .. 2.
) .
4 .
s.
'· 1.
Co.p011e•U wlta. ••terhlr. c•n be found In lh• .. t .. t Culd• to St•rMl•.-• h ed Ml ahv•r a.rrler ltndvue, pub I hht·d br ,....a c: an load and Tranapol'tatlo• lullclen AHoclatlon, US School It. ,SY, U.ah., D.C. Len~th of C2 poau 1Hecl In appnu1ch rall ln1 alMHtlJ H JncceuieJ bJ I In. to acco..odah additional ••pth o( Thrl• ~H•.
Thrle bea• and V-b11a• -re.-lal .•n4 hardware ere apedlled In AASHTO " - 110-JI .
U11leaa otMrwhe noted bolta ehall cnn(or. 10 requlr~nta ol "9111 AlOJ an4 .... . . Lo ce .. ul.-e-nta of ASTlt A)6J1
C:raJ• A u r better. Other bolu ah8H conlol'e to the r•"91te••C. ol ASnt AJZS .ad nuta to the r a111u ln.enta o( AS1" .061, ~ude Co.- betur . All nuta a11d holta ahall be 1alHnlae4 In accu rdan<"• vlth ASnt AIU.
~d 1111chora1a of th• po•l ...... ,, •hall k provided bf •pplyln1 • 10-Up (4\ - .. 0 rorc:e ln the poel •t 22 In. (')~O -> •hove th~ di:d •nd •••l1M"d •ccnr•tn1 to tM htHt AASlll'O ltr ldae •pectrtc11tlo..
S1eel •IJtill cCM1for• la nqwhe-. .. t• of A.S1N A-)6 or equlv• l ent •n4 ... 1•lvanhe4 •ccnr1Ung to ASTM AllJ .
ICT 1u11rdr•ll ter•ln•I •c-t•ll• er• •p•dfl~d la NCNIP ••-•rch IH•l te Dlac-•t 102 or bter revhlon .
Po•t eheent• •h-11 cOAfolW to th• requhe~nl• of ASTl'I llSOO Cr.cl• I or ASnt A~I an4 be &•lv•111&ed In •CcorJ•nc e v t U1 tt.e requlre~nt• o f A-S'nl .tU l .
Figure 4. Service level I bridge railing drawing-steel post.
~
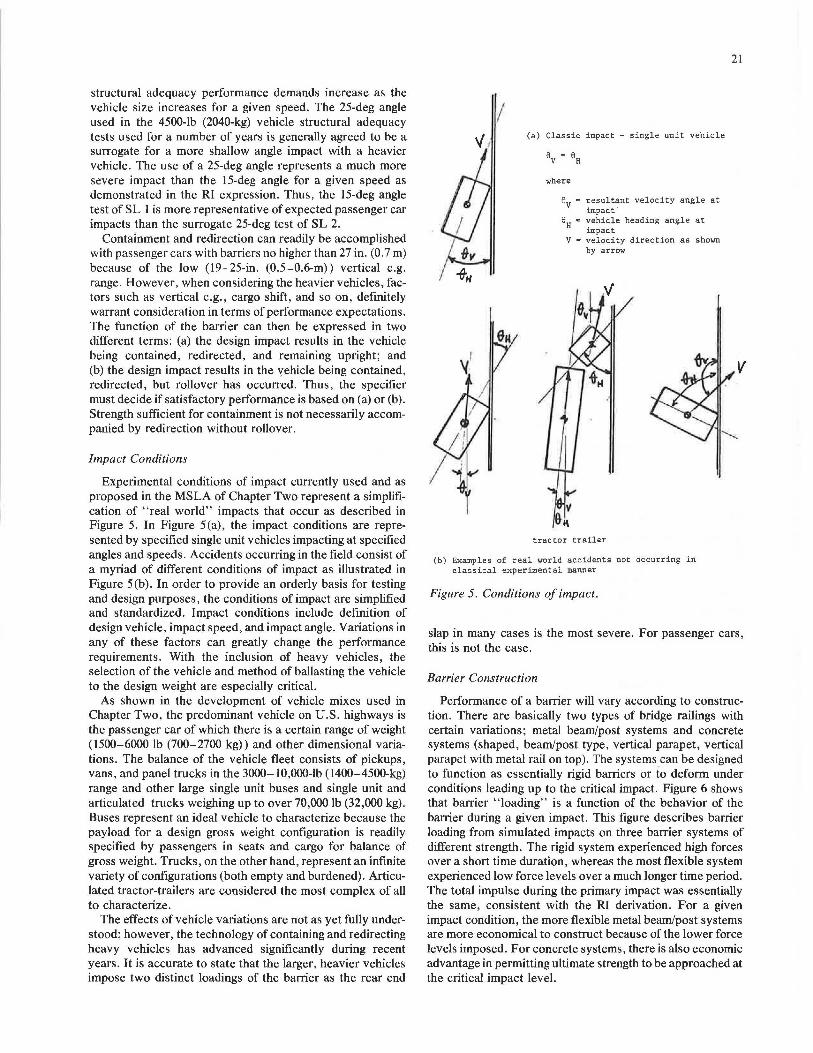
structural adequacy performance demands increase as the vehicle size increases for a given speed. The 25-deg angle used in the 4500-lb (2040-kg) vehicle structural adequacy tests used for a number of years is generally agreed to be a surrogate for a more shallow angle impact with a heavier vehicle. The use of a 25-deg angle represents a much more severe impact than the 15-deg angle for a given speed as demonstrated in the RI expression. Thus, the 15-deg angle test of SL 1 is more representative of expected passenger car impacts than the surrogate 25-deg test of SL 2.
Containment and redirection can readily be accomplished with passenger cars with barriers no higher than 27 in. (0. 7 m) because of the low (19-25-in. (0.5-0.6-m)) vertical e.g. range. However, when considering the heavier vehicles, factors such as vertical e.g., cargo shift, and so on, definitely warrant consideration in terms of performance expectations. The function of the barrier can then be expressed in two different terms: (a) the design impact results in the vehicle being contained, redirected, and remaining upright; and (b) the design impact results in the yehicle being contained, redirected, but rollover has occurred. Thus, the specifier must decide if satisfactory performance is based on (a) or (b). Strength sufficient for containment is not necessarily accompanied by redirection without rollover.
Impact Conditions
Experimental conditions of impact currently used and as proposed in the MSLA of Chapter Two represent a simplification of "real world" impacts that occur as described in Figure 5. In Figure 5(a), the impact conditions are represented by specified single unit vehicles impacting at specified angles and speeds. Accidents occurring in the field consist of a myriad of different conditions of impact as illustrated in Figure 5 (b). In order to provide an orderly basis for testing and design purposes, the conditions of impact are simplified and standardized. Impact conditions include definition of design vehicle, impact speed, and impact angle. Variations in any of these factors can greatly change the performance requirements. With the inclusion of heavy vehicles, the selection of the vehicle and method of ballasting the vehicle to the design weight are especially critical.
As shown in the development of vehicle mixes used in Chapter Two, the predominant vehicle on U.S. highways is the passenger car of which there is a certain range of weight (1500-6000 lb (700-2700 kg)) and other dimensional variations. The balance of the vehicle fleet consists of pickups, vans, and panel trucks in the 3000-10,000-lb (1400-4500-kg) range and other large single unit buses and single unit and articulated trucks weighing up to over 70,000 lb (32,000 kg). Buses represent an ideal vehicle to characterize because the payload for a design gross weight configuration is readily specified by passengers in seats and cargo for balance of gross weight. Trucks, on the other hand, represent an infinite variety of configurations (both empty and burdened). Articulated tractor-trailers are considered the most complex of all to characterize.
The effects of vehicle variations are not as yet fully understood; however, the technology of containing and redirecting heavy vehicles has advanced significantly during recent years. It is accurate to state that the larger, heavier vehicles impose two distinct loadings of the barrier as the rear end
I (a) Classic impact - single unit vehicle
where
ev = resultant velocity angle at impact·
8H = vehicle heading angle at impact
V R velocity direction as shown by arrow
tractor trailer
(b) Examples of real world accidents not occurring in classical experimental manner
Figure 5. Conditions of impact.
21
slap in many cases is the most severe. For passenger cars, this is not the case.
Barrier Construction
Performance of a barrier will vary according to construction. There are basically two types of bridge railings with certain variations; metal beam/post systems and concrete systems (shaped, beam/post type, vertical parapet, vertical parapet with metal rail on top). The systems can be designed to function as essentially rigid barriers or to deform under conditions leading up to the critical impact. Figure 6 shows that barrier "loading" is a function of the behavior of the barrier during a given impact. This figure describes barrier loading from simulated impacts on three barrier systems of different strength. The rigid system experienced high forces over a short time duration, whereas the most flexible system experienced low force levels over a much longer time period. The total impulse during the primary impact was essentially the same, consistent with the RI derivation. For a given impact condition, the more flexible metal beam/post systems are more economical to construct because of the lower force levels imposed. For concrete systems, there is also economic advantage in permitting ultimate strength to be approached at the critical impact level.
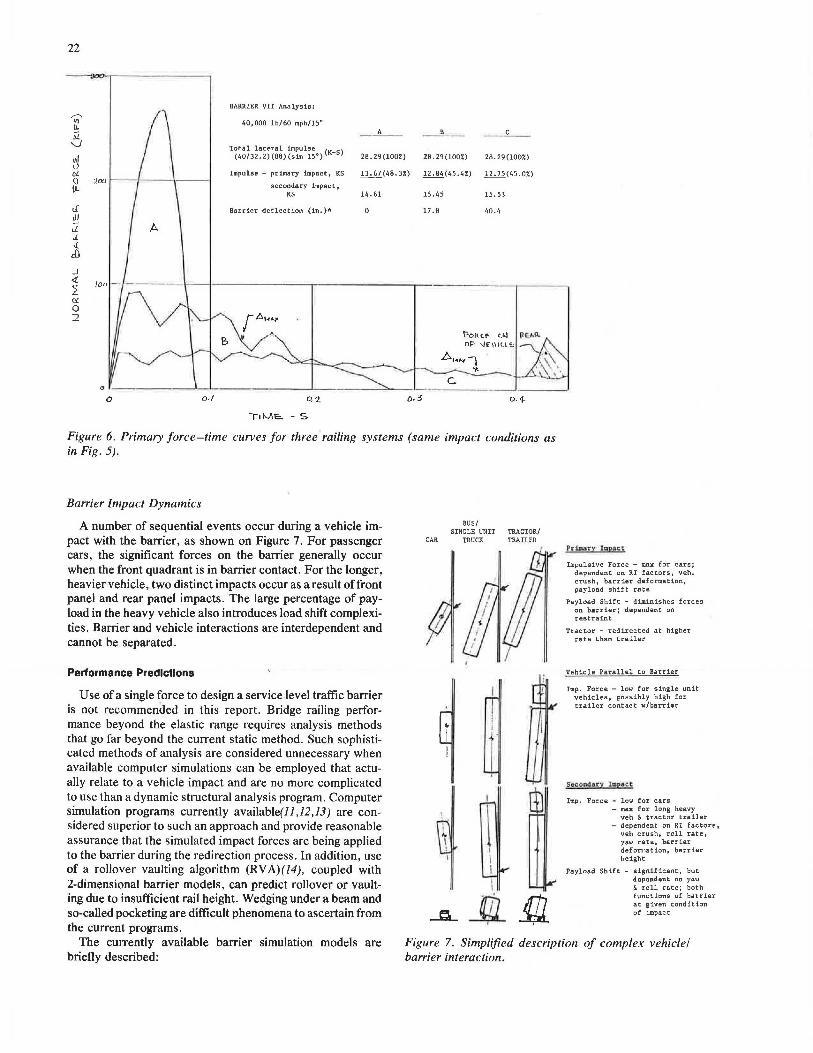
22
,--, .,, a. .'1 0
BARRIER VII Analysis:
40,000 lb/60 mph/15° A
.~ c) cl
20.29(100%) 20.29(100%) 20.29(100%)
Impulse - primary impact, KS
secondary impact, KS
13.67(40.3%) 12.04(45.4%) 12.75(45.0%) 0 200 1----+--- -l
IJ.. 14.61 15.45 15.53
_J
<! 2. Ci 0 2
0 a./
Barrier deflection (in.)"' 17 .0 40.4
o. '2 O.'f.
Figure 6. Primary force-time curves for three railing systems (same impact conditions as in Fig. 5).
Barrier Impact Dynamics
A number of sequential events occur during a vehicle impact with the barrier, as shown on Figure 7. For passenger cars, the significant forces on the barrier generally occur when the front quadrant is in barrier contact. For the longer, heavier vehicle, two distinct impacts occur as a result of front panel and rear panel impacts. The large percentage of payload in the heavy vehicle also introduces load shift complexities. Barrier and vehicle interactions are interdependent and cannot be separated.
Performance Predictions
Use of a single force to design a service level traffic barrier is not recommended in this report. Bridge railing performance beyond the elastic range requires analysis methods that go far beyond the current static method. Such sophisticated methods of analysis are considered unnecessary when available computer simulations can be employed that actually relate to a vehicle impact and are no more complicated to use than a dynamic structural analysis program. Computer simulation programs currently available( 11, 12, 13) are considered superior to such an approach and provide reasonable assurance that the simulated impact forces are being applied to the barrier during the redirection process. In addition, use of a rollover vaulting algorithm (RVA)(l4), coupled with '.l-dimensional barrier models, can predict rollover or vaulting due to insufficient rail height. Wedging under a beam and so-called pocketing are difficult phenomena to ascertain from the current programs.
BUS/ SINGLE UNIT TRACTOR/
CAR TRUCK TRAILER
I
I
I I.
1
\ I I I
\
I
II I
JlL I!J ' I
PtiDnl"Y lmpact:
Impulsive Force - max for cars; dependent on RI factors, veh. crush, barrier deformation, payload shift rate
Payload Shift - diminishes forces on barrhr; dependent on restraint
Tractor - redirected at higher rate than trailer
Vehicle Parallel to Barrier
Imp. Force - low for single unit vehicles, possibly high for trailer contact w/barrier
Second.at')/ lepeic t
Imp. Force - low for cars - max for long heavy
veh & tractor trailer - dependent on RI factors,
veh crush, roll rate, yaw rate, barrier defornation, barrier height
Payload Shift - significant, but dopondont on Y'm & roll rate; both functions of bat"rier at given condition of impact
The currently available barrier simulation models are briefly described:
Figure 7. Simplified description of complex vehicle/ barrier interaction.
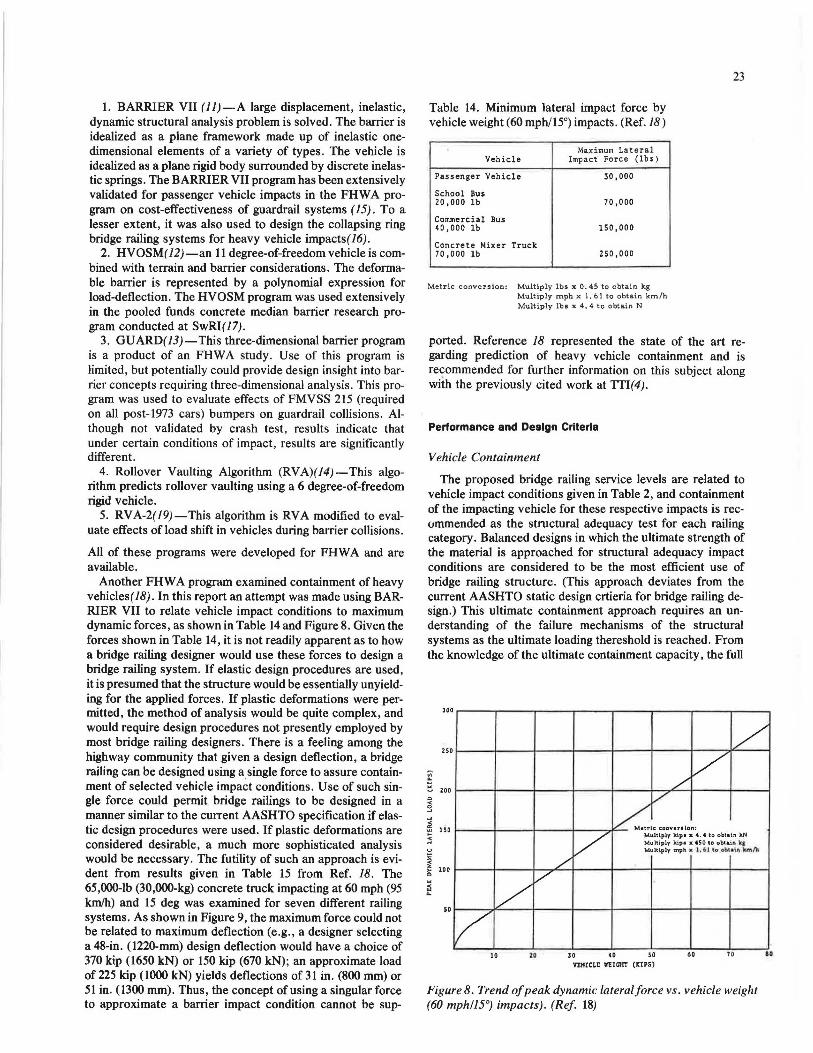
1. BARRIER VII (11)-A large displacement, inelastic, dynamic structural analysis problem is solved. The barrier is idealized as a plane framework made up of inelastic onedimensional elements of a variety of types. The vehicle is idealized as a plane rigid body surrounded by discrete inelastic springs. The BARRIER VII program has been extensively validated for passenger vehicle impacts in the FHW A program on cost-effectiveness of guardrail systems (15). To a lesser extent, it was also used to design the collapsing ring bridge railing systems for heavy vehicle impacts(l6).
2. HVOSM(l2)-an 11 degree-of-freedom vehicle is combined with terrain and barrier considerations. The deformable barrier is represented by a polynomial expression for load-deflection. The HVOSM program was used extensively in the pooled funds concrete median barrier research program conducted at SwRl(l7).
3. GUARD(JJ)-This three-dimensional barrier program is a product of an FHW A study. Use of this program is limited, but potentially could provide design insight into barrier concepts requiring three-dimensional analysis . This program was used to evaluate effects of FMVSS 215 (required on all post-1973 cars) bumpers on guardrail collisions. Although not validated by crash test, results indicate that under certain conditions of impact, results are significantly different .
4. Rollover Vaulting Algorithm (RVA)(J4)-This algorithm predicts rollover vaulting using a 6 degree-of-freedom rigid vehicle.
5. RV A-2( 19)-This algorithm is RV A modified to evaluate effects of load shift in vehicles during barrier collisions.
All of these programs were developed for FHW A and are available.
Another FHW A program examined containment of heavy vehicles(J8). In this report an attempt was made using BARRIER VII to relate vehicle impact conditions to maximum dynamic forces, as shown in Table 14 and Figure 8. Given the forces shown in Table 14, it is not readily apparent as to how a bridge railing designer would use these forces to design a bridge railing system. If elastic design procedures are used, it is presumed that the structure would be essentially unyielding for the applied forces. If plastic deformations were permitted, the method of analysis would be quite complex, and would require design procedures not presently employed by most bridge railing designers. There is a feeling among the highway community that given a design deflection, a bridge railing can be designed using a single force to assure containment of selected vehicle impact conditions. Use of such single force could permit bridge railings to be designed in a manner similar to the current AASHTO specification if elastic design procedures were used. If plastic deformations are considered desirable, a much more sophisticated analysis would be necessary. The futility of such an approach is evident from results given in Table 15 from Ref. 18. The 65,000-lb (30,000-kg) concrete truck impacting at 60 mph (95 km/h) and 15 deg was examined for seven different railing systems. As shown in Figure 9, the maximum force could not be related to maximum deflection (e.g., a designer selecting a 48-in. (1220-mm) design deflection would have a choice of 370 kip (1650 kN) or 150 kip (670 kN); an approximate load of 225 kip (1000 kN) yields deflections of 31 in. (800 mm) or 51 in. (1300 mm). Thus, the concept of using a singular force to approximate a barrier impact condition cannot be sup-
Table 14. Minimum lateral impact force by vehicle weight (60 mph/15°) impacts. (Ref.18)
Maximum Lateral Vehicle Impact' Force (lbs)
Passenger Vehicle 30,000
School Bus 20,000 lb 70,000
Commercial Bus 40,000 lb 150,000
Concrete Mixer Truck 70,000 lb 250,000
Metric c onv ersion: Multiply lbs x 0. 45 to obtai n kg Mult iply mph x l . 61 to obtain km / h Multiply lb1 x 4 . 4 t o obtai n N
23
ported. Reference 18 represented the state of the art regarding prediction of heavy vehicle containment and is recommended for further information on this subject along with the previously cited work at TTI(4).
Performance and Design Criteria
Vehicle Containment
The proposed bridge railing service levels are related to vehicle impact conditions given in Table 2, and containment of the impacting vehicle for these respective impacts is recommended as the structural adequacy test for each railing category. Balanced designs in which the ultimate strength of the material is approached for structural adequacy impact conditions are considered to be the most efficient use of bridge railing structure. (This approach deviates from the current AASHTO static design crtieria for bridge railing design.) This ultimate containment approach requires an understanding of the failure mechanisms of the structural systems as the ultimate loading thereshold is reached. From the knowledge of the ultimate containment capacity, the full
300
"'
/ /
250
~
w 200
" g
~ 150 .. j u
~ z 100 ,.. " ~
so
/ v
~iccoovonlon' /
Mu.ltlply kip• s 4, 4 to obtai n kN Multiply kip• :1: 450 tD obb.in q Multlply mph x l. 61 \o obi all\ km/h
/
I/ /
/ 10 20 30 co so 60 70
VEHICLn WE!Gln" (UPS)
Figure8. Trend of peak dynamic lateralforce vs. vehicle weight (60 mph/15°) impacts). (Ref 18)
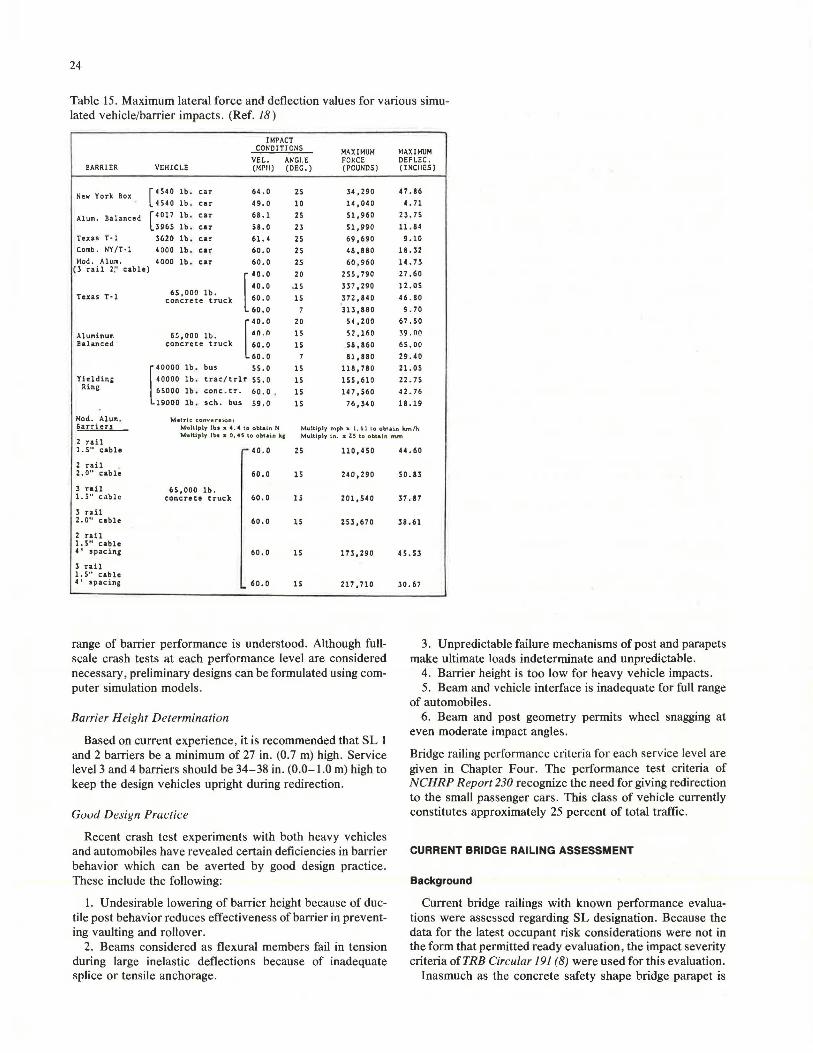
24
Table 15. Maximum lateral force and deflection values for various simu-lated vehicle/barrier impacts. (Ref. 18)
IMPACT CONDITIONS MAXIMUM MAXIMUM
VEL. ANGl.E FOHCE DEFLEC. BARRIER VEHICLE (MPll) (DEG.) [POUNDS) (INClll:S)
New York Box [ 4 540 lb. car 64. 0 25 34. 290 47.86
4 540 lb. car 49. 0 10 14,040 4. 71
Alum . Balanced [4017 lb. car 68.l 25 51, 960 23. 75
3965 lb . car 58. 0 23 51. 990 11. 84
Texas T·l 3G20 lb. car 61. 4 25 69. 690 9 .10
Comb. NY/T·l 4000 lb. car 60. 0 25 48,880 18. 32
Mod. Alum . 4000 lb. car 60.0 25 60. 960 14. 73 (3 rail 2:• cable)
[ 40.0 20 255,790 27.60
40 . 0 ,15 337 ,290 12.0S
Texas T· l 65,000 lb. 60. 0 15 372,840 46.80 concrete truck 60.0 313,880 9. 70
[ 40. 0 20 54. 200 67.50
Aluminum 6$,000 lb. '"· n 15 52,l~O 39, no Balanced concrete truck 60. 0 15 58. 860 65.00
60.0 81,880 29. 40
[ 40000 lb . bus 55 . 0 15 118,780 21.05
Yieldin• 40000 lb . trac/trlr 55.0 15 155,610 22. 75 Rine 65000 lb. cone.tr. 60. 0 ' 15 147 ,560 42. 76
19000 lb . sch. bus 59. 0 15 76. 34 0 18 .19
Mod. Alum . Metric conv e r 1 ion: 6arrieri Multiply l bt lll: 4.4 to obtain N Multiply mph x I . 6 1 to obta in km/h
2 rail Multip ly lb1 JI: 0 , 45 to obta in kc Mu.hiply i n . :11 Z5 to obtain mm
1.S" cable ~ 40.0 25 110,450
2 rail 2. O" cable 60. 0 15 240,290
3 rail 65,000 lb. 1. 5" c~blc concrete truck 60. 0 15 201,540
3 rail 2. 0" cable 60.0 15 253,670
2 rail 1. 5" cable 4. spacina: 60.0 15 l73. 290
3 rail 1.5'' cable 4. spacing 60. 0 15 217,710
range of barrier performance is understood. Although fullscale crash tests at each performance level are considered necessary, preliminary designs can be formulated using computer simulation models.
Barrier Height Determination
Based on current experience, it is recommended that SL 1 and 2 barriers be a minimum of 27 in. (0. 7 m) high. Service level 3 and 4 barriers should be 34-38 in. (0.0-1.0 m) high to keep the design vehicles upright during redirection.
Good Design Prw:tic:e
Recent crash test experiments with both heavy vehicles and automobiles have revealed certain deficiencies in barrier behavior which can be averted by good design practice. These include the following:
1. Undesirable lowering of barrier height because of ductile post behavior reduces effectiveness of barrier in preventing vaulting and rollover.
2. Beams considered as flexural members fail in tension during large inelastic deflections because of inadequate splice or tensile anchorage.
44.60
so. 83
37.87
38 .61
45.53
30. 67
3. Unpredictable failure mechanisms of post and parapets make ultimate loads indeterminate and unpredictable.
4. Barrier height is too low for heavy vehicle impacts. 5. Beam and vehicle interface is inadequate for full range
of automobiles. 6. Beam and post geometry permits wheel snagging at
even moderate impact angles.
Bridge railing performance criteria for each service level are given in Chapter Four. The performance test criteria of NCH RP Report 230 recognize the need for giving redirection to the small passenger cars. This class of vehicle currently constitutes approximately 25 percent of total traffic.
CURRENT BRIDGE RAILING ASSESSMENT
Background
Current bridge railings with known performance evaluations were assessed regarding SL designation. Because the data for the latest occupant risk considerations were not in the form that permitted ready evaluation, the impact severity criteria ofTRB Circular 191 (8) were used for this evaluation.
Inasmuch as the concrete safety shape bridge parapet is
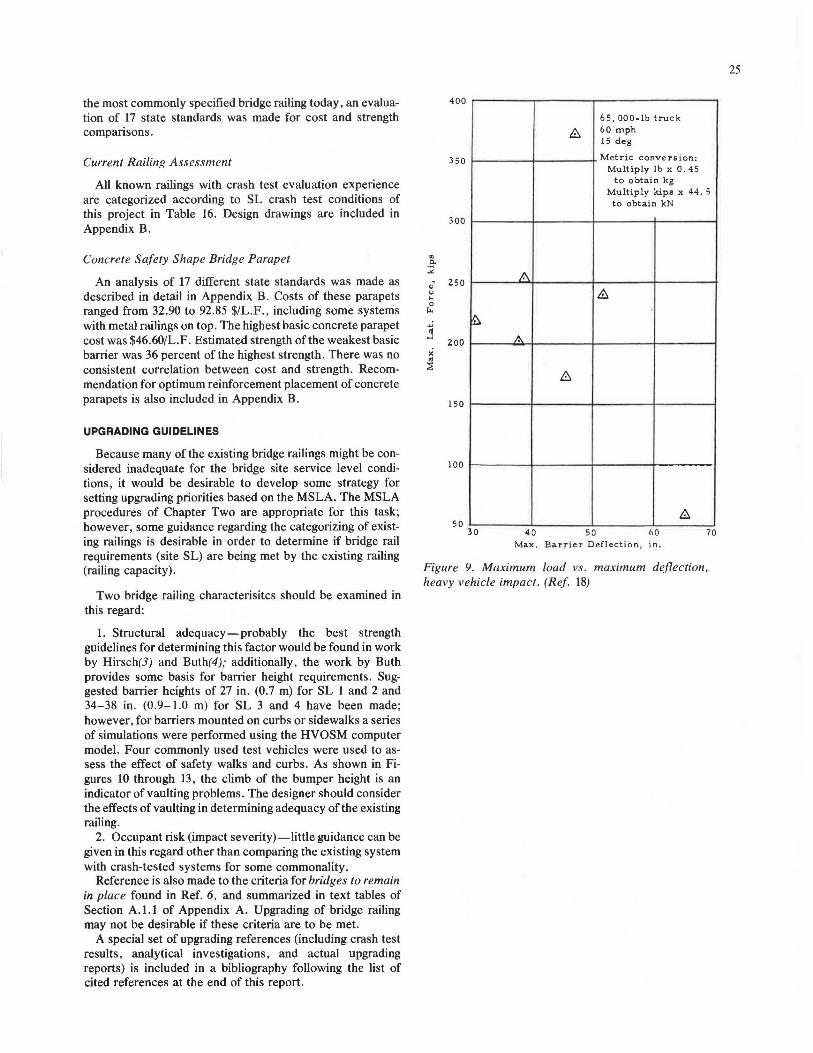
the most commonly specified bridge railing today, an evalua- 400
tion of 17 state standards was made for cost and strength comparisons.
Current Railing Assessment
All known railings with crash test evaluation experience are categorized according to SL crash test conditions of this project in Table 16. Design drawings are included in Appendix B.
Concrete Safety Shape Bridge Parapet
An analysis of 17 different state standards was made as described in detail in Appendix B. Costs of these parapets ranged from 32.90 to 92.85 $/L.F., including some systems with metal railings on top. The highest basic concrete parapet cost was $46.60/L.F. Estimated strength of the weakest basic barrier was 36 percent of the highest strength. There was no consistent correlation between cost and strength. Recommendation for optimum reinforcement placement of concrete parapets is also included in Appendix B.
UPGRADING GUIDELINES
Because many of the existing bridge railings might be considered inadequate for the bridge site service level conditions, it would be desirable to develop some strategy for setting upgrading priorities based on the MSLA. The MSLA procedures of Chapter Two are appropriate for this task; however, some guidance regarding the categorizing of existing railings is desirable in order to determine if bridge rail requirements (site SL) are being met by the existing railing (railing capacity).
Two bridge railing characterisitcs should be examined in this regard:
1. Structural adequacy-probably the best strength guidelines for determining this factor would be found in work by Hirsch(3) and Buth(4); additionally, the work by Buth provides some basis for barrier height requirements. Suggested barrier heights of 27 in . (0.7 m) for SL 1 and 2 and 34-38 in. (0.9-1.0 m) for SL 3 and 4 have been made; however, for barriers mounted on curbs or sidewalks a series of simulations were performed using the HVOSM computer model. Four commonly used test vehicles were used to assess the effect of safety walks and curbs. As shown in Figures 10 through 13, the climb of the bumper height is an indicator of vaulting problems. The designer should consider the effects of vaulting in determining adequacy of the existing railing.
2. Occupant risk (impact severity)-little guidance can be given in this regard other than comparing the existing system with crash-tested systems for some commonality.
Reference is also made to the criteria for bridges to remain in place found in Ref. 6 , and summarized in text tables of Section A.1.1 of Appendix A. Upgrading of bridge railing may not be desirable if these criteria are to be met.
A special set of upgrading references (including crash test results, analytical investigations , and actual upgrading reports) is included in a bibliography following the list of cited references at the end of this report.
65, 000-lb truck
& 60 mph 15 deg
350 Metric conversion: Multiply lb x 0. 45
to obtain kg Multiply kips x 44. 5
to obtain kN
300
"' .:!--"
,; 250 u ...
/.\
& 0 I«
j zoo
~ A
.< "' :E
&
150
100
8 so
30 40 50 60 70 Ma.x . Barrier Deflection , in .
Figure 9. Maximum load vs . maximum deflection , heavy vehicle impact. (R ef. 18)
25
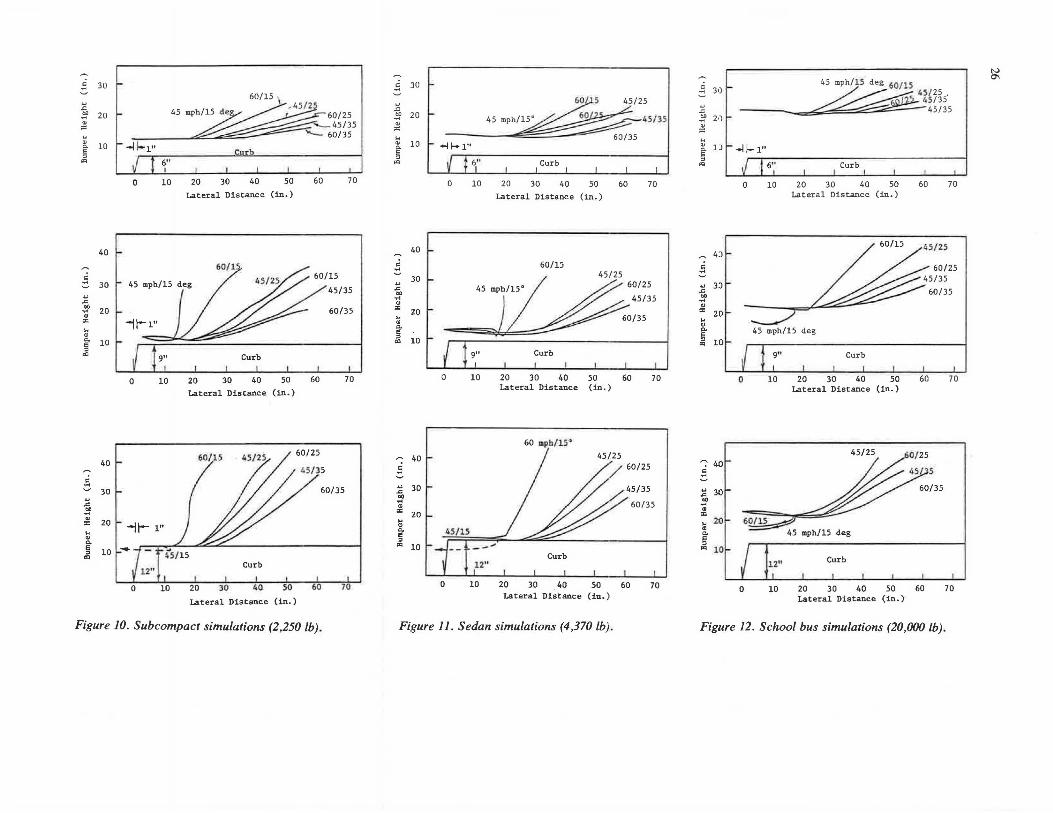
c ;:. u .<: 00 .,, " = " " c. E
" "'
,; ;:. u .<: 00 .,, " "' " " c. E
" "'
,; ;:. u .<: 00 .,, " = " " c. e ::i
"'
30
20
10 Ul" 0
40 ~
6" I
10 20 30 40 50
Lateral Distance (in.)
30 45 mph/15 deg
20
1t-1"
10
0
40
30
20
10 -0
9" I
10
10
Curb
20 30 40 50
Lateral Distance (in.)
Curb
20 30 40 50
Lateral Distance (in.)
60 70
45/35
60/35
60 70
60/35
60 70
Figure JO. Subcompact simulations (2,250 lb).
I
c 30 ;:. u .<: 00 20 .,, "
45/35 = " " 10 c. E
.., l-1"
" "' Curb 6"
0 10 20 30 40 50 60 70 Lateral Distance (in.)
40 ,; 60/15 ;:.
30 u 45 mph/15" .<:
bO .,, 45/35 " = 20 " " c. E
" 10 "' 9" Curb I
0 10 20 30 40 50 60 70 Lateral Distance (in.)
I 60 m~b/15•
40 ,; ;:. ~ 30 00 .,,
I " I // = 20 // 60/35
" " ~ ::i
"' 10
0 10 20 30 40 50 60 70 Lateral Distance (in. )
Figure 11. Sedan simulations (4,370 lb).
~ 30 l-
u .<: ~ 2•J L.
" = i ur-H-1"
~ i f 60i°
0 10
~ 4J
~ ~ ~ 3) .. .,, " = 20 " "
20
45 mph/15 deg 60/15
~45/25.
~45/35 ~ -45/35
Curb I I I '
30 40 50 60 70 Lateral Distance (in.)
45/35 / ~60/25 ~60/35
c. I 45 mph/15 deg E
" "' 10 I I '
0
• 40 c ;:.
~ 30 .. .,, .. = "
20
"' c. 6 ::i
"' 10
0
9"
10
10
Curb
20 30 40 50 60 Lateral Distance (in.)
Curb
20 30 40 50 60 Lateral Distance (in.)
70
70
Figure 12. School bus simulations (20,000 lb).
~
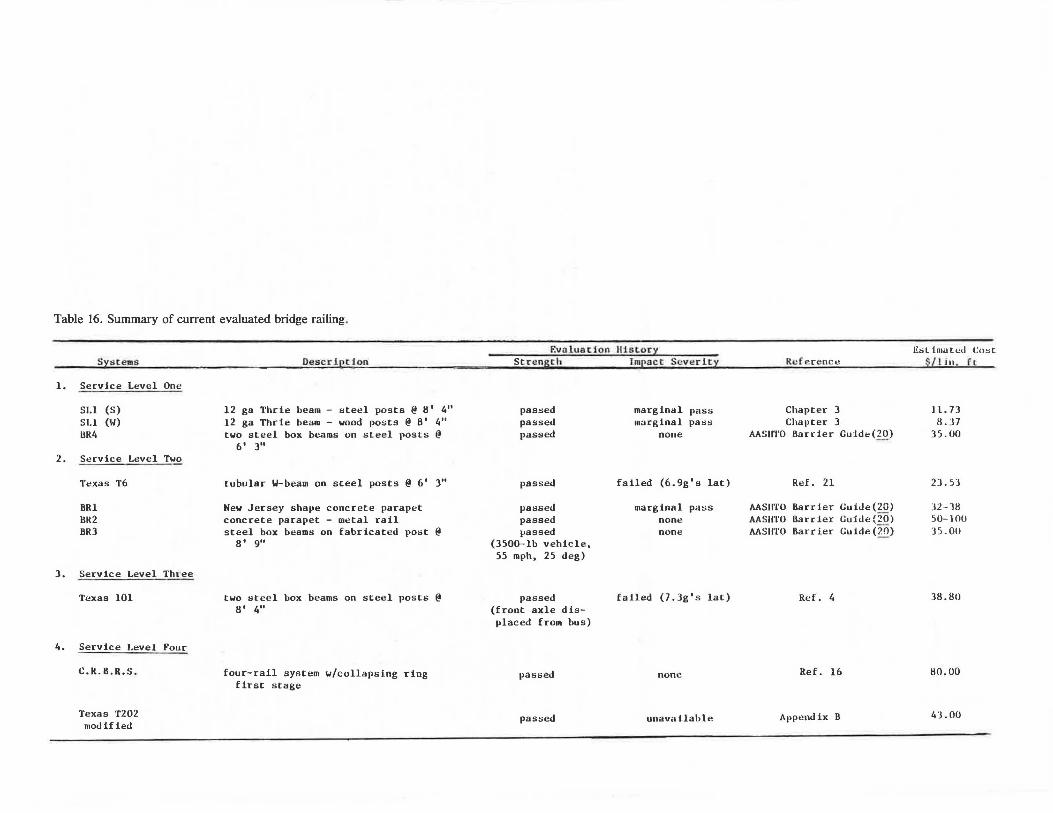
Table 16. Summary of current evaluated bridge railing.
F.val uation llisLory E:;llmutcd Co:;t Systems Oescripc:lon ___ __ Strengtl1 Impact Seve rity Rd erence $Llin. ft
l.
2.
Service Level One
SJ.1 (S) SI.l (W) DR4
Service I.eve! Two
Texas T6
8Rl llR2 8R3
3. Service Level Thtee
Texas 101
4. Service I.eve! Four
C.k.8.R.S.
Texas 'f202 modified
12 ga TllCie beam - steel posts @ !I' 4" 12 ga Tlirie beam - wood posts @ 8' 4" two steel box beams on steel posts @
6' 3"
tubular W-beam on steel posts @ 6' 3"
New Jersey shape concrete parapet concrete parapet - metal rail steel box beams on fabricated post @
8' 9"
two steel box beams on steel posts @ 8' 4"
four-rail system w/collapsing ring first stage
passed passed passed
passed
passed passed .,assed
(3500-lb vehicle, 55 mph, 25 deg)
passed (front axle dis-placed from bus)
passed
pas:;ed
marginal pass Chapter 3 I l. 73 marginal pass Chapter 3 8.J7
none AASllTO llarrier Cuidd20) 35.00
failed (6.9g's lat) Ref. 21 23.53
marginal pass AASllTO Barrier Guide(20) ]2-38 none AASHTO Barrier Gu1de{20) 50-100 none AASlrI'O Barrier Guide (°?O) )5.00
failed (7.3g's lat) Ref. 4 38.80
none Ref. 16 80.00
unavailable Appendix B 4].00
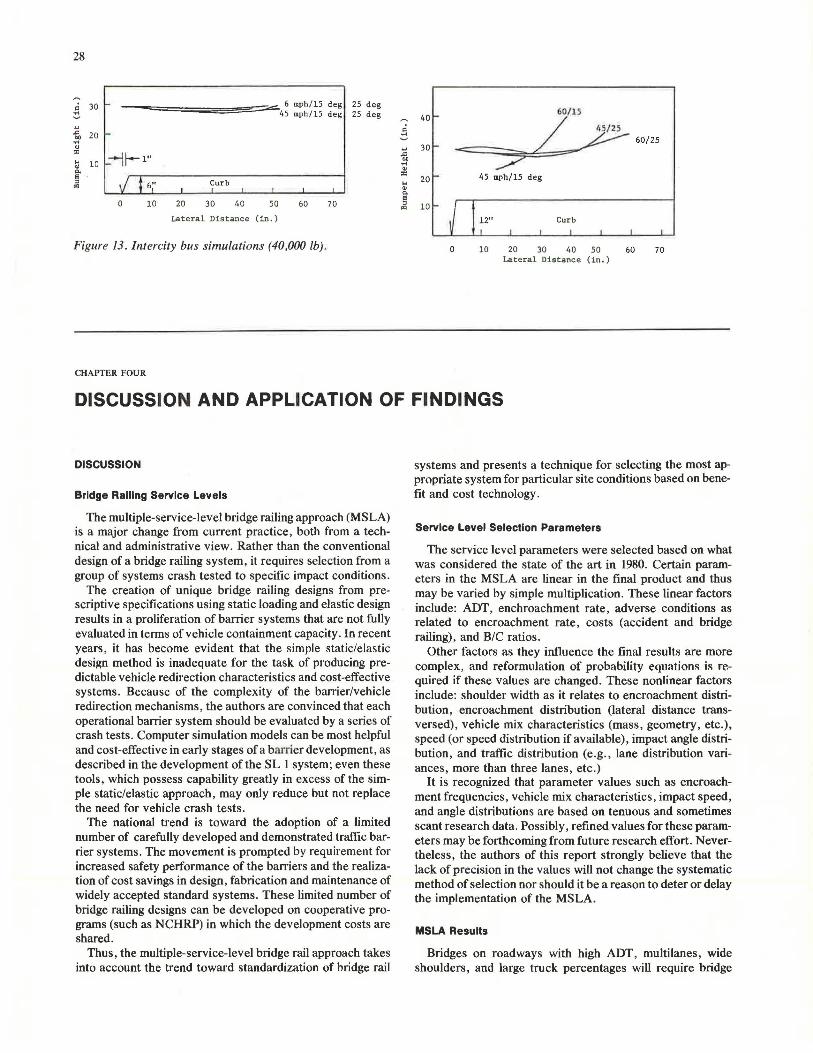
28
= 30 I- 6 mph/15 deg 25 deg
60/ 15 ~ 45 mph/15 deg 25 deg 40 ... =
45/ 25 "' 20 I- ~ 60/25 .. .... ... 30 " "' :-j f-1" "' .. ... 10 .... " " "' "' 45 mph/15 deg a 20 ~ J ; 6;' Curb ... .. I r I I I I " "' a
0 10 20 30 40 50 60 70 ~ 10 .. Lateral Distance (in.) Curb
Figure 13. Intercity bus simulations (40,000 lb) . 0 10 20 30 40 50 60 70 Lateral Distance (in.)
CHAPTER FOUR
DISCUSSION AND APPLICATION OF FINDINGS
DISCUSSION
Bridge Railing Service Levels
The multiple-service-level bridge railing approach (MSLA) is a major change from current practice, both from a technical and administrative view. Rather than the conventional design of a bridge railing system, it requires selection from a group of systems crash tested to specific impact conditions .
The creation of unique bridge railing designs from prescriptive specifications using static loading and elastic design results in a proliferation of barrier systems that are not fully evaluated in terms of vehicle containment capacity. In recent years, it has become evident that the simple static/elastic design method is inadequate for the task of producing predictable vehicle redirection characteristics and cost-effective systems. Because of the complexity of the barrier/vehicle redirection mechanisms, the authors are convinced that each operational barrier system should be evaluated by a series of crash tests. Computer simulation models can be most helpful and cost-effective in early stages of a barrier development , as described in the development of the SL 1 system; even these tools, which possess capability greatly in excess of the simple static/elastic approach, may only reduce but not replace the need for vehicle crash tests.
The national trend is toward the adoption of a limited number of carefully developed and demonstrated traffic barrier systems. The movement is prompted by requirement for increased safety performance of the barriers and the realization of cost savings in design, fabrication and maintenance of widely accepted standard systems. These limited number of bridge railing designs can be developed on cooperative programs (such as NCHRP) in which the development costs are shared.
Thus, the multiple-service-level bridge rail approach takes into account the trend toward standardization of bridge rail
systems and presents a technique for selecting the most appropriate system for particular site conditions based on benefit and cost technology.
Service Level Selection Parameters
The service level parameters were selected based on what was considered the state of the art in 1980. Certain parameters in the MSLA are linear in the final product and thus may be varied by simple multiplication. These linear factors include: ADT, enchroachment rate, adverse conditions as related to encroachment rate , costs (accident and bridge railing), and B/C ratios.
Other factors as they influence the final results are more complex, and reformulation of probability equations is required if these values are changed. These nonlinear factors include: shoulder width as it relates to encroachment distribution, encroachment distribution (lateral distance transversed), vehicle mix characteristics (mass, geometry, etc.), speed (or speed distribution if available), impact angle distribution, and traffic distribution (e.g., Jane distribution variances, more than three lanes, etc.)
It is recognized that parameter values such as encroachment frequencies, vehicle mix characteristics, impact speed, and angle distributions are based on tenuous and sometimes scant research data. Possibly, refined values for these parameters may be forthcoming from future research effort. Nevertheless, the authors of this report strongly believe that the lack of precision in the values will not change the systematic method of selection nor should it be a reason to deter or delay the implementation of the MSLA.
MSLA Results
Bridges on roadways with high ADT, multilanes, wide shoulders, and large truck percentages will require bridge
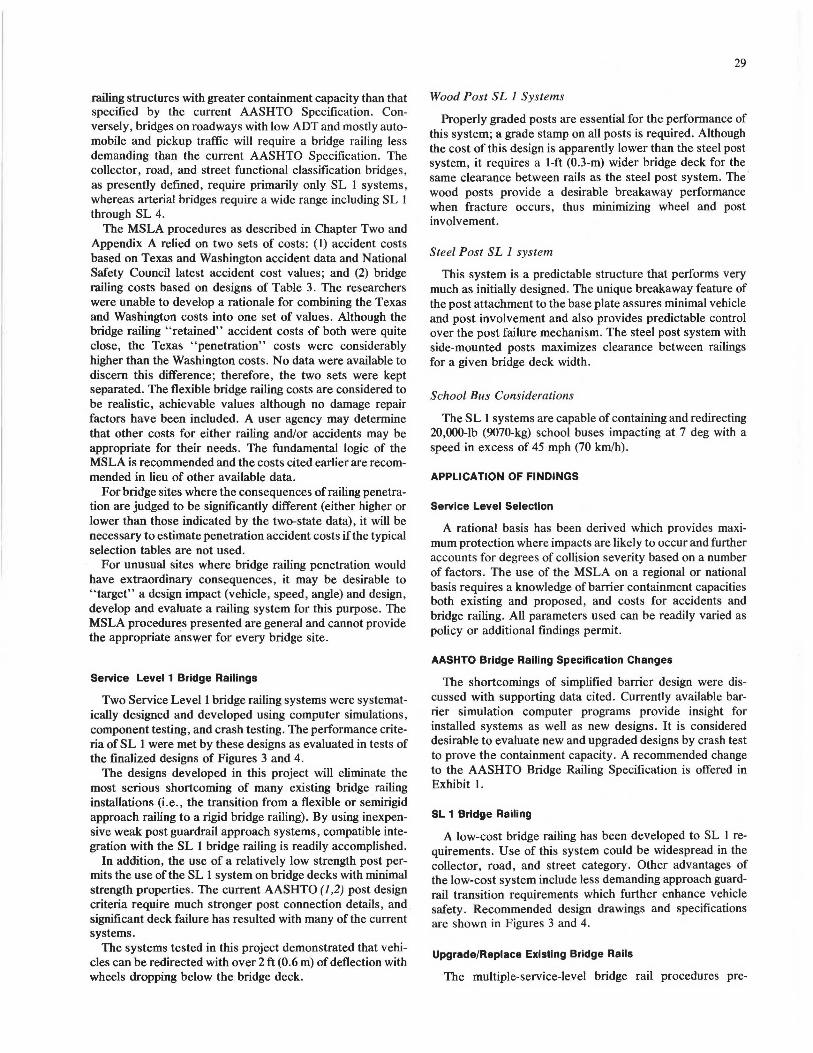
railing structures with greater containment capacity than that specified by the current AASHTO Specification. Conversely, bridges on roadways with low ADT and mostly automobile and pickup traffic will require a bridge railing less demanding than the current AASHTO Specification. The collector, road, and street functional classification bridges, as presently defined, require primarily only SL 1 systems, whereas arterial bridges require a wide range including SL 1 through SL 4.
The MSLA procedures as described in Chapter Two and Appendix A relied on two sets of costs: (1) accident costs based on Texas and Washington accident data and National Safety Council latest accident cost values; and (2) bridge railing costs based on designs of Table 3. The researchers were unable to develop a rationale for combining the Texas and Washington costs into one set of values. Although the bridge railing "retained" accident costs of both were quite close, the Texas "penetration" costs were considerably higher than the Washington costs. No data were available to discern this difference; therefore, the two sets were kept separated. The flexible bridge railing costs are considered to be realistic, achievable values although no damage repair factors have been included. A user agency may determine that other costs for either railing and/or accidents may be appropriate for their needs. The fundamental logic of the MSLA is recommended and the costs cited earlier are recommended in lieu of other available data.
For bridge sites where the consequences of railing penetration are judged to be significantly different (either higher or lower than those indicated by the two-state data), it will be necessary to estimate penetration accident costs if the typical selection tables are not used.
For unusual sites where bridge railing penetration would have extraordinary consequences, it may be desirable to "target" a design impact (vehicle, speed, angle) and design, develop and evaluate a railing system for this purpose. The MSLA procedures presented are general and cannot provide the appropriate answer for every bridge site.
Service Level 1 Bridge Railings
Two Service Level 1 bridge railing systems were systematically designed and developed using computer simulations, component testing, and crash testing. The performance criteria of SL 1 were met by these designs as evaluated in tests of the finalized designs of Figures 3 and 4.
The designs developed in this project will eliminate the most serious shortcoming of many existing bridge railing installations (i.e., the transition from a flexible or semirigid approach railing to a rigid bridge railing). By using inexpensive weak post guardrail approach systems, compatible integration with the SL 1 bridge railing is readily accomplished.
In addition, the use of a relatively low strength post permits the use of the SL 1 system on bridge decks with minimal strength properties. The current AASHTO (I ,2) post design criteria require much stronger post connection details, and significant deck failure has resulted with many of the current systems.
The systems tested in this project demonstrated that vehicles can be redirected with over 2 ft (0.6 m) of deflection with wheels dropping below the bridge deck.
29
Wood Post SL I Systems
Properly graded posts are essential for the performance of this system; a grade stamp on all posts is required. Although the cost of this design is apparently lower than the steel post system, it requires a 1-ft (0.3-m) wider bridge deck for the same clearance between rails as the steel post system. The wood posts provide a desirable breakaway performance when fracture occurs, thus minimizing wheel and post involvement.
Steel Post SL I system
This system is a predictable structure that performs very much as initially designed. The unique breakaway feature of the post attachment to the base plate assures minimal vehicle and post involvement and also provides predictable control over the post failure mechanism. The steel post system with side-mounted posts maximizes clearance between railings for a given bridge deck width.
School Bus Considerations
The SL 1 systems are capable of containing and redirecting 20,000-lb (9070-kg) school buses impacting at 7 deg with a speed in excess of 45 mph (70 km/h).
APPLICATION OF FINDINGS
Service Level Selection
A rational basis has been derived which provides maximum protection where impacts are likely to occur and further accounts for degrees of collision severity based on a number of factors. The use of the MSLA on a regional or national basis requires a knowledge of barrier containment capacities both existing and proposed, and costs for accidents and bridge railing. All parameters used can be readily varied as policy or additional findings permit.
AASHTO Bridge Ralllng Specification Changes
The shortcomings of simplified barrier design were discussed with supporting data cited. Currently available barrier simulation computer programs provide insight for installed systems as well as new designs. It is considered desirable to evaluate new and upgraded designs by crash test to prove the containment capacity. A recommended change to the AASHTO Bridge Railing Specification is offered in Exhibit 1.
SL 1 Bridge Railing
A low-cost bridge railing has been developed to SL I requirements. Use of this system could be widespread in the collector, road, and street category. Other advantages of the low-cost system include less demanding approach guardrail transition requirements which further enhance vehicle safety. Recommended design drawings and specifications are shown in Figures 3 and 4.
Upgrade/Replace Existing Bridge Rails
The multiple-service-level bridge rail procedures pre-
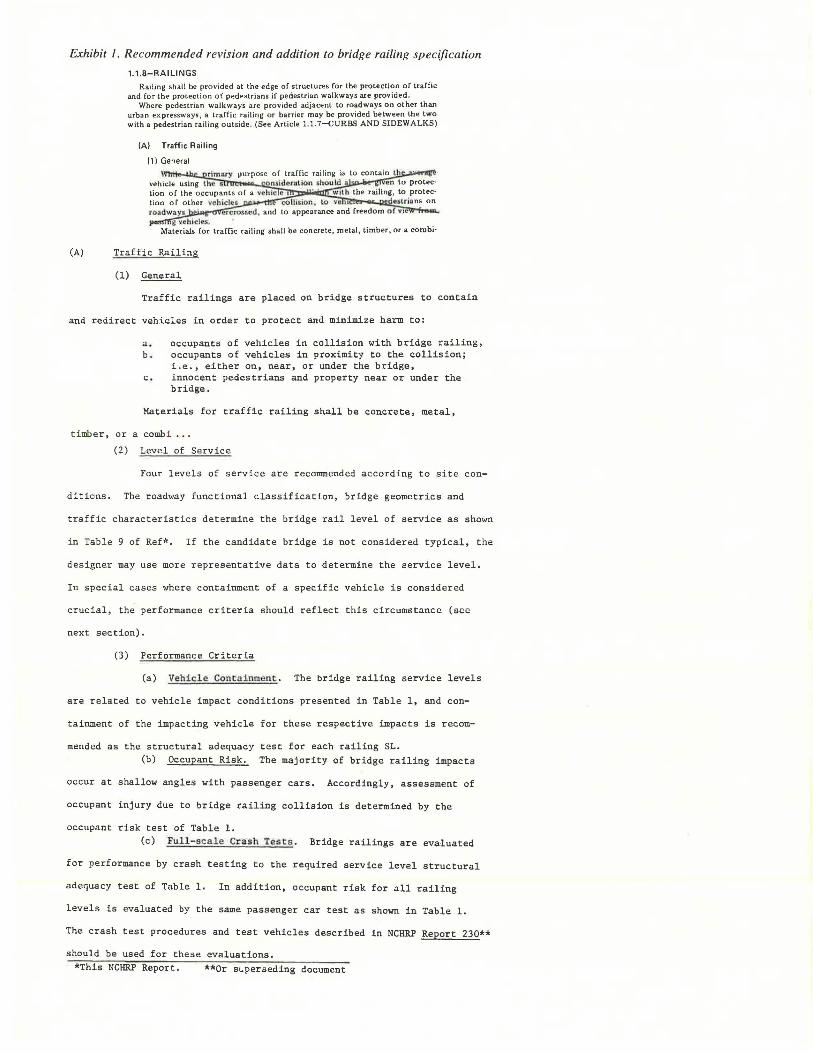
Exhibit 1. Recommended revision and addition to bridge railing specification
1.1.8-RAILINGS
Railing shall be pro vided at the edge of structures for the protection of traffic and for the protecti on of pedestrians if pedestrian walkways are provided .
Where pedestrian walkways are pro vided adjacent to roadways on other than urban expressways , a traffic railing or barrier may be pro vided between the two with a pedestrian rail ing outside. (See Article 1.1.7--CURBS AND SIDEWALKS)
(A) Traffic Railing
(1) General
\ rlmilfY purpose of traffic railing is to contain -"th~-··-.•-vehicle using the 1 Qnsidt:ration should en to protec· lion of the occupants of a vt hlc c 1 w l h the railing , to protec· l ion or other vehicles eo llision , lo ve 1 de:strh~ms on roadways ercrossed , and to appearance and freedom o f vie
g vehiclts. Materials Car traffic railing shall be co_ncrete, metal, timber, or a core bi·
(A) Traffic Railing
(1) General
Traffic railings are placed on bridge structures to contain
and redirect vehicles in order to protect and minimize harm to:
a. occupants of vehicles in collision with bridge railing, b. occupants of vehicles in proximity to the collision;
i .e., either on, near, or under the bridge, c. innocent pedestrians and property near or under the
bridge.
Materials for traffic railing shall be concrete, metal,
timber, or a comb ! •..
(2) Level of Service
Four levels of service are recommended according to site con-
ditions. The roadway functional classification, bridge geometrics and
traffic characteristics determine the bridge rail l evel of service as shown
in Table 9 of Ref*. If the candidate bridge is not considered typical, the
designer may use more representative data to determine the service level.
In special cases where containment of a specific vehicle is considered
crucial, the performance criteria should reflect this circumstance (sec
next section).
(3) Performance Criteria
(a) Vehicle Containment. The bridge railing service levels
are related to vehicle impact conditions presented in Table 1, and con-
tainment of the impacting vehicle for these respective impacts is recom-
mended as the structural adequacy test for each railing SL. (b) Occupant Risk. The majority of bridge railing impacts
occur at shallow angles with passenger cars. Accordingly, assessment of
occupant injury due to bridge railing collision is determined by the
occupant risk test of Table 1. (c) Full-scaie Cra sh Tes ts. Bridge railings are evaluated
for performance by crash testing to the required service level structural
adequacy test of Table 1. In addition, occupant risk for all railing
levels is evaluated by the same passenger car test as shown in Table 1.
The crash test procedures and test vehicles described in NCHRP Report 230**
should be used for these evaluations. *This NCHRP Report. **Or SLperseding document
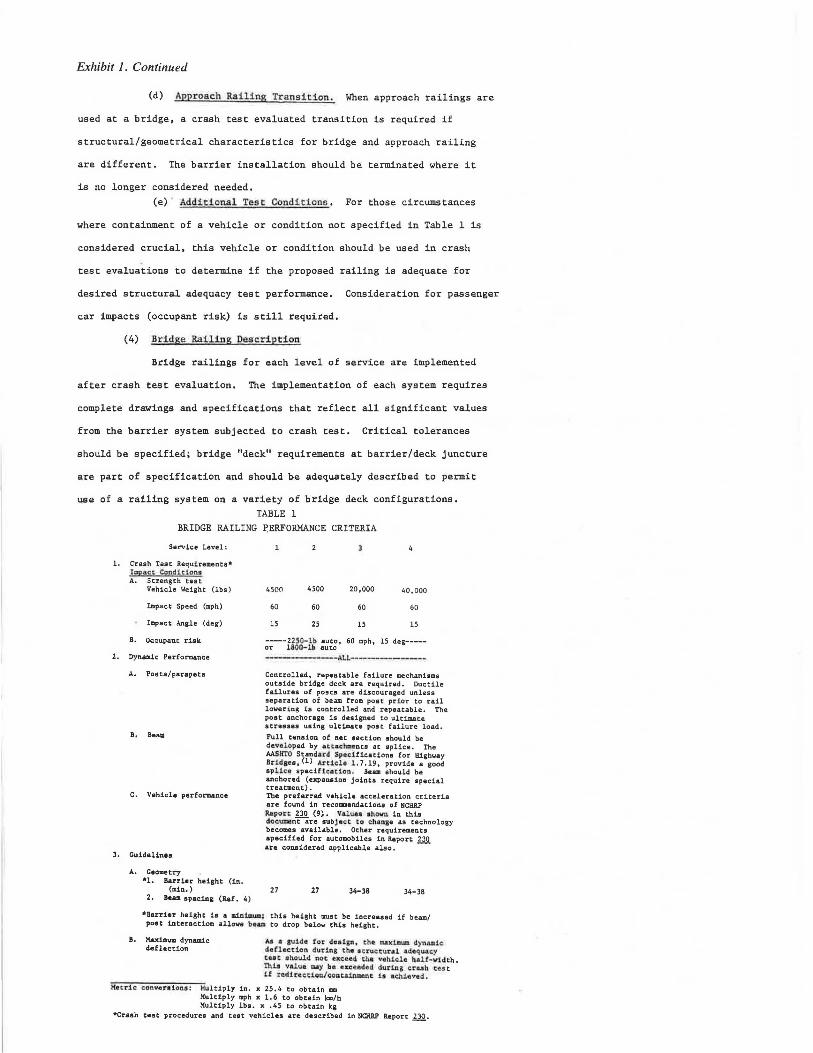
Exhibit 1. Continued
(d) Approach Railing Transi tion. When approach railings are
used at a bridge, a crash test evaluated transition is required if
structural/geometrical characteristics for bridge and approach railing
are different. The barrier installation should be terminated where it
is no longer considered needed. (e) Addi t i onal Tes t Condi tions . For those circumstances
where containment of a vehicle or condition not specified in Table 1 is
considered crucial, this vehicle or condition should be used in crash
test evaluations to determine if the proposed railing is adequate for
desired structural adequacy test performance. Consideration for passenger
car impacts (occupant risk) is still required.
(4) Bridge Railing Description
Bridge railings for each level of service are implemented
after crash test evaluation. The implementation of each system requires
complete drawings and specifications that reflect all significant values
from the barrier system subjected to crash test. Critical tolerances
should be specified; bridge "deck" requirements at barrier/deck juncture
are part of specification and should be adequately described to permit
use of a railing system on a variety of bridge deck configurations. TABLE 1
BRIDGE RAILING ~ERFORMANCE CRITERIA
Service Level :
1. Crash Te9t Requirements* Tmpac.c. C.Onditlons A. Strength teat
Vehicle Weight (lbs)
Impact Speed (mph)
Impact Angle (deg)
B. Oci:upauc risk
2. Dynamic Performance
A. Posts/parapets
8 . Beam
C. Vehicle performance
3. Guidelines
A. Geometry *l. Barrier height (in.
(mia.) 2. Beam spacia& ( Raf . 4)
4500 4500 20 ,000 40,000
60 60 60 60
15 25 15 l5
---2250-lb auto, 60 mph, 15 deg-----or 1800- lb auto
------·-ALL-------- ---Controlled, repeatable failure mechanilme outside bridge deck are required. Ductile failures of po9cs are discouraged unle ss separation of beam from post prior to rail lowering is controlled and repeatable. The post anchorage is designed to ultimate stresses using ultimate post failure load.
Full tension of net •action should be developed by attachm•nca at splice . The AASHTO Stand•rd Specifications for Highway Bri dges, (1) Art icle l. 7.19, provide a good splice speciUc•t1on . Beam should be: anchored (expansion joints require special treatment). The preferred vehicle acceleration criteria are found in reco11111.andatioas of NC~ R.e porc 230 (9) • Valua• ahova 1a i:hi.o docu:me:nCare subject co c:hcmae as technology becomes available. Other requirements specified for automobiles in Report 230 are considered applicable also . -
27 27 34-38 34-38
*Barrier height i• a miat.mua; this height must be increased if beam/ poet interaction allow• beam to drop below this height .
B. Maximum dynamic: deflection
,.. a SUide ro• do.-1.gn , tho ...,.l.mwa dynamic deflection d\,lt ing th• 1t rue: t l.lt•l adcqu.a.c.y t H t .thould noc ucced the •ehlcle b a.H•ll1.dth. Thi.I v• l u• MY b• t xc.aad111d du.t lng cru .b ces t 1. f l:c di:c·• c: d ca / cca u .t..n:aen t U a.ch1evad.
~cric convor &iOl'I JJ.: l<u ltiply in . x 25.4 to obtain mm Multiply mph x l.6 to obtain lcm/h Multiply lb•. x .45 to obtain kg
*Crash test procedures •nd teat vehicles are described in NQlRP Report 230 .
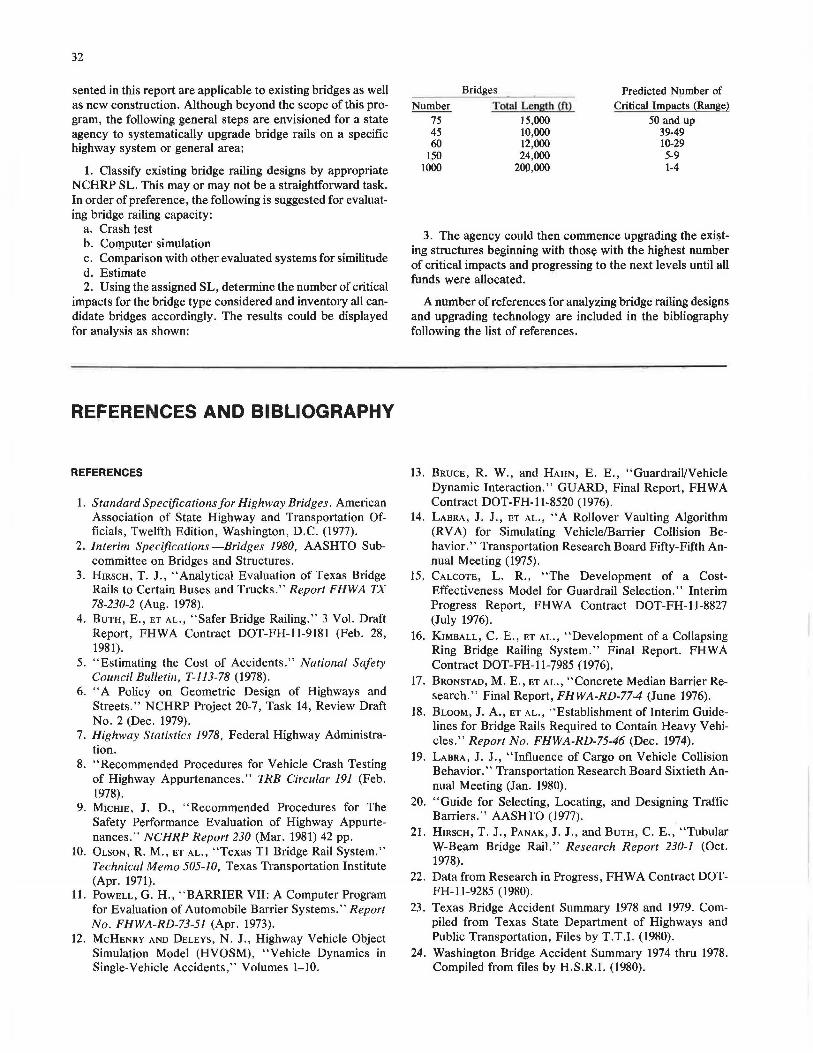
32
sented in this report are applicable to existing bridges as well as new construction. Although beyond the scope of this program, the following general steps are envisioned for a state agency to systematically upgrade bridge rails on a specific highway system or general area:
1. Classify existing bridge railing designs by appropriate NCHRP SL. This may or may not be a straightforward task. In order of preference, the following is suggested for evaluating bridge railing capacity:
a. Crash test b. Computer simulation c. Comparison with other evaluated systems for similitude d. Estimate 2. Using the assigned SL, determine the number of critical
impacts for the bridge type considered and inventory all candidate bridges accordingly. The results could be displayed for analysis as shown:
REFERENCES AND BIBLIOGRAPHY
REFERENCES
1. Standard Specifications for Highway Bridges. American Association of State Highway and Transportation Officials, Twelfth Edition, Washington, D.C. (1977).
2. Interim Specifications-Bridges 1980, AASHTO Subcommittee on Bridges and Structures.
3. HIRSCH, T. J., "Analytical Evaluation of Texas Bridge Rails to Certain Buses and Trucks." Report FHWA TX 78-230-2 (Aug. 1978).
4. BUTH, E., ET AL., "Safer Bridge Railing." 3 Vol. Draft Report, FHWA Contract DOT-FH-11-9181 (Feb. 28, 1981).
5. "Estimating the Cost of Accidents." National Safety Council Bulletin, T-113-78 (1978).
6. "A Policy on Geometric Design of Highways and Streets." NCHRP Project 20-7, Task 14, Review Draft No. 2 (Dec. 1979).
7. Highway Statistics 1978, Federal Highway Administration.
8. "Recommended Procedures for Vehicle Crash Testing of Highway Appurtenances." TRB Circular 191 (Feb. 1978).
9. MICHIE, J. D., "Recommended Procedures for The Safety Performance Evaluation of Highway Appurtenances." NCHRP Report 230 (Mar. 1981) 42 pp.
10. OLSON, R. M., ET AL., "Texas Tl Bridge Rail System." Technical Memo 505-10, Texas Transportation Institute (Apr. 1971).
11. PowELL, G. H., "BARRIER VII: A Computer Program for Evaluation of Automobile Barrier Systems." Report No. FHWA-RD-73-51 (Apr. 1973).
12. McHENRY AND DELEYS, N. J., Highway Vehicle Object Simulation Model (HVOSM), "Vehicle Dynamics in Single-Vehicle Accidents," Volumes 1-10.
Number 75 45 60
150 1000
Bridges
Total Length (ft) 15,000 10,000 12,000 24,000
200,000
Predicted Number of Critical Impacts (Range)
50 and up 39-49 10-29 5-9 1-4
3. The agency could then commence upgrading the exii;ting structures beginning with those with the highest number of critical impacts and progressing to the next levels until all funds were allocated.
A number ofreferences for analyzing bridge railing designs and upgrading technology are included in the bibliography following the list of references.
13. BRUCE, R. W., and HAHN, E. E., "Guardrail/Vehicle Dynamic Interaction." GUARD, Final Report, FHWA Contract DOT-FH-11-8520 (1976).
14. LABRA, J. J., ET AL., "A Rollover Vaulting Algorithm (RVA) for Simulating Vehicle/Barrier Collision Behavior.'' Transportation Research Board Fifty-Fifth Annual Meeting (1975).
15. CALCOTE, L. R., "The Development of a CostEffectiveness Model for Guardrail Selection." Interim Progress Report, FHWA Contract DOT-FH-11-8827 (July 1976).
16. KIMBALL, C. E., ET AL., "Development of a Collapsing Ring Bridge Railing System." Final Report. FHWA Contract DOT-FH-11-7985 (1976).
17. BRONSTAD, M. E., ET AL., "Concrete Median Barrier Research." Final Report, FHWA-RD-77-4 (June 1976).
18. BLooM, J. A., ET AL., ''Establishment of Interim Guidelines for Bridge Rails Required to Contain Heavy Vehicles." Report No. FHWA-RD-75-46 (Dec. 1974).
19. LABRA, J. J., "Influence of Cargo on Vehicle Collision Behavior.'' Transportation Research Board Sixtieth Annual Meeting (Jan. 1980).
20. "Guide for Selecting, Locating, and Designing Traffic Barriers." AASHTO (1977).
21. HIRSCH, T. J., PANAK, J. J., and BuTH, C. E., "Tubular W-Beam Bridge Rail." Research Report 230-1 (Oct. 1978).
22. Data from Research in Progress, FHWA Contract DOTFH-11-9285 (1980).
23. Texas Bridge Accident Summary 1978 and 1979. Compiled from Texas State Department of Highways and Public Transportation, Files by T.T.I. (1980).
24. Washington Bridge Accident Summary 1974 thru 1978. Compiled from files by H.S.R.I. (1980).
25. 1979 Fatal Accident Reporting System Data provided to SwRI by FHWA Office of Engineering (1980).
26. RrnnE, E. A., "Conventioned Road Safety." Report No. FHWA-CA-79-1, California DOT (Aug. 1979).
27. FARGIN, B. M., "1975 Societal Costs of Motor Vehicle Accidents." U.S. DOT, NHTSA (Dec. 1976).
28. GALATI, J. V., "Median Barrier Photographic Study." HRB Research Record 170 (1967) pp. 70-81.
29. LAMPELA, A. A., YANG, A. H., "Analyses of Guardrail Accidents in Michigan." Michigan Department of State Highways and Transportation, Report TSD-243-74 (July 1974).
30. "Motor Vehicle Facts and Figures, 80." Motor Vehicle Manufacturers Association (1980).
31. "Bridge Rail Retrofit for Curves Structures." FHW A Contract DOT-FH-11-9462.
32. BAsso, G. L., "Functional Derivation of Vehicle Parameters for Dynamic Studies." Laboratory Technical Report, National Research Council Canada (Sept. 1974).
33. Ross, H. E., JR., "Impact Performance and a Selection Criterion for Texas Median Barriers." Texas Tranportation Institute, Research Report 140-8 (Apr. 1974).
34. "Development of an Analytical Approach to Highway Barrier Design and Evaluation." Research Report 63-2, Phys. Research Proejct 15-1, N.Y. State Department of Public Works (May 1963).
35. BRONSTAD, M. E., "New Concepts for Traffic Barrier Systems." FHWA Contract DOT-FH-11-8797 (1980).
36. WEIR, D. H., ET AL., "Analysis of Truck and Bus Handling." Volumes I and II, Systems Technology, Inc. (June 1974).
37. GRAHAM, M. D., "Progress Report on New York's Highway Barrier Research Program.'' Presented to AASHTO Design Committee (Oct. 1969).
38. BRONSTAD, M. E., ET AL., "Crash Test Evaluation of Thrie Beam Traffic Barriers." Report No. FHWA-RD-75-509 (Jan. 1975).
39. BRONSTAD, M. E., and MICHIE, J. D., "Multiple Service Level Bridge Railings-Perlormance and Design Criteria.'' Phase I Report, NCHRP Project 22-2(2) (Aug. 1977).
40. BRONSTAD, M. E., and KIMBALL, C. E., JR., "Multiple Service Level Bridge Railings-Perlonnance and Design Criteria." Phase II Report, NCHRP Project 22-2(2) (Apr. 1979).
BRIDGE RAILING UPGRADING BIBLIOGRAPHY
Retrofit Research
I. KIMBALL, C. E. JR., ET AL., "Heavy Vehicle Tests of Tubular Thrie Beam Retrofit Bridge Railing." Phase 05 Report, Contract DOT-FH-8130 (1980).
2. KIMBALL, C. E., ET AL., "Heavy Vehicle Tests of Tubular Thrie Beam Retrofit Bridge Railing." Presented at Transportation Research Board Sixtieth Annual Meeting (Jan. 1981).
3. BRONSTAD, M. E., and KIMBALL, C. E., "Bridge Rail Retrofit for Curved Structures." Volumes 1and2, Final Report, Contract DOT-FH-11-9462 (June 1981).
4. BRYDEN, J.E., and HAHN, K. C., "Crash Tests ofLightPost Thrie-Beam Traffic Barriers." New York DOT
33
Research Report 85, Report FHWAINYIRR/-81185 (Mar. 1981).
5. BRYDEN, J. E., and HAHN, K. C., "Crash Tests of Box Beam Upgradings for Discontinuous Panel Bridge Railing." Preliminary Draft, NewYork, DOT Research Report (Mar. 1981).
6. MICHIE, J. D., and BRONSTAD, M. E., "Upgrading Safety Perlonnance in Retrofitting Traffic Railing Systems." Phase I Report Draft, FHWA ContractDOT-FH-11-8100 (Sept. 1974).
7. MICHIE, J. D., ET AL., "Retrofitting Traffic Railing Systems." Final Report FHWA-RD-7740 (Sept. 1976).
General Bridge Railing Research
8. BEATON, J. L., and PETERSON, H. A., "Road Barrier Curb Investigation." State of California Research Report (Dec. 1953).
9. BEATON, J. L., and FIELD, R. M., "Final Report of PullScale Tests of Bridge Curbs and Rails." State of California Research Report (Aug. 1957).
10. NoRDLIN, E. F., FIELD, R. N., and HACKETT, R. P., "Dynamic Full-Scale Impact Tests of Bridge Barrier Rails. HRB Research Record 83 (1965).
11. BEATON, J. L., and FIELD, R. N., "Dynamic Full-Scale Tests of Bridge Rails." State of California Research Report (Dec. 1960) 23 pp.
12. U.S. GOVERNMENT, Proposed Specification for Bridge Railings. Bureau of Public Roads (Apr. 1962) 23 pp.
13. NoRDLIN, E. F., FIEw, R. N., and STOKER, J. R., "Dynamic Full-Scale Impact Tests of Steel Bridge Barrier Rails, Series XL" State of California, Res. Report No. M & R 36356 (June 1967) 37 pp.
14. NoRDLIN, E. F., HACKETT, R. P., and FoLsoM, J. J., "Dynamic Tests of California Type 9 Bridge Barrier Rail and Type 8 Bridge Approach Guardrail." HRB Research Record 302 (1970) pp. 1-20.
15. OLSON, R. M., PosT, E. R., and McFARLAND, W. R., "Tentative Service Requirements for Bridge Rail Systems." NCHRP Report 86 (1970) 62 pp.
16. NoRDLIN, E. F., WoonsTROM, J. H., HACKETT, R. P., and FOLSOM, J. J., "Dynamic Tests of the California Type 20 Bridge Barrier Rail." HRB Research Record 343 (1971) pp. 57-74.
17. DELEYS, N. J., "Investigation of a Torsion Post-Beam Rail Type of Bridge Railing." Report No. CAL-V J-2363-V-1, Cornell Aeronautical Laboratory (1972).
18. OLSON, R. M., IVEY, D. L., POST, E. R., GUNDERSON, R. H., and CETINER, A., "Bridge Rail Design: Factors, Trends, and Guidelines." NCHRP Report 149 (1974) 49pp.
19. OLSON, R. M., WEAVER, G. D., Ross, H. E., JR., and PosT, E. R., "Effect of Curb Geometry and Location on Vehicle Behavior." NCHRP Report 150 (1974) 88 pp.
20. KIMBALL, c. E., BRONSTAD, M. E., MICHIE, J. D., WENTWORTH, J. A., and VINER, J. G., "Full-Scale-Tests of a Modified Collapsing Ring Bridge Rail System." Paper prepared for the Transportation Research Board Fifty-Fifth Annual Meeting (1975).
21. MICHIE, J. D., and BRONSTAD, M. E., "Development of Approach Rail-Bridge Rail Transition Using Aluminum

34
Balanced System." TRB Research Record 488 (1974) pp. 49-52.
22. KIMBALL, c. E., BRONSTAD, M. E., MICHIE, J. D., WENTWORTH, J. A., and VINER, J. G., "Development of a Collapsing Ring Bridge Railing System.'' Final Report, FHW A Contract DOT-FH-11-7985, Southwest Research Institute (1975).
23. HIRSCH, T. J., and BUTH, C. E., "Testing and Evaluation of Bridge Rail Concept. " Project Report No . RF3053-J , Texas Transportation Institute, Texas A & M University (1975).
APPENDIX A
SUPPORTING INFORMATION FOR MULTIPLE SERVICE LEVEL APPROACH FOR BRIDGE RAILINGS
This appendix contains information , findings, and results that support
or describe assumptions and procedures used in the multiple service level
approach (MSLA).
A.l
MSU is a comprehensive systems approach used in selecting the most
cost-effective bridge railing designs for specific highway sites. During
development of MSLA, a number of parameters were examined and their relation-
ship to the overall cost-effectiveness of barrier selection ascertained. In
cases, published facts, previous research, and/or accident statistics
used to support elements of the MSL.A. In other cases, the authors relied on
rational developments to support assumptions. Parameters that were considered
include the following:
• Functional Classification
.... rural or urban - arterial - minor arterial • collectors - roads and streets
• Bridge Rail Accidents
- consequences - frequency - costs - benefits of bridge railing
• Impact Probability
.. encroachment frequency (rural/urban location, number of lanes, direction of traffic and bridge width)
- lateral distance traveled
A. l
24. KIMBALL, C. E., WILES, E. 0., and MICHIE, J. D., "Test Evaluation of Tubular Thrie Beam for Upgrading Concrete Bridge Railing." Paper prepared for the Transportation Research Board Fifty-Fifth Annual Meeting (1975).
25. Ross, H. E. JR., and PosT, E. R., "Dynamic Behavior of an Automobile Traversing Selected Curbs and Medians." Research Report 140-6, Texas Transportation Institute and Texas Highway Department (Jan. 1975).
• Collision Conditions
- vehicle size distribution - impact speed - impact angle
• Barrier Behavior
- vehicle containment - redirection severity • poet-impact trajectory
• Barrier Design Alternatives
- rigid metal or concrete - flexible metal .... costs
• Service Level Selection Criteria
- cost effectiveness - cost/benefit ratio (B/C)
A.Ll Functional Classification
The functional classification of the roadway bridge identifies
critical aspects relating to the MSLA; specifically
• vehicle mix • geometrics • range of traffic volume (ADT) • design speed • accident rate
A fabic functional classification as described in Reference 6 is given in
Table A. L Characteristics of bridges for roadways by functional classifica-
tion are developed in following sections.
A. l. L 1 Local Roads and Streets. Local roads and streets
constitute a high proportion of the roadway mileage in the United States.
l,oc..al r urtl roada . Two tl;'avel lanes usually
can accommodate traffic volumes on these roads. Bridge width and shoulder
requirements are given in Table A. 2. Table A. 3 provides minimum requirements
for bridges to remain in place. The values in Table A. 3 do not apply to
A.2
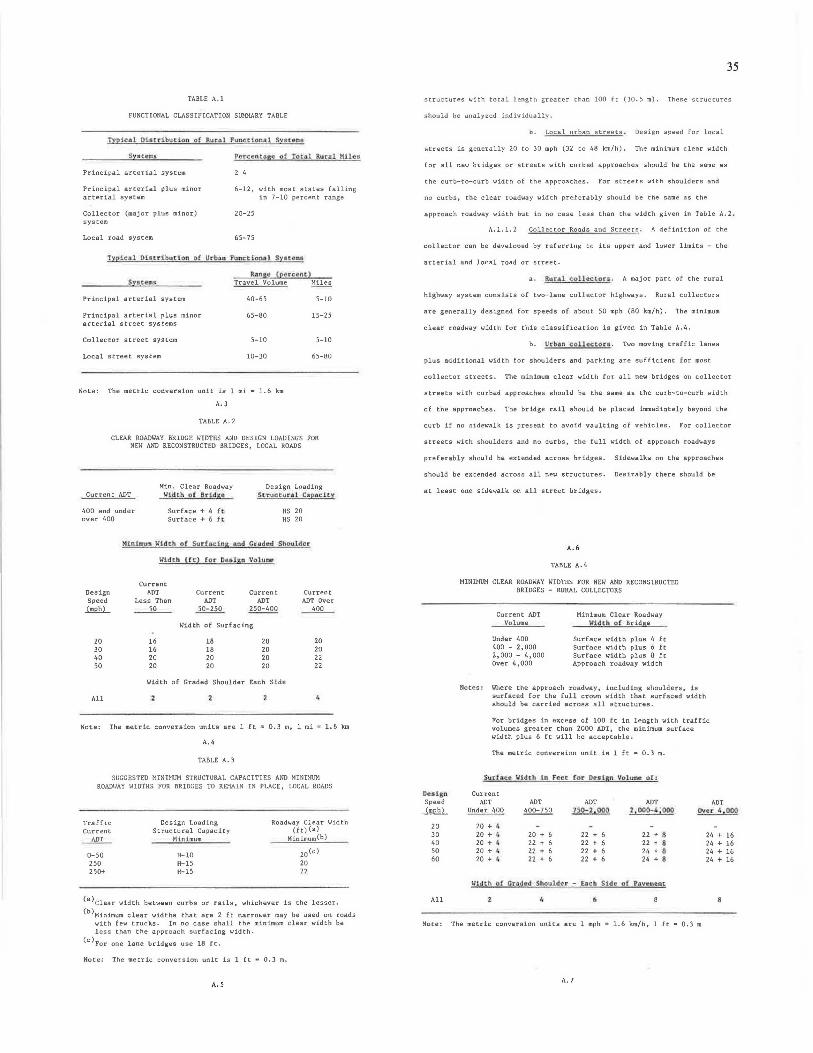
TABLE A. l
FUNCTIONAL CLASSIFICATION SUMMARY TABLE
1'yplcol D1.Hr11Ntian of Rurol FunattonAJ Sv.sucu.
Principal arterial system
Principal arterial plus ruinor arterial system
Collector (major plus minor) systero
Local road system
Pctcentasc of TocGJ ltural :iii1cu11
2-4
6-12, with roost states falling in 7-10 percent range
20-2S
6S-7S
Typical Dtnri.bu[!on of Urb4n Functionol S)''lttim•
Sy1ttms
Principal arterial system
Principal arterial plus minor arterial street systems
Collector street system
Local street system
Range! (percent) Trnvel Volume fil!!.!
40-6S S-10
6S-80 1S-2S
S-10 S-10
10-JO 6S-80
Note: The metric conversion unit is 1 mi'"' l.b km
A. J
TABLE A. 2
CLEAR ROADWAY BRIDGE WIDTHS A..'llD DESIGN LOADINGS FOR NEW AND RECONSTRUCTED BRIDGES , LOCAL ROADS
Cut"rent ADT
.400 and under over 400
Min. Clear Roadway Wi.dch of BT1dge
Surface + 4 ft Surface + 6 ft
Design Loading Struccurd Cm:pllc.h:'/
HS 20 HS 20
M!nl11uo \.,lldt'h of Surfacina 11.nd Graded Shoulder
Design Speed
~
20 JO 40 so
All
Width (tc) fot Ol!!.5ign Volumo
Current ADT
Less Than __ s_o __
16 16 20 20
Curt"ent ADT
S0-250
Current ADT
~
Width of Surfacing
18 20 18 20 20 20 20 20
Width of Graded Shoulder Each Side
Current ADT Ovet" ___JQQ_
20 20 22 22
Note: The metric conversion units are 1 ft !S 0.3 111 1 1 mi"' 1.6 km
A.4
TABLE A. J
SUGGESTED MINIMUM STRUCTURAL CAPACITIES AND MINHRJM ROADl~AY WIDTHS FOR BRIDGES TO RE:tAIN IN PLACE, LOCAL ROADS
Traffic Current ----"!1!,__
0-SO 2SO 2So+
Design Loading Structural Capacity
Minimum
H-10 H-lS H-lS
Roadway Clear Width (ft) ( 3 )
Minimum Cb)
20(c)
20 22
(a)Clear width between curbs or rails, whichever is the lesser.
(b)Minimum clear widths that are 2 ft narrower may be used on roads with few trucks. In no case shall the minimum clear width be less than the approach surfacing width.
(c\or one lane bridges use 18 ft.
Note: The metric convet"sion unit is 1 ft • O.J m.
A.S
35
structures with total length greatet" than 100 ft (JO. 5 m). These s tructures
should be analyzed individually.
b. Local urban streets. Design speed for local
stt"eets is generally 20 to 30 mph (32 to 48 km/h), The minimu111 clear width
for all new bridges or streets with curbed approaches should be the same as
the curb-to-curb width of the approaches. For streets with shoulders and
no curbs, the clear roadway width preferably should be the same as the
approach roadway width but in no case less than the width given in Table A. 2.
A.1.1.2 Collector Roads and Streets. A definition of the
collector can be developed by referring to its upper and lower limits - the
at"terial and local road or street.
a. Rural collcu:tor.s . A major part of the rural
highway system consists o! two-lane collector highways. Rural collectors
are generally designed for speeds of about 50 mph (BO km/h), The minimum
clear rnadway width for this classification is given in Table A.4.
b. Utbn.n colle-ctort. Two moving traffic lanes
plus additional width for shoulders and parking are sufficient for most
collector streets. The minimum clear width for all new bridges on collector
streets with curbed approaches should be the same as the curb-to-curb width
of the approaches. The bridge rail should be placed immediately beyond the
curb if no sidewalk is present to avoid vaulting of vehicles. For collector
streets with shoulders and no curbs, the full width of approach road\oays
preferably should be extended across bridges. Sidewalks on the approaches
should be extended act"oss all new structures. Desirably there should be
at least one sidewalk on all street bridges.
Dtt11lg:n Speed
.l!Ehl... 20 JO 40 so 60
All
A.6
TABLE A.4
MINIMUM CLEAR ROADWAY WIDTHS FOR NEW AND RECONSTRUCTED BRIDGES - RURAL COLLECTORS
Current ADT Volume
Under .400 400 - 2,000 2,000 - 4,000 Over 4,000
Minimu111 Clear Roadway Width o( Bridge
Surface width plus 4 ft Surface width plus 6 ft Surface width plus B ft Approach roadway width
Notes: Where the approach roadway, including shoulders, is surfaced for the full crown width that surfaced width should be carried across all structures.
For bridges in excess of 100 ft in length with traffic volumes greater than 2000 ADT, the minimum surface width plus 6 ft will be acceptable.
The metric conversion unit is 1 ft '"' 0. 3 m.
S·urhu ~ldth ln F~et fot Destsn \1ohme of:
Current ADT ADT ADT ADT ADT
Under 400 ~ 1~0-2.000 2 1 000-4 jOllO Over 4,000
20 + I\
20 + " 20 + 6 22 + 6 22 + 8 24 + 16 20 + 4 22 + 6 22 + 6 22 + 8 24 + 16 20 + 4 22 + 6 22 + 6 24 + 8 24 + 16 20 + ' 22 + 6 22 + 6 24 + 8 24 + 16
Wtdth of Crbd ltd Shouldrr: - Eiic:h Side of Povt:fli:ilnt:
Note: The metric conversion units are l mph • 1. 6 km/h, 1 ft • O. 3 m
A. 7
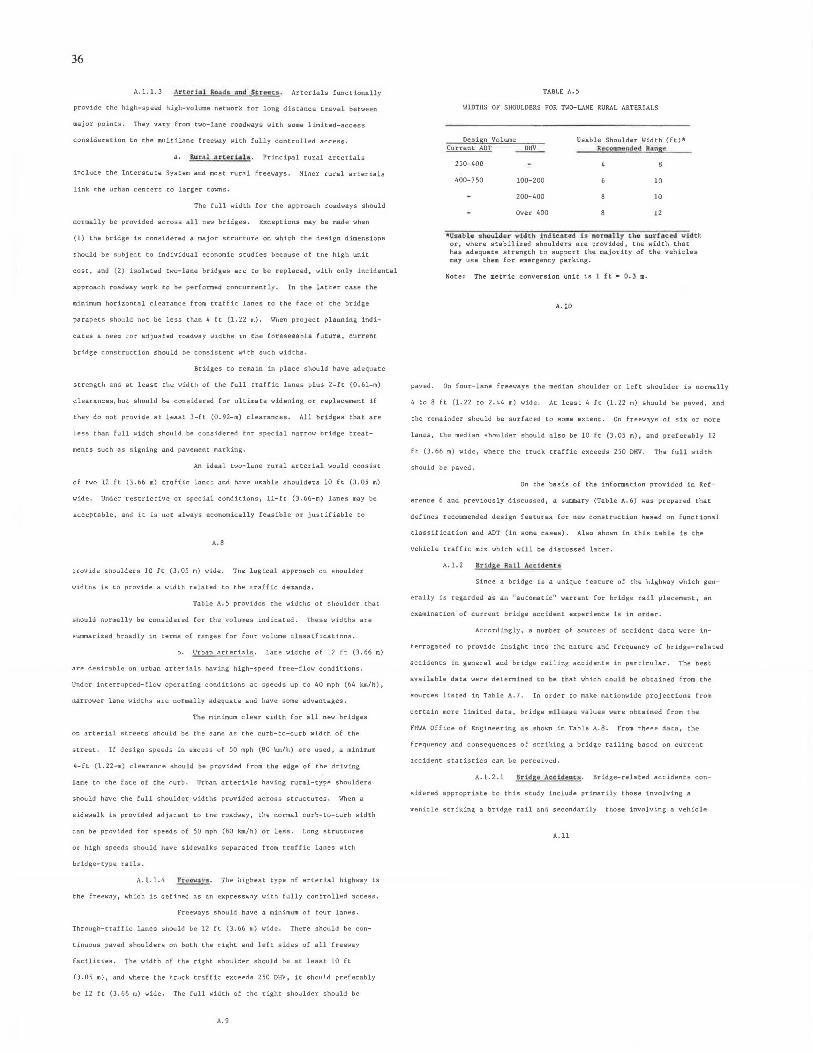
36
A.1.1. 3 Artothl Ro1ul11 nnd Scra.eu. Arterials functionally
provide the high-speed high-volume network for long distance travel between
major point s. They vat"y from two-lane roadways with some limited-access
consideration to the multil.ane freeway W'ith fully controlled access.
l\ur.111 arte-rial..!I. Principal rural arterials
include the Interstate System and most rut"al freeways. Minor rural arterials
link the urban centers to larger towns.
The full width for the approach roadways should
normally be provided across all new bridges. Exceptions may be made when
(1) the bridge is considered a major structure on which the design dimensions
should be subject to individual economic studies because of the high unit
cost, and (2) isolated two-lane bridges are to be replaced, with only incidental
approach roadway work to be performed concurrently. In the latter case the
minimum horizontal clearance froru traffic: lanes co the face of the bridge
parapets should not be less than 4 ft (1.22 m), When project planning indi-
caces a need tor adjusted roadway widths in the tor~~eeable future, current
bridge construction should be consistent with such widths.
Bridges to remain in place should have adeqi.1ate
strength and at least the width of the full traffic lanes plus 2-ft (0.61-m)
clearances, but should be considered for ultimate widening or replacement if
they do not provide at least 3-ft (0.92-m) clearances. All bridges that are
less than full width should be considered for special narrow bridge treat-
ments such as s igning and pavement marking.
An ideal two-lane rural arterial would consi:it
of two 12 ft (3.66- m) traffic lance. and have uMble shoulders 10 ft (J.OS m)
wide. Undt?r restrictive or special conditions, 11-ft (3.66-m) lanes may be
acceptable. and it is not always economically feasible or justifiable to
A. B
provide shoulders 10 fc (3.05 m) wide. The logical approach on shoulder
widths is to provide a width related to the traffic demands.
Table A. S provides the widths of shoulder that
should normally be considered for the volumes indicated . These widths are
summarized broadly in terms of ranges for four volume classifications.
b. Urban arterials. Lane widths of 12 ft (3.66 m)
are desirable on urban arterials having high-speed free-flow conditions.
Under interrupted-flow operating conditions at speeds up to 40 mph (64 km/h),
narrower lane widths are normally adequate and have some advantages.
The minimum clear width for all new bridges
on arterial streets should be the same as the curb-to-curb width of the
street. I[ design speeds in excess of SO mph (BO km/h) are used, a miniCl'lum
4-ft (1. 22-m) clearance should be provided from the edge of the driving
lane to the face of the curb. Urban arterials having rural-type shoulders
should have the full shoulder widths provided across structures. When a
sidewalk is provided adjacent to the roadway, the normal curb-to-curb width
can be provided for speeds of 50 mph (BO km/h) or less. tong structures
or high speeds should have sidewalks separated from traffic lanes with
bridge-type rails.
A.1.1. 4 ~· Tlie :1ighest type of arterial highway is
the freeway, which is defined as an expressway with fully controlled access.
Freeways should have a minimum of four lanes.
Through-traffic lanes should be 12 ft (3.66 m) wide. There should be con-
tinuous paved shoulders on both the right and left sides of all freewa y
facilities. The width of the right shoulder should be at least 10 ft
(J.05 m), and where the truck traffic exceeds 250 DHV, it should preferably
be 12 ft (3.66 m) wide. The full width of the right shoulder should b e
A. 9
TABLE A. 5
IHDTHS OF SHOULDERS FOR TWO-LANE RURAL ARTERIALS
Design Volume
250-400
400-7 50 100-200
200-400
over 400
Usable Shoulder Width (ft)* R.ec.omo.tmded RQlngi!
10
10
12
'IUs11ble shouldur "'7ldth indic.ated 1.t nonaally the !1urr.ac:e:d &1Jdth or, where stabilized shoulders are provided, the width that has adequate strength to support the majority of the vehicles may use them for emergency perking.
Note: The metric conversion unit is I ft • 0.3 m.
A.10
paved. On four-lane freeways the median shoulder or left shoulder is normally
4 to B ft (1.22 to 2.44 m) wide. At least ii ft (l.22 ra) should be paved, and
the remainder should be surfaced to some extent. On freeways of six or more
lanes, the median shoulder should also be 10 ft (3.05 m), and preferably 12
ft (3.66 m) wide, where the truck traffic exceeds 250 DHV. The full width
should be paved.
On the ba.!h of the information providC?d in Ref
erence 6 and previously discussed 1 a summary (Table A. 6) was prepared that
defines recommended design features for new construction based on functional
classification and ADT (in some cases). Also shown in this table is the
vehicle traffic mix which will be discussed later.
A.1.2 Br!d.ge- RAill Accldent•
Since a bridge is a unique feature of the highway which gen-
er ally is regarded as an "automatic:" warrant for bridge rail placement,
examination of current bridge accident experience 1s in order .
Accordingly, a nu111bel' of sources of accident data were in-
terrogated co provide insight into the nature and frequency of bridge-related
accidents in general and bridge railing accidents in particular. The best
available data were determined to be that which could be obtained froro the
sources listed in Table A. 7. [n order to make nationwide projections from
certain more limited data, bridge mileage values were obtained from the
FHWA Office of Engineering as shown in Table A.8. From these data, the
frequency and consequences of striking a bridge railing based on current
accident statistics can be perceived.
A.1. 2. 1 Bridge 1\cctdc:Ats. Bridge-related accidents con-
sidered appropriate to this study include primarily those involving a
vehicle strikin~ a brid~e rail and secondarily those involving a vehicle
A.11
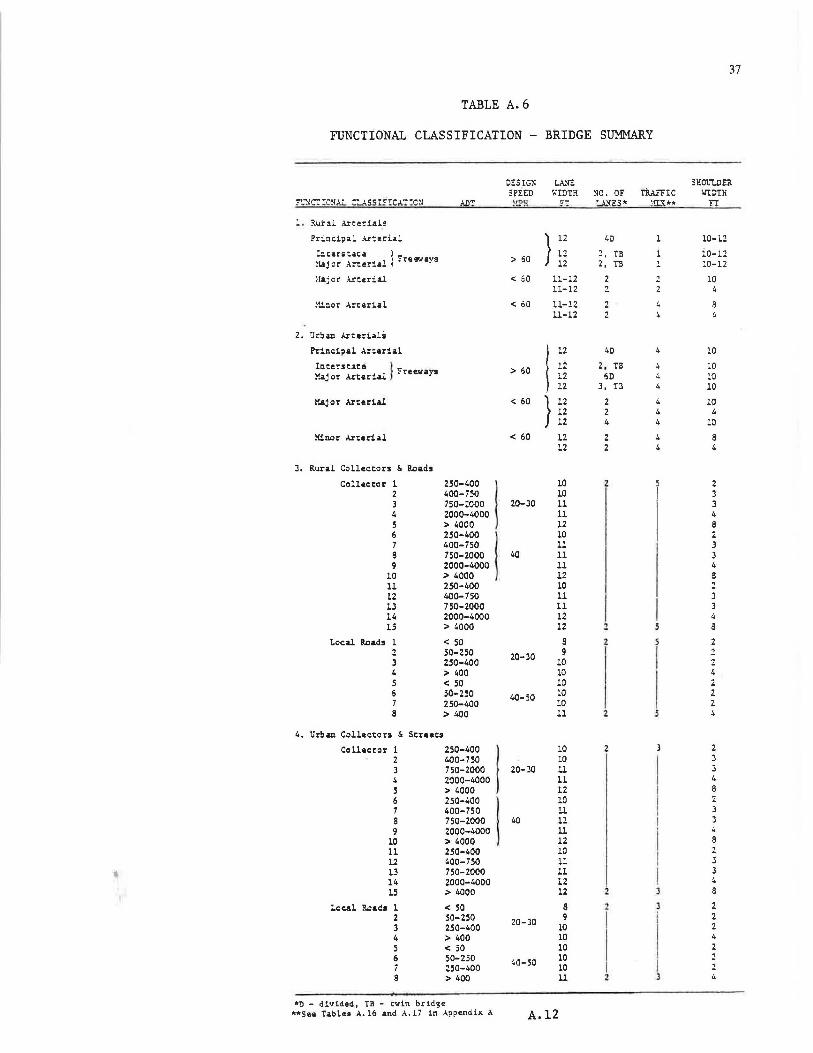
37
TABLE A. 6
FUNCTIONAL CLASSIFICATION - BRIDGE SUMMARY
DESIGN LA.'ft SHOL"LDEa SPEED \:!DTH :<10. OF TR.u""F!C l.'!DTH
:'-~CT:c~~..l :t.ASSI.!!CAT:cN AO'!" ~!..?~ !''! "...ANES* '.1I..'l:** FT
3.ui'al Area'!'ials
Principal Ar~erial } 12
40 l0-12
!.:l.tars taco! . l t" > 60 l2 :!, !B io-11
, . . .. rei!Wavs 12 2. Til l 10-12 .taJcr A~e~ia~ ·
Haj or .-\.rtierial < 50 ll-12 2 10 ll-12 2
Xinor Arterial < 60 ll-12 8 u-12 4
2. tlr~an AnerialS
Princi?al Ar:erial 12 40 4 10
Iciterstua } ,, > 50 12 2, TB 10 "< .\. W .reeways 12 60 4 10 .~.,,or . .rter
12 3, !3 4 10
Major Arterial < 60 } 12 2 4 10 12 2 4 4 12 4 4 10
!-lie.or Arterial < 60 12 2 4 8 12 2 4 4
3. Rural Collectors & RD ads
Collector 1 250-400 10 2 2 400-750 10 3 3 150-ZOOO 20-30 ll 3 4 2000-4000 ll 4 5 > 4000 12 8 6 250-400 10 2 7 400-750 l1 3 8 750-2000 40 11 3 9 2000-4000 11 4
10 > 4000 12 a 11 250-400 10 12 400-750 11 3 13 750-2000 ll 3 14 2000-4000 12 4 15 > 4000 12 2 s 8
Local Roads < 50 s 2 2 50-250 20-30 9 2 3 2.50-400 10 2 4 > 400 10 4 5 <so 10 2 6 30-2.50 40-50 10 2 7 250-400 10 2 a > 400 ll 2 4
4. urban Collectors & Streets
Collector l 250-400 10 2 2 2 400-750 10 3 3 750-2000 20-30 ll 3 4 2000-4000 11 4 5 > 4000 12 8 6 250-400 10 2 7 400-750 ll 3 8 750-2000 40 11 3 9 2000-4000 ll
10 > 4000 12 8 ll 250-400 10 2 12 400-750 11 3
• 13 750-2000 11 3 14 2000-4000 12 4
15 > 4000 12 2 8
Local Reads 1 < 50 8 2 2 50-250 20-30 9 2 3 2.50-400 10 2 4 > 400 10 4 5 < 50 10 2 6 50-250 40-50 10 i 250-400 10 s > 400 ll 4
·~ - divided, TB - twin bridge ••See Tables A.16 and A.17 in Appendix A A.12
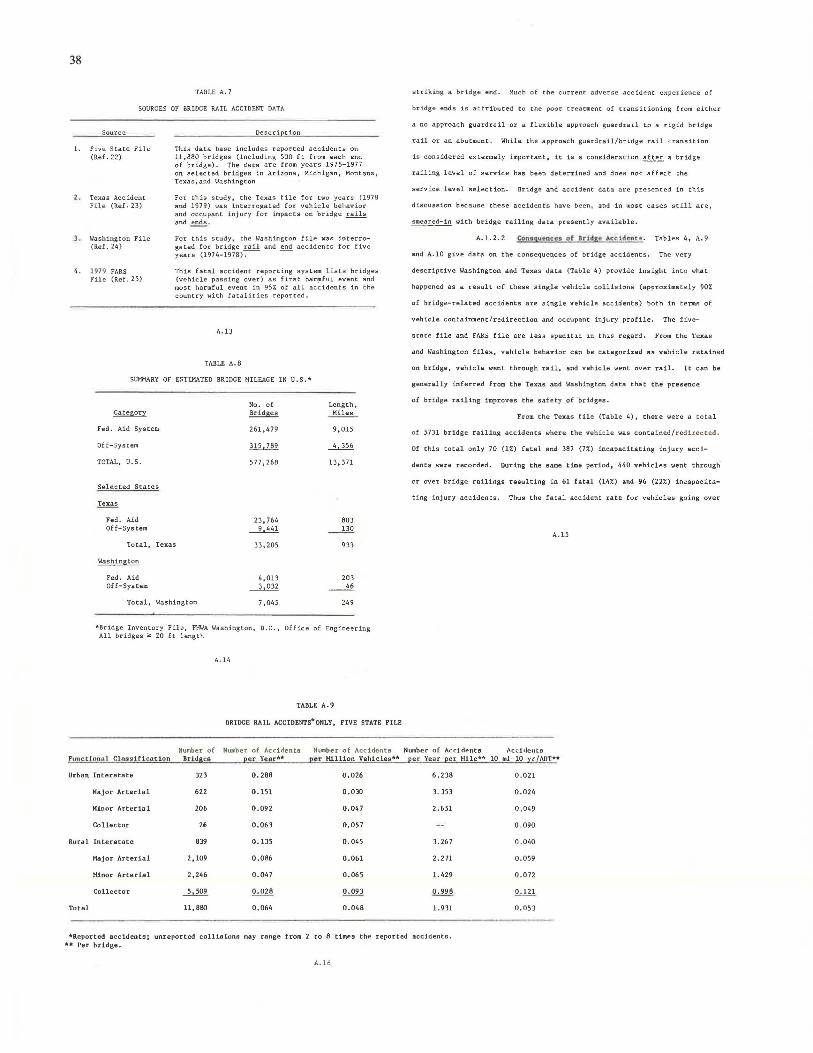
38
TABLE A. 7
SOURCES OF BRIDGE RAI L ACCIDENT DATA
Source
1. five State File (Ref. 22)
2 . Texas Accident Fi l e (Ref. 23)
) • Washington File (Ref. 24)
4. 1979 FARS File (Ref. 25)
Des c-r i tion
This data base includes t'epot'ted accidents on 11,880 bridges (including 500 ft from each end of bridge). The data are from years 1975-1977 on selected bridges in Arizona, Michigan, Montana, Texas, and Washington
Fat" this study, the Texas file for two years (1978 and 1979) wa s interrogated for vehicle behavior and occupant injury for impacts on bridge rails and ~. --
For this study, the Washington file was interrogated for bridge r a il and end accidents for five years (1974-1978).
This fatal accjdent reporting system lists bridges (vehicle pa ss ing over) as first haqnful event and most harmful event in 95% of all accidents in the country with fataliti es reported.
A.13
TABLE A.8
SUMMARY or ESTIMATED BRIDGE MILEAGE IN u. s. *
Fed. Aid System
Off- Sysc::em
TOTAL, U.S.
Selected States
Fed. Aid Off-System
Total, Texas
Washington
Fed . Aid Off-System
Total, Washington
No . of Length, Bridges ..l!lli!.-261,479 9,015
315,789 ~
577,268 13,371
23,76" 803
~ ___g£
33, 205 933
4,013 203 ___l,_QH_ __ 4_6
7 ,045 249
*Bridge Inventory Fi.le, FHWA Washington , D.C. 1 Office of Engineering All bridges -=. 20 ft length
A.14
TABLE A.9
ORIOCE RAIL ACCIDENTS* ONLY, FIVE STATE PILE
striking a bridge end. !iuch of the c urrent adve r s e accident experience of
bridge ends is attributed to the poo r treatment of transitioning from eithe r
a no approach guardrail or a fl exible approac h guardrail to a rigid bridge
rail or an abutment. While the approach guardrail/bridge rail transition
is considered extermely important, it is a consideration after a bridge
railing level of service has been determined and does not affect the
service level selection. Bridge and accident data are presented in this
discussion because these accidents have been, and in most cases still are,
smeared-in with bridge railing data presently available.
A.1.2 . 2 Conagut.ncu_. of- &ridge Ac.c..ld1:m1:.s . Tables Li, A. 9
and A. 10 give data on the consequences of bridge accidents. The very
descriptive Washington and Texas data (Table 4) provide insight into what
happened as a result of these single vehicle collisions (approximately 90%
of bridge-related accidents are single vehicle accidents) both in terns of
vehicle containment/redirection and occupant injury profile. The five-
state tile and FARS tile a.re less specU'ic in this regard. l"rom the Texas
and Washington files, vehicle behavior can be categorized as vehicle retained
on bridge, vehicle went through t"ail, and vehicle went over rail. It can be
generally inferred from the Texas and Washington data that the presence
of bridge railing improves the safety of br idges.
From the Texas file (Table 4), there were a total
of 5731 bridge railing accidents where th~ vehicle was conta i ned/ r edirected .
Of this total only 70 (1%) fatal and 387 (7~) incapacitating injury acci-
dents were recorded. During the same time period, liliO vehicles went through.
t'lr over bridge niling& ruulting in 61 fatal (1'1%) and 96 (22X) incapaaita-
ting injury accidents. Thus the fatal accident rate for vehicles going ovet'
A.15
Number of Nwnber of Accidents Number of Accidents Number of Accidents Acc1<lente Func tional ClBBsifi cetion Bridges per Yeart1• per Million Vehic:les** per Year per Hile*tc 10 mi-10 yr}ADT*"
Urban In t erstate 323 o. 288 0.026 6 .238
Major Arterial 622 0.151 0.030 J. 353
Minor Arteria 1 206 0.092 0.047 2.651
Collector 26 0.063 0.057
Rural Interstate B39 0.135 0.045 J. 267
Major Arterial 2, 109 0.086 0.061 2.271
Minor Arterial 2,246 0.047 0.065 1.429
Collector ~ 0.028 0.093 .Q.,1ll
Total 11, 880 0.064 0.04B 1.931
*Reported accidents; unreported colliBione may range from 2 to 8 times the reported accidents. •• f'er bridge.
A.16
0.021
0.024
0,049
0.090
0 .040
0.059
0.072
.!!..ill. 0.053
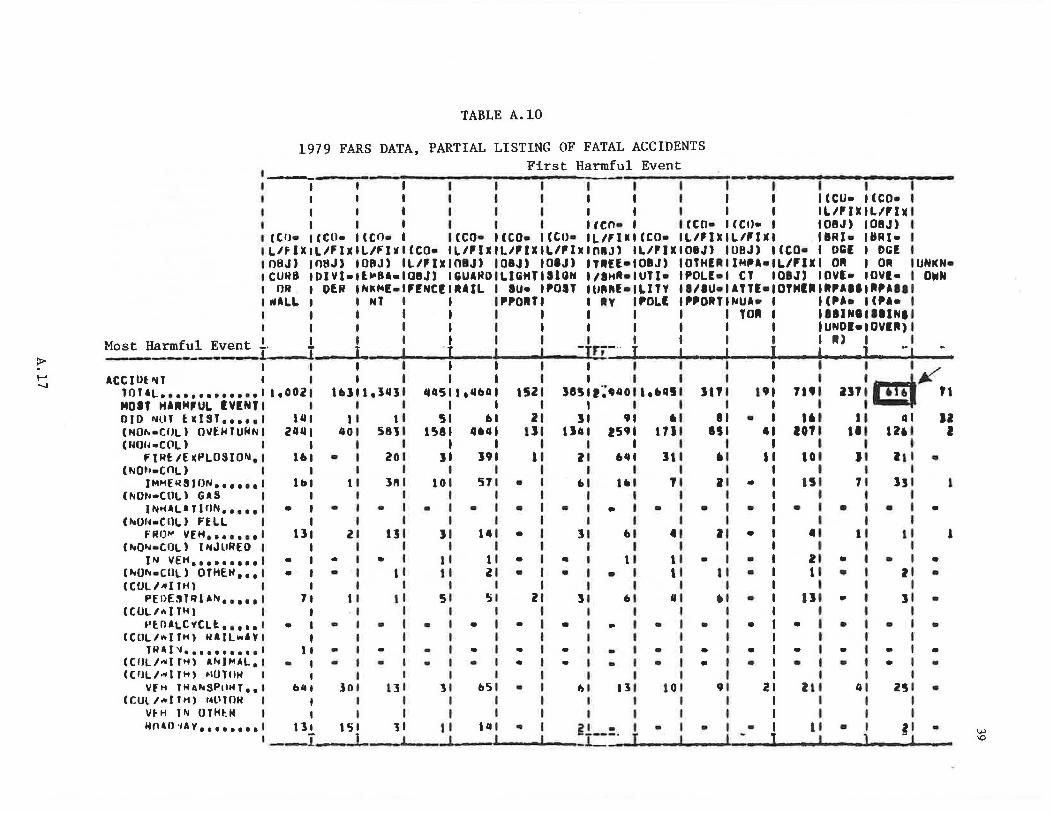
> I-' ........
TABLE A.10
1979 FARS DATA, PARTIAL LISTING OF FATAL ACCIDENTS
(CO• LIFIX nHJI CUN8
OR llllALL
First Harmful Event ,_I I I I I I I I I
I I I I I I I I I l(CU• l(CO• I f I I I I I I I IL/flXIL/flx I I I I I ICO• I ICCO• l(CIJ• I IOBJ) IOBJ)
(CO• l(CO• I l(CO• l(CO• ICCO• L/flXl(CO• IL/,IXIL/'IXI llRl• llRI• LlflXIL/FIWl(CO• IL/,IXILIPIXIL/,lx OIJ) IL/flXIOIJ) IUBJ) l(CO• I DG( I DGl OHJ) IORJ) IL/,IXIOIJ) IDBJ) IOIJ) TlfE•IOBJ) IOTHllllMPA•IL/,IXI OR I OR DIVl•ll~8Ael01J) IGUARD LIGHTtllGN /IHR•IUTI• IPOL(•I CT IDIJ) IOVl• IOVl•
OER l~K~E•lf!NC!llAIL IU• POST ll"~f•ILITY 11/IU•IATTl•IOTHllllPAllllPAll I NT I I PPOIT IY IPOLl IPPDRT NUA• I ICPA• ICPA• • I I I I TOI I llllNlllllNI
I I I I I IUNDl•IDVll;
UNKN• D~N
f 1 E 1 I I I I I I I I I) I Most H~~':!~r i 1.. 1 ·1 -rr;-· J 1 I 1 1 -, ~
ACC llJt "4T TOTAL••••••••••••• MDIT HAIM,UL lVlNT DJO NUT twlST••••• (NOhCIJL) OVE.IHUNN (l~Ul~•CllL)
FIR~ IE ICPLOSION, < NOt-1.cnu
IMME~SJON •••••• (lllON•COL) GAS
INl'ULIT&rlN ••••• C~Ol~•CllLJ FE.LL
F RIJ"' V[H • • •, • • • (~QN•COL) INJURED
IN VEH••••••••• (~O~•COLJ OTHEW,,. (CUL/NIJH)
PEOEST~lllll••••• CCULl"'ITH)
•'lOALCVCLt. • •, • • (COLl~JTH) NAJL•AV
TNA I '4 •••••••••• ( CIJL /"'I PO AlllJ "4AL • (CfJLl,..l JH) ~•OTOH
\lfH TM4~SPlllfT • • ((Ul/~ITH) M~TON
\ll:H JN OTHt:.M HOAD ·IA'(• 0 • 1 • 1 • 1
1,ooz
14 lU
,. lb
• 11
• •
7
•
•
bll
I I I I I I I I I ..._/ I I I I I I I I cmJllli..
1•111,]4]1 q4511,4•G tSZ J851t;•ao11,•a!I JI? ,,, ,,,, 2JJI • Tl
•
•
• •
•
•
I GO
I
l
JO
I I I I I I I I t 1 51 • Z JI •1 •I I • I l•I 11 a I H
5811 1~81 04 tJ lhl !5•1 IUI H 41 I011 Ill lhl I
zo
]ft
-lJ
•
•
•
n
•
•
•
J
lO
J
I I
5
J
•
• • •
H
57
u
I l
!;
•
• • • •
•
• •
b51 • I I
a z
• • •
3
• • •
z J
• •
• • • •
,,
64
l•
~
• I
' I I I I
111 I I
•
•
• •
Jl
1
• l l
4
I
I I
10 1
I I I • II lO I JI
I I I II • I 151
I • I •
I " . I • I •
'' . I
• •
• I • I
• I • • I • ,,
•
I • I I • I •
ZI
• z a
11
I I I I
I ll
7
• I
• • .. • I
' • I • I
41
It • J]
• • &
• • I • ] •
• I •
• I • • I •
I Z~I •
I I
111 151 ll ti 141 ~ l' • I • I • I • I I I • I ~I • _ __I J _.a,__ I _r::-· _ J_ ___j_ __ _l - ] I \ __ ""''--
VJ \Cl
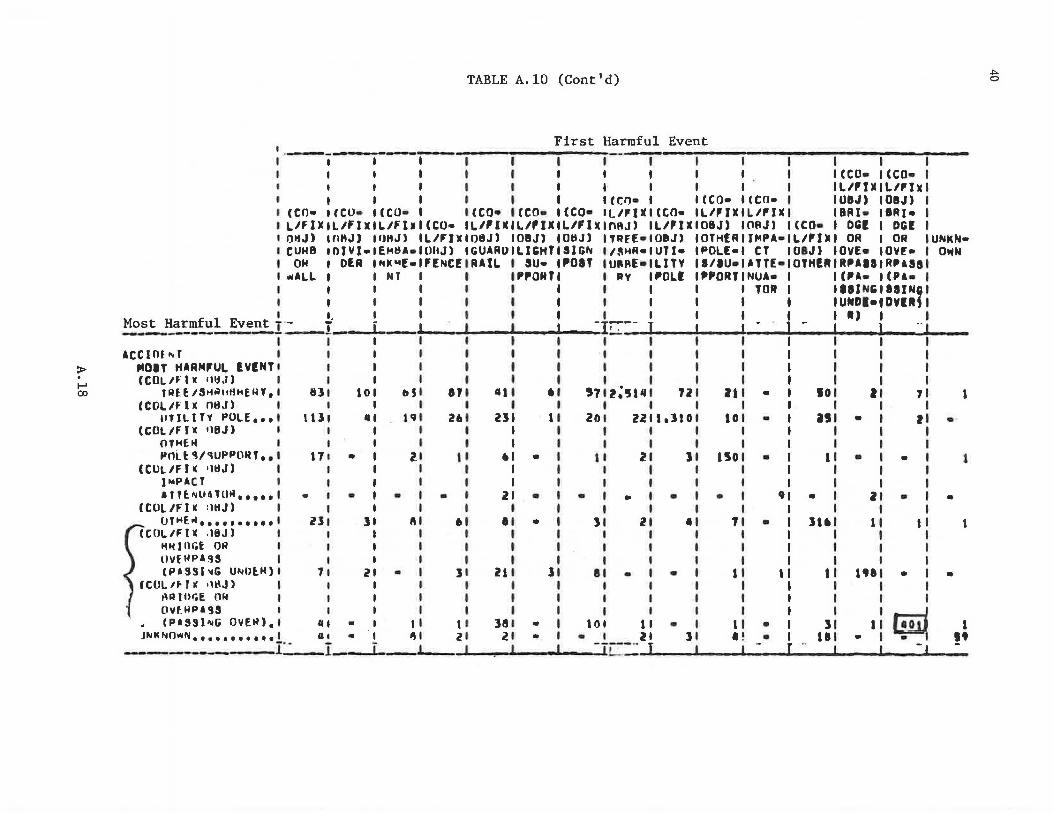
> I-' 00
TABLE A.10 (Cont'd)
First Harmful Event ~.__.,_.- _____. ___________________ _ I I I I I
1 I t I t I CCD• t(CO• I I t I I I t Ll,IXtLl,IMI t I (CO• I I (CO• t (CO• I OBJ) IOIJ) I
(CO• l(CU• llCO• (CO• ICCO• (CO• L/,IXl(CO• IL/,IXILl,IKI BRI• llRI• I LIFIXIL/flXIL/flx (CU• L/,IMILl,IX LIFIK nAJ) ILl,IXIOBJ> IOAJ) l(CO• DGl I DGl I OHJ) IOffJJ IOHJ) L/,IX 08J) 108J) 08JJ TREE•I09J) IOTHEAllHPA•IL/,JX OR I OR IUNKN• CUHB IDIVJ•IEH~A• U~J) GUAR~ILIGHT SIG~ /~HA•IUTI• IPOLE•I CT IDIJ) OVE• IOVf• I OWN
ON I DlR INK~!• fENC! RAIL I SU• ,OIT URA[•ILITV 11/IU•IATTE•IOTHlR R'AlltR,ASSI llllALL t I NT "'ONT AV l'OL! ,,ORT NUh I ("• t (Ph I
I I I TOR I lllNGtlSIN~I t t t I UNDl•tDVIRtl
. I, I I I R) I I ~!!._~~~~.:!!_~nt I:=--I_ i _1 • -1:7-- I - 1 - J .. ,
. t I I I I ace 10E ... 1
MOIT HARM,UL lVlNT (COL,, .. t II I)~,,)
TRH /S ... ~llHHfHY. (COL/Fill n8J)
llTIL 1 TY POLE 111
(COL/Fill 118JJ OTHl~ POLl:"'/,UPPOHT 11
(CULIFJI( tlltJ) J1o1PACT ATH.NU6Tlll~ 11111 I
(CUL/Fiii :lHJ) I OTMl~ •••••••••••
(tOl.IF'llC .l8J) I ~Ntnr.t OH OVfHPA•U I (PASSl~G U~OlH)I
(COL If> J IC •'t'J) I
83
1 IJ
l7 •
• •
ll
7
I t I I I I I I I I I I I I I
IO &JI 111 41 • '71Z;5141 1l il • 10 II I I I I t .. l~I 2~1 ZJ I 201 22111110 IO • l!I • I
I I I I I I I I t
l t I • • 11 21 J t 150 • I • I • I I I I
• • z • • • • I • 9 • l • I
] " • • • J z • J • JI• l
21 • I JI 211 JI II • I • I I I l•I • I I I I I I I I I I I I I I
7
' l ..
•
• t\RJOGf OM OVf:HPA'S I [PISShG OVEtO,t "
I I I I I I I ~ • I 11 ti 181 • I 101 ti • I • J I 10 I
JlllKN01111111............ 41 - ., 'ti i?I 21 • I • I ZI ] • • II • • . •• ____ r· I- 1 _..___ , . , , -·L= r - r .. -, -
~
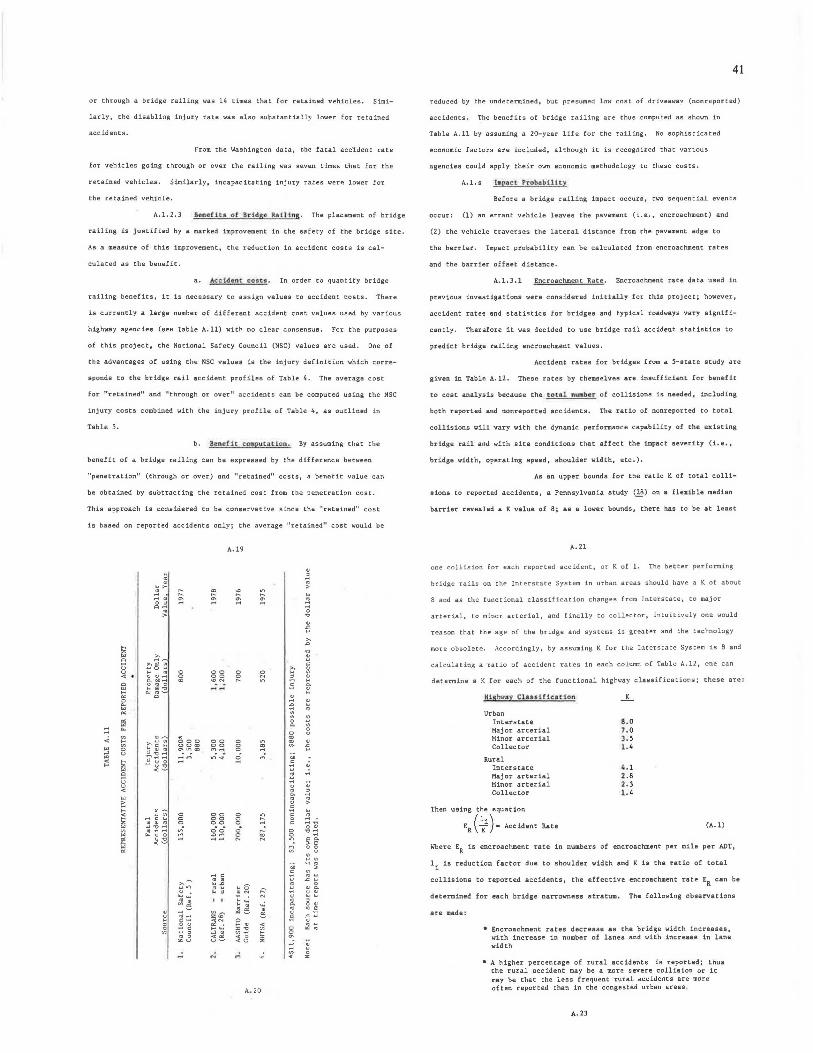
or through a bridge railing was 14 times that for retained vehicles. Simi-
larly, the disabling injury rate was also substantially lower for retained
accidents.
From the Washington data, tihe fatal acc'ident rate
for vehicles going through or over the railing was seven times t•hat for the
retained vehicles. Similarly, incapacitating injury rates were lower for
the retained vehicle.
A. l. 2. 3 8(!nl!Ut.a of B.~idae. Ra.11..tng. The placement of bridge
railing is justified by a marked improvement in the safety of the bridge site.
As a measure of this improvement, the reduction in accident costs is cal-
culated as the benefit.
a. Accident costs. In order to quantify bridge
railing benefits, it is necessary to assign values to accident easts. There
is currently a large number of different accident cost values used by various
highway agencies (sea Table A.11) with no clear consensus. For the purposes
of this project, the National Safety Council (NSC) values are used. One of
the advantages of using the NSC values is the injury definition which corre-
sponds to the bridge rail accident profiles of Table 4. The average cost
for "retained" and "through or over" accidents can be computed using the NSC
injury costs combined with the injury profile of Table 4, as outlined in
Table 5.
b. UenciUt cotaputat..ion. By assuming that the
benefit of a bridge railing can be expressed by the difference between
"penetration" (through or over) and "retained" costs, a benefit value can
be obtained by subtracting the retained cost from the penetration cost.
This approach is considered to be conservative since the "retained" cost
is based on reported accidents only; the average 11 retained" cost would be
.:
00 00 00
~&~
A.19
0 0 0
~&
A. 20
,., .. , "
.. -: . ~ u •
[ .:: 3 ~
.::: g "
41
reduced by the undetermined, but presumed low cost of driveaway (nonreported)
accidents. The benefits of bridge railing are thus computed as shoWTI in
Table A.11 by assuming a 20-year life for they-ailing. No sophisticated
economic factors are included, although it is recognized that various
agencies could apply their own economic methodology to these costs.
A. l. s tinpac.t.. ProbabilltY
Before a bridge railing impact occurs, two sequential events
occuT: (1) an errant vehicle leaves the pavement (i.e., encroachment) and
(2) the vehicle traverses the lateral distance from the pavement edge to
the barrier. Impact probability can be calculated from encroachment rates
and the barrier offset distance.
A. l. 3 .1 Encroachment Rate. Encroachment Tate data used in
previous investigations were considered initially for this project; however,
accident rates and statistiCli for bridges and typical roadways vary signifi-
cantly. Therefore it was decided to use bridge rail accident statistics to
predict bridge railing encroachment values.
Accident rates for bridges from a 5-atate study are
given in Table A.12. These rates by themselves are insufficient for benefit
to cost analysis because the total nuniber of collisions is needed, including
both reported and nonreported accidents. The ratio of nonreported to total
collisions will vary with the dynamic performance capability of the existing
bridge rail and with site conditions that affect the impact severity (i.e.,
bridge width, operating speed, shoulder width, etc.).
As an upper bounds for the ratio K of total coll!-
11ions to reported accidents, a Pennsylvania study (~) on a flexible median
barrier revealed a K value of 8; as a lower bounds, there has to be at least
A.21
one colllsion for each reported accident, or K of 1. The better performing
bridge rails on the Interstate System in urban areas should have a K of about
8 and as the functional classification changes from Interstate, to major
arterial, to minor arterial, and finally to collec tor, intuitively one would
reason that the age of the bridge and systems is greater and the technology
more obsolete. Accordingly, by assuming K for the Interstate System is 8 and
calculating a ratio of accident rates in each coluiun of Table A.12, one can
detenuine a K for each of the functional highway classifications; these are:
Higtnay Cl.a.utttcuton
Urban Interstate Major arterial Minor arterial Collector
Rural Interstate Major arterial Minor arterial Collector
8.0 1. 0 ). 5 l.4
4. 1 2 .8 1. 3 1. 4
Then using the equation
ER ( .f )- Accident Rate (A.l)
Where ER is encroachment rate in numbers of encroachment per mile per ADT,
li is reduction factor due to shoulder width and K is the ratio of total
collisions to reported accidents, the effective encroachment rate ER can be
determined for each bridge narrowness stratum. The following observations
are uiade:
• Encroachment rates decrease as the bridge width increases, with increase in numb~r of lanes and with increase in lana width
• A higher percentage of rural accidents is reported: thus the rural accident may be a more severe collision or ic may be that the less fre<Juent rural accidents are more often reported than in the congested urban areas ,
A.23
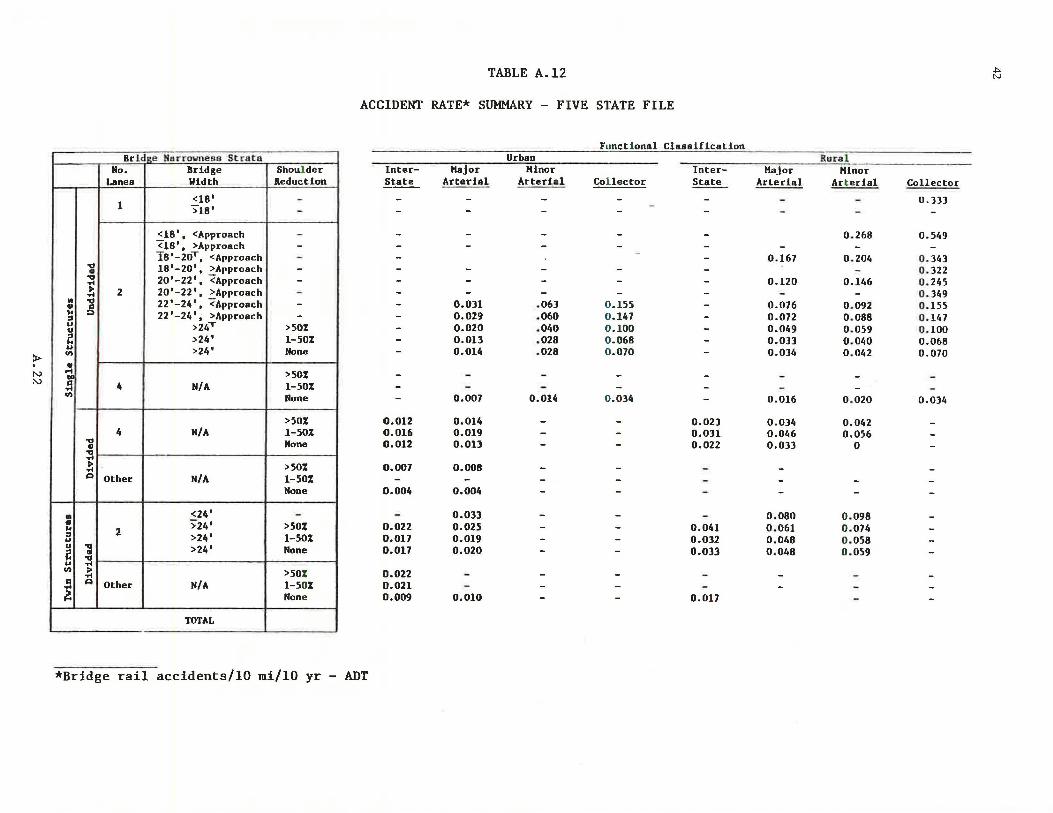
> N ~
TABLE A.12
ACCIDENT RATE* SUMMARY - FIVE STATE FILE
Funct i onal Classification Brid~e Harrowne9a Strata Urban
No. Bridge Shoul der Inter- Hajor Hinor Inter-Lanes Width Reduction State Arterial Arterial Col lector State
1 <18' ->18 1 -
<18', <Approach -<u•, >Approach -I8 1 -20T, <Approach -..., 18 1-20 1
, >Approach -• ..., 20'-22', "<Approach -....
~ 2 20'-22', >Approach -.. ..., 22'-24', <Approach -• s:I
~ p 22'-24'; >Approach -:I
0.031 .063 0 .155 -0.029 .060 0 .147 -.. >24T >50% u 0.020 . 040 0 .100 -
i! >24' 1-50% 0.013 .028 0 .068 -u >24' None "' 0.014 .028 0 .070 -• ! >50%
4 N/A 1-50% - -- -
"' None 0.007 0.014 0 .034 -
>50% 0.012 0.014 - - 0.021 4 N/A 1-50% 0.016 0.019 - - 0.031 ...,
None .. 0.012 0.013 - - 0.022 ..., .... ~ >50% 0.007 0.008 R Other N/A 1-50% - -
None 0.004 0.004
• <24' -• >24• >50% ~ 2 :I >24' 1-50% u
0.033 - - -0.022 0.025 - - 0.041 0.017 0.019 - - 0.032
u l >24' None i! ~ u
0.017 0.020 - - 0.033
"' ~ >50% 0.022 i:: .... R Other N/A 1-50% 0.021
" None D.009 0.010 - - 0.017
TOTAL
*Bridge rail accidents/IO mi/10 yr - ADT
""" N
Rural Hajor Hinor
Arterial Ar t erial Collector
O.J33 - -
0.268 0.549 - - -
0.167 0.204 0 .343 0. 322
0.120 0.146 0. 245 0. 349
0.076 0.092 0.155 0.072 0.088 0. 147 0.049 0.059 0. 100 0.033 0.040 0.068 0.034 0.042 0.070
- - -- - -
0.016 0.020 0.034
0.034 0.042 0.046 0.056 0.033 0
0.080 0. 098 0.061 0 .074 0.048 0 .058 0.048 0 .059
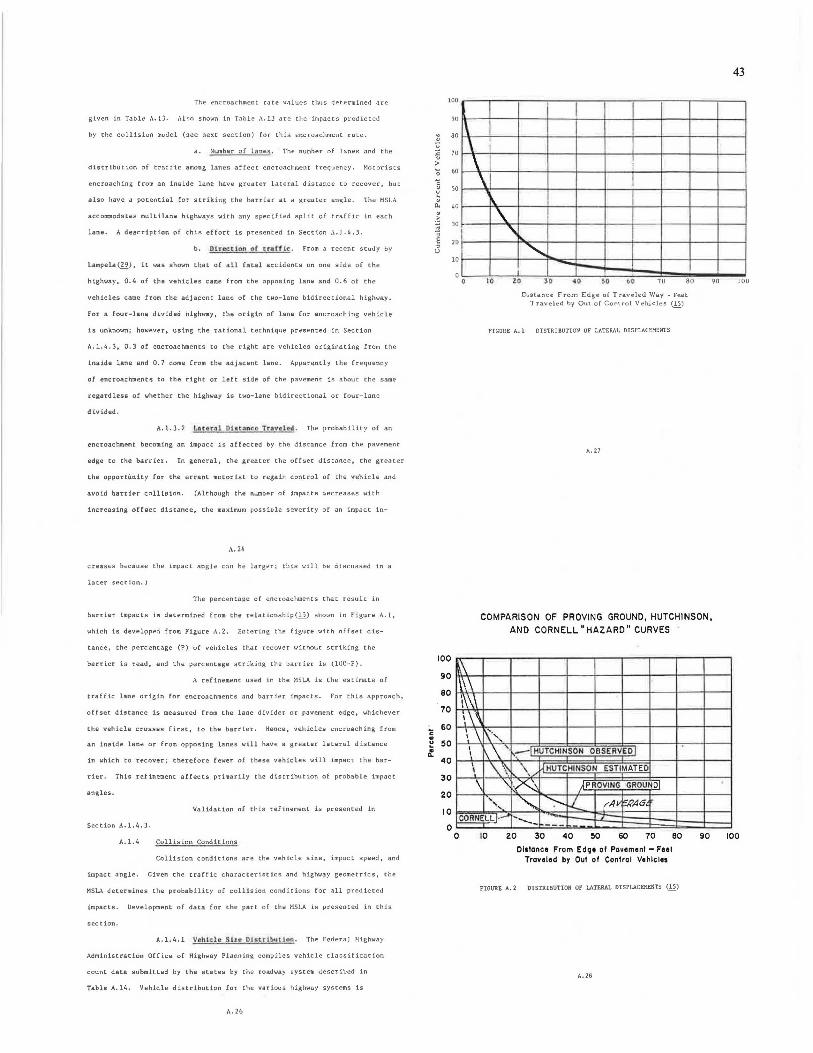
The encroachment r.:.ite values thus determined are
given in Tablt! ,\, l), Also shown Ln Table A..lJ are the impacts predicted
by the collision model (see next section) for this encroachment rnte.
Number of lanes. The number of lanes and the
distribution of traffic among lanes affect encroachment fr~quency. Motorists
encroaching from an inside lane have greater lateral distance to recover, but
also have a potential fo"r striking the barrier at a greater angle. The HSLA
accommodate.s multilane high1o1ays with any specified split of traffic in each
lane. A description of this effort is presented in Section A.1.4.J.
b. Dtrei:c:Son of crafflc. From a recent study by
Lampela(l2), it 1.1as shown that of all fatal accidents on one side of the
highway. 0.4 of the vehicles came from the opposing lane and 0.6 of the
vehicles came from the adjacent lane of the two-lane bidirectional highway.
For a fout'-lane divided highYay, the origin of lane for encroaching vehicle
is unknown; however, using the rational technique presented in Section
A.1.4.3, 0.3 qf encroachments to the right are vehicles originating from the
inside lane and 0. 7 come from the adjacent lane. Apparently the frequency
ol encroachments to the right or left side of the pavement is about the same
regardless of whether the highway is two-lane bidiC"ectional or four-lane
divided.
A.1.3.2 LD. t cr41 01..stnnce. Tuvelt:d. The probability of an
encroachnient becoming an impact is affected by the distance from the pavement
edge to the barrier. In general, the greater the offset distance, the greate'r
Che oppo't'tUnity for the errant motorist to 't'egain control of the vehicle and
avoid barrier collision. (Although the nwnber of impacts decreases with
increasing offset distance. the maximum possible severity of an impact in-
A.24
CI"eases because the impact angle can be larg~r; t!1is 1.·ill be discu~sed in a
later section.)
The percentage of encroachments that result in
barrier impacts is determined from t.he relationship(Q) shown in Figure A. l,
which is devel9ped from Figure A. 2. Entering the figure with offset dis-
tance, the percentage (P) of vehicles that recover without striking the
barrier is t'ead, and the percentage striking the barrier is (100-P).
A refinement used in the :1SLA is the estimate of
traffic lane origin for enct'oachments and barrier impacts. For this app"roach,
offset distance is measured from. the lane divider or pavement edge, whichever
the vehicle crosses first, to the barrier. Hence, vehicles encroaching fro111. c .. an inside lan~ or from opposing lanes will have a greater lateral distance ~
~ in which to rt!COVet'j therefore fewer of these vehicles will impact the bar-
rier. This refinement affects primarily the distribution of probable impact
angles.
Validation of this refinement is presented in
Section A.l.4.3.
A.1.4 Collision Conditions
Collision conditions are the vehicle size, impoct speed, and
impact angle. Given the traffic charactet'istics and highw~y geometrics, the
MSU detentines the probability of collision conditions for all predicted
impacts. Development of data for che part or the MSLA is presented in this
sect ion.
A.1.4.1 VaMch. She Dhtr!~tloo. The Federal Highway
Administration Office of Highway Plaf\ning compiles vehicle classification
count data submitted by the states by the roadway system described in
Table A.14. Vehicle distribution for the various highway systems is
A. 26
100
90 . . 80
u
~ 70
> 0 60
~
~ 50 . a. 40 . ~ "1
JO
e 20 0 u
10
0
\ \ \ I
\
0
" \.
I Q
' ... zo
............ ~
10 •0 70 80
Distance From Edge o( Traveled Way - Feet Traveled by Out of Control Vehicles (!_2)
90
FIGURE A. 1 DISTRIBUTlON OF LATERAL DISPLACEMENTS
A.27
COMPARISON OF PROVING GROUND, HUTCHINSON,
AND CORNELL" HAZARD" CURVES .
100
~\ 90
80 \\\ 70
60
50
40
30
20
10
0 0
\\\\ \ \' •\ \·,., I r-. \ ' ~-I HUTCHINSON OOSERVEOI I
I
\.~ \,; ~ HUTCHINSON ESTIM AT EO '. \ "lN A PROVING GROUND I
' ' ,,,_ ........... ;-.... ..L ( Av i:k'M .f CORNELLl__. -----
10 20 --- -
30 40 50 60 70
Dl1tance From Edge ol Povement - Feel Traveled by Out ol Control Vehicles
BO
FIGURE A. 2 DISTR.IBUTION OF LATERAL DISPLACEMENTS (~)
A.28
90
43
100
100
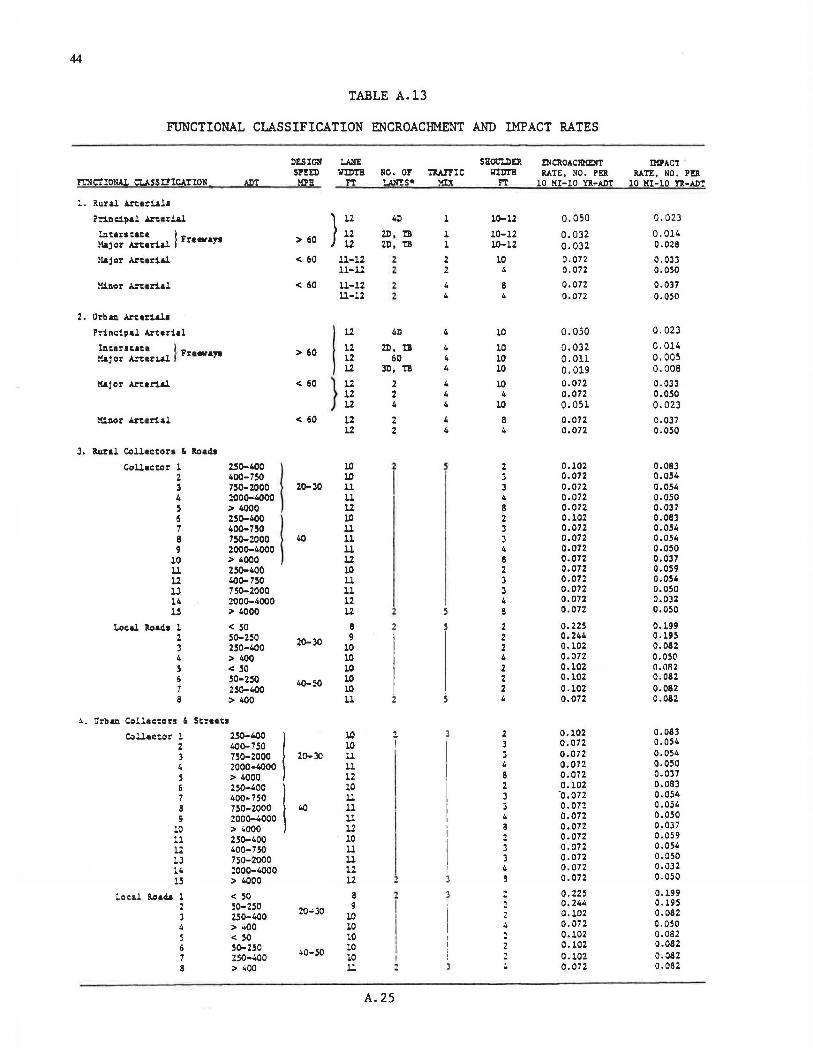
44
TABLE A.13
FUNCTIONAL CLASSIFICATION ENCROACHMENT AND IMPACT RATES
DESIGN u.-a: Sllot'".Jl!1 ENCllOACllMENT IMPACT SPEED \rIDTB No. or Tlt.A1'FIC WIDT!I RATE, llO. PER RATE, NO. PER
'F'.:NCT!ONAL CL\SSI!'ICATION APT HP'!! n :...W.:S* me !"!: 10 MI-10 YR-ADT 10 KI-10 Tit-AD'!'
-· R11n.l Arcer:!.&l•
?:-inc1pal Arterial } 12
40 l 10-12 0.050 0.023
!:1c1r1cate l > 60 12 2D . Tll l 10-12 0.032 0.014
Major Art•rial Fra11tays l2 20 . Tll l 10-12 0.032 Q.028
~laj or Arurial < 60 11-12 2 2 10 0.072 0.033 11-12 2 2 4 0.072 0.050
liinor Art1rial < 60 ll-l2 2 4 8 0.072 0.037 ll-12 2 4 4 0.072 0.050
2. Orbazi Arteriw
rTincip•l l\z'Clrial l2 1.0 4 10 0.050 0.023
!nc1::1tate I r > 60 12 ZD, Tll 4 10 0.032 0.014 Major ~•rial · ::e..,ays 12 60 4 10 0.011 0.005
l2 30, Tll 4 10 0.019 0.008 Major Arterial < 60 } l2 2 4 10 0.072 0.033
12 2 4 4 0.072 0.050 l2 4 4 10 0.051 0.023
Minor Arterial < 60 12 2 4 8 0.072 0.037 l2 2 4 4 0.072 0.050
3. R11r1l Collector• ' Ro&d9
Coll1ctor l 250-400 lO 2 2 0.102 0.083 2 400-750 lO
I 3 0.072 0.054
3 750-2000 20-30 ll 3 0.072 0.054 4 2000-4000 ll 4 0.072 0.050 5 > 4000 l2 8 0.072 0.037 6 250-400 lO 2 0.102 0.083 7 400-750 ll 3 0.012 0.054 8 750-2000 40 ll 3 0.072 0.054 9 2000-4000 ll 4 0.012 o.oso
10 > 4000 l2 8 0.072 0.037 ll 250-400 10 2 0.072 0.059 l2 400-750 u 3 0.072 0.054 13 750-2000 ll 3 0.072 0.050 14 2000-4000 12 4 0.072 0.0·32
l.5 > 4000 u 5 8 0.072 0.050
Local Roa.di l < 50 8 2 5 2 0.225 0.199 2 50-250 20-30 9 I 2 0.244 0.195 3 250-400 10 2 0.102 0.082 4 > 400 10 4 0.072 0.050 s < 50 10 2 0.102 O.OR2 6 50-250 40-50 10 2 0.102 0.082 7 2S0-400 10 2 0.102 0.082 a > 400 ll 2 .5 4 0.072 0.082
!.. Orban Coll•ctors & St::11t1
~llac:or l 250-400 lO , 2 0.102 0.083
2 400-750 lO i 3 0.072 0.054
3 750-2000 20-30 ll 3 0.072 0.054
4 2000-4000 u 4 0.072 0.050
5 > 4000 12 8 0.072 0.037
5 250-400
I lO 2 0.102 0.083
7 400-750 u 3 ·0.012 0.054
8 750-2000 40 ll 3 O.Oi2 0.054
9 2000-4000 u 4 0.072 0.050
!O > 4000 l2 a 0.072 0.037
ll 250-400 10 0.072 0.059
l2 400-750 ll 3 0.072 0.054
l~ 750-2000 u 3 0.072 o.oso 14 2000-4000 l2 4 0.072 0.032
15 > 4000 12 3 0.072 0.050
Local RD a ca l < 50 a 2 3 0.225 0.199
2 50-250 9 I o.244 0.195
3 2.50-400 20•30
lO
I 0.102 0.082
4 > 400 10 4 0.072 0.050
s < 50 10 0.102 0.082
6 50-250 10 0.102 0.082
7 zso-.:.oo 40-50
10 I 0.102 0.082 8 > 400 1.:. 2 4 0.072 0.082
A.25
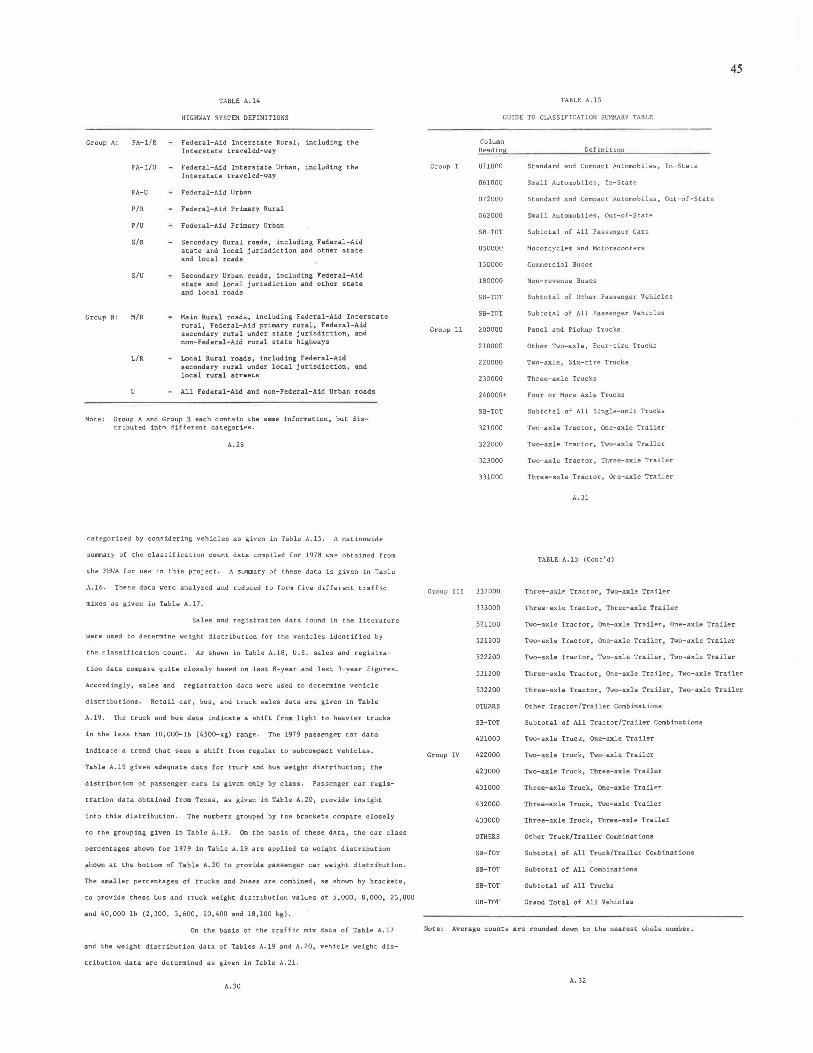
Group A: FA-1/R
FA-1/U
FA-U
P/R
P/U
S/R
S/U
Group B: M/R
L/R
TABLE A.14
HIGHWAY SYSTEM DEFINITIONS
- federal-Aid Interstate Rut"al, including the Interstate traveled-way
- Federal-Aid Interstate Urban, including the Interstate traveled-way
- Federal-Aid Urban
- Federal-Aid Primary Rural
- Federal-Aid Primary Urban
- Secondary Rural roads, including Federal-Aid state and local jurisdiction and other state and local roads
- Secondary Urban roads, including Federa l-Ai d state and local jurisdiction and other s t ate and local roads
- Main Rural roads, including Federal-Aid Interstate rural, Federal-Aid primary rut'al, Federal-Aid secondary rural under state jurisdiction, and non-Federal-Aid rural state highways
- Loca l Rura l roa ds, inc l ud i n g Federa l - Aid seconda r y rura l under l ocal jur isdic t ion, and local rura l s tree ts
... All Feder a l-Aid and non-Federal-Ai d Ur ban roads
Note: Group A and Group B each contain the same information, but distributed into different categories.
A. 29
categorized by considering vehicles as given in Table .\.15. A nationwide
summary of the classification count data corn.piled for 1978 was obtained from
the FHWA for use in this project. A summary of these data is given in table
A.16. These data were analyzed and reduced to form five different t~affic
mixes as given in Table A.17.
Sales and registration data found in the literature
were used to determine weight distribution for the vehicles identified by
the classification count. As shown in Table A.18, U.S. sales and registra-
tion data compare quite closely based on last B-year and last 3-year figures.
Accordingly, sales and registration data were used to determine vehicle
distributions. Retail car, bus, and truck sales data are given in Table
A.19. The truck and bus data indicate a shift from light to heavier trucks
in the less than 10,000-lb (4500-kg) range. The 1979 passenger car data
indicate a trend that sees a shift from regular to subcompact vehicles.
Table A.19 gives adequate data for truck and bus weight distribution; the
distribution of passenger ca.rs is given only by class. Passenger car regis-
tr at ion data obtained from Texas, as given in Table A. 20, provide insight
into this distribution. The numbers grouped by the brackets compare closely
to the grouping given in Table A.19. On the basis of these data, the car class
percentages sho"7TI for 1979 in Table A.19 are applied to weight distri?ution
shown at the bottom of Table A. 20 to provide passenger car weight distribution.
The smaller percentages of trucks and buses are combined, as shown by brackets,
to provide these bus and truck weight distribution values of 5,000, B,000, 23,000
and 40,000 lb (2,300, 3,600, 10,400 and 18,100 kg).
On the basis of the traffic mix data of Table A.17
and the weight distribution data of Tables A.19 and A. 20, vehicle weight dis-
tribution data are determined as given in Table .\. 21.
A.30
45
TABLE A. 15
GUIDE TO CLASSIFICATION St..~tMARV TABLE
Croup I
Group II
Column Heading
071000
061000
072000
062000
SB-TOT
030000
150000
180000
SB-TOT
SB-TOT
200000
210000
220000
230000
240000+
SB-TOT
321000
322000
323000
331000
Group 111 332000
333000
521100
521200
522200
531200
532200
OTHERS
SB-TOT
421000
Group IV 422000
423000
431000
432000
433000
OTHERS
SB-TOT
SB-TOT
SB-TOT
GR-TOT
Definition
Standard and Compact Automobiles, In-State
Small Automobiles, In-State
Standard and Compact Automobiles, Out-of-State
Small Automobiles, Out-of-State
Subtotal of All Passenger Cars
Motorcycles and Motorscooters
Commercial Buses
Non-revenue Buses
Subtotal of Other Passenger Vehicles
Subtotal of All Passenger Vehicles
Panel and Pickup Trucks
Other Tua-axle, Four-tire Trucks
Two-axle, Six-tire Trucks
Three-axle Trucks
Four or More Axle Trucks
Subtotal of All Single-unit Trucks
Two-axle Tractor, One-axle Trailer
Two-axle Tractor, Two-axle Trailer
Two-axle Tractor, three-axle Trailer
Three-axle Tractor, One-axle Trailer
A. 31
TABLE A.15 (Cont'd)
Three-axle Tractor, Two-axle Trailer
Three-axle Tractor, Three-axle Trailer
Two-axle Tractor, One-axle Trailer, One-axle Trailer
Two-axle Tractor, One-axle Trailer, Two-axle Trailer
Two-axle Tractor, Two-axle Trailer, Two-axle Trailer
Three-axle Tractor, One-axle Trailer, Two-axle Trailer
Three-axle Tt"actor, Two-axle Trailer, Two-axle Trailer
Other Tractor/Trailer Combinations
Subtotal of All Tractor/Trailer Combinations
Two-axle Truck, One-axle Trailer
Two-axle Truck, Two-axle Trailer
Two-axle Tcuck, Three-axle Trailer
Three-axle Truck, One-axle Trailer
Three-axle Truck, Two-axle Trailer
Three-axle Truck, Three-axle Trailer
Other Truck/Trailer Combinations
Subtotal of All Truck/Trailer Combinations
Subtotal of All Combinations
Subtotal of All Trucks
Grand Total of All Vehicles
Nata: Average counts are rounded down to the nearest whole number.
A.32
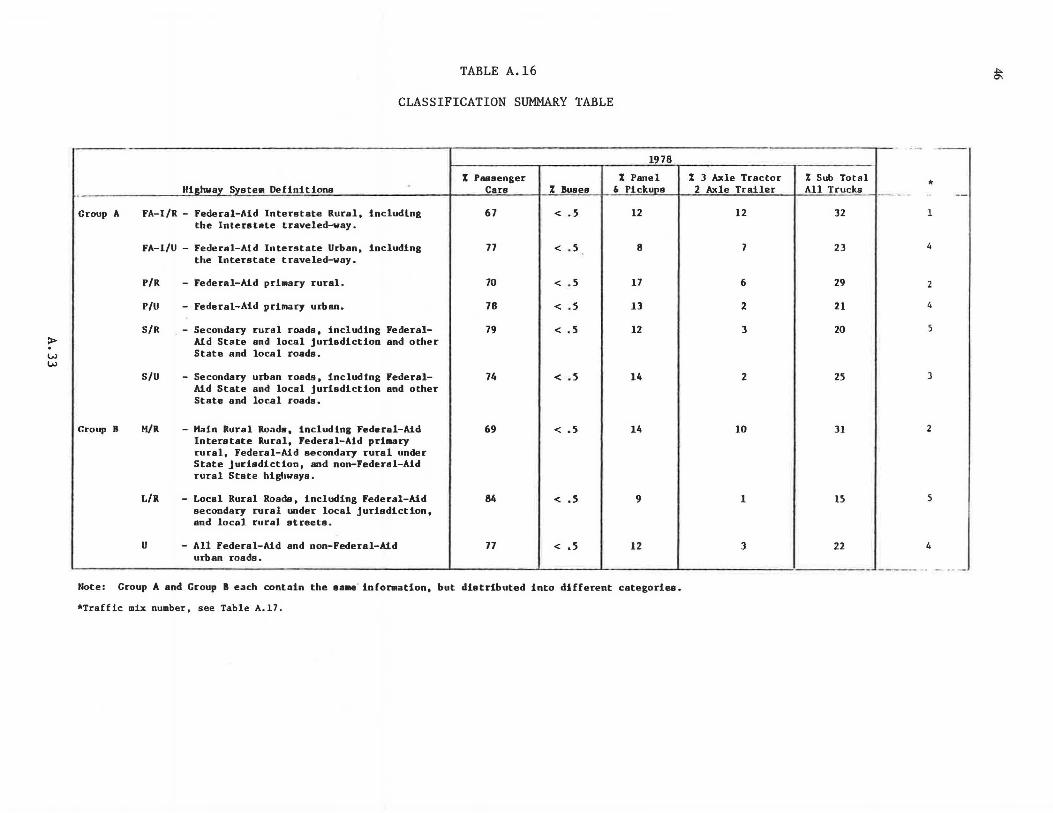
)>-. w w
TABLE A.16
CLASSIFICATION SUMMARY TABLE
1978
% Passenger % Panel Hi2hwav Svste• Definitions Cars % Buses & Pickups
Group A FA-1/R - Federal-Aid Interstate Rural, including 67 < .5 12 the Interstate traveled-way.
FA-1/U - Federal-Aid Interstate Urban, including 77 < .5 8 the Interstate traveled-way.
P/R - Federal-Aid primary rural. 70 < .5 17
P/U - Federal-Aid primary urban. 78 < .5 13
S/R - Secondary rural roads, including Federal- 79 < .5 12 Aid State end local jurisdiction and other State and local roads.
S/U - Secondary urban roads, includtng Federal- 74 < .5 14 Aid State and local jurisdiction end other State and local roads.
Group B H/R - Hain Rural Roads, including Federal-Aid 69 < .5 14 Interstate Rural, Federal-Aid primary rural, Federal-Aid secondary rural under State jurisdiction, and non-Federal-Aid rural State highways.
L/R - Local Rural Roads, including Federal-Aid 84 < .5 9 secondary rural under local jurisdiction, and local rural streets.
u - All Federal-Aid and non-Federal-Aid 77 < .5 12 urban roads.
Note: Croup A and Croup B each contain the same information, but distributed into different categories.
*Traffic mix number, see Table A.17.
~
% 3 Axle Tractor % Sub Total "' 2 Axle Trailer All Trucks
12 32 1
7 23 4
6 29 2
2 21 4
J 20 5
2 25 J
10 JI 2
1 15 5
3 22 4
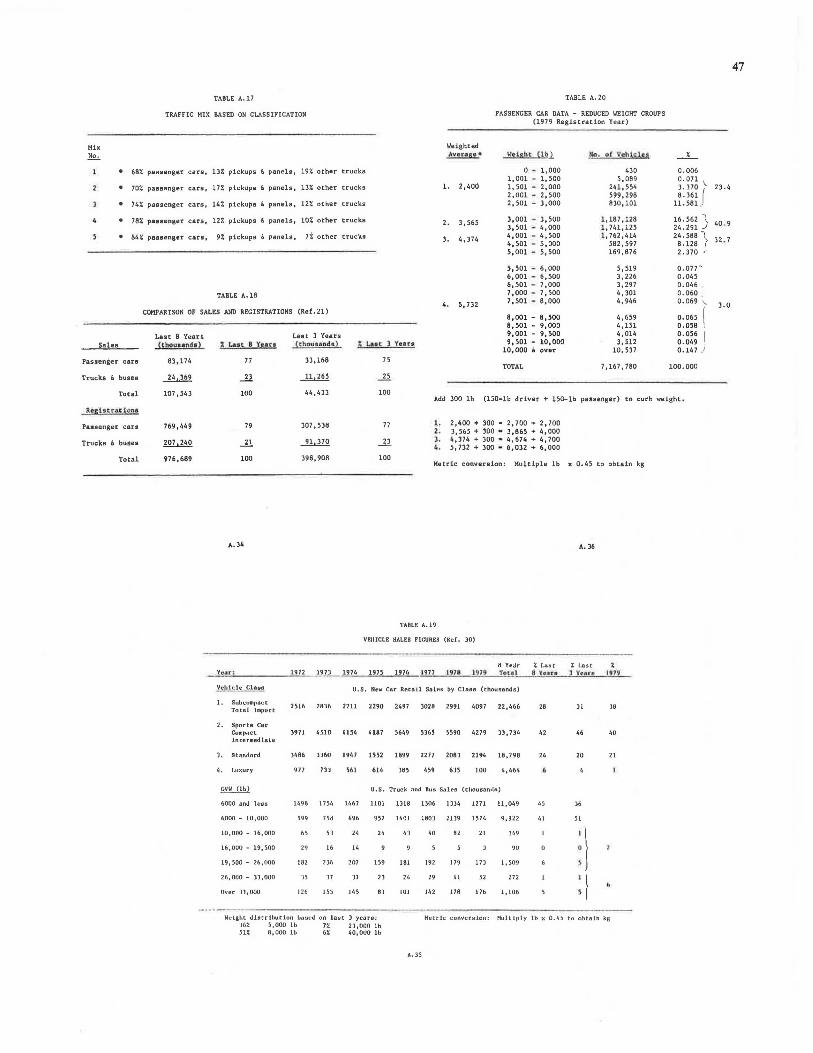
tABLE A.17
TRAFFIC HIX BASED ON CLASSIFICATION
Mix
1!2.:.. . 68% passenger cara, 131. pickups & panels, 19% other . 70% passenger cars, 17% pickups & panels, 13% other
• 74% passenger can, 14% picku'1& & panels, 12% other . 78% paasenger cars, 12% pickups & panels, 10% other
• 84% passenger cars 1 9% pickups & panels, 7% other
TABLE A.18
COMPARISON OF SALES AND REGISTRATIONS (Ref. 21)
Last 8 Years Last 3 Years Salas 1thou.und•~ t La•C 8 Yun ~thouundt)
PauenKer can 83,174 77 33,168
Trucks & busea 24. 369 -11. ll,265
Total 107 '543 100 44,433
Regt~tracton1
Passenger cars 769,449 79 307 '538
Trucks & busea 207 ,240 _ll 91,370
Total 976,689 100 398,908
Year: 1972 1971
Vehicle Cla1111
I. Subcompact 2Sl6 28]6
Total lmport
2. Sports Car Cum1U1ct 3971 010 lntermediale
J. Stand11rd )486 JJ60
4. Luxury 977 ])J
GVW (lb)
6000 and less 1498 1154
6000 - 10. 000 599 758
10,000 - 16,000 65 53
16,000 - 19,500 "' 16
19,500 - 2b,CIOO 182 2)6
26,0UO - J],000 J 5 l7
Over Jl,000 126 155
trucks
trucks
trucks
trucks
truck•
L••c: l Years
75
...n 100
Weighted AVfU'.OBCI.
1. 2,400
2. J,565
). 4,374
4. S, 732
TABLE A. 20
PASSE~GER CAR DATA - REDUCED WEIGHT GROUPS (1979 Registration Year)
\leisht Clbl
0 - 1,000 1,001 - 1,500 1, 501 - 2,000 2,001 - 2,500 2,501 - J,000
J,001 - J,500 3,501 - 4,000 4,001 - 4,500 4,501 - 5,000 5,001 - 5,500
5,501 - 6,000 6,001 - 6,500 6,501 - 7,000 7,000 - 7,500 7,501 - 8,000
8,001 - 8,500 8,501 - 9,000 9,001 - 9,500 9,501 - 10,000
10, 000 & over
TOTAL
No. of VehtcJu,
430 5,089
241, 554 599, 298 830, 101
1, 187' 128 1,741,125 l, 762,414
582,597 169. 876
5,519 3,226 3,297 4,JOl 4,946
4, 659 4,151 4,014 3,512
10, 537
7,167,780
_%_
0.006
~: ~;~ \ 8. 361 {
11. 581 .
16. 562 i, 24.291 .)
2::~~: ~ 2. 370 .
0.077' 0.045 0.046 0.060 o.069 ,
0.065 \ 0.058 0.056 I 0 . 049 ' 0.147 /
100.000
Add 300 lb (150-lb driver + 150-lb passengn) to cut'b weight.
77
-11.
100
1. 2,400 + 300. 2,700 ~ 2,700 2. 3,565 +JOO• 3,865 + 4,000 ). 4,374 + 300. 4,674. 4,700 4. 5, 732 + 300 - 6,032 • 6,000
Metric conversion: Multiple lb x 0.45 to obtain kg
TAbLE A.19
VEllICLE SALES FlGURES (Ref. JO)
8 Vear % Laet % I.eat z 1974 1975 1976 197) 1911 1919 foul 8 v .. r, l Yeal"1t 1919
U.S . New Car RetaH Sahli by Claes (thousands)
2211 2290 2497 ]028 2991 4097 22,466 26 Jl 36
415• "187 5649 536! 5590 4279 ]J,734 42 46 40
1947 1552 1899 2217 208) 2194 18,798 24 20 21
561 614 385 459 635 100 4,464
U.S. Truck and Bus Sales (thousands)
1467 1101 1318 1J06 llJ4 1271 11,049 " 36
696 952 1401 180) 2119 1574 9,922 " 51
24 24 43 40 82 21 349
:\ 14 90
207 159 181 192 119 173 1,509
JI 2J 24 29 41 52 272 : l 1'5 BJ IOI H2 178 176 l, 106
Weight distribution Li.~cd on last J years: Me t ri c conversion: Hultlpl y lb x 0.45 to obtalh kg 36~ 5,000 lb 7% 23,000 lb 51% 8,000 lb 6% 40,0UO lb
A.35
47
23.4
40 . 9
32. 7
3.0
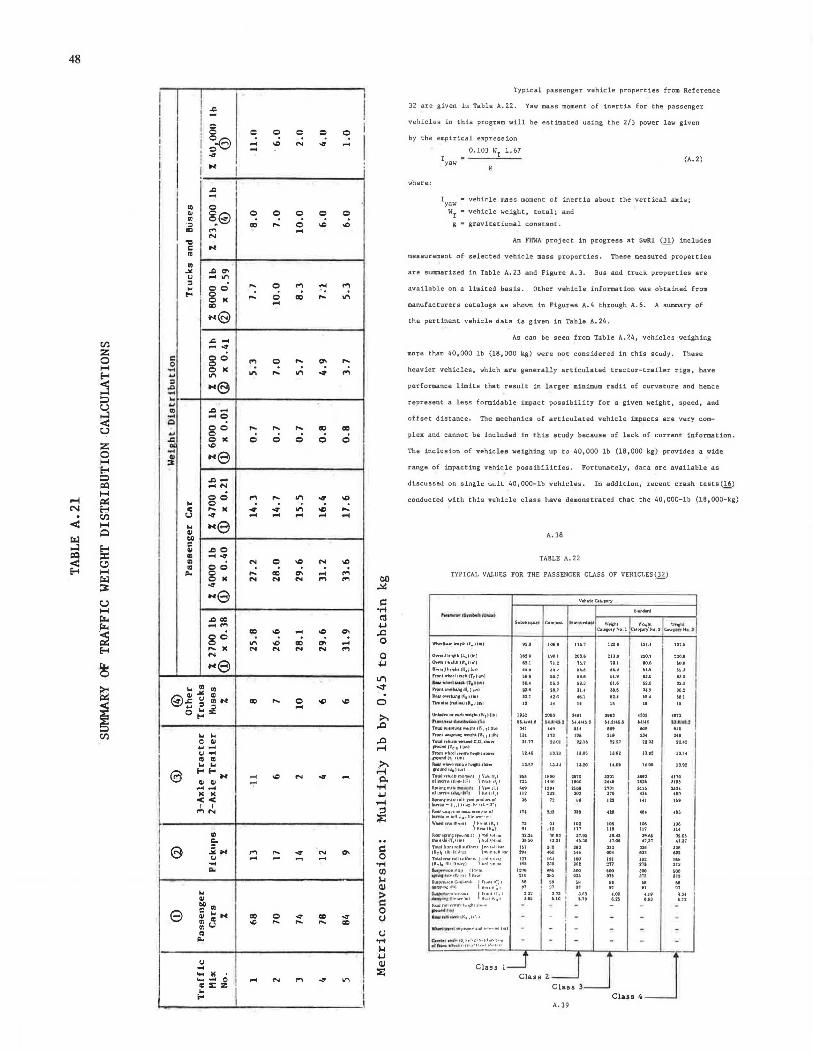
48
..c -
I
... I : '
..c .... ID 0 .,
~9 ~ Q 0 0 0
"' ~ ~ ·= .., ,.. 0
"' .., .... ..... ... c ... .. .,
.>/. ..c "' " .... "' = .... 0 .., ... .., ... 00 ~ 0 ,.. ci a:i ,.. .,.;
0 IC ... 00
... 9
C/'l z 0 H E-< :s
..c ... -.,, c:: 00 .., 0 ,..
"' ,..
0 0 ... 0 IC "'
,.. .,.; ~ ..; ... II"\
= ... (8 ..c ... ::i u ...:l < u :z: 0 H
.. ... ID ..c .... .... ....o Q
00 ,.. .... ,.. ~ CIO ... 0 ci ci ci c c:i 'S 0 IC
"" .... ... 9 ., ~
E-< ::i ~
..c .... ....... 1-l
.-I i:i::: N H . C/'l
00 .., ,.. "' ~ "" ... 0 .,; .,.; ~ ~ c ,.. IC "" I.I ~ ... .... .... .... ...
< H
~ ~
...:l E-< IXI ::i:: < (.!) E-< H
~ ~
u H
.. ... e ., t.D c " ..c 0 .. .... "" ID N 0 "" N "" "' 00
~ a:i a. ,..; ... 0 ... 0 IC N N N ..,
"" "" ... 9 00 ~
i:: ·r-1
rz.. ..c 00 ~ rz.. ~ E-<
.... .., 00 "" .... "" "' 00
~ ..; a. 0 II"\ .... ,.. IC N N N ... .., ... ,i,J
..c 0
0
~ ... e ,µ
Ll"I
~
~ .. "'., ., .>/."' @.cg., ... 00 ,.. 0 "" "" 0 t:: ~ ....
...,. 0
>. ..c
C/'l .. .. e ., ..c .......
I " ..... .. .. .. ..
e """" ... .... "" ... "" .... "
., .... ........
.-I
.>. i'-l p,,
"'"' IC IC << I I
MN
,i,J
.-I :l ~ ..
=-e .ii ... ,.., ,.. "" N "' <J '. .... - - .... i::
0 .... ·r-1 ... (fJ
'"" (IJ .. " e ~"' 0/ w H 00 Q .,, .00 "" ~~ ~ .... .... .... 00
:> i:: 0 t)
.. t)
"" "'"' '"" ,i,J
" ... ... IC 0 ....... .... N "" .,,
"'
(IJ
~ c ::c z ... ""
Typical passenger vehicle properties from Reference
32 are given in Table A. 22. Yaw mass moment of inertia for the passenger
vehicles in this program will be estimated using the 2/3 power law given
by the empirical expression
where:
I yaw
0.103 WT 1. 67 (A.2)
I • vehicle mass moment of inertia about the vertical axis; yaw
WT ... vehicle weight, total; and
g • gravitational constant.
An FHWA project in progress at SwRI (l!_) includes
measurement of selected vehicle mass properties. These measured properties
are summarized in Table A. 23 and Figure A. 3. Bus and truck properties are
available on a limited basis. Other vehicle information was obtained from
manufactut'ers catalogs as shown in Figures A. 4 through A. 6. A summary of
the pertinent vehicle data is given in Table A. 24.
As can be seen from Table A. 24, vehicles weighing
mOt'O than 40,000 lb (18,000 kg) were not considered in this study, These
heavier vehicles, which are generally articulated tractor-trailer rigs, have
performance limits that result in larger minimum radii of curvature and hence
represent a less formidable impact possibility for a given veight, speed, and
offset distance. The mechanics of articulated vehicle impacts are very com-
plex and cannot be included in this study because of lack of current information •
The inclusion of vehicles weighing up to 40,000 lb (18,000 kg) provides a wide
range of impacting vehicle possibilities . Fortunately, data are available as
JiscusseJ on slngl~ uull 40,000-lb vehklu. In additlon, r~cent crash tests(!_~)
conducted with this vehicle class have demonstrated that the 40,000-lb (18,000-kg)
A. 38
TABLE A. 22
TYPICAL VALUES FOR THE PASSENGER CLASS OF VEHICLES(!~)
Vth..VC.i.cl(lry
, __ ll'li~h l \M!u)
S.b<o• ian C9m[10U '"' ""' .. ..i • ., Wt~hl w~"h1 lftic lol CaueoryNo 1 Ctl<'ldry"No 2 C...M:,_, N. I
Mwel!ourlRl,0.(f.l(ln) ! 0..nUlitno'lh!L01(1n) :2G.B °'"111hllh1w.11in1 1'.1 r.o.o o .... !11 ••• ,1 .. 111.10111 U.1 a4.I u.~ ~UI ~~.o
hon1•hHI1ru• 4Tr1t111l SG.1 SU 61.1 63.0 - 1 11*lol- f t 1 11MI 6\.6 u.o 82.0 PrallloHTILM141rl11r11 , ... au 1.oaro ... 1twi1111 11m1 H .'i 1\n llY (nid1 .. oj 1111.1 (m'll
Uni.cs.hotcwb•l'iclul""1 ltlbl ""'' '"' f't••'-"'"' ........ \IMI~ a.t.J•4U $'-414~ -· S6.2/U6 SHH TOU1""'"'""«••1,i.11"·, ,11lbt ... ... ... "" fioftl.._Jl-i:••ochlf\\ 11 111hJ m ... TDW •,.hw:ll "'UC.ICC.-. .. ,..,, f"Mlllllll7't".:ll"'I rra,,,1.-1<i ... 1....,. ... iw.,h1 obott l"1....!.(11 1hn1 lat •ht>.• l..,nl.I ~ hctchl Ibo"' 110UN1111 )11111 Toul -th1<k- mom•nl l ~:;1.r~i.1 • ... u;o S201 '"' 4116 ol1Mn11 !lluf,•IL:I llJ "" HO H2S ~1115
Spun£rNl•-l I~~~ 11i:: ... uu "" 2101 31H> "" Ofll'MTU•(-• j1 l 1 ... li2 "" "' ... .., 19'\111fmtUr<>ll-)"••1>1<><.lwci.ot " lftn111- 11,,l (o;..,~- r1:11~ • 3°1
11.-""'l"''"~""'u111anvn1t1/ IMnilr In l<>!I 11 11 1 m .... -..~-1t1I
11110MlntoUh1!nl l ~·r<•nl 1K1 I " " "' "' "' 106
"~'"·' " "' 111 111 111 "' llol11p.,;1pac1r1~.i lm'"""" U.2~ ~nu 31 .9~ '9.42 39.111 39.65 _llwtdi "IT,1rw11 :.-,r •ro··~ H.r.o U .01 0 .30 H.04 41.37 41.37
T:~~ 1;;"u~'1:~\~\.r'""' f :~.~·~:.~"1~ .., 2·10 "' ll~ "' "' ... "' "' "" .. . '" r~~ ~ 7'1~·.~~'"" .. I ~-~ ::::~ ·~1 11'·1 "' IOI "' ... "' 2~ .. I "'
,,, .,. "' ~01a1olt~nn1 l:!llCI . .. '" ... "' lll'ritir r.i~ Ob on1 l ;c..,, ;.!IU
I "' m JU m
....... ,.c.. .. i.....i. ) ~~=.:~; .. .. " .. .. .. .. "--1"".0: lll•J " ' " " " " " ................ , • ., ..... w,1 ~Ji J.~l J .fi9 .... UI tJt -~ .................. 1t.-.. ••l·• l .li$ uo
I • • 111 ... , ...,
R<..M ,011~.-...,. 1 .. 1;'.111 ,,.,.,. -.._..,. .. , .__,,,. .,,,., ... , .. ·., -
-~· ...,..~ ........ c1 ...... 1 ••• 1 i -
Cr-.J~IO.l "!'~'"'I""'= •"' .fri.. • M ' •"•flk•llr•\rlo.\11•<1 I -
zd_J Class I Class
Class 4 -A. 39
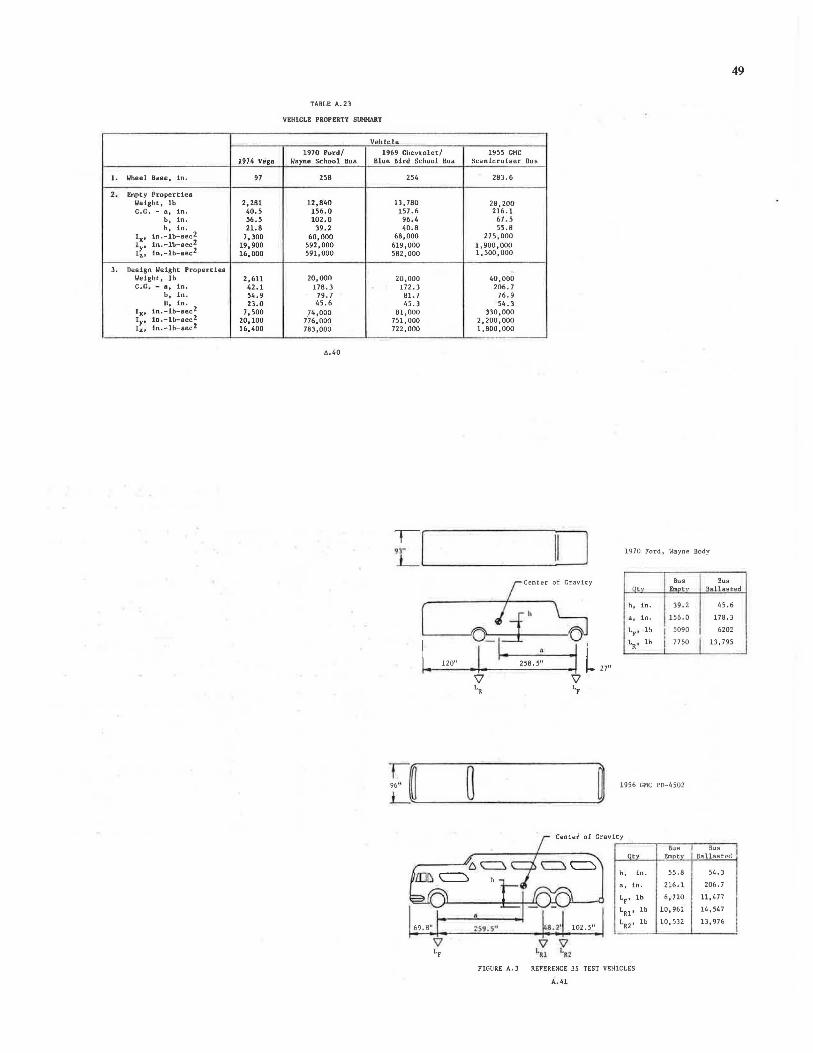
49
'!'ABLE A.23
VEHICLE PROPERTY SUMMARY
Vehicle
1970 Ford/ 1969 Chevrolet/ 1955 GMC 1974 vega Wayne School Bue Blue Bird School Du• Scenicruiser Dus
]. Wheel Base, in . 97 258 254 28). 6
2. l!mpty f1ropertiea Weight, lb 2, 281 12,840 lJ, 780 28, 200 C.G. - .. in . 40.5 156.0 157 . 6 216 . l
b, in. 56.5 102.0 96.4 67. 5 h, In. 21.8 )9. 2 40.8 55.8
r •• in.-lb-sec2 7 ,300 60, 000 68,000 275,000
ly• in,-lb-sec2 19, 900 592,000 619,000 1,900,000 1,, in,-lb-eec2 16, 000 591,000 582,000 1,500,000
3. Design Weight Properties Weight, lb 2,611 20,000 20,000 40,000 C. G . - .. in . 42.1 178 . 3 172 . 3 206 . 7
b, in. 54.9 79. 7 Bl. 7 76. 9 H, In. 23.0 45. 6 45. 3 54.3 ... in.-lb-sec2 7 ,500 74 ,ooo 81,000 330,000
Iyo in.-lb-sec2 20, 100 776,000 751,000 2,200,000 lz, in.-lb-sec 2 16,400 783,000 722,000 1,800,000
A.40
,. 9L.___I _ ____.II 1970 Ford, Wayne Body
[ ...__ ___,o_ (_f ... ;Ly I .. 120" w I . 258. 5" : I
Bus Bus Dtv ·~" 'V Ballas 'ed
h, in . 39 . 2 45 . 6
a, in . 156 . 0 178 . 3
LF, l~
I 5090 6202
LR , lb 7750 I 13' 795
27"
1956 GMC P0-4502
Center of Grav ity
Bus Bus Qty E»otv B1t UastcC:
h, In. 55.8 54 . J
a, in. 216 . l 206. 7
LF' lb 6, 720 ll,477
LRl' lb 10, 961 14. 547
LR 2 ' lb 10, 53 2 13,976
FIGURE A. 3 REFERENCE 35 TEST VEHI CLES
A.41
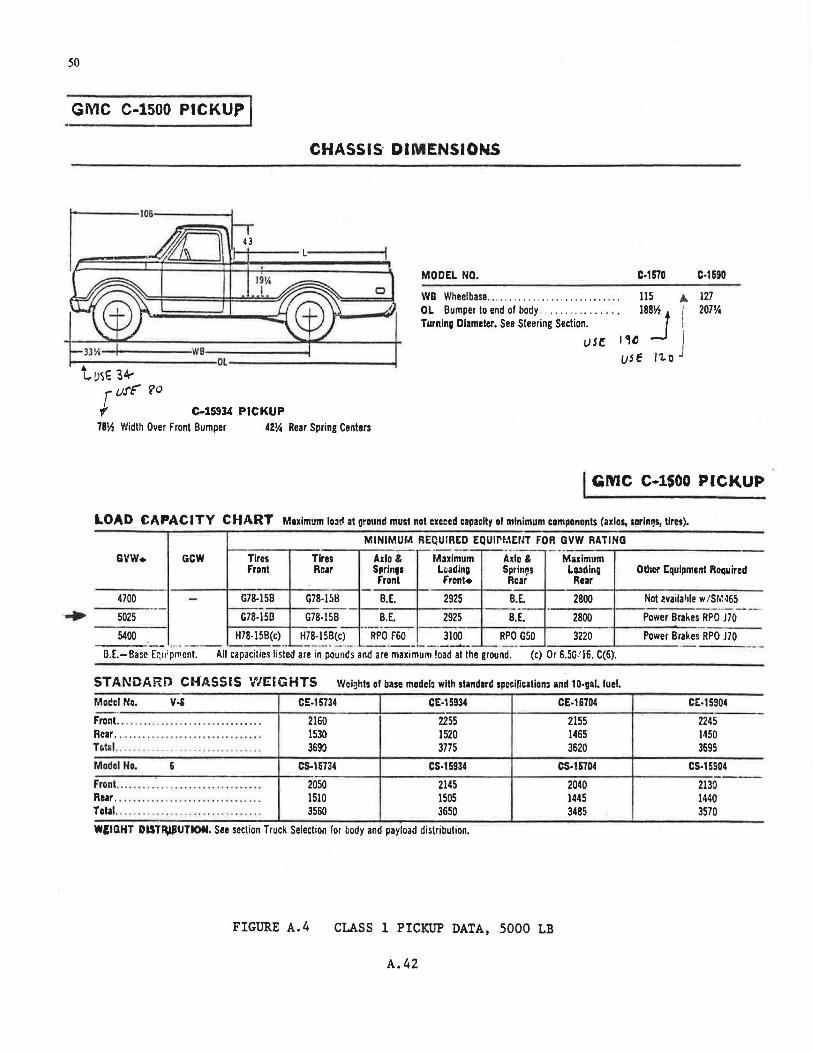
50
• GMC C-1500 PICKUP I CHASSIS· DIMENSIONS
MODEL NO. c.mo C-1690 0 \YB Wheelbase... ..... . . . . . . . . .. . . .. . . . . . . 115 A. 127
OL Bumper to end or body . . . . . . . . . . . . . . . . 188JVz I Turning Diameter. See Steering Section. \
tJSf t '1() J USE l'Lo
207%
C-15934 PICKUP 78Vz Width Over Front Bumper 42!4 Rear Spring Centers
I GMC C-1500 PICKUP
LOAD CAPAC I TY CHART Maximum lo3t1 at Q~aund must not exceed capacit~ of minimum componorats (axlos, sarin~s, Urn).
MINIMUM REQUIRED EQUIN.mlT FOR GVW RATING ·--·-·- r--- ---- .. - --·
G\'W+ GCW Tires Tires Aile & M~xlmum Axle & Maximum Front Rear Springs Lg a ding Sprincs Loading Other Equipment Required
Front front• Rear Rear -4700 - G78-15B G78-15B B.E. 2925 B.E. 2800 Not lVaila~le w /SM·l65
·- ,______ ·-----· ·---- · .... 5025 G78-15D G78-15B B.E. 2925 B.E. 2800 Power Bra~es RPO J70 ·- ·----
5400 H78-15B(c) H78-15B(c) RPO F60 3100 RPO G50 3220 Power Brakes RPO J70 - - --- ~---··-----· · - ··-·--·--·- -· _ __._ ___ - - ·-
B.E.-Basl.' Eq11:pment. All capacitie~ listed are in pounds and are maximum !Qad at the ground. (c) Or 6.50!16, C(6)~
STANDARD CHASSIS WE&GHTS Wcl~hts of base modcb with standard spocilicatians and 10-gaL fuel.
Mot!cl No. V·& CE-15734 CE-15934 CE-16704 CE:·15904 -Front. ..... .. .. ........ . . . . .... ... .. . 2160 2255 2155 2245
Rear . . . .. .... . ...... . ......... . .. . .. 1530 1520 1465 J.150 Tc.tBI ............. ······· ···-·· ···· · 3690 3775 3620 3695
Model Ho. 6 CS-15734 CS-15934 CS·1571M CS-15S04
Front ........ : .. . .... . . .... .. . . ...... 2050 Zl45 2040 2130 Rear . .... . . .. . . .. ... . .... . .. .... ... . 1510 1505 1445 1440 Total .. ....... . ... . . . . .. . . ..... .... . . 3560 3650 3485 3570
Wf;IGHT Da!TF\IBtJTION. See section Truck Selection for body and payload distribution.
FIGURE A.4 CLASS 1 PICKUP DATA, 5000 LB
A.42

51
GMC C-3500 PICKUP 1.
CHASSIS DIMENSIONS
MODI::L NO. C-3600 WB Wheelbase. ... • .. .. . . . . . .. . .. . . . . . . .. .. . . ... . .. .. 133 OL Bumper to end of body. Fender-Side .. .. ... . .... · ·· ·· ·. 217% 1
Wide-Side . .. ... .............. 213% Turning Diameter. See Steering section.
t USE. ~+
rl)5~ 80
C-36034 PIC5-~UP 78\1 Width Over Front Bumper 32 Front Sprini Centers
40 Rear Spring Centers
us:zzo ..J
I GMC C-3500 PICKUP
LOAD CAPACITY CHART r.~a:dmum laad ~I ground must not meed capacity of minimum components (ules, springs, tires).
MIHIMUM REQUIRED EQUIPMENT FOR GVW RATING
GVW GCW Tires Tires Axle & Maximum Axle & Maximum Front Rear Springs LoaLling Sprin9s Loading
Front Front Rear Rear
6,600 - ~.75·16.5C (6) 8.75-16.5C (6) B.E. 3,500 B.E. 3,980 --·-
8,000 9.50-16.50 (8) 9.50-16.50 (8) RPO F60 3,800 RPO G50 5,560
9,000 9.50-16.SE (10) ~Oo RPO G60 6,340
B.E.-Base Equipment All capacities listed are in pounds and are maximum load at the ground.
STANDARD CHASSIS WEtGHTS Weights of b~so models with st.?ndard spoclfte1llons and 10-gal. luel,
C·35DD MODELS Model No. V-8
Front. .... ... .. ....... . ..... . ... . .. ..... . ...... . ... . ........... . .... . . . ...... . . .... . . Rear . . .. . . ....... . ........ . ......... . .. . .. ........ . .. .........•............ ...... . . . Total. . .... ... . .. . .. . ... . . . . ..... . .. .. . .... . ..... .. . .. . . . . ......... . ..... ..
Modal flo. 6
Front . ............ . , .. ... ................ . . ... ... . . . ... .... . . . . ....... ........... . Rear ...... .... ... . .. . . .. .... . .. . . .. . . . ...... . . ...... •. . .. . .. . . .. .. .................. Tatal ...... ..... ... .. . . ................. .. .. .. .. : .. .. .. . . . .. ... ........ . .. ..
WEIGHT DISTRIBUTION. See section Truck Sele:tion for body and payload distribution.
Fender-Side Pickup CE-36004
2385 1750 4135
CS-36004
2275 1730 4005
FIGURE A.5 CLASS 2 PICKUP DATA, 8000 LB
A.43
--· ~·-.
Other Equipment Required
Wide·Side Pickup CE-36034
2390 1825 4215
CS-36034
2285 1805 4090
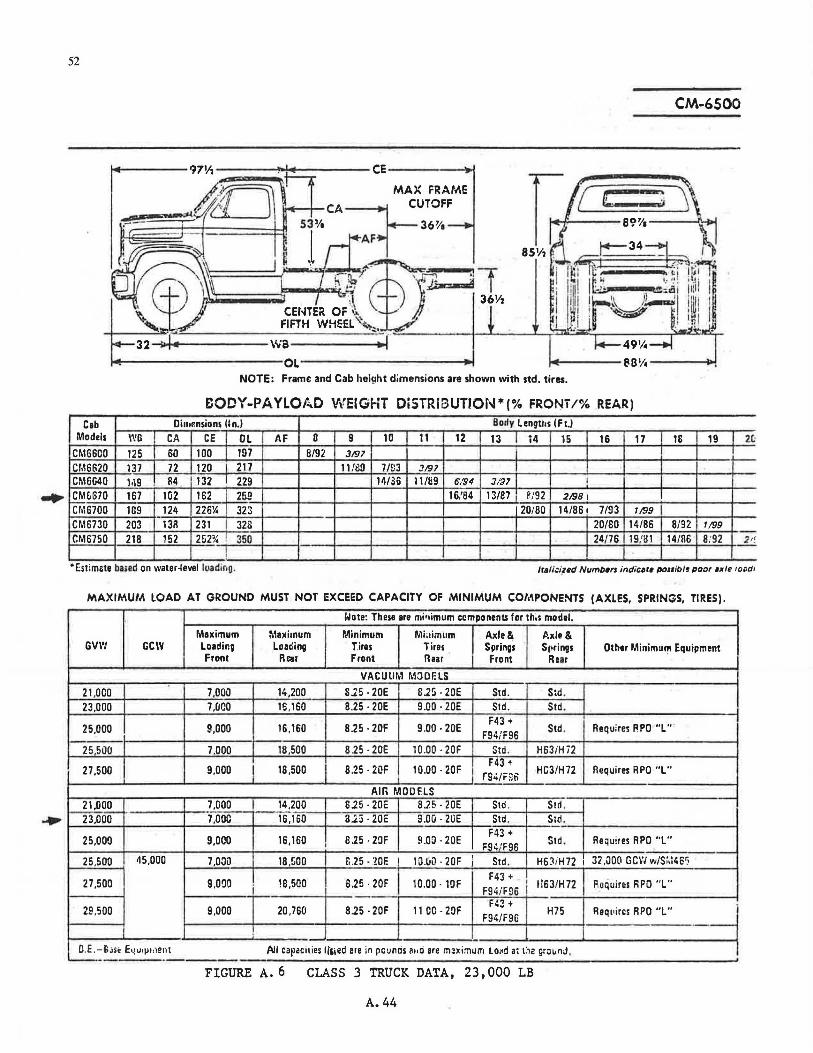
52
CM-6500
CE-----'1
-i>o+.------\VB-----~
-----------~oL----------_.,. NOTE: Frame and Cab height dimensions are shown with std. tires.
BODY-PAYLO/.;.D WElGl-iT OiSTRIBUTION*(% FRONi/% REAR)
C1b Di111Rnsiom Un.I Borfy Lengths (Ft.I Models Wll CA CE OL AF B 9 10 11 12 13 i4 15 16 17 1& 19 21·
CM66CO 125 60 100 197 8/92 3197 I
CM6S20 137 72 120 217 11/i!9 7/93 :J/97
CM6G40 1'19 84 132 229 14/36 11/89 6/94 3197 I
CM£i670 167 102 162 25g 16.'64 13/87 R/92 2198 i CM6700 11l9 124 226% 323 I 20/80 14/86 7/93 119s I -CM6730 203 1311 231 32& 20/BO 14186 8/92 1199
CM6750 218 152 252% 350 24/76 19,'81 14/86 8/92 21:
•Es1imc:1e hued on wa1er~evel IL•adir•o.
MAXIMUM LOAD AT GROUND MUST NOT EXCEED CAPACITY OF MINIMUM COMPONENTS (AXLES, SPRINGS, TIRES).
l~ote: These are mi•1imum ccmponenu for 1his mod1I.
Maximum Maximum Minimum Miaimum Axle& ll.1111& GVW GC\'V Lo1dir.9 Loaciing Tires Tires Springs Springs Other Minimum Equipment
Front Ri:ar Front Rear Front R11r
VACUUM MODELS
21,0CO 7.000 14,200 S.25 • 20E &1!i · 20E Std. S:d . 23.000 7,(JIJO 16,160 8.25 · 20E 9.00 · 20E Std. Std.
9,000 16,160 8.25 · 20F 9.00 · 20E F43 +
S1d . Requires RPO "L" 25,000 F94/F96 25 500 7.000 18,500 8.25 · 20E 10.00 · 20F Std. H63/H i2
9,000 18,500 8.25 · 20F 10.00 · ZOF F43 ~
HC3/H72 Requires RPO "L" 27,500 rs.+tFss AIR MOOHS
21,000 7,000 14,200 825 · 20E 8.7.5 · 20E Std . Std . --·-23,000 7,000 16,160 3.2:.i · 20E S.00 · 2lJE Std . Stet . -F43 + 25,000 9,000 16,160 I 8.25 · 20F 9.00 · 20E F.!l.l'F96 Std . Requires RPO "L"
25.500 45,000 7,0:JO 18.!iOO C:.25 • 20E ! 10.liO · 20F l Std . H63iH72 I 37 ,000 GCVJ w/Si,146~
27,500 9.0!JO 18,500 6.25 · 20F 10.00 · 10F F43 +
H63/H72 F.cquires Fi FO "L .. i F94iF96
29,500 9,000 20,760 825 · 20F 11 CC· WF F43 +
H75 Req11ircs RPO "L" j F94/F9G ·--C.E .-Gm: f•t•"ll"1en1 All capaci1ies ll"ed are in pounds a11ci are m?xi:num lo~d a: i:1~ grounJ .
~-
FIGURE A. 6 CLASS 3 TRUCK DATA, 23,000 LB
A. 44
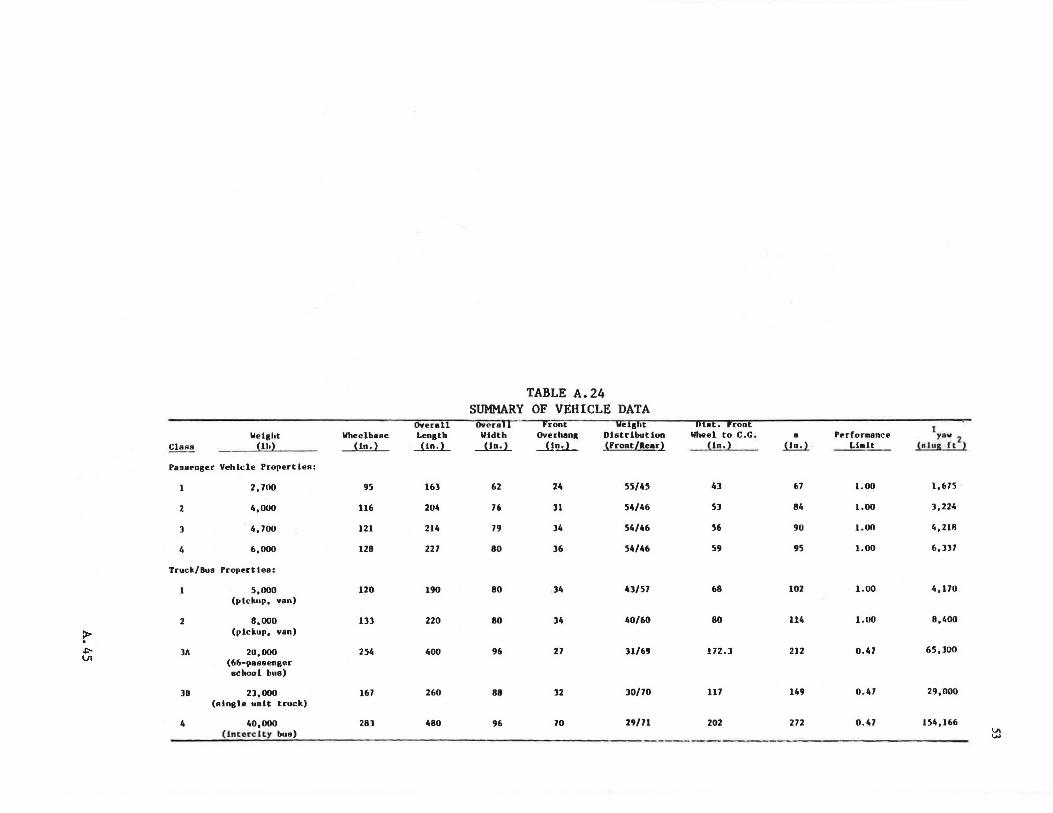
TABLE A.24 SUMMARY OF VEHICLE DATA
overall Overall Front weight hiat. f('ont I
Weight WheelbaAe Length Width Overhan11 Distribution Wheel to C.G. • Perfor11ance ya11 2 ~ (lh) (in.) ~ --1!.ll (in.) _(front/lear) (In.) 1!!!!.l ------".!.!!.!..___ (nluR ft )
Passenger Vehicle Propertlefl:
1 2,700 95 161 62 24 U/45 4l 67 1.00 l,675
2 4,000 116 204 76 ll 54/46 53 84 1.00 J,U4
l 4, 700 121 214 79 34 54/46 56 90 1.00 4,2111
4 6,000 128 227 80 36 54/46 59 95 1.00 6,ll7
Truck/Bua Properties:
1 5,000 120 190 80 34 43/57 68 102 1.00 4,170 (pickup, van)
2 8,000 Ill 220 80 34 40/60 80 114 1.00 8,400
> (pickup, van) . ~ lA 20,000 254 400 96 27 ll/69 172.l 212 0.47 65,lOO IJ1 (66-paaeenger
school bua)
lB 23,000 167 260 88 32 l0/70 117 U9 0.47 29,000 (Bingle unit truck)
4 40,000 281 480 96 10 29/71 202 272 0.47 154,Hi6 (int ere.I ty bua) IJ\ .....
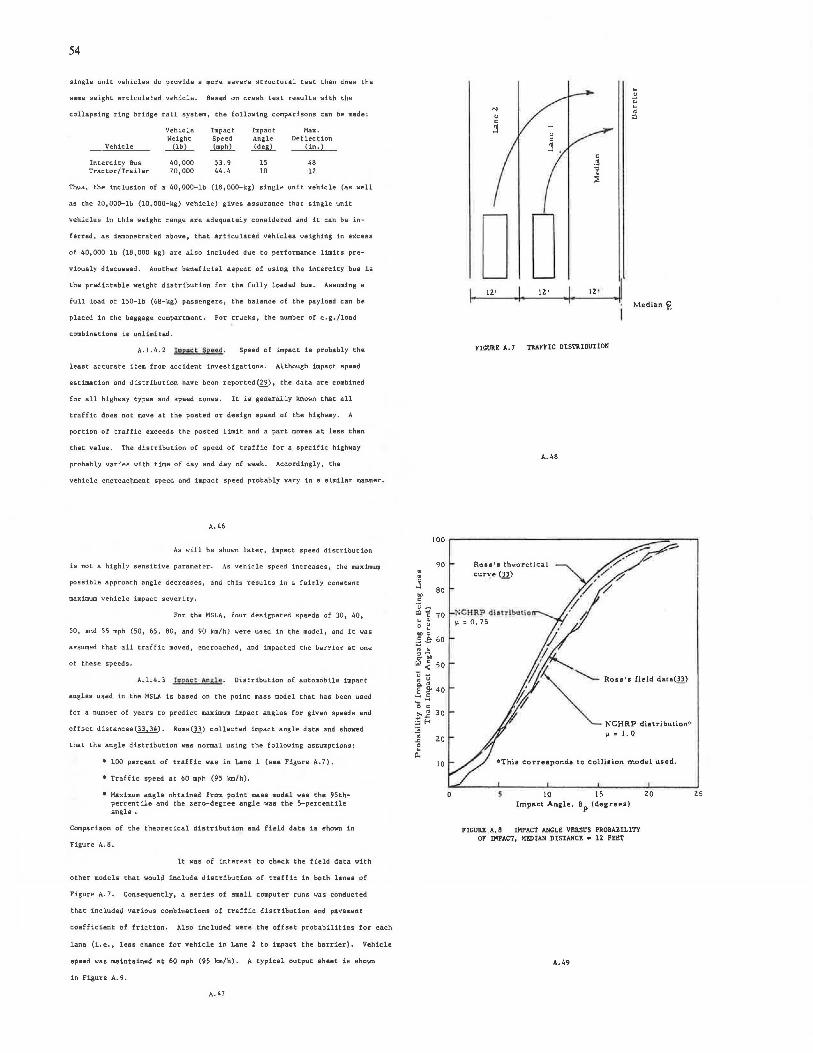
54
single unit vehicles do provide a Qlore sevete structural test then does the
same weight articulated vehicle. Based on crash test results with the
collapsing ring bridge rail system, the following compat'isons can be made:
Vehicle Impact Impact Max. Weight Speed Angle Deflection
Vehicle _illL .JsE.hl_ ~ ~in.)
Intercity Bus 40, 000 53. 9 15 48 Trac tor /Trailer 70,000 44. 4 10 12
Thus, the inclusion of a 40,000-lb (18,000-kg) single unit vehicle (as well
as the 20,000-lb (10,000-kg) vehicle) gives assurance that single unit
vehicles in this weight range are adequately considered and it can be in-
!erred, as demonstrated above, that .articulated vehicles weighing in excess
of 40, 000 lb (18, 000 kg) are also included due to performance limits pre-
viously d:l,scussed, Another beneficial aspect of using the intercity bus is
the predictable weight distt'ibution for the fully loaded bus. Assuming a
full load of 150-lb (68-kg) passengers, the balance of the payload can be
placed in the baggage compartment. For trucks, the number of c.g./load
combinationli iii unlimitlid.
A.Lli.2 'IDp3ct Spccad. Speed of impact is probably the
least accurate item from accident investigations. Although inipact speed
estimation and distribution have been reported(!2_), the data are combined
for all highway types and speed zones. It is generally known that all
traffic does not move at the posted or design speed of the highway. A
portion of traffic exceeds the posted limit and a part moves st less than
that value. The distribution of speed of traffic. for a specific highway
probably varies with time of day and day of week. Accordingly, the
vehicle encroachment speed and impact speed probably v.i~ry in a similar manner.
A. 46
As will be shown late..;', impact speed distribution
is not a highly sensitive parameter. As vehicle speed increases, the maximum
possible approach angle decreases, and this results in a fairly constant
maximum vehicle impact severity.
For the MSLA, four designated speeds of 30, 40,
50, and 55 mph (SO, 65, 80, and 90 km/h) were used in ~he model, and it was
assumed that all traffic moved, encroached, and impacted the barrier at one
of these speeds.
A. L 4. 3 h:ipnc t: Ansl • · Distribution of automobile impact
angles used in the MSLA is based on the point mass model that has been used
for a number of years to predict maximum impact angles for given speeds and
offset distances (33. 34). Ross Cl~) collected impact angle dat~ and showed
that the angle distribution was normal using the following assumptions:
• 100 percent pf traffic was in Lane 1 (see Figure A. 7).
• Traffic speed at 60 mph (95 km/h).
• Maximum angle obtained from point mass model was the 95thpercentile and the zero-degree angle was the 5-percentile anglci1.
Comparison of the theoretic.al distribution and field dat• is shown in
Figut"e A. 8.
It was of interest to check the field data with
other models that would include distribution of traffic in both lanes of
Fisure A. 7. Consequently, a series of small c:otnputer runs was conducted
that includ~c;I various combinations of traffic distribution and p~vement
coefficient of friction. Also included were the offset probabilities for each
lanei (Le., less chance for vehicle in Lane 2 to impact the barrier). Vehicle
speed was m.aintained at 60 mph (95 lan/h). A typical output sheet is shown
in Figure A. 9.
A.47
. . 0 -l
" .~
90
80
~ ~ 70 . . 0 ~ " 0 .: E: 60 .. . o-"" ~ < 50 u ~ • u
E ~ 40 -! 'O c ... 30 ~ .i:. ;::: f-1 :;; • 20 "' 0
o'.: 10
DD 12' 12' 12 '
FIGURE A. 7 TRAFFIC DISTRIBUTION
A. 45
Rosa' 11 thEmretical
cur':'e (ll)
NCHRP dlatrlbu!lc µ = o. 75
- ~ Median£
*This corresponds to colliai.on model used.
10 15 20 lrnpact Angle, 0p (degrees)
FIGURE A. 8 IMPACT ANGLE VERSUS PROBABILITY OF DIPACT, MEDIAN DISTANCE • 12 FEET
A. 49
25

OlSTRIB UTIDN OF IMPACT ANGLES
L•NE OISTR!~UT!ON FHACTIO~S L~Fl LANE : .SD
HIGHT LANE : .su
COEFFICIENT OF FHJCl!ON 1.00
qs•PERCENT!LE ANGLES LEFT SIDE c zs.w? DEGREES
RIGHT ~IDE: IR.?• DEGNEES
STANDARD DEV I ATION ANO HEAN -------- --· - LHT SIDE • •.SB um ·
RIGHT Sl~E • 3.32 ANO
lHPACl FRACTIONS BY LANE LEFT LANE • 311
Rl ~ HT LANE •. - , • ?U
- ·::_- · - . ZERO OEGREE_S- • U•PERCENTILE ANGLE
-- ANGLE-- CUMULATIVE' PRObAHILITY . ·- ·- • " - . ·--
- - ------- · · ·-·-_ ___ :·: ~::·_· __ : :_~:: _--:-:·.so~-~·::-__ :_·_ .· ____ --·· =--=--=·:,:!': --==- _-_!2;_~0.::: ~~=-::--=-.-=-=--: ___ -~!:s-:;:-··:___::__-=-:--::: . ~ :··s_s. q(___::=-~~ :~- · -- -- -:__~:-~~-- ~~·=·-· _ _::_::_ ·a,;·u::-_::-_-=--=-··:-_-_------ - · ~~=-~ ~ . ~ -=-- ~= ~J •. !l . ~---= = ·- -~-- - ---:.:._~---- - - • 3 ~~:-~.:.:--=- . ·-- --- ·· ·n·. 100.00 .- -· - - ··- ----- -·-
-- - -- •. !.D • 100.nu
. -~s-. 100.00
- !~· - 1un . oo
55. 100.00
~D • 1110.00
FIGURE A. 9 TYPICAL OUTPUT FOR !Ml'ACT ANGLE DISTRIBUTION
A.SO
u. ~c 13. 27
Results from two of the computer outputs are super-
imposed on Figure A.8. Note that the data with u • O. 75 gives results that
are closer to the theoretical distribution by Ross. The traffic split of
50 percent in Lane l and 50 percent in L11ne 2 gives results that are quite
close to the field data. Thus, it was assumed ~hat a more realistic split
of traffic , particulat"ly for two-lane, two-way bridges, could be used in
subsequent analyses. To be noted is that although the inodel was verified
for the 60 mph (95 km/h) data, it was assumed adequate for the entire speed
range of 0 to 65 mph (105 km/h).
The point mass model is sufficient to describe
automobile behavior, but must be modified with regard to heavy vehicles with
higher center of gravity. Relationships were developed in an FHWA program
for these heavy vehicles Cn). These relationships were based on performance
limits reported by Weirill) on a 36,000-lb (16,000-kg) intercity bua and a
41,000-lb (19,000-kg) tank truck. Angles of iinpact as a function of lateral
offset distance are plotted in Figure A.10 for the truck and bus along with
automobile mass data from work by Ross C].1). Euentially, the coefficient
of friction was reduced for these large vehicleli to account for overtu?'ning
tendency,
in general
2 v
r • -min gµ
The 111nimum turning radius is described fo?' vehicles
(A. 3)
whe?'e ?'min is minimum turning ?'adius in feet, g is acceleration due to gravity
in fps2
, and µ is pavement coefficient of friction. The coefficient of friction
is LO fo?' passenger cars and small trucks and 0.47 for large trucks and buses
(the 0 . 47 value is from Ref . 36).
A. 51
50
40
Cl) 30
l.J.J .J C> z <[
f- 20 u ~ :E
10
FACE OF
BARRIER
10
A Empty Bua (Ref. 36) 0 Full Bus (Ref. 36)
C!) Full Tank Truck (Re! . 36)
1- AJTIJ (Ref, 33)
20 30 40 50
LT AND LCG , (FEET)
FIGU'RE A.10 60 MPH IMPACT ANGLE DATA
A.52
55
60
A.1. 4. 4 VehlC-h: Encroae:ha.ont Tra le.c.torh. ~. A suUIIll8ry of
the previously discussed collision consideration is pr~sented in Figure A.11.
A. l. S Barrier Behavior
The safety performance of a longitudinal barrie?' such as a
bridge railing is evaluated on three basic factors(!):
• Structural adequacy in containing and redirecting the impacting vehicle.
• Red.trection severity imposed on vehicle occupants.
• Postimpact trajectory of the redirected vehicle.
These three behavior characteristics are examined for basis of utablishing
an objective multiple service level performance crite?'ion.
A.1.5.l Strucwral. Aduuacy. From TR8 Citc.ubr 191(!) one
level of service was recognized by AASHTO. Structural adequacy of a b['idge
railing design, evaluated by c?'ash testing, was subjected to a 4500-lb
(2040-kg) passenger ca?' impacting the barrier at 60 mph (95 km/h) and 25 deg.
Requirements were that the vehicle must not penetrate, pocket, or wedge undei;
the systeUI fo-r these impact conditions. Of the three evaluation f ac to?'&
(i.e • • structural adequacy, redirection severity, post impact trajecto['y),
only structural adequacy can be clearly determined by a yes/no standard. In
general, the vehicle was either contained on the bridge or it penetrated the
railing.
A dimension of structural adequacy not addressed
specifically in NCKilP Report 230 is maximum allowable lateral deflections
of the barrier. Histo?'ic.ally, bridge railing designs have been relatively
stiff st?'uctures (when proportioned to AASHTO static specifications) and
have exhibited at most only 3 in. or 4 in. of deflection when impacted by
the N'CHRP "Report 2)0 heavy car. Bt'idge railing designen have expressed a
A. 53
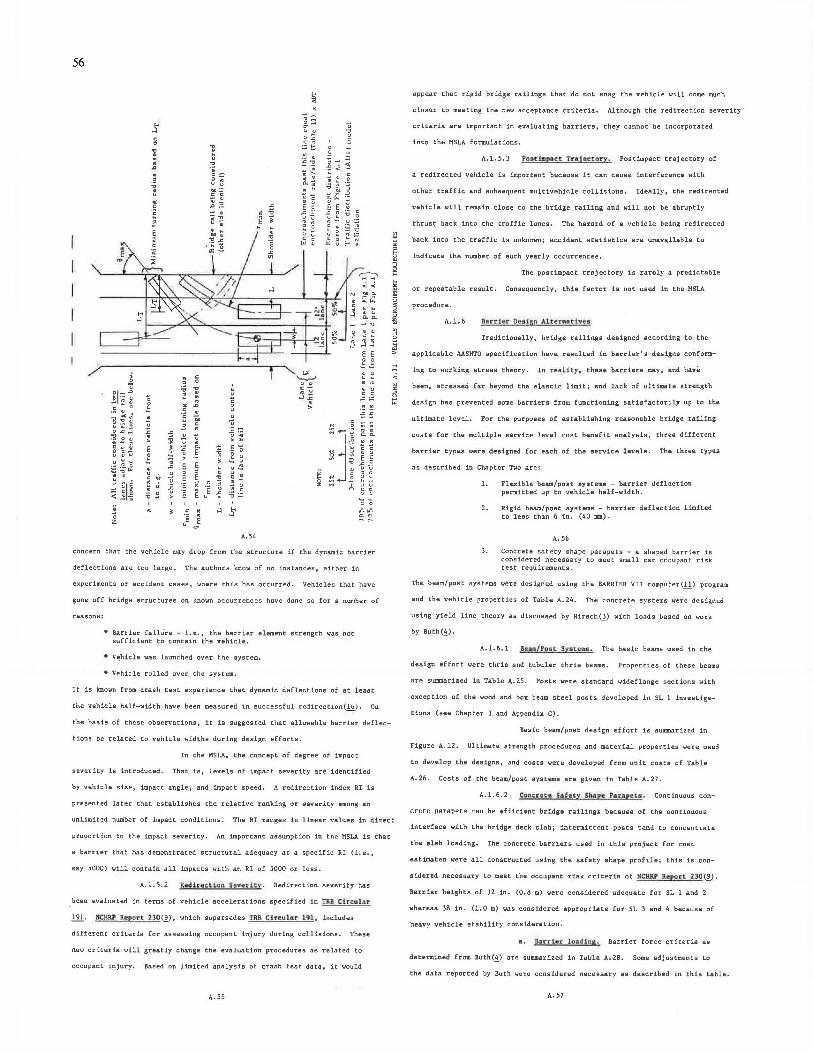
56
" " .. o.o.
~ ~ ~ j j j
/ ~ .
0 :;; 01-,, ~ ~ ... Q,I " ~ ..
.5 ~ ~ ~ " c
~ ~ ~ . ·~ u E " . ~
,, ~ L . :g 2 . :S u . . c . E ~ L 3 c . . ~ >
u u " • s :; ~ . L 6 u u 0
~ . c " 0
~1 ~ ~ .; u ·c: ~ < c 0 :;; 2 E ~~ > . c 0
• E z
.,, " : .
~ c . . u
" u
c u • ~ u .
-" 0. E E ;; ~ ·~
E " . " u u
E .,, ~ ·x " ;; . ~E 0
E .:; .,,
~ ~ ~ E
m
. . 0 u u ~
2 ~
A.54
E E ~~ • u . " . . u •
;§ ~
.. 0.0. . . c c
E E ".= u u
e t u u c c i;;:..
concern that the vehicle may drop from the structure if the dynamic barrier
deflections are too large. The authors know of no instances, either in
experiments or accident cases, where this has occurred. Vehicles that have
gone off bridge structures on known occurrences have done so for a number of
reasons:
• Barrier failUre - Le., the barrier element strength was not sufficient to contain the vehicle.
• V~hicle was launched over the system.
• Vehicle rolled over the system.
It is known from crash test experience that dynamic deflections of at least
the vehicle halt-width have been measured in successful redirection(!.§.). On
the basis of these observations, it is suggested that allowable barrier deflec-
tions be related to vehicle widths during design efforts.
In the MSLA, the concept of degree of impact
severity is introduced. That is, level$ of impact severity are identified
by vehicle size, impact angle, and impact speed. A redirection index RI is
presented later that establishes the relative ranking or severity among an
unlimited nulliber of impact conditions. The RI ranges in linear values in direct
proportion to the impact severity. An important assumption in the MSLA is that
a barrier that has demonstrated structural adequacy at a specific RI (i.e.,
say 5000) "Will contain all impacts "With an RI of 5000 or less.
A.1.5.2 Redirection Seve·rlty, Redirection severity has
been evaluated in terms of vehicle accelerations specified in 'nll C'ln.ule:r
191. tJC!HA.'P 0
Rl'!!pOrt 23.0(,2), which supersedes TRB Chcular 191, includes
different criteria for assessing occupant injury during collisions. These
new criteria will greatly change the evaluation procedures as related to
occupant injury. Based on limited analysis of crash test data, it "Would
A. 55
appear that rigid bridge railings that do not snag the vehicle will come much
closer to meeting the new acceptance criteria. Although the redirection severity
criteria are important in evaluating barriers, they cannot be incorporated
into the MSLA formulations.
A.1.5.3 Ponlmpct Tra1o.ctory . Post:.impact trajectory of
a redirected vehicle is important because it can cause interference with
other traffic and subsequent multivehicle collisions. Ideally, the redirected
vehicle will remain close to the bridge railing and will not be abruptly
thrust back into the traffic lanes. The hazard of a vehicle being redirected
back into the traffic is unknown; accident statistics are unavailable to
indicate the number of such yearly occurrences.
The postimpact trajectory is rarely a predictable
or repeatable result. Consequently, thia factor is not used in the HSI.A
procedure.
A.1. 6 B•l'rier Dt!s-lgn A.ltern.atlve.s
Traditionally, bridge railings designed according to the
applicable AASHTO specif ice tion have resulted in barrier 1 s designs conform-
ing to working stress theory. In reality, these barriers may, and have
been, stressed far beyond the elastic limit; and lack of ultimate strength
design has prevented some barriers from functioning satisfactorily up to the
ultimate level. For the purposes of establishing reasonable bridge railing
costs for the multiple service level cost benefit analysis, three different
barrier types were designed for each of the service levels. The three types
as described in Chapter Two are:
1. Flexible beam/poat ay!ltema - barrier deflection permitted up to vehicle half-width.
2. Rigid beam/post systems - barrier deflection limited to less than 6 in. (40 nan) .
A.56
3. Concrete safety shape parapets - a shaped barrier is considered necessary to meet small car occupant risk test requirements.
The beam/post systems were designed using the BARRIER VII computer(!.!) program
and the vehicle properties of Table A. 24. The concrete systems were designed
using yield line theory as discussed by Hirsch(l) with loads based on work
by Buth(~).
A. l. 6.1 Bua/Post. System.&. The basic beams used in the
design effort were thrie and tubular thrie beams. Properties of these beams
are swmnarized in Table A. 25. Posts were standard wideflange secttons with
exception of the wood and box beam steel posts developed in SL 1 investiga-
tions (see Chapter 3 and Appendix C).
Basic beam/post design effort is summarized in
Figure A.12. Ultimate strength procedures and material properties \ll'ere used
to develop the designs, and costs were developed from unit costs of Table
A. 26. Costs of the beam/post systems are given in Table A. 27.
A.1. 6. 2 C'onc.nte Sat•rr Sh1111p'I!. Pllllr.areu. Continuous
c.rP.tP. p;1r;1pPtr; can be efficient bridge railings because of the continuous
intet'face with the bridge deck slab; intermittent posts tend to concentrate
the slab loading. The concrete barriers used in this project for cost
estimates were all constructed using the safety shape profile; this is con-
sidered necessary to meet the occupant risk criteria of blCl:UlP R.eiporc 230(V.
Barrier heights of 32 in. (0.8 m) were considered adequate for SL 1 and 2
whereas 38 in. (1. 0 m) was considered appropriate for SL 3 and 4 because of
heavy vehicle stability consideration.
8an1or loading. Barrier force criteria
determined from Buth(!!) are summarized in Table A. 28. Some adjustments to
the data reported by Buth were considered necessary as d~scribed in this table.
A.57
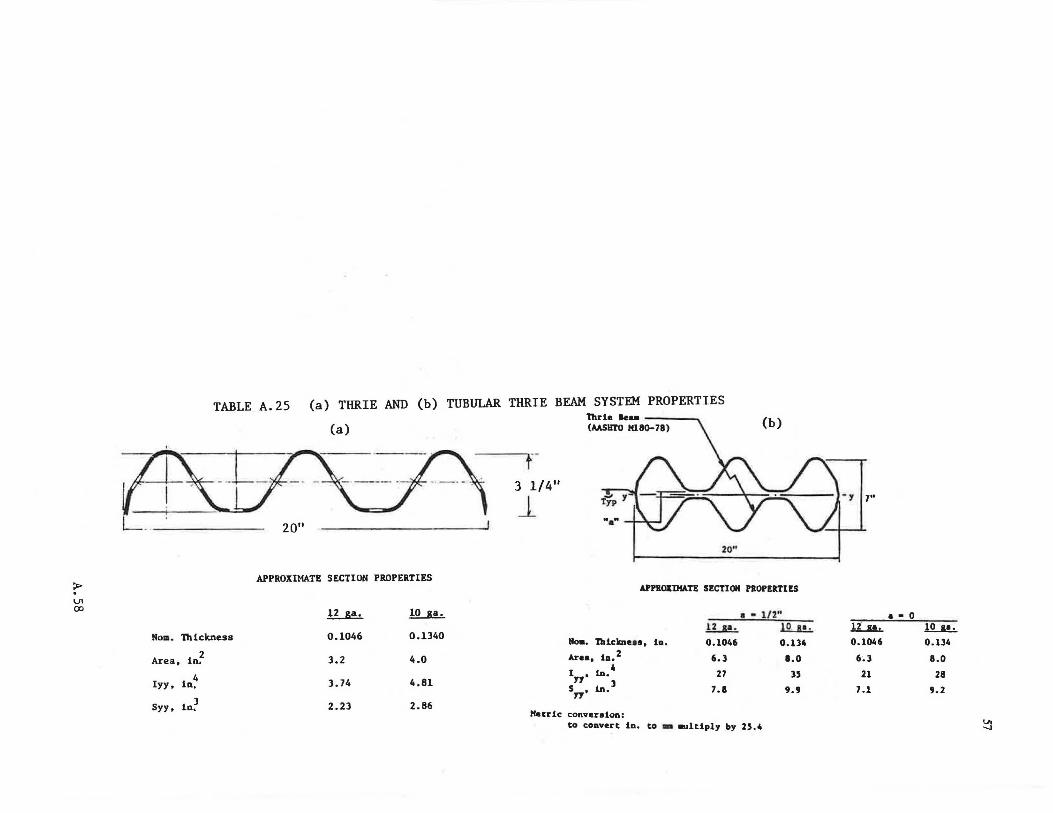
> . U1 CXl
TABLE A.25 {a) THRIE AND {b) TUBULAR THRIE BEAM SYSTEM PROPERTIES lhrie a.- ---
{a) (AASllTO Hl80-78) (b)
L _. 20" 1
No11. Thickness
Area, in~
Iyy, in~
Syy, in~
APPROXIMATE SECTION PROPERTIES
!L&!,.,_
0.1046
3.2
3.74
2.23
!!LJ.!..,.
0.1340
4.0
4.81
2.86
t"-3 1/4"
J_
20··
APPllOIIHATE SECTION PB.OP!llTI!S
Noa. lhickneas, ia.
Area, ia. 2
I , ia. 4
Y1 l s". tn.
• - 112" ll....&!..:. .lQ....s.!.,_ O.lOlo6 0.134
6.3 1.0
27 35
7. 8 9.9
Hecric convareion: to convarc in. co .... ltiply by 25.4
-y 17"
• - 0 .ll....&!.... ~ 0.1046 0.134
6~3 8.0
21 28
7.1 9.2
~
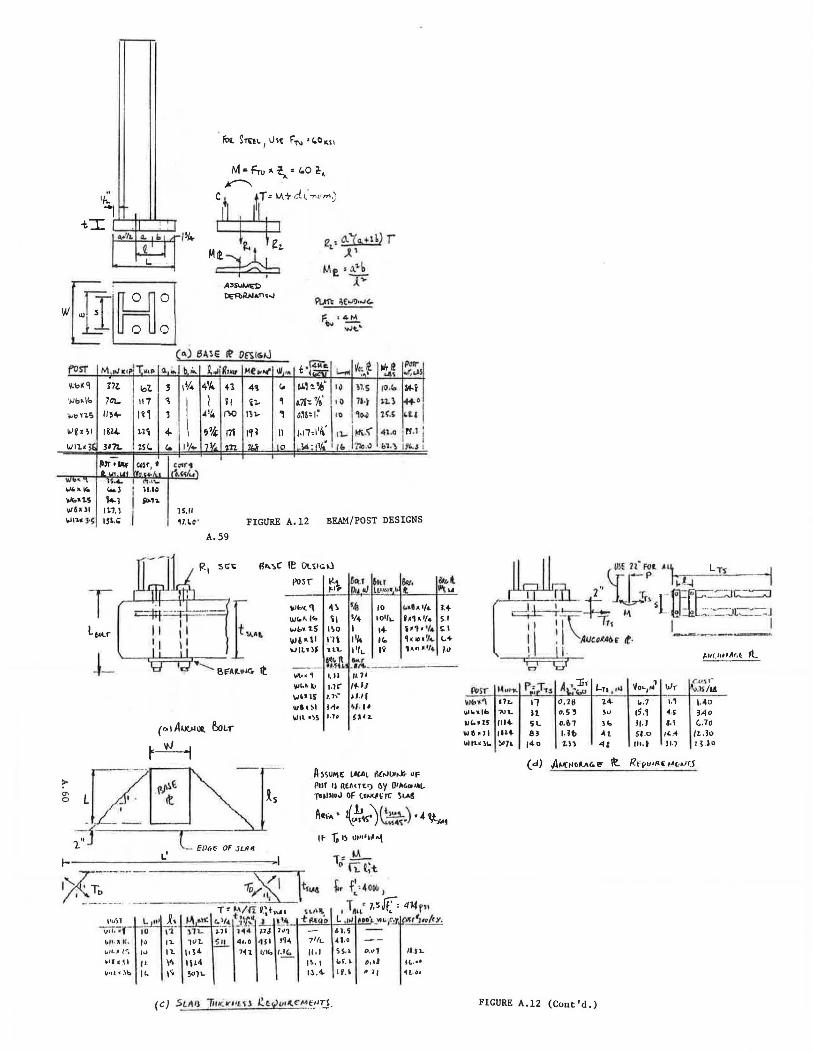
{tIOO Ll 0 0
f'OST M/Nu T-.p ~ ;.. J b ,;..
'1.'b~9
'>lb•llo
..,.,n.i;,
i.1en1
~~ .. Kt
""-•\.S 1>1&01
?7Z.
7CI..
"~'"" iW..
.. , ... "' 15l..;
lot 117
1i1
SC-, ...
3
' 1
4-
1lf·
11/+
lS.11 1uo·
~;£ ... 9•"'C..
F\ •4"' w ~·
Mt .. '4" IJJ •• i'~& t-... ~'; ~ lllr!! Posr ..a~ ;,,.t;J!
4~ c,, o.s.i '! •.e" ·~ ~l. 5 '°"' lif.i il- ~ ,,71-: "/&' 10 1l·) l1.l ......
111- , o.i1: I~ 10 ~°"' i<.~ •ti
!<!\.\ 41.o rs .1 I
" ?le.I> &1. ) I
''-S I
FIGURE A.12 BEAM/POST DESIGNS
A.59
j_
\ILISl v;r.-;y-
l-P· A K .. t..U. 1<l<;
\lo•l•H "'/il'l~b
L .~ ~,~ ..,.: IU \i"" \lL. IO l'L 1Vl.
'" 11. I•~" IL ,.. l\l4 It. I~ 501'-
"'"''(. '\ 4 !> f.fl 10 1.•h ,,._ l+ WI.A.I'- ~I I/+ 101/'- h,al/4 S. I wl>•1.S l\o I 1+ $•1•'1• S:I W&•\I 11, 111. I&. ,,,.,,, ... t.+ 1Jll•)$ U\. l'li.. Ii 1•n•'lt 1.tl
--- '~\flJ .'i'.4... _______ _ ~··, 1. 11 fl. 71
Wb• lo 1.1C' /f.IJ \J~'1~ J,1\- .,,,, 1116'~1 1-i• ~, ... lolll ·~S 1.Jo Oh.
A ~SUI>\( ~·CJIL ~(rJUl..X, •F
Pllf IJ l\tMHC<) r,y 01.liC.0.1~\..
151Ji10J OF tolJ<.fnt: ~LAS
A~f" , {.~~~~ ~.) • -4 \t,c.•
I~ 'J; I~ '""''~'"'\
1- u 0 fl: ~:t
~1:r't(;J11. ~i·~- i~;\ Z.71 7~-l l7~ ,., -
s II 4•.• 'IJ I ~~4 7 1/L
7~1. b1'. I~ 11·1 ,~ .. 13.4.
i, (4o~ I T. , 1,'5.Jf= 414f"
t nH. "
L ·'" ~••'•-"'i.. 1r.::r,f:rf1,./<Y. <ll.~ -41,0 --s~· ~·T n~L Ltf. I- Odl H,.••
lf. i •11 1l·•·
~ST ~l<o~'I i.,J11•lb
IJl.• 1S
IMO• ll 11111-•llo
~;r ... ~ At.<~: Ln ,,.i 'JOLll-l IJr C-A:.1'\r ·~.lS /l&
1 0,15 1.4. ~.7 ,,, \,.1\0
1 o.S, ~" 1s.1 H Mo L o.&1 lb JI.I a., c..10
J 1. Jf> .Ill Sl.o /L.+ /z. .Jo 0 1.11 4: 111. t Jl.7 1 ~ .10
'~"'"'"~ l7L I 7UL 3 Ill.. 5 ,.... 8
))IJ• '"
( d) .AJ.JCNollAG. \!!' ~ RFpu•ll.~ IAc,AJrJ
FIGURE A.12 (Cont'd.)
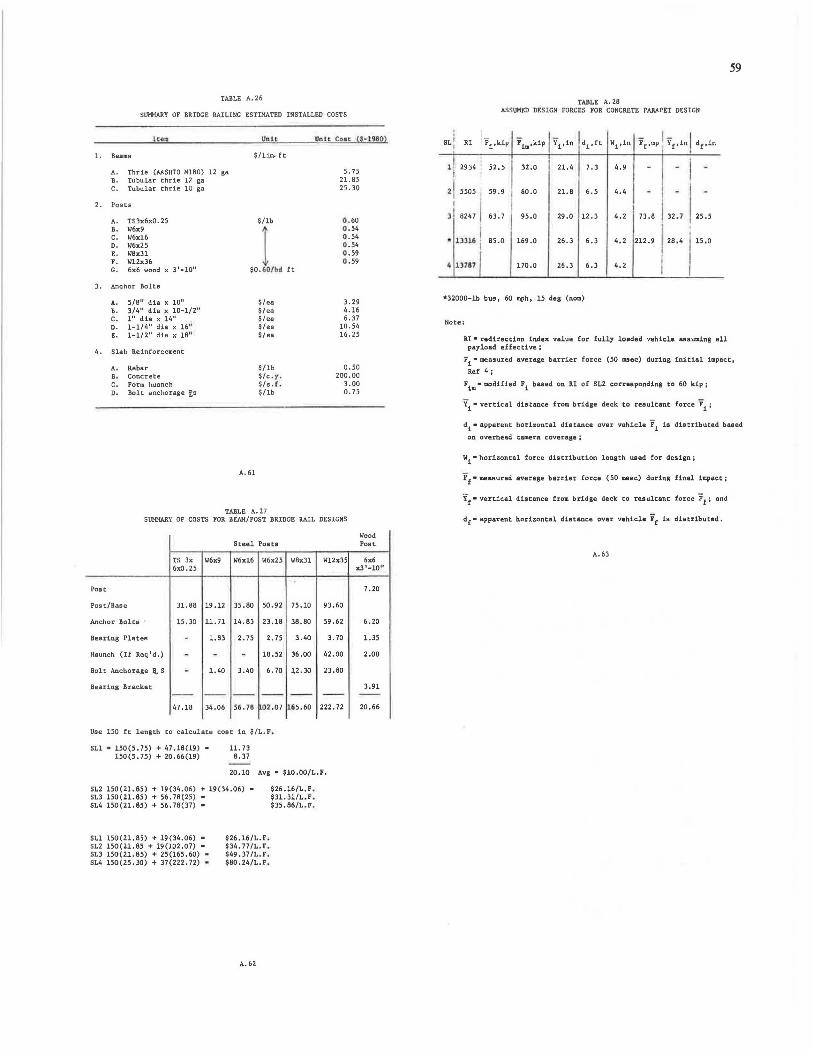
TABLE A. 26
SUMMARY OF BRIDGE RAILING ESTIMATED INSTALLED COSTS
""" Un it Qntt. Co11t !§·1980l
l. Beams $/lin. ft
A. Thrie (AASHTO Ml80) 12 ga 5. 75 B. Tubular thrie 12 ga 21.85 c. Tubular thrie 10 ga 25.30
2 . Posts
A. TS3x6x0. 25 $/lb 0. 60 B. W6x9
I 0 .54
c. W6xl6 0 . 54 o. W6x25 0 .54 E. W8x31 0.59 F. Wl2x36 0.59 G. 6x6 wood x 3 1 -10 11 $0.60/ bd ft
3. Anchor Bolts
A. S/8 11 dia x 1011 $/ea 3.29 B. 3/4" dia x 10-1/2" $/ea 4.16 c. 1 11 dia x 14" $/ea 6.37 o. 1-1/li" dia x 16" $/•• 10.54 E. 1-1/2" dia x 1811 $/ea 16. 25
4 . Slab Reinforcement
A. Rebar $/lb 0.50 B. Concrete $/c .y . 200 .oo c. Form huanch $/ s . C. 3 . 00 o. Bolt anchorage ~s $/lb o. 75
A.61
TABLE A.27 SUMMARY OF COSTS FOR BEAM/POST BRIDGE RAIL DESIGNS
Steel Posts
TS Jx W6x9 W6x16 W6x25 W8x31 Wl2x35 6x0. 25
Post
Post/Base 31.88 19 .12 35.80 50.92 75.10 93.60
Anchor Bolts 15.30 11. 71 14.83 23.lB 38.80 59 .62
Bearing Plates . 1.83 2. 75 2. 75 3.40 3. 70
Haunch (If Req 1d.) - - - 18.52 36.00 42.00
Bolt Anchorage 1J.. S - 1.40 3.40 6. 70 12.30 23.80
Bearing Bracket - - - - -- -- -- - -47 .18 34.06 56. 78 L02.07 165.60 222. 72
Use 150 ft length to ca lculate coa t in $/L .F .
SLl • 150(5.75) + 47.18(19) • 11.73 150(5.75) + 20.66(19) 8.37
20.10 Avg • $10.00/L.F.
SL2 150(21.85) + 19(34.06) + 19(34.06) • SL3 150(21.85) + 56. 78(25) • SL4 150(21.85) + 56. 78(37) •
SLl 150(21.85) + 19(34.06) • SL2 150(21.85 + 19(102.07) • SL3 150(21.85) + 25(165.60) • SL4 150(25.30) + 37(222. 72) •
$26.16/L.F. $34 . 77/L.F . $49.37/L,F . $80,24/L.F,
A. 62
$26.16/L.F. $31.31/L.F . $35.86/L . F,
Wood Post
6x6 x.3 1-10°
7 . 20
6.20
1.35
2.00
3.91 --20.66
TABLE A. 28 ASSUMIID DESIGN FORCES FOR CONCRETE PARAPET DESIGN
11 2934 1 52.5 i
21 5505 59 .9
I
3 8247 63. 7
• 133l6 1·
4 U787
85.0
32.0
I 60.0
95.0
169.0
170.0
21.4 7 .3
21.8 6.5
29.0 12.3
26 . 3 6 . 3
26.3 6.J
•32000-lb bus, 60 mph, 15 de& (nom)
Note:
4.9 -
4.4 -
4.2 73.8
4.2 212 . 9
4.2
- I
1 32~7 I 1 28 . 4 i I I
25 . 5
15 . 0
RI• redirection index value for fully loaded vehicle assuming all payload effective;
59
F1
•measured average barrier force (50 msec) during initial impact,
Ref 4:
F im •modified F 1 baaed on RI of SLZ corresponding to 60 kip;
i 1 "" vertical distance from bridge deck to resultant force F1 ;
d1
•apparent horizontal dia tance. over vehicle F1
is distributed baaed
Olli overhead camera coverage ;
wi - horizontal force distribution length used for design j
Ff• measured average barrier force ( 50 msec) during final impact :
Yf •vertical distance from bridge deck to resultant force Ff i and
df..; apparent horizontal distance over vehicle Ff is distributed.
A. 63
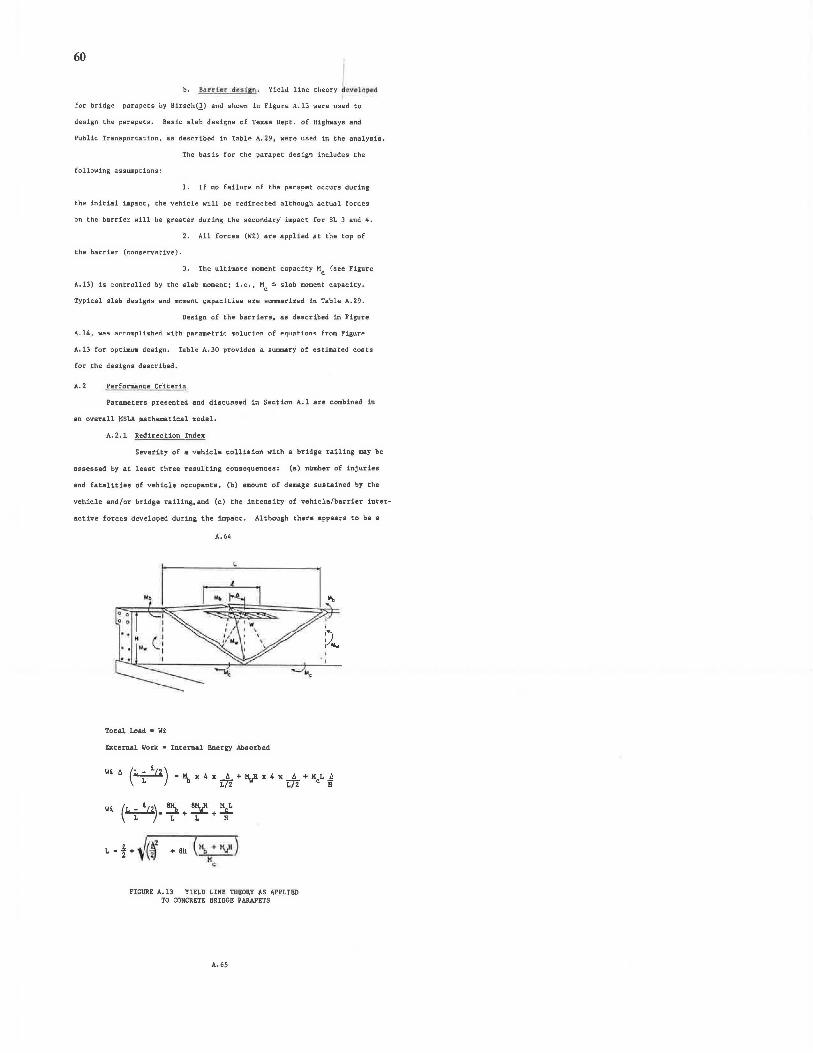
60
b. 'B.anlel"' dedgn. Yield line theory iJ a.v Qlcplfld
£or bridge parapets by Hirsch(l) and shown in Figure A.13 were us~d to
design the parapets. Basic slab designs of Texas Dept. of Highways and
Public Transportation, as described in Table A. 29, were used in the analysis.
The basis for the parapet design includes the
following assumptions:
L If no failure of the parapet occurs during
the initial impact, the vehicle will be redirected although actual forces
on the barrier will be greater during the secondary' impact for SL 3 and 4.
2. All forces (Wt) are applied at the top of
the barrier (conservative).
3. The ultimate moment capacity Mc (see Figure
A.13) is contt'olled by the slab moment j i.e., Mc ::.. slab moment capacity.
Typical slab designs and moment capacities are summarized in Table A. 29.
Design of the barriers, as described in Figure
A.1/j, WR'I Rf'f'nmr111ilhPri wtth paramiPtric i;:olut:lnn C'lf Ptpu1t1r,mc;: frortl FisurP
A.13 for optimum design. Table A. 30 provides a summary of estimated costs
for the designs described.
A. 2 Perfornis.nce Ci1teria
Parameters presented and discussed in Section A. l are combined in
an overall MSLA mathematical model.
A.2.1 Redirection Index
Severity of a vehicle collision with a bridge railing may be
assessed by at least three resulting consequences: (a) number of injuries
and fatalities of vehicle occupants, (b) amount of damage sustained by the
vehicle and/or bridge railing, and (c) the intensity of vehicle/barrier intet'-
active fot'ces developed during the impact. Although there appears to be 4
A.64
Total Load • WR.
External Work • Internal EnerS)' Absorbed
Wl. 6 (L~·l.'2 ) "'\x4xi+yx4xi+ML]! L/2 L/2 c H
+SH
FIGURE A.13 YIELD LINE THEORY AS APPLIED TO CONCRETE BRIDGE PARAPETS
A. 65
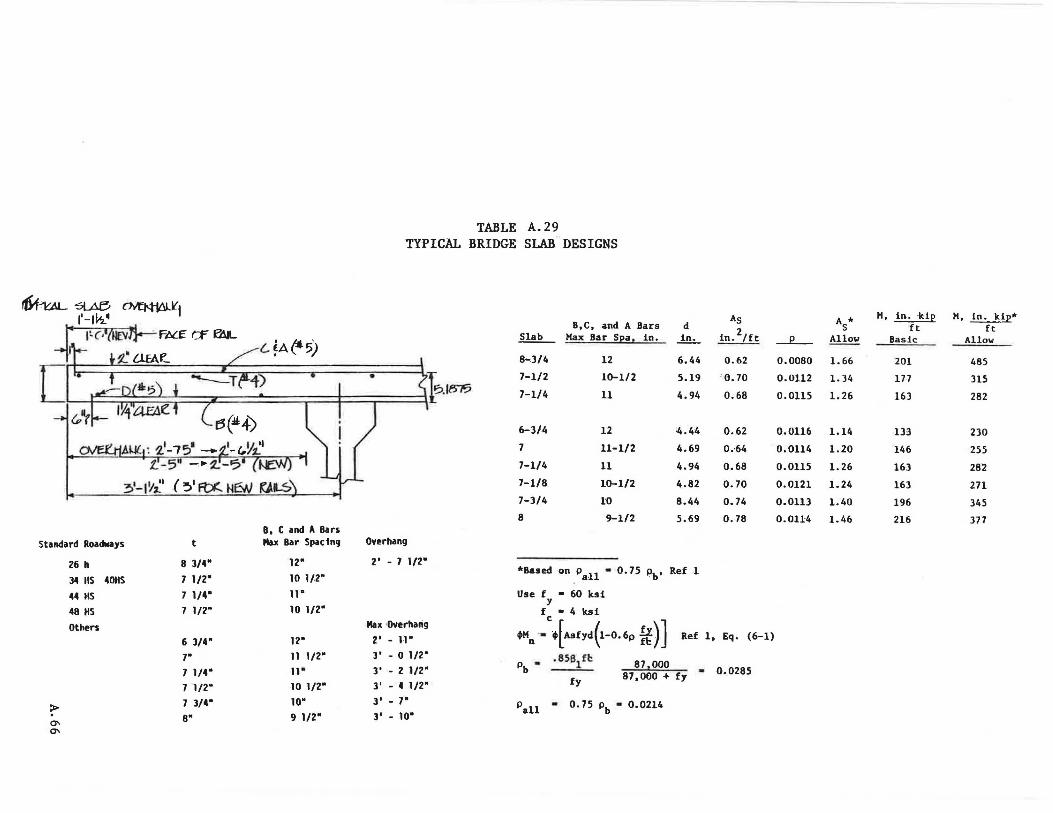
l. fA ("5)
• I - -Al .. , •
dt!= iY.f~e 1 c 13(:»4) l I I
B, C and A Bars Standard Roadways t Max Bar Spactn9
26 h 8 l/4" 12·
34 llS 40HS 7 1/2" 10 1/2"
44 HS 7 1/4" 11"
48 HS 7 112· 10 1/2"
Others 6 l/4" 12·
7• 11 112·
7 1/4" 11"
7 1/2" 10 1/2"
> 7 3/4" 10"
°' 8" 9 1/2"
°'
TABLE A. 29 'TYPICAL BRIDGE SLAB DESIGNS
B,C, and A Bars 1!!L Max Bar S(!a 1 in.
8-3/4 12
• ... 7-1/2 10-1/2
7-1/4 11
) I -6-3/4 12
7 11-112
7-1/4 11
7-1/8 10-1/2
7-3/4 10
8 9-1/2
Overhang
2' - 1 112·
d in.
6.44
5.19
4.94
~.44
4.69
4.94
4.82
8.44
5.69
*Based ·on pall• 0.75 l?b' Ref 1
Use f - 60 ksi y f • 4 ksi
Max ·Overhang c
As
in. 2 tft
0.62
6.70
0.68
0.62
0.-64
0.68
0.70
0.74
0.78
2' - 11 • ~Mn - ~[Asfyd(l-0.6p *)] Ref 1, Eq. (6-1)
l' - 0 112· .856lfl: 871000 Pb -l' - 2 1/2" 87,000 + fy - 0.0285 l' - 4 1/2" fy
l' - 7• pall - 0.15 Pb• 0.0214
3' - 10·
A * M, in. -1<12 M, ~ip* s ft ft
~ Allow Basic Allow
0.0080 1.66 201 485
0.0112 1. 34 177 315
0.0115 1.26 16) 282
0.0116 1.14 lH 230
0.0114 1.20 146 255
0.0115 1. 26 16) 28'2
0.0121 1.24 163 271
0.0113 l.40 196 345
0.0114 1.46 216 377
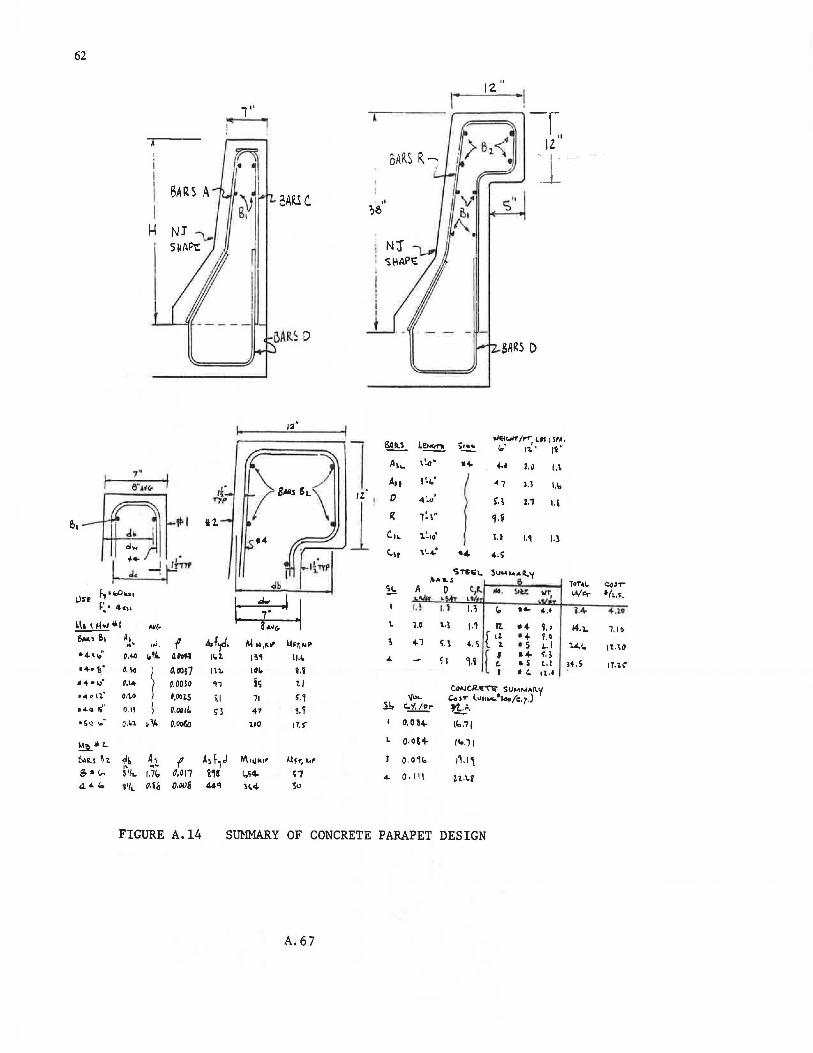
62
I 7 '
I
I I
H
6' Af" I
•• --Q~I d~ I
o1 ..
~ ... ~ .~;..,, J, r
~,. loD ... , L):n
~~I 4c,,
~-' AV(•
61•1.1 s, A, f .~· 1...i. •4. .,.;· o.44 "'"' 4Dff.1
14-• ~: Uo
) 0.0011
·~ ·i,;,· D.14 O.OOlO it.ii" r'l~ o.1.0 0,00l.S D4Cl 1i
11
0.1\ 0.0014. ·s~ ,,. .. o.~1 :,.1,t. O.Ool'.o
~~L.
&.1t1 ~l. .,i~ A~ f " .. ~ i;. (.... 3 ., ... rn, 11.0I? 4 .. :0 'i'I ... i1°ib o.aos
FIGURE A.14
"" !
L" '~ .,..,,.
i2.
dsf.,d, 11.l.
Ill. ~,
\ii
1;"3
A~ f1.I m 44q
l "
i' ;v I B1
cARS C.
12·
l. (
>..,''\ 1 H
I Jb
~ . (;.
MN.~,, ll~r, .. ,. I~, 11.~
101. i.i is 1. f
11 S'.1 47 3, 'i
·1.10 11.r
"''""''' A.IF.,., t.., 'Ji4- ~;
~~"' lu
,____;_12 ____ 1
~ L~ ~~ -'ra_.-f~llf;m.
(., 1'2.. ,~ ..
A,.._ ,~ .. ·~ ... u I.\
A11 1~1:
i
~, u I.lo D ~' ... u~ ).\ 1.1 ,,, ~ 1'. 1" 'J.i
CIL 1.~ro' u I.~ l.l
<-u ,1_..,: •4 4-S'
su .. ,.,.ll.'f
!h 4.•
t. 1.0 1.l 1.1 ll. ,.., i.•
+1 ['i •+ I.I s. \ 4. s IS l. I .. ~.1 9.'i [ { •+ q •S l.I . " It ,I
C.ONtllJI!~ SUu.N~"-'(
"''"· Co.... l ........ •io.. (c. r.J 1.1.- C::f!..!..r '1:!·
o. 014- 1'-.11
L o.og,._ 11..11
o. oii. 1,.li
4. 0, 111 Lt.t.i
SUMMARY OF CONCRETE PARAPET DESIGN
A. 67
T•'l'•l. <:4JT" IA/~ •IL.~.
U· + .10
14. l. 1.10
t&.!. 11.\0
i+.S 11.1;
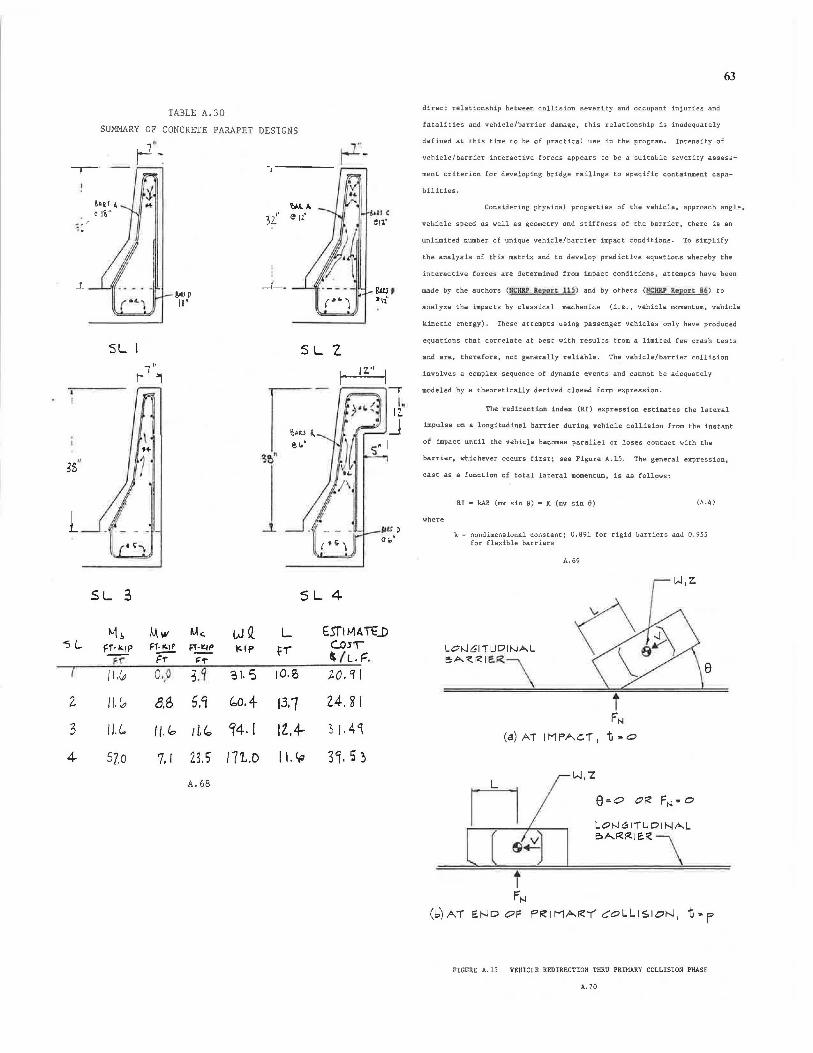
_j_
"5 L
2.
3
4
TABLE A.30
SUMMARY OF CONCRETE PARAPET DESIGNS
7'' 1~ i-1'-
-,------
_j __
SL SL '2. l'' r- ____,
SL 3 SL 4
tvt b Mw Mc. w Q. L E.STI MA Tt..D Ff·1<.1P Ff-IC.IP FT-l:IP IC: If' t'T" C..Os\ ~ Fr ~~ $. /L. F. 11.1,i o.,o 3.~ ~I. 5 10.B J.O. '1 I
JI.(,, 8.6 5.9 bO.f 13.7 24.~I
11.i.. I/. lo r lf.~ 94-1 ll.4- ) 1. 4 'I
szo 7.1 23. 5 /7t.D 11. ~ 31. s; A.68
63
direct t"elationship between collision severity and occupant injuries and
fatalities and vehicle/barrier damage, this relationship is inadequately
defined at this time to be of practical use in the program. Intensity of
vehicle/barrier interactive forces appears to be a suitable severity assess-
ment criterion for developing bridge railings to specific containment capa-
bilities.
Considering physical properties of the vehicle, approach angle,
vehicle speed as well as geometry and stiffness of the barrier, there is an
unlimited number of unique vehicle/barrier impact conditions. To simplify
the analysis of this matrix and to develop predictive equations whereby the
interactive forces are determined from impact conditions, attempts have been
made by the authors (~CHAP R.~porc lll) and by others (NCHilP Repo.::1: 86) to
analyze the impacts by classical mechanics (!. e., vehicle momentum, vehicle
kinetic energy). These attempts using passenger vehicles only have produced
equations that correlate at best with results from a limited few crash tests
and are, therefore, not generally reliable. The vehicle/barrier collision
involves a complex sequence of dynamic events and cannot be adequately
modeled by a theoretically derived closed form expression.
The redirection index (RI) expression estimates the lateral
impulse on a longitudinal barrier during vehicle collision from the instant
of impact until the vehicle becomes parallel or loses contact with the
barrier, whichever occurs first; see Figure A.15. The general expression,
cast as a function of total lateral momentum, is as follows:
where
RI • kAB (mv sin 0) • K (mv sin 6) (A.4)
k = nondimensional constant; 0.891 for rigid barriers and 0.955 for flexible barriers
A. 69
LOIJ61TUDINAL ~,..._!<:.~IE.~\ a
t F'N
(a) AT 11'1 PA.c:r, t-o
11 W, 'Z
e=o Of<? FN- 0
LON61'TLJDI NAL
( s4 e.A.~f<.IE.R
t fN
(bJ AT E~D OF PRI MAR'( COLLISION, t = F'
FIGURE A. 15 VEHICLE REDIRECTION THRU PRIMARY COLLISION PHASE
A. 70
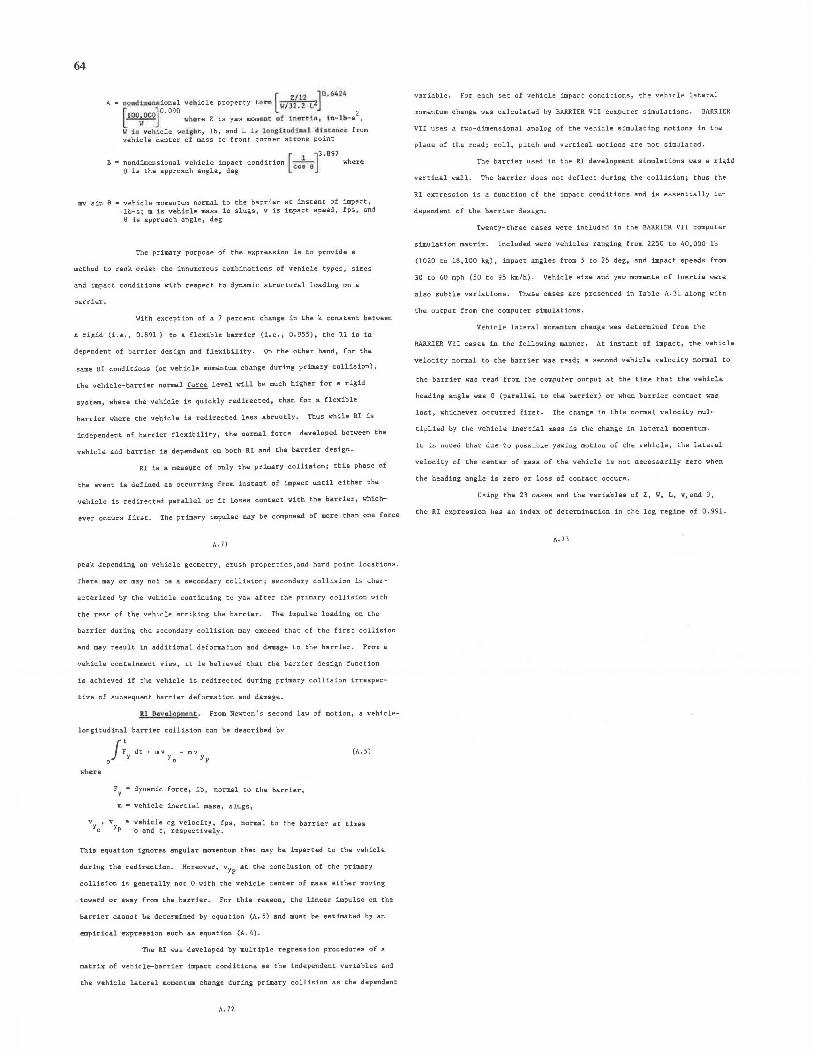
64
[ Z/12 ~J0.6/.2~
A • nonditll!M ional veh icle property t om ~
[100 oooJ0
· 090 z ~ whare Z is yaw mome.nc of in111c tia 1 in ... lb-s ,
~~ 1.s vehicle wo.Jf!h t, lb, and L is longitud'innl dii11 unc:ci from vehicle center of mass to front earner strong point
[ l ] 3.697
B "" nondimensional vehicle impact condition co• a where 8 is the approach angle, deg
sin 0 '"" vehicle momentum normal to the barrier at instant of impact, lb-s; m is vehicle mass in slugs, v is impact speed, fps, and 8 is approach angle, deg
The primary purpose of the expression is to provide a
method to rank order the innumerous combinations of vehicle types, sizes
and impact conditions with respect to dynamic structural loading on a
barrier.
With exception of a 7 percent change in the k constant between
a ri~id (i.!.., 0.891) to a flcxibl!. barrier (Le,. 0.955), the Ill io in
dependent of bat't'iet' design and flexibility. On the other hand, fot' the
same RI conditions (ot' vehicle momentum change during primary collision),
the vehicle-barrier normal force level will be much higher for a rigid
system, where the vehicle is quickly redirected, than for a flexible
barrier where the vehicle is redirected less abruptly. Thus while RI is
independent of barrier flexibility, the normal force developed between the
vehicle and barrier is dependent on both RI and the barrier design.
RI is a meae1,1re of only the primary collisionj this phase of
the event is defined as occurring from instant of impact until either the
vehicle is redirected parallel or it loses contact with the barrier, which-
ever occurs first. The primary impulse may be composed of more than one force
A. 71
peak depending on vehicle geometry, crush properties,and hard point locations.
There may or may not be a secondary collision; secondary collision is char-
acterized by the vehicle continuing to yaw after the primary collision with
the rear of the vehicle striking the barrier. The impulse loading on the
barrier during the secondary collision may exceed that of the first collision
and may result in additional deformation and damage to the barrier. From a
vehicle containment view, it is believed that the barrier design function
is achieved if the vehicle is redirected during primary collision irrespec-
tive of subsequent barrier deformation and damage.
kl D11.vil!llapa111:inc.. From Newton 1 s second law of motion, a vehicle-
longitudinal barrier collision can be described by
0
where
f :y dt - mv yo Yp
FY • dynamic force, lb, normal to the barrier,
m • vehicle inertial mass, slugs,
(A. S)
Thie equation ignores angular momentum that may be imparted to the vehicle
during the redirection. Moreover, vYp at the conclusion of the primary
collision is generally not 0 \i'ith the vehicle center of mass either moving
toward or away from the barrier. For this t"eaeon, the linear impulse on the
barrier cannot be determined by equation (A. S) and must be estimated by an
empirical expression such as equation (A. 4).
The RI was developed by multiple regression procedures of a
matrix of vehicle-barrier impact conditions as the independent variables and
the vehicle lateral momentum. change during primary collision as the dependent
A. 72
variable. For each set of vehicle impact conditions, the vehicle lateral
momentum change was calculated by BARRIER VII computer simulations. BARRIER
VII uses a ti;.;io-dimensional analog of the vehicle simulating motions in the
plane of the road; roll, pitch and vertical motions are not simulated.
The barrier used in the RI development simulations was a rigid
vertical wall. The barrier does not deflect during the collision; thus the
RI expression is a function of the impact conditions and is essentially in-
dependent of the barrier design.
Twenty-three cases were included in the BARRIER VII computer
simulation matrix. Included were vehicles ranging from 2250 to 40,000 lb
(1020 to 18,100 kg). impact angles from 5 to 25 deg, and impact speeds from
30 to 60 mph (50 to 95 lan/h), Vehicle size and yaw moments of inertia were
also subtle variations. These cases are presented in Table A. 31 along with
the output from the computer simulations.
Vehicle lateral momentum change was determined from the
BARRIER VII cases in the following manner. At instant of impact, the vehicle
velocity normal to the barrier was read; a second vehicle velocity normal to
the barrier was read from the computer output at the time that the vehicle
heading angle was 0 (parallel to the barrier) or \i'hen barrier contact was
lost, whichever occurred first. The change in this normal velocity mul-
tiplied by the vehicle inertial mass is the change in lateral momentum.
It. is noi::~d th.at due to possible yawing motion uf the vehicle, the lateral
velocity of the center of mass of the vehicle is not necessarily zero when
the beading angle is zero or loss of contact occurs.
Using the 23 cases and the variables of Z, W, L, v, and 8,
the RI expression has an index of determination in the log regime of 0. 991.
A. 73
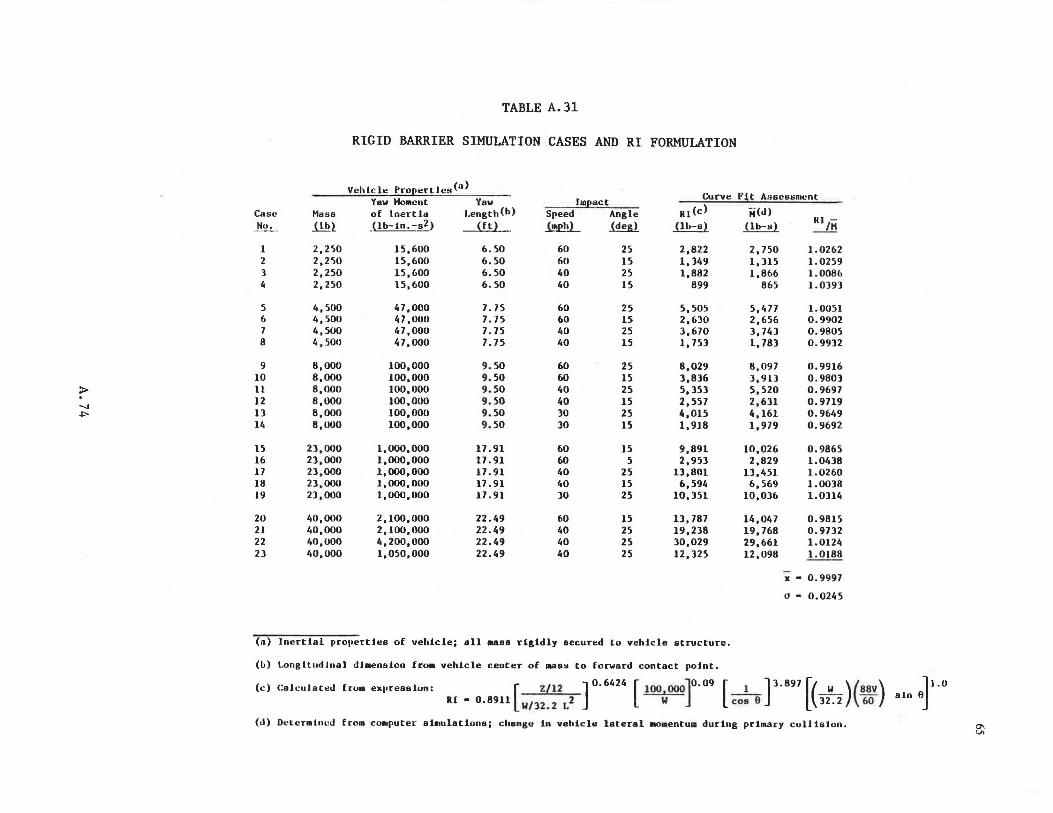
TABLE A.31
RIGID BARRIER SIMULATION CASES AND RI FORMULATION
Vchlcle Prnl!ertlcs<a) Curve Ftt Assessment Yaw Moment Yaw J1111!act
RI(c) Case Hase of Inertia l.ength(b) Speed Angle lf(J) Rl/H No. fill (lb-tn.-s2) ~ft} ~ ~ ~ (lb-s}
1 2,250 15,600 6.50 60 25 2,822 2,750 I. 0262 z 2,250 15,600 6.50 60 15 1,349 1,315 1. 0259 3 2,250 15,600 6.50 40 25 1,882 1,866 1.0086 4 2,250 15,600 6.50 40 15 899 865 1.0393
5 4,500 47,000 1.15 60 25 5,505 5,477 1.0051 6 4, .soo 47,000 1.15 60 15 2,630 2,656 0.9902 7 4,500 47,000 1.15 40 25 3,670 3,743 0.9805 8 4,500 47,000 1.15 40 15 1,753 1,783 0.9932
9 8,000 100,000 9.50 60 25 8,029 8,097 0.9916 10 8,000 100,000 9.50 60 15 3,836 J,913 0.9803
> 11 8,000 100,000 9.50 40 25 5,353 5,520 0.9697 12 8,000 100,000 9.50 40 15 2,557 2,631 0.9719 ...., ll 8,000 100,000 9.50 30 25 4,015 4,161 0.9649 """ 14 8,000 100,000 9.50 30 15 1,918 1,979 0.9692
15 21,000 1,000,000 17.91 60 15 9,891 10,026 0.9865 16 23,000 1,000,000 17.91 60 5 2,953 2,829 1.0438 17 23,000 1,000,000 17.91 40 25 13,801 13,451 1.0260 18 23,000 1,000,000 17.91 40 15 6,594 6,569 1.0038 19 23,000 1,000,000 17.91 JO 25 10,351 10,036 1.0314
20 40,000 2,100,000 22.49 60 15 ll,787 14,047 0.9815 21 40,000 2,100,000 22.49 40 25 19,238 19,768 0.9732 22 40,000 4,200,000 22.49 40 25 30,029 29,661 1.012/i 2) 40,000 1,050,000 22.49 40 25 12,325 12,098 1. 0188
'i - 0.9997
0 - 0.0245
(a} Inertial pi:opertiee of vehicle; all aass rigidly secured to vehicle structure.
(b) l.onglludlnal JJ111enston froa vehicle center of niae" to for-ward contact point.
(c) Colculat.,J hum expr-eeeion: [ Z/l2 ] 0.6424 [ l00,000]°.09 [-l ]3.897 [(-W )(8SV) RI • 0.8911 W/3Z. 2 L2 W cos 6 32.2 60
(J) Delcnd1wJ hon coaiputer- ei111ulations; change in vehicle lateral MOaentua during pr-tnar-y collision.
li.o sin 9J
Cf\ ..,,
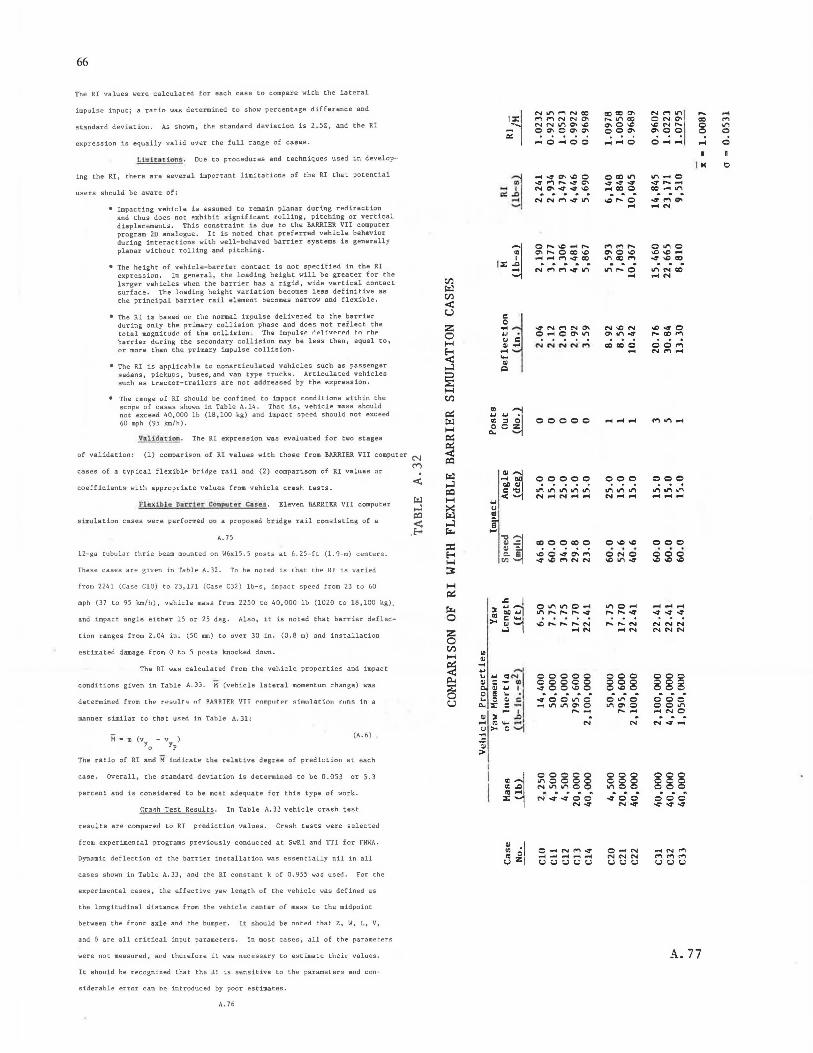
66
The RI values were calculated for each case to compare with the lateral
impulse input; a ratio was determined to show percentage difference and
standard deviation. As shown, the standard deviation is 2.5!1.:, and the RI
expression is equally valid over the full range of cases.
t.i•itDCionil. Due to pt'ocedures and techniques used in develop-
ing the RI, there are several important limitations of the RI that potential
users should be aware of:
• Impacting vehicle is assumed to remain planar during redirection and thus does not exhibit significant rolling, pitching or vertical displacements. This constraint is due to the BARRIER VII computer program 2D analogue. It is noted that preferred vehicle behavior during interactions with well-behaved barrier systems is generally planar without rolling and pitching.
• The height of vehicle-barrier contact is not specified in the RI expression. In general, the loading height will be greater for the larger vehicles when the barrier has a rigid, wide vertical contact surface. The loading height variation becomes less definitive as the principal barrier rail element becomes narrow and flexible.
• The RI is based on the normal impulse delivered to the barrier during only the primary collision phase and does not reflect the total magnitude of th"' collision , The impuhP rlPl ivPrPrl t"n t"hP barrier during the secondary collision may be less than, equal to, or more than the primary impulse collision.
• The RI is applicable to nonarticulated vehicles such as passenger sedans, pickups, buses, and van type tt'ucks. Articulated vehicles such as tractor-trailers are not addressed by the expression.
• The range of RI should be confined to impact conditions within the scope of cases shown in Table A. 14. That is, vehicle mass should not exceed 40,000 lb (18,100 kg) and impact speed should not exceed 60 mph (95 km/h).
Valida.Uon. The RI expression was evaluated for two stages
of validation: (1) comparison of RI values with those from BARRIER VII computer N
cases of a typical flexible brid,g;e rail and (2) comparison of RI values
coefficients with appropriate values from vehicle crash tests.
Flex ib l e DaTritn· Cociputer Caee.s. Eleven BARRIER VII computer
simulation cases were performed on a proposed bridge rail consisting of a
A. 75
12-ga tubular thrie beam mounted on W6xl5.5 poses at 6.25-fc (l.9-m) centers.
Thes e cases are given in Table A. 32. To be noted is chat the Rl is varied
from 2241 (Case ClO) to 23,171 (Case C32) lb-s, impact speed from 23 to 60
mph (37 to 95 km/h), vehicle mass from 2250 to '40,000 lb (1020 to 18,100 kg),
and impact angle either 15 or 25 deg. Also, it is noted that barrier deflec-
t.ion ranges from 2.0'4 in. (SO IIDll) to over 30 in. (0.8 m) and installation
estimated damage ft"om 0 to 5 posts knocked down.
The RI was calculated from the vehicle properties and impact
conditions given in Table A. 33. H (vehicle lateral momentum. change) was
determined from the result'5 Qf RARRTf.R VTT rnmpnt:Pr f'limn1at1on runs in a
manner si.Jllilar to that used in Table A. 31:
M • m (vy0
- v ) Yp
(A. 6)
The ratio of RI and M indicate the relative degree of prediction at each
case. Overall, the standard deviation is decetillined to be 0.053 or 5.3
percent and is considered to be most adequate for this type of work.
Crash Test Results. In Table A.33 vehicle crash test
results are compared to RI prediction values, Crash tests were selected
from experimental programs previously conducted at SwRI and TTI for FHWA.
Dyn.,mic deflection of the barrier installation was essentially nil in all
cases shown in Table A. 33, and the RI constant k of 0. 955 was used . For the
experimental cases, the effective yaw length of the vehicle was defined as
the longitudinal distance from the vehicle center of mass to the midpoint
between the front axle and the bumper. It should be noted that Z, W, L, V,
and 6 are all critical input parameters. In most cases, all of the parameters
were not measured, and therefore it was necessary to estimate their values.
It should be recognized that the RI is sensitive to the parameters and con-
stderable error can be intt"oduced by poor estimates.
A. 76
(""')
<
I x:I _....., =i
- ~ = .c ...
fx: ~
~1 rJ c ~ .... .... ... ~
i:>
., .., ..,~ "' " 0 0 c :z ....
~~ c""' < ... rJ ! a ..... 1] ~ -
... Ei
"'
>~~ "' c ..... > ~ ...l
.. ~ ..... .., ... .., "'11 ~ :: - 0)
ol~ ~ """ 0 CJ c ... x: = -
"' I ~ > .c ~ r: .......... rJ > c ..... :; >
~~ "' ..... x:
~ ol Cl)
"' z1 u
N 1.1"\t""'INCIO .., .., "' N '"'"'I
.... .... ("""if"'IN N Cl'\ .... "'co 0 N °' co .., N NI.I"\°' ..C "'0"' >C N .... 0 "' 0"' 0 "'"' oo"' "'0 0 0 0
,.... o ...... c::> o ~...:o 0 ......... ....; 0 I
I M 0
... ..,.O\\CO 0..,"' .,., .... o ~ ~,.....:tC'\ ...,....,....,. ...,. ....... N0\4..,....0 .... co 0 00 - "' . . . . . . . . N Nr"l...,-&t"\ "',... 0 ...,. .., "' ... .......
0,.....C ""'"',... .., .., ..... o"'o Cf'l,....OCC...C "'o"' "'"' .... """"~,..,..,.co "'00.., .... "'Cl) . . . . . N ("""it-'\-:f&t"\ .,., .... o "'N 00 .... .........
4N C""'IN 0\ N >Q N "'""" 0 O"" Oil'"' "'"' ... .... 00..,
NNNNM .., 00 0 0 0 .., .... N '°'""
00000 .............. .., "' .....
00000 000 000 ... &I"\"""'"""" "'"'"' "'"'"' N~N_..~ .......... ..............
Cl) 0 000 0 Q>Q>Q 000 ..... 000 liD 0 ""7 °' f'l""I ONO ..:T\iC r-"\NN "'"' .... "'"'"'
0"'"'0""' "'o,.... ............. ....... ,.... ,.... ,.... '4' ............. ...,. ...,. ..:r liD ,....,....,....N .............. N NN .......... .... ..... NNN
00000 888
000 00000 000 ...,. o o"' o O>Q o 000
..;oo~c 0 "' 0 000 ~ "'irr.~o
"'"' 0 0 0 "' ......... ..... .... ..... N 0 ..; ..; ..... .... _
s;gggo 000 000
N"'"' 08 000 000 "'0 0 000 . . . .. .. . . .
N -4'..,. 0 0 ..:r 0 0 000 ..... ...,. N -<r ...::~..,.
0 ,...N l"""l..:t 0"" N """'N ~ ... -......... N N N .., .., .., u (,.):.,)I,; u uuu uu~
A. 77
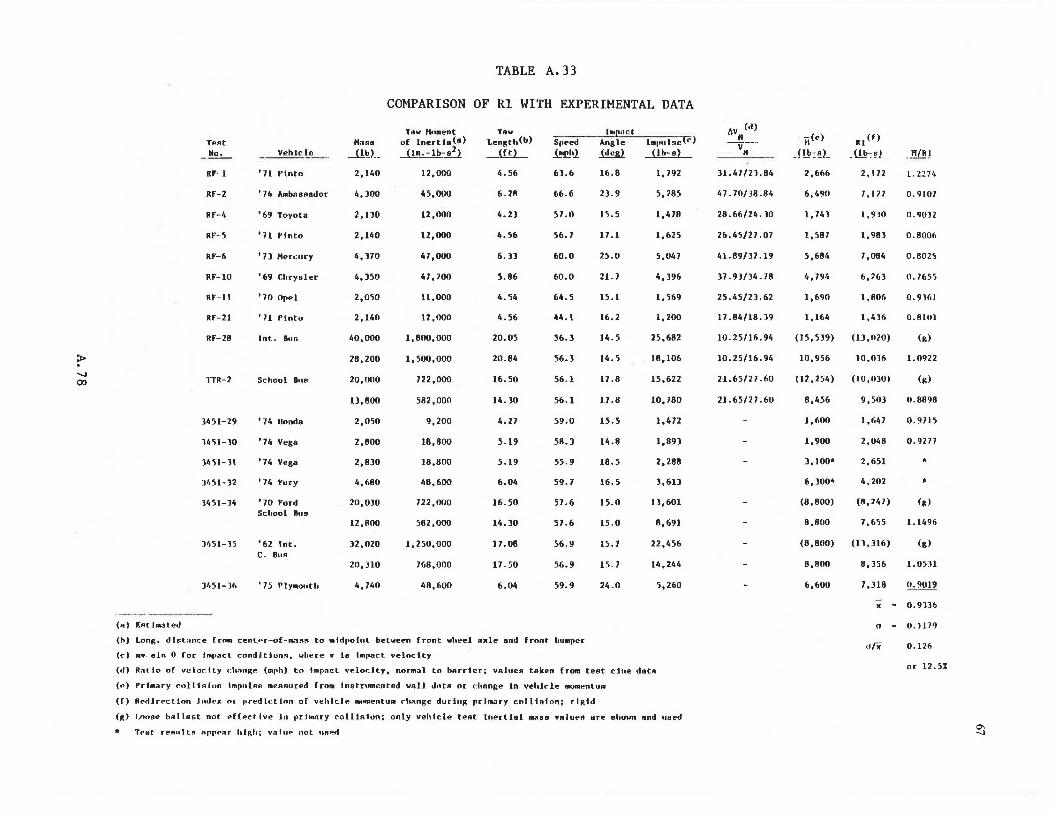
?-....., CX>
TABLE A. 33
COMPARISON OF RI WITH EXPERIMENTAL DATA
TP.~t
_ .!!'!.:...._
RF-1
RF-2
RF-4
RF-5
RF-6
RF-10
RF-11
RF-21
RF-28
TTR-2
14'.H-29
1451-10
1451-Jl
1451-12
1451-14
Jlt51-l5
1451-')6
(11) l':Atlmated
_ Vehtc~e __ _
'H rlnto
'74 11 .. bnsAador
'69 Toyota
'H Pinto
'71 Hen:ury
'69 Chrysler
'70 Opel
'71 Pinto
lnt . Bus
School BnR
'74 llonda
• 74 Vega
•74 Vega
• 74 Fury
'70 Ford School Bus
'62 lnt. c. 8119
'75 Ply•ooth
Hnse
_lit._)._
2,140
4,JOO
2,110
2,HO
4,170
4,J50
2,050
2,140
40,000
28,200
20,000
ll,800
2,050
2,800
2,8]0
4,680
20,010
12,600
12,020
20,HO
4, 740
Yaw Ho•ent u( lnertJa(a) _i!_n.-lb-fl
12,000
45,000
12,000
12,000
47,000
0,700
11,000
12,000
1,800,000
1, 500,000
722,000
582,000
9,200
18,800
18,800
48,600
722,000
582,000
1,250,000
768,000
4R,600
Yaw Length(b)
_{!_IJ_
4.56
6.2R
4.21
li.56
6.]]
5.86
4.54
4.56
20.05
20.84
16.50
14.10
4.27
5.19
5.19
6.04
16.50
14.10
J 7 .08
17.50
6.04
Sp Ped
~J!.1'1
61.6
66.6
57.0
56.7
60.0
60.0
6". 5
.r,4.1
56.J
56.l
56.l
56.1
59.0
58.)
55.9
59.7
57.6
57.6
56.9
56.9
59.9
(h) Long. distance f['OIR cent.Pr-of-masR to •tdrotnt between front wheel 11xle and front hu•rer
(C') 11v- eJn 0 for ha.,act condJtjon!l, where v le tmpact velocity
hopact Angle lmpulAelC)
~ _J.!!!:.!.L_
16.8 l, 792
2].9 5,285
15.5 1,478
17.l 1,625
25.0 5,047
21. 7 4,196
n.1 1,569
16.2 1,200
)4.5 25,682
14.5 18,106
17 .8 15,622
17.8 10, 780
15.5 1,472
14.8 1,89)
18.5 2,288
16.5 J,61J
15.0 ll,601
15.0 8,691
15.7 22,456
15.7 14,244
24.0 5,260
(11) RsHio or vcloc.lty ch:1ngP. (mph) to t • pitct velocJty, normal to b11rrter; vRlues taken from test clue datR
(r.) Prtn1ary collision lmpulAe meRRured fro• Instrumented wall d1Ha or c:hnnge ln vehlC'le 111omentun1
(f) RE'dlr~cllon lnd~x or prediction of vehicle ""'"'entum rh1'nge during prJm.,ry colltolon; rlRid
(g) tooee hitl lest not efff!ct Ive Jn pr hmry colftston; only vehicle teRt inertial 111a.es VRlueA are shown Rnd used
• Tr~t reAultR Aprf'"rtT hJp,h; v.ilur not llfl~d
/IV (d) ___!! v--
N
Jl.47/21.84
47. 70/J8 .84
28.66/24.10
26.45/27.07
41.89/17.19
17. 91/)4. 78
25.45/2).62
17.84/18.19
10.25/16.94
10.25/16.94
21.65/27 .60
21.65/27.60
tic"> J !!>:".L
2,666
6,490
1,741
1,587
5,684
4,794
I ,690
1,164
(15,519)
10,956
(12,254)
8,456
1,600
1,900
1,100•
6,JOO*
(8,800)
8,800
(8,800)
8,ROO
6,600
Rl(f)
J.!!?::~L
2,172
7. 127
1,910
1,98)
7,084
6,26)
1,806
1,416
(IJ,020)
10,0)6
(I0,010)
9,501
1,647
2,048
2,651
4,202
(8,247)
7,655
(11,316)
8,156
7,118
. !!L!! !
l. 2274
0.9107
0.9012
0.8006
0.8025
0.7655
0.9161
0.81111
(g)
1. 0922
<11>
0.8898
0.9715
o. 9277
(g)
1.1496
(g)
l.ll5Jl
0.9019
x ~ 0.9116
(J 0.1179
(J{i 0.126
or 12.5%
~
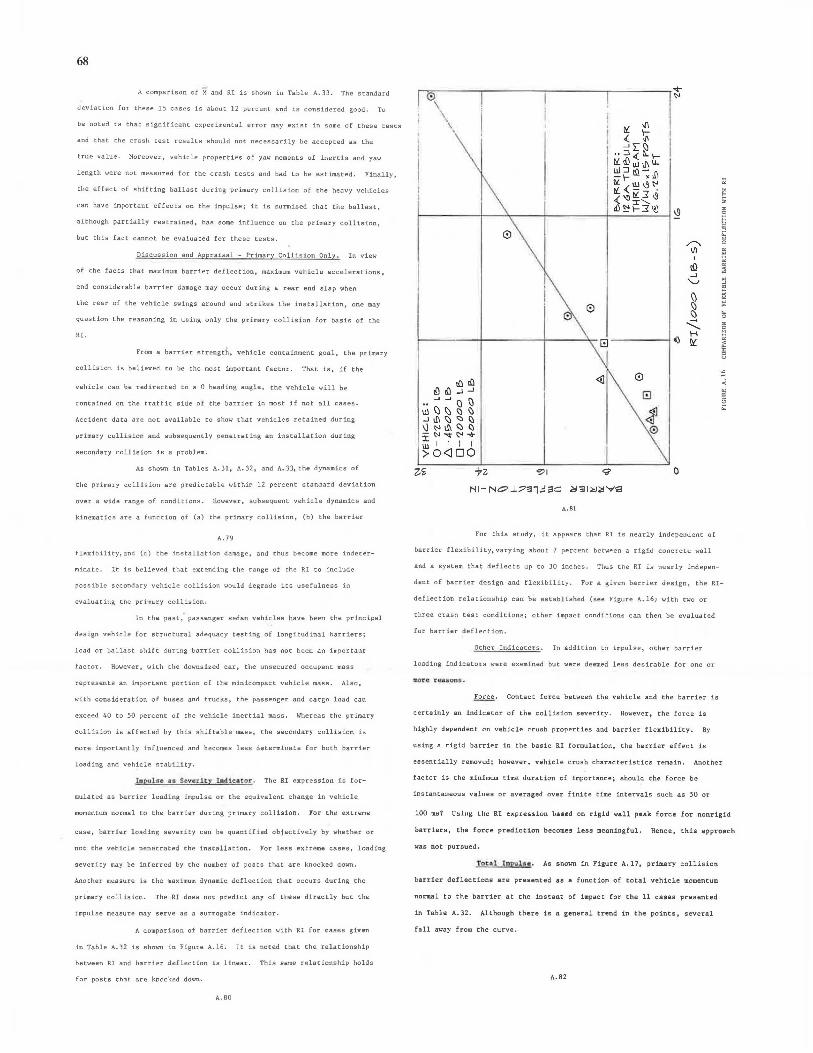
68
A comparison of M and RI is shown in Table A. 33. The standard
deviation for these 15 cases is about 12 percent and is considered good. To
be noted is that significant experimental error may exist in some of these tests
and that the crash test results should not necessarily be accepted as the
true value. Moreover, vehicle properties of yaw moments of inertia and yaw
length we.re not measured for the crash tests and had to be estimated. Finally,
the effect of shifting ballast during primary collision of the heavy vehicles
have important effects on the impulse; it is surmised that the ballast,
although partially restrained, has some influence on the primary collision,
but this fact cannot be evaluated for these tests.
Discussion and Appraisal - Primary Collision Only. In view
of the facts that maximum barrier deflection, maximum vehicle accelerations,
and considerable barrier damage may occur during a rear end slap when
the rear of the vehicle swings around and strikes the installation, one may
question the reasoning in using only the primary collision for basis of the
RI.
' From a barrier strength, vehicle containment goal, the primary
collision is believed to be the most important factor. That is, if the
vehicle can be redirected to a 0 heading angle, the vehicle will be
contained on the traffic side of the barrier in most if not all cases.
Accident data are not available to show that vehicles retained during
primary eollision and subsequently penetrating an installation during
seeonda"ry collision is a problem.
As shown in Tables A. 31, A. 32, and A. 33, the dynamics of
the primary collision are predictable within 12 percent standard deviation
over a wide range of conditions. H.owever, subsequent vehicle dynamics and
kinematics are a function of (a) the prima"ry collision, (b) the bat'rier
A.79
flexibility, and (c) the installation damage, and thus become more indeter-
rninate. It is believed that extending the "range of the RI to include
possible secondary vehicle collision would degrade its usefulness in
evaluating the primary collision.
In the past, ' passenger sedan vehieles have been the principal
design vehicle for structural adequacy testing of longitudinal barriers;
load or ballast shift during barrier collision has not been an important
factor. However, with the downsized car, the unsecured occupant mass
represents an important portion of the minicompact vehicle mass. Also,
with consideration of buses and trucks, the passenger and ca"Cgo load can
exceed 40 to 50 percent of the vehicle inertial mass. Whereas the prima"Cy
collision is affected by this shiftable mass, the secondary collision is
more importantly influenced and becomes less determinate for both barrier
loading and vehicle stability.
hnpulllo •• Scvertc.y tndicator. The RI expression is for-
mutated as barrier loading impulse or the equivalent change in vehicle
momentum normal to the barrier during primary collision. l"or the exLr~ml::!
case, barrier loading severity can be quantified objectively by whether or
not the vehicle penetrated the installation. For less extreme cases, loading
severity may be inferred by the number of posts that are knocked down.
Another measure is the maximum dynamic deflection that occurs during the
primary collision. The RI does not predict any of these directly but the
impulse measure may serve as a surrogate indicator.
A compa"rison of barrier deflection with RI for cases given
in Table A. )2 is shown in Figure A.16. It is noted that the relationship
between RI and barrier deflection is linear. This same relationship holds
for posts that are knocked down.
A. 80
0 \
.q-<:"
ti'. "' < ~ -' 'L \:'.l .. :::J < ~\-
l:l d) u.J ll\ u.. ~~lil-;J\ l\l Ill \9 t' ll<i£:s ~ <('-:l ' '°~~:::;:~ 19
/"'\
"' tO -' '-'
0 & \}
-.::::.. d,)
H til
0 [!]
~ 0
9 0
A.8l
For this study, it appears that RI is nearly independent of
barrier flexibility, varying about 7 percent between a rigid conc"Cete wall
and a system that deflects up to JO inches. Thus the RI is nearly indepen-
;;:
"' ... ; z
~ ~
~ ;l .., :;l
~ ~ 0
~ < i:: 8
! < ~
" ~
dent of barrier design and flexibility. For a given barrier design, the RI-
deflection relationship can be established (see Figure A.16J with two or
three crash test eonditions; other impact conditions can then be evaluated
for barrier deflection.
Other Indicators. In addition to impulse, other barrier
loading indicators were examined but were deemed less desirable for one
~· Contact force between the vehicle and the barrier is
certainly an indicator of the collision severity. However, the force is
highly dependent on vehicle crush properties and barrier flexibility, By
using a rigid barrier in the basic RI formulation, the barrier effect is
essentially removed; however, vehicle crush characteristics remain. Another
factor is the minimum time duration of importance; should the force be
instantaneous values or averaged over finite time intervals such as 50 or
100 mi:.? UsluK Liie RI cApl:t:ulon Uaaed on rigid wall peak force for nonrigid
barriers, the force prediction becomes less meaningful. Hence, this approach
was not pursued.
Tat.al lmpuba. As sho\m in Figure A.17, primary collision
barrier deflections are presented as a function of total vehicle momentum
normal to the barrier at the instant of impact for the 11 cases presented
in Table A. 32 . Although there is a general trend in the points, several
fall aYay from the curve.
A.82
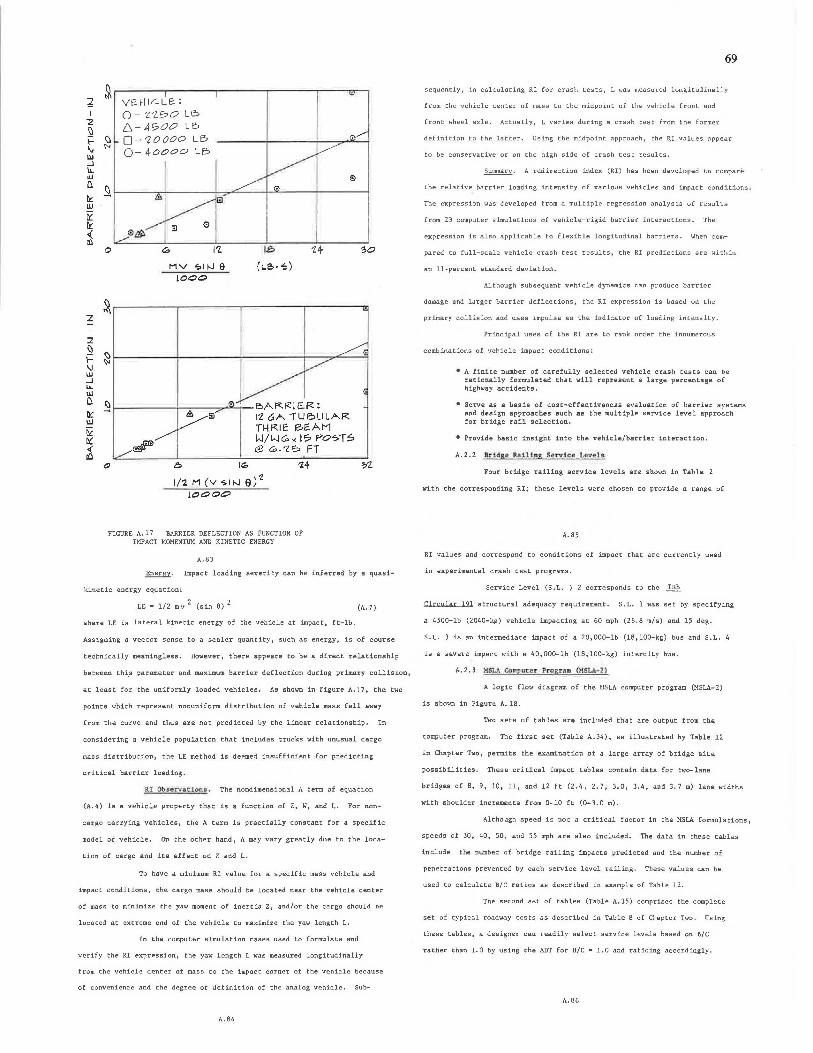
~ ~
VE.HIL:.LE.: I 0 - Z'LSO Le-
"2 6-4000 Le> ~ I- <::. 0-'20000 LB
" t'< 0- 40000 LE> w
..J 11. Ill 0 [i
~ t't. UJ ti'." ~ 1:1 0 <l. 0(/t, Ill
0 a. l'Z lb H ~o
MV ?tf.J 0 (L.e.- ~) 1000
~ z I
2 ~
~ ~ \J
~
uJ ...J LL uJ Cl .5l e>A~RIEO.R: l\:: IZ 6A IU !?LI LAR UJ
~ THl<:lf: 13E.AM
ti'.'. , W/W<'.D~ I!:> PO°"i:O. < e co.-zi;, FT rO
0 e, I~ 'Z4 ?>'Z
l/'2 M (v '>lt-J 0) 2
10000
FIGURE A.17 BARRIER DEFLECTION AS FUNCTION OF IMPACT MOMENTUM AND KINETIC ENERGY
A.83
Energy. Impact loading severity can be inferred by a quasi-
kinetic energy equation:
LE • 1/2 mv 2
(sin 8) 2 (A. 7)
where LE is lateral kinetic energy of the vehicle at impact, ft-lb.
Assigning a vector sense to a scaler quantity, such as energy, is of course
technically meaningless. However, there appears to be a direct relationship
69
sequently, in calculating RI for crash tests, L was measured longitudinally
from the vehicle center of mass to the midpoint of the vehicle front and
front wheel axle. Actually, L varies during a crash test from the former
definition to the latter. Using the midpoint approach, the RI values appear
to be conservative or on the high side of crash test results.
Summary. A redirection index (RI) has been developed to compare
the relative barrier loading intensity of various vehicles and impact conditions.
The expression was developed from a multiple regression analysis of results
from 23 computer simulations of vehicle-rigid barrier interactions. The
expression is also applicable to flexible longitudinal barriers. When com-
pared to full-scale vehicle crash test results, the RI predictions are within
an !!-percent standard deviation.
Although subsequent vehicle dynamics can produce barrier
damage and larger barrier deflections, the RI expression is based on the
primary collision and uses impulse as the indicator of loading intensity.
Principal uses of the RI are to rank order the innumerous
combinations of vehicle impact conditions:
• A finite number of carefully selected vehicle crash tests can be rationally formulated that will represent a large percentage of highway accidents.
• Serve as a basis of cost-effectiveness evaluation of barrier systems and design approaches such as the multiple service level approach for bridge rail selection.
• Provide basic insight into the vehicle/barrier interaction.
A. 2. 2 8t"i dse R.a t llng SM'\'!Cll!I Lc·v&.a
Four bridge railing service levels are shown in Table 2
with the corresponding RI; these levels were chosen to provide a range of
A.85
RI values and correspond to conditions of impact that are currently used
in experimental crash test programs.
Service Level (S.L. ) 2 corresponds to the ..,'.!!!__
Circular 191 structural adequacy requirement. S.L. 1 was set by specifying
a 4500-lb (2040-kg) vehicle impacting at 60 mph (26.8 m/s) and 15 deg.
S.L. 3 is an intermediate impact of a 20,000-lb (18,100-kg) bus and S.L.
is a severe impact with a 40,000-lb (18,100-kg) intercity bus.
between thi_s parameter and maximum barrier deflection during primary collision, A.2.3 Y.SU. Ce:a:put e.t Prograa:a (:151.A- '2)
at least for the uniformly loaded vehicles. As shown in Figure A.17, the two A logic flow diagram of the HSLA computer program (MSLA-2)
points which represent nonuniform distribution of vehicle mass fall away is shown in Figure A. 18.
from the curve and thus are not predicted by the linear relationship. In Two sets of tables are included that are output from the
considering a vehicle population that includes trucks with unusual cargo computer program. The first set (Table A.34), as illustrated by Table 12
L'lass distribution, the LE method is deemed insufficient for predicting in Chapter Two, permits the examination of a large array of bridge site
critical barrier loading. possibilities. These critical impact tables contain data for two-lane
RI Ob.si=r:"V.at.JOD.B. The nondimensional A term of equation bridges of 8, 9, 10, 11, and 12 ft (2.4, 2.7, 3.0, 3.4, and 3.7 m) lane widths
(A. 4) is a vehicle property that is a function of Z, W, and L. For non- with shoulder increments from 0-10 ft (0-3.0 m).
cargo carrying vehicles, the A term is practially constant for a specific Although speed is not a critical factor in the MSLA formulations,
model of vehicle. On the other hand, A may vary greatly due to the loca- speeds of 30, 40, 50, and 55 mph are also included. The data in these tables
tion of cargo and its effect on Z and L. include the number of bridge railing impacts predicted and the number of
To have a minimum RI value for a specific mass vehicle and penetrations prevented by each service level railing. These values can be
impact conditions, the cargo mass should be located near the vehicle center used to calculate B/C ratios as described in example of Table 12.
of mass to minimize the yaw moment of inertia Z, and/or the cargo should be The second set of tables (Table A. 35) comprises the complete
located at extreme end of the vehicle to maximize the yaw length L. set of typical roadway tests as described in Table 8 of Chapter Two. Using
In the computer simulation cases used to formulate and these tables, a designer can readily select service levels based on B/C
verify the RI expression, the yaw length L was measured longitudinally rather than 1.0 by using the ADT for B/C = 1.0 and ratioing accordingly.
from the vehicle center of mass to the impact corner of the vehicle because
of convenience and the degree of definition of the analog vehicle. Sub-
A.86
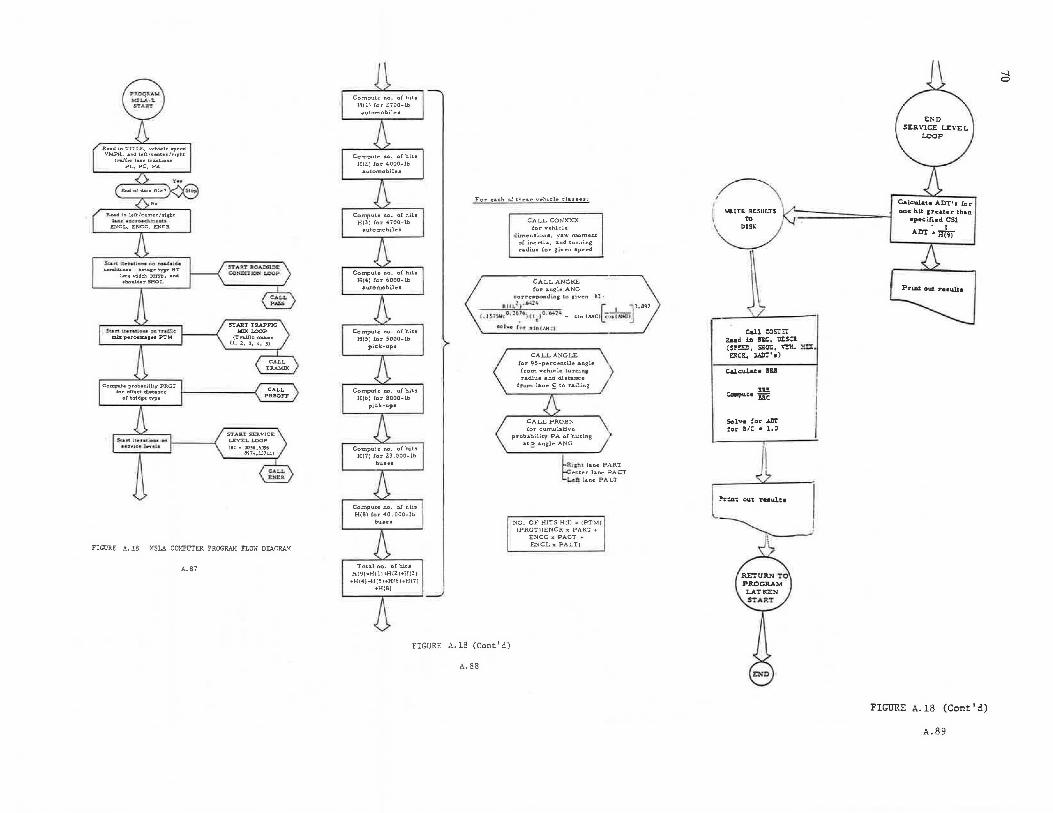
FIGURE A.18 MSLA COMPUTER PROGRAM FLOW DIAGRAM
A.87
For each o! thes e velui:le clas~e!I:
CA LL CONXXX !or vehlc:le
dirnen1ioru, yaw moment o! inertia. and turning radius !or given •peed
CALL ANGKE for &ngle ANG
c1;1rre1-ponding to Jil;'iven RI :
a1 u.h• 6"'2'' r I 134897
C. J57~-.o , J•~·l(l :r )0 . 6'.'21. • 'in (ANC)LC.,,. 1Allielj
M> h c- r11 1'" •l11 ( ANl:t)
CALL ANGLE !or 95-perc:entile angle Iroin vehic:lt1 turc.ing radiu1 aad d.i1tanc:e
!rom lane £ to railing
CALL PROBN !or cumulative:
probability PA oC hi..tting at~ angle ANG
La11tu lane PART ~er:ter lane PACT
Le tt. b.ne PA LT
NO. OF HITS H!I) : (PTM) (PRGT)(ENCR x PART+
ENCC x PACT + ENCL x PALTJ
FIGURE A.18 (Cont'd)
A.88
'~ ( \
WlllTE RESULTS TD
DISK
C&J.l cos::i: ilu.d in Bte. 'O!:SCB. (SP=, SBOC, ~II. ~. ~CR, JADT's)
C&lc'\ll&te JU
JIU ea.puce iiC
Solve !or A1Jt fo?' l/C • 1.0
fl
~rillt •~t <•lllu '
~ ~
C&lcu.late ADT 1 1 fer o.c.e hit 1reater tbaD.
•p•ci.fied CSI . l
Arrr • BT91
FIGURE A.18 (Cont'd)
A.89
-.J 0
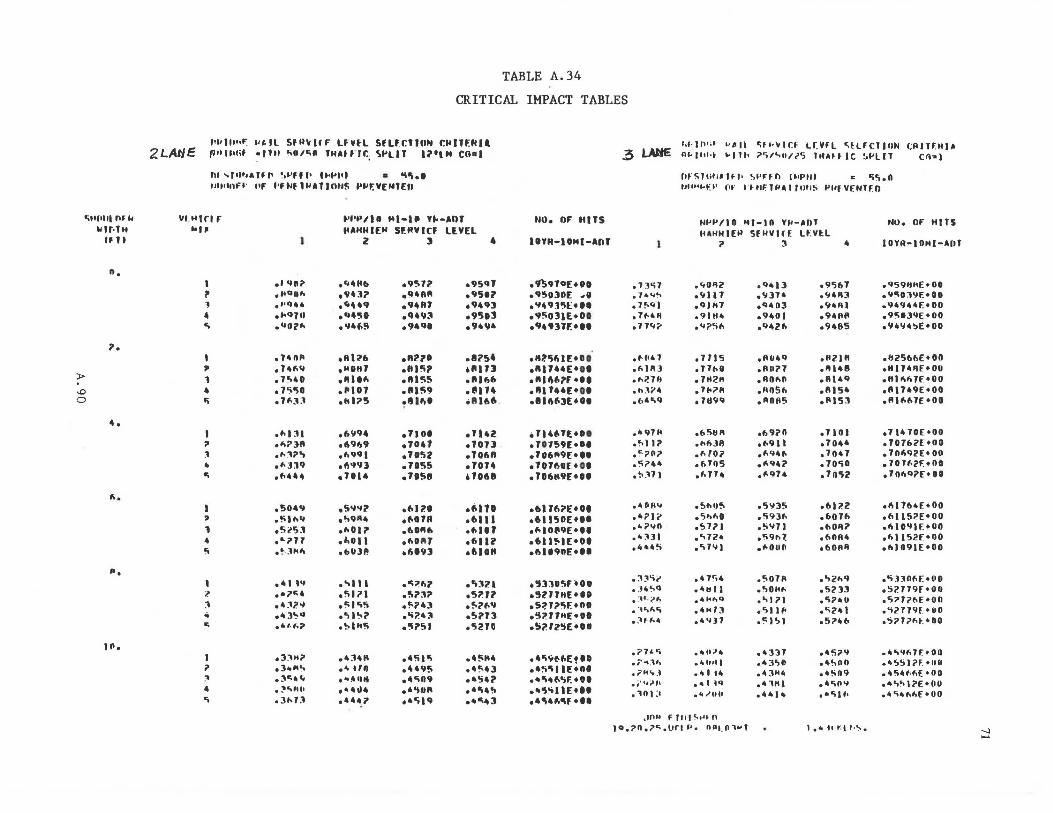
...... Ill l\J ..
)>
'° 0
I.I fr· TH IFU
n.
?.
4.
".
,. .
'".
TABLE A.34
CRITICAL IMPACT TABLES
2LAtlE f•IJlll••I' llt.ll Sfll~lfF lfvtl SflHTION f:lllTElfU p1111u;f •llH '>OIC-,n TNAff' lt: '>l'LIT l;"lN CO•I
nl -.111~1Alfl' ~,Vffl• l .. f'l•I • o;l\ol tJlt••nn· l•F' t•ftlf11111JOtl~ t'l>F;V[Nf[fl
YI M1rl f .. , J
•1~11• Ml-ll Y~-AbT ~AHNIEN SF.MVICf llV£L
' 1' l
• ...
, 1
• 'i
I , :1
• ..
It
1 4 ...
l
' .. ...
I ? '.1 .. ..
·' 'lni" .1<011,, ••• q ...
•"C1Ttl
·"02'"
o 14111' .l4fo'I .l .. 40 • T'i50 • Tf<J:t
•" 111 oli?~R
·"'"" ·"ll'J of.4••
o!iO•'I .Slhlf e!ii.'11).l ... ?11 • ~ .. l .. ,,
• 41 ,., .. ,. .... • •Ji'~ .... 3'>"
··'·~~
oJ:"H? oJ•M .. .3 .... .. . _:.-.. ... . • 3t. 1 ;\
z > •
·"""" ,'143? • ..... •Cf
•"''!iO ·"""'' oRl?6
·"""' ·""" ·"'01 o1tl75
• t.11Cf4 oi\969 •""'q I .,, .. .,J elOU
.s.,.,;o ,o;911.4
•"Oli' • l.11 I I obll)P.
.... , , • ... , i"I ......... ·"' ... ? .~IM'!i
o4l4K . .. "" •""''" . ... .,. . ... ..
0951?. • ct•llll oCf4111 .1a.9~
,94oan
.1111• ....... , olll!i5 ........ ~8lr.1
• 1101 ,J041 elO'iiP • TD'!i!i • TO!ill
oftli'O ,f.OTA o60R" eflORJ •fll9J
·"'""1 .!>?l? .!-?43 .o;?.•~
• '!i?!t I
..... , .. ·••95 o4"ift9 . ....... ·•"ilCf
o9SqJ ,9501 o94Cfl .9503 .9•41•
oll?!i4 •lllTJ .... ,, .. oL'lU .... ,,,. oll•Z elOJJ .T06ft .1014 •10611
.t.111
.6111
... 111 ·"l liP
·"•°" e l\l?. l o<J.111 .~?fo'I e!ii'l3 o'521G
o4!>K• • •!-• 3 ·•t;•? .•"i•!t ·•"•J
NO. OF' HITS
IOVN-ION(-Af)f
o'B9T'l(•OO o'fSOJOE .-II •"•9ll\E•ll e'l'iO]l(•OI e'f49]lf.•ll
off?.Sfll(•OI elll144E•tl oRl~fi?E •II ·"1144[•01 olllflft3£+0I
e Tl46T(•OI oT0159E•ll e106A9[•11 .10160[•01 e106K9[•11
o6l1t.l£•01 o6ll!JOE•H efolOL'9E•ll e6ll!'IE•OI of>llCflU:'.•11
o'J3]0l\noo o'!tl11N[ol0 o52l?'iF.•nO e5i1'1TH(•OO e!>?.IZ!;E•DO
·""'i>f-.. [flO ••S"il IE•ftO ·•"i•6t;F. ••• ·•~'ii 1£•11
·"""""f •II
.3 l.Al'IE
• lJo;7 .1 .. "~ • l!>" I
·'"''" .11'1?
...... 7
·")It] ·"271l
. '""'' ...... .,
.••HI<
.<, 11?
.~?II?
.<;?••
.!> .'11
• 4 llll .. .•?Ii' ... ?Yn .•HI .to••S
• 3;1-;;> .J4<,q • :~c. ~~ ..... ,, .. • '.ll ,,.
• 71£ •; .; ... ,,, . , .... . . • ;·,,;a,_ •"II ;1
r,f·Jfl•;• "-II <;fl•lllf.f Lr.VFL <;fLfCTION CIHHHJ• ni-1111.~ i.11t. ?')/L,n//5 lHAH IC ~l'LIT CA 3 l
llFSIHl1•IH• ~PFfn O•Ptll "' s;o;,n """""f.I' rr l 'HIFlJ>A I IOll!i l'llf VF.NT FD
Nl'l'/tn NI-ID Y~-•DT ~AHHI[~ Sf HVlff lEYll
?. l •
,c,0112 .<Jill ,QIHl .9IH• •"i'S"
• 7115 .11to11 olH211 • llo?ll • 7119'f
o6'il!R ... f>.)11
·" tO? .6705 .1.11.
• !>flU'i .5!>#,0 ,!>7?1 ... 72• ."> 1'1 I
.•7~4
• •1111 .•J41"1Q
0 4H1J
·""17
.... ,.. • 4 .,,, I • 4 I t4 ••I tQ ... ........
·"•ll ,.,,37• ·"•nl .9401
·"""" oRf14Q ,Rll?J .110,.n .1111Sfi oRDR'i
ef>9?ft ofo91 I
·"""" ·""•? ·"q74
.5'13'i
.'i931\ o!i'17 l • 'i9h 7. ,f.0111)
.'iOlll
... OHf.
.... ?I • ""11 fo .o; I'> I
.4331
.•3')11 o4JH4
·''HI .4•1•
o9'567 .<J41t3 .94111 0941111 .9•85
ollZI II ·" 1•11 o 1'1 I•'> .1115• .11151
.1101
.104•
.1047 • 70"i0 .111o;2
.b I 7.2
.607fi oflOll? ... nR4 •bOAll
........ .,
.St>Jl
."i?•ll
.o;24J o!'>?4fl
e4S?'I .•!>nn .•!ill9 • •'>11'1 ........
1.io. OF HITS
IOYR-IOMl-IOf
.q591rnE•OO ·""n:t'IF.:•Oo .'14'144[•00 o9!'>11J'IE•OO o94 1H~E•OO
obZ566E•OO .llJHl\£•00 offl,.l\7f•OO ,Rlf49E•OO oRll\61£ •00
+ll410E•OO .10162£•00 .7nf,Q2E•Ofl .70lf.t'F.+no ·'"""?£•00
+#ilT6•f.•00 ofll IS?E•OO •" IO"IF.:•00 ,f,llS2f•llO olll09IE•OO
,t;)~llf.F.:•flO
oS?.179£•011 .t;?7i.'fo£•11ft .'i2779f. •110 .s?7?t.t_•no
...... ,,7f.•00 ·•'>Sli'f•Ull .4'i4f>fo[ •OU .... .,1?£•flCI ..... ,,,,£•00
,lnll F 1111<,o•H'I 10.?n,?o:..ur1P. nRL!l~•T 1 •••• t.l t·~. -...) -
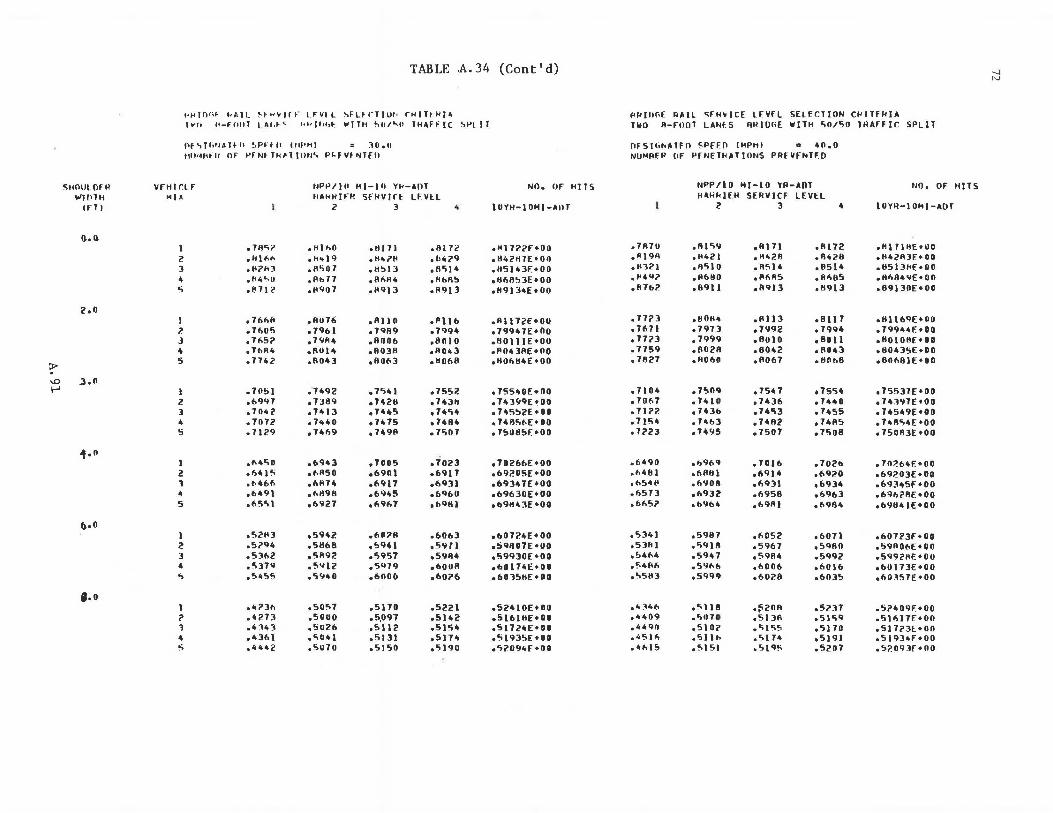
TABLE .A. 34 (Cont'd) -..] N
f<fdf)fi~: t.~ll ~fk~((f tFVI L ~.FLH'T)UI• fHITtH)A PPJllC.E AHL ~FH~ICE LFVfL SELECTION CHITFHIA
'~··· 1•-Ffllll I.Al.~< •~ '" 11 u,1: "'I TH ~Ul"O THAfflC '>Pl.IT TWO 11-root LANf. S RHIDfiE WITH 50/ .. 0 THAFFIC SPLIT
Pf'>lh•J~lH> '>PHii CllPHI = JO.II OFSll>llollTFO ~Pf[O (MPHI • 411 .o tll1<1IH'll or PfNtTl<~T)llll'i P~fllt'ITfll NUMRFP OF PFN£THATIONS PAfVfNTFD
SHOlllOFH VfHICLF NPP/(11 MJ-111 Y .. -lllT NO. OF Hll S NPP/IO Ml-10 YA-AOT No, OF HITS llllOTH MP FUll<H)fl! '.ifHVlft l.fVlL HlHHIEH SERVICF LEVEL
CFTI I 2 3 .. (UYH-IOHl-Al>T I 2 3 4 IUYll-IOMl-ADT
o.. n I • 111r;7 ,fll"O .11111 .11112 ,H)7?2f•OO ,71170 .111 r;.., .11111 .8172 ,1!171HE+OO 2 , HI f..., ..... 19 ....... ,. o6'o29 ,8'o2H7E•OO ,A19R ,111,z I , H421! .8428 ,tl4ZRJE+OO 3 0 H?flJ , tl'iO 7 ,l<'ilJ .11•;i4 ,H5143E+OO ,llJZI .11510 ,R<,14 .11514 ,115131<[•00 4 ·"""" ,flb77 ,flhH4 ,HbA!> ,1.168!>3£•00 • 1'44'? ,116!10 ollhll5 • 8h85 .8hll4'1[•00 5 .I! 7 I? .1!907 .1<9)3 oR9)3 .119( 34[ + 00 .87bi' .8911 .111113 .11913 ,8913PE•OO
2.0 I • 7 6"11 ,llU76 ,8)) 0 ,Pl)b .111172£•011 .77?3 .8014• .111 lJ .8117 olllt6'1E+PP ? .7605 .7961 ,7999 ,71194 o79947E•DO • 71171 • 7973 ,7'192 .7994 ,79944E•OO J • 7f.5? , 79R4 ,RO Ob ,8010 ,801 llE•OO ,77?3 .7999 ,8010 ,8011 .80108[•00 4 • 7blll+ 0 11014 ,110311 ,1101+3 ,ll04JAE•OO ,7759 .11028 .8042 .11043 ,8043!>£•00
;J> 5 • 7742 .11043 ,flOf.3 .11068 ,ll06114E•OO • 71127 ,R06D ,11067 .11Clb8 ,80fi8IE•OO
'° .3. Cl t-' I .7P!>I .7492 .7'>41 ,7552 ,755.,0f•OO .7104 .7509 • 7547 +7554 .7553lE•OO
z ,69'17 ,JJ89 .l .. 28 .74311 ,74399£•00 .7067 ,7'ol0 .7436 .7440 ,7.,J97E•OO 3 .1n1o2 ,7413 ,7445 • 74'i .. ,7.,51jZf•OO .1122 .743b ,7453 .7455 • 74549£ •00 4 .7072 .7 .. 40 .7475 • 71o84 .748<,t>f•OO • 71i:;., ,7463 ,74112 ,74fl5 ,748'>4E•OO lj .11?9 .74f>9 .74911 .7507 ,7SOll5E•OO .1223 .7495 ,7507 • 7"i08 ,750113E•OO
.,. Cl l .t.450 ,69"'3 .1005 ,70Z3 ,70Z66E•OO .6490 ·"9"" ,7016 ,702b ,7026"F•OO 2 .641'5 ,f,1150 .6901 .6917 ,69205f •00 .6481 .6flltl ,6914 .6920 o69203f•OO l .t>46f. ,61174 ,6917 .6931 o69J47E•OO ,,,5411 .6'1011 ,6Q31 ,6934 .69..145f+OO 4 .6491 • f>lt98 .6945 .69611 .69630£•00 .f>573 ,693l .6958 .6963 .6'1f>i!'llF.•00 5 ,65C,1 ,6927 ,1\967 ,t.9111 ob9H4..1E•OO .6t.5? .b'lb .. ,69111 ,69114 ,691141E•OO
c..o I .52113 05942 .6P?R .6063 o607?.4E•OO .5341 ,5987 .t.052 .6071 o60723f•OO 2 .5294 .5868 ,5941 .5911 ,S91107E•OO ,531ll .5'118 ,5967 ,51180 ,lj9R0f>E•OO J .5362 ,51l92 .">957 .59114 o59930E•OO ,5464 .5947 ,59114 .59Q2 ,5992111'.+00 4 ,c-,379 ,5'112 ,5'17'l ,bOOll ,60174£•00 .54flfi .59t.e. .6006 06016 oblll73E•OO ., ,5455 ,c;.,,.,o 06000 ,60?6 ,60l5HE•PO .!>5113 ,59119 ,6028 ,6035 .60357£•00
•• o I .'+?3h .50"'1 .")170 .5221 .52410E•OO .4~4ft ,11\118 -~2011 .52]7 .S;>409f+OO i!' • •'<'7 3 .souo ,5,097 .!>142 ,516111E•OO .4409 .1)117• .513fi .51<;9 .511il7f+OP l .411+3 .5U26 .5112 .51"i4 ,51724E•OO .44'1(1 .5102 • 5 l"i!: ,5170 ,517?3l•OO .. ,4361 .504-1 ,5131 .5171t .'51935E•OO ,45)6 • s 11 f> .5174 .5191 .51113•f•OO 5 ·" 41o2 .5u7o ,!i)SO .5190 o">2094f•OO ,4hl5 ,5151 .519!' .5207 ,5;>0'l3f +PO
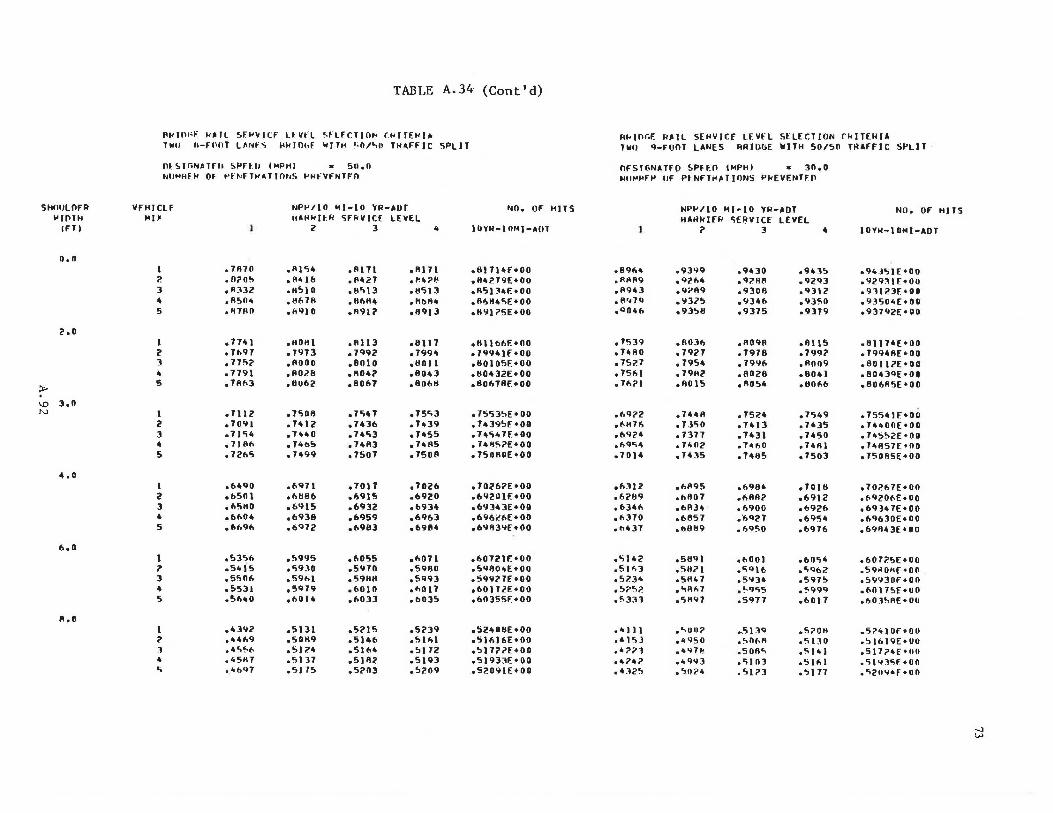
SHlllJLOfR
"'"''" lfTI
n.n
2 .o
:i>
'° 3.0 1'.l
4.11
6.0
11.0
TABLE A. 34 (Cont'd)
llHJONF llAIL ~FllVICF L~Vfl <,fLfCTIO~ flllTEHI• T~I tt-fPllT LANf~ HHIOhf WITH ~II/~~ TH4ffJC SPLIT
O~!.Tf"lN•Tffl SPrt.11 IMPHI .. 511.n NllMRfH OF t'ff\!f.THATTOt•S l'llfVfNTfO
VfHIClf 141)
NPt'/10 ~I-ID ~R-AOT HAHHlfH SfHVJCf LEVEL
I ?. 3 4 5
I i' l 4 s
l 2 3 4 5
l 2 3 4 5
1 ? 3 4 5
I ? 3 4 c;
.11110 • 8i'O!> .11332 .11!>04 .111110
.7741
.71>97
.71'i?
.7791
.7111>3
.111 i'
.7091 • 71<;4 .11111> .7265
.6490
.e.5nl ofi'iHO .bfi04 oflfi9fi
.5356
.5415
.55116
.5531
.56 .. 0
.43'12
.44fo9 ..... ~,,
.45117 ,4f)Q7
2 3 4
.Rl54 • R4 I fl .HSIU ,tl67fl .,. ... 0
.110111
.7'173 0 ROOO .1102& .llU62
.7508
.1 .. 12 • 7440 • 741>!> .7 .. 99
.6971
.61186 ,6915 ,6938 o6'H2
.!>995
.5930
.591>1
.5979 ohDI•
.5131
.50119
.SI?•
.5117
.''>I 15
.11111
.11427 ,e">lJ .11611• ,R91?
.11113
.7992 ,81110 oll04i' ,8067
,7o;47 .7436 ,74o;3 .74113 .7507
.1011 ,1,915 ,6932 ,6959 ,f,983
,6055 .5970 ,591111 ,6010 .t.033
,5?1 !i .5146 ,Slf•• ,51112 ,5?03
.11111 • 1'4?P. .11513 .Hbll" ,8913
.11111
.7994
.11011
.11043 ,8068
,75c;3 ,7439 • 7455 • 7•115 .7508
,7026 .6920 ,6934 ,6963 ,6984
,fi07l .5980 ,51193 ,fi017 ,6035
,5239 ,!> 1 h I .!>172 .5193 .!>209
NO, Of HITS
ll.IYll-10141-A!IT
,8J 714f•OO ,H4279E•OO ,11513•H'.•OO ,116H4">E•OO ,H91?5E•UO
,HllbbF.:•00 o1994lf•OO ,80I05f•OO ,110432E•OO ,8067llf•OO
o"f553!>E•OO ,7.,395f•OO ,74547f•OO .7411">?E•OO ,750llOE•OO
,7026?E•OO .6'1201£•00 .69343E•OO ,696~6£•00
,6'1113'1£•00
,607i'll'•OO ,511110.,E•OO .599?7f •00 obOlllE•OO ,60355E•OO
,S2.,0BE•OO ,516l6E•OO ,Sl7?lE+OO .5193JE•OO .52091E+OO
RllJOr.E ll~IL SEHVJCf LF.VfL SlLECTION fllfTEHIA TWO Q-fOOT LANES RRllJ<;E WITH 50/50 TRAfflC SPLIT
OfST6NATFO SPFF.0 IMPHI s Jn.o """',..ft> llf Pt NETH-TJONS PllEVF.:NTfO
.896 ..
.RRll9 0 R943 .11'1711 .004t.
,7!i39 ,74110 • 7527 .7561 • 7fi?J
,611?2 of-H76 .69?4 .6<1<;4 .7014
,fi3J2 .6?89 ob34t. ,6370 .t.437
.5142
.Sl'-J
.5?.3 ..
.!'>?C,;>
.">333
• "111 ,4 )I))
•• ??l ... ?4? .432C,
NPl'/10 Ml-10 Yll-AOT MAHklf~ 5ERVICE LEVEL
? 3 4
.9399 ,'12fi4 .9<'119 ,93?5 ,93'>11
.11031]
.7927 ,7954 ,79fl2 .11015
• 74 .. 11 • 7150 • 7377 .7402 ,7435
ofill95 .bll07 ,bll34 .t.857 ob8H9
.5891
.">II? l o5H47 • '>llf. 7 ,c;1w1
,._UO? ,4'150 ,4Q71' ... q .. 3 ,.,0<'4
.9430 ,<121111 ,93011 ,934f, ,9375
.1101111
.7978 ,79'16 .1102e , 110!>4
.7524 ,7413 • 7431 .7460 • 748!'>
.6984 ,611R? ,6900 ,'61127 ,6<1">0
ofiOOl ,5Qlb ,5'134 .<;<1o;5 .5977
~513Q
.~Of1R
,SOR., .•Hn3 .51?3
0943!> ,112'13 .9312 .9350 .9379
.1111 s
.199?
.11009
.8041 ell0fi6
,7549 .7•35 .7450 • 7411 I .7503
.7018
.6912 06926 06954 .6976
.6no;4 ,5'16;> .51175 .59<J9 .b017
0 5?0H
·"' 1]0 •">I 't I .Slh I .5177
NO. Of HITS
IOYH-lnMl-AOT
,94J5lf •00 .'121131[•00 ,9ll?3f•OO .':13504[•00 e93711i?E•DO
.81174E+OO ,7994Rf+OO ,80lli'E•OO ,8043Qf•OO ,806R5E•OO
.75541[•00
.74400[•00
.74S!'.2E•OO
.74R57E•OO
.75085£•00
o70?.67E•OO ot'll206f•UO o6'13•7E•OO ,611630EoOO ,b91143E•OO
.607?.0:.E+OO ,511>40Hf•OO .5'il<J30f •OD ,6Dl75f•UO ,IJOJC,RE•Oll
.5?4l0f•OU
.'>l619E+UO
.5)7;>.,f•OO
.<;l<1.l5f+UO ,o;2D'l4f+OO
-...) <»
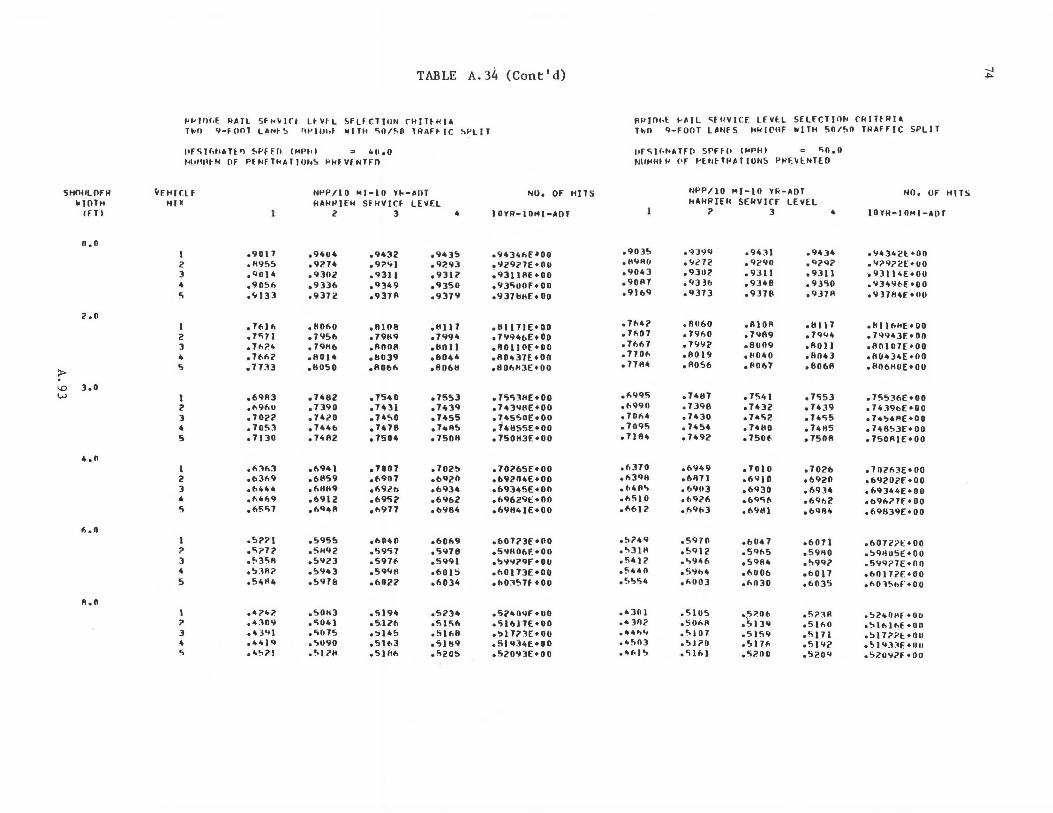
SHOllLOfH loJOTH
IFTJ
11.11
2.0
;l>
'° 1.0 \...)
4 .11
,, • fl
ll. II
TABLE A. 34 (Cont'd)
l'l<fl)l,f J>All Sfk~lrt LtVl· L '.>fLfCTJON C-llJTH<IA TloO 9-fOOT LANt., A~)Uhf ~ITH <;O/C,O lA~f~IC ~PLIT
l>FSJl;~1ATl'l ~PffO (Ml'lol " ltfloO MillllfM Of Pf.NflkATJfJl'I'.> l"k~Vf. NTFO
llF.Hlf.lf HIX
NPP/10 Ml-ID ¥~-APT llAM~JfM SfllVJCf LEYEL
2 3 4 s
l 2 J 4 ..,
1 2 3 4 5
l 2 J
• 5
l ? J 4 5
I ? l 4 5
.9017 ofl95S .'1014 0 9056 .... 133
• 7t.I,, .7o;71 • 7fl?.lt • 7t.t.2 .11:n
.69113 ofl9f.U .70?2 .705] .1110
.f>Jt.3
.6369
.t.44•
.fl41>9
.65"'7
.5??.l
.... ?1?
... 1511
.!>311?.
.541411
.•?•;>
.•3119 ·" J4l 0441 Q .... ,,,
2 3 •
,94U4 ,9?74 .9302 .93)6 .9372
.1101>0
.7c.1s1> • 7'lll6 oll0l4 .11050
.7482 • 7390 .74?.D .744b .Hll2
.6941
.6tl59 • t.11119 .6912 .t.'1411
.5955
.SHCl2
.sc.121
.5943
.5978
0 SDHJ • "04 l .o;111s .c;1190 .c,1 ?It
.9432
.9;><;1
.9311
.11349
.93711
.8108
.79119
.110011
.11039
.11066
.7540
.1•n1
.7450
.7478
.7504
.7007
.t.907 ·"9il> .695? of>977
.61140
.o;9•;y
.597f. .591111 .6022
.5194
.5.12fi
.~145
o5lt.J • 5)116
o94J!I .'1293 .911? .9350 .9379
.llll 7 07994 .110 I I .11044 .80611
07553 .7439 o74S5 • 1.,115 .75011
.702!> ob'l;>ll .&934 .6962 ob984
.6069
.5978
.5991
.601~
.60)4
.5234
.5156
.SJ68
.51119
.s2os
NOo Of HITS
l 0 'l'A-1 0141-IW T
o'l4l46f ~OO o929?7E•OU ;931 lllE+OO .93Sll0f•Oll .937111![•00
.111171[•00 o 79946[•00 oflOllOE•OO .80437[•00 o80M•3E•IJO
.75"'iJflE•OO
.74398[•00 o745SllE•OO ol46SSE•OO o7501t3E•OO
o70?65E•OO .1>9?114[•00 .69345[•00 .69629E•OO .69H41E•OO
.607?3£•00
.S'IH06[•0U o!>'lc.1?9F•OU .f>Ol13E•OO ohOJ57f •OU
o5i'"ll'IF•UO o'ilbl7E•OO .~ll?JE•llO .Sl'll4E•UO .SZ093E•OO
1w1ni.l l<AJL <;fllVICF lfVll 5£LfCTION CRITfAU T~O <I-FOOT l~NFS HMl~ttf WITH 511/50 TllAFFIC SPLIT
11rSll·NATf[l SPffll ll'PHI c s;o.o ~llll'llHI <•F f'f.tlflPH IONS PllOlNTED
.90)!>
. ""'"' .9043
.90IH
.9lf>Q
• 7fl4i' .1 .. 01 .7f>67 • 770,, • 77R4
o#.'195 of.9911 .711#.4 .7095 • 7184
.f>J70
.6J98 of•4fl .. .fi510 ·"61?.
.!>749
... Jiff
.541?
.~ ... "
.!,~-;4
.4Jll I •• 3112 • 4 • .,.,
.4503
•""I 5
NPP/10 Hl-10 Y~-ADT HAMRIEM SERVlCF lf.YEL
7 3 4
.·~J9c.I
.c,212
.9311?
.9336 o'IJ73
0 8060 .7960 .79Y? .11019 oR056
.74ll7 • 7J«6 .7430 .7454 .7492
ofi9"19 061171 .6903 ofl'l2" .691>3
.597(1
.5912
... 946
.5'11>4 ·"00)
.s1us
.sot.11
... 107
.5170
..... ,, 1
.94Jl
.9;>91)
.9311
.9]48
.9J7ll
.AlOll
.79119
.8Ull9 ofl040 ol'067
.151, I o743Z • 7•5?. • 74ll0 .lSOf.
.1010
.6910
.6<130
.6'1., ..
.69lll
0604 7 .5'1f>S .'!>9114 o600b .t.llJO
,o;;oot. .SIJQ .5159 .Sl7fo .5200
.9434
.'l?<I? 09311 .9350 0 9J7A
.11111 • 7'1'44 .11011 .11043 • f!06R
.1c;53
.7439
.74o;5 • 74115 .75118
.1021> 06920 .69]4 o6'1r,2 0 1'><1114
06071 .59110 ... 9Q? .1>017 o6DJ5
o57JA oSlt.D .s111 o">lc.12 .S?Oc.I
NO. Of HITS
lOYH-lllHl-AOT
o'l4)42t. •DO .4?9?2E•UO ·o'IJl l4f.•OU 0 9J49f>£ •DO 0917114[•00
oHllflHE•DO .79943f.•00 oRDl07£•00 oflo.r,J4[•00 .fl061!0E•OU
.75536£•00 o74J9t>E•OO o7456A£+00 .748!>3[•00 .750111£•00
.7Di.'63E•DO 06920?£•00 .69344[•00 ob96?7F.:•OO .691139£+00
.607i:'?t:+OO
.59ll05E•DO
.5'1<177[•01) o6017?f.•UO of>Ol':>t>F•OO
.!121tllflf •OU
... lt.lflE•Oll
.5177i'E•Oll o':tl'IJ:~F.•llU .52U'>l?E•OO
-.I ~
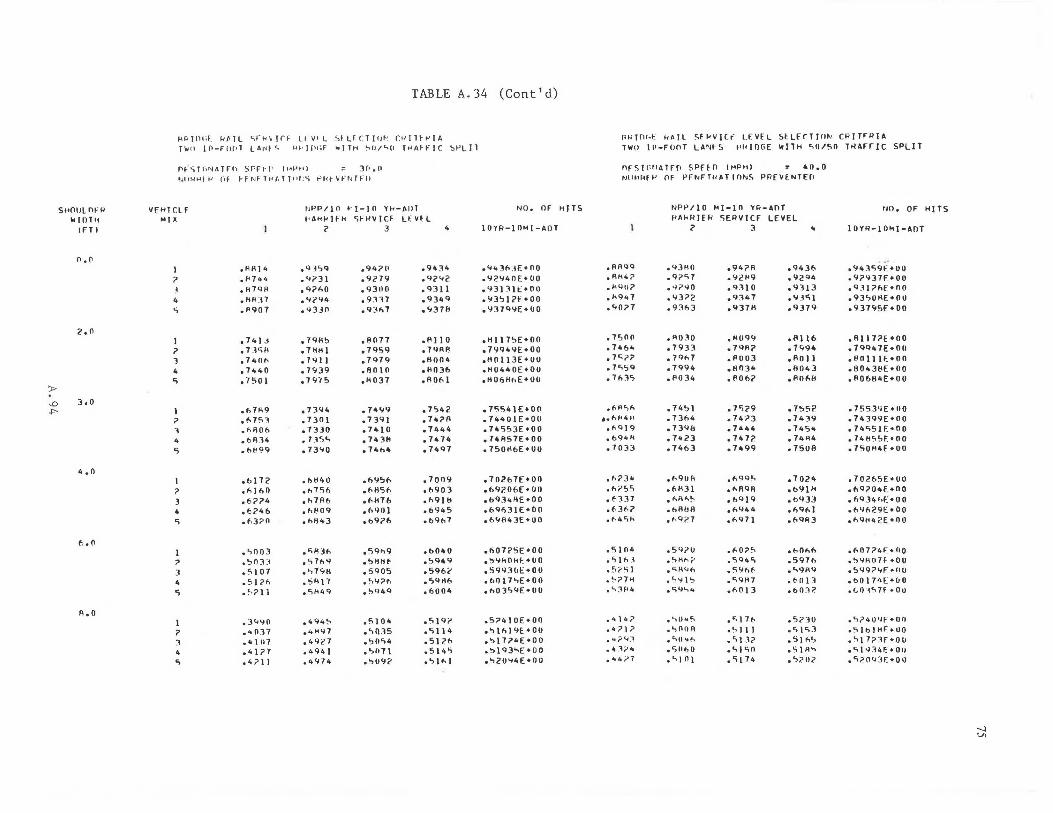
;p.
'° .i:--
SHOlJL nf w I< IDT 11
CFT l
n.n
2.n
3.0
4.0
f , . n
A.O
TABLE A. 34 (Cont'd)
f< l> ll \li f_ l< ~JL <;rk ;J of LIV>L SfLf C T!fJ~; r 1, JH H[A Tl• ll 11•-FOC •l LA•" t '- <H, J[ll;F "Il l< 0,11/'-CI lo-JAffl C ~ f' Lll
f' .. "ll t'1 "41\TFP SPF1- 11 11 .. .._,tl) ) (•.co fJI0!.1 .. l l< ('of H Nfl l-'f· Tl ll l ;'i o-'l<fVH, TFll
VFHlCLF ... x
I ? ~
4 .,
I 7 1 4 c;
I ? l 4 .-,
1 ? 3 4 c;
7 J 4 c;
? l 4 .-,
.HH)4
.~1·~
.H7'1fl • llH :IT .1''107
.741~ • 7 l"ifl .7401> • 7440 ,7501
of>7A9 .1'>75J • '-ROI> • t>ll 14 • !>1'9'1
.t>l 72
.l'>J 1>0
.t>?74 ,t>(.'41)
of>J?O
• ':>003 .'::to3 :1 • <;I 07
.51 ""' • ~ , 711
• 3'-90 .40)7 ·"I 117 .41?7 .4?11
tJPP/10 •- !-10 Yl<-AllT t•AHl<)Fk <;1-' WV!Cf Lf.VtL
? 3 4
,'l1'>'1 • 4i'3 I • <l?<'>O .4<''14 .<i3JO
, 7'1H'::t , 7HH I • 7 '111 • 7'i1J9 , 7975
,73'14 .7301 • 7330 • 1 _1.-,c; ,73'10
.f>H40
.h75ft
.h7AI>
.f>f:IO'I ,hll43
,<;HJf> ,C,7h'I ,0,7'ill! .5Hl7 .SH4Q
.4<.14~
e4H47
• 49<'7 ,4'l4 l ,4'-174
,94?11 ,9279 ,9300 .9:n7 ,QJf>7
.e.011 , 7'15'1 ,7'179 .AOlO ,11037
.7•9'l , 7 3'l l ,7410 ,74311 , 74h4
.1>95f> ,f>H5f> ,f>H1b ,tWO)
,b9?6
,c;q,.,9 • '::tlllif .5'105 ,0,9?f-> ,O,Q4Q
,C,J 04 .'>0:15 .'::t0'>4 .'>1171 ,0,09?
.9434
.'1;>42
.'1111
.934'l • '-3711
.All 0 , 7'1Af! ,8004 ,H03b ,ROf> I
,7':>42 0 747A ,7444 ,7•74 ,74'17
.7009 ,1>903 ,!>9) ti ,b945 .b'lt> 1
,b040 ,C,Q49 ,596(' ,")Qtl,., • f:J004
•<,I 'li' • c; 114 .51 '-'" .514'> ·"l"'I
NO. OF h!TS
lOYFl-IOMl-ADT
,c,o431>:1f.+OO .92C,040E:•OO ,93!1lt::+OO ,93'>1?f•OO ,937'l9(•00
,HJ 175E:•OO .79'l411E:•OO ,l:IOl13E•UU ,H0440E•OO ,tlOF,Ht.E•OO
,75541(•00 ,7,.,.0IE•OO ,74553(+00 ,741157E•OO .750HbE•OO
,702b7E•OO ,b9;>0bf+UO ,b93,.llE•OO ,6'1f>31E+OO ,b'-R43E+OO
,f:J07?5E:•OO ,'>.,f10flf.•OO ,5'l'1301::•00 ,bOl70,(•00 .t.OJ">C,0(•00
.5?4IOE+OO
.'::tlh19E.•00 ,'::tl774E•OO • '>I Q3"E •O o ,'::t2U'<4E•OO
l<k!D•·t: kA[l SFr-VICf LfVfL StLffT!O~ CP!TfR!A TWO Jll-FOnT LANtS ~l<IOGE W!lh 50/50 T~AFric SPLIT
nFSIH1Alf[1 $PFEn Cf'4PH) = 40,0 Nlll•Hf t' nF f'Ft-IFTl<~T JONS PllfVfNTH.l
,llAQ<! .AH4? .H4U? ,H'l47 .<i0?7
,7500 , 7 Hi4
, 1<;?;> ,7<;5Q ,71'>3">
. ,, .. .,,, 41.hA4H
,f,<!)9 • bq•l-4 ,70]3
,f.?34 ,f>i'5C, • f-337 ,f.3f,?
·"""" .5)04 .'>ltd .5?SI .~?7>1
• '-:11'4
.•14?
.•?17 • "?'-41 •• ];>4
• 44i' 1
NPP/IO M!-10 Yw-ADT HAkR![k SERVICF LEVEL
? 3 4
.'13fl0 ,q7<;7 .~?~O
• 11372 ,931',3
,RU]O • 793] , 1Qf,J ,7Q94 .1'034
• 7451 .731>4 ,73'16 .742] ,74f:J3
,1>90fl • M<3 l ·"'fl"!> ,f:ifHlR ,f->'l?.7
, 5'l?O .~H,..(1
.c;RC'.lf'i
.5 .. 1':>
.';41,4
.'-,04~
,':>0011
• "i01t>h ,<;llf,O , ._,IO I
.94?11
.92H9 • '1:110 ,'l]47 ,937H
,HO'l\I ,7'lll? ,1'003 ,6034 ,RO bi'
,7'5?9 • 7473 ,744~
,H7;> ,7499
,t<,C)Q<,
,.,R'IR ,f:JQIQ ,h'144
• f.<17 I
,t<.0?5 .<,Q4<;
.54hf
.E;Qf<7 ,f>O J 3
·"I 7t·'>I 1 I .'>13? .'-,)Gil
• 'il 74
.9436
.'1294 ,'1113 ... ]"ii ,9J79
,HJ 16 ,7q94 ,11011 .110"3 ,l'OMl
.755? ,7439 .7454 ,74R4 .7508
• 7024 ,f:J911• ,b'l33 .l)'lf>l ,6<1113
.t.Ohb
.5971> ,'><lf1Q
• "" 13 .bO:l;>
,C,?JO .<;J<,3 •'>I<'>':> ,51 A'> .'>?Iii'
rrn. OF HI TS
IUYFl-IOM!-AOT
.94359f•OO
.9?'137f•OO ,Q _1li'hE+OO ,9J'>ORE•OO ,937'il5E•OO
,Rll7?E•OO ,7<1'147[•011 ,f!Olllf•OO .ao .. J~E•OO ,H0fill4E•OO
.75539E+UO ,743Q9f+OO ,74551F:•OO , 74H'i5F:•OO .7~0R4f •00
,702f.5E+OO ,fl<l;>04E•OO • fl'l .~4'-F:•OO ,fl'lt\29E+OO ,f>'IH42E•OO
,t<.07?4F+OO ,0,4H07f +00 .~'l9?<;F+llU
.bOl74E+OO
.1..o ·ic.n •Ou
,0,?40Qf•Oll ,<;lb!lff+UO .'>17;>1F•OO ,<;J•r14E+OO ,'i;>O<;JF:+OIJ
--i Vi
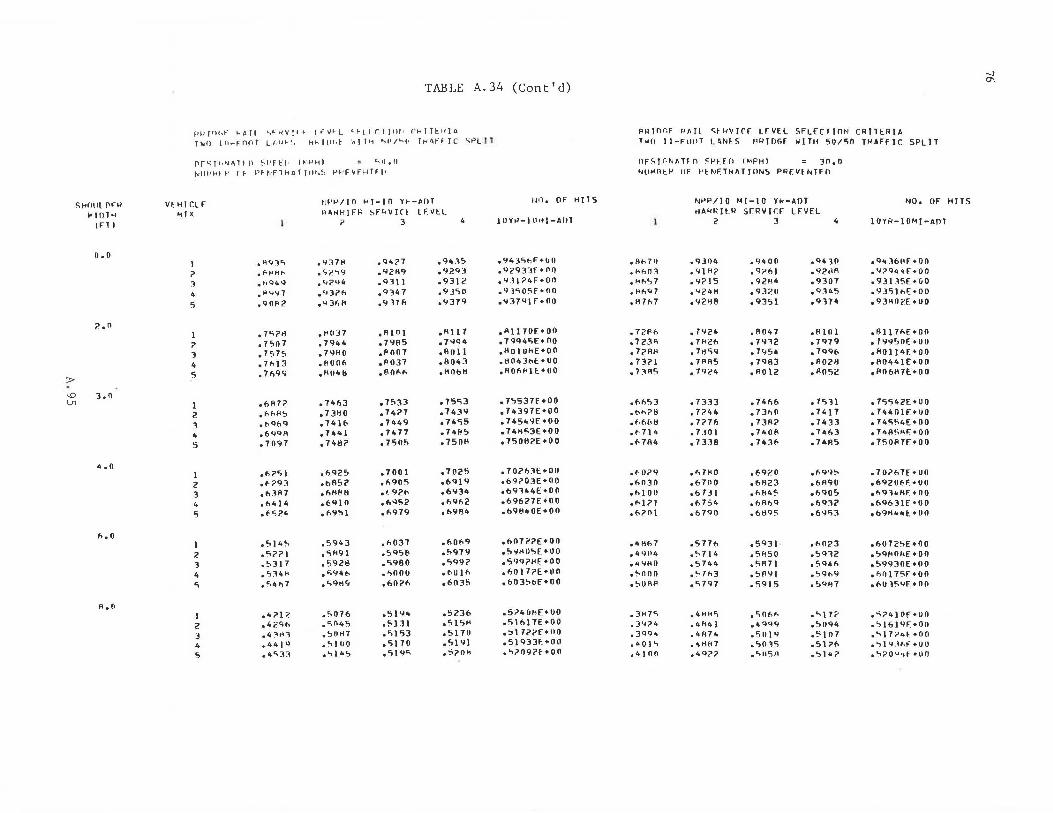
-.J
TABLE A.34 (Cont'd) °'
p'"' f f)C~t-° ~A JI <...,F~V JI .. l f V' L <.~ l r r Tr IH• (' ... r Tt "I A PRfnr.f PAIL ~tHVIrr LfVEL SFLECTION CRITERIA
T "fl 1 n-fnnT L '""'" ~1 H~ l t>i.t ·~/' r 1-t ..," /L.fo Tt< ~rH C SPLl l '"" 11-F"U!>T 1..llN~_S 1rn IDGF w!TH 50/50 TMHFIC SPLIT
nr"Tf.'JhTI" ~·i'Fl'l• l•'>'HI = ~II .fl OFSJ01hTF n Sl'F[O CMPHI = 30,0 tvllr~ Hf ~' r 1f- PH•FlH~flt",S >'~·fVFHTFI• Nll'4«t:M llF i'ENFTMAT!ONS PHEVENTFD
SHOlll f\F"M VfHICLF ~i'>'/10 ~T-10 Y~-AOT un, OF HITS N~P/]0 Ml-10 Y ... -AOT NO, OF HITS
l'TOTH Ml~ HAtH<!FR SfkVlO l FVl:L HANRil:R 5ERVICF LEVEL
IFll I 7 3 4 lOYtl-10•~!-AOT I 2 J 4 lOYR-lOMI-AflT
o.o ,9435 ,94:i5t>F+IJO I .~Q::;4C, ,93711 ,Q4?7 , At>711 ,Cl304 ,9400 ,94 JO ,9 .. ]bl•f•OO
7 .f.t·H1f-. ,.,,...,\1 ,92tl9 ,92'i:i ,<>;>933f +00 ,Hh01 , "I H? • 97f>I ,9;>tlA ,<,;>944f•OO , .t1Q4~ ,42<>4 ,<>311 ,93lc ,'>]l?4F+OO ·""57 ,Q?l5 ,921l4 ,9307 .93115£•(10
4 .~4'17 ,4Ji't'1 ,934 7 ,9j'i0 ,'ll'iO'if •00 • t\l'o<l7 ,'<24H ,9320 ,<1]4'i ,9.lSlt>E+OO
5 ,90P? ,<iJf\H ,9l7A ,Y379 ·" 37"1 F •no .117fo7 .''12'lll ,9351 • 9 37• e93R0('.f+UO
?. • n 0 Rll7 0 111170E+OO .1~PI> ,7921< ,!1047 .11101 ,81171\E•OO 1 • 7'i?tl .~037 ,AIOI
? ,7507 , 7944 , 79!15 ,79q4 ,7q94<;f+OO ,72JR ,7H2f1 ,79l2 ,7979 ,799501':•00
3 • 7".,75 , 79HO ,1'007 • fl 011 ,llUlUHE•OO ,7;>AH , 71l59 .7954 ,7Q9f1 ,l!OlJ4E•OO
4 • 7f.l 3 ,!lOOfi ,1"037 .8043 ,t1043"E_+UO • 73?1 ,7RA5 ,7983 ,A02H ofl044lf•OO
5 , 7fo'l<; ,H0411 ,flOf.f. oil Obi! ,llOfoHlE+OO ,BA5 , 7Q24 ,A012 .A052 ,llObH7E•OO >
'° J,O , 75537f+OO ln 1 ,f1H72 ,741\J ,7533 .75<;3 ,f.f.53 ,7333 , 741\1\ , 7">l l ,75<;42E•OO
2 ·""""' ,73110 .14?1 .71<39 ,74J97E+OO ,,,,.,?ll ,7244 ,73110 ,74]7 ,74401E+OO
3 .t-Qf,9 .7416 ,7449 .7455 ,74549f•OO ,fo6bt1 .7?76 ,73R2 • 7433 ,74<;<,4[+00
.. ,699R .1 .... 1 .1 .. 11 • 741!':> ,74H!'oJE+OO ,t-714 , 1 :iO I ,7408 ,7463 0 74R<,'4F.•00
5 .7097 , 7i<tli' .7505 .75011 , 750112E +00 ,fo7A4 ,7338 .7•3fi .7 .. A5 .7SOA7E+OO
4,0 ,7001 , 7025 , 702fo31::+00 1 ,fl?'i I ,fl'l25 ,f.Oi'Q ,I, 71'0 ,r,9;>0 ,f.99'> ,70267f+UO
2 .t-?93 obfl5? .f\90"> ,6919 ,b9?03E+OO ,f.030 ,6700 ,61l23 ,6A90 e69i'06F.•OO 3 0 f,3R7 ,f\Hl:18 ·'- 92f. .6'134 ,69l4i<E+OO
·"' 00 ,6731 ,t>H4'i .6<105 ,119l•HF.+00 .. .f14 l 4 ,6910 .f.952 ,f,91\2 .696?7E+OO ,fol?) ,f.754 ,f>Rl\9 ,6932 ,f19631f •00
5 , t-<;;>4 ,f1951 .f1979 .&984 ,&91:1"0E+OO ,f.;>O I ,()790 ,6!l'l5 ,69<;3 0 69tl.,41:_•UO
fo,0 ,(,Qf.9 ,f,0722£+00 I ,5]45 ,5943 ,1\037 .4!11>7 .577'1 ,59]1 ,f.023 .6072<,E+OO
2 ,5??1 ,51491 .5'l'>l:I ,0.,979 ,C,.,.1Hl':>E+OO ,4904 ,0.,714 ,5Fi50 ,59l2 ,C,QHOFiE•OO 3 .!:o3 I 1 .5928 ,c;9eo ,C,99? • 5'19?14[ + 0 0 ,4<#HO .5744 ,'iR71 ,5941\ ,59930E•OO 4 • C,34" • 'i94b .'>000 , t-U 1 f. ,6017?E•OO ,<,noo .!'7t>3 ·"'"'' ,59t>9 ,fo0175F+OO
"' ,54'17 •<;9H'l ,f102f\ .6035 ,b035t>E•OO .5UAI' ,<;797 .5915 ,'><IH7 of10~5YE+OO
R.O ,5?401<E•U!I I ,4?1" ,C,076 ,51., .. ,5?.3f1 , 3H7<; ,4HH5 ,<;Of.I'. ·"17<' ,'>?4l0f•OO
2 .4c<ifo ,5n45 .5111 e5\5H ,51617E+OO .34;>4 ,4f!4l .4Qtlq .50Q4 ·'>16191'•00 :.! .'6:=-t'1 ,5UtH .">153 .5170 e!:>l 7?i'E•llO .JQ9 .. • 4147 .. .so) 'l .5107 ,.,I 7?4F+OO 4 ,44 I 'l , o., I 110 ,5170 .5191 .5l'l33f_+OO ... 0 l" .~"4!H ,C,Ol<; .Sl?fo ,.,}4 .lf.f•OO ., ,4<;33 .'>145 ,<;)9<; .~;>Of! ,5;>0<i?f •00 ,4)00 ,4Q?? ,'>ll'ifl ,., I" 7 .~?0011f.f•UO
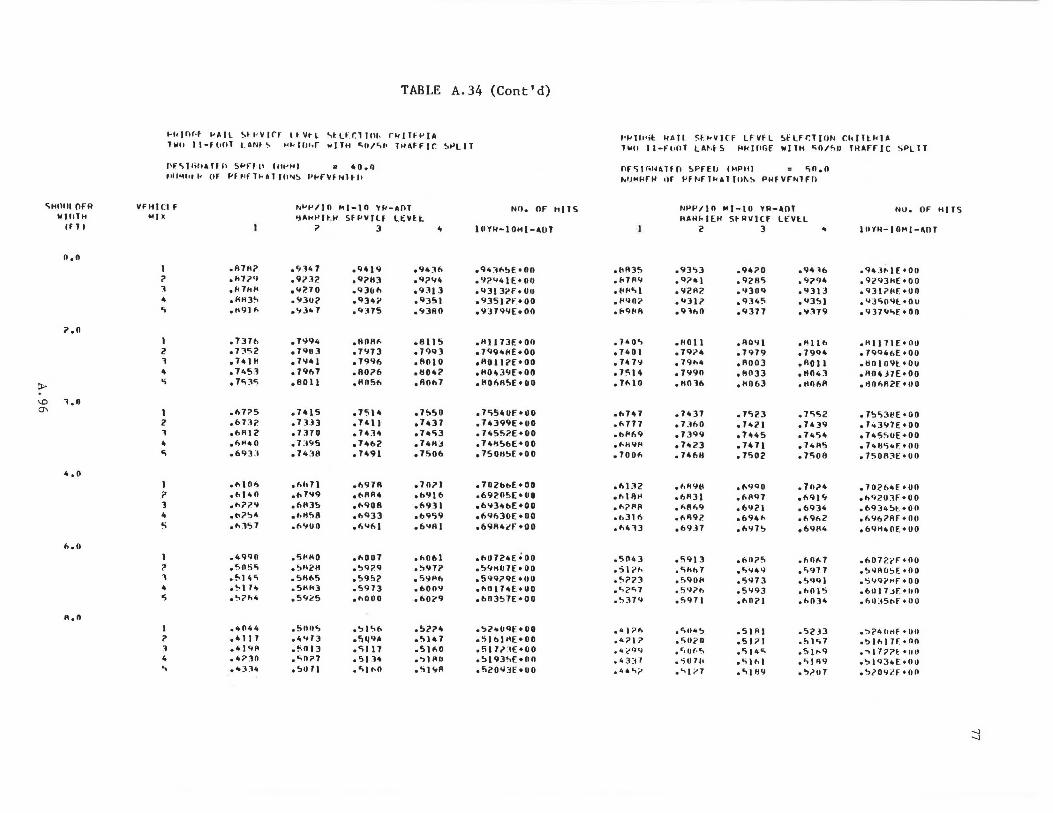
<;t<Olll OFA WlllTH
lrTI
n. n
?.II
~
'° l.11
"'
4 .II
I\. (I
11. II
TABLE A. 34 (Cont'd)
H .. IH·f 1',All !.H, lllCf t•. V•l "tLH'.llCll< f"ldlfl'IA Tlolll ll-fl1CIT I.AN•<, l<l• lllhf wlTH C\0/ ... 1• TH'lf-Flr. ~"LIT
Pf'>llir••Hn s1>n11 11wH1 = •n.11 t•ll'41ot I< or Pf t•fT"Al '""'~ l'1<FllfNIH1
VFHl<:I f MO
I ? l
• ...
I 2 l
• ...
I 2 l
• .. I ? l
" 5
1 ? l 4 o:;
I ? ]
4 ...
.111R?
.1'7;>•1 oR 1Rl4 .1'113., eH91f>
.7371> • 7'.\<;2 • 74111 .7451 • 7c;3c;
.1>7?5
.t.71?. obllJ2
•"'"'II .6'13:1
... 10,,
.11l•11
.t>?;>'I
.t.?'3•
.t> .l57
.49'10
.<,115o; • 51 ,, ... •!>I 14 .'17h4
.41144
.41I1
.4191'
.47311
.4334
Nl'l'/)11 ~l-111 ~~--OT
~AHHltH Sf ~Vllf LfV~l
7 3 "
.914 7
.9i'l?. • .,;no .930? ... 3 .. 7
• 7'194 o 19UJ • 1'14 l .7967 o8Dll
.7415 • 7 JjJ .7370 • r1r,,5 • 74 :!8
.hh1l
·" 7'19 .1\11]5
·"""8 .t.'IUO
.514110 0 5H211 .5111\5 .5HllJ .59i'5
.511fl">
..... 13
.!ifl 13
... 1177 • 50 71
.'IH'I ,'1?113 .'IJOfl
·"3"i' .<1 :ns
• llflfff> • 7'173 • 79'1f) .11076 .111156
.7514 • 7•11 ,741'1 • 1<tb?. .7491
.1>9711 • !-11114 .t.'108 ,b<IJJ .f>'lfd
.flD07
.5'1?.'1
.595?
.5913 of>OUO
• ., l '11\ .sct9A
·"' 17 • ">I 14 • C,J t>ll
·"•JI\ .'l?'H ,9]13 .<13•;i .93110
.8115 • 79'13 .111110 .1104? 0 110fl7
• 7550 .7437 .74'i3 .1411;, .7506
• 7071 ,1>916 ol\911 ,t.'159 .6 .. 111
.1>061
.5'11?
.5'1f'f)
.t.0119
.1'>0<'9
.5??4
... 147
.!'> l t.O • ., 11111 •'>I .. A
NO. OF hllS
lllY~-IOHl-111£JT
.94:tl\5E •Oo o'l?.'14lf•Oll .C'31 li'F•UCI o'l35J?f.•OO .c,iJJ'l'IE•llO
,llll 7JE•Oll 0 799 .. llf•OO .llUll?f•OD 0 11043'-lf•OO .ll06115f•OO
• 7<;S4Df•llO 0 74399E•UO .74552£•00 ,74,,'>t.E•OO 0 750H'>f•OO
.7112bt.f•OO
.69?.0'>E•UO ob<,i34bE•OO of>'lf>30E•DO .69114<'f•OO
.1>012 .. E•oo
.!>9Hll7E•OO
.5'1'179f •110
.Mlll"f.•00 ol'>n3!>7E•OO
.S?'Otl'lt:•UO
.SlblHE•OO ,5J 7,> :tE•OO ... l93'>E•On .520&,l :ff•llO
Nl)ll•il MAii q1<V)Cf LFVfL !>tLFr.l(OI< r.l<)Hl<l.l Two II-Fe.Ill LM·~S l'l<lfl!;f IO)Th o;n10,11 THAFFIC SPLIT
Pf<;llll~AlfO !>Pffll IMPtll = s;n.o ~UMl'fl< or Pf~fll<AllU~~ PWfVF~trn
.111135
... 7R9
•""°'I .14'10? • "Cjflfl
.7400, o 740 I • 74 7" .1c;14 • 7fl ID
oh747 .t.177 .bl46'l
·"""'" .7001\
,h)12 • t>I llH
. """" oh316
·"•13
.5043
.51?h
.0,?2'.\ . .,,. .. ,
.537'1
•"I 7h .•71? .-~Q~
·" 3]7 • 44 ..,;;'
NPP/111 M)-10 ~R-lOT 11.lW~l[ll SfAV)(f LEVll
2 3 ..
.93">3 ,Q;>4)
.'12117. • "3 Ii' ·"'"O
.11011 • 79;>4 ,79f>4 • 7<,190 ,HO lb
.7437 • 7 .160 .7399 • 7423 .74611
• t.ll'ltl .1'>1131
·"""'"' .1\119?. ,f>'Hl
.5'11 l
·"""1 .5901' ... .,,.., • 597 I
-~···~ .511?0 .~o~~
,iU711 • .,1~1
.94?0 • 92115 .930<1 ,9345 ,'1377
• """ 1 • 7979 ,ROOJ .111133 .1101>3
.7'>23 • 1 .. 21 • 744S • 747 l .7502
,1\990 • hR'17 ,6<,i?J .694f. ,t.975
.60?C, • '>'149 • ">'17 l ,5'19] ,t.11?1
.5JRI
.51?1 • ., I'•"' • 'i l t. I .">11:19
,'14~1'>
.9794 ,9JIJ .'13Sl .'1179
,l!l)b ,7994 .11011 ,11043 ,1111611
.1s;52
.7439 • 7454 • 74115 .1c;o8
• 7074 .6'119 .6'1J4 ol\9t.2 .6'1114
.tint. 1
.... '111
.59'11 ohll)5 ,hll34
.c;2n
.51<, 7
.5Jh9 ,<;)R'I
• '>.>117
NO. OF HI TS
lUVJl-lOHJ-~OT
.'14Jf>IF•OD 0 929JllE•DD .'131?14f+OO • 'IJC,O'll •DU .9379..,f•OO
.HI) 71E•Oll
.7'1946E•Oll
.llOIO'll•Dtl ,fl04J7E•OO • t!llt.112'E • oo
• 7 .. C,Jllf•OO .143'17E•OO .74550[•00 • 7"11'>4f•llO .750R1E•OO
.7021\'IE•UO oh'120JF•OO .b9345t•OO .6'1f>711F•ll0 ,b'IH411E•llO
.1\071'.?F•OO
.!:>'IROSF.: •00
.59'1i'Hf •00
.Ml)7.Jf•llO
.h1U5t>f•DD
.~?4~Hf•UO
.~1617f•Oll
.,17?7t•UU
.'31'134[•0~
o">lO'l~F•OO
:::l
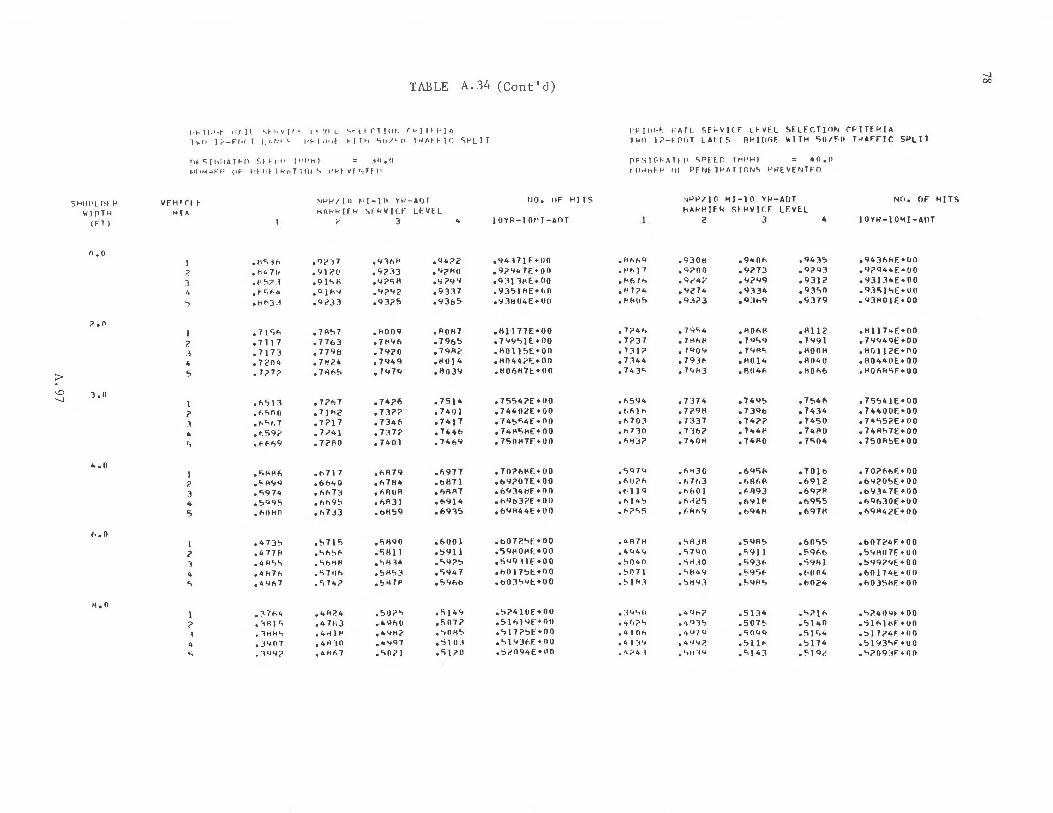
-.I
TABLE A.34 (Cont'd) 00
. . .. J[i•.r- •-'I JI ......... v I ( I I. 1H L 1.,..- L • r l J <1f'i r...., J J ~ FI u P~ ir1r:J._ FAIL Sf~VJ(F L~ Vfl SELECTJO~ rPJTEHIA
1 ~fl ) ;...-Ff1f1 l I. f. ,.~ ~ c. , ...... f IH .~ ~ J T ._, i;tr/'"-11 1 ><A~f IC 'if'LI I ll•O 1 ?-f rnT LAt [ S RH([1GF ~ITH 'iO/l;O T><M'FIC SPLIT
flf c;, Ih!IA l F p ~·. ~ Ft I I (•1PH) = .10. 0 flFSIGt·•All f\ SPEUl (,_,PHI = 40.0
1.il•M~FP ('f ~·~ 111- 1h'11 T r 01 ·<... t)..,. ~ v F ~,J T f 11 t-1t!.~H~ R Ill PFN~lµAf IONS PHEVfNTfO
SHiii•!. n1 P VfHJrt f NµP/ I (I ~' 1-1 II YH-MJT tJO. OF HITS NPP/lU M(-10 YH-AOT NO, Of HITS
w rrn>< .. [' HAHµ If'< ~f.HV IC.F LFVEL f<AHHJE.1< Sf PVJU lf.VE.L
(Fl I 1 r 3 .. I OYP-1 Ot· I -AOT l 2 3 .. IOYH-IOMJ-AOT
o.o I .11<. ~h • 'l('~l7 .93hl< ,Q4?2 ,9<+HH:•OO .fif..f,Q .9301! .940h .<l43;, .943bkE•OO
;> ... ~ 711 ,91 ;>Q ,9?33 •<;;>HO ,9?1147E•00 • t'f'] 7 .<l?OO ,9273 .<l?<>3 ,<l?<l44E•OO
1 ,f<'>?.l .9 !'> R ,4?c;H ,y794 ,<l:i11t<f.• oo .l<t.7 ... .Qt'4? .9?99 .931? ,11))]4[•00
4 .... t;f.4 0Qjk'I .4?4? ,9)]7 .93'>1HE•f•O ,117?4 • 11?74 ,<l]34 ,<lJ';O ,<lJ<;J ':>E•llO ., .t<t-3] ,<l233 ,'13?5 .93t;5 ,Y31!U4E+UO • l'l<O'> ,<lJ?J .Q]hQ ... 379 ,'13HOIE•OO
?.O I • 71 c;;, • 7A'i7 ,kOO<l .ROH7 ,Ill I 77E•OO • 7?4 ... ,79'i4 • R Oh!< ,A) l c .11117 .. f.•OO
? .7117 • 77&3 • 71'111> • 791;"> ,7Y9'>1E•OO .7?37 • 7 ""fl • 7gi,q • 7991 • 79<149[•00
:l • 7173 • 77'l8 .79?0 , 79R<' .ROll!>E•OO • 7:11? ,7'l09 ,79R'i .ROOH ,llOll<'E•OO
4 .7204 .7~24 .7<l49 .l'0) 4 ,H044?E+OO .7144 .793f. •RO l" .8040 .110440[•00
;J:;> 5 .1?1? • 7>lf>C, • 7Q7Q .ll039 ,l!Of>H7E+OO ,74)0. .79k3 ,804h • llOh6 ,ROhR'iF+OO
\D 1.0 -J
I .f\513 .17,,1 .H?6 • 751 '> .75">4?[+00 .1'><;94 .7H4 • 74'1<, • 7<,46 .7'5'>HE•OO
? • f,c,o 11 , 7 J "" ,73?? • 740 I ,74402E•OO .t·"'I" .7t''l!I .739b • 7434 .7440UE+OO
1 ,f'O.,f,7 • 7 ?11 .7341' .7417 ,745<;4f•OO ,h70] • 7337 ,74?? .7450 ,74'i52E•OO
4 .~.<;9;> • 7141 .1:>.7? ,744b ,74115kE•OO .t>710 • 711>? .744~ .741'0 • 74AC,7E+OO
'i • f,f,f,Q • 7?RO .7<+01 • 74f,'I .750117[•00 .h•U? • 7<+fifl ,74RO .7'i04 ,750R'>E•OO
4.0 I ,'iHHf> ,t>717 ,t-R79 ,6977 .7026HE+OO ,5<l7<.o .hli)O .69<;!< • 701 b • 70?f.f>f:. 00
2 ·"""Q .6& .. o ·" 7114 .1>1171 ,t;'l207E+OO .f>ll;>h .h 7t>3 .&Rf>f\ .6912 ob420':>E•OO
3 ,c;974 • f>f>73 ,hROR ,6RA7 ,69341lf+OO • I· 11 Q ·""o I .f-11'13 ,bQ?H .b93•7E•OO
4 .5Qq5 ·"""" ,hR]J .69)4 .h'lbJ?f•Ofl ·"'"" .f>-125 ,6<,l)f' .6<l55 ,6<l630E•OO
5 ,f.OHO • h7 J3 .hli59 .691'> ,6'1H44f+OO ,f'?'>5 0 Mlh9 ,h<l'>H ,697R ,f>'lfl42E•OO
1 •• 0 I .4 7]'> .">715 ,<,H90 .6001 ,b077.0.,f+OO ,4R7fl .SAJH ,5'1A<, .60'>'> ,607c4F:+OO
? ... 77 fl .'>h'>f. .">HI 1 .5911 ,';Q!<ORf.+00 ,4Q4<, .<;7<lO ,C,9) l .59f.f> ,':>«f!07f•UO
1 ·"""" 0 'ibliH ,'iH 14 ,'i'I?'> ,S9<lHf•OO .'>040 .st1 .i0 .5'l3f. ,')Yfi] ,'>'19?<1E•OO
4 • 4 Ii 7i, ."\711~ ,'>H'>3 ,c;947 .h0]7'>l•fl0 .'>071 .'>1<49 ."><l5f- ,MJ04 ,60l14t:•OO c, ,44h7 • c; 7"? ,'>'47P .C,4f,b .bO]C,Yt:•OO 0 0.,) R] .':>Jl4] ,5QH"o .b024 .l'>O.JSl<F•OO
M,O I .:Hf'4 ,4R?.4 .50?'i .5149 .'>?4lllf+OO • 3'4C}t1 • t.4h? .513 .. .'>?lh .'>?.409~. 00
? • :•A I c; ... 7113 ,491\0 ,507? ,51 ... l'IE•Ofl .4f1?t, ,4Q1'> .507~ ·") 40 .'j)h)t<E•UO • iHH'"> ,4.-1] !' .41.iH? .'>O'i'> .'>17?':>f.•00 ,4 J Oh .41..170 ,<;()QQ ,c; I c;4 .':>! 7('4f•llO
4 ,]407 .4A]O .4'<'l7 .-;llU • ., l YJf,f •nu • ~ 1 :-t4 ·"""?. • '> 11 f' ·'>174 .':>!93'>f'•UO 'i .1<>Q? •"'Hh7 • ">Oi'I ,51?0 .-;;-094[•110 •I~ ?4 ~ • t.,o ~1Q • c; l 4:1
·"' <li' ,o.,209:iF+OO
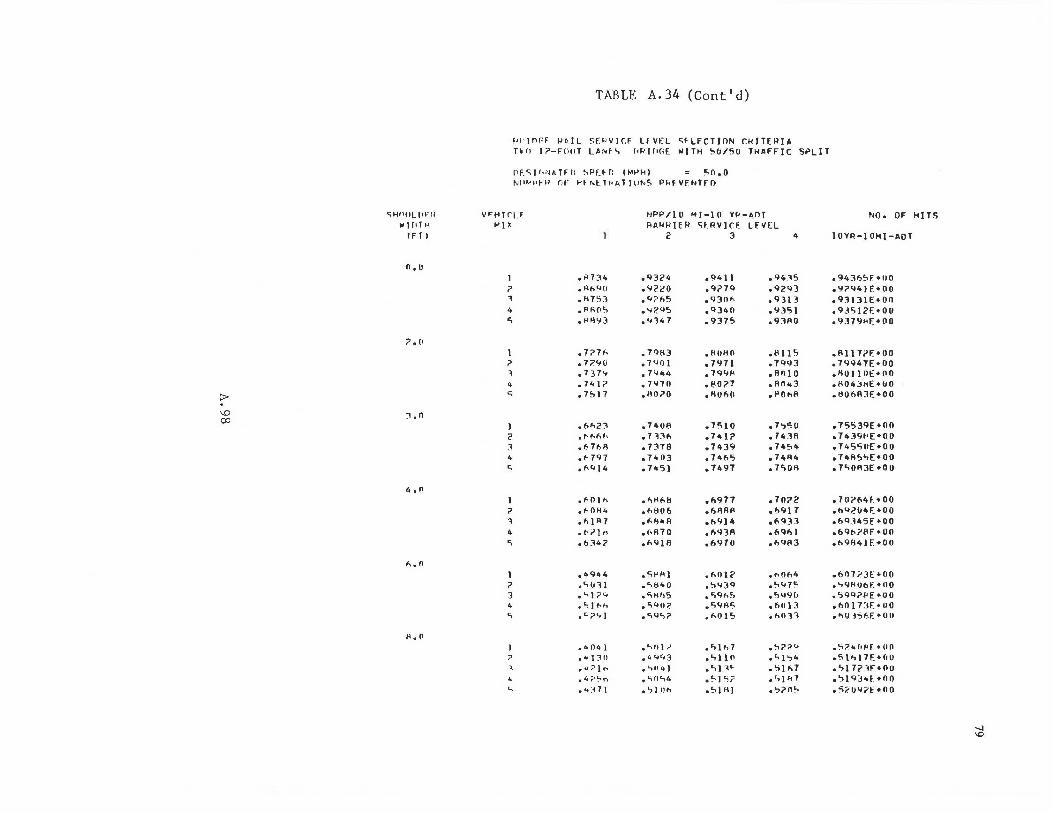
TABLE A. 34 (Cont'd)
1•1·111r:f µ~JL ~p:·vJr.F Lf V[L <;fLfCTJON r.HJTEHIA HO !?-FOOT LM•F'> l<li!f1GE WITH ~IJ/50 HUFFJC SPLIT
f1[<;J~Nhff() ~P[~n (~~H) = 'iO.o Nfl"'H~P nr f'~Nl:lt<AT]llNS PHFVENTFI)
<;HnlllflFfl Vl"HJ rL.F NPP/lO MJ-10 YJl-AOT "'O • OF HITS w 1 l•T"' ~IX RAHRJER <;f_RVJCE Lf llEL
IFT) I 2 3 4 lOYR-lOMl-AOT
"·" I .il7J4 .Q]j>4 • <141 I • 94.15 o94]65F•OO 7 ,Af,<;11 .9220 ,977Q ,Q2'1J ,9?'14lf•OO l • 1\7';:1 ,«;?65 ,930i> ,93}] ,9J1J1E+OO 4 • ARO'i ,'0?.95 ,Q340 ,9J51 ,9J51?F:+OO 'i , !Hl\13 ,<;14 7 .9375 ,9JAO ,9]791'1:•00
('•(I
,777;, • 791:13 0 1\0HO ,A 11 C:, ,Ill l 7t'F:•OO ? ,7;>9U ,7<101 • 7971 ,7q93 ,79947E•Oo 1 .7J7't ,7944 ,79'<1\ , fln IO ,liOI IOt::+no 4 • 741? ,7970 .1_1071 ,Ro .. 3 ,H04~11E+IJO
>- c; , 7!> I 7 .HO?O ,H060 ,PohR .l106RJE+OO
\0 :i.n CXl
I ,6f>2J ,74011 ,7510 ,7.,50 ,75539E+OO 2 .t-f-.lif1 • 7 JJf, ,741? ,741R , 74391•E•OO J ,f,7t,R ,7)78 ,7439 ,7454 ,745'iOE+OO
" ,;,797 ,7403 ,74f.5 ,74114 ,74R5!>E+OO c;
• "" 14 ,7451 ,7497 , 7">0H , 7'iOR3E +O 0
4.n • f.O I h .hAMI ,6977 ,70;>2 , 707f.4f_+OO
? ,t-01\4 ,f.!IU6 ,6RRfl ,1>91 7 ,t>"2114F:•OO l ·"I A7 , f. lj4 A ,69)4 ,69]J ,6Q]45f •00 4 .h1 111 , <• R 7 0 ,,,93R ,69f)I ,69t-2RE+OO 'i ,b]4? ,f,9)1! ,6970 ,f)C/113 •"9R41E•OU
"." 1 ,4944 • 'il'A I ,Mil<' ,t-064 .607i'JE+OO ? .C,()J 1 .C,t.140 ,59]Q ,.,97C, o'>9ROtif.+OO 3 • "1 ?4 ,'i111l5 ,c;q,,., ,'>'1'111 ,'jQQ?f<E+OO 4 .C.,lf>h • c;<in;> ,5<iA<; • tlfl 13 ,601731:+00 ., •"?"I • C,'IC.,? ,f.015 ,f,fJJJ ,.,U i"it.F:+UU
., • n • "04 I • <,o I~ • ., l h 1 .'>??" .<;;>4flf<F + 110
;> •"]~II . (., "'"3 • '>110 • 'i l '; .. .51'117E+l1U < •.:,? l n .'-llltt) ,C.,) v- • "l "7 o'>l 7?:lf+OO
• .4?~n ,'ifl'i4 •<.I c.,; .... )117 .':>l'l34F_+OO ., ,1+:Hl • l> I Oh , 5 I 11 I • 'j;>O<. ."i?U'17E+OO
-..J \0
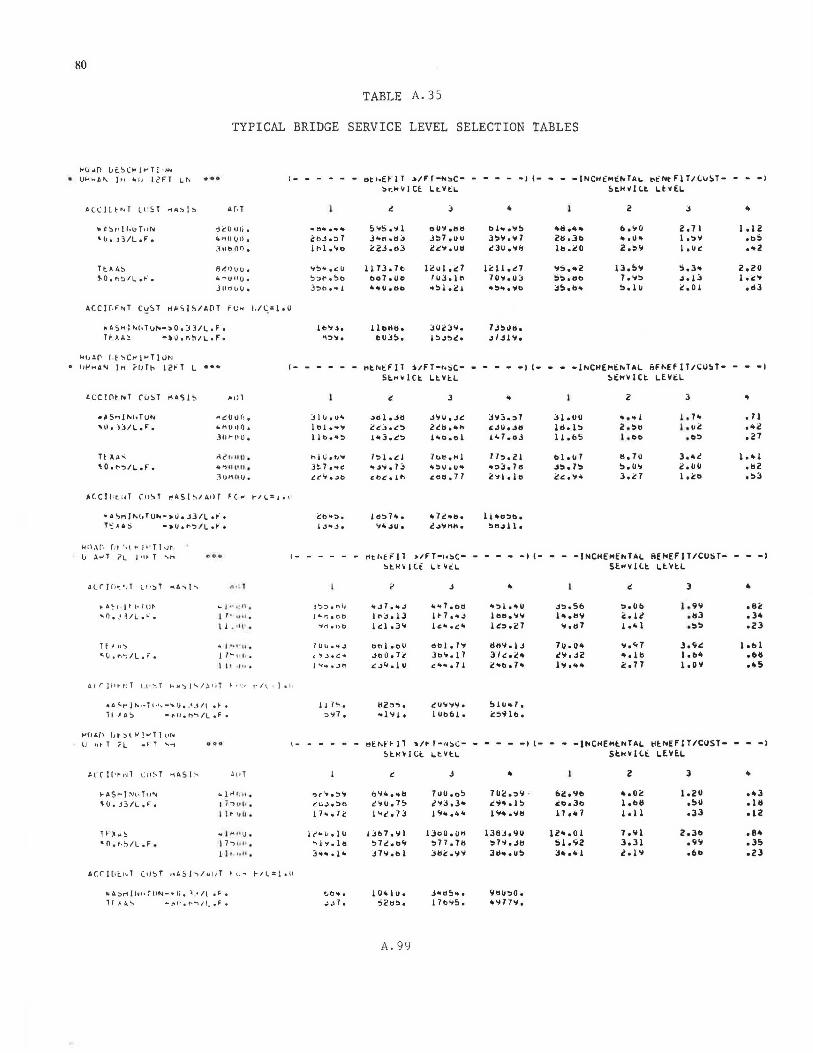
80
TABLE A. 35
TYPICAL BRIDGE SERVICE LEVEL SELECTION TABLES
"'\J•rl v~~(" Jl"'TJ di• • U"'1~1Jt<.., J,t ~i1 l2F'T L,....
"'t'::>r1t l.uT11N • ~, 1 3 /L, F,
Tt) A~ ,_O. f"l~/L ......
dl:'O uo • .C..l"\(l(JI).
Juonn.
8/!IJ\JO • 4 ... uou. J ltrjl.I\).
•A$><l~hlvN-~O.J3/L,Fo
TfAA~ -)~.~~/L•'•
'<1,~r f , t~C>'l"Tl1.m
• lll'><A'< In (lilt> l2fl L ••"
.,0,5,,1,._.1,Ju~
'\\I• ·1:i/L • J:° •
H1.A'~o.r-.,IL.F.
k11,1r. r,, '" .. p·T[,;r lJ A>'T ? L I •If T ~"
•6~1 - P'<·IOt
"0, .•~/L • .:.
Tf 111-:-
"'l.J. f"'l")/L. F.
~Lll
"~O l.I(• • 4kU11() I
.'.\0>-11 u.
~il?1 1 11t1.
itl")tll' ll 1
1l.lt1 11 U.
n t . l
~ 1 •• .:•1. IT • u11 .
11 . "i' ·
.. J·· · 11. 1, ... , ,; .
l i" '" .
1111Q'-t"l""' • •it ·~ ~-"" r;, .~.Jlt .... H 1/>.I;, -.1'11.h"'l/L .F.
~flA(l \Jt :;..l ~ !'""l 1 UN
U "'" T rL .. i- T ""'r-t
P.AS~l~t' T"" HJ,J3/L,F,
T ~)" ~ 111:0.1 . ~/L.F.
...
""l~IH • •
I ; -, '''' • II • •1fi.
.. I Ii ••u. 17., 1. 11 . 11 1 1111 ,
1t.4:>r1Jf>1l•fllN-,.li. 'I ~/l .F •
- ... 11 • t-""I ! I_ • F •
I- - - - - - 11to.HIT .. /FT-.. ~c- - - - - -1 ,_ - - -INCHt,.thhL t>t'Nt:FlT/lvST- - - -1
.. 0 ...... ~
2h~.:i7
l 1' l ""'
..,~ ... c:u .,,,,..,.,,b 3~t> ....
~~kVICE L~VtL ~lHVl<..l LtVEL
:,,.s ,\I l J"-n .,;,J c2J.11J
ll73.7t> ba7.oc ... t.1.00
I lbllbe l>UJ'!>,
oU.,, .t1t1 J::>7,uu 2c ... Ull
li!ul .id IUJ.11\ .. ::.1. <! 1
bl•·"'~ J'!>\I • ... 1 cJu ... i,
1;:11.n 10...u;, ..~ ... 'Jt>
7 J!>~ll. "I JI \le
... ti .... 2t!.Jb lb.cO
.. :> ... 2 !S'!>ollb J!>,b ..
2 J
z. 71 1.::. .. I. uc
1 .12 ob!> ... 2
2.20 1 .c11 .dJ
I- - - - - - ~tNtF!l ilFT•hSC· • • • • •I I• • - •INCHE~thTAL ~fhEf lT/tU'!>T• - • •I
'.J l ll 1 Ult
lb l. """' l lb,•::.
nl li,,,_,, 3~7 ... e t~"1.~c
St,.•ICt LtVtL ~tH•lCt LEVtL
"" 1. Jll c~:. .<'::. 1 ... J.c~
7:> l, c I .. .J°'lil. 7 ~ C.bt!. .1t1
3
,, .. u •. u 2c11 ... ., l .,o .o l
lbt>,Ml '+~U.O't
coo.77
• .l'll:J. "1 4'JUeJll 1 '-1. <1.l
77:>.21 ..,.3. 7d c '1 I. l t>
JleOO Id. 1::. 11.t.5
() l. u 1 .IS .1:> C'c::.'14
2 3
l. 7., l.u2
,b:>
.. • 71 •• i .21
1- - - - - - r<tl•fi'IT >IFT·1o~C- - - - • -> (- • - •INCHEHl::NTAL BENEFIT/CUST• • • •I
''J:>ef"'lfJ
J 4r: 1C". b
"llt1 et>b
1 Uli e't .J
"".l•C .. J"'ot•..J"'
11 7':>, ':>"'i7.
~tkvl(f LtV~L 5EMVl<..t LtVtL
't.j 1 • .. J 1 .. :. .JJ l Cl • 3 \I
oal.oU -'bO • 7 i! £:"''-.ju
j
4t't7 ,Dt:I I~ 7 ,.,:, 1, ... c ..
dill., .. 30 ... 11 t!. ...... 7 i
cu'il"'I • l lib bl,
.. .. :!:) l ... 0 I 1>11 .... ...
l <':> .c 7
1111\1, lJ 3 lcoC4 ~ .. b.7tt
711. O'o c11.J2 111 ....
3 • .ac .3• .z3
1ob1 • bt! ..s
,_ - - - - - ~ENf~Il ~/~ r-~~c- - - - - -1 c- - - -lNCHE,.tNTAL ll~NEFIT/C~ST- - - _,
""""·'='"' t:'V.Je:>b
!1•.lc
lt'-liolU ~I.,. lt! 34'~ • l"
~tk~lCt ~tvt~ StHVl<..t LEVEL
()'14 ... b
<'llU • 7~ l "c. 1:i
Lsb7,\ll :>7c.t>'< 3711 ob l
A.99
.l
7uu.o'!> t''fJ .J ..
I '<<t ·""
13110.Uf> ::.77. 71l J11;: • .,,.,,
• 7Uc o:>\I • c'l4 .1::. l \I ..... t!
l J!!J • 'IU :>7 ... Jb Jd" • U!>
&2o9b co.3t> 17 •• 1
12". 0 l !; l ... 2 J ..... 1
•.o~ leb8 1.11
3
1.211 ,!>II .JJ
•• J • 11! .12
.e•
.JS
.23
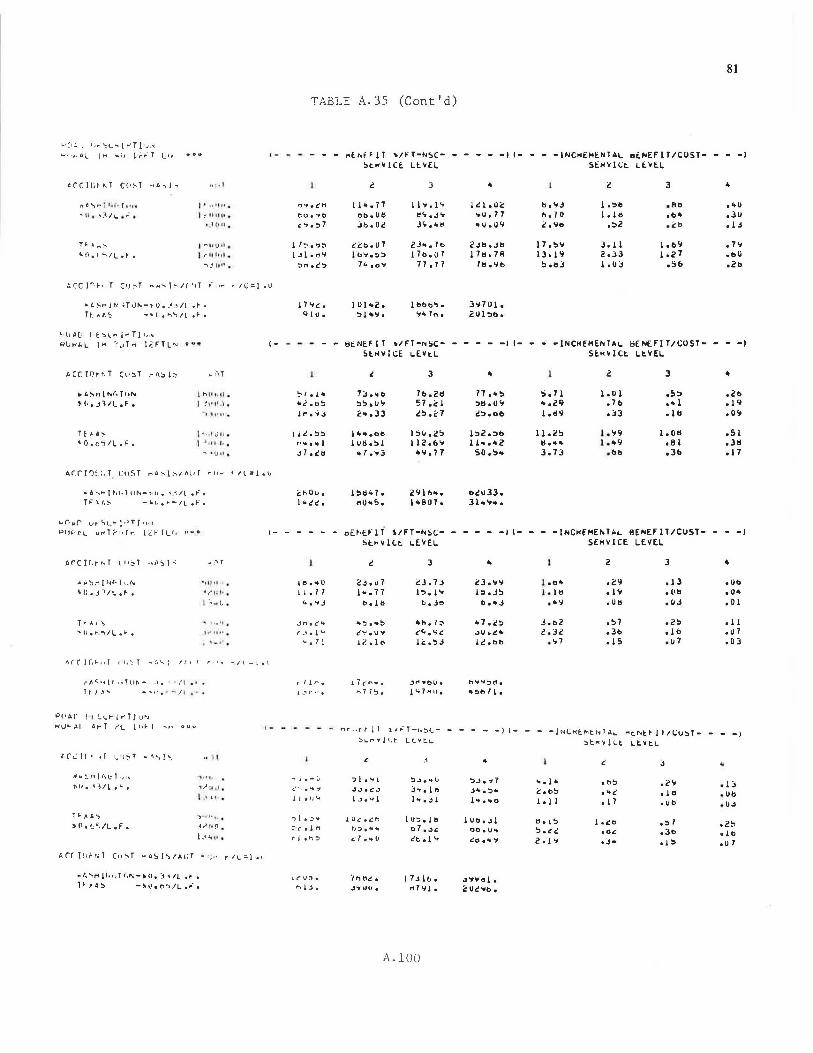
L•('1.:' l;r" ~L ... lr-'TJ•.) .~
L't.,_AL 1,.. ~'' it-.--r L1.,
t.r:Cl/Jt"-1 ((1~1 .,6'"'.IJ..,
,,t1.., .... 11 ... t. f 1114
~ 11 . _,:~IL..•,: ..
TJ. .-. "":-i
'4r. fl• t ~IL .t·.
h 1 ' 1
I ~ II 11 \I •
, .l f1 c1 .
I "" h lJ •I •
1' 11 h1I .
""1_1 11 ' ' .
•t.S~ll'' ;TLl""-'IJ• .~ ,/L .t-. Tt_1o/\~ _,.l•.,..,"ill .~.
f lJ IJ.{.; I t ':> l t-. i"' TI t.1 ..
~lJ ... ·AL lM ?uTP1 lCFTLl\J •-o•
.,,~ri1r-.r,f11~
,.(, • .llll .~.
H ~·~ ~0.o':llL.F.
lt1 i1 1i 11 •
I!'''' ·' · -. l ~·II •
)1:-·ll!• =· \ .. tt l •• •
81
TABLE A.35 (Cont'd)
,_ - - - - - ME.O.H!l ... /l'T-N~C- - - - - -1 (- - - -INC"E"'tNTAL. tlt.,.EFIT/CUST- - - -1
IC =I • ~
l'l., •CH eo • .,o c..,. ~7
l ''='. "~ l ->l ·""' ~n .c'~
~t,.•lCE. 1.tYEL StHYILt LE.YE.I.
114.77 ob.Oil .Jb.Oc
cC'.b. u 7 l t>'>'.:i:>
7 .... o'f
J
11 .... 1., ~<, .J .. J<, ... ~
2J ... 7b 17b.u1
77 .11
1 cl• UC'. .. u.11 •U.U'<
2.lb.Jb l71lo 7R
Ill .'lib
J'll70l o
"Ul :>!> •
17 .!>II lJo l <;
!> ollJ
l .:.ti 1.1 ..
,!)2
J.11 2.JJ I .uJ
3
... u
.Ju
.!J
t- - - - - - Ht:NE.FIT •lfT-NSC- - - - - -I 1- - - -INCtlEME,.TA~ llE,.EFIT/CUST- - - -l
:-.1.1.-4tt:? .c~ u· • -...~
l I c • :>:> ,, ..... 1 .>7 .cts
5tNYICE ~EVtL StkYICt LtVEL.
7~ •• o :>!:>. u .. ""·33
14•.od 1us.:.1
.. 7 ... J
3
7b.21l 57 .i:: l 11!!>.<:7
1:>11.<!!:I 112.6"'
.... • 7 7
.. 77 .•!> :ill .U'< /l!:loDb
l:>2 o:>b u ..... 2
so.!:> ..
11. 2!> ij ... ~
3.73
I. u l .1b .::.3
3
,!)!> ... I • 111
I. 011 .el ,Jt>
o2b ,J9 .o,,. .Sl .311 .11
Ar.r10~.;1T . CtiST r"''-'::'ol~//ll1T ,.,, .. f /l =1.1..
•A-...1-1Tf'11.111r...-~ ''· '-!/L .f. T~'lf;~ -fr.l •• ,. ... IL .i:.
2'<16 ... 1"807.
C>/l!UJJ, 31 .. 11 ...
~n,,.r ut io,t.~ 1· 1 TJ.,., Pllj:..t-L Ml"'lf-'11f1-: l.:'.t" flf · 1- - - - - - t1E~Efli 'IFT-NSC- - - - - -1 I- - - -1,.C,.EMENTAL BE,.EFIT/CUST- - • -l
ti.re I,,,."· r l 1 1 ~ l """''' r, 1...:.
,,. i.> ~:-t 11..,r- T 1Jt'.
\.. IJ. J 1 IL• J. •
Tr A.' ·;
'~l.t"")/L.•.
... :' T
~1 u ~· • 1 t•=t· . I \~L .
' ,..,1 ' .
,jn. c''t
r _1. l"" i....11
/\ ( ( } f1 lot' J I I I'= T - !. '-.. l I I 1 T ,. •' ~ .. /I - i •I
,"l\C:.•~Jr ·~TUI'- 1. • /I•' .. 1 ~ } ."'I.... • ~ -. 11
P( 1 t.t.r lr~L,...l,.,TJuP.~
..,.U ... AL ''"'T r'L jll~ I
A ... ~,.., IN(: T 1,1, "till. i"3/L .....
l ~- .... .a..., ""· ,...!..:,/L .F.
-.., .. o~v
.• 11
i t' ;1,, . l .• .+ 11 .
, .. ,. " . ~"' " n • J.''4 11 11
.. r.'"'ril'~•:T(1,..;-iiu. )1/L ·"'. 1~ 1'.C.~ -"!rlV.ri:l/L.,.·.
,_,, ....
·- - - - - -
.. 1 .... "' , ....... '"1
l J. u~
..,1.-., .. ~ {"" • l 11
l"J .,.,:i
Stt<Vl~t ~EVEL SE,.YICE 1.EVEI.
2~.u7 1 ... 77
be lb
-~ ... ~ t!"':l.u.,, 1<.. l l'
J
C.J. 7 J
l=>.l" b .Jt>
4tb. /:" cc.. .4c Ii: .:>J
jr'•blJ.
1""'7 "41/.
,.,,.1.rt-ll 11P:T-1.:;:.1_.
~1..r w J c.t Lt...- t.1-
! Uc' .cti ,,:;, ... .. c.: 7 ... t.1
.1
~.J ... 1..1
~ ... ln l• • .JJ
l U:>, j b 0 7 • ..;.::: <to l '1
l 7 j lb. ..1 ... 1 •
A.100
..
.. 7 oc:>
.)U .~ ..
le obC>
2
.!> 7
.Jb
.15
3
.13 • (.lb
.uJ
.2!>
.lb
.u 7
.. oO!> • Q4
• 0 l
• 11 .u1 .03
- - - - -11- - - -Ji.t;><t""ti.TA'- Me.,.,t:•Jl/!;u:>T- - - -1 ::,t"YlLt LtYt.L
..
I UOo.>l t>t>.u ..
Co•"'.,
J .co oOC .J ..
.i::i
.Ub • U.l
.2~ olo • u 1
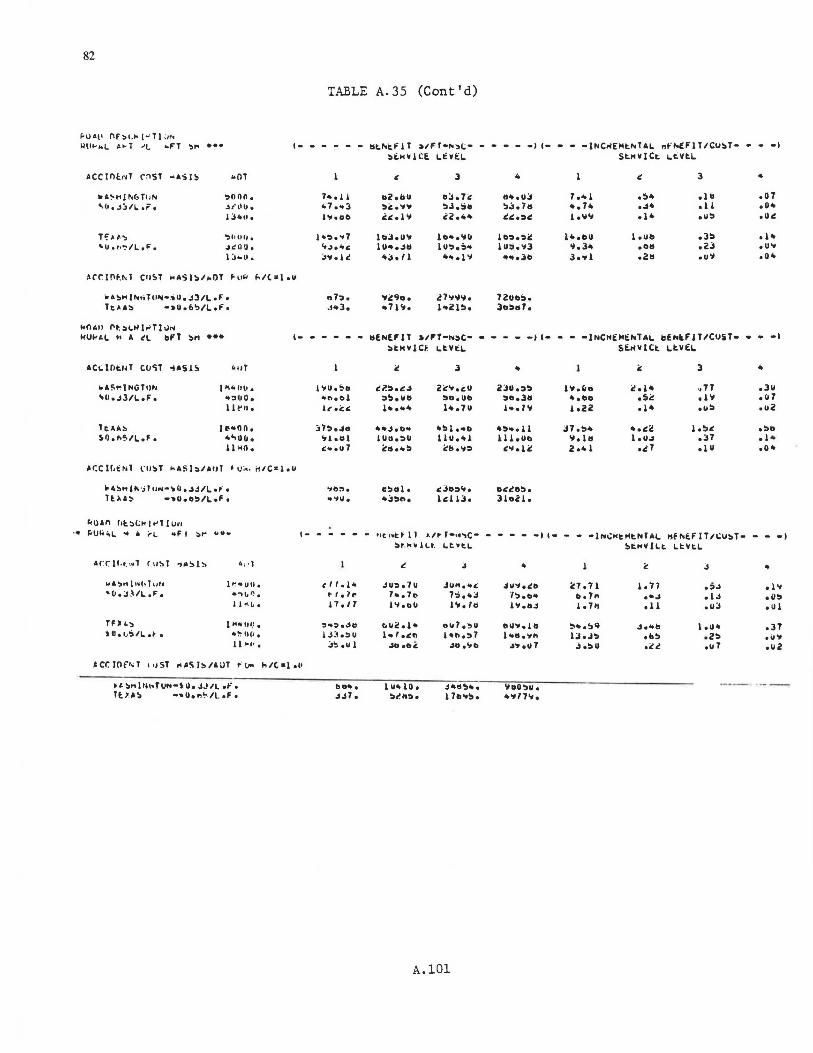
·•
82
~u•I• l'IF:>L" 1~· T1 ;,.., M\'"'"L ~~l ~L '"FT .... ...
ACC Inti'll C"~Sl ..,,., I~ •l>l
"~~H!,.,(,fl:N ':IOfln • 'b • .J)/L .F • ~ll'O•
I J•11.
TIO•~'> ''''"'• 'U .t•'!'/L .F • .s~ou.
i:, ... o.
sA)" lr.tH\l"i•>iU. Jl/L .F • Ti:.AA) ••U.6~/loFo
kOAll N.::il.lllr'TluN
c- -
TABLE A.35 (Cont'd)
- - -- llt."'t.I' 1 T >IF r-.. :.<;-loi.tcW 1 CE. L.tWt:L.
II l
1 .. • 11 112.11u 11~. 7<: .. 1 ... 3 :aic • .,,.., :iJ.s11 , ..... e. i.t!. .1 .. ~2 .....
1 .. :i ... 1 lc:.J.11 .. le:.•·"" 't.Je4fc lU•o_,11 1uo:i.:i .. Jy. i I!. •J. 'l • ... 111
-- - - •) ·- - - •lNCl([Mtt.lAL nf"'[F ll ICU!>T• - - -· SttcWlCi:. 1.t:Vt.L.
• II 3 .. 11 ... uj 7 ... 1 .:; .. .111 .07 :i.:s. 711 ... 1 .. .,., .. .11 ·"" 11!.t!..:it!. , ...... .1 .. .u:i ollt!.
1 .. ,.:,11!. 1•.c.u 1.uc. • J:i .1 .. lu:i.Y3 '1.3• .011 .23 • Ulf .-..Jo 3 ... 1 .211 eUY .o ..
HU~iL ~ A tL bFT )H ••• I•••••• llE.NE.Fll alFT·~':IC• • • - ••II••• •lNCHEMthlAL. llEN~FlT/CUST• •••I )tHVlCf 1.tVt:L. SE.riVlCt L.tVEL.
ACi; IOt:r• T ClJ'iT ·OSl!i •ur I!. l .. ii: 3 .. "'!''"INGTtlt. I'"'• hl•. I "U o!:ll ci!:i.11"' 211!. ... cu 2Ju.,:i lY.lio t!..1 .. ., 77 .Ju .. O.Jl/LoFo 't':IUO • ....... 1 ::.:i.u11 :io.ub :io.Ja •.c.o .~I!. .111 •II 7
11 t'll. 11.cc: 1 ...... l•• TU i .. • '"
i o22 .1 • .u:i ... 2
Ho!> 1 t"•O n • :;1:i.,.,o .... .S.b11t •':I 1 ... c. •:i ... 11 J7.:i• ... t!.t!. 1 .:i11 o:ib S.ll.fl~IL•' • ""Ullo .. 1.111 11111.:iu 1111.0 u 1.uc. .,, .111 1.11,., .J7 • I•
11 ~". , ... u 7 4::11.•:i ctt • .,:i '""ell!. 2 ... 1 ot!. 7 .1u .o ..
Ar.C 11.t: Nl \"U)T "'ASI ::i/Atil • u;,. HIC1<l oU
~~)"i~~luN·~o.,.,JILo~• ..,~:it. e:ictl o 11JD::i ... Ollf!ll':lo ltU~ - .. u.11':1/LoF • •"'"· •J':lfto 1'1 u. 31ocl.
s.oan fll)tl< [t'l !U1'1 l"<Uli•I. .. ~ i-L "FI ., .. .. ... 1- -- ••t .. t. f 11 '·'• r-·•..,c- -- - - -· ·- - - •IN~ICt~t.Nfli>L l!f ,.E.F IT ti:Ul> T • - - -· l>t .. ~ i l.t. 1.t.•t.I. !>ttcV!l.t. L..t~t.I.
Al:C: 1f .t.1•l ( lll> t ~·~ll> . , . 1 t!. J .. ii: J .. WA';)"ll't;(,fuh l "'. .. Uti • c 11.1• "'u:i. 7 u JIHI o "" JllYot!.b 4::7. 71 lo 77 .:..> • 111 '0.:S.l/L. .F • •':"t(,f"!. "''. 1 rt
1 ... 7., 1:; ... J 7'::1.c. .. 1>.1 .. .. ,., ..,., o 11'::1 11 .. & • i 1.11 111.011 Ill.Id 111.11_, I• 71! .11 .u:i .111
TF) •"> 1 H .. 01_! • ~ .. ~ • ..ib t.Ut!.ol" ou7o!>U llU'f o 111 ~ ... ':IQ ., ... a 1.11 .. .J7 > u. ,_,'f)/L, ·". ·~uo. i J:i.:.u l•lot!.fl i •t>.':17 1•11•"'" lJ.J:i ob!> .z:i ·"" ""''. ~':. .u 1 .,a.oC ,., ..... «> .s., .u7 J o'::ICI ot!.i .u 7 .u2
i Cr. J[lf"' T I •JST ,. • .,. ll>/&UT f l.M "'' •1 •••
•& )r11i"l1•TVN•' 0 • JJ II. oF • ba-.. 1u"10. J"<l!t ... 'lllO':IU • --- -- --TtH~ --.u.rt~/L.F • JJ7. :il.ll:h 1 7t> .. !>. .. ._,7 ...
A.101

..,vt.11 1 1 i:>c~ l ..... T 11' • . u .... 1 ?L l 11~ 1 <;H 1-
•rcir>'<"T r:u'> T ,.,~~ r) ·• · I
,, L ~I I l (,.,~ 1 l,f'I ~ · 11 h .
~o. 33/L .~. -..i u b fl . jc; ... t •
lF:au._, ,,, ll l tr n. 'O.r-ii;/L.F. rll}tll••
,~ ... •).
ACLlfH·••T CPST 'iA~h/AllT 'l•w ~/L=J .U
,.Ai.;r}fl.lhrOr~-,o."i.i/L .F. l'-AA~ -11u.ti~/l.~•
""'tJAI" !)f ~(.h l '-'l l tlf• u •• 1 d. •FT ~H • •@
ACf.IC•r"-l LIJST ... sf<; ~Pl
'ltA~ii''"l~t .. ltiN 2 u I vu. "'lJ • ,j)/L • F' • .,I) Jll 1
lci.u.
TF.A"~ 21l l uu. Jdl .t-ii;/L .J: • HO Ul •
,,jl.etU •
•.4$H}l\li..f0N-,.0.~1 j/l ,i: • TFA~S -~u.n~/L.F•
><lJAf, nt-~lkll'TJui;
••• l· ~ ~~T ~L ~f T ~~ •• •
...
,.11s,1J r·.1.111r• ~~.3~1L.~.
TE~•<;
'-u • t>':>/l .F.
•111 r
l l ll UU • "1CIJll •
~ ....... I I tlOP.
"lt:..lJO' ~ .. lJll,
~A!>'1 jt,(, [ IJN-00, U/L or', Tt~AS -~u.6~/L.F•
Rl)AO Df~C"H I PT! ON ll I"' •HT i:"L 'tfT -;.., ...
ACf.luf.Nl CU!>T bASI5 AUT
wA!)H)NFTVN I l U vo. '1-0 • .l31L.F. '-'~UlJ'
!:>'>110.
H ~AS 1100". 'IJ.li'>IL.f. ""t"'U U •
':"·• uu.
ACC"IDENT COST f!4Sl~/lDT fv•
~A5HINGTUN·~U,13/Lofo
Tc XAS •\U,,.,~/L.F •
I -
l •
(-
t</l =I, u
TABLE A. 35 (Cont 1 d)
-
-
- - -
111.uu ht'\• Ub t:."/ .~b
..1.Jbebl l .i't .Lt~
:> .. • c ~
Ii l':J, ::, .. 7.
- - -
JUc, 7':J l '0 o':JU
411.t10
!:>.,,b,Jc ~_,I. Ji1t
'7bol2
t.o ...
.lJ7.
- - - -
l!.J.'1.3 ~~.c.~
~':J ... j
t'C4 ... 1 l n·( ,o'1
ll u. l 7
- - - -
lt>':>ot>tl 1;,~.:01
tH .JJ
3cboJ" 21<!., .... l 1>11,cU
be•. jJI •
-
-
-
-
Hctllf J T >lfl-••!>C-!>t:.• •!Ct. L.• •t:.L.
?
c I 0 ,.l4 t<J. 7<: Jj ... 1
"14 .JI l tJM.. (,I 0
OfJJ. 7tt
11<'.5'>. ..1'11,
HEt•tf IT
J
d!'l.cT b':Jobtl ,, .. • 7 u
., .... o~ lbb, 7b
bb .J':J
)/fT-t•!>C-::.t.><•ICE L.t:.Vt.L.
2 3
333 ,\I!> JJb,\lc llL'o .. l I J• o l u
!:>Job3 !>4. 31
057. 711 l>bJ.l>::S 21>lobU c"" .1:; lU1>,0J 1u;,,111
l u .. 1 u. 34ttt5-.. !'l<'.b':Jo I 71>\I:> •
nf 1.r f 11 1'/t- l-1.,;:,C-
::it. P'< " l I~ t'. 1..r- w ... L.
t!
l .,,4,tJ:> j j 2 .... .,
"''. l u
co':J.c< Cc.l, oit' l ::su .ell
llcNEf IT
l .J 1. u c 11 .. ,.,o
o I ,c I
l.b"l,'1U 2c:0,7J
l .JC'·"'"'
~Jo::>~• ldllo
~/f T-N!>C-St><~ I Ct. Lt.~ i!.L.
i! 3
l1>c. 11> lb .. ,JI! 1!:>2 .11:. l ':> ... 21
ti ... 72 \IU,:)c
3':>9,911 Jl>J.ltl :io1.01 3U.3,7'> 171>.72 l 7t1. 2'1
l ~ .. 1 u. ;i .... !> ... ,, .... s. l 71>.,,!:>.
A.102
-
-
-
-
83
- - - _, ,_ - - -INC>ltl'ltNTAL HE,.,fflT/CUST- - -_, !)f.><V ICE. L.t.•f.L
.. 2 J .. d 1.0., 11.10 2.~3 ·"'" • .3'l
ha • ..i"I bobl • ';7 ,Jb .lb ,j .... "'1-J ,/, 7b ,311 .!!:> .06
... :!/ .!:>!> 33,bb •.dO I ,bll • 711 1111.11 IJ, .. 1 1 • .,, l .7!:> ,31
btl,\12 !;,4J .11 ,JO ol 3
- - - _, ,_ - - -INC><El'lt.NUL. t-E NH IT /(.;U!>T- - - -1 SEkYlCE Lt.YEL
" 2 3 .. 337 .tl':J Ju.21 1 .113 ,':J!I .20 1 J .. ... 1 12 .o!> .11 .2J .011
':J ..... b ... as .31 ,uti ,OJ
bb!:> ... b !)<,1,bJ 3.bO 1.1 .. • .. u 21>" ollb 2J.7J 1.!>1 .... s .1 b 1U7,27 11,bl ,bl , lb ,01
\lbU.,U, .. .,,77<,1.
- - - -1 I- - - -Jl•C"t .. tNl~L. .,t:,.,tr I l /~u::.T- - - _, ::.£>< 11 l.t L.t. Yt.L.
.. c J .. I J7. t-J 11.J .. l .c::o ... b .111 ll':>oi!7 ~. :J.J 2.111 ,J .. • l !>
o 7 .bo ~-~" • .,3 .i!J ,(J ...
211 ... ~ cc.~- '.!:>J ... 1 .J!:> cc7,u .. 111. 71 i!ol I , 71> .2.;; l jJ .c 7 11 • ~' I oc• ... ., .11
- -- _, c- - - -INC><~"tNTAL. HENEF IT /CUST- - - -1 St.HVlCE L.f.YEL.
.. 2 3 .. ltl4 od9 11>.!:>7 1. "" .Ji! .11 l !:> ... b .. ll.bl> ,tit! ,2b .u ...
'ilU, 71 boll o!>C , j ':J .ob
31>4, I t1 J2,63 2.u1:s .tie:? .22 3u ... ~9 Z1 ,2-. I. 7., ,!:>.< • l ti I 711, 711 lboUZ 1.uc ,JI .11
';bU'>U, .. .. , ,.,, .
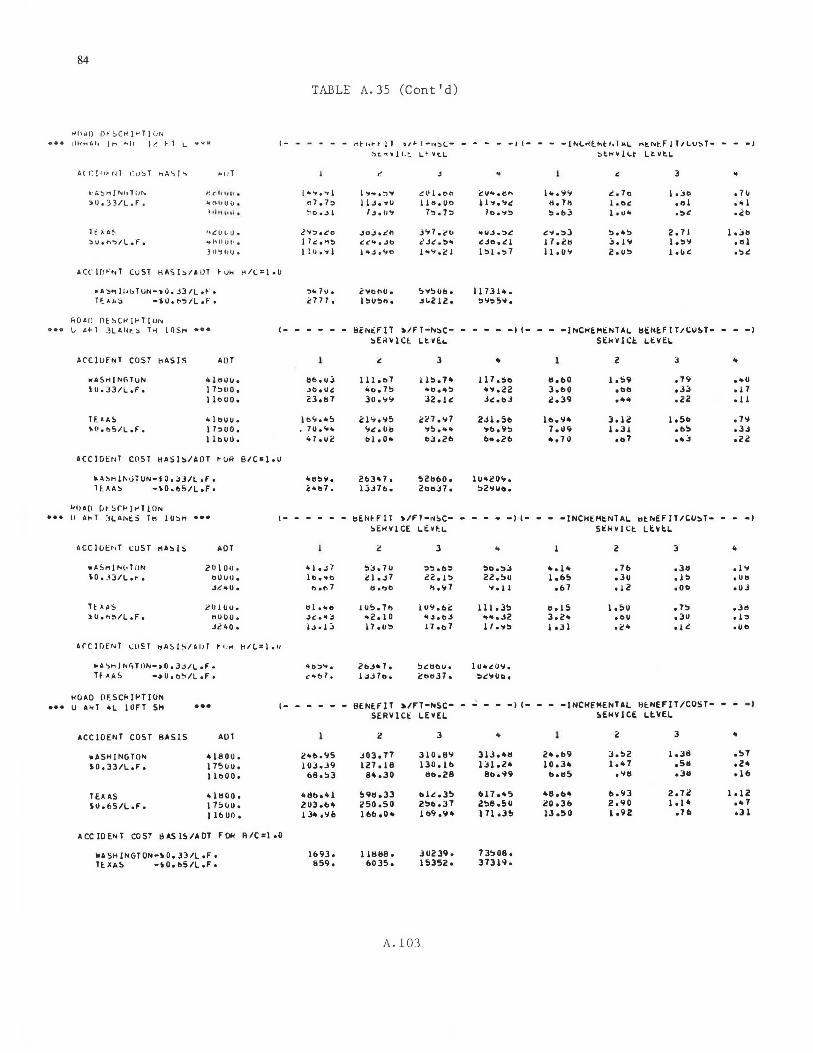
84
TABLE A. 35 (Cont'd)
W(l,YI) D;:;Ct<)>'T[i1N 1H~t"1 lor•i I" "'' I~ fl L ·~· 1- - - - - - r1 t 1~~ ,- l 1 !111.-1-1 ~ :::iL- - - - - -1 1- - - -1,,(.t<E_~, ~t.T"L "tr.t:.f IT 11..u::.T- - - -1
~C.1'1vl1.t. Lr Vt.L :>t" v I Lt: Lt.Vt.I.
Al r.1111·rd 1:u~ T '°'A"'i I "'i .. uT ~ J " 3 .. -:.4~N!l\!hl(H-. >-: ~ h111 1 . l ... .,. • ..,1 1., ... ~'; ~I) l .t'h cu~-~"' 1 ........ c..7a 1 • ..10 .1v :>U,33/L.F. 4C\hUIJ • n7,7'!> 11..1 ... u 11.,.uo !! ..... ..: 11. 711 I•"" • ti l •" 1
~ . .,,,q,. ~ o •J 1 1.s.u'I 7'!> .1:. 1De'1~ '!>ob3 I. u" ·'!>" ·it>
1 t ~ A~ >-\~lJl,IJ. l"l'J.Co .jd,J.~tl ; .. 1 • .- ... ..u.j.":>~ .C:'<I.'!>) '!>e4'!> 2. 71 1 ,;,11 ~U. f"l ")/lefe .. Mllut• • I 7 c: • >1'!> £~ .. . .lt> c..1..:.:." .C:JO,.C:l 17.itl :;.1._ 1, '!>II • "l
3 0lj CJIJ • 11 11 . 'l l jAt~e'iO I"".~ l l '!>1 ,-,7 11, o 'ii 2 .u'!> l. u c: ·'>"
AC C w.- .. T Cu ST H A5 l:.O UT ~ "" ,.11: =I• U
~A :,M lil b TUN-110 • j3 /Let-'• -;. .. 1 u. 2.,.onu. '>'t'!>Ube ll 7Jl'o. 1£•~:; -sU.tt':ltL.r- . i!171, I '!>U'!>PI • JuZJZ. '!>11:>5.,,.
r..O•fl nE~Ct<!f'T!UN u •~1 -~l Al<r_ ~ T '1 lOSH ... (• - - - - - tlEl'lt::F l T )/FT-fll'!>C- - - - - -1 c- - - •INCHE.Mt:NTAL. l!t:NHIT/CU!>T• -- _,
:;Ei!YlCl LtVE.L St:kY !Cl:. L.t:Vt:L
ACC!UfNT COST i.ASIS ADT ~ J .. 2 J ,. WA5H!NGTUN 4 l llUIJ, ~&.u) 111.01 ll'!>.T" 117,So 8,bO l .'>9 .n• ... u 1U.331L.F. 1 7:.uo. .>b .Ot'. i.o, 7'!> •b ... ~ ..... 22 3,bO .oo ,J..I .17
l louo. 2J,87 Jo,,.., Jc.le: J..:.t>J i!.39 ..... .zz , 11
TUA!> 4l1:1uu. I""•"'"> ch • .,,5 cc7 .... 1 2Jl.St> lb·"" 3.li! 1.so .1 ... ~ (•. ~5/L .F, 11,,uo. 70 ..... <;..:,Ob "1!:>.•1t .. b,9'!> 7.119 l.Jl .b!I .JJ
l lbUU • .. 1.uc bl. o .. l>Jo2b b ... 2b .. • 7 0 ,1:17 ... ~ .zz ACC lDEr<T COST HAS!S/~llT r Ull s1cc1,u
•A::. .. INGTUN-i0,~3/loF• .. ti'!> ... 2t.3 .. 7. 52111>0. lUiti!O'i/, H. AA~ -~O.b5/L,F• c"b7. l:>.Hb. 20<IJ7. !12'1Uo,
kl)A[l vr~r~I,..T!ON ... LI "'" T
~ilAl-.~:j T" lo~" . .. 1- - - - -- bE.N~fll 'l>/F 1-,•~C- -- -- _, c- -- -lNCkfMt:NlAL t>t.fllEF!l/CU:;T- - - _, ~EH WICE LtY~l. St:kv l!:t. Lt:Vt.L.
ACCllJE••T CUST HA~IS ACT ~ 3 .. 2 3 .. wAS.,IM•Tll N 201 o u . 4 l o..17 !:iJ, 7U :>~.b~ '!>0.:...1 ... 1 .. . 1b ,311 o I '1 10, ,l J/L ,r, aOuo. l tie lltC cl.J7 cZ. l '!> 2i!.!IU 1.6!1 .3u .l'!> .u1:1
.J~ .. o • f'.I •"' 7 tset>tl ".c; 7 'to I l .67 .ic .oo .uJ
Tt ~·~ c111uu. ttl ·-4' l U!>. Tl> l UY.bi:: 111, 3!1 ., .1 s l • !IU ,7'!> ,3tt >u • .,;,11...f. ttUOO. .,, ... :, .. 2.10 '-~ .o.::t ..... J2 3.2 .. •OU ,JU • l :>
J~40. I.> .1 ~ 17 .u!> 11.07 l 7 ... :. leJl •c" • l ~ •UO
Arc lllEr.T L:llS T t>ASl~/Al>T ~ "" H/(.:), u
-A~MJNGTllN-•0.3.>/L,F• 'to:,,,.. 2bJ .. 7. ~~~t>u. lu .. ~o.,, Tf •AS -aU.b~/L.f, ~litt:.1. I J..l 7o. c<>t>J7. '!>c'iluo.
l<OAO nF.SCl<lf'TIUN .;;; ... u A~T "L IOFT SH ... l- - - - - -BE.NE.FIT :./fT-NSC- - -- _, ,_ -- •INCHEMENUL t;t.NEFIT/COST- -- -1 SERVI Ct LEVEL !>EkVICE Lt.'IEL
ACClOENT COST BASIS AOT z 3 .. c 3 .. •ASHJNGTON • 1800. 2.,o,<;5 J03,7T 310 .ll'il 313.411 2•.b9 J.!12 1.311 ,'>T
S0.33/L,F. 175ou. lOJ.J9 127. 18 130 .lb lJl,2• 10.3• le" T ,511 .2 .. llt>OO, 68.!13 84,JO tlo.28 so.99 Oot15 .... 8 ,311 .16
TE1.AS .. 11100. •tl0.41 598 .33 olc.3!1 bl7.•5 .. 8.o• 6.113 2,Tc l "12
SU,!>5/L,F. 1 7'1vu. 2U3ob4 zso.50 2'!>o.3T 2'!>8.!IU Z0,36 2.90 1.1• •" T I lb uo. 13 ... ~!> 166 .o .. l 69 ·"" l 71 oJ!I 13 .!iO l .92 .76 .31
ACC lDENT COST llAS l~/AOT f Ok ll /C sl .o
wASHINGTON-\0,33/LeFo 1&93. 111188. JUi!39 • T 3!108, HAA~ •\O,bS/L,F• 859, 6035. l535i!· 3731~.
A.103
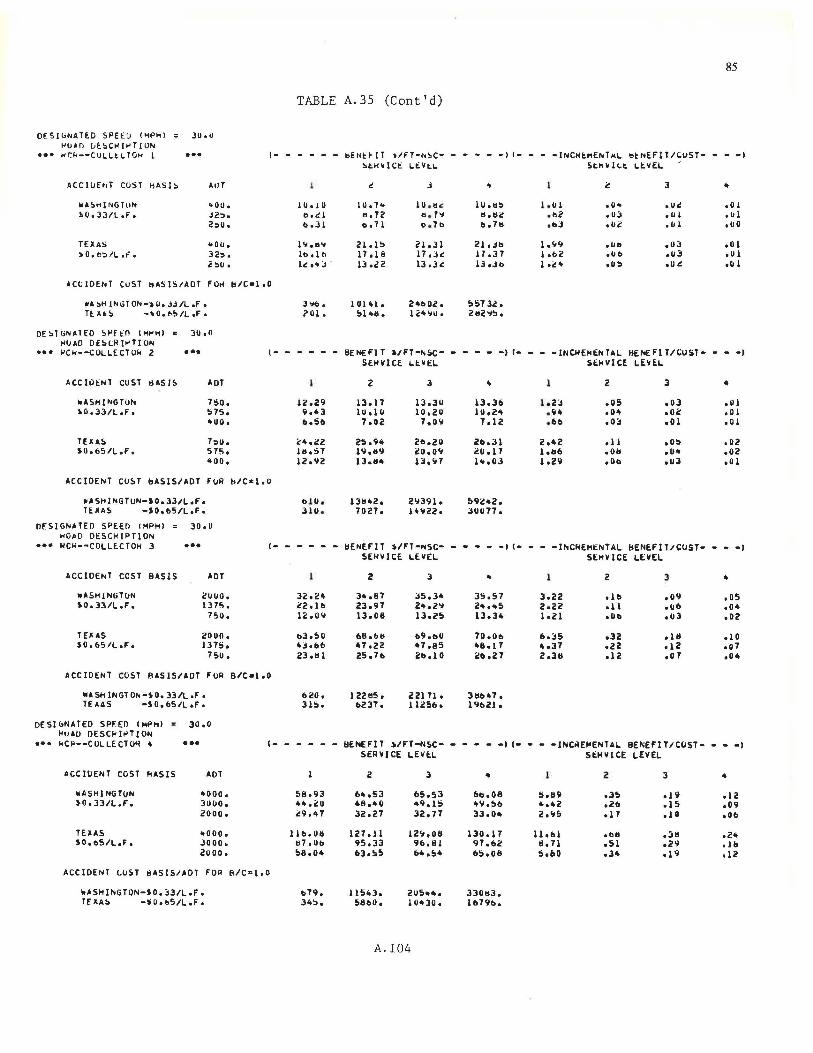
OES!uNATEO SPEEU IHPl'11 = Jo.u WUAO uESCW[~T[ON
••• w~w--CULLtLTOW I •••
ACC1Un1T COST ~AS!::. AUT
WAS1'1!NGToN ie.oo. i0.33/loFo J2:..
2:.0.
TEXAS .. oo, :..O.ti=:>/L ,,: • 32:..
Z!:IO,
ACC.: !DENT Cu5T ISAS IS/AOT FOH
•A::.HIN6TON-~O.JJIL.Fo
Tt.HS _,O.t-5/L ,F •
OE SI GNAT ED Sf'f t:n (Mf'H) .. JU ,O IWAD DESlRJwTION ... f/Cw--c OL LE CT Ok z •••
ACC !Ot:NT COST bAS IS AOT
llA!i.HINGTON 7!:iO, ,0.33/L,Fo S7'5,
'oUO,
THAS 7:iu, SO,b5/L,F, 575,
.. 00.
ACCIDENT CO!:.T bASIS/AOT FOR
~ASHINGTUN•S0,33/LoFo
TE.llAS •S0,115/LoFo
OESIGNATED SPEEll (MPH) 30,U WOAD OESCHIPT)ON ... HCM•-COLLECTOW 3 ...
ACCIDENT COST BASIS ADT
lllASHlNGTON zuuo. S0.33/L,F, 1375,
750,
TEX AS 2000. SO,b5/L,Fo l37S,
750.
ACC !DENT COST RAS lS/AOT FOR
~ASHlNGTON•i0,33/LoFo TEA AS -so.65/L .F.
OESl6NATED SPFEO IMPHl • 30,0 ~uAO OESC~lwl!ON
••• l<Cl'--COLLECTOH It •••
ACCIDENT COST FIASIS ADT
lllASHlNGTON •ooo. J.0,33/L,F, 3UOO,
2000.
TEUS <oOOQ, SO,b5/L.F, Jooo.
zuoo.
85
TABLE A.35 (Cont'd)
I- - - - - - bE~l~IT >/FT-NSC- - - - - -> 1- - - -INCHtMENT~L tltNEFll/CU5T- - - -> StHVICE LEVtL StwVILt LtVEL
t!. J It t!. 3 .. lO.i 0 10.1 .. 10 ·"'~ lU.11!:1 1.01 • o .. •Uc! .01
tlot!.l ... 12 o, 7'1 llollt!. oh2 • u:-:. .111 .111 boJl o.71 o. 7c. b, 711 obJ .oc • "1 ,uo
l 'll ·"'" 21. l!:> i2' 1. 31 ZloJb l. f;'I ,Ob .o.l .o l It> o l to 17 .1 & 17.Jt!. 17 .37 l ,b2 .01> .u3 .o 1 lt!. ... J . 13 oi!2 13 ,3.: lJ oJb l ot!." ·"!:I .o t!. .o l
BIC"'l ,o
3"10. lUl ltl. z.,ooz. S!:i7 3.!, .? Ol , Sl .. 11, l c"llU, Zt1Z'l!:I,
(- - - --- BENEFIT ~/FT-Iii~· - - - - -> (- - - - INCHEMfN TAL HENE Fl Tll:UST- - - -> SEHYICE Ll::Yt:L st:wYI CE LEHL
z 3 .. 2 3 II
12.29 ll.17 13,30 13,36 l,ZJ .os ,oJ .01 9,43 lu.10 10,i!U l u .i! .. ,i;.4 ,04 .oc .01 11.511 1,oz 7,011 7.12 ,66 ,OJ .01 .01
C:4 oi!i! Z!:i,lllt zo.zo Zb,Jl i!,42 .11 ,O!:I .oz 111.57 Ill ,111l zu.o .. t!.U o l 7 1.116 .011 .o .. .oz 1Z,ll2 13.114 lJ,<;7 l'o,OJ l,Z\l ,oo ,oJ .u
b/Cz1,o
b 1 o. 1311 .. 2, Z\13\ll o !'19<:•2. 310 o 7027. lltllZZ, JUU77,
(- - - - -- BENEFIT ~/FT•NSC- - -- - -11- - - -lhCREMfNTAL BENEFIT /CUST• --_, SEHYICE LEVEL Sl::HYICE LlYEL
z 3 .. 2 3 .. 32,24 311,87 J5,34 3S,!>7 3,zz olll ,oil ,o5 i!Z. lt> 23,97 211.2':1 z ..... s z.zz .11 .~6 ,04 12,Ull 13,00 13.25 13,34 1.21 'UI> .u3 ,02
1>3050 680611 1>\l ,1>0 70.0b 6.J5 ,32 .111 .10 4Jobb 47,z2 47,85 40.11 ... 37 .22 • 1 z .oT 23,tsl 25 .111 211.10 21>.27 z.30 .12 .o 7 .04
B/C•l oO
bi!U, 122115. z 21 71 • 3111>47. 3 l!:i. b237. l lt!.56. l 9b21.
C- - - • - - BENEFIT ~/FT•NSC- • - • - -> (• - • -INC~E~ENTAL BENEFIT/COST- - - ·> SERVICE LEVEL Sl::HVlCE LEVEL
z 3 .. l 2 3 .. 58.93 b4,53 65.53 6t.,08 s.119 ,3!) o l ll .12 44,ZO 48,40 .. ll .15 •ll.56 11,42 .ze. .15 ,09 t!.9,47 32.27 32.77 33.04 2.115 .11 , l 0 ,Ub
11b.011 127 .11 12 ... 08 130.17 11.111 ol>ll ,311 .21o 117,0b 95,33 9b,U 97.62 11. 71 .51 .2'i .111 !:18.04 630!>!'1 64,!)4 bS,Oll s.&o ,34 o l 9 .12
ACCIDENT LOST SASIS/ADT FOR !llC•l oO
•ASHINGTON-S0,33/LoFo b79, 1151o3 • 205•4· 330113. Tf AAS •50,b5/L,F, 3 .. !:I. 5860, l U1130, l679b,
A.104
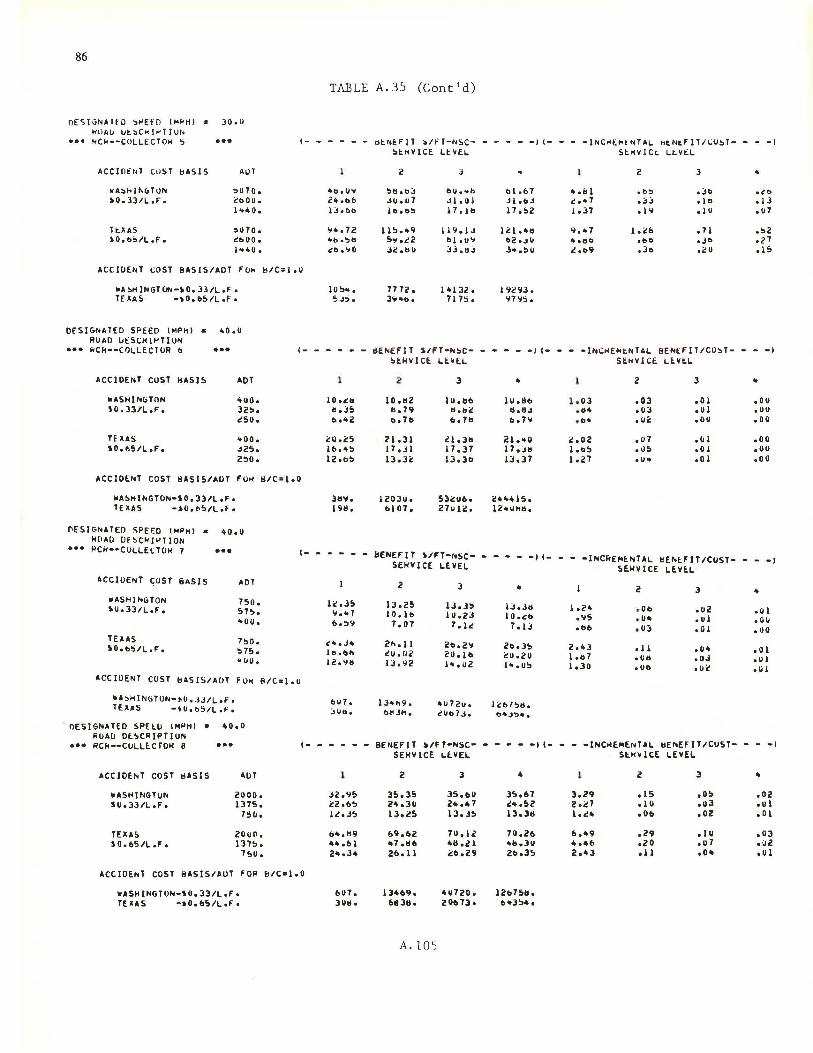
86
TABLE A.35 (Cont'd)
JO.O OE5JGNAlf D !>PEfO IM~Hl
HOAU Ut:.~CHJ~TIUN
••• HCk--COLLECTOH !) ... I- - - - - - <>l:.NEFIT ~/fT-NSC- - - - - -l I- - - -INCHl~tNTAL ht:.Nt:.flT/i;U~T- - - -l
A CC Int NT cusT llASIS olLlT
wA~nJ!l.GTON :io10. )0.33/L,F. CbOO.
1 .... 0.
Tt:.AAS :.u7o. )0.t>~/L,F, ~t>OO,
l<t .. 0.
ACCIDENT !:OST BASIS/ADT f()H
lllA~HINGTOh-S0.33/Lef • TOAS -~o. b!>/L .F •
OfSIGNATED SPEED IMPt1l .. .o.u ... RUAD uESCHl~TIUN i<Ck--COLLECTOR b • ••
ACCIDENT CUST HASIS
wASHINGTON ,0.3JIL.F.
TE AAS ,0.1'>5/L,F.
~A~HINGTON•\0,33/LeF•
TEXAS -i0,~5/Lof•
ADT
4110. 325. ~so,
ltOO • J25. 250.
OESIGNATEO SPEf.D (MPH) a MOAD Df~CklPTION
40. u
••• HCk•-COLLElTOH 7
ACCIDENT ~OST 6AS1S
•ASHING TON \ll,J3/L,F,
... ADT
750, !>7!>. 1tOU •
!!/C=l.U
,_ -
,_ -
ACCIOENT COST EIASIS/AOT fOH R/C:l,u
~-~HINHTON-~O,JJ/LeFo TEAAS -~O,b5/L.••
nESIGNATED SPE~O (MPH) • 40.0 ROAD Ot.SCRIPTIUN
'tbeU"" 24.t>b lJobb
.. •• 72 4tbo!>IS <'b .... o
10 !><t. 5~;.
- - -
10.c:b b.35 belt2
c:o.25 It>.•!> 12 eb!:I
lbll. l'iill,
-
----
lc.J!> \1,4 7 b.:.11
cloeJ4 lD obtl 1.2. \Ill
SEHVICE LEVEL 51:.HV!Ct LtVEL
2 J
!>bobJ bO ... b "II. u7 Jl. 01 1 <>. <>!> 11.111
11 !:>. <t'I 119, J j 5'!1.<!2 bl .u .. 32,bU JJ.11J
77 72. 14132. 3 .. -.0. 717!:1.
tlENEFJT Slf"T-N~C-SEHVlCE
2
IO.ll2 11,79 o,7b
21.Jl 17 .Jl 13.Jc
l203Ue bl07,
Lt::VEL
J
lU,llb 11,bi:: be7b
~I.JI! 17 .J7 1J.3b
53211t>. 27Ulco
bENEFIT S/FT•NSC• SEMVICE LEVEL
2 J
IJ.25 13,J, 10.lb 1u.2J 7,07 1.1c
Zb, ll zc..211 cu.112 20 el b IJ,\12 i..,u2
.. 2 J
bl.bl ... &l • t>:> .;,b JlebJ ~ ... 1 • .:s.J .1 .. l 7 .!>2 1. :n .19 .I u
121 ... !j 9.•7 l.c& • 71 t>2oJU -. .ao obb .Jb J ... :.u c,t>9 .Jo .2u
1'le93. 11711!:1.
--- - _, ,_ - - • INCrifMt.N TAL BENt:FlT/CO~T-
St::HVICE Lt.Vl:.L
.. 2 3
l u. 8t> I.OJ ,OJ .01 11.113 ·"" ,OJ .ul bo711 eb<t • Oi: .ou
21 ... u 2.02 .o7 .111 17.Jb I .b!:I • 05 .01 lJ,J7 1.21 .u .. .01
- -- - _, ,_ - - •lNCkEPlt.NTl.L !!Et.EFIT/COST-SEHV ICE LE.Vt.L
• 2 3
13.Jll J,24 oOt> .02 IO.ct> ,95 .u .. .ul 7. l.J ebb • o::. .01
2b.J!> 2.4J .11 .o .. c:u.2u 1,157 oUll .OJ 1•.u, l,JO ollb .u~
..
.....
.1J ,111
.!>2
.21
.1 !)
- - _,
4
.ou
.011
.oo
.oo ,ou .oo
- - _,
• .u1 .ou .oo
• 01 .u1 .01
••• RC~··CULLECTOH 8 ••• I- • • • • - BENEFIT ~/FT•NSC- • • • • •l I• • • •lNCriEMENTAL EIENEFIT/CUST- - - -I SE~VICE LEVEL SEH~ICE LEVEL
ACCIDENT COST t1ASIS AOT 2 J .. 2 3 • •ASHINGTON 2000. J2.115 35.JS 35,t>U J!>.67 J.29 .15 'O!> .oz S0.33/L,Fo 1375. a.11:. 24,JU 2•.47 c•.52 2 oir!7 .111 .uJ .u 1
750. ll.JS IJ.25 lJ.35 13.Jtl le.24 'Ot> .oz .01
TEXA~ zuoo. blt,119 !>9,b2 7U,12 70.2b b,49 ,29 .1u ,OJ SO. 65 /L .F • 137!>. •4 ob I •7 .llb •11.21 ittl,JU ..... 6 .20 ,u7 .uz
7!>0. 2•.J4 26.ll cb,Z9 Zt>.JS z.•J .11 ,04 .01
ACCIDENT COST E!AS ISO.UT FOii B/C•l,O
•ASHINGTON-,O,JJ/LeF• 607. lJ4b9, 4U720e l2t>7511. TOAS - 90,fJS/LeF• JUiie 611Jll. 20t>7J. bltJ, ...
A.105
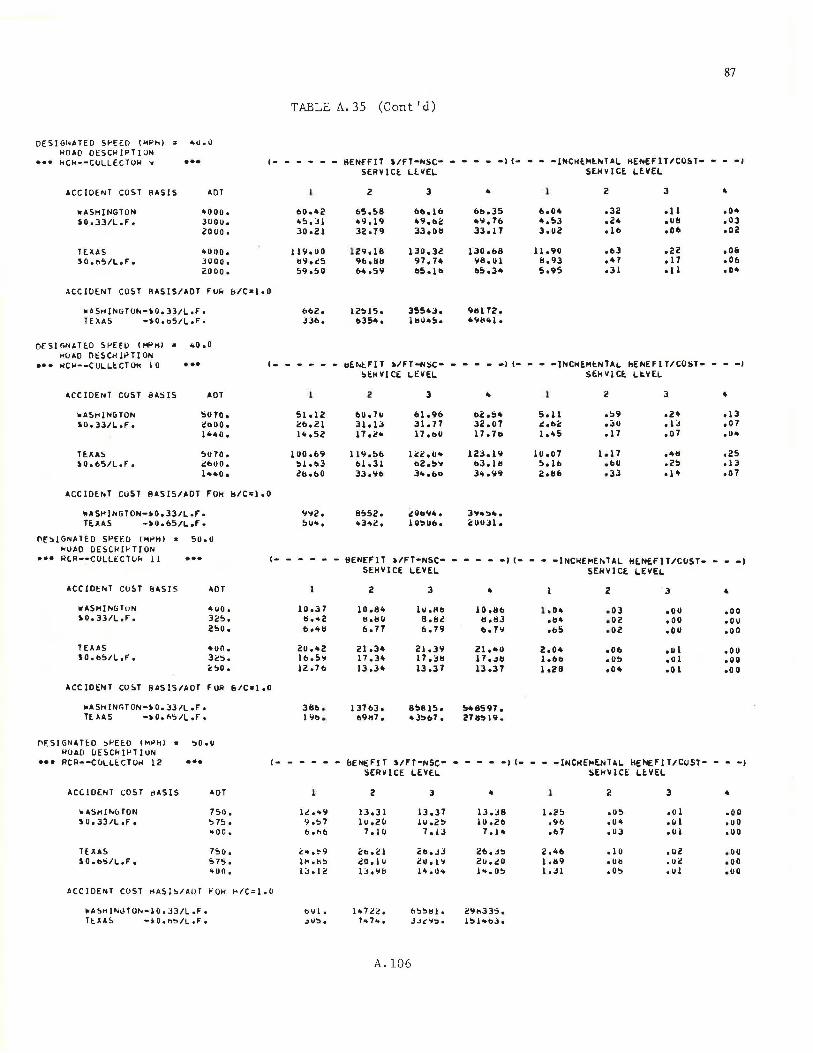
87
TABLE A. 35 (Cont'd)
DESIGl•ATED Sl'EEf> !MPt-.1 .. u.O ROAD OESCMIPT!ON
••• kCk--COLLECTOM Y ••• (- - - - - - HENfFIT '/FT-NSC- - - - - -II- - - -lNCHEMlNTAL BENEFIT/COST- - - -1 SERVICE LEVEL SEHVICE LEVEL
ACC IOENT COST EIASIS AOT 2 3 .. 2 J .. lllASHINGTON 4000. b0 ... 2 65,58 bb.lb bb,J5 6.0 .. .32 .11 .o• S0,33/L,F, 3UOU, .,5. Jl 119,19 49,bi! •'il. 76 ... 53 .2 .. • U!I ,OJ
20UO, 30.21 32.79 33.0ll 33.17 3.02 .1 b .06 .02
TU.AS i.ouo, 1111.uo 129.18 130.Jli: l lO ob8 11.90 .bl .22 .011 ~O,tt'S/L,F. JOOO, 119.c5 96,1111 97,74 1111. u 1 11,93 ... 7 .17 ,06
20 00. 59.50 6• ,59 115.lb 115.J• 5,95 .31 .11 .o•
ACC llJENT COST RASIS/AOT Fow b/Cs1.o
•ASHINGTON-\0,JJ/LoFo TE)l.AS -~O.o5/LoF•
OESl6NATE.O 51-'EEll (Ml'MI " i.o.o WOAD OESCH!~TION
••• MCl'--COLL.lCTOI< 10 •••
.. cc IOENT COST BASIS AOT
loASHlNGTON !>OTO• 50,JJ/L,F. i:!DOO o
l""o. TE.llAS 5070. ,O,b5/L,F, c6tJO,
l••O •
662. 12515. 355 .. J. 9111 72. Jlb. b35•. 1110•5· 4'111 .. l.
I- - - - - - t1El'.EFIT !11/FT-NSC- - - - - -11- - - -INCHEf'ltNTAL. l!ENEFIT/COST- - - -I StHVICE LEVEL SEHVlCE LEVEL
2 3 .. 2 3 .. 51.12 bu.7u 61.9& 112.:.• s.11 .59 .2• o ll i:!boi:!l 31.13 31. 77 32.0T li:,bc .:;o .lJ ,07 l'+.52 17.2'+ 17.110 1 7 o 7D 1.•5 .17 .01 .u ..
lU0,69 llc.1 .Sb 122 .11 .. 12J.l9 10.07 1.17 ... 11 .2s !>lobJ 61,31 o2,5Y ol.111 5.lb .110 .2s .13 lllobO llo'lll 3•.b<> Jit.'i19 201!6 ,33 • l" .o7
ACC IDE.NT COST RAS I SOOT FOH b/C•loO
lllASHINGTON-~0.33/LoF• TE.AAS _,U,65/L,F•
OES!GNATEO SPEED (M~HI ,. 'SU.O kOAO OESCMl~TION
••• RlR--COLLtCTOH ll •••
ACCIDENT COST f:!ASIS AOT
OIASHINCHUN "uo. ,0,33/L,I', 325.
2!>0.
TEUS •uo. 10.bS/L,F, Ji!!>.
i!SO,
'l'i12o 8552. c011'i14o 3Y•!I"• 511". .. J .. 2. l ll!lllbo i!UUJlo
l- - - - • - BENEFIT !11/FT•NSC• • • • • •IC• • - -lNCHEMEll.TAL HENEFIT/COST- • • •I SEHVICE LE.YEL SERVICE LEVEL
2 3 .. 2 3 .. 10 .J 7 10.B'+ lUoHb 10.ttb 1.0 .. .OJ .011 .oo
t;.42 11.110 8,e.! llo!!J ·"" .02 .ou .ou 6olt8 ti. 77 6.79 b. T'il obS .02 .ou .oo
2u ... 2 2l.34o 21.J'il 21.•ll 2.0 .. .ob .ul .oo 16.5~ 17 .J .. 17 .JI! 17 • .Sii 1.1111 • us .01 .ou 12. 711 13 .l .. ll .J T 13 .J7 l o28 .o .. .o 1 .o u
ACC IOt:NT COST RAS IS/llDT FUR &IC"I ,o
~ASHIN~TON•,O,Jl/LoFo
TE )I.AS •)0,~5/L,F,
l"IF'.SIGNAH.D Sf'Ern lMt>'11 " 50oU ~UAO UESCH!f'T!ON
••• RCR•-CULLECTUM 12 •••
ACCIDENT COST dASIS ADT
Ill ASH I "'I> TON 7~o. S 0, 33/L .F, !::> 75.
.. oo.
TEXAS 7!>0. ,O,b!:>/L,F, !>7!>.
c.oo.
ACCIDENT COST r-IASl!>/AOT l'Ok
•A~HINGTO,.-l0,J3/L,Fo
TUllS -~O.n!:>/Lol'o
386. I 37 63 • 8!>8lSo 548597. l'ilb. 69117. •J!lb7. i!71!!> 19.
l- - - - • • bENt:FIT 'IFT-NSC• - • • - •I I• - • -lNCHEMENTAL hENEFlT/COST• • • -I SERVICE LEVEL SEHYICE LEVEL
2 J .. 2 3 .. 1~ ...... ll.Jl 13.37 lJ.JB 1.2!> .o5 .ol .oo 9 .!:>7 lu .20 111 .25 111.211 .<Jb • 0,. .u 1 .uo b. tit• 1.10 7 o lJ 7 .1 .. .117 ,UJ .111 ,uo
e:: ... ~9 211.21 2b.JJ i:!b,J5 2.46 .10 .02 .ou 11< otl!I cO.lU 2Uol'I 2u.co l ot19 oUb .u2 .oo l;; .12 l:::So'il& l•. o .. 1•.05 l.Jl ,05 .01 .110
f</C=l,O
bUl, 1 .. 72<!. b!l!ltll o ~y.,335,
.>II!:>, 7,. 7,. • J.JC":'~ • 1!1l'ObJ.
A.106
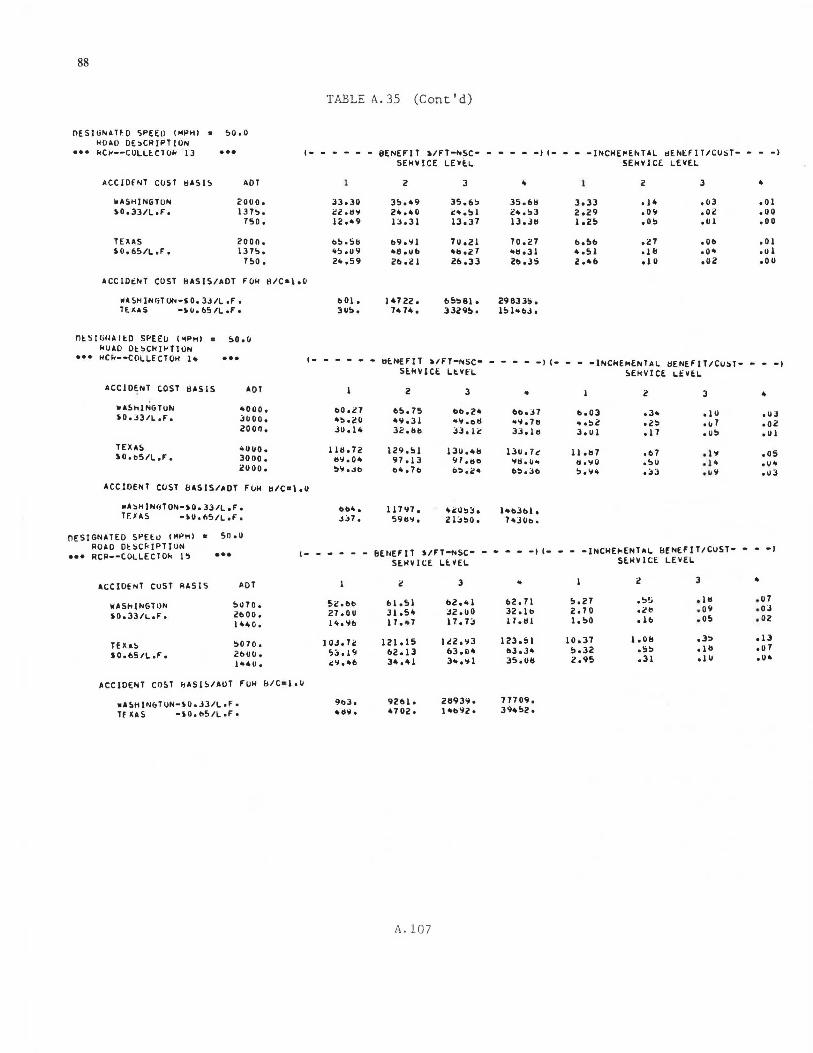
88
OESl6NATf O 5PEED (MPHI • 50,0 kOAD DESCRIPTION
TABLE A. 35 (Cont'd)
••• kC~--COLLECTOk 13 ••• I- - - - - - BENEFIT ~/FT-NSC- - - - - -I l- - - -INCHEHENTAL tlENEflT/CUST- - - -I
ACCIDfNT COST tjASIS
llASHINGTUN ,0.33/L.F.
AOT
2000. 137!:>.
750.
zoon. 137!:>.
750.
ACClDtNT COST BASIS/ADI FOM B/Cal,O
WA SH lN6T ON-'.5 O. 33 /l of, TE.l\AS _,ll.6!>/LoF•
OESI6HAl~D SPEElJ (~PHI • !>OeO kUAO OE~Ck!~TlUN
33,30 i!i ,ljy Ii! ... 9
b5.5b
""' oU9 21+ .59
1>01 • 3U!:i •
SEHYICE LEYEL SEkYICE LEVEL
2 3 .. z 3 .. 35.•9 35,6S 35.611 3,33 ,)4 ,03 .01 24.40 "" .s l 2•.S3 2.29 .oc,, .oz .oo D.31 13.37 13.Jtl 1.25 .os .ul .oo
b9e'll 7u.21 70.27 bo56 .27 .oo .01 •e.ut. •boZ1 .. tj .31 ... 51 .111 .o .. .u 1 21> .i! 1 21>.33 2t>.35 z .•1> .1 0 .uz .o u
147 22. 65!:>81. 29833!:>. 7• 74. 3329!>. 15 l .. bJ.
••• HCw--COLLECTOH 1• ••• l- - - - - - tlt.NEFIT 31/FT-NSC- - - - - -I (- - - -INCkEHENlAL !IENEFlT/CuST- • - -I SlkYlCE LtYfL 5EkYlCE LEVEL
ACCIDENT COST tlASIS AOT 2 3 .. i! 3 .. wAShlN6 TuN •ooo. i.o.z1 6!>.75 bC>.24 bb.J7 b,OJ .3 .. .1u .uJ i0,33/L,F, lODOe •!; .20 49.31 .. Y.bl:t "". 711 ... sz .zs .111 .oi! zoon. JO e 14 32.llb 33, 1<: 33.111 3,ul .11 • us .u1
TEXAS l+llUO • 1111. 72 129 ,SJ 13U.l+b 13U.7t ll .b7 .1>7 .1-- .os ,O,oS/L,F. 3000. tl'i. 04 97.13 97 ,tjD 'Id•'-' .. I! ,yO .su .1 .. • u .. i!UOO • s ... Jti bi+e7b bS.i!• bS.Jb s • .,, .. .JJ . 11 11 .OJ
ACCIDENT COST !IASlSODT f(JM il/C•l .u
wASH!NqTON-,0.33/L.Fe bb4. 117117. •i!OSJo l•b3til. TDAS •)U,fi5/LeFe JJ7. 5911Y • ZlJso. 7•Jllb.
OESIGNATEO SPElU (MPH) • sn.o ROAD O~SCf<!Pll<JN
BEr~Ef IT i/FT-NSC- - - - - -I<- - -•INCHE~ENhL BENEf IT ICUST- - -_, ••• RCll--COLLECTOI< j'; ... (- -- -- -
SUI VICE LUEL SEMVlCl LEVEi.
i! 3 .. z 3 .. ACCIDENT COST RAS!S AOT
I> I.!> I 1>2 ... 1 1>2. 71 !>.27 !>•· .It! .o7 52.bb . "' WASHINGlON 5070. • 0 \I .oJ 2600. 21.ou 31 ,54 J2 .110 32.lb 2. 7 0 ei!tl
S0.33/L,Fo 11 ... 7 17. 73 11. I! I 1. so .16 .05 .oz
1•40. , ... 111>
lOJ,7~ 121.15 lc!Z,\13 123.:01 IU.37 I• Oti .ls .13 TH a!> :0070.
!>.32 .:.s • lb .or 2bUO, !)J.19 62.13 1>3.u4 b3o34 S0.65/L.F.
3•.41 3.,,._l J!>eUti 2.95 .31 ,1u • o• l••O • C:ll .. •b
ACCIDENl C05T fiASIS/AUT FUM !1/C • l•O
•A5HIN&TON-\U,J3/LoF• 9b3. 9261 • 2119311. 77709.
Tf XAS •SO, ti5/L .F • -d"il. 4702· 1 •bll2. J9•5i!.
A.107
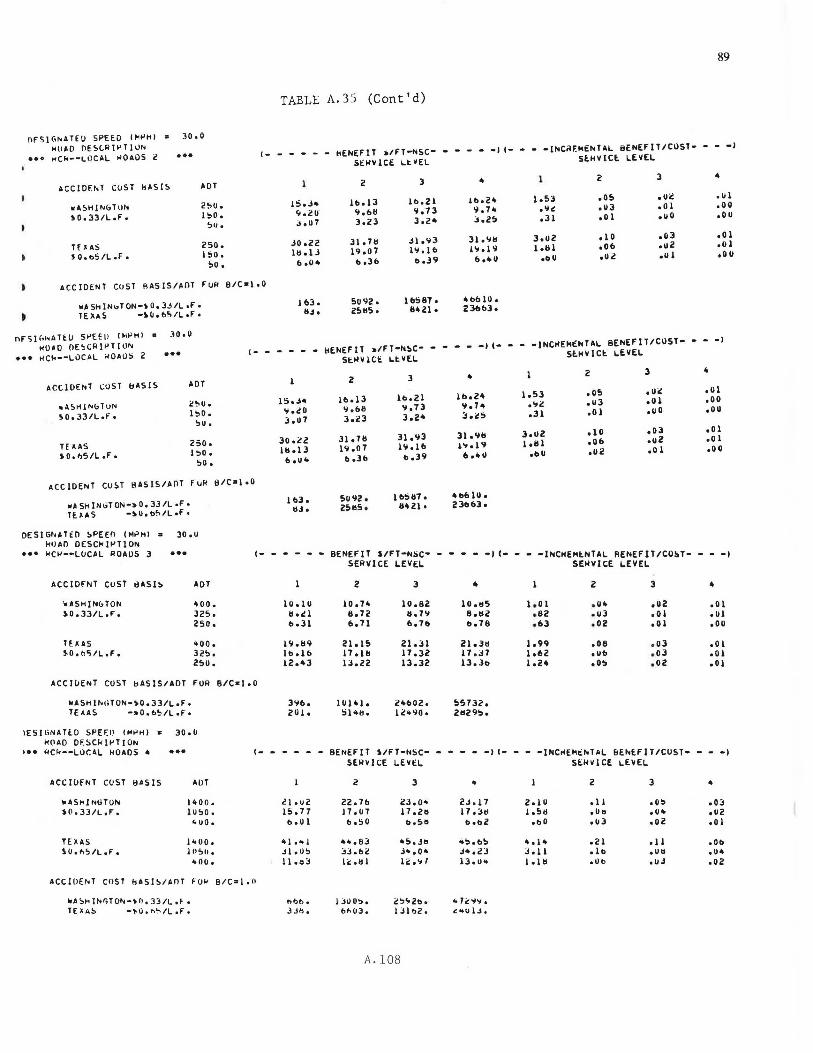
•
nFSJGNATEO SPEED lk>'HI s MO•O OESLRJ>'T)UN
30.0
••• HCk--LOCAL HOAOS 2 ... A CC I OF.NT COST l>ASIS ADT
wASHJNGTUN 250. ~0.33/L.F. l~O.
5ij.
H ~AS 250. ~O.t>5/L ,F. l 50.
50.
ACCIDENT CUST flASlSOOT FuR
WA SH lNbT ON-\ o. 3..l/L .F. TE.JI.AS -J.Oob~/L•F •
nF~l(•l•AltO S>'Efll l~i l'HI = MO•D OE~CRI>'T)UN
30.0
••• HCk--LOCAL ~OAUS 2 •••
ACClOENT cusT llASIS ADT
•ASH!NuTUN c~o.
l~O. ~0.33/L.r• 5U,
250. TE AAS Io, 1>5/L ,F, 1 ~o.
50.
89
TABLE A.35 (Cont'd)
1- _ - - - - "ENEFIT a/FT-NSC- - - - - -I I- • • •INC~F.kENTAL bENEFlTICOST• • • •I SEHVlCE L~VEL SlkVlCl LEVEL
2 3 .. 2 3 .. lt>.Zl H>•2" lo SJ .os .u2 .ul
15.J• lb.13 .uJ .01 .oo 9.21f Y,bll Y.73 "'· 1 .. ·"' 3 .2• J.25 .JI .o 1 .uo .ou J.u7 3.23
JI o'il3 31.c,,11 3.u2 .10 .ol .01 Jo.22 31. 71!
lob 1 .ob .u2 .o l 19 .o 7 111.1 b I" .1 'i 111 .1 J .112 .111 .011
b ,Jb l>o.39 b ... u ol>U b .u ..
8/C=l •0
1 bl. 5U92 • 111587. "'"" 111. llJ. 25115. 11•21. 23bblo
•••• •I I• • - •lNCHE.kENTAL BENEFIT/COST• • • •I 1- • • • - • "ENEFIT a/FT•NsC• SlkVlCl LEVEL
StHVlCl LlVEL 2 3 ..
z 3 .. .111
lb.21 lb.2" 1.s3 .os .uz 15oJ<I lb .13 .01 ,oo
Y,73 y • T <I • .. 2 .uJ ... 20 Y.bll .31 .o l .uo ,ou 3.01 3.23 J.2• J.25
31.Yll 3.112 .10 .o::i .01 Jo.22 31. 711 31 0Y3
loll l .Ob .112 .o l 19.07 lY. lb l" .19 .o l .o II 111.13
t>.39 b ·""
.1>11 .uz b .u .. b .Jb
ACCIOE.NT cusT tUSIS/AllT FUR S/C:oloO
wASHlNiTON-~0,33/LoF• TlJl.AS -i.u.t>!>/Lof"•
OESIGlllHtO SPEEn IMPHI .. 30,u MUA(l DESCkl>'TION ... MCk•-LOCAL ROAUS l ...
ACCIDENT COST SASIS ADT
\jASHINbTON .. oo. ,0,33/L,F"o 325.
250.
TDAS <tOO • !-0,l>";IL.F, 325.
25U.
ACC!CiENT COST bASIS/AOT FUR
-ASHlhHTON-~0.33/L,f• TE.us -:oo. t>!:>/L .F •
IESl&NATlD S~E~D t~~HI s k~AD DESCklPT!ON
30.0
••• MCk--LOCAL MOAOS " ... ACCIOfNT COST 8ASIS AOT
•ASH! Nt;TON 1400. ill. 33/L ,F", lU50.
4UO.
TEXAS 1 .. 00. \0,11!">/L.F • I C>!">o •
<tOO,
ACCIOEr.T COST hASIS/AOT FOi<
-ASH!NllT0 .. -~!>.33/Lo~ • TEXAS -'tiU,h~/L.F.
1113. SOYZ • l bSll7 • .... b 111. llJ. 25115. ll•Zl • 23bb3.
I- - • - • - BENE.FIT l/FT•NSC• -- - - _, ,_ -- •lNCHEMlNTAL RENEFlT/COSl• - - -1 SERVICE LEVEL SEHVlCE LEVEL
2 l .. 2 3 .. 1u.1u 10.74 10.82 10.115 1.01 .u .. .u2 .01 11.,1 11.12 11. 7 .. e.112 .e2 .ul .01 .u1 o.Jl 6. 71 6.7b 1>.78 .63 .02 .01 .oo
l 'ii .119 21.15 21.Jl 21.31! 1.99 .oe ,oJ .01 lbol6 17 .111 17 .32 17.;H lo6Z .u11 .oJ .01 12 ... 3 13.22 13.32 ll.ll> 1.2 .. .os .oz .01
8/C•I .o
)'ib, 111141. 2"bOZ, 55732. 201. 51 ltH. 12 .. YO • 211295.
1- - - - • - BENEFIT 'IFT•NSC- • • - ••II-•• •JNCHEM~NTAL &ENlFlT/CUST• •••I SERVICE LEVEL SERVICE LEVEL
2 3 .. z 3 .. l1.u2 ZZ.Tb 23.0• 2J.l7 2.10 • 11 .o~ .OJ 15. 77 J7 .01 17,2b 17. Jtl J.!>tl • 0" •Ult .uz boUl b.!;O t>.511 1>01>2 ol>O .ul .oz .o l
ltlo'>I • ... 8) •5 0 Jt1 .05.t>5 .. ol• .21 .11 .Ob .ll.05 ;,J.b2 J ... o• J•.2J J.11 .lb ,Utl .u .. 11.113 le .11 l li: ... , lJ.u .. l .1 t! oUb ,uJ .oz
B/C,,l.O
hbb. I JOO~, 2~ ... 21>. •>Ti:~ ... JJI;. 6'-03. 1Jlt>2. ~~u 1.;.
A.108
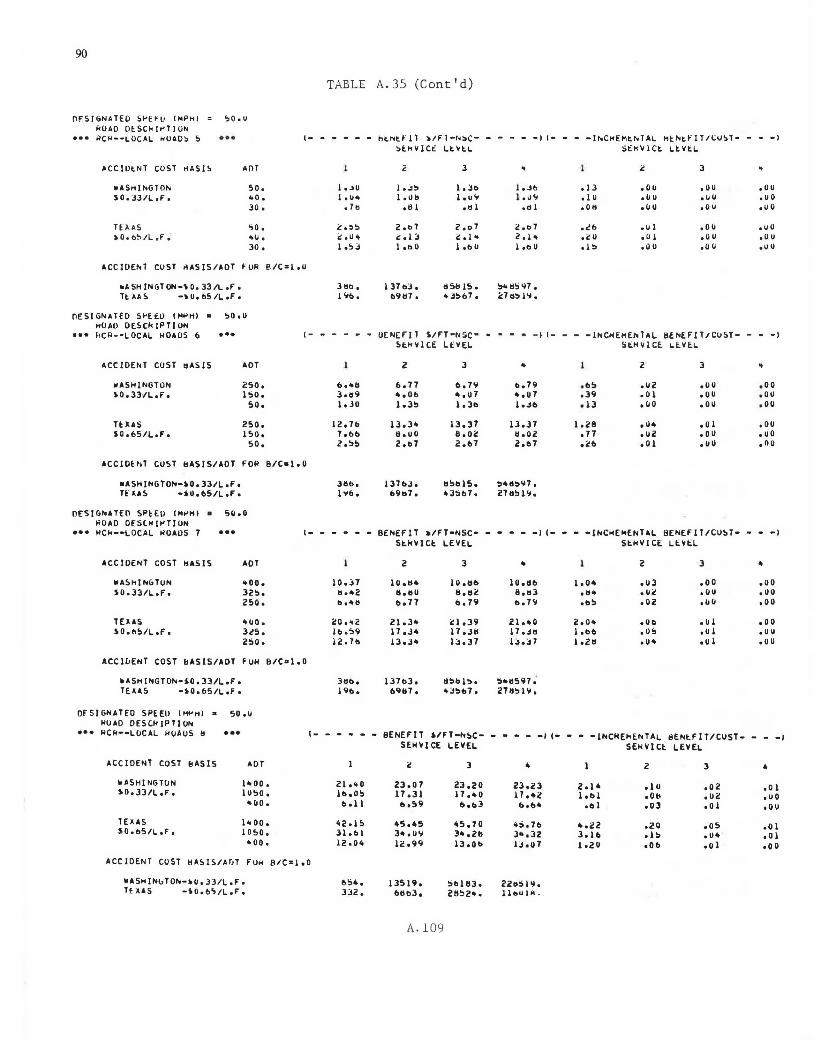
90
O!'SIGNATEO Sl'E~lJ IHPHI so.u IWAO OESCl<!t'TJO" ... RC~--LOCAL t<OAO::. s ... 1-
olCCIUtNT COST tjASl5 AOT
•ASHllliGTO"' so. SO.JJIL.F, .. o.
30.
H:HS o;o • ~O.o!>IL.F •' "". 30.
ACCIOElliT COST ~ASIS/AOT fOR P/C•loU
•ASH ING TON-\ O. 33/L .F, Tt.~AS _,0,65/L.Fo
OE SI G"'A TEO Sl'E.t:u (l<l'H) . so.u HOAD OESCk !PT! ON
••• hCll-•LOCAL HO&OS ·6 ... ACCIDEt<T COST llASIS AOT
WASHl"'GTON 250, ,0,33/L,fo 150.
!>O •
nus 250, S0.65/LoFo ISO,
so.
1-
ACCIO~hT CUS.T llASIS/AOT FOR 8/C•loO
•ASHl"'GTON-,0,33/L,Fo T~AA5 -i0,65/Lof•
OESIG"'ATED SPEED IHl'HI • SQ,O HOAO DfStHll'TIUN
-
-
TABLE A. 35 (Cont'd)
- - -
I • ..tU l.u ..
• 7"'
;:.~::.
i: .o .. l .SJ
- - .
6 ... 11 3.119 I.Jo
li!.71> 7061> 2,!:l!:I
3111>, 1'16,
-
-
htl'•t~' 11 :.1n -r.::.c-::.t:.t<V lCt::
2
l.J::. I .011
.Bl
i!,t>T ".1 J l .1> 0
I 37t>J. 1>9117.
Lt:.~t:.L.
3
I• Jt> 1. u ...
.111
2,oT ;:.1 .. 1 ,bU
U[NE:Fil SlfT•NSC-S.t.l<VICE
z 6,77 .. ,06 l .l::.
llo3• 11 o UO 2.1>7
13763. 69o7.
Lt:YEL
3
b, 7'il .. • 01 loll>
13.37 8,02 2,67
-
-
- - - -1 1-
.. 1 • ..10 l. u ...
.111
z.oT 2 .1 .. I .1> U
::." ll!:ili7, C:T 11::.1 'I•
--- _, 1-
.. o. 79 ... 01 1 • ..11>
lJ.37 11.oz 2.1>7
-
-
- -llliCt<El'lt:.lliTAL St::t<\/ICt:.
" .13 .ou .1 u .u u • 0 II • (J 0
.tb • u l
.(:'U .01
.1::. .oo
- -lJ;CHEHE,.TAL St:H VI CE
z ,1>5 .uz ,39 .01 oil .oo
1.ze .11 .. ,77 .uz .26 .01
Ht:.llit:.fl T /l.:V::.1- - - -1 Lt.Vt::L
3 .. .ou .ou .uu .uo .ou .uo
.oo .uo • 0 u .o u .o 0 .ou
BfNfFil / CUST- - - _, 1..t.n1..
3 .. .uo .oo .ou .ou .ou .oo
,01 .ou .ou .uo .uu .oo
••• HCk--LOCAL HO&OS 7 ••• I- • - - - - BENEFIT ~/FT-NSC- - - - - -l (• - • •INCt<EHE"'TAL BENEFIT/COST- - - -I
ACCIDENT COST ijASIS
WASMl"'uTON 10.33/L,F.
AOT
.. oo. 32!>, zso.
ACCl~ENT COST bASIS/ADT fuH 6/C•l,O
~ASHINGTO"'•iO.JJ/L,Fo TE.AAS ·>0,65/Lofo
OFSIGNATEO SPEEIJ 1...-HI • so,u llOAO OESCl<JPTION
••• ~C~--LOCAL MOAOS ti •••
ACCIDENT COST !IASIS ADT
loASHINGTON l•OO • ,O,J3/L,f, !USO,
.. uo.
TEXAS 1 .. 00. S0.65/L,Fo 1050.
"00.
ACC !DENT COST tlASIS/ArJT Fuo<
WASMINuTO"'-~U.33/L,Fo TE.US -i0.6'il/L,Fo
(-
BIC•l oO
10.JT e1.•2 b.~tt
i!0.42 lt>.59 li!o 7b
3111>, 191>,
- - - - -
21 ... 0 11>.0!:I boll
42.15 31.1>1 12 004
6!:i4. 3J2.
St:.kVICt LEVEL St:MYICE LEvt:L
2 3 .. z 3 .. 10.11 .. 10.81> l 0 oCll> 1.0 .. .u3 .oo .oo
11,00 8,lli! 11,113 ,It .. • Ui! .uu .oo 1>.77 o,79 o,7'il ol>!:I .oz ,uu .oo
21.l .. <:1.39 21 ... 0 2.0 .. ,Ut> • u l .oo 17.J4 17.311 17.Jlt l 01>6 • 0!1 , u 1 .uu 13.34 1J.J7 l:S.J7 1 .211 • 0" .ul .ou
1371>3. tl!:lll l !>. S•llS97 ,' 69117. .. :i::.1>1. i!7t1::.111.
BENEFIT ~/FT•NSC- -I I- - • •1,.CHE~ENTAL SENH IT /CVST- - - -1 SEMYICE LEY EL SEMI/I Ct: LEVEL
i! J .. 2 J 4
23.07 23.20 i!3,23 2ol4 .10 .oz • 0 l 17 .31 17 .40 l 7 ... j! lob 1 , Otl • Ui! ,uo bo59 6063 1>.6 .. ol> 1 .oJ • 0 1 ,ou
45,45 45,70 •S.71> ... zz .20 .os .o 1 J ... 011 J ... 211 l ... 32 3.16 .1 !:I • u .. • 0 1 li!o99 13 .0I> lJ .u 7 1.20 oOb .o 1 .o 0
13519. Sl>l8J, 22oSl9. 611bl. 211~2 ... 11 .. u JA -
A. 109
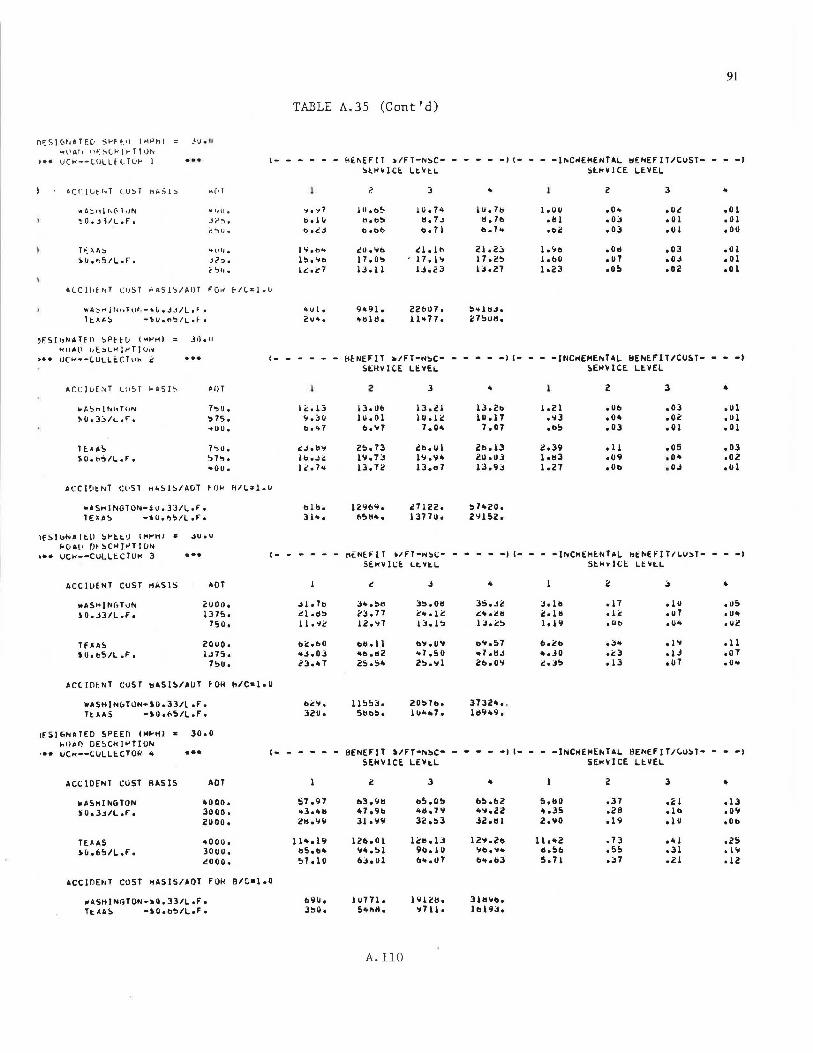
"'1l 1 Al1 Pt-:~l~ll"'T1V"1
••• ucw--LULLfLTU~ I
•CC!lJtNT 1_ u:,T HA::I ! ::>
wA~t,lN(~l•JN
~O • .Ji/L.f,
T~ >.h::,
>uor>5/L.F.
...
~ lC 11 •f. NT CtJ!>T ~AS l !>/AIJT
.. r.1
.. 1111.
Jr~.
t:~v.
4\llJ.
.Je":>, l'':>h.
FC..<
WA~r4JN1"TUt- -"li,.L1/L,F • 1 t>-• ~ -\U,ni;:)/L,F •
k'IJ.60 li[::ilHl,.,TJIH-4
••• UCk--LULL~CTUk i
ACCILJU.1T LtlST I-AS I~
"'''~'"'t t-.11T11N
~U.3::l/LoFo
T f:.• •!:. SO.b~/L.Fo
.....
ACC !(itr<T Cl•Sl ,;~!:J l !>/A!il
AIJT
7.,U • !:>75. .. uo.
7'>u. '>7!:>. -.uu.
HJI<
•ASHINGTON-iu.JJ/L.Fo TEO~ -'tiO,f}'='ll ,F,
lfS]bNAltU ~~t~~ l~~HI : .JUoU
l<OAL• IH ~C>ll"Tlul>I ••• uc~--CULL~CTUH 3 •••
ACC IUENT cusT r11<S Is AOT
wAS01lNr,TuN <:uoo. S0 • .13/L.Fo 1375.
750.
TfAAS 2000. so.ti5tL.F. IJ75.
7su.
ACtlllfNT cusr l!ASl~IADT ~OM
WASHlNuTON-I0.33/loFo HAAS -so of.':l/L .F •
1ESH•NATEO !.PEEO (Hl'Hl " 30o0 1-0All DESCHl"TION
.... UCM--~OLLECTO~ .. • ••
ACtlDE'hT CUST RASIS AOT
w6SHINGTON i,ooo. ,U.3J/LoFo 3000.
2uoo,
TEA AS •000. :.u.65/L.F. Jouu.
.:ooo.
ACC lllH1T COST liAS IS/AOT FOM
wASHlNGTON-~0.33/LoFo Tt:.US _,0.115/LoF•
91
TABLE A.35 (Cont'd)
t- - - - - - HENEFIT ~/FT-N~C- - - - - -l t- - - -lNCMEMENTAL hENEFIT/CUST- - - -I ~t~vlCE LtVtL ~tkYICE LEYEL
i 3 .. 2 3 " "I• '11 Jll.b~ !U 074 1u.11:1 1.uu • o .. oOi! .o l b .1 u t'l.b~ ti. 7 .J ti.lb obi .OJ .01 .01 b • .:J bebb bo71 b.7 .. .02 .OJ .01 .oo
Io; .ti'+ c!U .... b c!lolb 21.2;-, 1. "b • Otl 003 .01 I!>. "t> 17.0!:> 17 .1 .. I 7. i!!> l obO .01 oOJ .01 le:. t!7 IJ.11 lJ.23 u.21 lo23 .o!> .02 .01
~/(.cloO
'tO l, 9 .. 91. 22bU7. !>"lt!Jo 2U4, .. 111 d. 11'+77. c7!>Ul!o
t- - - - - - h~NEFIT ~/FT-N~C- - - - - -l I- - - -INCMEMENTAL ~ENEFIT/COST- - - -I SlHvlCE LEYEL ~EHvlCE LEYEL
2 3 .. 2 3 • lc.D l3o0b 13 • .!l 13.2b 1.21 oOb .OJ .01 .,,.:;u 10.01 I U o l c 111.11 o\IJ .o. .oc .01 bo'+7 b ... 7 1.0 .. 1.01 •II!> .oJ .01 .01
c:.J. 1111 2!>.73 lboUl 2bol3 i!o39 .11 .05 .oJ It> • .1 i: lll.7J I.,. .11 .. i!UoU.l lotlJ oU9 .o• .02 llo7'+ 13.72 1J.o7 13.9J 1.21 .u11 .oJ .01
H/l.:11.U
bl!I. lcllti~. 11!7122· !> 1 .. 20. 31". f>!>tl•. 1377u. 2'"15i!o
,_ - - - - - r11::NU'1T ~/fT-Nsl.- - - - - -) ,_ - - -1NCHE"1t.NTAL bt.NHIT/1.UsT- - - _, SEH¥(1.t LtYtL StMYICE LtYtL
.: J .. c ;-, .. .JI. 711 J" o!>I:! JS.Oii JS.Jc Jo lb .11 olU • u5 cloclS 2J.77 C'+olc .C:'> •<!II 2 .1 ti .1~ .u7 .u .. 11.11c 12 .... 7 IJ.IS lJ.<:S Io l II ollb .u .. .uz
bcobO blloll b'll • U'I o'loS7 boi:!b .3 .. .1 ... .11 .. J.OJ .. b.112 '+7.50 .. 1.t1.1 ...JO .cJ .1J .01 i:'J ... 7 2s.s• 2!:> .... l 2b.Oll .!.J!> oil ,01 • o ..
H/C•loO
b~.,,. ll!:i!>J. 20!:>7bo 3732'> • . 32Uo 5bll!:>o I U"" 7 • l 119 .. 9.
c- - - - - - BENEFIT :.1FT-NSC- - • • - -I l- - • -INC>IE'4EhTAL llEhEFIT/~UST- - - -) SEMVICE LEYt.L SEHYICE LEYEL
2 J .. 2 J .. s7.97 1>3.911 b5.0!> b5.b2 5.110 .37 .<: l .1 J .,3 ... 11 •7 0 9b .. ti. 79 .. 'i. i!i! •• 35 .2a olb .011 ~K.1111 31. 'ill Jc.sJ 32.ttl Zo'iO .19 .1u oOb
11•, 19 l2b.Ol 1c1:1 .1;; l2'11.2b 11 ... 2 • 7 J •"I .2s 1:15.11 .. 11•.!>I 91>.10 'lbo'll'> ci.Sb .5!> .JI .1 ... !>7.10 6J.ul b ... 01 b'+obJ 5. 71 .J7 .21 .12
B/C•l.O
t>9Uo 10771. l 111211. 3111 .. bo J!:>O, 5 .. ,,~. ... 111. 111193 •
A. llO
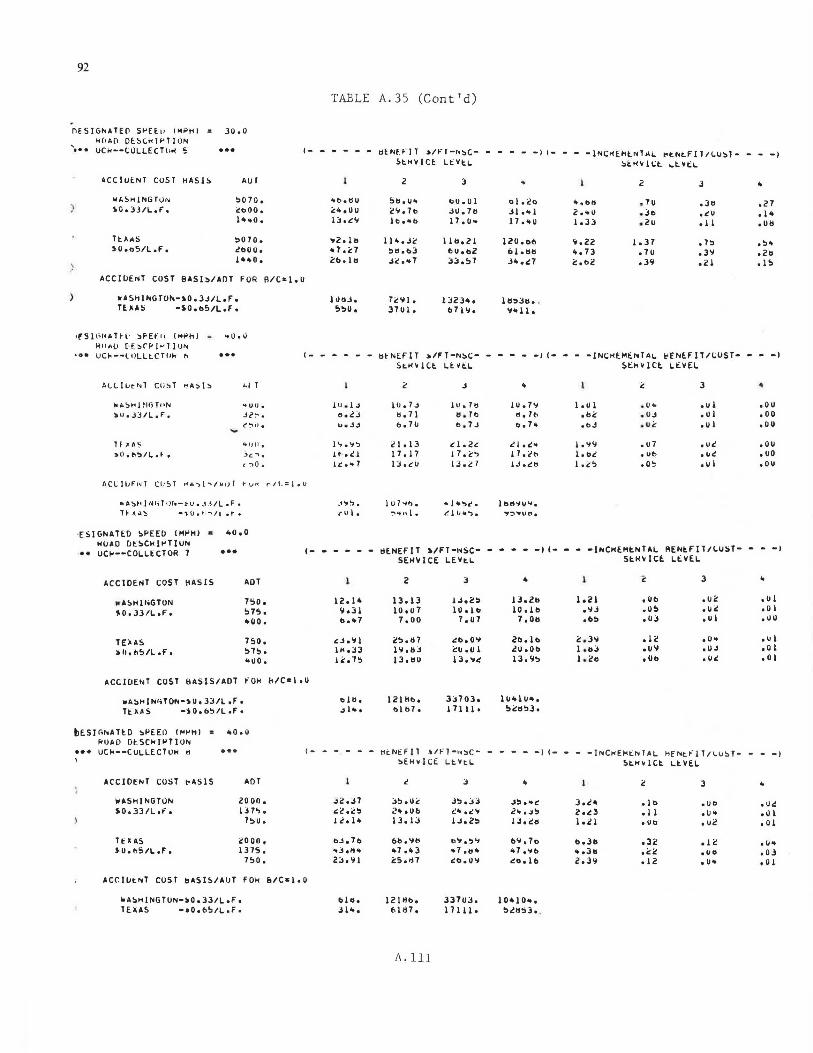
92
f1ESIG"ATE!1 Sl'Ei'_ll l~PHI z J0,0 l<!•A!1 Dl~CH!f'T!ON
'>•• UCw--(;OLLf(l(ltl 5 •••
ACClUlNT CUST HAS!~ AUi
w&.~HINGTUN !>070, ~o.:n1L,F. ct>OO,
1 .... 0.
TUAS !>O 7 0, ~O.oS/L,f, c!ooo.
1• .. o.
TAELE A.35 (Cont'd)
,_ - - - - - 11ti.H IT >11'"1-.. ~c- - - - - -11- - - -1i.c><H1t.NTAL l't. .. t.Fll/(;U!>l- - - -1 St.HVICt Lt.Vt.~ !>t.HVl~t. ~t.Vt.~
z 3 .. 2 3 .. 4tt'ledU Stl,U't t>U,Ol ol .co ... ots , 70 ,Jtl .z1 "". u u i!'I. 7to .JO, 71l Jl ... 1 2 .~u • .Jc ,i<U .14 13.i<'il l Cl e4tb 17. o .. l 7 ... u 1.33 .2u .11 ,Utl
.. 2.111 11 ... Jc 1111. z l l20,o6 'f.ZZ 1.37 • 1!:> • !>•
.. 7. i:7 !;>11,1>3 l>Uob2 ol otlll ... 73 ,70 ,311 .211 21>.111 .i2 ... 1 33.!>7 J .. ,,.7 ii:.toi! ,39 .21 .15
ACC llJENT COST BASl!>/AnT FOR R/C:l,O
••SH!hGTOh-i0,3J/L,f o
HAAS -i0,1>5/L,f,
•!Sll'l<AHl· !>Ff~'' l"'l'n) - .. u,u 1'11'"0 [•f_!>C'!<J;..f JUN
·•• UO• --lllLLt.C TOI< h •••
All.11.JtNT CO~T ~A:i I~ ~I 1
-"~t1!M<;Tf•N .. uu. bll.J~IL.F. .ll~.
(°:"II• ..... 1F 'AS c.uo. >11.tr.~IL.F • .)c::"'I.
( .,o.
IU!iJ, Tc\11, 1J23't. 1 !i:>J!i • . S!>U, 3701. b7 I I,). 11• l l.
1- - - - - - tltNfflT >IFT-t.~C- - - - - -11- • - -lNC><El<Et.TA~ l;fi.lflT/<;UST• - - -I S~HvlCl Lt.VE~ 5EkVlCl LEVEL
2 J .. " 3 ~
l 11. l .J Io, 7 .J I u, Tti 1u.111 1.01 .u .. • u l .oo o.~J tl. 71 11,Tb tl. 1t> .bi:: .UJ , UI .oo u. j.j t,,7U "· 7.1 "· 1 .. .t>J .. u" .u I .uu
I '1 • ..,., c 1.13 cl.Zc 21 • .: .. I• "'\I .u7 .uc .ou H ,cl 17 .17 ! 7. l'.":> 17.-.th 1, be , Ub .~c .oo ! c."' 7 lJ,cU 13.~I 1.j .~H 1.2~ .o~ ,u I .ou
ACLli.JF+.1 CllST "1.1o.., 1.._1,.1> r r v• r-1 t. = ! • v
trr11.A~t-tl11Jr~t1Jr .. -l'v. ~1.i/l .F. lf- A.W~ -'t.ll. t -. /l • t •
·ESIGhATt:D !>PEED IMl'Hl • .. o,O HUAO OtSCl<l~TlUN
~· uc~--COLLtCTOR 7 •••
ACCIDENT COST l:IASIS ADT
•.t.SHlNGTON Tso. .,_0,33/L ,F. !>75 •
.. oo.
TOAS 750. :011, ti5/L ,f, S7S.
-uo.
ACC ICJENT COST hASlS/ADT fOH
•ASHJNr.TOh->UoJJ/L,fo HHS -so.t>S/L ,f,
tESJr.t.ATtD ~l'EED , ... ~HI : ltQ,O kUAD DtSCH!l'TlUt.
••• uc~--CULLECTUH " •••
' ACClDf.NT COST rASIS AOT
WASHINGTON zo on. S0,33/Lof o 1:n'>.
7!:>u.
HXAS e:ooo, !-0. l>S IL ,f, 1375.
750.
AC\.ll.it.r;T cusr tlASIS/AIJT FOH
WASHINGTUN-)Q,33/L,Fo TEXAS -•D.b!:>/LoFo
~1"1~. l 0, .. ., • ... 1 .. -.,c. lbrt"ilJ"I • ru 1. ':'1 .. 01. ~ l IJ4'), "1:i"'u"•
1- - - - - - tlENEflT ~/fT-~sc- - - - - _, ,_ - - -lhCHEl<tNTAL RENtFIT/(;UST- - - -· SE~~ICE LEVt~ St.HVlCl LEVEL
2 j .. c 3 .. 12.14 13.13 1..1.cs IJ,2b 1.21 ,Ob .u~ .u I
'ilo3l 10.u7 l 0 .10 10 olll ,\IJ • us .u~ .01 b ... 1 1.00 7,07 1.011 ob!> • o;; • u I .uu
.:J. 111 ~~.117 .:t>.O\I 21>. ll> ~.311 .12 • u .. • 0 1 IHoJJ l\l,tlJ i::o .u I .i!U ,QI> l ,11;; .011 ,U.J .01 Ii::• 7S l3ot10 l J,'fc 13,'ilS l. i!tl • 01> • Ui< • 01
k/C=loU
t>lll, 12ll:lb. 3J703. l u .. 1 u ... ~1 ... 01111. 1711 l • Si::t1!>J,
,_ - - - - - Hi:. ... ~Fll .'1~1- .. sc- - - - - -11- - - -1 .. CHEJo<t::i.lAL f1fNt.t'"ll/lUST- - - -1 SEH•IC~ LtVt~ 5t.H~ICt ~tVEL
c J .. i:: 3 .. JZ,J7 :i~.u~ J!;>,JJ ,j~ ... I! 3.c~ .1 b .uo .o.: c:i! .c!> 2•tUb c-. .C'':ll 2" ,.;S z • .:3 .11 • u .. .01 l <!. 1 .. 13. lJ lJ.2!> IJ,~11 lo i! 1 .uo .u~ • 01
bJ.7b 6b,\lt< ti'1.~"1 b'>,7o bo311 .Jc .1c .o .. ..J.H .. .. 1 ,It) .. 1 .tt'- .,7 •"" ...311 .C::c ,ua ,OJ 23.111 <:S,1!7 .:o.U\I 20.11> 2.311 .12 • u .. , 0 I
&/Cs1.o
bl11. 121111>, 337oJ, l O• lo .. , Jl ... f, 11!7. 11111. !>c11sJ • .
A.111
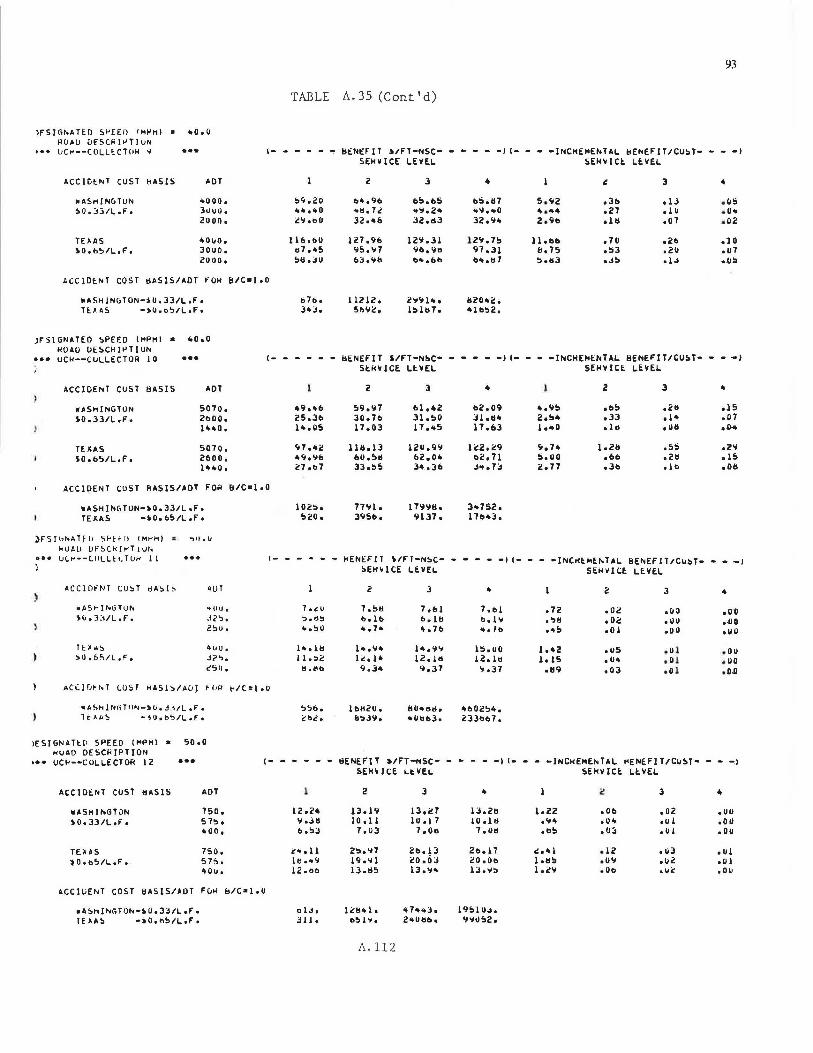
lFSIC.NATtO S~EEO IMf>H) s .. o.u HO•U OESCAl~T!UN
••• UCt<--(OLLtCTOR 'I •••
ACCIDENT cusT !1ASlS ADT
•ASr<INuTUN '>UOO, )Q,33/L,F, 3ouo,
2000.
TEXAS 4000, i0,b5/L,F, 3ouo.
2000.
ACCIDENT COST tlASlS/ADT l'OH
RASHJNGTON->0,33/LoF• TUAS •tiO.c5/LeF•
JFSIGNATEO SPEF:D ("'PHI & ltO • 0 HOAO OESCH!~TlUN
••• UCk--(ULLECTOR 10 •••
ACCIDENT COST tlASlS AOT
WASl11NGTON S070. S0,33/L,F. 2000,
l .. 40 •
HUS S07o. SO,b5/L,Fo 2000.
l"•o.
ACClDENT COST AASlS/&OT FOR
w&SHINGTON-)0,33/LoF• TEI.AS -io. !>5/L ,F •
;)FS!GNAHl1 Sf-'Efl) IM ... HI • ~o.o
kUAU UFS(kJt<TIUN ••• UCf'--C.llLLtt. Tlif' JI
ACC!flt'NT COST r:lA~ I~ ~UT
oASMl"'liltJ"° .. ou. ~u.3:1/L,f, .l2':>.
2':>u.
Tf.~ .. ~ 411U • ~0.6C,/L,F, J?'>,
cc;u,
ACC I IJt t• T lU5T HASl~/lluJ fl1R
•ASHINC.TON-)U,J~/L,Fo
H><>!> -tiU.b'::'i/L.Fe
lESTGNATt.C> SPEED IMPHI • 50.0 KUAO DESC~!PTION
••• UCl<--COLLECTOR 12 •••
ACC!Dt:NT COST llASlS AOT
w•SHl,.GTON 750. io, 33/L ,f. 575.
4110.
TDAS 750. ~O.b!>/L,F, 57~.
'tOU •
93
TABLE A. 35 (Cont'd)
I- - - - - ~ HENEFIT i/FT-NSC- - - - - -l l- - - -INCHEMENTAL 8ENEFIT/CU~T- - - -1 5EHVICE LEVEL SEHVlCE LEVEL
2 l .. ;: l 4
5c; .20 b4.9o o!>,115 b5.117 S.92 .lb o lJ .us ....... o '>I!. 7 ~ ...... 2 .. ~'if.•0 ~ .... .- .21 .1u .o .. ;:<;,au l2o4& 32.113 l2 ...... 2o9b .111 .01 .02
116.bO 127.96 12'>1. l l lZ'i, 7!> 11.00 .10 .2b .10 1>7 ... s 95,<;7 \lo, 1111 97,ll s. 75 ,53 .2u .u7 511,JO &J,<;!1 o .. ,&b "" otl 1 5ollJ .J5 o l ~ .u5
b/C•l oO
1'>71>. 11212. 2'1111 ... 1120 .. 2. 3 .. J. 56112, 151117. ltlb52,
,_ - - - -- llENEFlT 5/FT-N!>C- - - - - -1 ,_ - - -lNCHEMENTAL HENEFIT/CO!>T- - - -.1 SEkVlCE LEVEL SEHVICE LEVEL
2 3 .. 2 l .. •9 ... & S9,117 61,42 02.09 ..... 5 ob!> .211 .1s ZS.lb 30.711 31.50 Jl .11 .. z,54 ol3 .1 .. .01 l1t,OS 17.0l 17 ... 5 17.&l 1 ... 0 .1 Cl • ()Ii • .o ..
c;7 ... ;: 1111.ll lZU,9\1 lc.z.29 9,74 1.211 .55 .211 49,'lo &U,511 &2.0 .. 02. 71 5. 110 ,&o .211 .15 i!7.b7 33.5!:> 31t .• 3& J ... 7J 2.11 o3b db .011
B/Csl .O
1025. 77'11 o 179'>111. l .. 752. 520. 39511. 9137. 171>43.
I- - - - - - t<ENEFIT \/Ff-N~C- - - - - -1 I- - - -INC"fMENT-L BENEF!TtCU!>T- - - -I SEH~lCE LEVEL SEHVlCE LEVEL
2 J .. 2 3 4
7.cu 7 ,!>II 7.&l 7.bl .12 .02 .11 a .oo ':>. "" bo lb b,lb b,l'I ,'>II .02 .uu •. uo ... 50 4-.7• ... 7b ... lb ... 5 .01 .011 .uu
l1tolb 1 .. ·"'" l•. ""' 1!:;, uo 1 ... 2 .us .01 .ou
11.:>2 I c, l 4 12, 111 12. 111 1.1s .11 .. .01 .uo !lotlb 9.l• 9,l7 ... l7 .119 .ol .01 .o.o
t./C=l ,u
!>5b. lb/120. ll04!Sdo ljb02!:; ... 2e2. 115J'i. 4llbb3. i!llbb7.
C- - - - - - BENEFIT ,./FT-NSC- - - - - -I I- - - -lNCHEMENTAL t<ENEFIT/Cu!>T- - - -:I !>EH~lCE Lt:VEL SEHVlCl LE~EL
2 l .. 2 3 .. 12.24 13.19 13,27 13.211 l. il?.Z ,Ob ,oz .ou
.. ,,jl! 10 .11 lU .1 7 10 .1 !I .11 .. .o .. .ul .oo b.53 7.0J 7,0a 1.011 • Cl!:> .o:, • 01 .ou
2 ... 11 2!:>,97 20.13 2bol7 c!.•l .12 .o3 .u1 11:! ,.,<; 19 .111 20 .ciJ 20.0b I .115 .O'I .u2 .01 12.ab ll.1!5 ll. "" lJ.11!:> l o2'1 ,Ob .u;c:o .ou
ACCTliENT COST BASIS/AOT f"O~ B/Cal,O
oASH!Ni,TO"'-'U,33/Lof • cl.J. I ct!<+ I. .. 1 .... J. l9!>1U~.
TE AA!> -~O,n5/LoF• JI!. bSl'>lo 2 .. 0110. \191152.
A.112
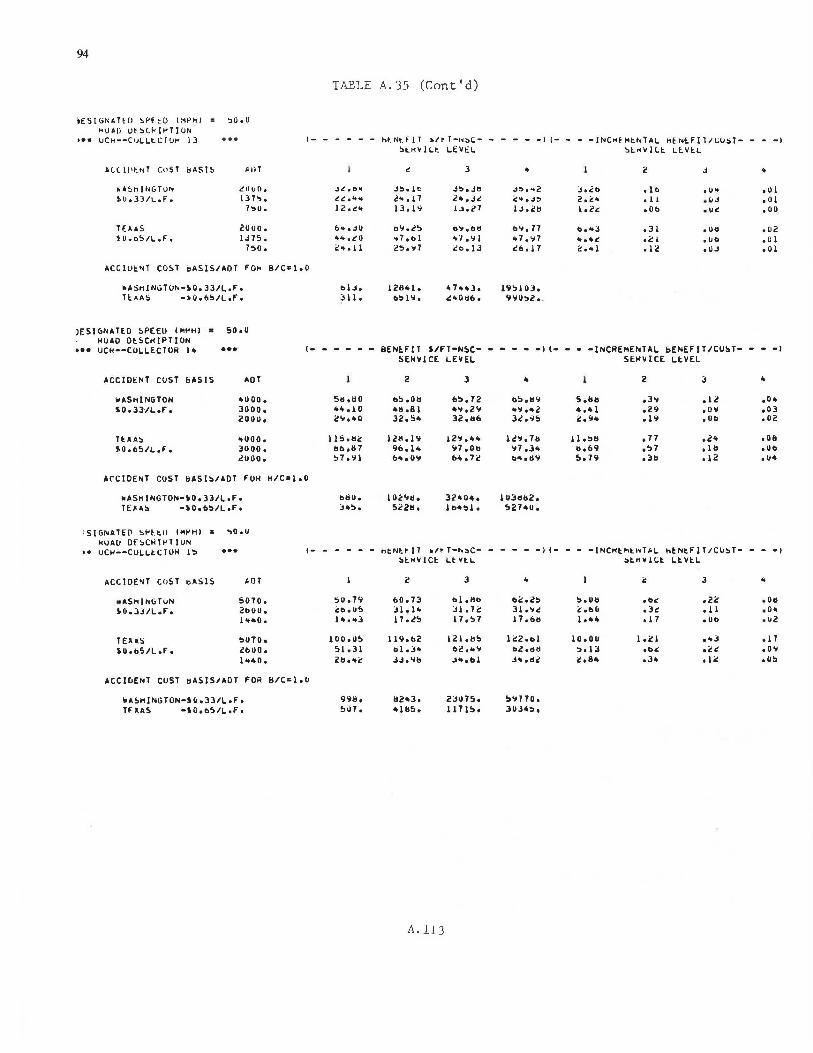
94
IE S l GNA TED ~f'EtD I ,.t'HI : .,0 • U kUAD DlS(k!t'TION
••• lJC1<--C•1LLtCIUt< 13 •••
Al( li'tNT COST bASIS ~llT
wA~NJNGTUN 20110. ~0.33/L,F. i::n..,.
1.,u.
TEA AS 2000. io.b!:>/L,F, lJ75.
750,
ACC !Ut:.NT COST i>ASIS/AOT FOk
-ASH!NGTOr.-,0,33/L,fo HAAS -)Oob!:>/Lof o
)ESIGNAT!:.O SPEEU (M ... HI • so.II HOAO Dt.SCHIPTION
••• UCk--COLLECTUH I" •••
ACClOl::NT COST bASlS ADT
wASHlNGTON •u oo. SO, 33-/L ,f • Jooo.
2000.
HHS 'tOOO, SO.bS/L,f, Jooo.
luoo,
ArCIOENT COST t:IASIS/AOT FOH
•ASHINGTON-,0,JJ/lof • TDt.S _,O,b.,/Lof o
'51GNATE[I Sl'H.11 IMl'HI ,. '>OoU kUAO DfSCH!t>TIUN
•• uc~--COLLtCTOH I., •••
ACCIDElllT COST bASIS ~OT
•AS"IN&TuN 5070. ,0,JJIL.Fe 2000.
1 .... 0.
TEHS SU70o 50.b5/L,f, lbUO,
l 't40.
ACCIDENT CUST 11ASlSIADT FOR
•ASHINGTON-lu,33/LoFo TE llAS _,O,bS/LoFo
TABLE A.35 (Cont'd)
I- - - - - - blNt.F IT '"" r-,.~c- - - - - _,I- - - -INCt<H•~.lllTAL. bEl'•t.Fll/L.lJST- - - -1 Stt<Vllt LEVEL Slt<Vllt:. L.!:.V!:.L
t!. 3 .. 2 J .. .Jrt!. .o .. .. ... 1 .. .. ... Jb .J~.At2 J .. 2b ,lb ·"" • u l ~"t:. ... 4+ l't .11 2't,Jt!. c: ... .J~ 2.~ .. .11 , uJ , o I 12.c" 13.l'ol 1J.ii!7 1J.2ts 1.2c ,Ob .uc ,oo
& .. • .Jo ""' .l!:> O'ifebH b\j, 17 b.-3 .JI • 011 .02 ..... co 't7,bl .. ·1,111 .. 1."1 ..... t!. .21 ·"" , o I c'+ .11 25,'17 2t>.l3 t!.b .11 2 ... 1 .12 .oJ .01
8/C•"1·0
blJ, l 284tl. .. 1 .... 3. 19!:>1 OJ, ::111. b"l"· t!."Oclb, 11"11.,2 • .
I- - - - - - BEN!:.FIT S/FT-NSC- - - - - -I I- - - -INCREMENTAL bENEFIT/CUST- - - -I SEHVlCE LEVEL SEHVlCE LtVEL
2 3 .. z J .. 5cl .so b!:i .011 b.,,7Z b!il ,cl\I s.1111 ,J" .12 .o .. ..... 10 ltll .81 "" ,211 .. " ... 2 ..... 1 ,Z9 .011 .oJ 211 ... u 32.S• JZ,116 Jc.'il5 2.11 .. .111 • Ut> .02
11s.112 1211.19 12" ..... Ii!". 711 11,.,e ,77 .2 .. .011 tsb,117 9b .1 .. 117,0b "7 ,Jlt b,69 ,!I 1 , 111 ,Ub !:>7.~1 blt,O" 6olt,72 ..... 1111 5,79 ,Jts .12 .u ..
H/C=l•O
bHU. I Oclllle 321tO•• I 11311112, J .. .,. 52211. I c.•.,l, !:t27•U,
,_ - - - - - htNltiT .1~T-~sc- - - - - -1 ,_ - - -INCHE~ti.l~L h~NtFlT/CUST- - - -1 StHVIC!:. LfVtL Sl"vl~l ltVtL
2 3 " ii: 3 " 50.711 b0.73 bl ,Ill> b~o2S .,,1111 .c.c .2~ • 011 c:o.u!> :u .1 .. :JI• 7i:: 31 ... , c,bu .Jc .11 , Olo I'> ... 3 11.;cs 11 • ., 7 17.bll 1 ..... ol 7 , Ot> .u2
1011.0!> ll9ob2 121. ll!:i 1 c2 .c.1 1u.ou 1.c1 .. ,, .11 51.31 "1. Jlt 1>2 ..... C.2 ollt! .,.I J otlc .2, • 0\1 211 ... , .H.~ts J'tobl J't,clc ii! .e .. .3 .. .14: .u!:i
8/C=loO
9911, ll21t3o 2:.11175. !>'fl7o. !>U7, 1tli1S, 1171!:1. 3034.,.
A.113
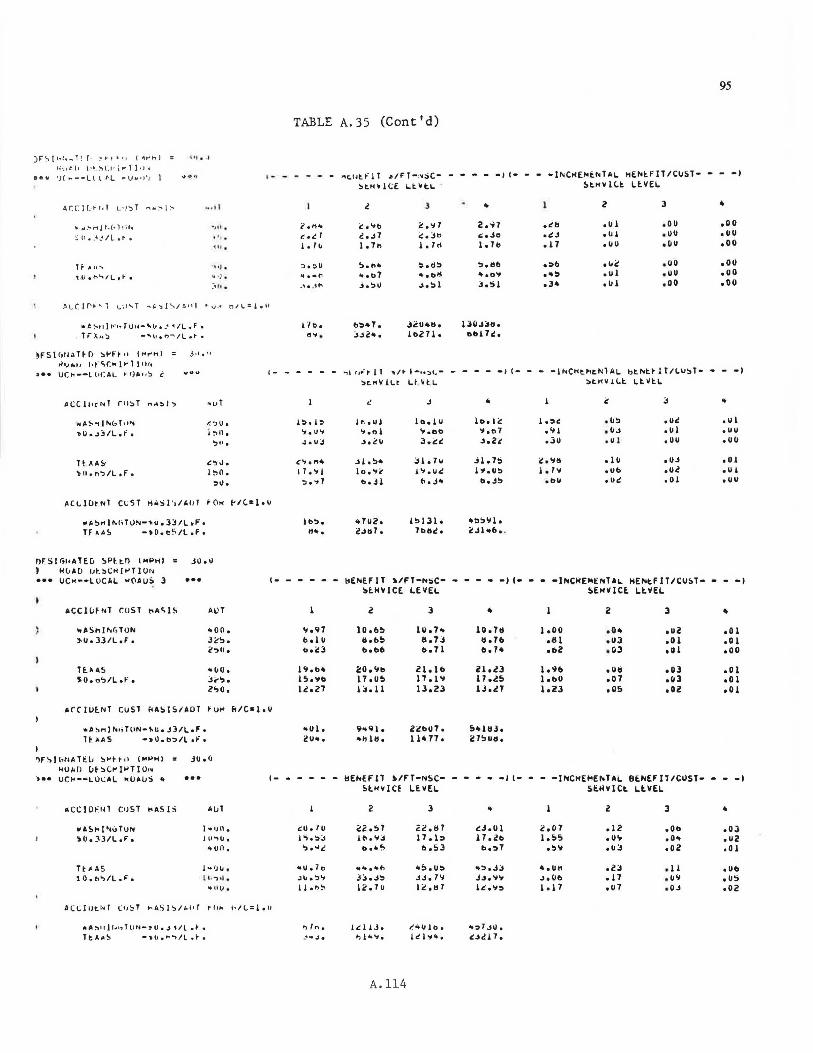
)F"Sl•~r ..... T; f• ~.,..~ ... , 1 "...,.nJ ~• l • t. I 1 ( ·~- '."I l: I ~ i ,.. l l •I 1.1
-~~ 'J( .... --Ll { f'L rUu•l'.• l
&\f.ClLt-r.f l.•.t '.:>T "~:-.!~
... "'~ 1-1ir.c~i11r. ~u .1_~1L.t.
1 F- A 11 ....
t.1.1 •,....,IL• ... •
~ ' I • I
... 11
.,4 t .
<1.1 1 ,
\.•• · 14 · ) .
~ ... .
95
TABLE A.35 (Cont'd)
· - - - - - - "C.lltflT ~/FT- .. sc- - - - - -11- - - -lll;CHE .. t.NTAL t!ENtflT/CUST• - - -1
'.11 .. r.t.1 1.111
StH•ltE LtVtL ~tHVlC.t LlVEL
l
t! .~ 1 c:.Jb I. 1 r1
.. .t.& .t.J .11
2
• u 1 .01 .uu
• Ui! .ul .u1
J
,ou ,uu .uu .uu .uu .oo
.o 0
.uu
.oo
.ou
.oo
.oo
't,(Jr'- .. "l \..;l .... T .,'-'>J'.'-i/A•11 ""•.J --1 r:I"-:.'•''
-.e.~t1J1·~ ..,ru1"-'l1._4 ~1L.F.
lF').,.~ -"'''•"'...,/L.t'.
~fSIC,tl~HO Sl'H '' ,,.,...,, ~1,,1,..I J I•~ IO,(." l t-' 1 1 •H~
~·· UCt-o--LhCAl. t< IJA11~ '
jd •II
'11111/a.~ "1 f P.,.(,f11"4
lJUe.l::tlL.f •
HAA~·
)fl.n":l/L.F.
4.llUT
r.::>U • l !°)ll.
'>H•
J2U .. th 10211.
1- - - - - - "'' ' "'tll ''° 1-,.~1. - - - • - -1 I• - • -INCt<t~tNlAL btNt~ITIC.U~T· • - •I ~c.t<VlLt L ~ VtL StHVlC.t LlVtL
JI,!>• )o,.'1i'
o. J l
•
jJ.7!> l '11 .u::i
o.J!>
l.::it. •'<I ,Jo
.o::i ·"J .ul
.1u
.ut> • Ut!.
,uc: ,uJ ,uu
,OJ .u<! .01
.. ,ul .uu .uu
.01 • u I .uu
ACLlOtNT C~ST H~Sl~/~UT POt< ~/t=loU
-•SM!ll;HT~N-~u.3J/Lof • TF~A~ -•O.c 5 /L,F,
n~Sl~~ATE~ ~Pltn (HPH) , t<~•D Ut~CMll'T}ON ••• UCH••LUC~L wo•u~ 3
... Snll'<GTUN !oU.33/L,F •
THAS !'U.o!>/L,i:.
JO.I.I ... Al.)T
'tOO • 31!!>. 2-,0.
*A~ .. I ,.,,;Tl•N-~O. J3/L .F. HAAS •>Uob:>lloro
'lf!>lbNAH.IJ ~>'Hol l"'l'HI : JU,ll
kO~O ~t::it~ll>TlO~
ACCIO~Nl CUST nASIS
~A~nl .... uTUN ~H.33/L,Fo
... AuT
1 .. u n. lll""llJ. .. un.
1 .. ~Jt;. llo ") tl .
.. ,4 U •
l !> 131 • 7011<!.
I• - • • • • ~E!llEFIT 'IFT-NSC• - • • • •IC• • • -INCHEM[NTAL HENtFIT/CUST- • • -I St.HVlCE LEVEL SEHVlCt Lt.VEL
c:o.<;o 17,US lJ.11
3
2il!Oll7 o
11• 77,
I- • - - • • ~ENEFlT 'IFT-NSC• St.t<\11 CE LE VEC.
c:u.iu 1 o;. ::i;,
"·""£ 'tU. 7 o .Jl.f. ':).,,
11 • "!'>
2
c:z.s1 '". \lj o.•~
........ ,.. J:S.J::i 12.1u
3
22.111 17. l::i o.53
.. s.u:. JJ.7'J 12 ,ti 7
i!l o<!l 11 oZ!i> lJ • .!7
1.00 .111 oD2
oUtl .01 .os
l
.u2 ,o 1 .u1
oOl .ol oOi!
.01
.01
.oo
.01
.01
.01
• • • • •I l• • • -INCHEMENTAL 8tNEFITICUST• - • •I St.HVlCt Lt.VEL
.. t.J.Ul 17,Zo
0.:17
.. ::i.J;s J..1.~.,
lt!. o\1:1
4.Utt .lo Ob loll
z
.12 • u .. .uJ
oZJ . u .u7
l
.oo • o .. .02
.11
.u'il
.OJ
..
.OJ • Ui! .01
oUb , OS .oz
ACL.liJt-1.,.f t.:1,~T .,..A.Sli:,/'-11T rl1fol. +.1t=1.u
111A~11Jf .. 11llJN-JolJ•.J tll .1- • Tt.AM~ - .. u.~..,/l .1-.
!"I In. _ .... .J.
A.114
.. ~1 .. u1. ~..l<!l 7.
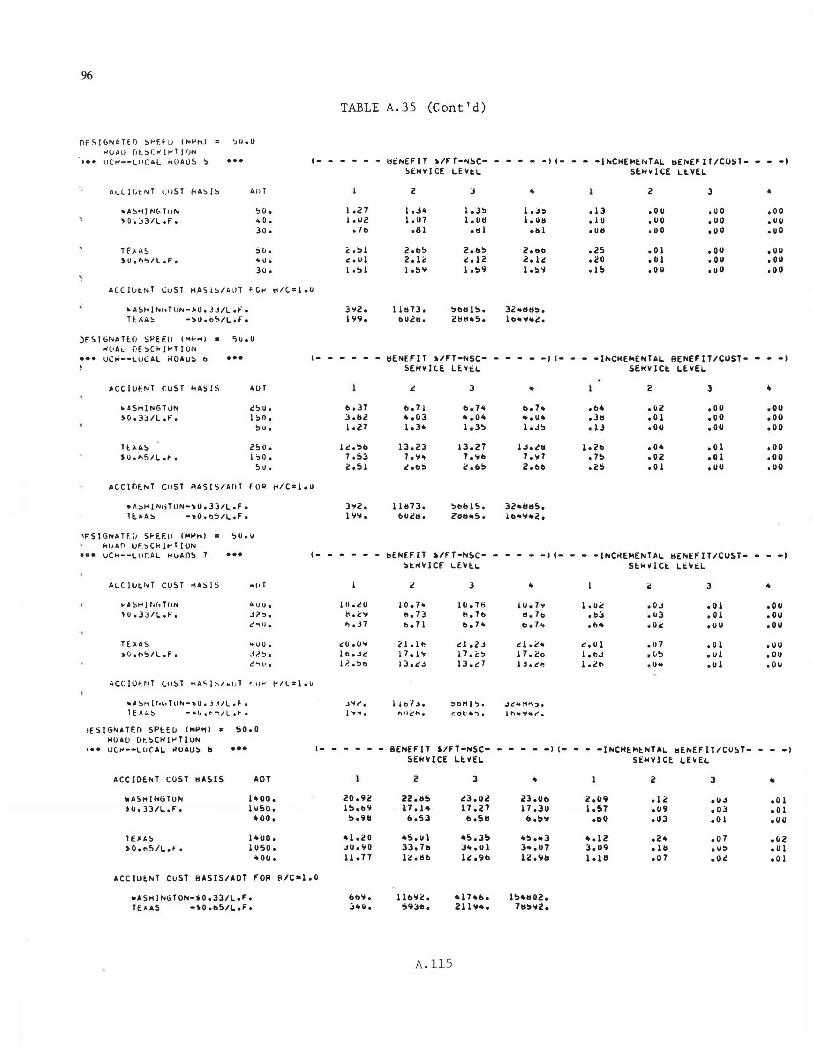
96
OFSI<:.NtH I) ~t-H u c,., .. ,.,, ~.Jo. o "'lJjl. LJ fit :>O<J .-lJ (JN , .. LJCt'--Llt \. AL IWAl)5 !:>
A<. Ll l; tNT 1;11 ST flA51~ All T
111A~H] N(., Tul\i
~O.j3/L.F.
Tf >-A~ !IU ,,.,'°)/l .F •
•A5HlNhTON-,U.3J/Lef o
T~AA!> •)U.6~/L,Fo
o;u. u
!>0. .. 0. 30.
:>u. .. u. 30.
c- -
TABLE A.35 (Cont'd)
- -- -
1 .27 1.u2 . .,., <:.!:ii c.ul lo!:ll
t1cr.fF IT .,IF T•N!>C-!>[HY I CE Lnt.1.
z
l •. H 1.01 .a 1
2.1>!> 2.H 1.s.,
111:173. bUZll.
J
1.3!:1 1. 01!
• <:1 l
Zeb!:> c.iz 1.59
-- -- _, c- -- •i i'<CH(loll•TAL 11E,.Ef IT /COST• -- -1 SE.HY ICE Lt.YEL
.. z 3 • l.J:. .13 .ou .uo .oo l • Ut! .1u .uo .uo .uu
.111 • Ull .oo .ou .uo
z • .,., .zs .01 .ou .ou 2.12 el!O .01 .ou .ou le!:l9 .15 .ou .uo .oo
)F'>IGNHE.li Sl'EEll IMl-•O MUA~ GE~Ck!t-l!ON
••• uc~--LUCAL HOAUS 0 ... I- - • • - • t!ENEfIT >IFT•NSC• • • • • •IC• • • •lf'<CHE~ENTAL AENEFIT/CUST• • • •I SEHYltE. LEYlL SEHYICt. LE.YEL
~CCll>fNT I.UST kASJS AOT z 3 .. 2 J .. •ASHINGhJN c!>u. bo37 b,71 b.7" o. 7• ob4 .uz .ou .ou ~0.3J/L,f, 1 !>O, J,112 4 ,OJ • ,04 •• u .. ,J11 .01 .oo .oo
!>u, 1.z1 1.3• ),JS l .J!> olJ .ou .ou .oo
HAi.S 2!>0. le.Sb 13.ZJ lJ,27 lJ.211 1.21> ,04 .01 .oo so . 1\5/L .r· . 1 ">0 • 7,53 1 ......
7 ·"'" 7,\17 ,75 ,02 .01 .oo
Su. 2o51 cobS z .b!> 2.bb .zs .01 ,uu .uo
ACCtr•f.f'<T CllST ~•s 1 son r FO~ H/Co:1.u
~~~HINijTUN•\0,33/L.F• 3.,z. lllHJ. !>Obl5o 32•11115. H.•AS •"tO.t:>S/L,F. l ':111. bUZllo za11 .. s. iO•ll•Z•
1FSIGr.ATF.r1 Sf-E.t.11 OO•HJ = !>U, U klJAft Uf.:>Ckit-TION ... UC><·-L1>CAL t<UAl)S 7 ... ,_ -- --- bENEfll ~/FT•NSC· ---- -11- -- •INCHEHENTAL tlEl'<HlT/CUST• -- -1
StrOlCE LOt.~ St." YI Ct Lt:vt.L
ALC 11.itl•T CUST oi&SIS "'I' T l! J " " 3 4
., . • ~t"' J t~(, TUN "-UU • 10.~u 10. 7,. 10.71> 1u.7., l, Uc ,OJ .01 .ou H.JJIL.I', -'?':>. t4. C''1 "· 73 "· 71> .,,7., • b.'.$ , IJJ .01 .ou
t-,n. "· J7 b.71 b. 7'+ t>. 1 .. .,, .. .oc ,uu .ou
TE AAS 'tUU • c-ll.O"tl cl .11> d .z,, "1 ·'"
c.Ul .01 .01 .uu ><>af'<i,IL.F. .V':>. 1 a • .l~ 17.1 .. 17.i::> 17.co l,bJ • ~!> .ul .ou
ie:°""'ll•. 1r. • .,., 13 • .:J 13.'7 lJ.~,, l.<'t> .o .. .ul .ou
oCCIOH<T (.II~ T t"IA<;, 1 !"'1/ ,,. IJ l ,.,) ... 1-'IV•l .v
110 ~H 1 tfl1 T u~- .. u. j .i/L .;. • .J""t". llo'/,,, :ODHl'>• ..Jt'•H~:>. TE A,,, - "U. t -i I l • .. • 1..,. .... hlli:',.,. r:cu-. .. ..,. l h .. .,. .. r..
If SI GN.lTf.O SPHU l"P'11 "' !>O, 0
HO•O (I~. SCH I" Tl UN ... U(r<-•Ll1CAL l'IO&OS II ... ,_ - --- - BENEFIT i/FT•NSC• -- - - -1 c- -- •INCHt.Ht.NUL 11E.NEFlT/CU~T- -- -1 SEHVICE Lt.VEL St:H VI CE LEvEL
ACCIDENT COST t1ASIS ADT z 3 .. 2 3 .. WASHll•GTl>I'< 1"00. Z0.9i! 22.11!:1 cl.Oil! ZloUb l!oll9 .le .u.s .01 ~U.33/L.F"o 1 U!'>O o l!>.bv 17,h 17.27 17 .Ju 1,57 .u9 .oJ .01
400. !:1.911 6.53 bo511 11.s .. oDO .UJ .01 .uu
lUA!> 11ouo. •I .20 .. 5.u 1 45.3!> .. !:l.•3 .. .12 .2. ,07 ,(12 tO."'!>/L ... - . I U!'>O, JUo'ilO 33.71J J ... u1 3 ... 07 J.U9 .111 ,u:. .u1
'tOO • 11. 77 12.llb le. 9" li!.va l 018 .o 7 .oz .o 1
ACC IUE.NT CuST 8ASISIADT FOR El/C•l,O
•ASHIN6TON•$0,J3/LeF"o btill. l lb':lc. 4l74bo l !:1•~02. TEA AS •\Oob5/LeFo ;,•u • '!19Jo. 211 ..... 7tl!:l .. 2,
A.115
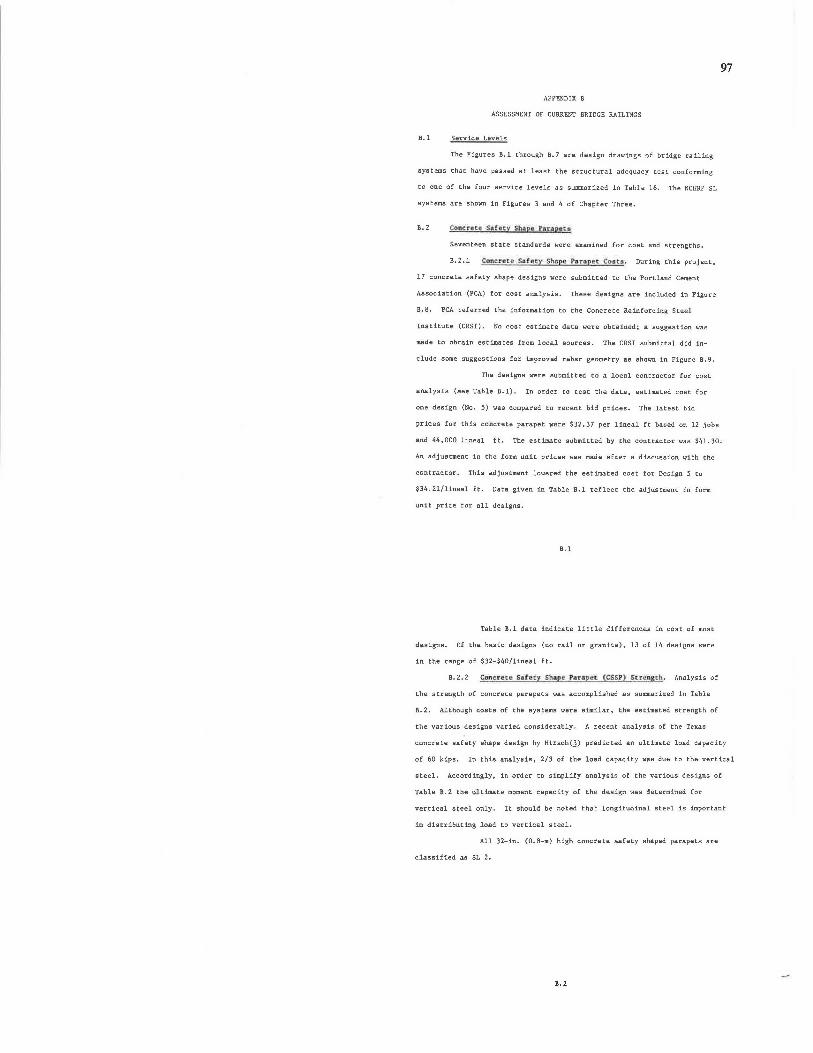
APPENDIX B
ASSESSMENT OF CURRENT BRIDGE RAILINGS
B. l Service Levels
The Figures 8.1 through B. 7 are design drawings of bridge railing
systems that have passed at least the structural adequacy test conforming
to one of the four service levels as summarized in Table 16. The NCHRP SL
systems are shown in Figures 3 and 4 of Chapter Three.
B. 2 Concr!!i::e -Sa!tity Shape. hrap111:c11
Seventeen state standards were examined for cost and strengths.
B.2.1 Concnta S11fttr Sbnpu l'er.opet Costs . During this project,
17 concrete safety shape designs were submitted to the Portland Cement
Association (PCA) for cost analysis. These designs are included in Figure
B.8. PCA referred the information to the Concrete Reinforcing Steel
Institute (CRSI), No cost estimate data were obtained; a suggestion was
made to obtain estimates from local sources. The CRSI submittal did in
clude some suggestions for improved rebar geometry as shown in Figure B.9.
The designs were submitted to a local contractor for cost
analysis (see Table B.l). In order to test the data, estimated cost for
one design (No. 5) was compared to recent bid prices. The latest bid
97
prices for this concrete parapet were $32.37 per lineal ft based on 12 jobs
and li4,000 lineal ft. The estimate submitted by the contractor was $lil.30.
An adjustment in the form unit prices was made after a discussion with the
contractor. This adjustment lowered the estimated cost for Design 5 to
$34.21/lineal ft. Data given in Table B.l reflect the adjustment in form
unit price for all designs.
B. l
Table B. l data indicate little differences in cost of most
designs. Of the basic designs (no rail or granite), 13 of 14 designs were
in the range of $32-$40/lineal ft.
B.2.2 Conerll!re Sa.fl!t.x Shi:t.p1! P.a.rapi!t CCSS.P} Stren'gc h . Analysis of
the strength of concrete parapets was accomplished as summarized in Table
B. 2. Although costs of the systems were similar, the estimated strength of
the various designs varied considerably. A recent analysis of the Texas
concrete safety shape design by Hirsch(]) predicted an ultimate load capacity
of 60 kips. In this analysis, 2/3 of the load capacity was due to the vertical
steel. Accordingly, in order to simplify analysis of the various designs of
Table B. 2 the ultimate moment capacity of the design was determined for
vertical steel only, It should be noted that longitudinal steel is important
in distributing load to vertical steel.
All 32-in. (O. 8-m) high concrete safety shaped parapets are
classified aa SL 2.
B. 2
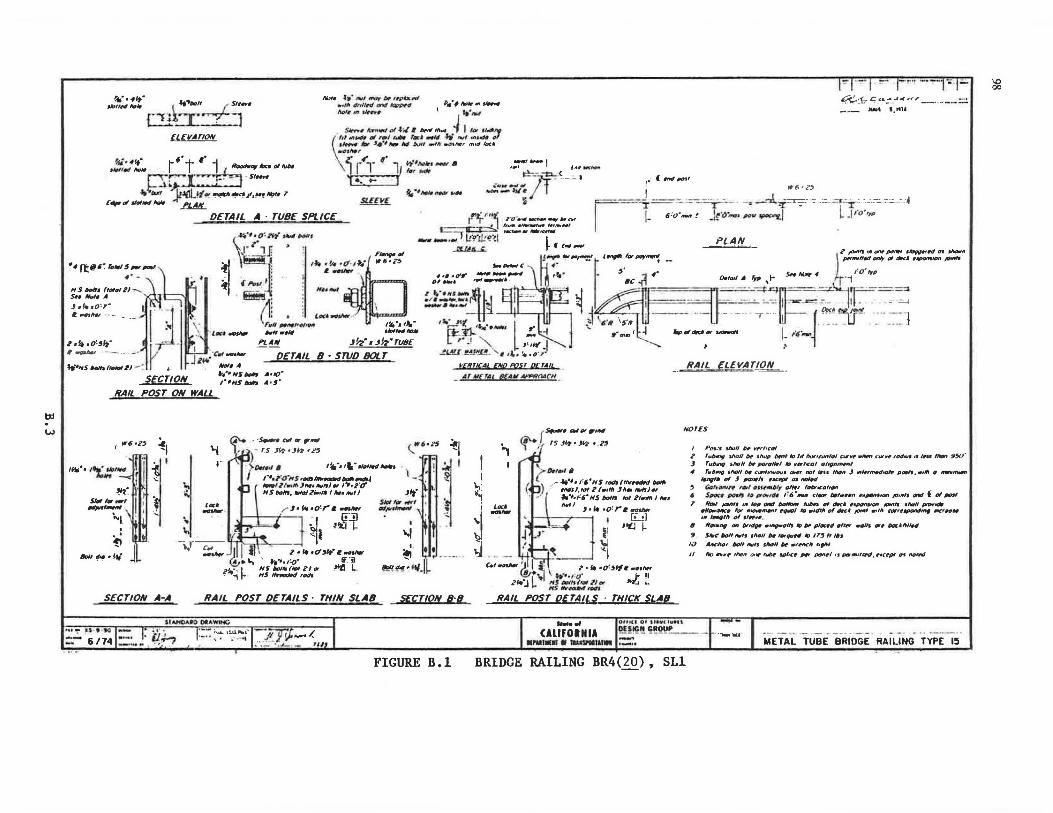
~
....,
:-- - ·· - ·-·11-; , J;:..
!ft". ,,i,· *""" ,.,,,. \ _...,.I»,, r s,, ... QlIT_~_-]
"'11• .i., • '-JI ""IF bl' , ,_ptr.ft'I .,,/It ''""rd tlftd IOPP'll P"• • # ltolr ., g.,.. l'lOll *' ~,.. t ... 1W1
.«..::!;""' ~~-~ ... "" ""' ' -·-· · ·---~
.... · - .>wt 1. tu•
ftEVATION SJn.# """,.., "' tv 1 - '""' ~ I '"' ,,.-,.,
~,Ml .. '11 ""' ,..,, , •• ..., ~ ,.,, utl4# ,,,, ...,.. Av ,._.., 1* ltd ~I -tll .osnter nnd loci ... ,,,,, g·~· ::'': ,..,, . ,::• .,_ I """ """",_
.:u .... .,:;=/F.{--=-l "k••lt" t-~'t ,_. i ,,_,,_,_ I £ ,,_ ... ,,,_
t=!t;""l::: ; : -"J .s1-~·w1 ).llll!f<!'! ......... JI,~'~ T
£¥olf/olW- ~
. ,. .. ___ _ ..... ... .w. /T
r ( rndlJOSf
____ J ---- - -·· . . W6·Z~
NS. IHlllJ ftol•IZJ -... S.• Nol• A
'.~ .o:,· .. ~ft.,
2 ·!t •0'51t" ,,,.,.., -- ..
~
1-1---::~~.: ;i;C)-::.-. :,, ~~ .. ~ -~11,:~::--:.=-: .. ~ ,.,. ••• o'·rl'JI ...... - •
\I° r 1 J > ! F'-ngool
~ i I-. ,: . .
• f'Po•t : : H•_.lfltll
t~"'~ 1 ·0 ·..-~,...111rc•' •i::=::;--.,,a:::::::&:;:::...-~~ ::-:.:::.-:.,::--'
-· - ·'"" 1 l.!!'.;!!'!~I I PLAN
.JJ:JL4_.£. t- ( c .. -
12 /Od'f'I "' """ ptmrl 1"1p/#fft/ Of Jhcw11 .... ,.,.,,."-on+ "' .-Cj • .,,.,,.'°" /(Nl'ft
#1, ,,,,:,- .,_,...,,..,~ l O'typ 0,..... ,.,,..,....A. 0.fOllA t;p ,r S#~.f r·1
DETAIL A · TUBE SPLICE
2=ff¥L
: :
'~~· ; 1Jo•l<t•tli51 .. • Wh•i'~
M!i~. . I : • : ,... ..... . l!it ... '"' •
rutt ,_,,,,f'fMP'M fltJlf#fl ltO#
::tn::!i!L4 ===n;;:-_ ~ ~~~~IF c::, '~Et;~··-· l ,. -i - -· ··-u---·· , .... I ~-~·jf'· _··--=1 L-,. I ' .. ..,.,4d .. .....,.. L ,:,-..,,., , .............. ,.,,, ••Id
PLAlll ,,~·._,~·ruse
{)£TAIL B • STIJD BOLT -·" ...... "NS"'°"9 A•J()• 1·-Ns ...... A•§•
, ~.. .."'. ,:,.-,.I ' ' ·" _ (,£,I - !EN..L!- ' • ,~. ~ .o· , .
V£R.T!C4L Ell/{) PQST DCTAIL
AT Al(IAI 8{AM ~(II
RAIL £L£'(£1fl!L...
RAIL POST ON WAU
I W6•Z5 ~I
,.._-.,~..; !! ~-.:. I ~·f
Sloll•,,.,, 11 . #Jflll_,,,, I ·'
~L . J ,
llol• <H "'" J
SECTION A-A
' \
"i ,-
"'" ... -
(A\+ - ·S.-. All•~- W6•2S "«J l.-.~ ·'5 Jl? •Jl11 •~ ' • -1
· ~""''"" 1ll.-.,,.,,,,...,_, . ~ ~ I I 1·•·?'0"NS·----~ \ - . . . , IOIOIZfrnMJM•lltlJll)tl' l"f•2."t:f' HS""""· toto12r-11t, ,.,,. ltfll) J#t. I
Sktll"' ..,,,, • • , ,. C.•o:r a ... ., -"''""""" •
t--+--r--.., bl !~~ . I ' ' -~ "-I
2•i.t•O'!Jl!t"l-...... ,:o· lf."il NS,,.,,,.,.., N• ,"ti L.
HS~rodt
.... , • I l•lt '!! i.i~ - .. . .
~! i'~ • ffl.j ~
RAIL POST DETAILS · THIN SLAB S{CUON B·/l
llAHOIJIO 0-AW...C
-::rrv.-- /. ~ ·- •..,,.1- - , ,,
.... - •. , .... "° , ... ----- l.L~ , .. . I ··-· . ilh 6 74 - -·- ' . ..
• .... .... ;,~ 1:!.ll,.. l'' ·- ·· .... ·-i
FIGURE B.l
~: "'I
:.,
~ -!:.~.':,::;::,:-J~:r::-.... ,.,:,·HS liolfS lot lf-111 I N•
'""' J•'* •o:reroJNr I li.!I
11 ·~I-j~ ~~ _j '-1 J .. - ! ~- ~1 c .. -..-'.J• I a; ?·i.·o'!J"ll-•""
~ ... , ..... , ,". 1•11 .,.,,.·J L"' 11.slJOl,..,""' 2J°' ~ 1-NSll'lt«ldftit(Odl
RAIL POST O{TAIU · THlfff ~LAB _ _, Ou t.f t O• U•t1.(tw11 '
OESIC" GROUP
NOTES
I Poi.·s Jlull ~ W¥1t'OI
2 't.JHntJ 'Siio/i N J/ldp ""'' *'"' ftt.wUcJtf/Q/ CllW'...,,, '"'~ '°""'' /1 In• than ~· J '"~ shah # po'•llrl A:J ~«"llC'ol ol~m~t 4 '"'6JI Sholl 0. C""Vtf#OtJf ~, "°' /#H lht/lf ,J ,,.,,.,IP#d"1,. pa.If, •1111 • ,,..,,....,
/flng/6 ol J Pont1l1 r.acrpt as nolH
~ Go/•°"''• ""' llJU•l111' olfrr lllbrtea''"" 6 $pon ""''" 111 prOfl1tH 1·'6'mu1 c/«11 l»l•Hn '~"°"''°" "'"''' ortd fol,.., T Noll plttf "' loP Ottd """'°"' fllbn al dtc• 'VHl"'I'"" J'llf'll 1/loN ptPtl'*
•No.MK- IOI' ftt0dln*9r rquql IO "'dllt ol drc.t /Ofl'I .,,,. a:xrupOIWI,,,_ ftl:r'HW "' 1~111 o/ f/Mr#~
IJ 11,,,_,. on b,,d .. r11,,...alff to a. ploud •ltw wol/J "" O«ll't/¥4
Y S~ lkll'""'• tlulJI a. lllr'lflH _,''~II 1•• UJ AMltot llo/I 11111s sltoll N •r.-Clt ''fh' II No.,.,,, than °'"" ,,,,,,. tp/•c• ,,_, "°"'' '' pt#tfttl"'1, r•crpl a• notftl
<AllfOINIA •1'111•11·-·- ~-- ------...... ----1 METAL TUBE BRIDGE RAILING TYPE 15
BRIDGE RAILING BR4(20), SLl
~
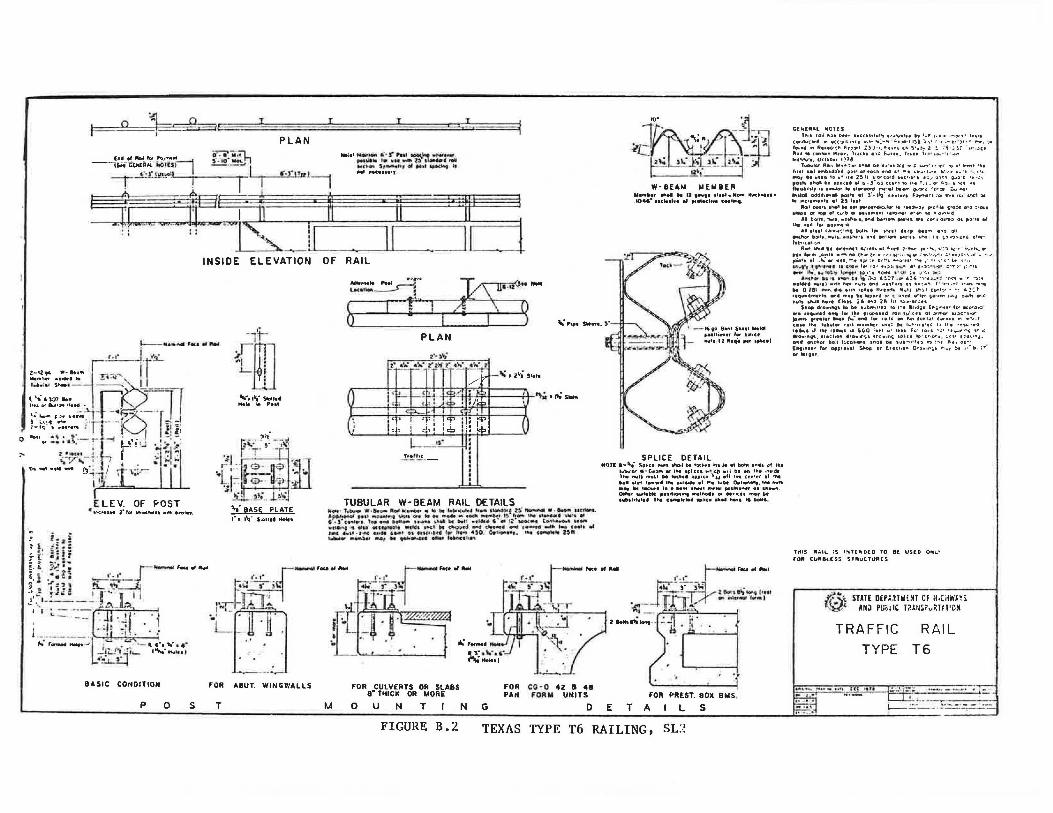
a }-- oi=3 I ' PLAN
INSIDE ELEVATION
1----... ~ ......... ...... -1!f-
.i'fil]' j ••
~·r·.2.... ·-·· ....... Tn. ~:-.. --QI ...... ~ ..... ,lo --;;,,;:"' •••• 1 • • ~·
~~:::: .. :h-rlD-- ~ J l•. ,, •. , ... .. rr--j J I ~J ~ 1-:~· :.-:.·;._ ~F i!r · ~·~ , ... !1 ;'1:!.·
d .. 'v•••• .: ·~ :.:. 2 •1-Hn __ ~ a • • ,.. .-,-v ... . : I 1 l.·i.-
ac. ............ ~' .; "-1 1 '\f"" I
i.,! ; ~ : !iii
i l!t_
ELEV. OF POST • lr<•IGH z• 1oo •••.c .... n ··"' ·--·
r ~ .. } :. ~ Ii. 1..-:! • • , ............. , .. ,,, ...... i, i ;·.!: ~::..?;--J ; • 'fHl !i... °'- -'.l ·:,.: ! ·~ • I • • •• 11 I ~ •. •----- ~ ~ '.:>.,
I . • ~= -- ... - ~ . - - I
I J...j '"!• • 4 J. • - ~··----- 't - L--...... '- ll 1•1 .,.. I ....
,,_. r.-......_ • ..,, .JJ:.J,_...t·r,._ t'-'"tt,,1.t11
o'~
BASIC CONDITION
"I : L_ 'i "'-'"••"1'"saot114ll
HeN in POii
\.e" BASE PLATE 1'" • 1\.,.- s.0111• Holn
FOR ABUT. WING\VALLS
Mt:1• ~~ :~ ~!-:!-'°t}~r;:_ 1M11o.,i St-•''f .... d .. tdott I t ,. .. 11111t:11111,,
OF RAIL
• ZF•
~:c·:=~
PLAN
· II! 'Tl ;t t\M•~s.te
~~-
TUBULAR W-BEAM RAIL DETAILS ~· t....,,..- w •IH11"9 R.• .,·'""""' • .. iR t.il:llloc >11'1:ll '•'~ •~t tt' lftol-.I W • ~ u .........
:~l~1:::u,;;11::';1.1:! ~:.i.! ~9: .:,r:'::."T-~ .. r>l;~-:.:=. , .. ~..!;~':.:. •ti~ •1 .... tcctt 1"°'1! Wthh t1 ""'CJI iH C ... i)~f .... ~ .... ill roiJI i •"""l'4 •""' f• e ( .. II 9f , ..... . . t<ll( ... ......... . 01. .•M••ll•d , .. .. . . 4SO. 0.b .... ll t , $411 ... w .. z~n ~ -~· ~, t. ~-..al'I ••'-' fM.rouluA.
fj ..... · {_,_,, ....
..,..- --':[[f!5' -~+J
~r::r . . r ·- · .. •, FOR CULVERTS DA SLABS
a• T>llCK OR MORE
.. ]" ..... ". •t\t "°"'''
FOR CG·O 4Z 8 4B PAN FORM UNITS
W-BEAM MEMBER Ml"'''' ,..,.. .. II ''"'' 11111 ... NOllll tfl..:lr. ... u • .I041'" uci.1111 •' .... tch•I CMI .....
SPLICE DETAIL Nt)T(• Iii-tr.• !iphU '"'" "'a.I 0. 100•0 i"l•.M et bolR en•• of lf!.41
lubvlo• W·lico ... •' 11141 "l•Ut .t.ic(I •••i '>• on the .nt1•dtl Tti. -11 ''"'" 0. tvid•• ODP•CO• "·u all ''"' (tn••• ol '"" •o11 tlol l••'JI• Ir. oul"O• at ,...., luDI 01tl..-i.011,, ,,.. "" .. ... ., .. l•c•tl te O IMM 11\ffl ~I .. go&iloo,.tlf a• •"-"· OU•r ''"tob&I •Hiho•u••t ""'""' or Otl.0<11 mo, be 1v111tot1i1••4 1"'9 c.,,.,kl•• 1p1ic• ••• "••• •6 boltt.
FOR PREST. BOX BMS, p 0 S T M OUN TING D E T A I L S
FIGURE B.2 TEXAS TYPE T6 RAILING, SL2
c;(N[A&l frlOHS 111111 rllll fl.JI~''" t11cc1Hlu"'r t•.J•.,.c•10 .-, 1,,11 1.:11 • .... ,._-,, '"''"
(O'lduCl•d .. OCC':IIC)"(I ..... ~:. .... i-t;>WI l)j -:.,• r.«•"'' ' 31 •• "'C, ';.'I
l0t-ftd IOI Auto•tlil il::rp7I ;:) ) • o, J.,,., <"' S""-'? ' ~ ;• ' ~ '( · ,, . :.~· "'"'I• tar>tcl1" HfG"o T1,.c.t1 o~C: f..,1f1. Tro111 T·:i·;.;i~- · ( 1 -V" ~l .. lv•t. 0Cllltler l'.:111
1 .. ti..lo• Ro" M•"~•· ,.,cal tit 1•'•"'<111 .,.~ "'"'•~'•' •o a• Ir°''""'' l111t 11>1 .,..b1da"1lll i1'" 01 tocr. 1nd '' "• """·'·'• "?t 1w:r. "-~•"• .... , Cl• .... 11IG11!"1U 2~11 ··orr..;i.1d HC'•llll'I ,.:;;,,,.Q}~ .. g .. .J·C ···~~ ••"•,._ •• tit u••~•• •• b·l"o:; cu•l IO''"' T,t. o• '-:. 1 "<' ,,, tteullt111r ........ ..,,to tl!ll"OOl"O ,..,. ••• btOM q..~.:: !c .. ::t .... n.o• ~1lol odOll•~• "''' et ]'-1\:i" ''"'"'' F-:i,...rt !u lrl•I ,,,1 V>C1 :it
• ... , •• "''"'' •' 2~ '"' "°'' "'''•'*"IN·~ ,.. •• ..o.c .......... ~,,, rc'-111 ljj•OCC Clt"CI :•DI•
119PC ar loti el cu•b 1111 "''"''"! ••••-• •'•" WI ,. ~.., ... d &I 11.io•n. """·•C'•"'•••. '"' t.11- ... ,,, 1:.1 '""' 01'95 •• "''"' 8'
''- •••' fa• PO•"'•"'' &I,,,,, t.Jn111:•,..1jj bolni '°' ''"' ht' ce:i~ •":.; on """"'°" ttoll1 . "'°1t. •1tll'o.1·t 0.,4 9CllQ>fl 5-0G'll ,,.. Ct i;.:i"""'''' c!11·
fot-•c.o• "" A.,1 11'\o1 Ill e11t.,!M1 o,;111" d 1.,, .. :·"'<>'" 111 • ., , 1' ::1 &,; o: r I·~•·"-· o•
:::,:oro7 .1~~:: ·=~~~ ~. c:::;: ;~~:,• ~~~~~~ u: .. ;~:·~:··:·.t: ~:i~-~~.~--;. • .,.
"'"'''' •"'I'""'' 1e ~ .. 1or ''" ,,,,. ,"""" ••••>-:"\...,.. , . .,.,. 1:.1111
~"'1:::., .... ~~i~\!:;':', ~!•;.•:i ":;~1'.";1•_.~~ ;:~~ J~:~ ·r·~• ... ., '"J:•
••••• """"' •• 111 "•• """ eno -01~•" '' ''·~·"'- r- •"l·"'" '"°' "'"1'1 .. 0 781 "'"'· ... •"" roiltO .~ .... ~ .......... ~I CV'''' - t: "!i'.:l 11q-•mc11l1 •• "'Of te IO:lltl'd O' t-0,1(1 O'lfr i;~··cri '''"~ C.a.11 °' C ftutt .,.dll llo•• c.lon 2& ... a 211 111 1;i.,•of":.t1
$flog fro••l'llJ• lo lb• t .. tl,.,1llt:I 10 1•41 Br·d"O• (lilf"'"' Ir.- 11co•or:i •• , .... ,.~ .,,.., lor lflo1 ••OC"OU4 nul 1:,0'-ltl ol ~rniv u:ic·'°" )D•"" t•••••• 1 .. 111 11i.· a"° tor ""'' 111111 l\or 1on1a1 <•••U .-....... r cell '""' lotel<11I01 •111 "''"'btf t.nai:: Dt It~'" ll't'::" U lht ,,_, .. ••d ••"'-• 11 011 , • .,.,., ,, iC.O iett "' 1111 fo· ,.,, 1 •.:.• ··~., ..... ._ .~ '' ••••ltll. lltChOfl ••O•lf'l'f• lflt••n( IGICI IC'·t••Ct"• ~~.11 IC" .. V"•· a11C ot1chor 110:1 l;..co11 .. 1 shall•• 11111-. 0 · 11~ I">:"' "'· ;:,1·.: , Ent1n1t1r for op51••-~• 5'-o5 or E11c1.o" D•)• n•,• "'·• ~ '' tt, i'.' .. ... , ..
lHIS "AIL iS 1'41("iC.[0 10 8( US(D ON;..T
ro .. CU .. BLESS STRUCTURES
.ifp~< STATE DEP~~Tr.ltNT CF H1CitW~n i._~< ANJ PU<.1 IC T?.MiS•vRTll!CM
TRAFFIC RAIL
TYPE T6
~)~•~·;,,~ · - ... - - · • I -
1--.:::.=.:.:.:.=:=~
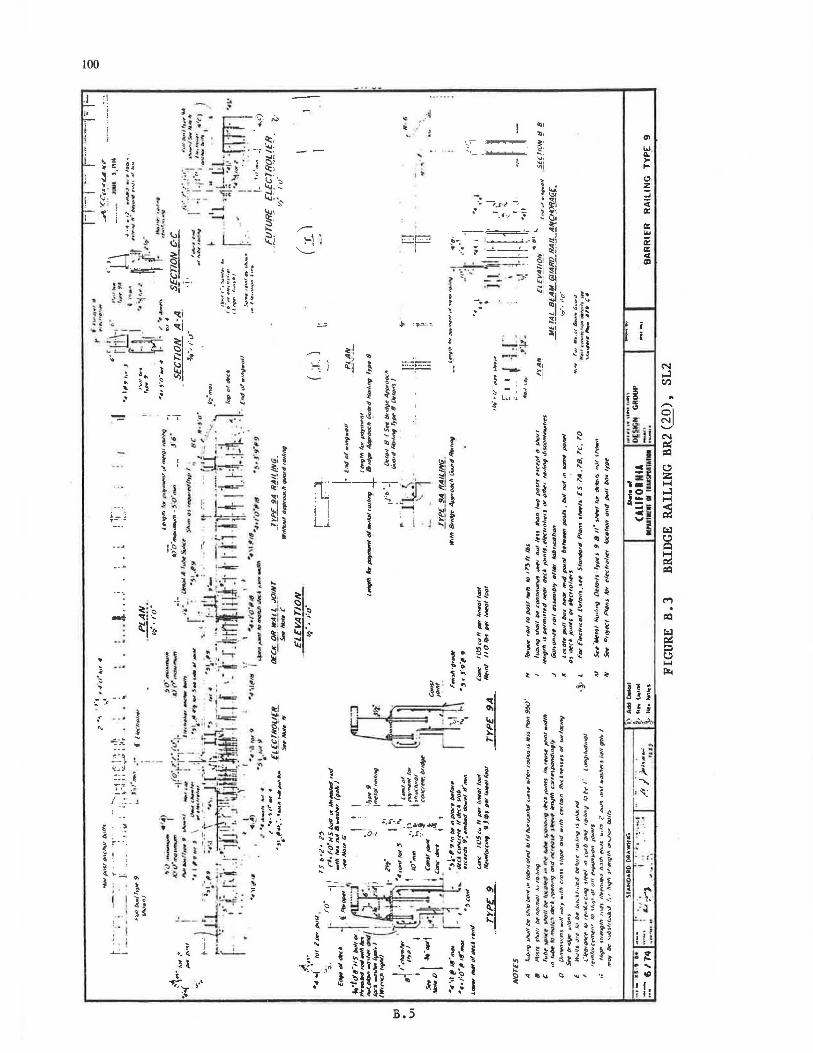
100
I•
·~
..
j"'"'"';
"-.:. ,.- ..
• . JI
~· ~ r··. , 4 g :
L'"" J : ' . f I
! . •
b -~ ~
i } •
~ .. .. ·~ ! ~
,,...._, •. ~·
.. .. :• .:
... <
I i
* :1' .. : .: .. ":...
B.5
·~· -.
t -! t "' !
u H H ". as ..,<:) <:)' ,,
~~
~ OI
.... ~ ....
a~ j1 'l t; .... a .. ~~ ~
!i
~
. ' . :........:~
' ! '•: -"'r----- ! L: .. ~ f
"' ~ ~
.,, '" 't· ~· ti: "' "''
't ·
"' l.:i
t ~
d ~ ~ ~ 'S H ~~ . ~ ~~ !!. • !~
l a I ~ .
~ t
N ...:i en ..
- ~ fO . .. -.... • ~I =r '!ii' • ~~: ii
.._, N ! O • er::
f i:i:I c:; u
.. :~ z H
•o- ...:i !5~ H .. ; ~ "'~ c:J • u
~ H er:: i:i:I
r"I
i:i:I
~ ::::> u H l'z'4
a e :; !~ j
!l i ~· -~
'l: . ' . :..\ >..
I ~~
~ ~ . Ii i'", i; ! : . •: ii1 . 0 z ~ " · \.
.: ,l .
i ! l ''
1· ~ . ,.. . ... : 40
•I ... : "
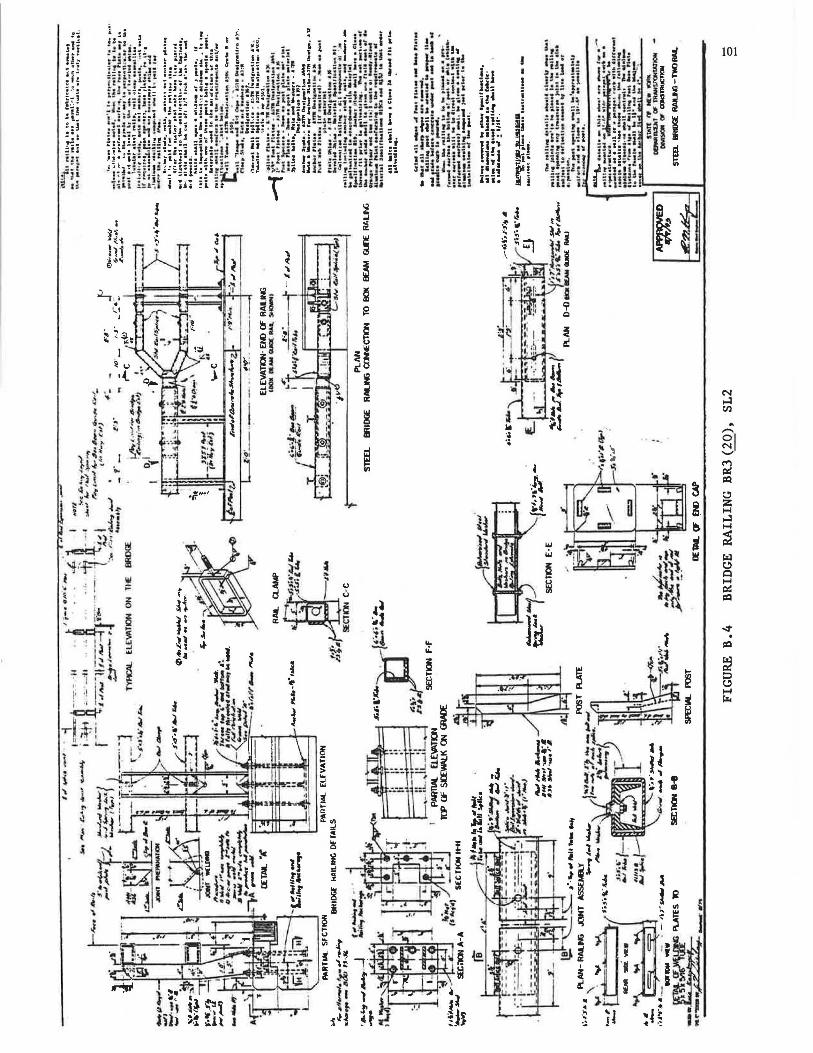
101
N ,.J tn
J .. ,..... 21 .._,,
. ' r"')
er:: ·!l hl ~ = L
t:.!)
~. z ~
~ ..:I
w
~
w a ~ ,H• ~ i:.l
1l"l t:.!)
~•I ~ ~
.. !~ er:: = ~ .
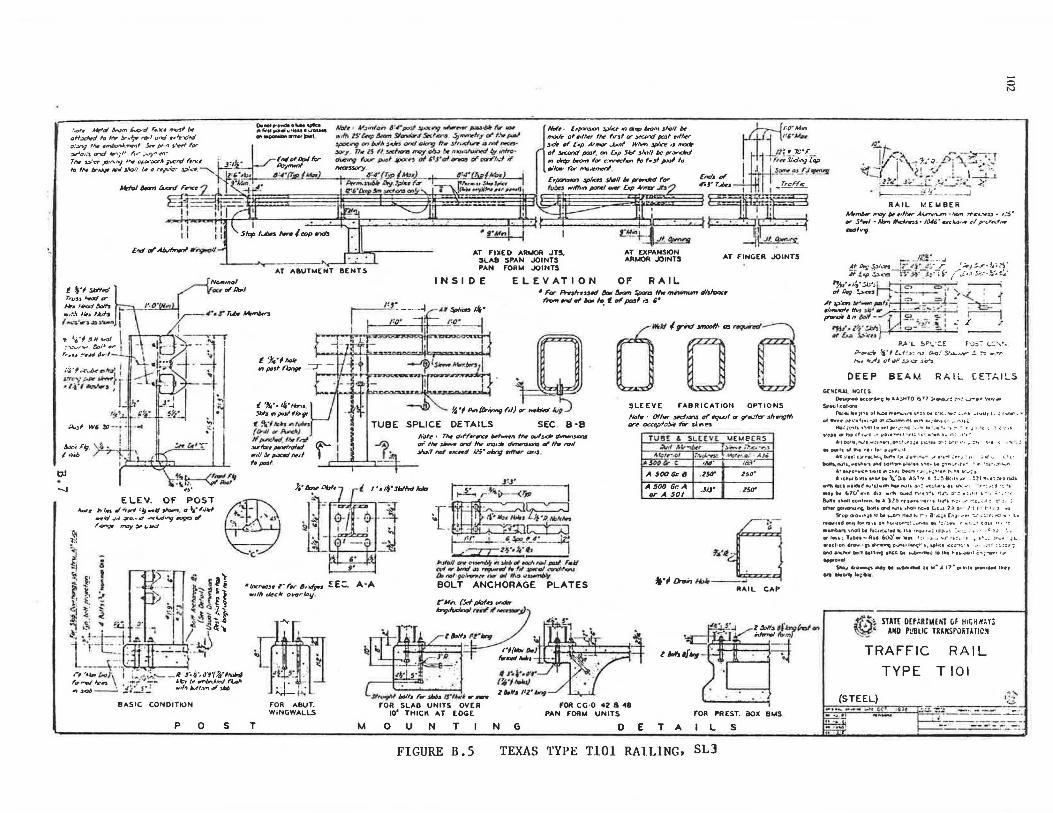
~
-0 N
'd• >ft'~ 3".Jm &.;o.·d r._y• 1".ffl ~ ~:::mo:=:~.~.:.. IJol~ · V~.qfan 4 ·4-•poj/Jt.4<fl"V"'-'~~ltl '°' offxlwd la IN .\-'•~ ro./ ar11ti ~,,,.~'fd _,._.,..-•mot )*t " -,Ira r$' k-tp 4't:ln ~ $tcfit¥u .$jvnmtlf"J' ~ ~.'w /:l'Ja/
~a1:s a.-w:I ,.....;~1 fir_..""-'"/,.~.. • Jory 11.- 15 II. :<e/N¥D may.olw b# n1q1~ 0' flfrlro- ~ro·u.n / l&'ltl(Jr
o.'.Y>J flw #lftllo"'1,~I .S.-. p;.n J.~ It>' ~ ¥JOC-"'9 ~ "'1//, .$d-> Ohd oJr;r:g /;-, .J}rucl~ Qh'J/ l'll'('dl·
Thr '.>'a .J"-'"·l><J ''V cµ¥.:JiX" JIXord fr/'t.:' tf' .J!/ • . (ntl°'l1otlfir dvcu<tg (.,., JNJ .px-. ., ~ ttJ•gl'1fW» ~«nfl#to"J;, fo IN br""'ll "'" J/to// ti 11 r•;s;/or .,: ... .-.. ~ . A:Jprwnf n«PSSOl""y.
' £'.~II• 11~-U..J _ffffrf>.~r}- 6~l""'tl_____J _,a-.. liuorTI Froc• "J · •4,., •. 4• I A< ... ,.~ <1y, .:,:.1.,, f.r -r-----ir,, ... ,. ....;,;;;;-i
Nolr : l •ptJl'UIOll Ji;Jl.cr ~ ct.., l«Jm Jlvll bt modi' al •11/>,r IN f1rJI rr J«CJ>-d JIUJI r1lhtr .J,do of C•p Ar"'°' J;,,,nl W,,.., .jpllCP 1J """*' ol J«ond poJI, °"' bp Sit>/ 31i..>ll be pr:wdkl "' ~ brom fOI' e.wviclcn f'O f1r3/ p.u~ lo ollow ;"'or rrtor1tntNtl
c,pan310n s,p!,cn •" ,,, pror,dtd for li.,:ii:..;z-...
'~"!...[{_'ll!:'!!JI
TrcFf'1e
. tfr...-:{\. . .. ,... ----~ _, I -v'·'"· L'> · ~.,.. • 1_ ~ ! -..! ! ...... ;. ~ .. : l."..! ,L~" ~£/~~.=:.~ ~:""
'~'..:... ~I W' .!0 --: :
<==1"~- -f. -• llf'' Jm.)ft:ioUoM . !/loiif-'JJf~"- ,.'''<t#"
~=-1f1--=--=- : . .......---. I ,---~ ,.,tfh,,, pant/ IJt'ff"' &p ~ Jb
! I I ii 1
II 11 1 1
I :slDf' '"""' 11ww I cop""""
£,,,Z ,,,. A/wl,.,.,,I ,.~,
NGAtmol
~·~,
AT ABUT .. ENT BENTS
·.rr.-..-.
{ '"'''~·-·· ~J "i"Q/ fO'J' f ~., ........ , ..... (i>'J/.,~)
AT FIXED "'A"'OA JT5. 5LA8 SPAN JOINTS PAN FDR"' JOINTS
INSIDE ELEVATION Of RAIL • For Prw"'-uMI /bl&-! l;oar1:I If.,,.........., di>!Doc• '"""""'"''-"'- t! ,,,,,..., •• ,.
JOINTS
. ri-·---~-M Du 0 LJ ~·,p,,,(lJri,,""Jf•l).,.,..1;,olcJI~ SLEEVE fABRICATION OPTIONS
DETAILS SEC. B·B ;:,";x}:,';;~~::."l'»1ar7 ... -t.r•hong#I TUB~ ,. 5LttVl -.ruetRS
&x<l'J;. I •>ib
If"""'*'-""'"" .s&.rfb-41 pinrl'UID ,,IJ/I ,!Ji p.JC«/ /¥6/ ,. ptdl.
lr°'r • Tlv d1~~vrc• 11#'1-wn llw w/~dr o',..,.,..,s.an or llw ~ ard,,,., "'11-» ~OUI ol' llw 'flll ~'/ hOf •Mfttf q;• °"'>g '1lfwl" (IWIJI
~' ,,..,,.~, • .).,...,.# -;,.::;::;:.:;
;"~.....,;: •""'1tt1.CI: -'JO ,NJ~4·--
bl
-.J { 1-.11j's'1/hd,..
{ . ...:;:.._=..,,.-=.::>..&
ELEV. OF POST @ ~·-l~i:-':tzfj.,, :j A.dr >i l.n. _,,.,.:rl r~ -ii Jlto-t. o ••;;·"'' -t..: , 'd • ~. ¢-/ 4 & ·~
~JO ;,J./ ;)#'""' ""' .ncW""!J ~ ?i . .· ~ ~ I f ~ ,.,,,,,. • .,,,, ""'Y!J,&.J#:,/ • 1.J - -
.Qi Ui_ ·'-· -10( • ~ -~ ~ r
~ i ~-D .. \ < _t· ~ ~· t · ;. ,. 51, ''"'""''''°'"'""'""'~·"~E- A-A
"doll ""' ... ......i.,. in - "' """,., -i '•" t\f/ N '1HttJ J.J ~,. fl/ 3P«o/ ~OU 0.no1,.,i-.n,,.,.,; ll>o ~~.
~ l ' ) - "i-:, •- ~~1~} •nlh,,.,cko..,rlo!J• ~'Min. {Srf/>hl.,..- .. > BOLT ANCHORAGE PLATES
t ' ( - • -.1 ,.~ ,~ >. ·• -· ~ '" E" ~.ludonol,..,,,,,,_.....,.~ ~1· ~ · :: :t... ... • ' "~ ... ~ . . ~I. ~.::'.!~~~ fl . ~ .s " EiJ ~ ·- .a ::; of, ' . 'i . .~ · • 1 . J _ _J • :::.' / I\ 13- r1r-o.4Cft) ~ ··~··, ._1. . .1 . -;.., . . -~ . . . • '"'"""'"'" -.. . ' L.. . ---. ··-1 .. l_ _ _\::,' · -·.. .,.•·.m•·•- ;. •: . .' 1>·1.., • • <. I r.f•.,.,,.. ,., .''"- ~f, I : ~ ,.~~~ - ,~ t: ~J't..J r~ 1 • •• f~··••llus \ •4c;r 1.T- ~1.,.,1r,,.,;,,w ~- 1..,; ~U»lf• for""-U"IMi•or_..
.,"20-- - '- - fOR SLAB UNITS OVER BASIC CONDITION FOR ABUT. WiNGWALl.S 10' THICK AT EDGE
FOA CG·O 42 8 ~8 PAN FOii"' UNITS
A 500 Gr. A or A SDI
.J/J'
~·,t
zso·
Z511'
Ll *'~ [>o.;, Hol.----RAIL CAP
z j,)/131f1.n9h>/ ... iJJ.mol fnnnf
"L-.~tl'["----'J~
p 0 s T M 0 u N T N G D E T A
FOR l'REST. aox a .. s
L S
FIGURE B.5 TEXAS TYPE TlOl RAILING, SLJ
--- ·- .......J RAIL ~<EMBER
AAtrml>#r """Y bl ,,11wr .A~-"°"" ff!c .. -w.u - l..'5• .,- :S~I •lo.. llw::Jr,r.,s • 1040 .. C'1c4.J,..,. C'./ p·c.,.A.-11,. _,.,.,
__ _ _tfJf.: •.. ~ ~~"s'~~ ~;-L)•_f:-j .. J:_ ;,;,,.;!.T-:\~-1· 4f !.p ~ia5--i.~.»· , J:' j ~- / 1.:d 5,:·.':.( .. !_ ... '
~,· .. ,4,·.:;A;.·;H~ . -----; "' t:.g !.><Y• ~-...-=' i' '--<.. : {
"'""~ ..... __,,..,;......l.2..... ::-2'.~. - =--.1~1ffws ~- .. '- l ~ .A i;. ~~~ • C:.:-
-.;.•11&K -../-( 1~" ~ ':- ; . ~ ,.,. . .... ... , l"fj,·, i~· ~) V· o· -" - ~ : , - - ., w .S,,, '"'n P...l ' L ~P't., : .:_[ f'.J57 c..:·, ~.
P,..pr ....... "6"-! .. 1~>~ "" 0..0.' $1.Jro...vr ..!.. ':"': ... ,.. N.• %".AJ ul~ .s;,u:z Ji7°J
OEEP BEAM RA IL LET..:.l!....5 GCN[R&l .. NOrcs o.~ ec.,or .... c loAA~HTO IS71 =-••.O....'! :r.: ~"T·" .,.,oy ..
Ss:•'-''''.''°"' Oa.·•-nJl'llOll~-11\1,,~,, "":: l•D<I C.'I<. . ... :: .,;,l'lh .1 .... ~r I .. .;1W'W'r,..,
ol awrt !'oti!1 fr•t'"PI iii 1;).,l"""!"lt .. , ..... . ~O•·•: r , ,•.15 ~
~.:r<:"'lll .. 711 .. Hl;t#'',': 'I C ; • • •• ll:I ~-·· t:" • ~ J''': 1•op• "t)p er r.,.·t '•~·•-•• · 11~ •., ~ •'•" ,,, ..-.: "'•"
••• 00' '9 , "V!l-!ll>•" · Ot'~, .,,;:•"..:.11.7•: ...-. • .. ·.,, ;t, .... ( . .... ·. : .. po911,., ,,. •••• ,.._ .. ,; ...... ~.
A.C1 1 e1:,7,..._ht,l>.J't1l.Jr~: 11T""'" ,,II'•~· ~ · .. ;·,; .:;ot,,. , , ~,
'°"'""'11 , •~l'\,.1'11 ~ t~H>m"ICt•I t."Ch L4 i?"'.:;"•l•" '.- 'co.•, :r ,_.._
A.I ••••"•IC"'~""' ~lfl to.~"' ' "' , ••.;"''•" r . •11 t.r..1: t "''"""...,'"'~ri.\.:o.o -~T,,, .c. ! . ~HC1h"7 !.?1110.1 : !0~. wl"' l;(lt. •llde~llu'll••I" ~ ..,,, ~~: ~-.•~~ • •• ""'•"· · · ··:~~~ r : •1
-.Ot h 61(..l"r.on doO ••ttl oil•:! l"',•~l"I ,~,,._ il'!: ,,:;.r PI',.:.• ;,• : •
&ft1 1!\Dll c;.onl""" .. A )2~ rt-1Uofl '"I '' ' 11"'1 T·:• .,. •':.t,;J ! : · :. ;
Dfllf iOI..._,...,. b."llt• ~ "111 •hol• t.Col '-'-•' 'lJi. Q'- ,'~I I· I , .1 •l
Srt>p Gl"o• ... ll 1e bt .... n ... ,, • .J k r. a ... ;~ c ... 1 ... ,. ::.- L:.:,~ -c• ... 1...
r•., il ld gr.ff fiw 19,,. 0" t.(ol•l~";;: , ..r••L ·~ •:: :. .. f •I ,. '(O ~• •I • ·~ .~ ... \f\Gllt4 h:lf"-'!•tr. o .. •"O<>••: .,, ... ~ :., .. ; : . · .• _ It !.J ! . • .1 .. , ; To1!1•1-Ao4 ftW'• '°"' ':" •;l., ... , .. •1:. •• • •".·. J,., .. ,;r... "'ecl •Ofl GUI•' f' "~•OlllQ ~"'' l4N0r •, .... ~ . "'.:i'.-,: • •' ~ ! ! ':.:: ~ ';
GM OJ'IC. .... '811 Miii"~ 111.c.tl IM '"""''I .. ~ 10 "" "'••·<1•nl C..,;-• 1; ........ Streol ••~ -., llJil wllftl•~ c1 u•' 17'"'p11nl• IJ'9'f•INd u .. ,, .,..or ..... ;~111
!f,.~~ STUE OEfAP.TIU~l vf HIGHlf~r; ~~c AND PUBLIC TUllSPuHAllC.~
TRAFFIC
TYPE
(STEEL)
RAIL
TIOI
.~ .. > ,_,.
------------·· ---- - -
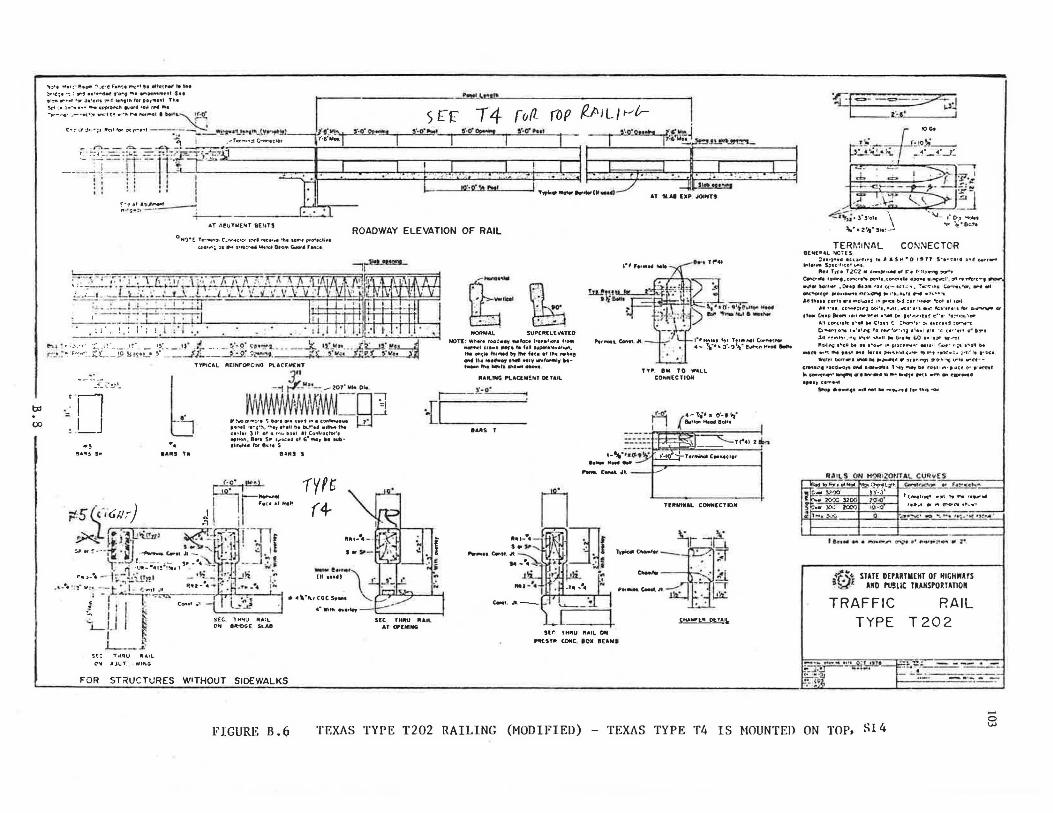
b::l
O'.)
:.~•;:·i,~ .:;::: ,::~·.:/;:~: :•;' t• Gftc~ht .. I~• S"4:•'J•"•••"-.;:••:-..~11"''',.'or";~-11t$1t -,,.-.-oa• :--~c·~ =-=~:c: .~•d .... '.:"~,Th• ~~: ,,, ~··'";• "'='•' 'O" :.::.""'°.· .• -_ ... _.L .. ~~ L
- r.-.,_ :.:: --:- - •::r.&1 I ' c:•· · ..=-_:-"' - ., i . _..-. .. .J.YY'1"!!1-l S r(" T ·- -~ - ·-·' -"" - -~ •''""''" ,,,_ c . 4 ---~-1-=~rr-=--1 :.f::rTTj~.z~!i,1- . """ •. ..-.;.J""""" ' ,~... ·~ (oil fllP f'_PIL/ ,...,., ' . . '-" ' .... ,_ ~
: : i ! I I I ' ., -· .. · • , - I '
' I I :::::=.zJ . . I ,., ... ,,._ I ' -~-- I .,,.,-~ : - ,. -"" I
_,____ " ,,, '" ;, .. . •1· A! Al!liTWtNT acrns . ~ ::::~· j'f::::::~::::::jti~~~;.;.;.~~~~
ROADWAY ELEVATION OF RAIL 0
W)•t T,--. .. ~ C ..... tc•c• •~' ·«••,.. tflt M"'• .,. .. 1di11
U'O'""i n 11'-t ~·-..: ,_.. U.kll BM"" G..r• F.-.:1
~-l '"• ·-··.·•' :.;,__.~- ·- · I~ _ ! -- - ·'~ •' ;r- ___ _,..j; · •• ~' ' ':1"-L . ... __ _J'._ l .c. _~2• •• • . __ 1_ !!3! ·- • . • ~· • :ol •• o· i.. •' .1.1>· " ~ ,.-_,_:-: ·r·~"·.~_;:_L_ __ .!._O _ ~~~·L' ~· __ _ _/J;_ ____ i:,:.:_g;..J.~t . '(.f fw.:. 1 t'I P'! ,·v... ·
1 TPIC:AL ft[INrOAc:~o Pl.ACf.MCJlllT
-~~ ._-:,., ,_
b 3"
- 1 ;:.;.....!'!•_ -201· .... 01•
._~n -, J_J
WW#/WVwWMJ=n3 fl~ Ol ""~ ' e "; ........ "'"'" "'. C')lll-... t1:j I"""' .. -,·~. ""91 •"•II i.e ~t!el •'*~ tNo u "''' 3 It •' , "'" D?•I •I i:o .. t1oct&r"1 .. .. ...,,, . a .... 5,. ,,.,,.cs •' , .... , ~· 141b-''''"''-' r'lf 8cr1 S .,
!!IA!ltS S• IAIU T• 9.iR9 1
;t51·,-,·c:;1,1,~) !~l.l!!::.1..-~ .. ! I I he• of Rel!
. -:-...J I . ~ .?'"'<,; ~ • • "! l.!'i.!!n "' j .. ~!-- -~~ii ........ ' ~- ;;-.-r. [""lli ~---~L--.·-~uJl- ,'-~,:1~ . ' :!'! l ...... --f ·-'1 ::'·· •• ,. .. ,.,, •• -.• \.,. )J -1-..l f
... . •. -:,· ., =-- - ~."'l'.!.\.l'r!• -. •Si . • ,.~· ; - ~- ' .:,.• : - t .... ~ 1 • '- """'' Jt R•2-'4 - ,•: .JJi . ·~
I --i·· ~~·. •
1yPr (4-
Q;;_._. .... ~-·.
v..rbl .. : • J 80-
. .. ~ ~ ... NOAMIA.L SUPCREL[YATED
NOT[: Wl'l•t• tooe••• Nract lr11111.,1"°"' hOlll llCIF'N'I CfO•fl flllle'• .. fyll lllolP9ftlltvlllhQtt,
"'9 -~I• few._, ti, IM f•ce Of 1.-e ,.,111119 ... U11 .. Od•Of tifWll •••Y IWHfDffftlf ··,.._,. fti• ••uf11 ••- lllHw•
RAllftllQ f'LAClMl!NT DUA.IL
r---->.:: o·
{C BAiii!& f
...
1•1H~••• for T.,•"'91 O>r-"•t•or 4- !'1·•10·-,•"l·l!u,..,,.ttn• Bon•
TYfll. llMI TO •ALL CONN[CTIOH
h ......... ..,,
P'llf•C.-.l.U.--
f4 I • {
•- ""' 11 o·-• \Iii. &11a11~M8ott1
Tr"41 rt!-,_
T!RlllNAL CONNECTION
.~ ·I I · ~--·, . ...... ,;:. ~ I t Ci c~·· ,, .. ..:..1-11 ~ - .':)
• ~ S£ I i;: o•c .~"'" •••L SEC rHIW "A.IL tH.&Mf'"t:lll DIE. TAIL
j__ ~ •DG£ SLAO _ ... Sf£:<: TMqU ,_A rL
C"ll A)l.T. Wl .. 0
FOR ST~UCTURES WITHOUT SIDEWALKS
AT OP!:MNO SU: TH"U .. AIL ON
~tTR COltC. 10• BEA.Ml
:r.7i=.:==--::;;z ~ ..;i_:_ 1c 1• I
TER~.111\:AL CONNECTOR 0[.tri£•ilL 'IC':'E5
!n•?"•• IU:t•t'•~1 .. J. s M •o ,, TT 5"••-:o •lll g .. 1 ~,, ... .,. • ., ... S~tc •·c 1• """'
•c• T,r. T 2Cl ti C-ot•H•ll ~ t.'• ,.~ ., ....... ~' C--.:•,1111 la•l"'I .C:O'l'.11°' ..-i•h. Co->C11l1 O>o"• • ·~I'. !If! •t 'nflo•c:-1 ~.
H• ~.,, ... , 0.•t lh-'• •011 cc..,.1c1,: ... ~.:-:-1"c: t:.-:"'l ... •r::.-. _... ..,, ~'°9"' IWO•••-• r.oc:uo....., Dc i'' ·"'"" rod •:?•"'·~ Art l~HI rorlt .,., 11c...,,•:I 1,. ,..oc:e bod :tr ,.,_ "'col ol 1111"1
•M•'lt Cc-w>t;l11113 bO;'l,1'!111 , -t't'I • .., fc:1'1"• ' I ,., ._.....or
••••• 0.1p ko"' •••I---..- 1'\0ll t.. to•,.,,., .. ~ c:"1• '•:"'•X"lo-t
&:1 CCl"<rafc ......... Cl1:111 c ="°"'"·'•·:..I ••rt' .. i : l)ll'"lt ' I
t•...,11"\0.,I 11'•'•"'1 lo t1o•'Cl"':•"iJ l 11<1I Clftl 'C c1•'1r1 ~ b,..I
.lU l!•fll-,o. "II 1•11• "'1111 bt 6•11,_ (.Q u " l;tl lr•P'CI
.. , •• ,.,. 1"'1111 M D11 1°'0•• •• 01.,et_,.. ••11-I 'A>f· ";t 1''JIT b•
-.e. ••''· ,... t••• .... fecu >t•~••od·<"'" "'> ,.,, • .,.x .. :, ;o'fl' :, 1•:::c1 9'alfl blln•l ll>GllDl .. ,,... •• C! .. 'J(l""V" ,.O' .. ~V'1CI ... tl •
C,..H ... .,41 ••ci•-·· ..... •·•-al•• 1-..,....,. bf (C:\I "' " fOCf ¢'" · · 9C"C'1f
.. CO'I~' ~ •f ..,,. •• _, -- ~11 Ol(I •f'" .. C:IP' .... 11
., •• , u ....... $liiof •e•-i.41 ... ...,, IM,.Q<io,.IClh•Ohl ......
RAILS ON H~tZOlffAL CUl!llfS l\Ob: td '-""'",a-,,. ""' r 1:--c:c "" ....
t(Lln1lruc' ... ,u ,,,..,...,. ... r:ii:t- .. 1 ...... C!"O"A•' • -
1sr~· ..,........., I "' f:.:.·~· '° ... ··• •..-:: . ·i.< ., ~ ..... •
t e,.,_ ..... f"'ljft .... "' ~· •• ,. ..... ~ .... "" : •
a1..'~ STATE DEmTllEffT OF "IGHllHS ~ ANO 1'119LIC TlAllSPORTATION
TRAFFIC RAIL TYPE T 202
~:J~i ... '!.'.U.,::.f i•)•
~~~~ ~-·~ ~·~~~~~---=; ~ ==
......
FIGURE B.6 TEXAS TYPE T202 RAILING (MODIFIED) - TEXAS TYPE T4 IS MOUNTED ON TOP, Sl4 0 w
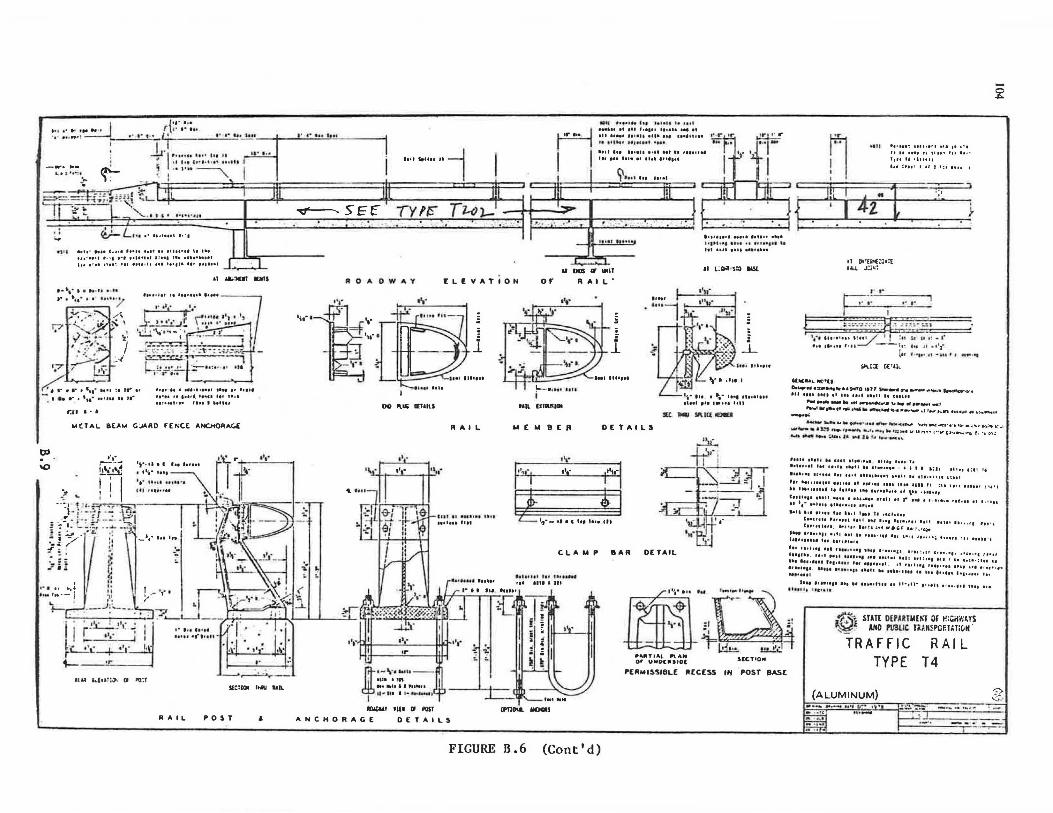
, ..... . '\" .... .
~T--~·n ·······-·· I -!i·1, .......... ... ti .. . • •• .
.t •f l • I 0•4 • t ••, 1utt• f I , .. .... ~ I
~·· .... ....... , I • ···- ·i :..=:.:......J ;-
'"'''"""l . I
I .. , ....... ~ 5f;f" TYftr'
. '• ·' . .... V-L ............ , ... . ., ... •• ,, ..... , ............ t ... u ..... , ••••
•••.••• , •·'• ........... l l••• , ........... , ........ ~ .. ~ '" .......... ''''"It• ........ ---------
A I I
•ti tl•UH IU Ut•1t t• iu t ..... .......... ,,, ,, ........... 111 ltHt 111111 •U• Ill 11••11u1
t• 111'4t lflHUI 'HI .............................. I•• ••• Ill• II 1111 11"111
Ci' ...... .
.., .................... . t• 1•1 01 lhl •• 1111•fU 1t "' .............. .. It L:Qtl ·STO liSl
•II I If I 01~ Ill I •I" I tr• j I I• I . ....... " ..... '" .... '•" .. '''"'i ht ! ~II~ I 11 I I: I It lo I
{ I I 42. i j. .---. -~ •- . .
lt lllfEN:JaTE uu. .t:ilri':
...... ~
,, .aam«.11 IDltS ROADWAY £LEYATION or I.I DUS t6 '-"it
A A IL'
t:(I I • &
..... , ................ . I' ti,· 1'·• J I, r-f+HU .... I .,.
·~!.,\u1•1" 11•
·~;~;-~;~ . ;:~~:~<=~d .... -, .. ·r-1'1~--, h!!-!.!:.!.'...l:=-""' " "'
1 r •·• I ................. ······ "'" ..... "''"'·'···· ,,, .... ................... .,
M£TAL BEA"" G:JARD FENCE ANCHORAGE
"' \0
' , .. ... ~.· .... , .. --1 .. -!---c: I •• . I .....
ill~ L.hlljl)I ('# ~f -----6~ ·
SlCUOlll rhlU blL
A A IL POST ..
··i···l!~~~·[·I ] .. ~-·~ ~
00 fll"9 Clf&IU
-•llUllll'llST
DETAILS A"'CHOAAG[
1
RAIL
l . J_
HIL (JJMJOt
sa: - 111.10: ,._.
........ Sli\.1~ rt:ru ..
ll.fl[••L fllC'"'[I
o..,.,, •:ir .. ..., ..... '"',.o 1t11 s•1111r• - -- ... .,,.. ~··•• Ul Hll 110 11 Ill llol lhll II CHUI
.... .............. -..-.-.. b ... ., ....... _,
...... I .......... ""-' .............. •- .. 1 !- ,.,,.,. Mc1~1 .... :-. .... ..-.o ....,.._. MEMBCll DETAILS ~..,......,,.,. .. ...._.._, .. .,,,,_..._"*'"" """'•--•·1·11a·•· .: ' ... •••••~-i
..., . ...,_ • &):' o.,.,,........., .... ,, _,,. •u:i.1 u u .a•• ~··•• .,.~ ......... :>" ._ t. ·, o"I.: ~ ........... :.&1111& ..... ltfo1t9'....,.n
.... r·;··1 ···· (·.-1
IJ ii 'L:....,., .. _ U •CUI Htt Cll
~
-tr' ; I
~~ ·~~·· .,. .. ESJ
llllt 1•1t1 •• lllf 111• •111 11111 ,.,, I•
•• 11
,,,1 '" "'" '''" •• ,., ... ,. • • 1 • 1:11 111., 1a1 ••
111&1111 U•lll Ill 1111 lllU .. 111 11111 II •11111•11 llUI
r11 ••1111101 llUH et 111111 IHI llll IHI ., !II 11 •I 11e11• : ~I' I ............ , ............ ,. ....... \'' / ..... , C1111111 1Hll 11" I •U••11 1'111 11 t" Ill I l•••e11 fUoH 11 f , •111 ...................... , .. tall ••• ''"',., .... '"' ,. ••1h111
C•••flllP1•uu11111•••,.1•11•1•1•1111 1111111 ... ,, 111·1
c ............... ., ···~ ·, .. :!I .... ,, .... ~.·~ Jiii .1•111111 1111 •II II 1111• IU ho 1•· I 11•1 ••,; IUOI ~II •t1)I ·1 ............. ,,,, .. .,,
CLAMP BAR DETAIL ,,, lhl111 ••• ••••• •••• ,,,, ...... , • . 111( :,p .... . ..... , • .,, ,,.,, 111101 . 11•11111tt1111111e t11111 UI : Ul:111'"I11 ht1•:111 11
111 l.t1 1•tll l•l•IU I 11111111ul , 11111111& 11uor11 U tt Ule•ut11• .................... 111 llHIJll
IPTl--S
.... ,. ••. ••••• ••••1111 .............................. ........ . ........
m,,. .... ~:-·~··-,_ .. .. •• •11····· ••.•• "~ ........ 11•,11· .............. "'' ... ..... .. o, ....
:I ;; · .. . 1=~ !!!..?!.:
:~R~~~J-crt~l"o~ SC<T•O-.
PCAWIS51BLE RECESS Ill P'OST llASE
.1.XE SfATE OEPARTME~1 ()f H:c;rnos ~ • AftO MllC To>.H~POWT:C.N .
TRAFFIC RAIL TYPE T4
(ALUMINUM) ... -.... - w•r v• 1"f•I .. _ 2.
FIGURE B.6 (Cont'd)
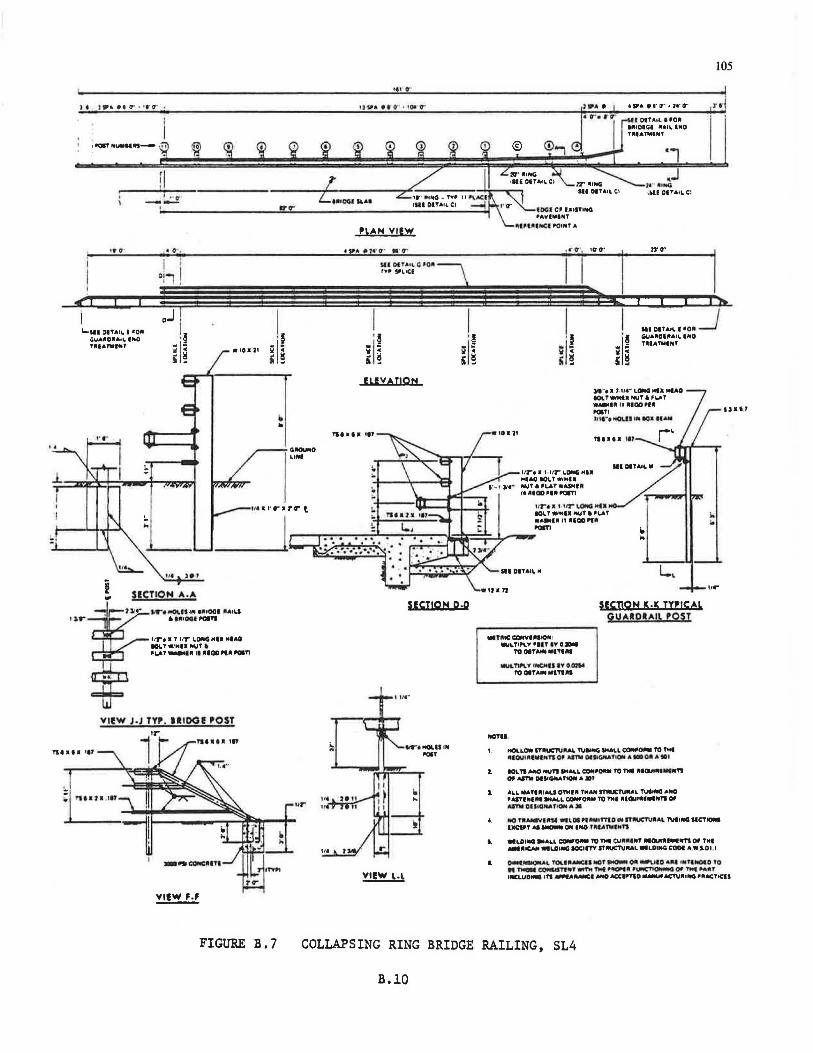
l.
1 t l •• • t rr • , .. O'""
... ,,.
Liii atTA,_ I 100 ~wAlllOlllAlt. lfllO ,,. ... ,.. ... ,
• a- .
ii o-' I
· ~ ~1 · • !j • •
• 10& 2'
., SlCTION A.A
¥...-.~HIN l•IOGI aAIU
I J.r 6 IA•OOI '°9TI
!IT• a 7 llT' LOllG Mtl MIAO IOLTWtMIJI fltUT •
OL.AT -·· 11 OIQD ot•-"'
2 w
VlfW f.f
FIGURE B.7
.,.
,., ti '
t ) va • ,. O' ' . ' Oi' O""'
l'\,\N Vll!W
•$1'• •i.· ct· .. tr
I '!
;; 1 ~ • !j • • Hl!VAflON
Tll •I K tl7
SCCJ!ON Q.D
Vll!W \.L
105
:rr
I DG• C' U.llTING •A1tl .. INT
l\IPUINCI POINT A
. .. O'., 10'0"
·1 • ..J
;ir 'l tNQ 1HI OITAU. Cl
f I I I l't
-1· ~ Ill OITAIL 1000 _} GUA,.01,.Alt. INO T"IATlllNf
II c ' ~ >'I '• a, Hr L...0 NII MIAO IO\T*Mtl NUT• f'-Af W,_.IAUlllQOff• OOITI 711rt MOUi H• IO& lftUI
Tll ••• 111
i. ..
SCCTION K.K TYPICAL OUAROIAIL ,OST
OllTOIC COONlllllON' -.o.,TIPLY 'llT 1'10 ...
TQOITAIJllMl"M
WLT\l\."I rNCMU 1¥'0.0llil TO OITA.IN MITlltl
NOTO
'· MOL.LOW STlh.JC'nJ•- 1\letf!IG '"""'"COW~ TO n+t •IOUtllWIJll'Q 0" Al1"ltt Orfl•GNATlOfl A •O" A to1
2. 10L Tl ~ NUft IM-L QOflllllOMI TO TMI "IOllRl ... 11'1 °' AITll OISIGIU TMM A JDJ
ALL MAflllllALS 0"'4111 TMAN ITM.ICTU"AL TUllllG AND U.STINIM •M.L CQlltif'OtlM TO ntl "IG.lllllllllNTI Ofl ....,..at~ r- .. 11
.. "'
,, ...
•· ..c> fu.MVI i1tM wt.lOI "11 MU"1.0 IN ITJIUCT\lfllAL TUllNG SICTIO'll IJIC1PT Al.._.,Qllll lfllO f RUTlllllNB
I. •LDllllG .... t.L c::owo- TO TMll cu•UNT "11CUI• ... ..,.. Of '"' ... llllCM WIL.O.c; IOCll"TY STMIC'TUUL WllDING COOi AW S.01 I
tJ&t J
I . o-IMIOIUl 'tOl.t,_...c.ll_,T ...,_ ~ tW\.1IDA .. UIUll(alO to ".,,,..._cocasn .. ,...,,,.""' fl'llOll"t• ' '-"'C"h°""'° or '"' ,.,., lllC\.UD,_ 1n ....,.Aiu.iCI MO ACCll'TIO llMIUfAC'f\l"lllG PllUCTtCll
COLLAPSING RING BRIDGE RAILING, SL4
B.10
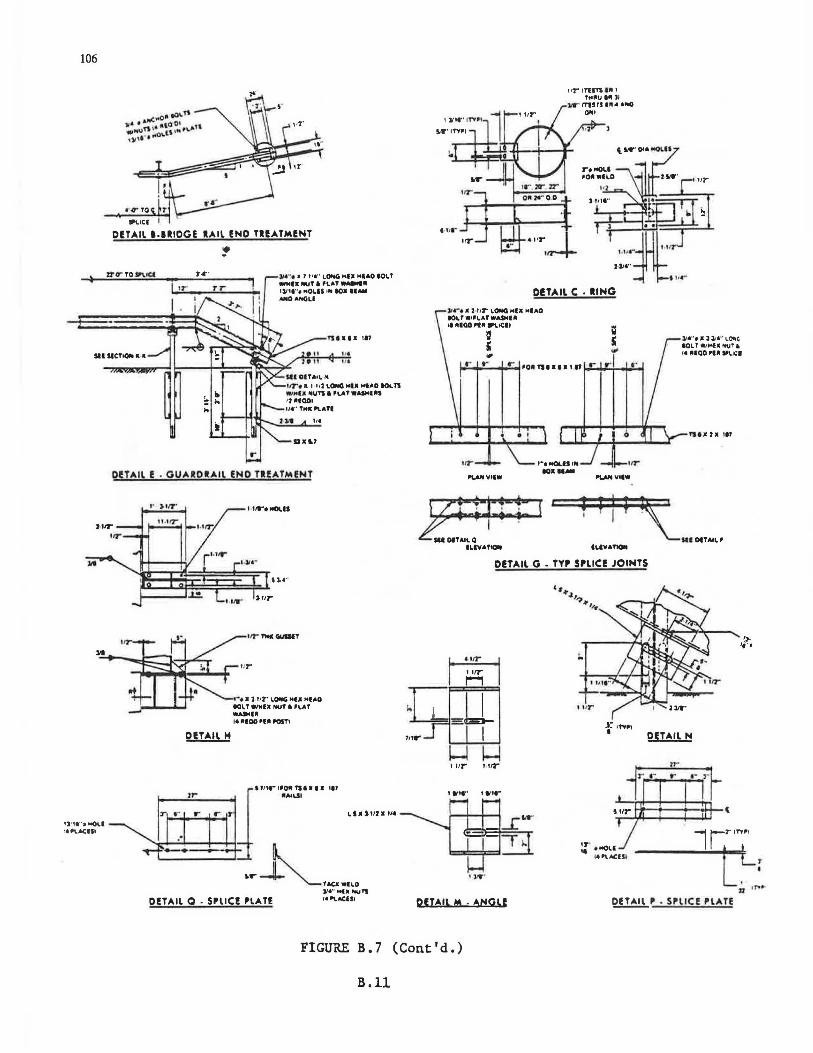
106
.._,Cl I
DETAIL 1-UtDGE RAIL ENO TUATMENT
• r..-·
I T
ll'.t" • 1 1 114" LONG Jlilt:I MIAO IOL 1' ....... ,.,,,.,\. .. , ...... 1l/1t" • "°"'' '"'°JI .. ,... .,.OMIGLI
f'SI JC I J: 111
SH SICTIOOo c • , ..
11·1t"a-OL.I '4 0\.M:ISI
,,.
r
DUAIL I! • GUAIDl.AIL END Ul!ATMl!NT
I ' J.'17''
OITAIL H
........ -.11
'IT l'Mtl GUlllT
"'"•a 2 112'• 1..0NG Ml• Mt .. O IOl. T •IMl.1 MUT I ,LAT ...... 14 •IOD 'II POST!
•Att..SI
114
LSXS.t12• t/4 ju11•-,.C111n•••• •••
':._-=--==~-I-~.~-" Ol!TAll Q . SPllC! PlAU
DITAIL C • RING
it•""• a 2 llT LONG Ml.I MIAO IO'-TWIJLATWASHll 11 •IQD •O "1.oCll ii
0 ' ~ •- ,':' r ,0 ,. n • • 1 • 117 t--r_,.,r_,l,_op;;r...,.
11···· • l l.'4 . lO'IC. IOL T WIWI• NU!• t• llQO ,l,.1'\.1C8
e I ruau 111
l/T 1""'tMOLlltM l/T IQKH•
"-ANVflW ~v•I•
r:n::= I J I J
~"'"'~' I Sil OITAIL Q
I .
ILl'l&T- ILIVATIOll
DETAIL G • TY, 5'LIC! JOINTS
-i: ..... ,, DITAILN
,~,,.. ''"r
•11t"
DUAIL M . ANGLE e!llil' . SPllC! l"lATE
FIGURE B.7 (Cont'd.)
B.11
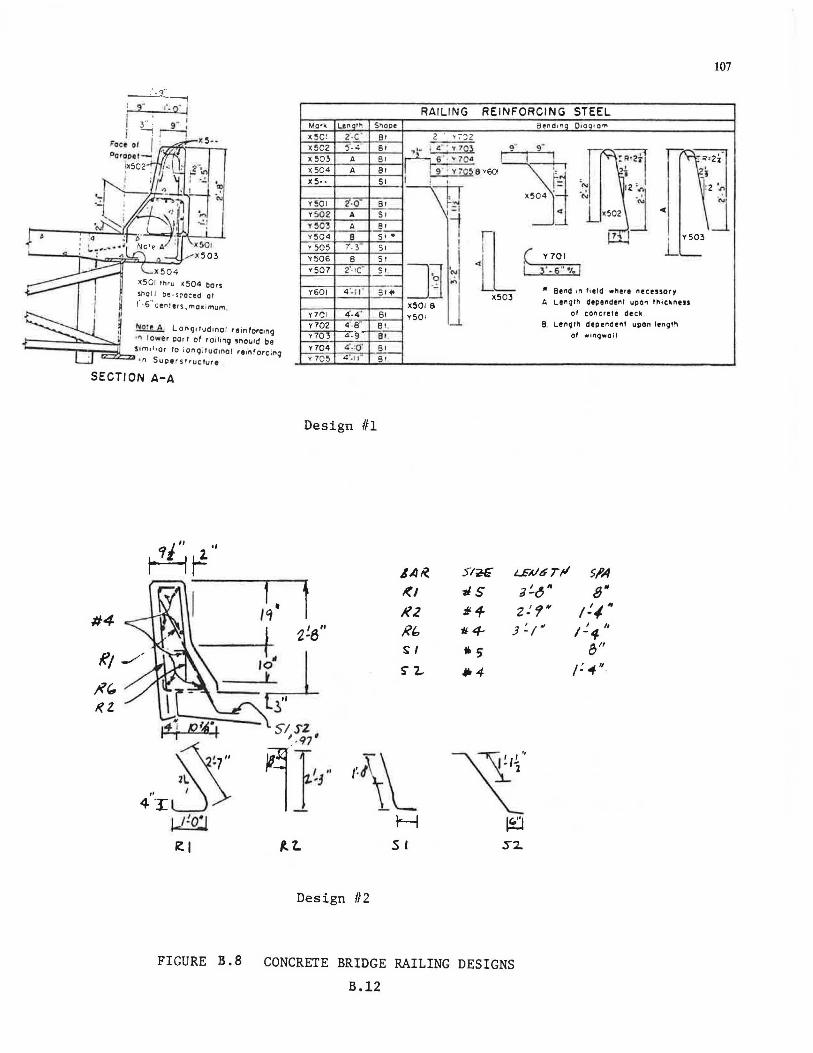
107
RAILING REINFORCING STEEL Mo·~ Lenath S>looe 8end 1 ~a OioQ10"'
X5C ! Z·c" St 2 ~ 7'J2 X502 5-.:. I ~ i .:· ; V7Q: I <]" I g•
St n .---0 If X503 A 6 1
•·ro~ : ~;· ~· 1 X504 A St
X5·· SI I I ' -2 ·,... 1\ --0- X504 ,-
"t 12 ·,,..
"i_ "" j "' Y501 2"· 0 8• """ c ,=1 ... Y502 A Sr i Y503 A St -·- I
{Lr ~
No!e A . Long1t•Jdinol reinforcing ' "' r o~er pert of roiling !ih01 • .11d be
i-..---r-l""'=!:dLS•m11 1ar to i ong i fudinol re1n~orcin; •n Superstrucfure
SECTION A-A
Y504 y 505 Y506 V507
Y601
Y701 Y702 Y703
Y704 y 70 5
e r. 3·
8 2'-1c"
4 '. 11'
4 . 4" 4 .9' 4.9 .;'.:(f 4 '-11°"
Design Ill
r "' ·; ~ .,
I f l I 'I. #4
t I " 2-6
RJ 'W ~ J?(, t< 2. :,''
SI SZ ' . 97'
s•• St
S!
s~
]~ =·· X501 S
St Y501 Bf. Bt.
Bt f! I
JAK.
~I
K2 Rb S I
S" l..
, f'{' ";-\\__ 1-,110;,i H rz. I ~t. .S I
Design 112
l =3
j Y701
3'. §"% I
• Bend '" field •here necessor,-x503 t.. Lenqth depe"dent upof'1 ttiicknets
or concrete deck B Len9th deP<"dent upon lengt~
of ,.,.nQ•O:I
Sl7Jfi U:Altf Tli 5/'A
#S ;;!..CJ" a" II- 'f 2:1" 'I " I-ji. 4- 3 ~/,, I I ,,
- 'I-tlo 5 fJ II
•4 I~.,"
~ ~
S2.
FIGURE B.8 CONCRETE BRIDGE RAILING DESIGNS
B.12
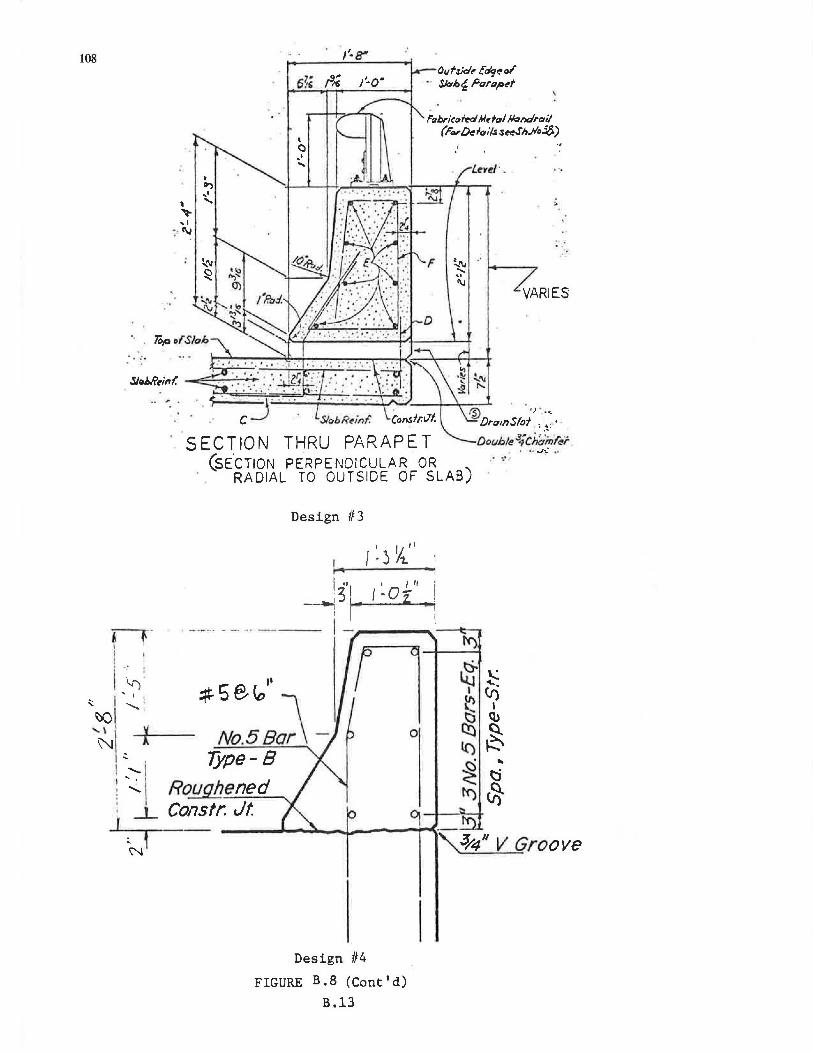
108
rr I 1 ··~l '.
' I I .:.: I ......._ ' "OI .
~\ ~ 1 ,_
1'-8"
,, :· 1\1
011f:kle Ug~~ ·· Sla.h~ Pora~t
rabrit:ClrN /t/~fol lloridrai/ (ForOe;oils $tt.Sh.Ho2.)
VARIES
® . •)· .... DramS/ot , "•
SECTION THRU PARAPET Oouble 3khe~°Mr (SECTION PERPENDICULAR OR ) · · . .. ..,,,,_ ..
. . RADIAL TO OUTSIDE OF SLAB
Design #3
I I/ II J-~/'1.
! ''1 I .!..'' __ .-i31- I ·Oz .,.
t I !
~5@,(~/
No.5Ba~ -Type-8
1- 1_~
'l 0
: '...:. Rou hened : _t_ Constr. Jt. ~--
N
Design 114
FIGURE B. 8 (Cont'd)
B.13
.'-.o/4" V Groove

'l- uc·~1 ••; ' I
or1~:~g~oo~'ei!:l .C.&G"o 1 -J 1111V:-~tP1r.9 p~
~~;::~~~~=!·:::~·:;-~·~;,}~~; I ••II\ '"• c~;>r~1a! 01 '"·• Ll'l;1:ot1er S1.1C't D:r$ $."l .J•I b• f.irr.,11'1•111 ConlrGCIGr'a llPUU.
Design 115
Design 116
FIGURE B. 8 (Cont'd)
B.14
109
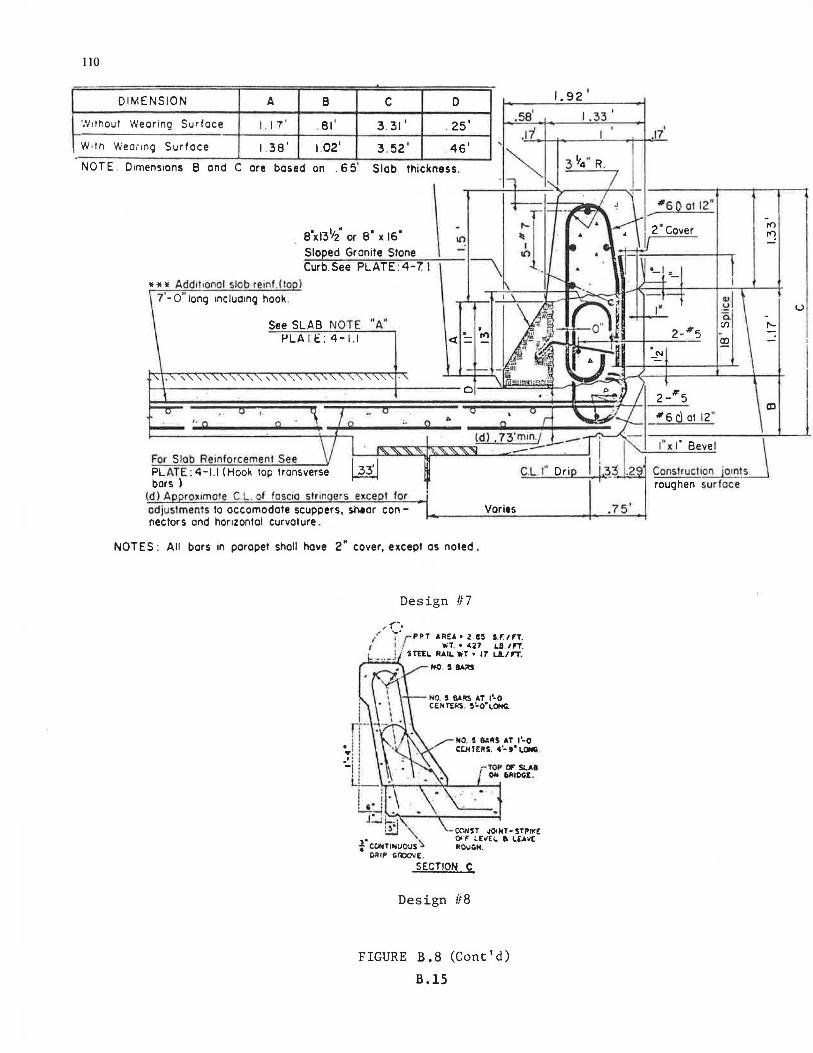
110
DIMENSION A B c D
I '.'/1 rnout Wearing Surf oce_-t-_1 _. 1_1_'--1 __ ._8_1 '_-+ __ 3_. 3_1 ·-+--·-2_5_' -4
lW1tn Wea;1ng Surface 1.38' 1.02' 3.52' . 46'
NOTE Dimensions B and C ore based on . 6 5' Slob thickness.
• ~ • Add1!1onal slob re inf.llo l 7'- o" lonq 1nclud1ng hook .
a'xt3Yz or a' x 1s' Sloped Granite Stone Curb.See PLATE : 4-71
See SLAB NOTE "A" 1-'LAI C:: 4-1.1
0
For Stab Reinforcement See
\
I. 92 I
.ss' 1,33 I
.rt
PLATE : 4-1.1 (Hook top transverse bars )
C.L I'' Drip
(d) A rox1mote C.L. of fascia Sirin ers ex.ce I for adjustments to occomodote scuppers, war con -nectars and horizontal curvature .
NOTES: All bars in parapet shall have 2" cover, except as noted .
Design 1!7
Vories
,,,,,- NO. ' &:.RS AT 1'·0 CtHIERS. 4'-t'LQNG
r CONTINUO:JS ~ DalP CllXl\I[ .
SECTION C
Design If 8
-TOP aF SUI OH r.lllOGE .
FIGURE B.8 (Cont'd)
B.15
.75 '
"6 Q Cl 1211
-ro ro
m
1"x1' Bevel J Construct ion joints roughen surface
u
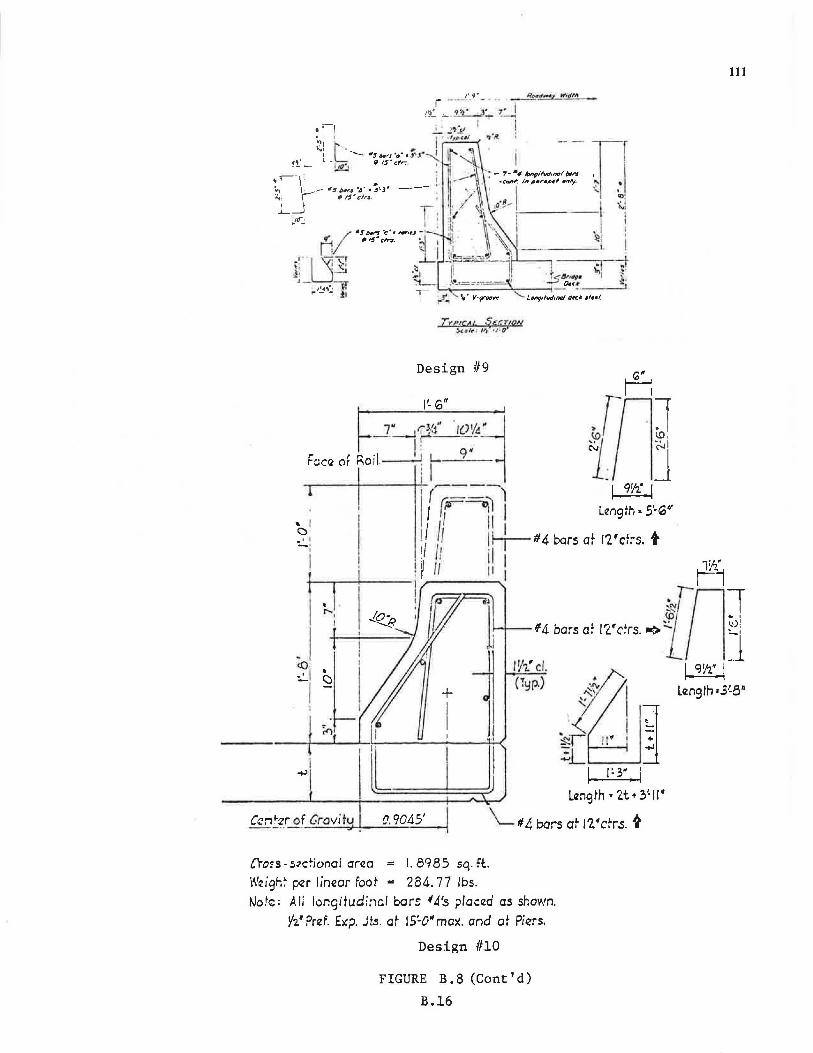
. r-- ,
I
I i
Ccr.~~r of Gravi fu
Design 119
I'- G"
0.90~
tro~S-s;>dionai area = I. 8985 sq. H.
Wic:i9h~ vzr linear foot -= 284. 77 lbs. tJoti;;: All lor.gitudincl bar$ '4'.s plac'ld as shown.
Y2' Prllf. f)(p. Jt.s. at 15~0"max. and at Pi1Zrs.
Design 1110
FIGURE B.8 (Cont'd)
B.16
111
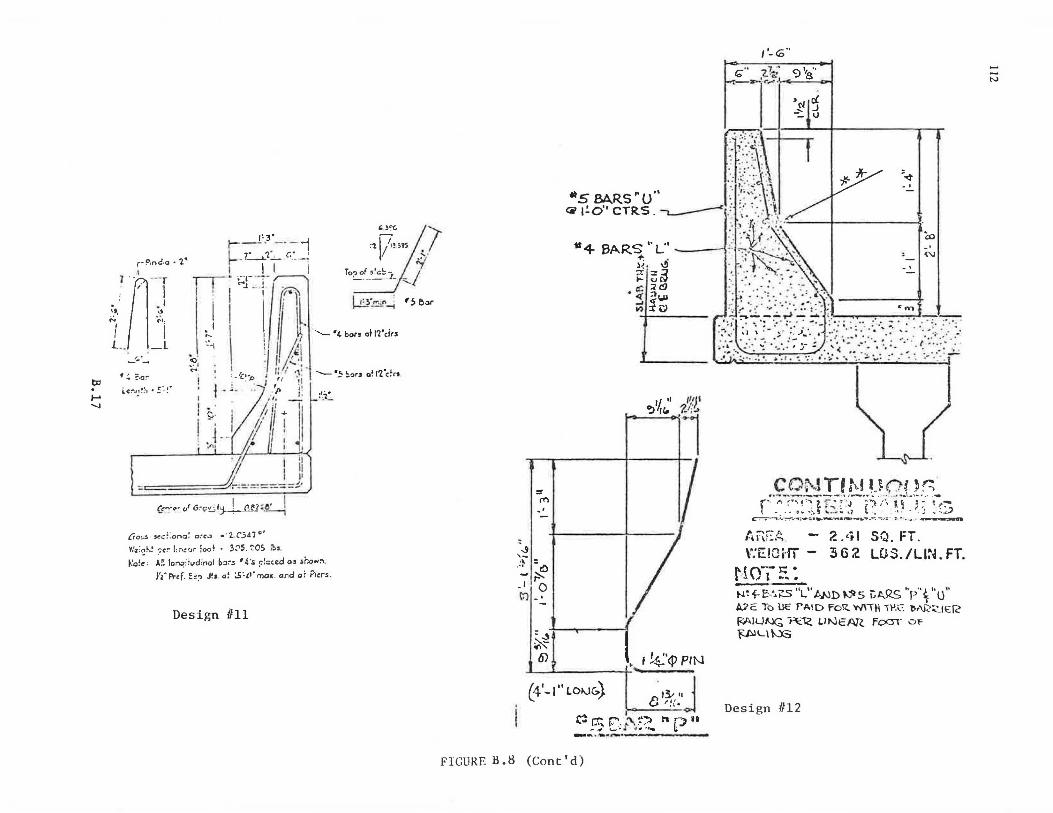
1'3. ~G I --· -·- -l I . - . I :'1 I! S9S
r- 0 .ndo. 1• C- 1~1...L. c.: _ _.; 11 .:- · 1
· ' 1 I I J ~f' ;:.;
n. - r n--• ,- 1- -:--~ •o:>o sc~- /
1 .... J ----~ -
I I ~ -· . ...... : , In"· ~· ; I I I . l ~·fa·~ '"°'
L _l ~~\I i 1 j I ~ .. ""'·"'"" • r· • • . I I 'j~l _ .. _ 5>, . · I :...·•
' , - <""" I ,. I ·: . t:Jj ... ::-.a:"" t • : .... ,,. ' • ., , 1 ......._ •c..... i rz· 1
• i.c~•,o;,.c'.•' ; l 0· _,, I,'' '•11 I --~•~a. c.rs I-' . " - . l . • - .. I' I
I 1 1· •''l•
" I ~: ,- / !/ +-JI . ! ~ -- f I, ! I · :,,, fl It : ,
J I '' d.:o·===J=1!
fr.~'~· o' Gc<;'~fj.~ :~
{io:,,.:J- Sot"c!- :ona: a!"C'~ ··2.C..341°'
't,'a;~h~ :;c:- l::"~~r foo~ • ~='5. ~OS lbs
t-:o~e; A!~ lo~:~ud ;nal b~:-.s 11 ~'s p~c,c:d O!ll sbow:i.
rl· Pref. ~:!~ J!J Q~ ~'..,,.mo& . or.do: ?icrs.
Design 1111
-f1"I
. '
..., )f : cO -r I 0
t:1 - •
~
/1-G"
.. 1.~· 9'~ .. r;; ,.....: . .,,;.~
_'1"/·:;Y: •, I 0 ~ . 0
. ;·=· ... : -..,. .': t·: :·J.·:.t * S BA.R.S "U" f1·!: -~~:V_\ ~ t!O'' CTRS. ~ .': :;'. ::.JJ
1
Co
. i/~! : '\ .. >{:; . ~ 1~ .':1·~~~~;:~~;·;~ ).:-; .... -... :·.-. :- ~--+~J . ,_· :·.·. ·
'/. ,, l''JI
Jj
~;~~-~~::--~.~: ·_ :~:~....:; ;~_:·_: ~- ::>·::<:~;-~:~::~ . -~-~ .-:: ~3\~:·-/
CON TU'-' U(){. '~ c";-r::::Tf.~:T~:-T~ :;·:··i.r: ·j·~· :~~~
~-,·-~~~~·---.,.. .. ,... .... &,.'~-.. ~~··='::. ·- . . •
f;.i-\i:.~ . - 2 .<ti SQ. FT. V.'E!Oi-fi
,.,o--:i::. • .l ,, l lh·-- •
362 LDS./Ll~~.FT.
~~"t-..t-.lDt....~s ct..RS "p"ru·· /VE To UE 1"A\D fo~ W\IH 11'.<:: ~-\l~~l~R F:AIUN(; H:.i< LINEAR, fo<n- C"JF
~LI~
{j) l,1. ''"' I I j• I ~4- 'i' PIN
~li-•·J (4'-1" LO"-.JC:.) v ,jl ...
I ""' ,.,... ,..., " .. -., n r·) II .... •··~ I·· ··t• "I,,.. l
~,,,; ._ ... '" "" .... . --- ··--~ ... - ·-
Design 1112
FICUREli.8 (Cont'd)
...... ...... N
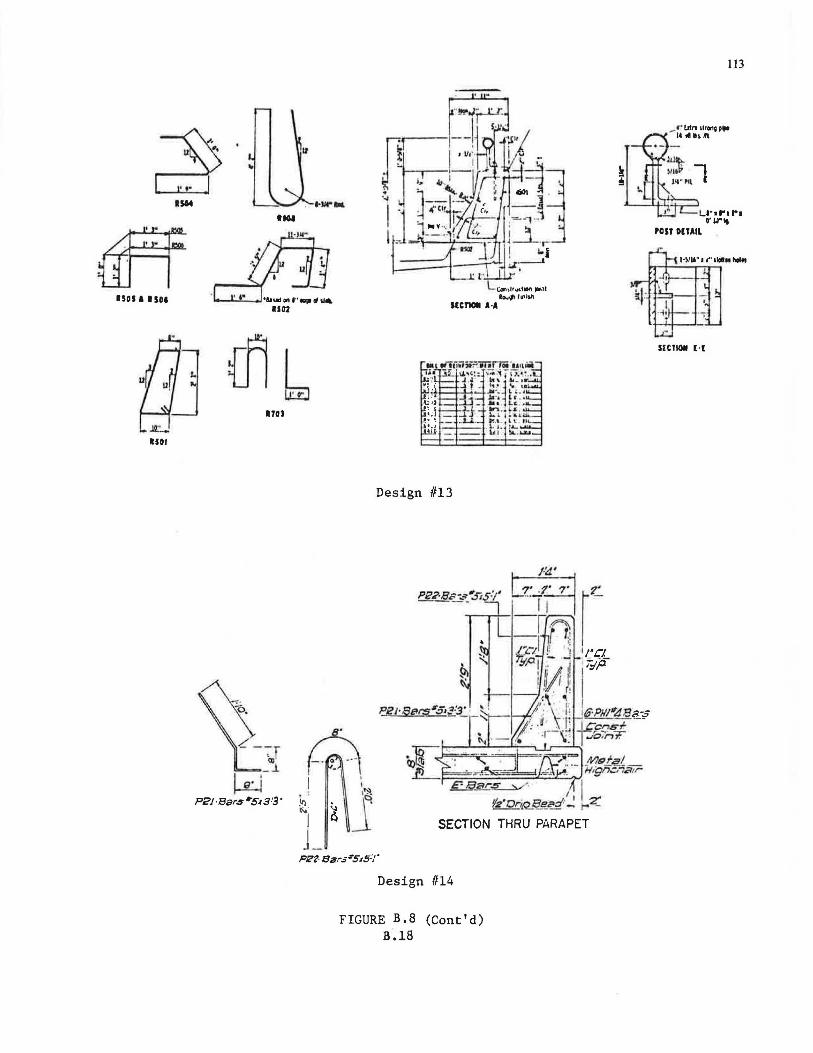
1514
1sos a •so•
1501
Design 1113
Design 1114
FIGURE B,8 (Cont'd) B.18
113
U"•r1r1 O' Ll"lt
POST OllAIL
SICTIOll l ·l
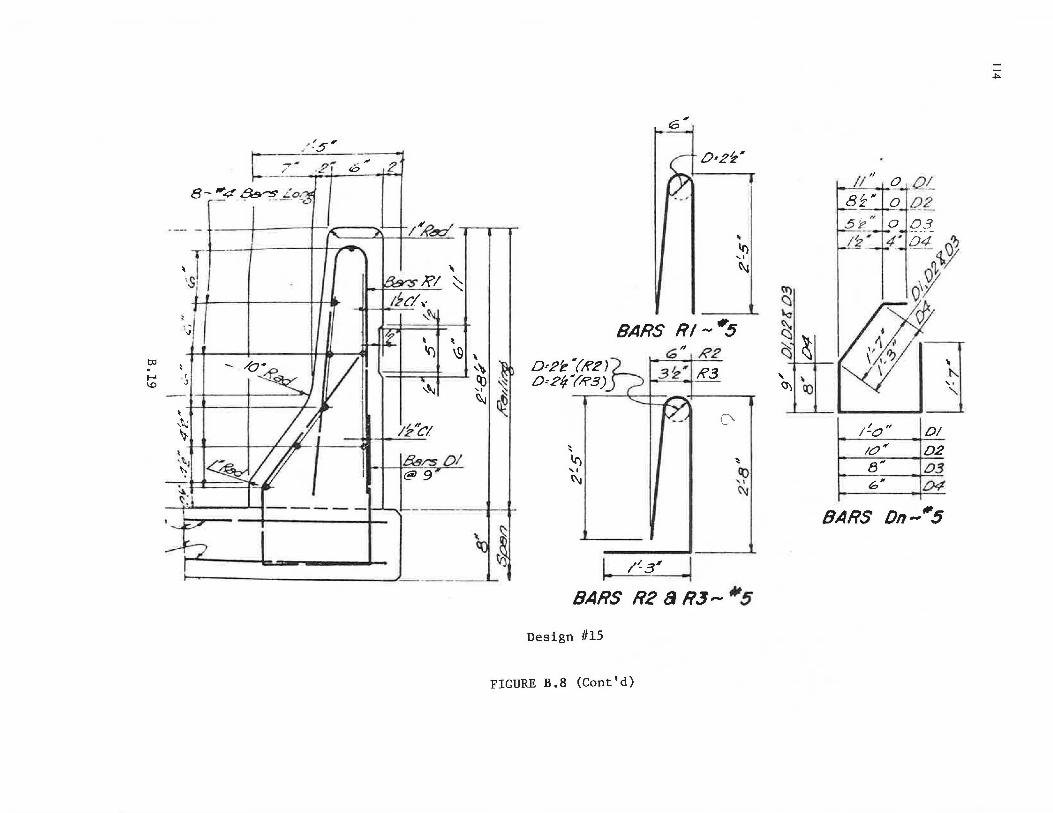
-:5" c ~# · 2 --/ , I 6,, .z 8- ,..4 ~~.£0~"
---..."---+ 1k'~
\
~
\
l \91 ~\ ~ I . ~ 1 ~ ) ,. :s: ,\,j
1j.'c1
&r.s 0 1 @J 9
~~
---------
D--2e " ( KZ) 0=2f/'(R3)
~
Ii) " ~
6 " -, ______.
0:2~·
~
If) ,, ~
BARS Rt-""5 ~II /?2
3~ ... iR3 --0.
1t
<o "' ~
1. /-3' ~
BARS R28R.J- 1115
Design /115
FIGURE B.8 (Cont'd)
tT)
~ "c (5 ~1 ~ ' I , ~ ~
//
11
0 _Qf_ 8~--1 ~02 Si~" OjD3 /~ ~ 4~ 04 (\'? - · . ·-- V/
1 ~0"
10" 8" ~·
~<{./ .\Q
0.'
DI
02 03 04
BARS Dn-"'5
...... ...... """
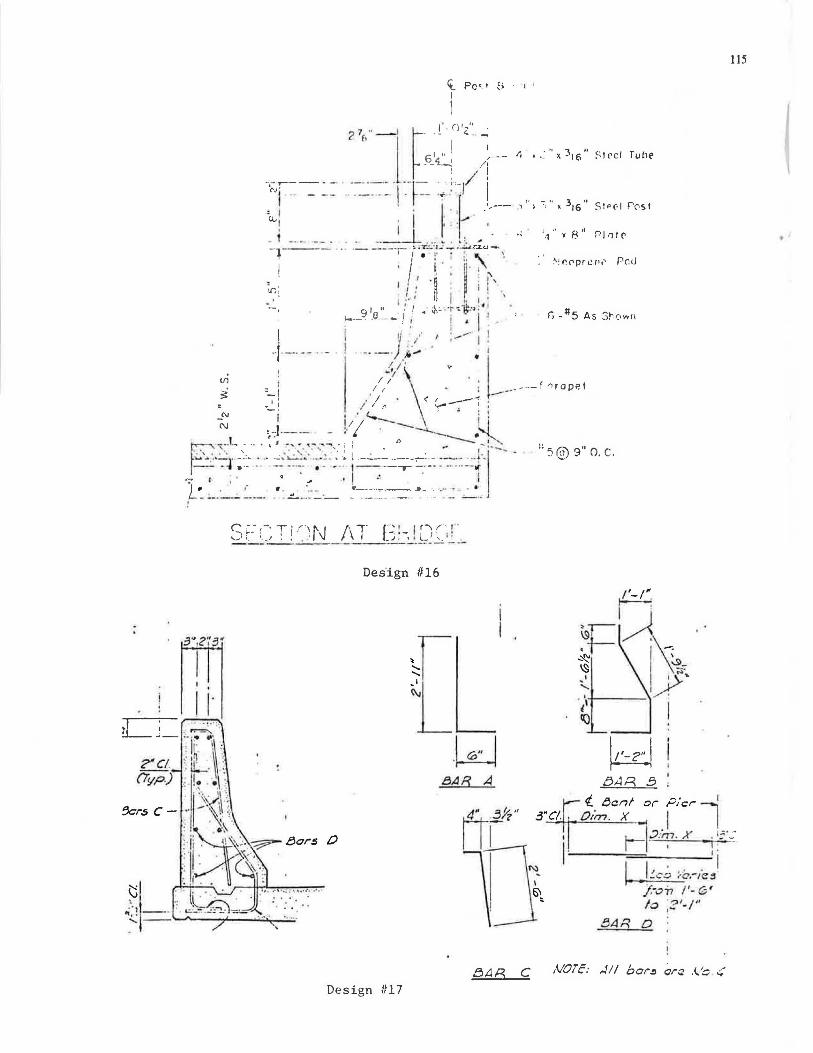
't_ Pc~. t b 1 •
I
("' ~-- : - . T i ( \ !\' . I /\ T f_~ :-. ' D ~-., !'. ,) j;_~-' : : . ' \J . . ·--·-- --
Des'ign 1116
.w BAB A
0
115
8AR .5
i. t>cnl or Pl~r l' 01in. x -l I
I.,. v l - · .• r- !""':; . ,, ; :~ -:.
I I ;c,; :.&.-/e !SI -· . /-on I'- e; • b ;:'-/"
8AR D
.BAB C NOTE: ,.t// bar~ r;;rrt .~~ - .:;
Design #17
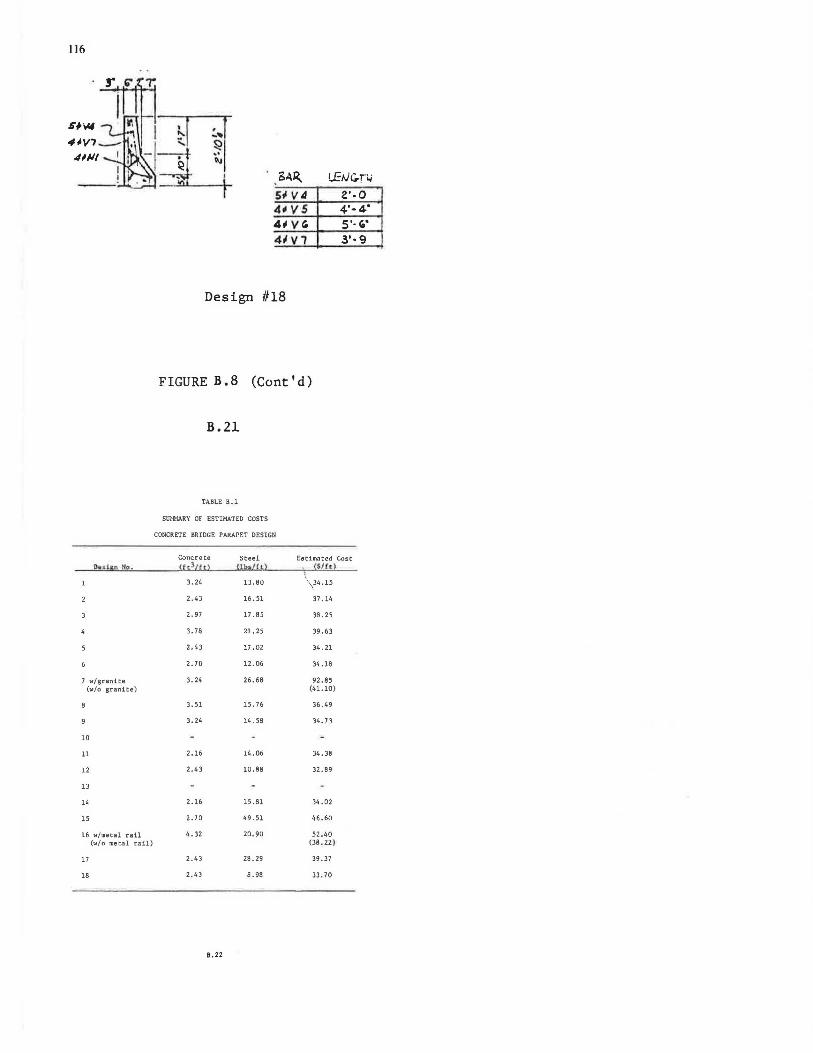
116
Stl V .d z·.o 4t1VS 4•.4•
4t1Y' 5 '· c.· 41V1 3'·9
Design 1118
FIGURE B. 8 (Cont'd)
B.21
TABLE B.l
smlMARY OF ESTIMATED COSTS
CONCRETE BRIDGE PARAPET DESIGN
Conc:ret.e Steel Estimated Cost De.sign No. !f13lul Ul!:il'~l • {$/I<!
3.24 ll.60 \ \34.15
2.43 16.51 37 .14
2.91 11.85 38. 25
3.18 21. 25 39.63
2.43 11.02 34. 21
2.10 12.06 34 .16
7 w/granite 3. 24 26.66 92.65 (w/o granite) (41.10)
3.51 15. 76 36.49
3. 24 14. 56 34. 73
10
ll 2.16 14 .06 34.36
12 2.43 10.88 32.89
l3
14 2.16 15.81 34.02
15 2.10 49.51 46.60
16 w/metal rail 4. 32 20. 90 52.40 (w/ o metal rail) (36.22)
17 2 .43 28.29 39.37
18 2.43 6 .96 33. 70
B.22
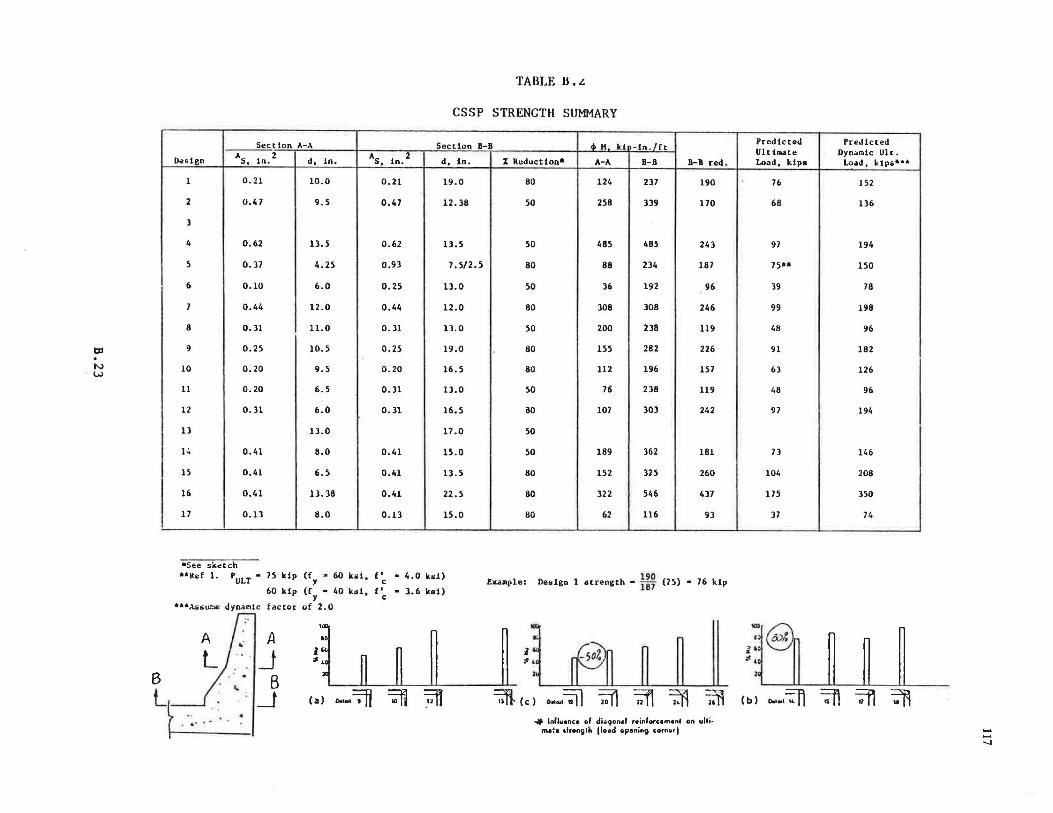
t:i:t . N w
TABLE H • .t.
CSSP STRENGTH SUMMARY
Section A-A Section B-B • H ki -1n./ft "s, in. 2 "s. in.
2 o .. stcn d, in. d, in. % Reduction* A-A B-B B-B red.
1 0.21 10.0 0.21 19.0 80 124 237 190
2 o.u 9.S 0.47 12.38 50 258 339 170
l
4 0.62 13.S 0.62 13.S so 485 48S 243
5 o. )7 4.25 0.93 7.5/2.5 80 88 234 187
6 0.10 6.0 0.25 ll.O 50 36 192 96
7 0.44 12.0 0.44 12.0 80 308 308 246
8 0.31 11.0 0.31 13.0 50 200 238 119
9 0.25 10.5 0.25 19.0 80 155 282 226
10 0.20 9.5 0.20 16.5 80 112 196 157
11 0.20 6.5 0.31 13.0 50 76 238 119
12 0.31 6.0 0.31 16.5 ao 107 303 242
13 13.0 17.0 50
l~ 0.41 8.0 O.H 15.0 50 189 362 181
15 D.41 6.5 0.41 13.5 80 152 325 260
16 0.41 13.38 0.41 22.5 80 322 546 417
17 I O.ll 8.0 O.ll 15.D 80 62 116 91
•s~e 5k.,tch **Ref l. PULT • 75 kip (fv ~ 60 k~i, f~ • 4.0 ksi)
60 up er· - 4o k..t, r• • 3.6 kat> y c
Example: 190 Design 1 strength • Ti7 (75) • 76 kip
***A.s~u..-ie Jyna~lc factor of 2.0
l·~ ~ ~ ~ ~ !~ @~ ~ ~ II B
A _J
Lt I . ..
B _1 (a) ""''"' =;=fj ~ ~ =;;ff. ( c) o .... ,=;jl 7.11 ~ ~ ~
'* Influence of di11i9otwl reinlorum•nt on ultim•!• .trenglh (lo•d opening corn"r)
Predicted PreJicted Ult i111ate Dyn;,r.iic Ult. Load, kips Load, kips***
1b 152
68 lJ6
97 194
nu 150
39 78
99 198
48 96
91 182
63 126
48 96
97 194
73 146
104 208
175 150
17 74
:19 ~ ~ ~ (b) o. .... ~ ~ ~ ~
---.)
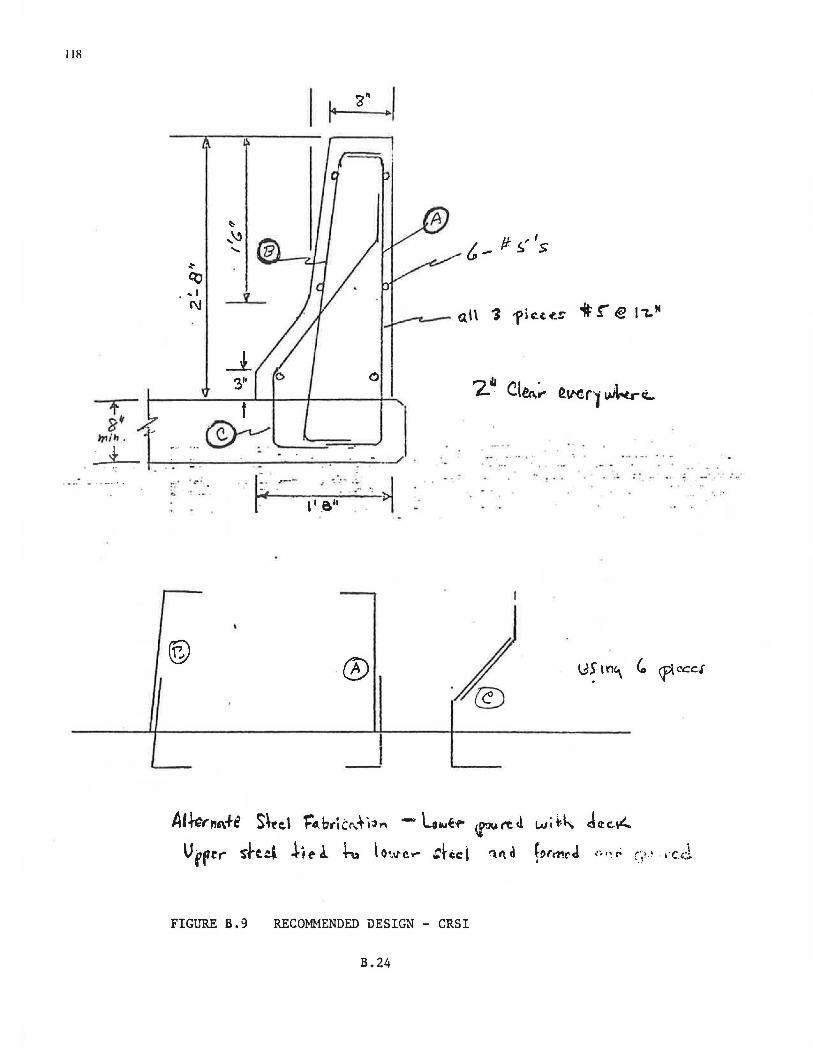
118
+ 8'
111111 .
_-t
I
j
I
'I
:--' ·:- ·
" .... . .... . . .
®
I z·· I r .
0
-
·@
I _J
lJ.. I t.- ,.. ~,. s
• • I 0
· ..
I
. J
.4 !JS In'\
AU-~rr!A.f-i S\tc.\ T!'o.bticr-Ji"J"' --l.wt'f' (f'N('Ccl wit."- dizc..i/...
G, <?~ccs
Urpr,- s-tc:.l lie.il ~ lowc...- :teed 'll'\d fi>r111c-J ~- .. ~ r?·' .·c.d
FIGURE B.9 RECOMMENDED DESIGN - CRSI
B.24
· . . ·
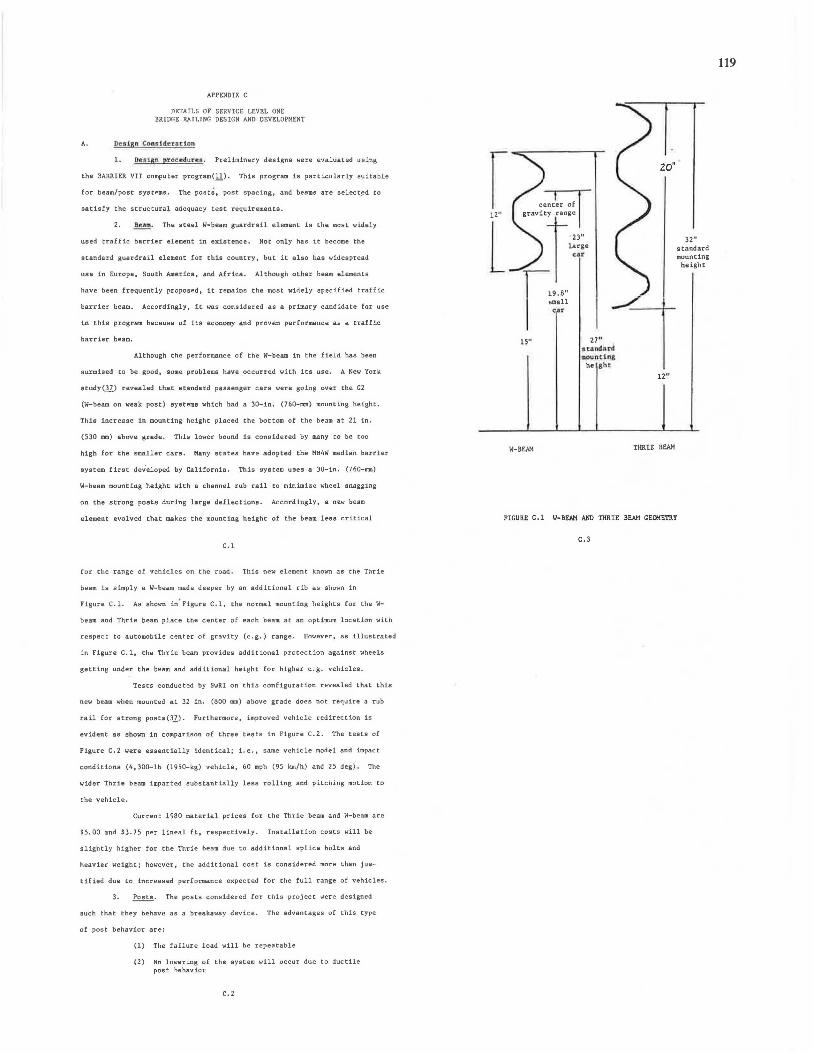
APPENDIX C
DETAILS OF SERVICE LEVEL ONE BRIDGE RAILING DESIGN ANO DEVELOPMENT
A. Deolgn Cons idi!cnttan
1. Ouign procit!durH. Preliminary designs were evaluated using
the BARRIER VII computer program(!!)· This program is particularly suitable
for beam/post systems. The postS, post spacing, and beams are select.ed to
satisfy the structural adequacy teet requirements.
2. Bcnfl'). The steel W-beam guardrail element is the most widely
used traffic barrier element in existence . Not only has it become the
standard guardrail element for this country, but it also has widespread
use in Europe, South America, and Africa. Although other beam elements
have been frequently proposed, it remains the most widely specified traffic
barrier beam. Accordingly, it was considered as a primary candidate for use
in this program because of its economy and proven performance as a traffic
barrier beam.
Although the performance of the W-beam in the field has been
surmised to be good, some problems have occurred with its use. A New York
etudyQl) revealed that standard passenger cars were going over the G2
(W-beam on weak post) systems which had a 30-in. (760-mm) mounting height.
Thie increase in mounting height placed the bottom of the beam at 21 in.
(530 mm) above grade. This lower bound is considered by many to be too
high for the smaller cars. Many states have adopted the MBltW median barrier
system first deVeloped by California. This system uses a 30-in. (760-llllll)
W-beam mounting height with a channel rub rail to minimize wheel snagging
on the strong posts during large deflections. Accordingly, a new beam
element evolved that makes the mounting height of the beam less critical
C. l
for the range of vehicles on the road. This new element known as the Thrie
beam is sitw.ply a W-bea11 made deeper by an additional rib as shown in
Figure C. l. As shown in ' Figure C. l, the normal mounting heights for the W-
beam and Thrie beam place the center of each beam at an optimum location with
respect to automobile center of gravity (c. g,) range. However, as illustrated
in Figure C. l, the Thrie beam provides additional protection against wheels
getting under the beam and additional height for higher e.g. vehicles.
Tests conducted by SwRI on this configuration revealed that this
new bl!am when mounted at 32 in. (800 mm) above grade does not require a rub
rail for strong posts (11.). Furthermore, improved vehicle redirection is
evident as shown in comparison of three tests in Figure C.2. The tests of
Figure C. 2 were essentially identical; Le., same vehicle model and impact
conditions (4,300-lb (1950-kg) vehicle, 60 mph (95 km/h) and 25 deg). The
wider Thrie beam imparted substantially less rolling and pitching motion to
the vehicle.
Current 1980 material prices for the Thrie beam and W-beam are
$5.00 and $3. 75 per lineal ft, respectively. Installation costs will be
slightly higher for the Thrie beam due to additional splice bolts and
heavier weight; however, the additional cost is considet'ed more than jus-
tified due to increased perfonu.nce expec ted for the full range of vehicles .
J. Posts. The posts considered for this project were designed
such that they behav~ as a break.away device. The advantages of this type
of post behavior are:
(1) The failure load will be repeatable
(2) No lowering of the systeru will occur due to ductile post behavior
c. 2
119
I zo"
center of 12" ""'l :, L 32"
large standard car mounting
height
f ·'" ~ small .r
15" 27" 1ta ndctrd »OUntlng
he sh e
12"
W-BEAM THRIE BEAM
FIGURE C.l W-BEAM AND THRIE BEAM GEOMETRY
C.3
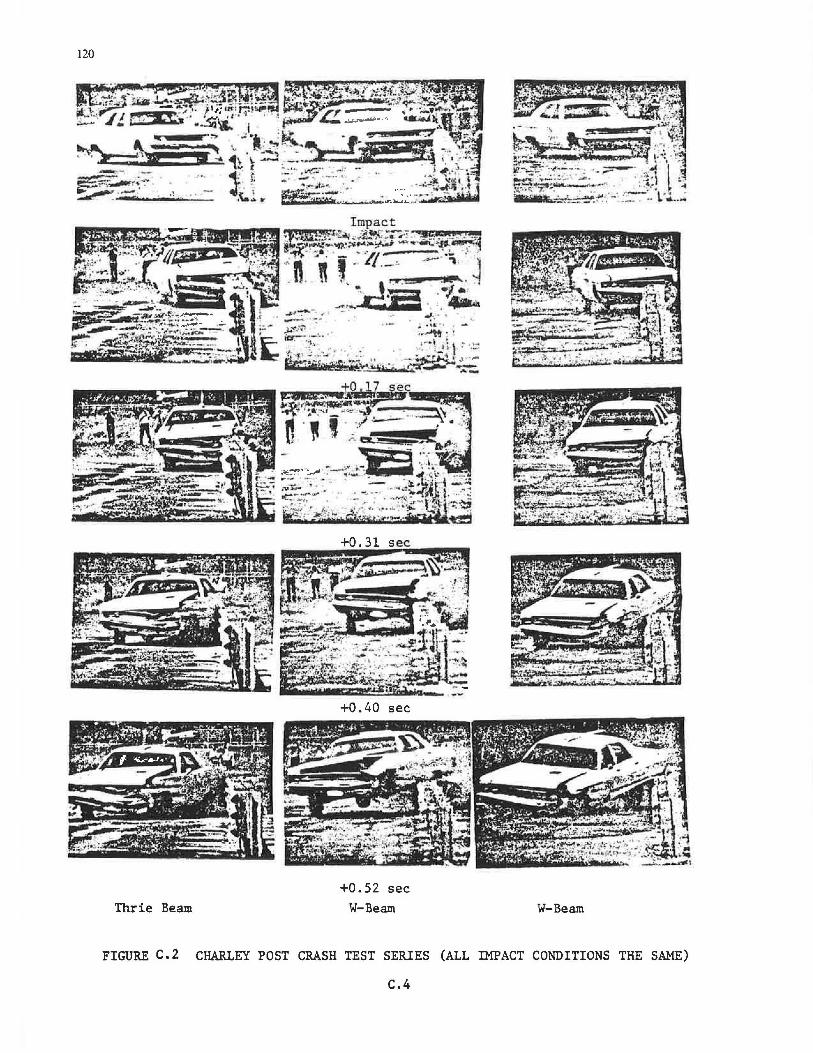
120
+0.40 sec
+0.52 sec
Thrie Beam W-Beam W-Beam
FIGURE C.2 CHARLEY POST CRASH TEST SERIES (ALL IMPACT CONDITIONS THE SAME)
C.4
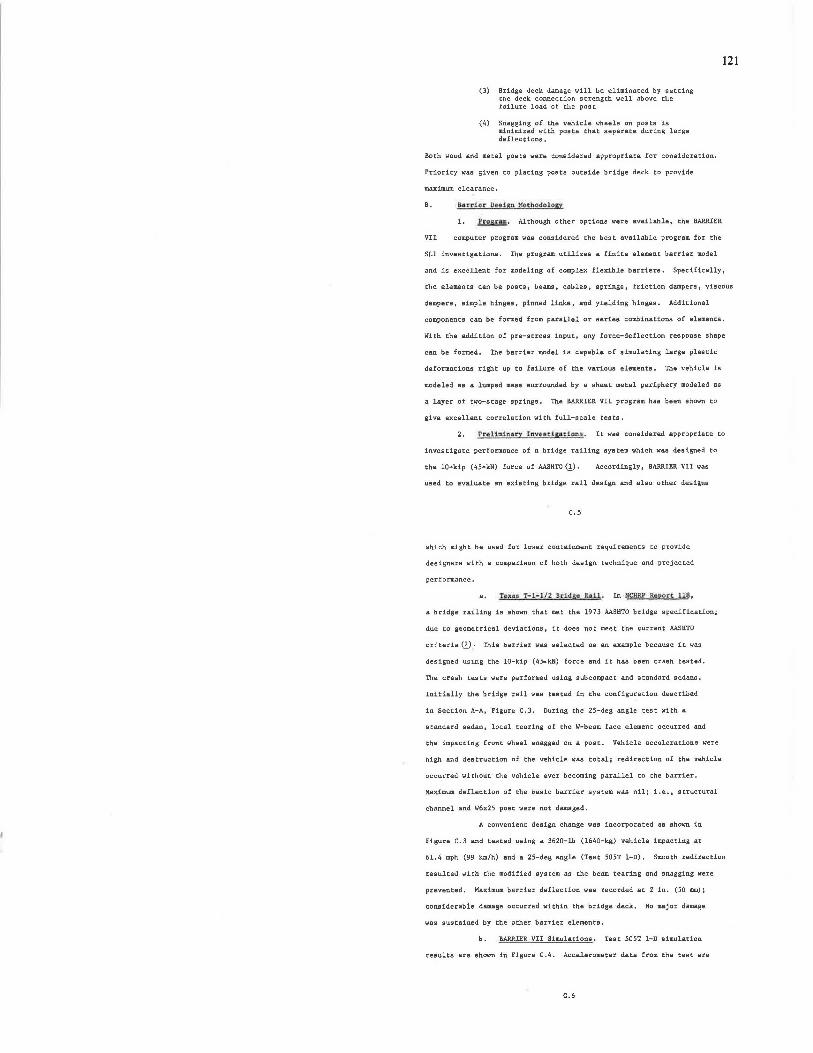
(3) Bridge deck damage will be eliminated by setting the deck connection strength well above the failure load of the post
(4) Snagging of the vehicle wheels on posts is minimized with posts that separate during large deflections.
Both wood and metal posts were considered appropriate for consideration.
Priority was given to placing posts outside bridge deck to provide
maximum clearance.
B. Bi1rd e:r Dlll!..lllisn Mcthodolo&y
1. Pr osru . Although other options were available, the BARRIER
VII computer program was considered the best available program for the
SLl investigations. The program utilizes a finite element barrier model
121
and is excellent for modeling of complex flexible barriers. Specifically,
the elements can be posts, beams, cables, springs, friction dampers, viscous
dampers 1 simple hinges, pinned links 1 and yielding hinges. Additional
components can be fanned from parallel or series combinations of elements.
With the addition of pre-stress input, any force-deflection response shape
can be formed. The bat'rier model is capable of simulating large plastic
deformations right up to failure of the various elements. The vehicle is
modeled as a lumped mass surrounded by a sheet metal periphery modeled as
a layer of two-scage springs. The BARRIER VII program has been shown to
give excellent correlation with full-scale tests.
2. ProUmJ.n•cy lnvut isat1on~. It was considered appropriate to
investigate performance of a bridge railing system which was designed to
the 10-kip (45-kN) force of AASHTO (!). Accordingly, BARRIER VII was
used to evaluate an existing bridge rail design and also other designs
c. 5
which might be used fat' lower containment requirements to provide
designers with a comparison of both design technique and projected
performance,
a. Tl! xatt 't-1-1/2 &r i dRt!I R.ai.l . In NCH!t.P Re.por e. 118 ,
a bridge railing is shown that met the 1973 AASHTO bridge specification;
due to geometrical deviations, it does not meet the current AASHTO
criteria (~). This barrier was selected as an example because it was
designed using the 10-kip (45-kN) force and it has been crash tested.
The crash tea ts were performed using subcompact and standard sedans.
Initially the bridge rail was tested in the configuration described
in Section A-A, Figure C.3. During the 25-deg angle test with a
standard sedan, local tearing of the W-beam face element occurred and
the impacting front wheel snagged on a post. Vehicle accelerations were
high and destruction of the vehicle was total i redirection of the vehicle
occurred with out the vehicle ever becoming parallel to the barrier.
Maximum deflection of the basic barrier system was nilj i.e. 1 structural
channel and W6x25 past were not damaged.
A convenient design change was incorporated as shown in
Figure C.3 and tested using a 3620-lb (1640-kg) vehicle impacting at
61.4 mph (99 km/h) and a 25-deg angle (Test 505T 1-D). Smooth redirection
resulted with the modified system as the beam tearing and snagging were
prevented. Maximum barrier deflection was t"ecorded at 2 in. (50 mm);
considerable damage occurred within the bridge deck. No major damage
was sustained by the other barrier elements.
b. BARRIER VII Simulations. Test 505T 1-D simulation
results are shown in Figure C.4. Accelerometer data from the test are
C.6
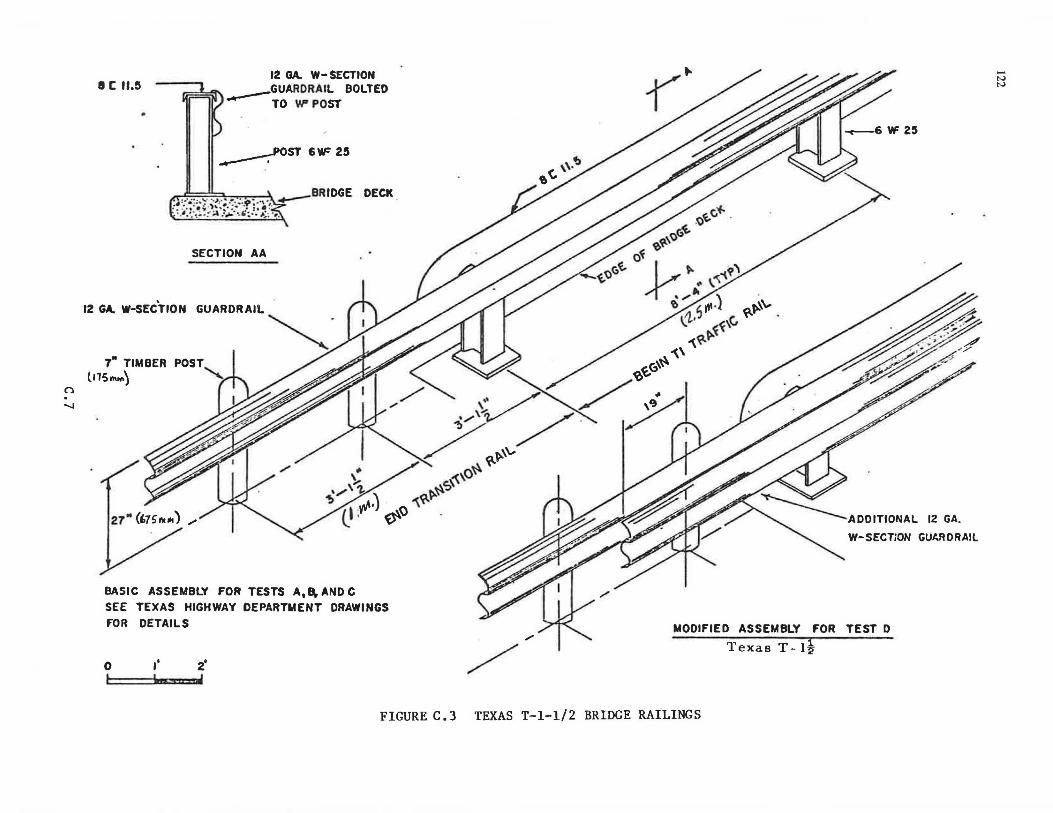
(")
.......
IC 11.5
. 12 GA. W-SECTION
7• TIMBER l11s ...... )
12 OA. W- SECTION ----GUARDRAIL BOLTED
TO YFPOST
,
.,.----:'OST 6 YF 25
SECTION AA
GUARDRAIL~·
~~c,"f.. -~f:f:fc.
o~ ~~ ~~(f>~ ~~ -... -t'' ~ \. '
....... --~ ~~,.,.) ~\.. \.: ~,c. ~
~ ~'\\~~~
-;; / / <i>~r.· ........ 'V / ~
~/~~,~/ 1Y, ......... .<\0~ ~ ' ~S''
/ ll y/t•J ~~~ \... . ~~ -
BASIC ASSEMBLY FOR TESTS A, B. AND C SEE TEXAS HIGHWAY DEPARTMENT DRAWINGS FOR DETAILS
0 1' ~ I b ~
FIGURE C.3
MODIFIED ASSEMBLY FOR TEST D
1'exas T- 12
TEXAS T-1-1/2 BRIDGE RAILINGS
...... N N
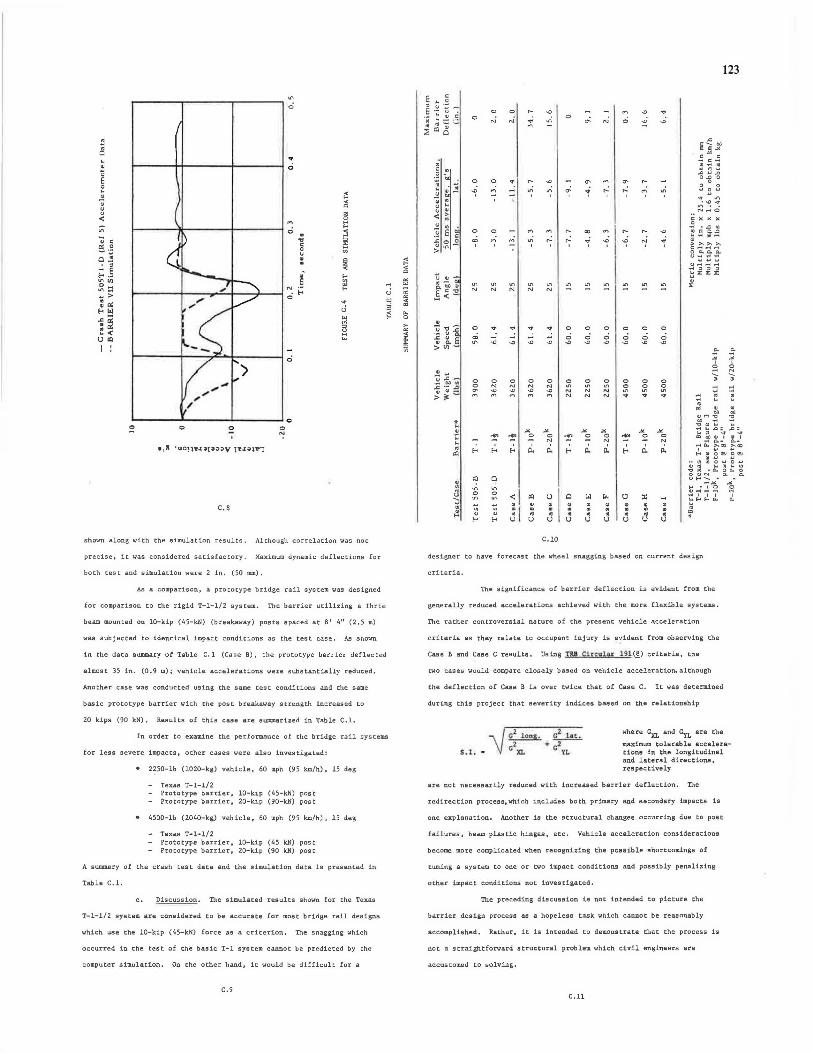
0
. • 0 . . 0
" E ~
~ ~ . < 0 " < :z:
::l ;; 0
.. ';;
. :5 c .,,
~ c: 0 c --= 0 0
o~ ~ ~ " - E ..... 1f
... "' Ul 13 o~ "'~ !'.: .. ~> 0 : 0: ~
... Joi " .., ; ., "' • c: :>
~ < ~ u Ill .. I :
0
,,,,,,"" " /
0
~ 0 0 0
': o ,B 'uonw.iaya:i:ly t~.J:•lllV'1
c. B
shown along with the simulation results . Although correlation was not
precise, it was considered satisfactory . Maximum dynamic deflections for
both test and simulation were 2 in . (50 TillD) ,
As a comparison, a prototype bridge rail system was designed
for comparison to the rigid T-1-1/2 system. The barrier utilizing a Thrie
beam mounted on 10-kip (45-kN) (break.away) posts l!lpaced at 8 1 4 11 (2.5 m)
was subjected to identical impact conditions as the test case. As shot.In
in the data summary of Table c.1 (Case B) I the prototype barrier deflected
almost 35 in. (0.9 m); vehicle accelerations l<l'ere substantially reduced.
Another case was conducted using the same test conditions and the same
basic prototype barrier with the post breakaway strength increased to
20 kips (90 kN), Results of this cue are summarized in Table C.l.
In order to examine the performance of the bridge rail systems
for less severe impacts, other cases were also investigated:
• 2~50-lb (1020-kg) vehicle, 60 mph (95 km/h), 15 deg
- Texas T-1-1/2 - Prototype barrier, 10-kip ('45-kl-l) post - Prototype barrier, 20-kip (90-k.N) past
• 4500-lb (2040-kg) vehicle, 60 mph (95 km/h), 15 deg
- Texas T-1-1/2 - Prototype barrier, 10-kip ('45 kN) post - Prototype barrier, 20-kip (90 kN) post
A su11WAry of the crash test data and the 9imulation data is presented in
Table C.l.
c. Discussion. The simulated results shown for the Texas
T-1-1/2 system are considered to be accurate for most bridge rail designs
which use the 10-kip (45-k.N) force as a criterion. The snagging which
occurred in the test of the basic T-1 syetem cannot be predicted by the
computer simulation. On the other hand, it would be difficult for a
C.9
~ :c .... Ql)Yj ;: ... .Q .. ->~
c
0
"' '
0 0
"' "'
"' N
.... ....;
"' N "' N
... ... ...
....; _; ....;
'l "' 0 ~ . . ...
0 N
"'
... 0
"' N
...
....;
0 N
"' "'
"' 0 N
d.
u ~ • u
c.10
0
0
0
"'
....
~ . u
"'
0
"' N N
-" 0
Joi . . . u
0
"' N N
-" 0 N
d.
f<. . m • u
0
"'
0
~ ...
~ • u
....
0
~ ...
-" 0 N
p.,
" . • u
designer to have forecast the wheel snagging based on current design
criteria.
.e-"' I ::: -> ~ .. ~
The significance of barrier deflection is evident from the
generally reduced accelerations achieved with the more flexible systems,
The rather controversial nature of the present vehicle acceleration
criteria as they relate to occupant injury is evident from observing the
Case B and Case C results. Ueing !R& Cit:culat 191(_~) criteria, tl1e
two cases would compare closely based on vehicle acceleration, although
the deflection of Case B is over twice that of Case C. It was determined
during this project that severity indices baaed on the relationship
123
.e-"' I
~ > ~ .. . "
S.t. •
where GXL and GYL are the
maximum t olerable accelerations in the longitudinal and l ater al directions. respectively
are not necessarily reduced with increased barrier deflection. The
redirection process, which includes bocn primary and secondary impacts is
one explanation. Another is the sttuctural changes occurring due to post
failures, beam plastic hinges, etc. Vetlicle acceleration considerations
become more complicated when recognizing the possible shortcomings of
tuning a system to one or two impact conditioru1 and possibly penalizing
other impact conditions not investigated.
The pt"eceding discussion is not intended to picture the
barrier design process as a hopeless task which cannot be reasonably
accomplished, Rather, it is intended to demonstrate that the process is
not a straightforward structural problem which civil engineers are
accustomed to solving.
C.11

124
Comparisons can be made to the concrete safety shape based on
experimental data (safety shape performance cannot be modeled in BARRIER VII),
Table C. 2 provides this comparison. As shown, the p!"ototype system was com-
parable to the CMB regarding vehicle accelerations, The T-1-1/2 railing
pradueed significantly high decelerations.
3. P.1uuet-r 1c Invutf satton11 . Computer simulations were conducted
using the BAR.RI'fR VII simulacion program. Preliminary findings included r::he
fact that of the thr ee impact conditions given in Table 1 of Ref. 38 for
Service Level 1, the 25-deg angle impact with the 2250-lb (1020-kg) vehicle
produced the greatest maximum deflections. For this reason the 17 cases sum-
marized in Table C. 3 were conducted with this vehicle at 25 deg. Both W-
beam and Thrie beam were investigated; results of the 2D simulations indi-
cated little difference in performance for the two beams including dynamic
deflection. One apparent difference was the amount of beam damage; the
Thrie beam generally sustain~d much less permanent beam damage. Systems
usln~ Liu~. ~-kiµ (22-k.N) break.away po1;t were penetrated !tJr all but. th!:!
3' 1-1/2" (1 m) post spacing. A plot of dynamic deflection versus post
strength is shown in Figure C. 5. From this figure, it appears that the
10-kip (45-kN) post spaced at 12' 6 11 (3.8 m) centers is on a steep portion
of the curve indicative of rapidly increasing deflection.
As a check the other two impact conditions for SL 1 were
investigated for 12 1 6' 1 (3.8 m) spacing with 10-kip (45-kN) posts.
Table C. 4 summarizes the results of these investiBations (Cases 18 and 19).
It is noteworthy that the equivalent impacts for SL 1, as shown in Table 1,
were determined by the collision severity indicator (CS!) described in
the Phase I report (JJ!). The CSI has since been replaced by a new expres-
sion, the redirection index (RI), The deflections for the three impacts
C.12
to c .~
IOJ .;~ • """ :;; .. ~ ;~~ N ;;; :! "' .. c r-
~VlU N ' " 0 u
>-0 . " • * • <>.<'l :;; ..., . ::;
~ ~~(,) ~ .,.; "' ~ 0 "' .
z < ... <
"' z E N s • ~ c
u !;( . . . 0 ""
"' i:i <!l "". :;; 0 iil .... u Cl.:. N "' !'.:
"' •i: ~ "1' N ~ ~
" u u "'0 -< ... - ., "' .... ~ "' "' ~ :;; >
' 0 !'.: a. N "' r-... N
. c .9 . . .
.c 1;i . "" -.,, -.,, :9 "" " "" " ~ . . • :::l <i 'tJ .. " • . . -· . . ~ ~ .
u . c -.. • c -.. > .s -.,, -§, .; .!: u > :a E :a N • <.:" ~
•• . < " • 0 " . .. u • ~~ • . " c '" "~ u "" E . " . .. " " "' < ..
3 - .. . <.: .. . c " .!: " 8 E c • c j <.: c j
. -~ t: t: E 0 u 0 " u ::: ..:i u ..:i < .3 ~ " :c • • .• 0
" "" "" ~ ~ "' < <!l . • • .§ .§ <.: <!l > ::;
~-
C.lJ
§ ... ;:i
~ "' .. u u
< "' .. .... i!!i "' " ul ..
0 ,,. i iil
2i.,, . . o E c. •
0
E g ~ E'S· -~ ~ .s . . ::; 0
""~ c ·u . . " "" .. "' ' ~::: 0 c.
25
20
.5 c .~ IS t: ~ . 0
E " E 10 .. • ::;
- .. 0
....: ci ~ -NN
E E E • • • . . . ~~~
" " "
10
6 •
"' ....
C.14
.. -"'
:.:: :.:: :.:: 000 NNN
E S E • •• . . . .0 .0 .0
~~~
2230-lb vehicle
NNN~
~. l"'"'l"'1'..0"7~~...o..o
I I I - I I I I ...Oa:>N 1...0CONN
- rri - -
:.:: :.:: :.:: :.:: :.:: :.:: :.:: :.:: 0 0 0 U"I \t'I U"I U"I 11'1 NNN -
no mph, 2:; dpe Thrie beam
12' o· sp d ng
3 11j spacing
I
I>
Post Strength, kips
FIGURE C. 5 BARRIER DYNAMIC DEFLECTION AS A FUNCTION OF POST STRENGTH AND SPACING
C.15
0
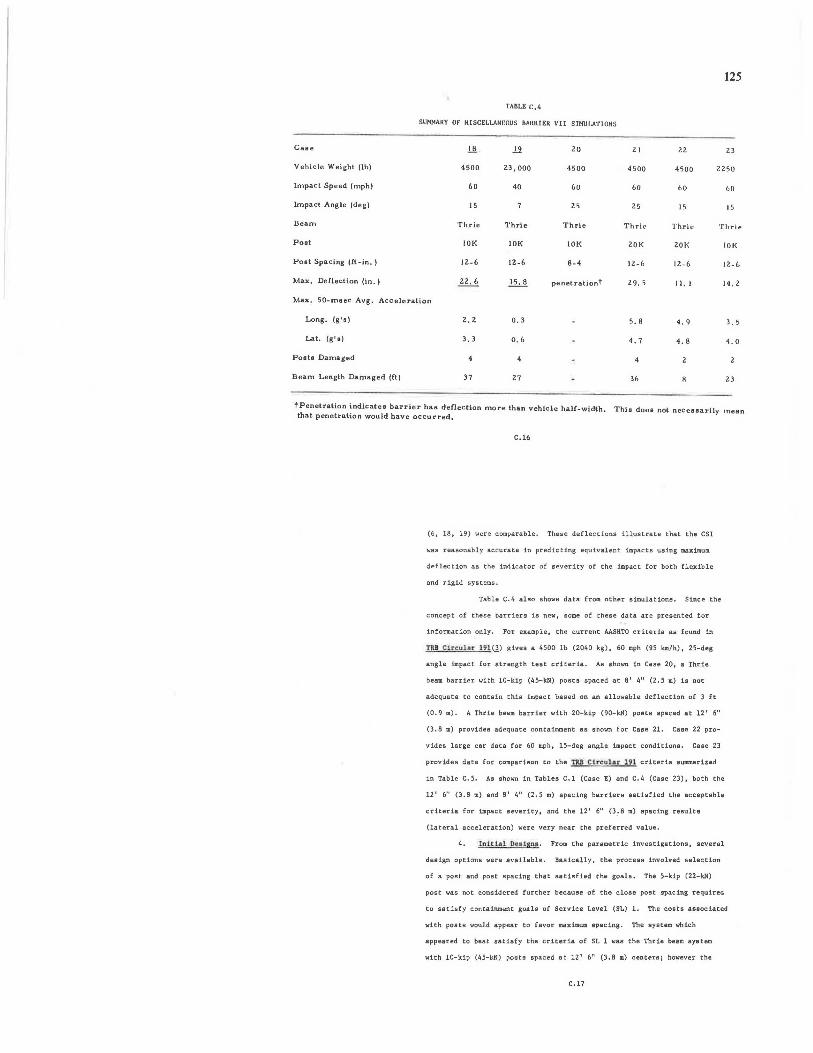
125
TA8LE C.4
SUMMARY OF HlSCELl.ANl!OUS BARRH:R Vil S IHU 1.A'l'IONS
Case !.!l. .li 20 2 I 22 23
Vehicle Weight (lb) 4500 23. 000 4500 4500 4500 2250
Impact Speed (mph) 60 40 60 60 ~o r,o
Impact Angle (deg) 15 25 25 15 15
Beam Thrie Thrie Thrie Thril"' Thrie Th?"ie
Poet !OK IOK IOK 2QK 20K IOK
Poet Spacing (It-in.) 12-6 12-6 8-4 12-6 12-6 12-6
Max, Deflection (in.) 22 . 6 .!2..:.1. penetratlont 29. 5 II, I 14. 2
Max, SO-meec Avg. Ace eleration
Long. (g'e) 2.Z o. 3 5,8 4. 9 3. 5
Lat. (g'•I 3. J o. 6 4 . 7 4. 8 4 . 0
Po1le Damaged
Beam Length Damaged (fl) 37 Z7 36 23
tPenetration indicates barrier has deflection more than vehicle hall-width. Thia does not necessarily mean that penetration would have occurred,
C,l6
(6, 18, 19) were comparable. These deflections illustrate that the CSI
reasonably accurate in predicting equivalent impacts using uximum
deflection as the indicator of severity of the impact for both flexible
and rigid systems.
Table c. 4 also shows data from other simulations. Since the
concept of these barriers is new, some of these data are presented f.or
information only. For example, the current AASHTO criteria as found in
TRS Cuoubr L9l (1l gives a 4500 lb (2040 kg), 60 mph (95 km/h), 25-d•g
angle impact for strength test criteria . As shown in Case 20, a Thrie
beam barrier with 10-kip (45-kN) posts spaced at a' 4" (2. 5 m) is not
adequate to contain this impact based on an allowable deflection of 3 ft
(0.9 m). A Thrie beam barrier with 20-kip (90-kN) posts spaced at 12' 6"
(3. 8 m) provides adequate containment as shown for Case 21. Case 22 pro-
vides large car data for 60 mph, 15-deg angle impact conditions, Case 23
provides data for comparison to the TRB CJ.rc:.ular 191 criteria summarized
in Table C. 5. As shown in Tables C. l (Case E) and C. 4 (Case 23), both the
12' 6" (3.8 m) and 8' 4" (2,5 m) spacing barriers satisfied the acceptable
criteria for impact severity 1 and the 12 1 611 (3_.8 m) spacing results
(lateral acceleration) were very near the preferred value.
4. [n:ltbl Oe tt h;rui, From the parametric investigations, several
design options were available . Basically, the process involved selection
of a post and poet spacing that satisfied the goals. The 5-kip (22-kN)
post was not considered further because of the close post spacing required
to satisfy containment goals of Service Level (SL) 1. The costs associated
with posts would appear to favor maximum spacing. The system which
appeared to best satisfy the criteria of SL 1 was the Thrie beam system
with 10-kip (45-kN) posts spaced at 12 1 611 (3.8 m) centers; however the
C.l7
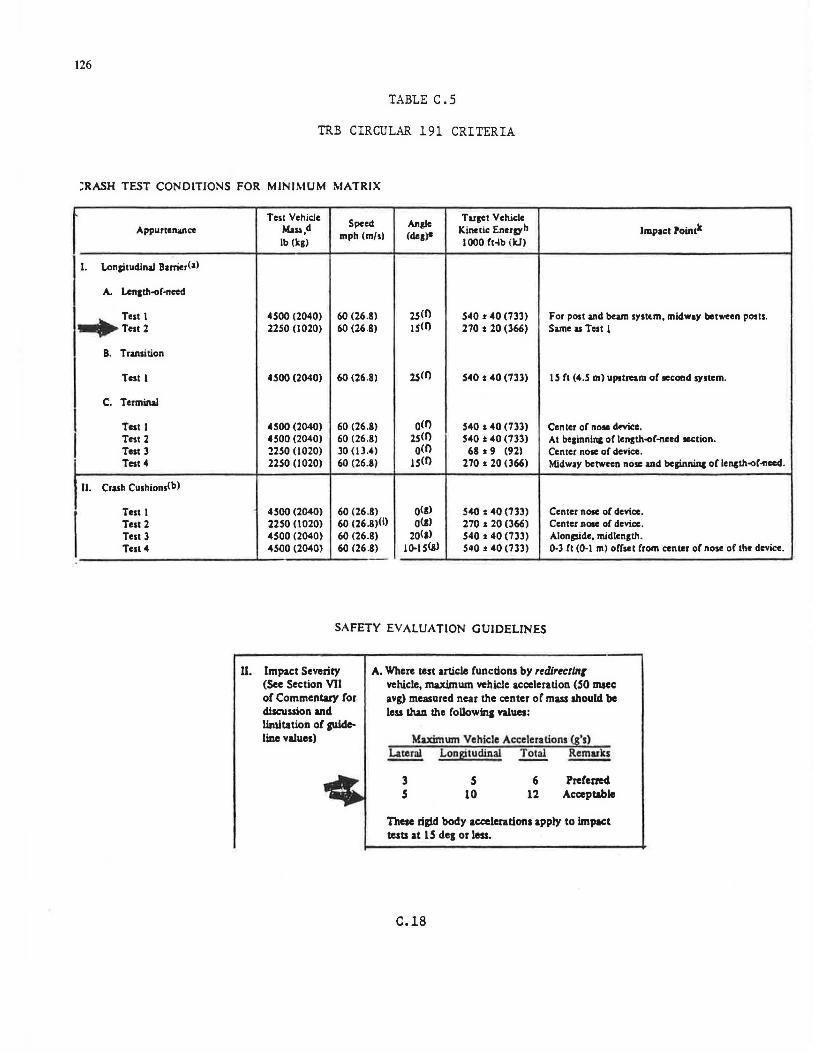
126
TABLE C .5
TRB CIRCULAR 191 CRITERIA
:RASH TEST CONDITIONS FOR MINIMUM MATRIX
Appurten;&11ce
l. Lonptudinal Barrier(;a)
A. Lentth-of-need
.... Testl Test 2
B. Transition
Test 1
c. Terminal
Test I
I Test 2 Test 3 Test 4
II. Crash CushionsCb)
Test I Test 2 Test 3 Test 4
-
Test Vehicle Speed Angle
Target Vehicle Ma~,d
mph (m/s) Cde1)e Kinetic Enerl)'h hapacc Pointlt
lb (kl) l 000 ft-lb (ltJ)
4500 (2040) 60 (26.8) 25<0 540 t 40 (733) For post and beam systc.m, midway between posts . 2250 (1020) 60 (26.8) 15CO 270 t 20 (366) Same u Test 1
4500 (2040) 60 (26.8) 25<0 540 t 40 (733) I 5 ft (4.5 m) upstream of second system.
4500 (2040) 60 (26.8) o<O 540 t 40 (733) Center of note d~e. 4500 (2040) 60 (26.8) 25<0 540 t 40 (733) Al be1inninc of length-of-need section. 2250 (1020) 30(13.4) o<O 68 t 9 (92) Center nose of device. 2250 (1020) 60 (26.8) ts<O 270 t 20 (366) Midway between nose and bcPnning or length-of-need.
4500 (2040) 60 (26.8) 0<1> 540 t 40 (733) Center nose of device. 2250 (1020) 60 C26.8)Cil o<i> 270 t 20 (366) Center nose of device. 4500 (2040) 60 (26.8) 2o<g> 540 t 40 (733) Alongside, midlenglh. 4500 (2040) 60 (26.8) l~l .s<&> 540 t 40 (733) 0-3 (I (0·1 m) offset from center of nose of the device.
SAFETY EVALUATION GUIDELINES
ll. Impact Severity (See Section VU or Commentary for discussion and linlitation of Jllideline values)
A. Where test article functions by rrdirtetlnl vehicle, maximum vehicle acceleration (50 msec avg) measured near the ~nter or mass should be less than the rollowina values:
Maximum Vehicle Accelerations (g's) ~ Longitudinal Total Remarks
3 5
5 10
6 12
Preferred Acceptable
These rigid body ac:celentions apply to impact tesu at 15 deg or less.
C.18
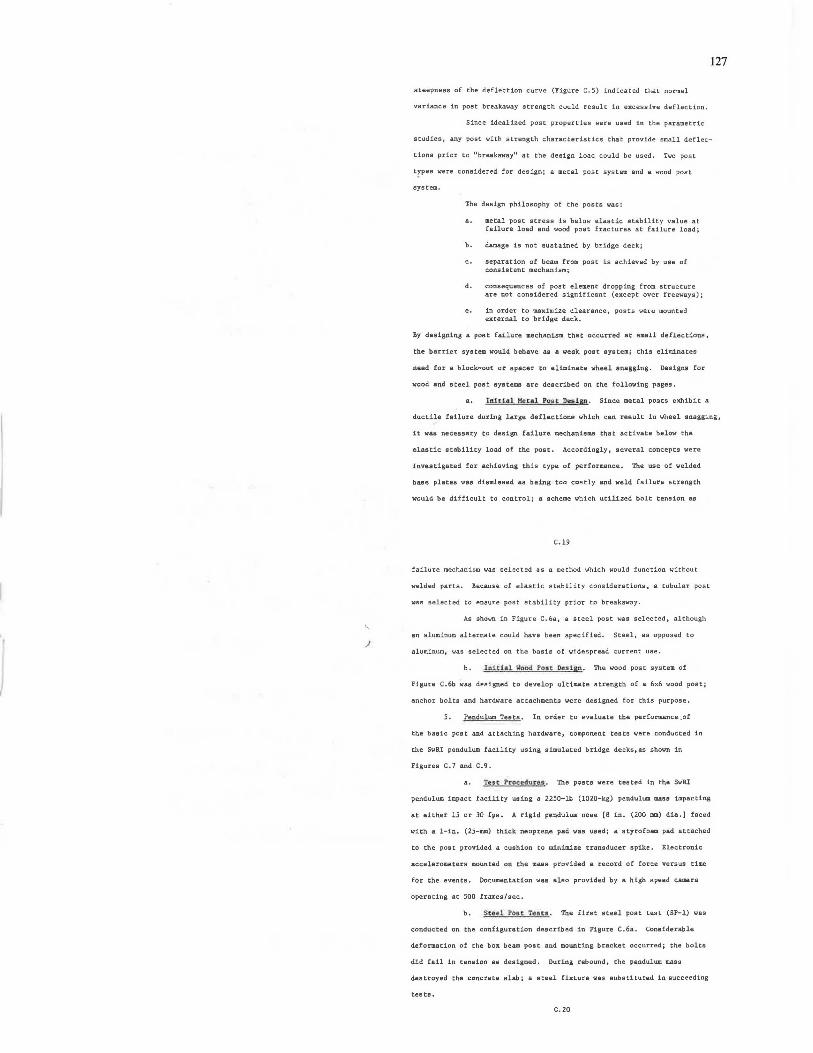
)
I
127
steepness of the deflection curve (Figure C. S) indicated that normal
variance in post breakaway strength could result in excessive deflection.
Since idealized post properties were used in the parametric
studies, any post with strength characteristics that provide small deflec-
tions prior to "breakaway" at the design load could be used. Two post
t!pes were considered for design; a metal post system and a wood poet
system.
T,he design philosophy of the posts was :
metal post stress is below elastic stability value at failure load and wood post fractures at failure load;
b. damage is not sustained by bridge deckj
separation of beam from post is achieved by use of consistent mechanism;
d. consequences of post element dropping from structure are not considered significant (except over freeways);
in order to maximize clearance, posts were mounted external to bridge deck.
By designing a post failure mech.anism that occurred at small deflections.
the barrier system would behave as a weak. post system; this eliminates
need for a block-out or spacer to eliminate wheel enagging. Designs for
wood and steel post systems are described on the following pages.
a. lnltlal H'e.tal Post De.s1.g9. Since metal posts exhibit a
ductil~ failure during large deflections which can r@sult in '-'heel anagging,
it was necessary to design failure mechanisms that activate below the
elastic stability load of the poet. Accordingly 1 several concepts were
investigated for achieving this type of performance. The use of welded
base plates was dismissed as being too costly and weld failure strength
would be difficult to control; a scheme which utilized bolt tension ae
C.19
failure mechanism was selected as a method which would function without
welded parts. Because of elastic stability considerations, a tubular post
selected to ensure post stability prior to breakaway.
As shown in Figure C.6a 1 a steel post was selected, although
an aluminum alternate could have been specified. Steel, as opposed to
aluminum 1 was selected on the basis of widespread current use.
b. -1.nitial Uaod Po·1t Dcl.11Bn.. The wood post system of
Figure C.6b was designed to develop ultimate strength of a 6x6 woo~ post;
anchor bolts and hardware attachments were designed for this purpose.
5. Pendulum Tests. In order to evaluate the performance .of
the basic post and attaching hardware, component tests were conducted in
the SwRI pendulum. facility usina simulated bridge decks,as shown in
Figures C. 7 and C.9.
Tut l"r ocedure.s, The posts were tested in the SwRt
pendulum impact facility using a 2250-lb (1020-kg) pendulum mass impacting
at either 15 or 30 fps. A rigid pendulum nose [8 in. (200 mm) dia.] faced
with a 1-in. (25-mm.) thick neoprene pad was usedi a styrofoam pad attached
to the post provided a cushion to minimize transducer spike. Electronic
accelerometers mounted on the mass provided a record of force versus time
for the events. Documentation was also provided by a high speed ca.mar a
operating at 500 frames/sec.
b. Steel. Poat Teeu. The first steel post test (SP-1) was
conducted on the configuration described io Figure C.6a. Considerable
deformation of the box beam poet and mounting bracket occurred; the bolts
did fail in tension as designed. During rebound 1 the pendulum mass
destroyed the concrete slab; a steel fixture was substituted in succeeding
tests.
c. 20

128
llil\&O: __ ,..
!:.':',~\!. 2."
8
10
wooo .... "' Anchor Bolt
3/4" a Z•-011
5/8" x l'-6"
1/2" x 1'-6"
FIGURE C.6
(a) Steel Post
a Dlmea•lon !In. I
3-7/8
3-13/16
(b) Wood Post
o·
I I
'·c1~. wou. (P9ttt
c~:~v Mou•n1..,.o P.lllAC.IC.Ll
'T•'l•'IJI.~' 0.1•1• • .
... I ,. ""'c.... ; ' """°° -""'"" '
\· ........... c ........ ,
INITIAL SL 1 BRIDGE RAILING DESIGNS
c.21
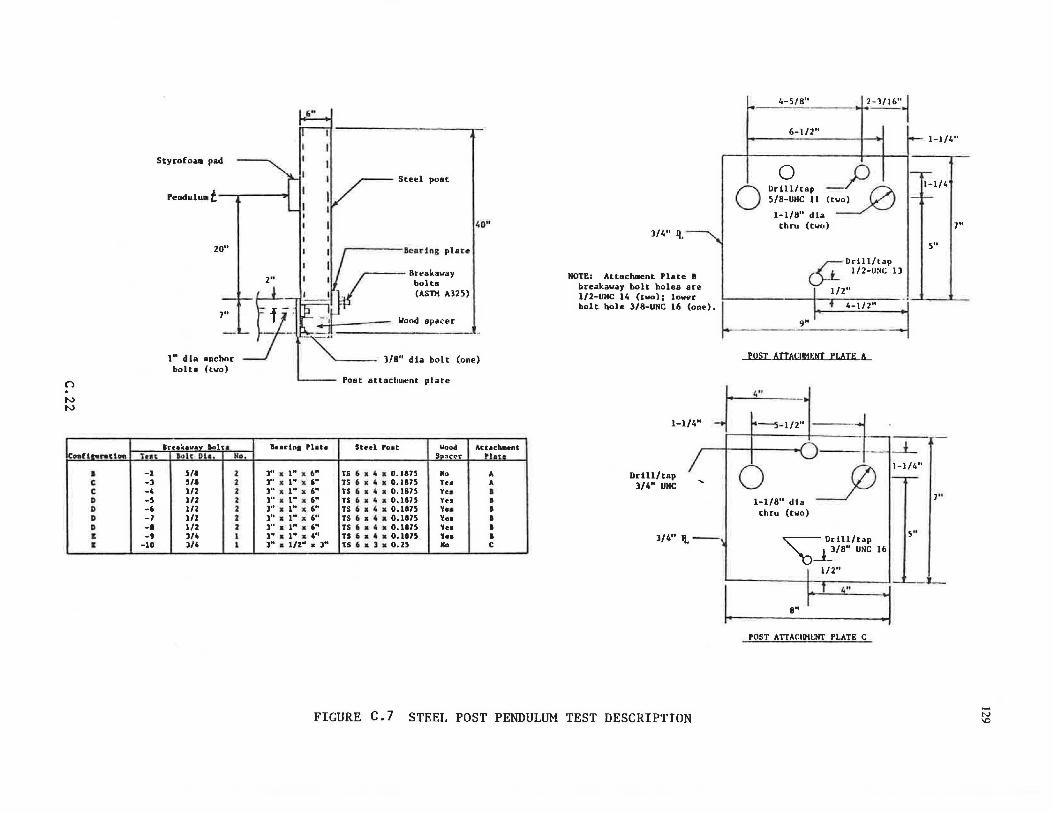
n . N N
CoaU1l11Htlon
I c c D D D D i I
Styrofoam pad
Steel post
Pendulu• t--.,-----M
teJIC
-z -l _, -5 _, -1
-· _, -10
20"
I" dla anchor bolta (two)
lre•k•way lolt• l<>lt Oh.
5/1 ,,. 1/2 1/Z 1/2 1/Z 1/2 l/4 l/4
No.
2 2 2 2 2 2 2 I I
40"
.------Bearing plate
2"
~ Breakaway bolts
' • f · (ASTH Al25) J -----, ---,
- - Wood spacer
3/8" dia bolt (one)
Poat attach....,nt plate
Bearlna Plate Steel Poat Wood Att•chment Spacer Plat•
]11
• r· a 6" TS 6 x 4 • 0.1875 llo A J" x 1" .. , .. TS 6 x & x 0.1175 y .. A )
11 .. l" .. 6" TS 6 • 4 • 0.1875 Yea • ] ... 111
• 6" TS 6 x 4 x 0.1175 Yes • ]" :a l" lilt 6" TS 6 • 4 • 0.1875 Yu • l" x l" JI: , .. TS 6 • 4 • 0.1875 Yeo • l" • 111 • , .. TS 6 " 4 x 0.1175 Yeo I l" • l" • 4" TS 6 x 4 • 0.1815 Yeo I J" a l/Z'' • 3• TS 6 x l a 0.25 No c
l/4" IL
NOTE: Attachment Plate breakaway bolt holes 1/2-UNC 14 (tvo); lov bolt hole 3/8-UNC 16 (one).
~ 4::5/8" _;-J/lb"1
6-1/2" - 1-1/4"
0 ,,2, .. , -/:;a , __ 1-1/4
5/8-UNC 11 (two) ~ -
1-1/8" dla thru (two) 7"
5"
1/2-UNC ll ~Drill/tap
I 1/2" - -- ..
I I i 4-1/2" - -1 . .
9" ' - -- - -. _l.Qll_AITAQIMF.N'f PI.ATE A_
1-1/4" ~· ~~-"'" Drill/tap
3/4" UNC
l/4" 11.--
0 1-1/8" dia
thru (two)
~Drill/tap
'U-_1_3/8" UNC lb
1/2"
8"
POST ATIACllHllIT PLATE C
1-1/4"
7"
5"
FIGURE C.7 STEEL POST PENDULUM TEST DESCRIPTION -N \0
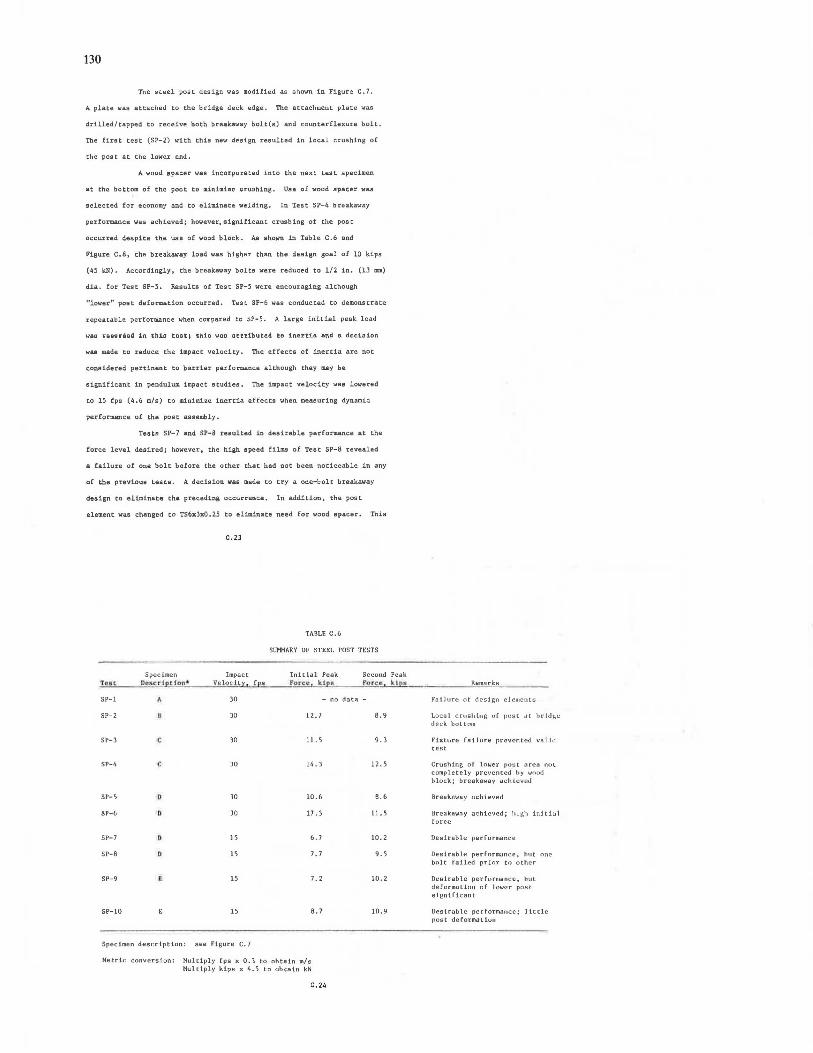
130
The steel post design was modified as shown in Figure C. 7.
A plate was attached to the bridge de.ck edge. The attachment plate was
drilled/tapped to receive both breakaway bolt(s) and counterfle.Kure bolt,
The tint test (SP-2) with this new design resulted in local crushing of
the past at the lower end.
A wood spacer waa incorporated into the next test specimen
at tha bottom of the poot to minim.he cruahing. Uae. of vood .!pace.r wa~
selected for economy and to eliminate welding. ln Test SP-4 breakaway
performance was achieved; however. significant crushing of the post
occurred despite the use of wood block. As shown in Table C.6 and
Figure C.8, the breakaway load was higher th.an the design goal of 10 kips
(45 kN). Accordingly, the breakaway bolts were reduced to 1/2 in. (13 mm)
dia . for Test SP-5.. Resulta of Test SP-5 were encouraging although
"lo1o1er" post defot"m.ation occurred. Test SP-6 was conducted to demonstrate
repeatable performance when compared to SP-5. A large initial peak load
vaa 1"uuordad in thio toot a tkio uoo ottl'ibutcd to inertia and a dc.c.ioion
waa made to reduce the impact velocity, The effects of inertia are not
considered pertinent to barrier performance alth.ough they may be
significant in pendulum impact studies, The impact velocity was lowered
to 15 fps (4.6 m/s) ta minimize inertia effects when measuring dynamic
performance of the post assembly.
Tests SP-7 and SP-8 resulted in desirable performance at the
force level desired; however, the high speed films of Test SP-8 't'eveale.d
a failure of one bolt be.fore the other that had not been noticeable in any
of the previous tests. A decision vas made to try a one-bolt breakaway
design to eliminate the preceding occurrence. In addition, the post
element vas changed to TS6x3x0. 25 to eliminate need for wood spacer. This
C.23
Specimen Impact T<iat. Doa:cr1pt ion • Velocity ,
SP-1 A 30
SP-2 30
SP-3 30
SP-q 30
SP-5 JO
SP-6 n 30
SP-7 15
SP-8 15
SP-9 15
SP-10 15
Specimen descC"iption: see Figure C. 7
fps
TABLE C.6
SUMMARY OF STEEL POST TJ::STS
Initial Peak Fore~. kipl'I
Second Peak Force, ~tra
- no data -
12. 7 B.9
11. 5 9. 3
1'. J 12. 5
10.6 B. 6
17. 3 11.5
6. 7 10. 2
7. 7 9. 5
7. 2 10. 2
B. 7 10.9
Metric conversion: Multiply fps x O,J to obtain m/s Multiply kips x q,5 to obtain kN
C.24
Fatlure of design elements
Local crushing of post ut hridt.\t.! deck bot tom
Fixture fBilure prevented valid te!'lt
Crushing of lower pust <UCB nol completely prevented '1y wnod block; breakaway achlevC!J
Breaknway .'.lchieved
Hreakaw::ay achieved; hlKh initiul force
nesirable performance
Desirable performunce, hut one bolt failed pr!or to other
Desirable performance, hut deformation of lower post signiCicant
Desirable performance; J ittle post deformation
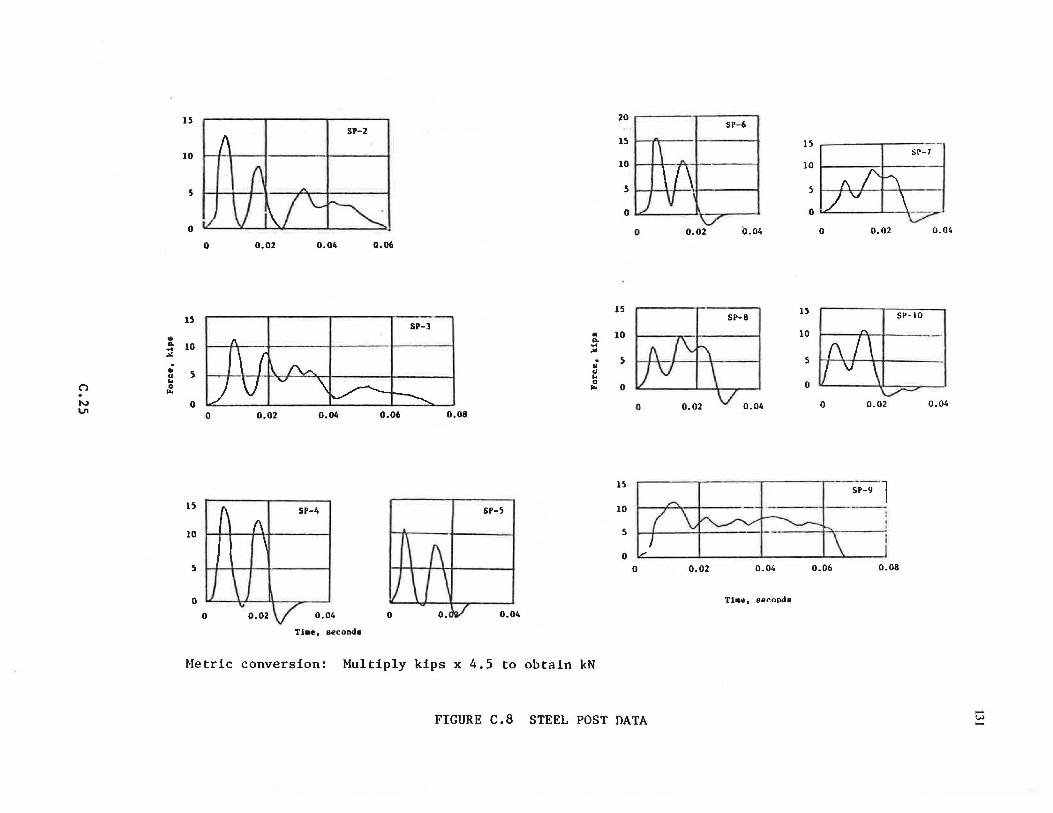
.. Q. ... ..:
• u .. (') 0 . ... N lJ1
15 I I I I 20
SP-2 SP-6
15 15 JO ~ \ I I I Sl'-7
10 JO
:D \} R/3:":1 5 5
0 0
0 0.02 0.04 0 0.02 0.04
0 0.02 0.04 0.06
15 15
I [ I JS
SP-l SP-8 I I SP-10
• 10 10 Q.
10 ... ... ,; s l-J..-.\-1 I I I 5
5 u .. 0 ll I \ I ... 0 0
0 v 0.04 -
0 0.02 0 0.02 0.04 0 0.02 0.04 0.06 0.08
15 SP-4
JO :: [ /'~. - '.'~ ) ·- - : o __ _ \ I - I
SP-5
5 0 0.02 0.04 0.06 0.08
0 Tlmt!, seconds
0 0.04 0.04
Tiae, seconds
Metric conversion: Multiply kips x 4.5 to obtain kN
FIGURE C.8 STEEL POST DATA -\>J
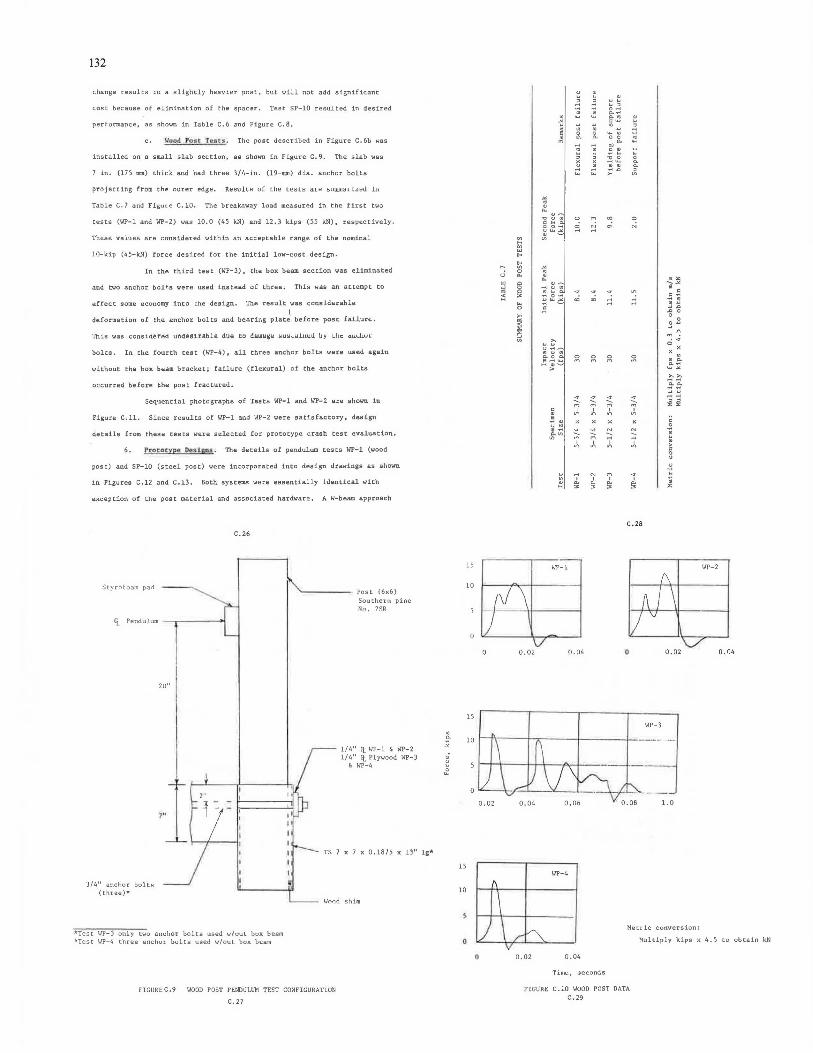
132
change results in a slightly heavier post, but will not add significant
cost because of elimination of the spacer. Test SP-10 resulted in desired
perfonnance, shown in Table C. 6 and Figure C. 8.
WPOCI Poict tuu. The post described in Figure C. 6b was
installed on a small slab section, as shown in Figure C. 9. The slab was
7 in. (175 mm) thick and had three 3/4-in. (19-IJllO) dia. anchor bolts
projecting tram the our.er edgt!. R~oulLo uf Llu~ L~sls atl::! boUWUJ~11.t.t:J. 111
Table C. 7 and Figuc-e C.10. The breakaway load measured in the first two
tests (WP-1 and WP-2) was 10.0 (45 kN) and 12.3 kips (55 kN), respectively.
These values are considered within an acceptable range of the nominal
10-kip (45-kN) force desired for the initial low-cost design.
In the third test (WP-3), the box beam section was eliminated
and two anchor bolf".s were used instead of three. This was an attempt to
effect some economy into the design. The result was considerable
I deformation of the anchor bolts and bearing plate before post failurt..
'l'his was considet'ed ut\dM1rlbl.e due tu dawa~I:! !:IUSLalul;!ll lJy Lhc a.1u .. huL
bolts. ln the fourth test (WP-4), all three anchor bolts were used again
without the box beam bracket; failure (flexural) of the anchor bolts
occurred before the post fractured.
Sequential photographs of Tests WP-1 and WP-2 are shown in
Figure C.11. Since results of WP-1 and WP-2 were satisfactory, design
details from these tests were selected for prototype crash test evaluation.
6. Prococypo Duisn.t. The details of pendulum tests WP-1 (wood
post) and SP-10 (steel past) were incorporated into design drawings as shown
in Figures C.12 and C.13. Both systems were essentially identical with
exception of the post material and associated hardware, AW-beam approach
Styro foam pad
G.. Pendulum -~----
3/4" anchor bolts (three)*
20"
C.26
*Test \JP-) only two anchor bolts used w/out box beam •rest WP-4 three anchor bolts used w/out box beam
Post (6x6)
Southern pine Nn, ?SR
1/4" !\. Wl'-1 • Wl'-2 1/4" !\.Plywood Wl'-3
& WP-4
TS 7 x 7 x 0.1875 x 13 1' lg•
Wood shim
FIGURE C. 9 WOOD POST PENDULUM. TEST CONFIGURATION
c.21
. c. ~
~ ~
15
10
15
10
15
10
0
0.02
. . ...
Wl'-1
Wl'-4
0 ..,
o. 04
. 0 0.
~ . " , " . ~ ..
N I
!i
0
N
N
1
C.28
0.02
WP-3
1.0
Metric conversion:
Wl'-2
0.04
Multiply kips x 4. S to obtain kN
0.02 0.04
Time, seconds
FIGURE C .10 WOOD POST DATA C.29
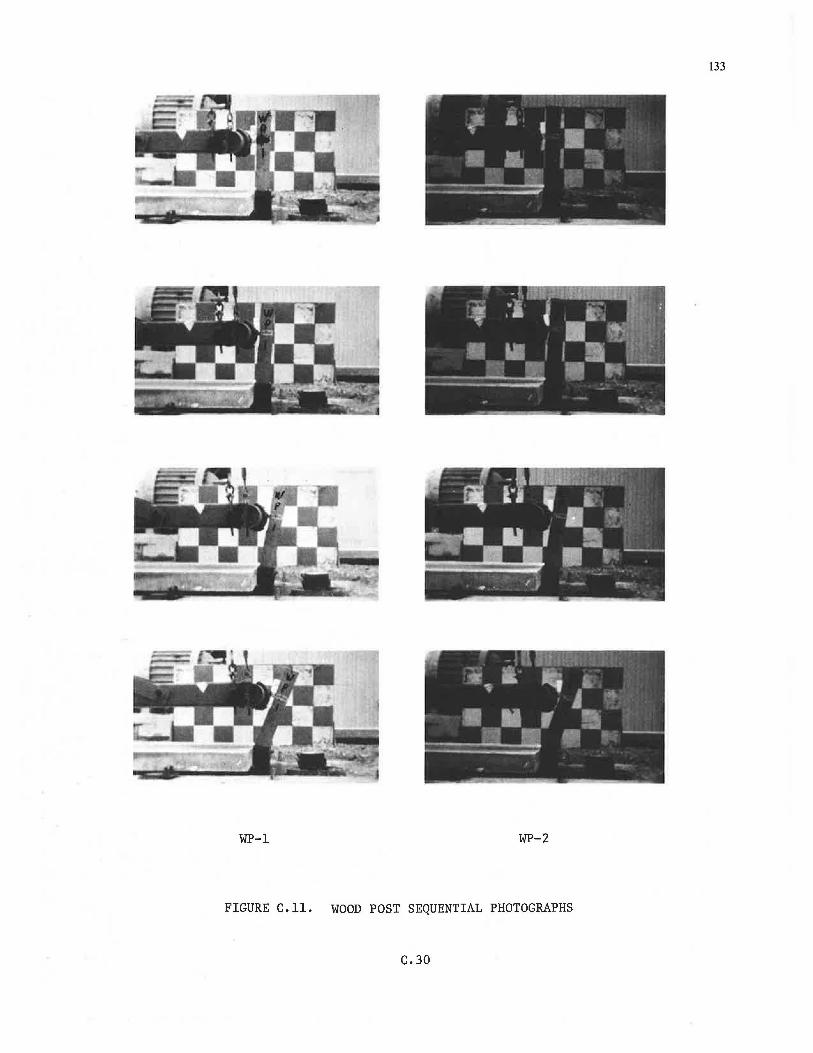
-1• tlJl!IJI . . .. {' ' :
:i ' -~--.-.fit) • 'i°T!!~ • ... . ""J'r·.
H• Ii !Ii.··'· -··c-c ~ t-i(
WP-1 WP-2
FIGURE C.11. WOOD POST SEQUENTIAL PHOTOGRAPHS
C.30
133
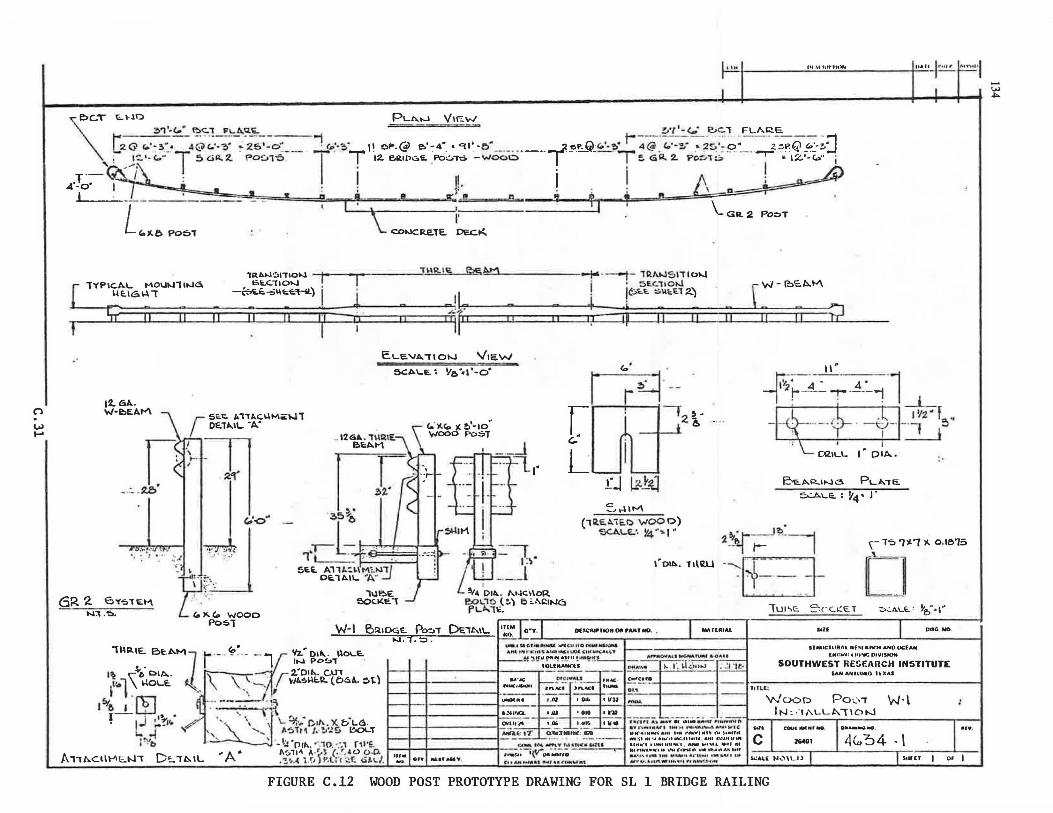
n w I-'
~I j~Mh•~·"~ I"•" 1~F' I
_ __ ;!)_'l_'·~· P.>C."f F\.-6.Q.E.. j- !.'I'·<.,; f!.,C., FLARE.
'\
c.T ~1-Jo PL~....i V1Ew
C2G r..·:~:· .s~il- ~'-"?.:·-~-;~--;:o~ -- :!_c..:·~· p 5P.@ e.'·4·. • 91' -o· --·-----_,.}~P·~-"··~· ~@. i.'·?.· 7i~;~-~~=--z-=-~Q f->~·;J ~_!~'- c..· T 5 GA. 2. Po::..1-0 I T 1:2.. e.R.1Du!E. ,Po:.:.-r::;. -wooo ! Tj !. GA.. :2.. f'G:0.1" $ I '" IZ'·C.." .k
4·!~-:- ,-f..\ j • : ! !!· ! . . /\ ~~~ I i ' -- !- - t 7==r+· e :'5 .. n • 't ' T .. - .
L 7= I' j \_ Gil. 2 Po:>T
'-11.b POQ'T : ' \_ CD>.ICllETE. DE.c...:..
lR.AoJ':>l"f10"1 I • 'HIR.. I E eisii.M ~---4- 1RMJSl"flo...i f WP•<"'- .. ~,,...., • -~"'°~ . I ,. . 5E.C.'TI0"1 ( w - IOSb."'\
"'""~' --·~ ..... ~)I ~ 'f . !"'' """'21 r;;: ii 0 LI ii a iii 'i' ~ ~·~ ~ ~ ~ ij ii 5 ii ii ii ;:;i
12. 6A.W·t>EAM r S::.1'. A"f"ft.C.\.\MO.-hll
DE.1 ... IL 'A.'
__ ,fflll <,,.'<:>~
ELE."A."TIO\..J \/raw 5CAl....E ~ ve••• '-o"
.• 12 GA. . i\.112\E: e.~i>.M --rn.=.__J
.:i_,.
I" ~~· [~'2!>· ~ 6
L i Ll ~.!:~ · ~1-llM
("fltE~iE.D 'vJOOO) 5<:.A.1....E..'- 1'4'·-..1.
11' ·1 -P--·- 4• ~· _L-t------i _L
r } - ~ 1_ ,,,. r,,. +t--': - 'i'- 2-J
r CfllLL 1 • DIA..
P->1:.A.R.l>JG PLA."TE.
e.:.ALG:. : ~4 • J"
~~"" 2~~~~
·:11~.-... + ,-To;. 1~'1 l(. o.1e15
..
GR 2. 6Y-:.1Et"\
-~~l 1 ..... .. o.~::-._.
,\.IP.>E SOC.KE!
N:t .';>. t·~-:-(o wooo Po~l W-1 BQ.1DGE. Po~'T De:.,~\\..
IJ.i.-;::,. i"lllE. "'- A..,. '-" '
r.Jt ~•1 t-- ·- · . ·· - ~ ~ Yz. Oil... 1\0\..1:. I IN PD~'T •
I~ ~O· OIA. · 2.'01,!,,. C.U, litol \ ~01...E:.° ~. \ \ ->-.. ,' r WA.~~U:.R.(OG.A. ~l.)
!>t. • fhl - · ··--'·i?. I & _.!_ L..:;:J . ~ . r.-:.\
f tj ~!'11o· 6'' ~- \ ·, \_ ~ .. • C,1/1. , ')( b"L6. -I 'ir , , ' , "-~Tr'\ /. · ~".l!> l.X>L.T
IUM t..:O.
Q'Y,
1' DIA.. t 1UU..l
OHCRIPTION Olll PARJ HO • • MArlfllAL
~At_&~..,_C.,a-"1•
~····y, .. =fill::.:,-;;:;-
0 lUl'>E. 5r-C.~E: T ::>C.A.I.~ : ire:·• I"
.... DWG NO.
SlMUC1llAAl Rfsr•nr:H ANO OCEMt lNlilNI l 111~ DIVISION
SOUTHWEST RE!;EARCH INSTITUTE: IAN A~UlNO llXAS
TITLE:
Wooo Po~"T W·l - -·--- ~--- . -· .. .. IN: .'t/\LLl>."'TIOt-J
t•(flt A"....,.,. ... •UHl•llllV fl l•t¥11ll•ff' " " .,., • .,.., , .... ,,.. '*'"'''-1"'·~ ••t11v1c •""!"*"A.Ml 1•16 l'lk~Mt'f Ill ~•ITH M !O I ........ ~·01~. JllHU , •HI r..!.&"JI ... HM1t'I tl'frflltM ... , , 1WiMa ~1\1~ lltlH .. •t rt1111t•1111:1 n 11M C••ll n •Mil 1r.-.11• AS,..,
..,, c
COUt: .... , llO, I .. ._..,UllO
1'401 4Cu~4 - I .....
I!\'" · • ' -'·:S"pr/\. ".io.-: ,1 r,1•e.. I I I I -~'"'"':'?!.~~ .. .. f\~111\ A ·'~ (. . .. .. (.) 0 ·'2 IHM ,, .. ~. •(Y'" &NIW\rtO A,, hC.llt-'lt;;_tJ"'T D'=.., b..\L A .'!,1, ,4( 1.r1 r P .. t n -=:.f.. bl.t../. lllU. OIY ... ., ... y "'...,. .. ,,.., Mh•ll"<>'lllJ•~ ........ ~ 11• .................. , . ,, ...... ·- .... , • ·-...... ...... ""'"'" .. ""' " .... .,..,.., .. o• I 5':AU ... .._"'l\. I) SIHCT
FIGURE C.12 WOOD POST PROTOTYPE DRAWING FOR SL 1 BRIDGE RAILING
-w
"""
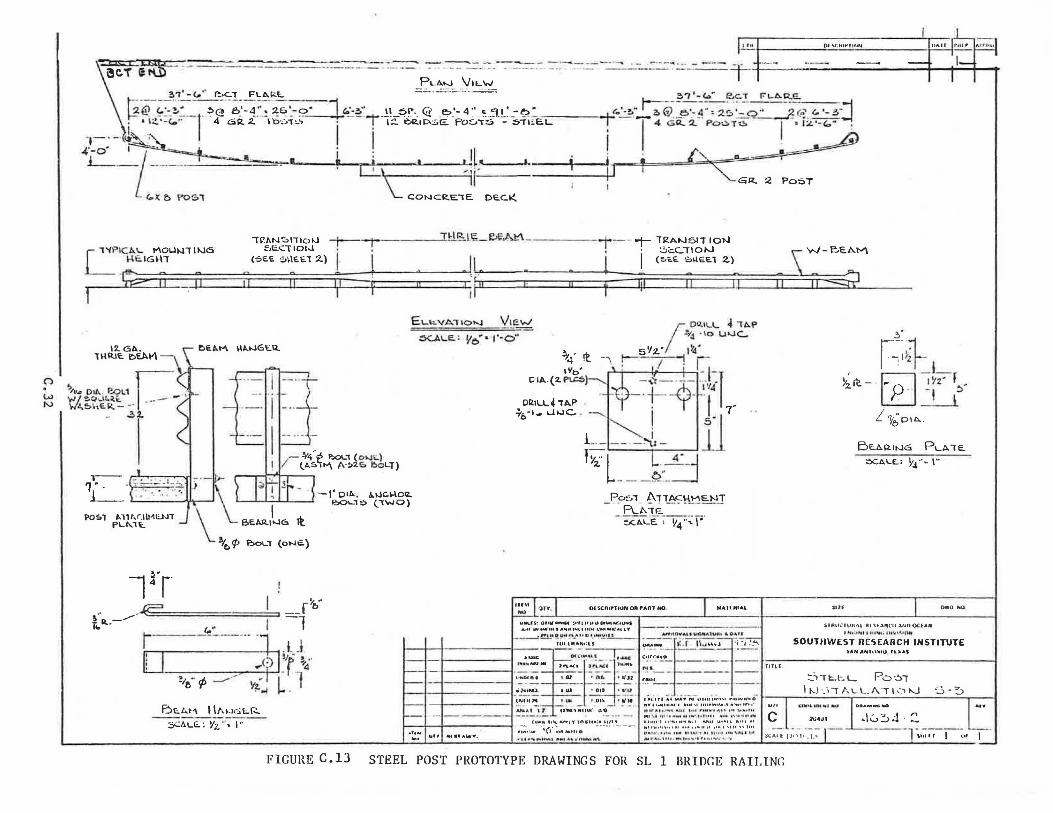
() . w N
... ru v.~ ... ,,,,..
'f w - ---- ------ ·- ·- - ··--· -· ---- ------·- -----·---1 PL.i.....i V1c.w
~ - -- -----------~ · - - ~- -· ~ -- --·-- -·
3,'-<.'" l!·C."T FLAi;:.~ =-'---=--=--------= ~'7 1 -<o" ec:T Fl-ARE.
~Q ~~~.:___= _ ~@ -~~·-.r·!-~&~-9· J '-.'.:~: . .!!_5r._ Q e._'- 4 .. " __ ':l_!_'.:~ • . <..'-?>·~@:~e'.-~: = 2~·'.=--~-_-r_,.-~_-<..-.---~-J j •I:!. ·-c.." l 4 GR. 2. \\:":.;:..~ · ! I~ ~11:>.sE. Po~,-:;, - :>-r1~C.L ! I 4 GQ.. Q.. Po-.:.T~ I • l::L ·-~ ·· :
-,- ~~ I I I · 4·-0· ~~.. . . !l . . ~ L__i_ --.-._... a. I ~ ct; I t . ,• l.. ; • I
\_ :·n I GR. :2 Po::>T
G.)( f> f'0$1 CONCl<:.EIE. DE.C.K I
1r.1o.~~rr101-J I • 1· 1~ 1 r-11;?;_f!>t?~ -r- . '"I- "Tl2AIJ51T 1ot-J r "l°"PICA\.. t'\OLJi..nl~c5 ~,E.c;:.l"IDl-.1 • • _· · ~'=:.C..llD"-1 \ W-eE.A.M
L_ ~~•GH, '°'' '""" "-l I I ll.. • . I I '"" ""m ". l -i;p.- a p jj jj y ,; ; If II I• II t ,,, 11 11 11 a ~
ELt:.VA,"IO'-J V1r=...,..,,
f Oil.ILL .j "!AP
.?v.i -10 u....ic..
12.GA. ""-"-16\::.R. ntlt!E. ~EAi'\ -\
.,/11<> 0111. . e.o1.i ~ ' w I ~q,_1r.;i.~ -- - -N'.t..:=.l\E.R - - .
.32.. -·llj I _ ~4··~ P..ol.., (o>JL}
I lA5'l""'\ /\·"'2'0 &oLT)
\ ~ ,~ , t 1-r- - I" 011>. A.IJC.MOIZ.
P0~1 "-llf,rJll'IUJT Pl..t..ll::.
\
\_ BE.11.R.1...ic:. ti
3/C> <P e.01..."1 (o...i.;.)
-1rr· ! I ~ -.. ,.(E __ f e.
l 11..-- I I ... r ~:. ____ -~ ----~------1~1 - t J LJ , .. g~'f_ ~4··
?te·· ¢ -~ v?..j L . l B1:.t..t1 i\t,1..J61o.r.:.. ~IL1..I:.: Yi.. • 1 •·
e.o1....1;, (._"lWO)
~LE: Vo' L·r ·-o·
v 1. 5 'l:z: 1~s'
i----- -1 r : I . I I
-;,'t-----' ·1 1'14
• Orl1LL4 "I AP ,-. +-- -A. . f 7'0·1 ... L.hJC. . 1· I 7'
~-1
'"b' t:IA-(2.~)
IUl\1) 'ln'
"''
L.- -- - -~ - Jl lY,:-l =_j. 2. ---
---~·-
P~,, ArrACl-\VIE.NT - . F\..t-.=TE. -··· -- - --;z-~LE:° ~~:.:r·
otscnu•JJON DA rAnl friM) MAllMIAL
••Jf\.15! 01Hr"1'ftU' ~flUll~O. ... ll'rt!:U,lof!fl
.aoU '"" IM. "' I A ... 111"'("1 llUt CHI .. K. . ... I "'f
.. u1c - -CJt ;:"""''! - _1,,1.-.c: . c~1-;;, •~o --·- = flfl( ;
r~:.+_I_ ~ l~z· r .. !t~it--~~!>
""
! 7f;o1A .
Be.AR.lt-J6 p._A "IE.
::>cAl..E.: y~ ... \"
DWO HO
SlfHli;"IUlll\l Al ~l~"Cll ~Nn OCl.fi ..
t N o, 1folt t IU'"t1, U1 Y1 0,1nN
SOUTHWEST RESEARCH INSTITUTE SAN A~11l:"llllJ . IL)IA.S
· =·~:,'f;:~.~ .. ; .. ·-~-.. .....~.-I"·t;~ .. ;~~:·~: .. ··~ . ..; ....... 1
"''""":00.Mlll :lf'L..Ct ~"~4JIUH5 NL.
--!-------< - · - --;-;;-- ~~~- ···i_i;- r.~.u - ---== =t ~:.,IC.L--L Po·~j
--+-------!;;.:,~ ~; - : ::: _.:~;~ - ~=·:.'..!.~:,_w,•~.~S",:::~::'.::::.::~·~;~ .~- 11'.J ·_q f , LL/\ 11.:.> "-.J "3 · ~ ,_,.i"-l 1. J ' U'Wla,HUlll '. IL'Q 11 u- ... 1 ..... "' 11110 l u t .-.u .. · 1°'" , .. '° "' "' --'"'-· · - --- - l"ll '"; f ott • • " '"'' ' ..,1•1"11 ' "' ...... •+ Ot<t
11".0l.H h1'.A>T1Y1f\1Ua:a .. 11t'I !011111 I ••' .. •l"I""'' l\floU :.11A11 ""'''Ill c ~IG~.:1- ~ 2641.11
~(;.All I l•) I•. I. ' ~:: .... .- .. ,{,,· : ......... u • ·--- - -- =~:_;:~·::~: '/,'.., ·:::: .... ·"4·~:· ,::::,' ::::~~:::~ l '",;:;-;- 1 ·:1f·- ,-· .,,, I ,_.., "'t.a""'. ....... ... , .. ,.,_, ..... ., ... ....,,.., ,.,. ,,. ... ,~ , ................ ~ ........... ·~
FIGURE C.13 STEEL POST PROTOTYPE DRAWINGS FOR SL 1 BRIDC.E RAILINC
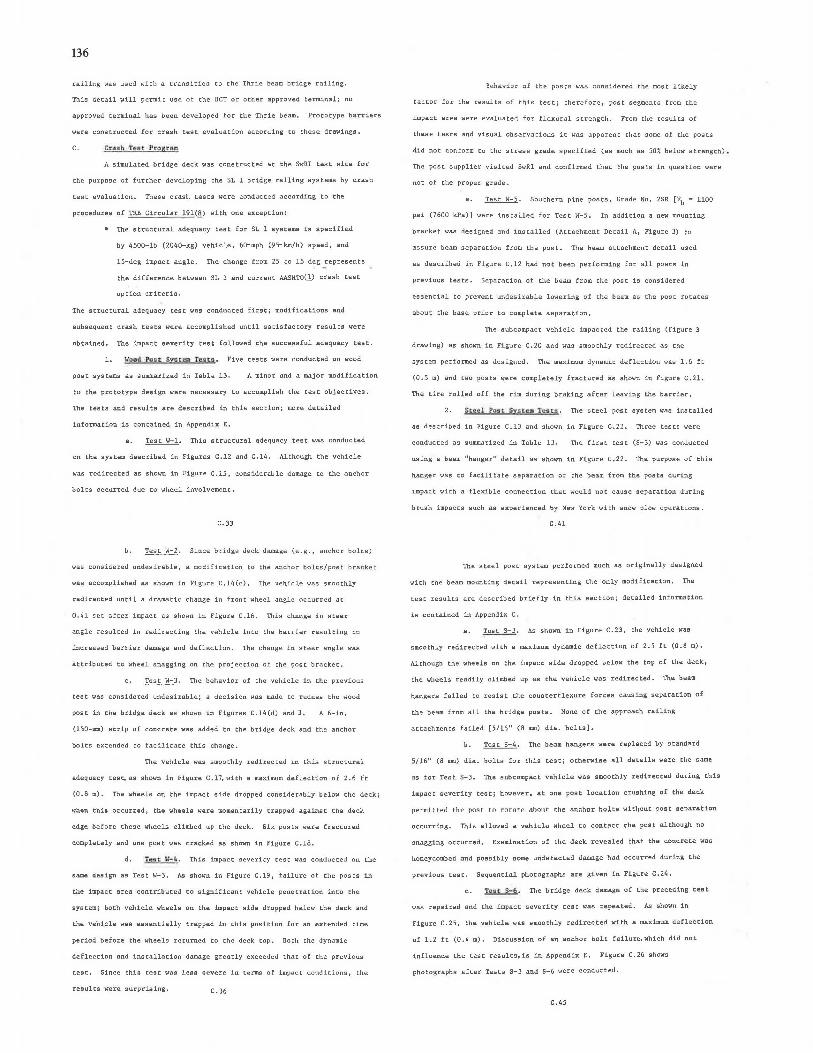
136
railing was used with a transition to the Thrie beam bridge railing.
This detail will permit use of the BCT or other approved tenn.i.nal_; no
approved terminal has been developed for the Thrie beam, Prototype barriet's
were constructed for crash test evaluation according to these drawings.
c. .Cruh Tttlit Pror;,nni
A simulated bridge deck was constructed at the SwRI test site for
the purpose of further developing the SL 1 bridge railing systems by crash
test evaluation. These crash tests were conducted according to the
procedures of TRB Circular 191(8) with one exception:
• The structural adequacy test for SL 1 systems is specified
by 4500-lb (2040-kg) vehicle, 60-mph (95-km/h) speed, and
15-deg impact angle. The change from 25 to 15 deg represents
the difference between SL l and current AASHTO(!) crash test
option criteria.
The structural adequacy test was conducted first; modifications and
subsequent crash tests were accomplished until satisfactory results were
obtained. The impact severity test followed the successful adequacy test.
1. 1lood fo11t_ Sy&tl!e1 Te.!ilta, Five tests were conducted on wood
post systems as summarized in Table 13. A minor and a major modification
to the prototype design were necessary to accomplish the test objectives.
The tests and results are described in this section; more detailed
information is contained in Appendix E.
a, ~· This structural adequacy test was conducted
the system described in Figures C.12 and C.14. Although the vehicle
was redirected as shown in Figure C,15, considerable damage to the anchor
bolts occurred due to wheel involvement,
c. 33
b. Test W-2, Since bridge deck damage (e.g., anchor bolts)
considered undesirable, a modification to the anchor bolts/post bracket
was accomplished as shown in Figure C.14(c), The vehicle was smoothly
redirected until a dramatic change in front wheel angle occurred at
a.Lil sec after impact as shown in Figure C.16. This change in steer
angle resulted in redirecting the vehicle into the barrier resulting in
increased barrier damage and deflection. The change in steer angle was
attributed to wheel snagging on the projection of the post bracket.
Test W-J. The behavior of the vehicle in the previous
test was considered undesirable; a decision was made to recess the wood
post in the bridge deck as shown in Figures C.lli(d) and 3, A 6-in,
(15a-mm) strip of concrete was added to the bridge deck and the anchor
bolts extended to facilitate this change.
The vehicle was smoothly redirected in this structural
adequacy test, as shown in Figure C.17, with a maximum deflection of 2.6 ft
(0.8 m). The wheels on the impact side dropped considerably below the deck;
when thiii occurrad, the. wh&liilfil ware. momentarily trappad against tha d&ck
edge before these wheels climbed up the deck. Six pas ts were fractured
completely and one past was cracked as shown in Figure C .18.
d. TG!lt. •-IL This impact severity test was conducted on the
same design as Test W-J, As shown in Figure C.19, failure of the posts in
the impact area contributed to significant vehicle penetration into the
systemj both vehicle wheels on the impact side dropped below the deck and
the veh:t cle was essentially trapped in this position for an extended time
period before the wheels returned to the deck top. Both the dynamic
deflection and installation damage greatly exceeded that of the previous
tes t. Since this t es t was l ess in terms of impa ct conditions• the
results were sut"prising. C.36
Behavior of the posts was considered the most likely
factor for the results of this test; therefore, post segments from the
impact area were evaluated for flexural strength. From the results of
these tests and visual observations it was apparent that some of the posts
did not conform to the stress grade specified (as much as 5a% below strength),
The post supplier visited SwRI and confirmed that the posts in question were
not of the proper grade,
Test W-5. Southern pine posts, Grade No. 2SR [Fb"" llaO
psi (76aO kPa)] were installed for Test W-5. In addition a new mounting
bracket was designed and installed (Attachment Detail A, Figure J) to
assure beam separation from the post. The beam attachment detail used
as described in Figure C,12 had not been performing for all posts in
previous tests. Separation of the beam from the post is considered
essential to prevent undesirable lowering of the beam as the post rotates
about the base prior to complete separation.
The subcompact vehicle impacted the railing (Figure 3
drawing) as shown in Figure C.20 and was smoothly redirected as the
system performed as designed, The maximum dynamic deflection was 1.6 ft
(0.5 m) and two posts were completely fractured as shown in Figure C.21.
The tire rolled off the rim during braking after leaving the barrier.
2. Stcitl Po!tc !:iiy!itl!m Te:au . The steel post system was installed
described in Figure C.13 and shown in Figure C.22. Three tests were
conducted as summarized in Table 13. The first test (S-3) was conducted
using a beam "hanger" detail as shown in Figure C.22. The purpose of this
hanger was to facilitate separation of the beam from the posts during
impact with a flexible connection that would not cause separation during
brush impacts such as experienced by New York with snow plow operations,
C.41
The steel post system performed much as originally designed
with the beam mounting detail representing the only modification. The
test results are described briefly in this sectionj detailed information
is contained in Appendix C.
Test S-J, As shown in Figure C.23, the vehicle was
smoothly redirected with a maximum dynamic deflection of 2.5 ft (a.a m).
Although the wheels on the impacc side dropped below the top of the deck,
the wheels readily climbed up as the vehicle was redirected, The beam
hangers failed to resist the counterflexure forces causing separation of
the beam from all the bridge posts. None of the approach railing
attachments failed [5/16 11 (S IIDll) dia. bolts],
b. ~· The beam hangers were replaced by standat:d
5/16" (8 mm) dia. bolts for this test; otherwise all details were the same
as for Test S-J. The subcompact vehicle was smoothly redirected during this
impact severity test; however, at one post location crushing of the deck
permi tti;>rl thP pni:it tn rntatP. ahout the anchor bolts without post separation
occurring. This allowed a vehicle wheel to contact the post although no
snagging occurred. Examination of the deck revealed that the concrete was
h.oneycombed and possibly some undetected d~ge had occut"red during the
previous test. Sequential photographs are given in Figure C.2Li.
~· The bridge deck damage of the preceding test
repaired and the impact severity test was repeated. As shown in
Figure C.25, the vehicle was smoothly redirected with a maximum deflection
of 1.2 ft (0.4 m), Discussion of an anchor bolt failut:e,which did not
influence the test results, is in Appendix E. Figut:e C,26 shows
photographs after Tests S-J and S-6 were conducted.
C.45
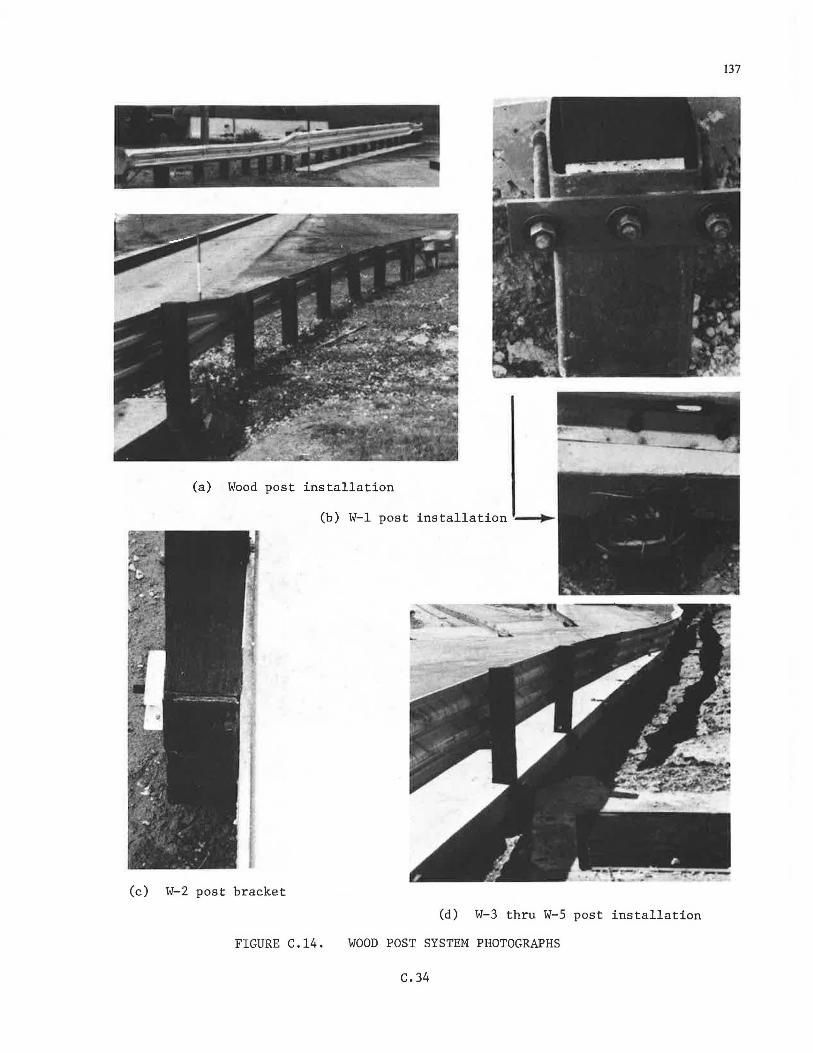
(a) Wood post installation
(b) W-1 post
(c) W-2 post bracket
FIGURE C.14.
(d) W-3 thru W-5 post installation
WOOD POST SYSTEM PHOTOGRAPHS
C.34
137
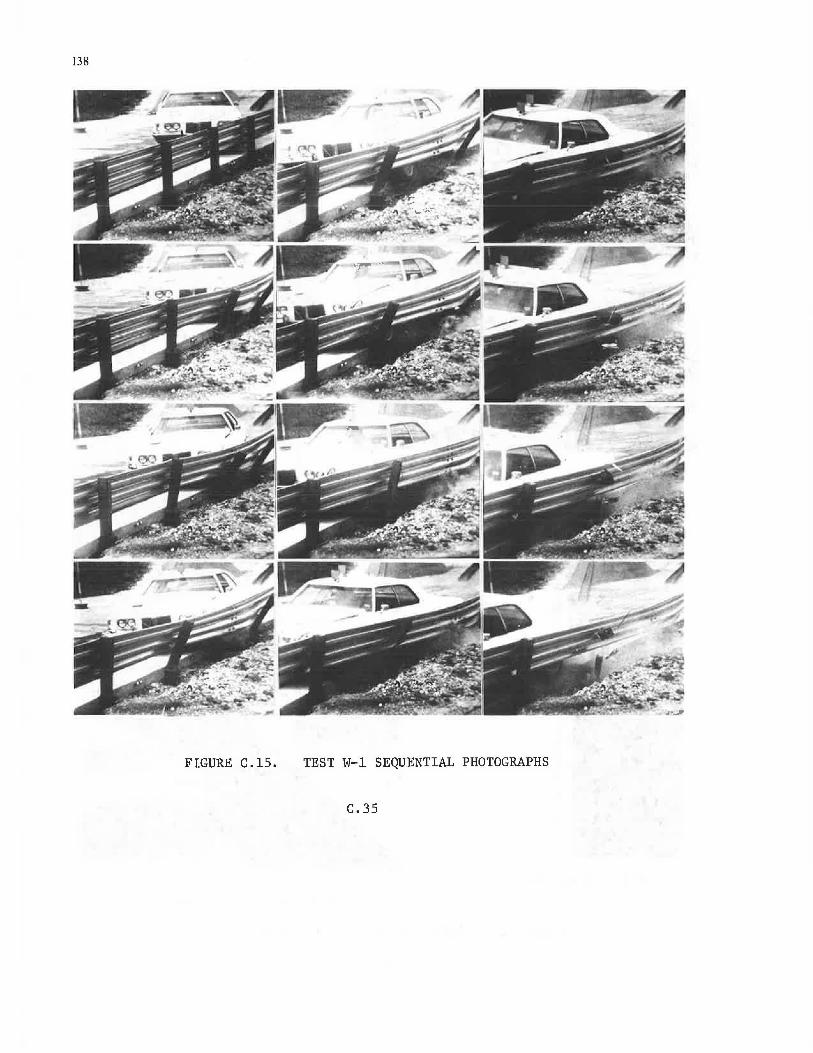
138
FIGURE C.15. TEST W-1 SEQUENTIAL PHOTOGRAPHS
C.35

FIGURE C .16. TEST W-2 SEQUENTIAL PHOTOGRAPHS
C.37
~ NOTE: Change of vehicle direction from previous photo.
139
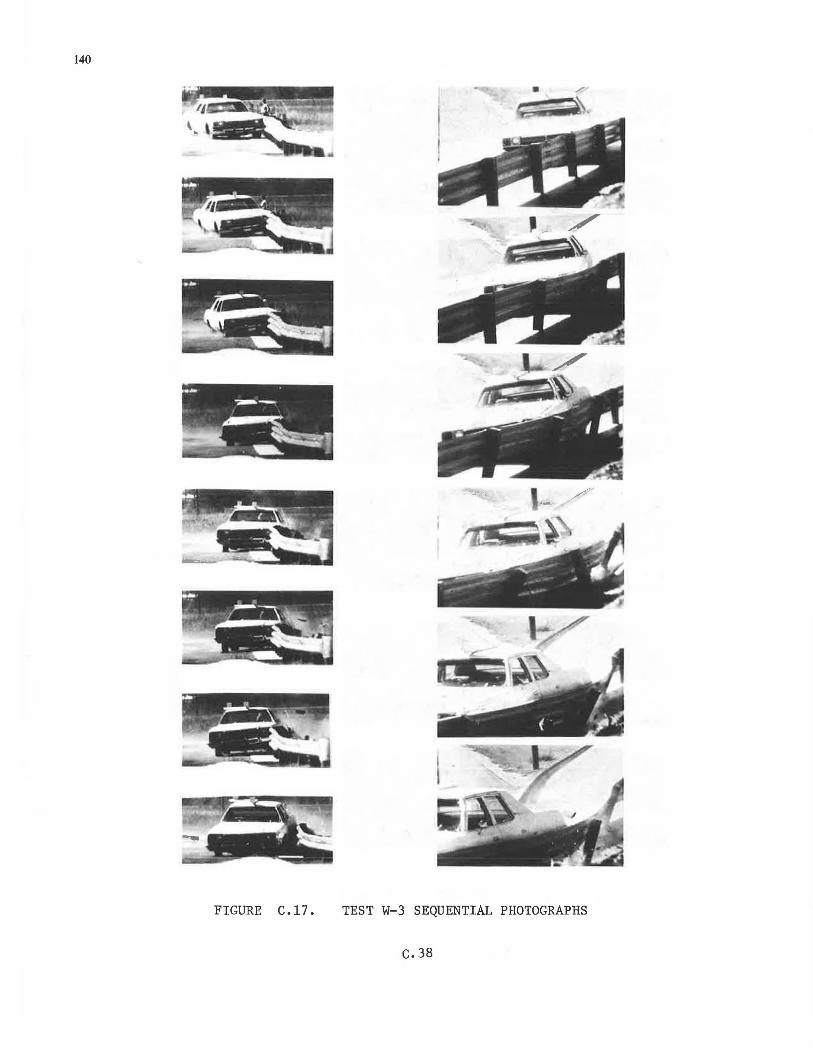
140 . /·
... . ----, - -~
FIGURE C.17. TEST W-3 SEQUENTIAL PHOTOGRAPHS
c.38
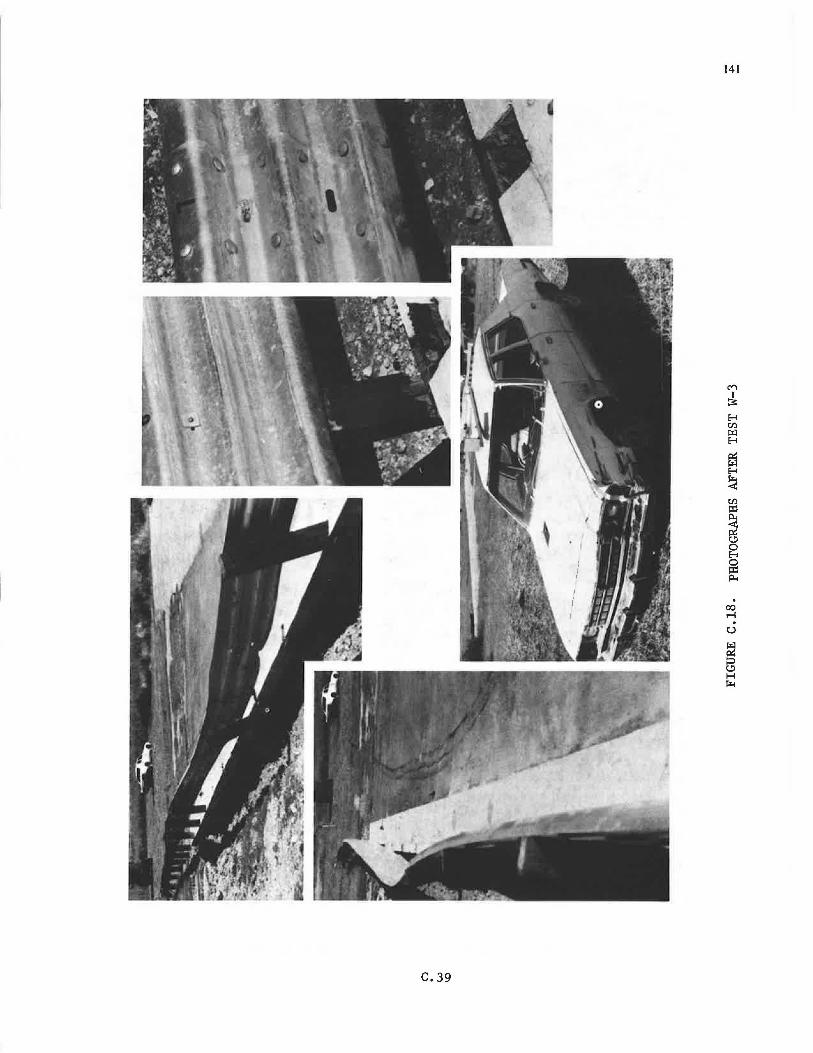
C.39
141
. 00 ..-l . u
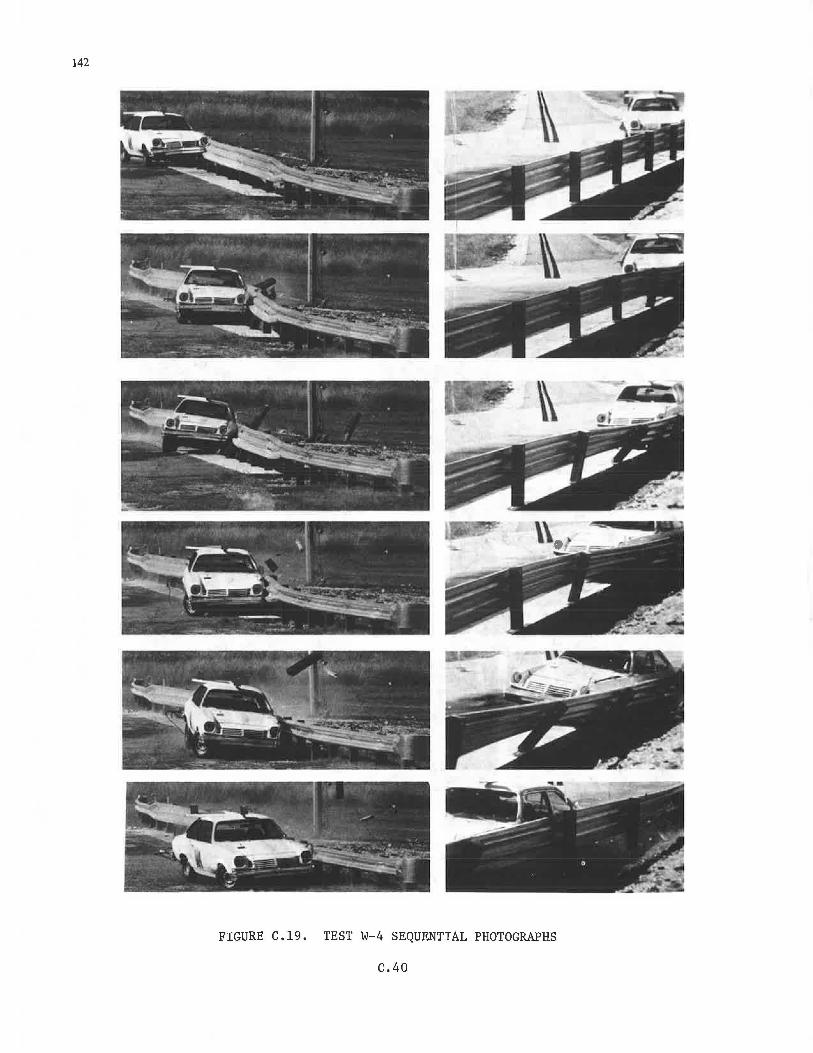
142
FIGURE C.19. TEST W-4 SEQUENTIAL PHOTOGRAPHS
C.40
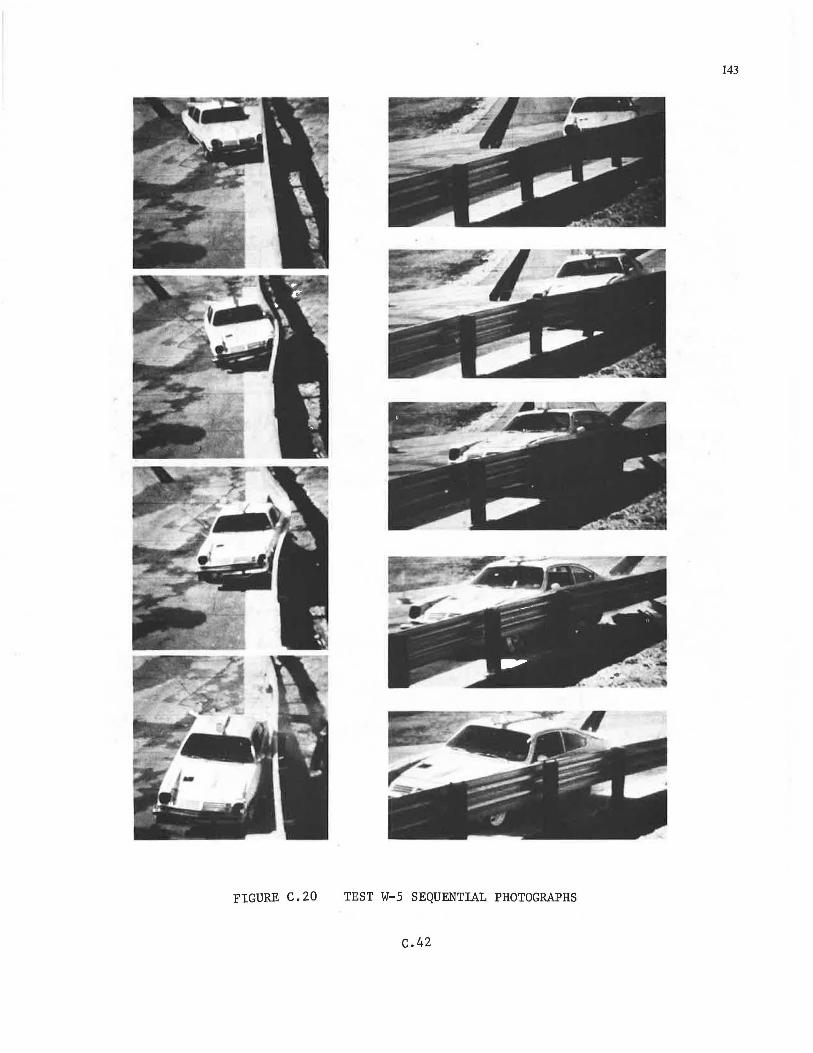
143
FIGURE C.20 TEST W-5 SEQUENTIAL PHOTOGRAPHS
c.42
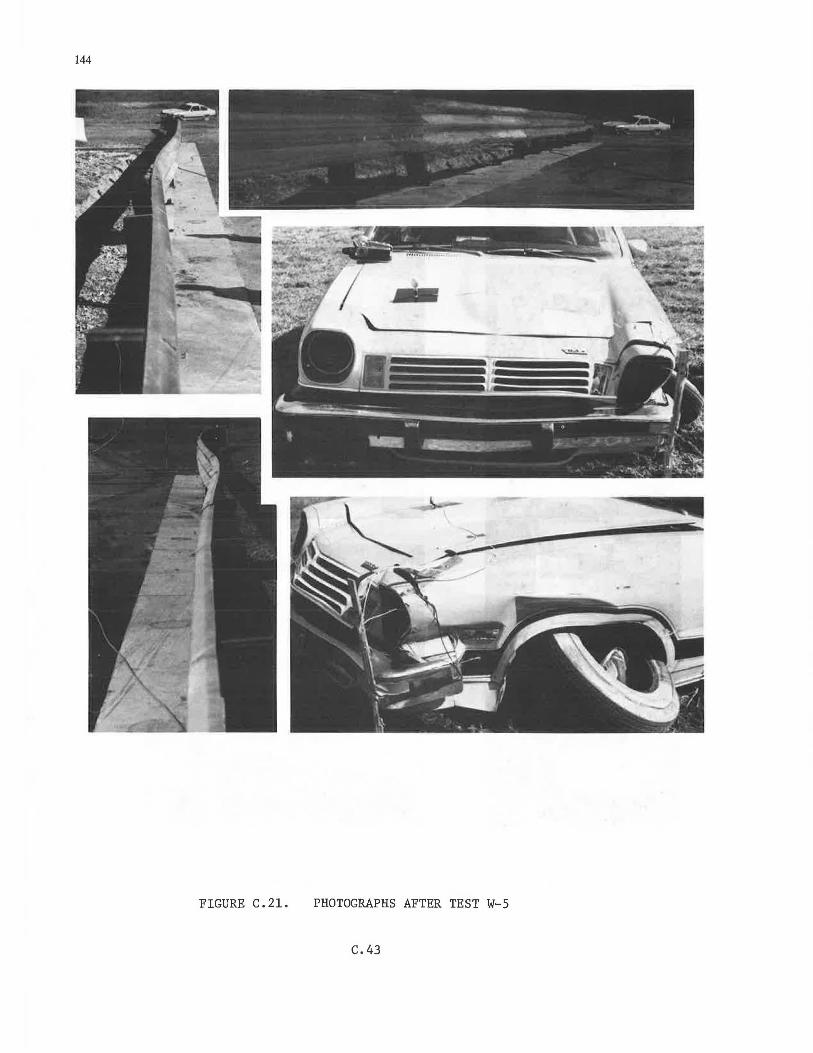
144
FIGURE C.21. PHOTOGRAPHS AFTER TEST W-5
C.43
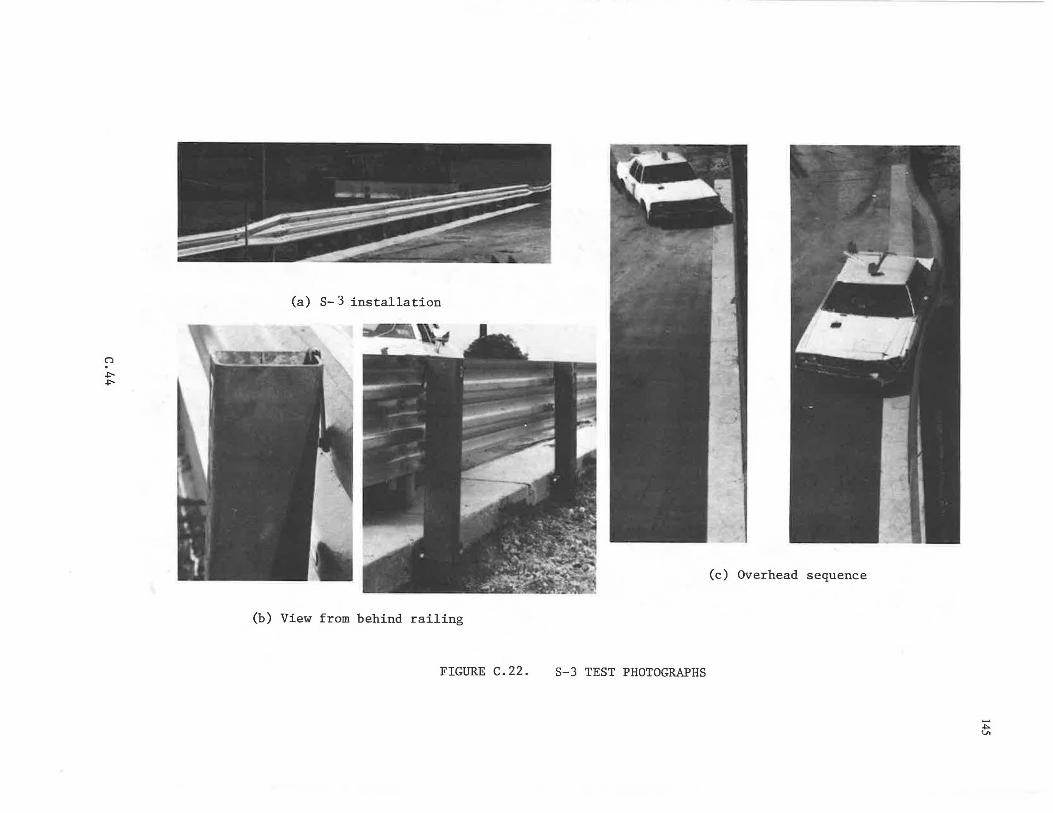
C1
~ ~
(a) S- 3 installation
(b) View from behind railing
FIGURE C.22.
(c) Overhead sequence
S-3 TEST PHOTOGRAPHS
-~ v.
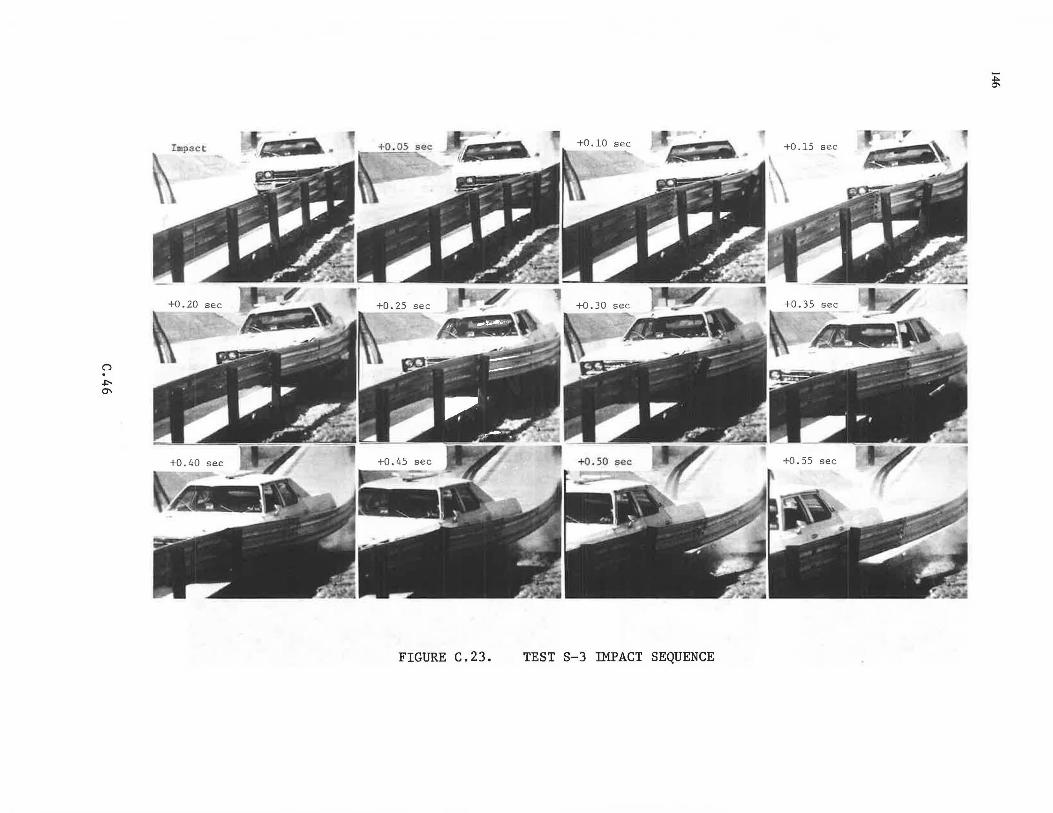
(")
~
°'
FIGURE C.23.
~ O'I
TEST S-3 IMPACT SEQUENCE
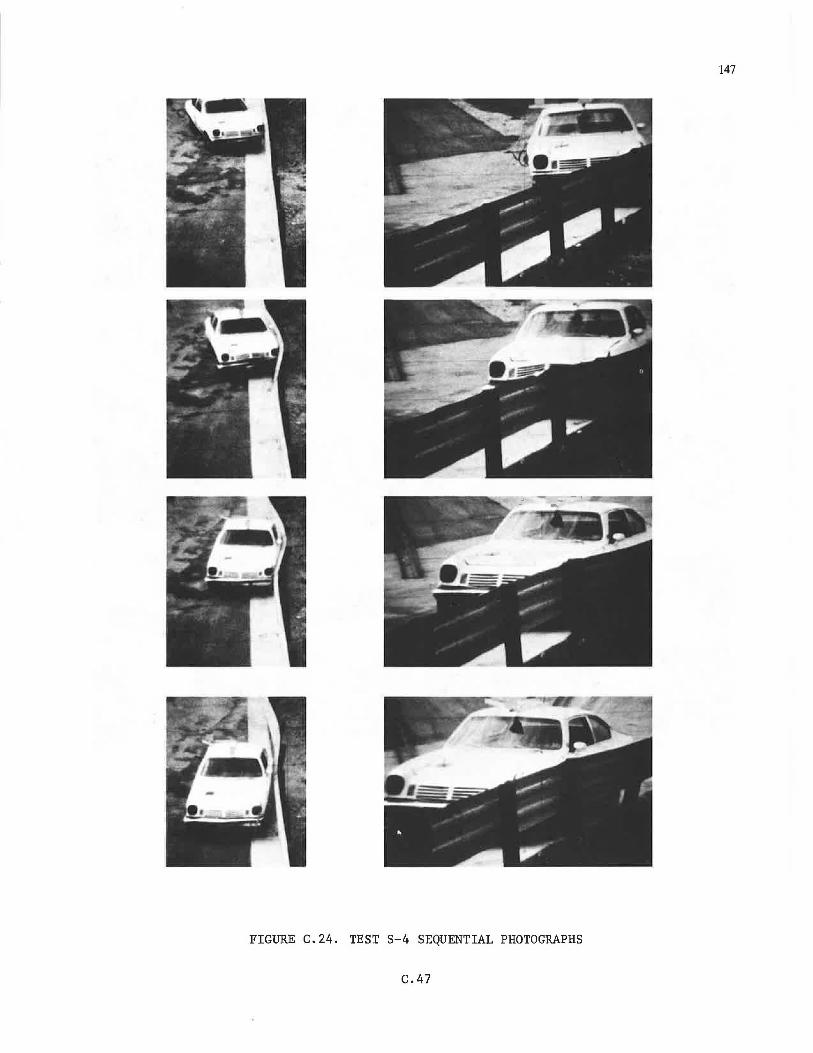
147
FIGURE C.24. TEST S-4 SEQUENTIAL PHOTOGRAPHS
C.47
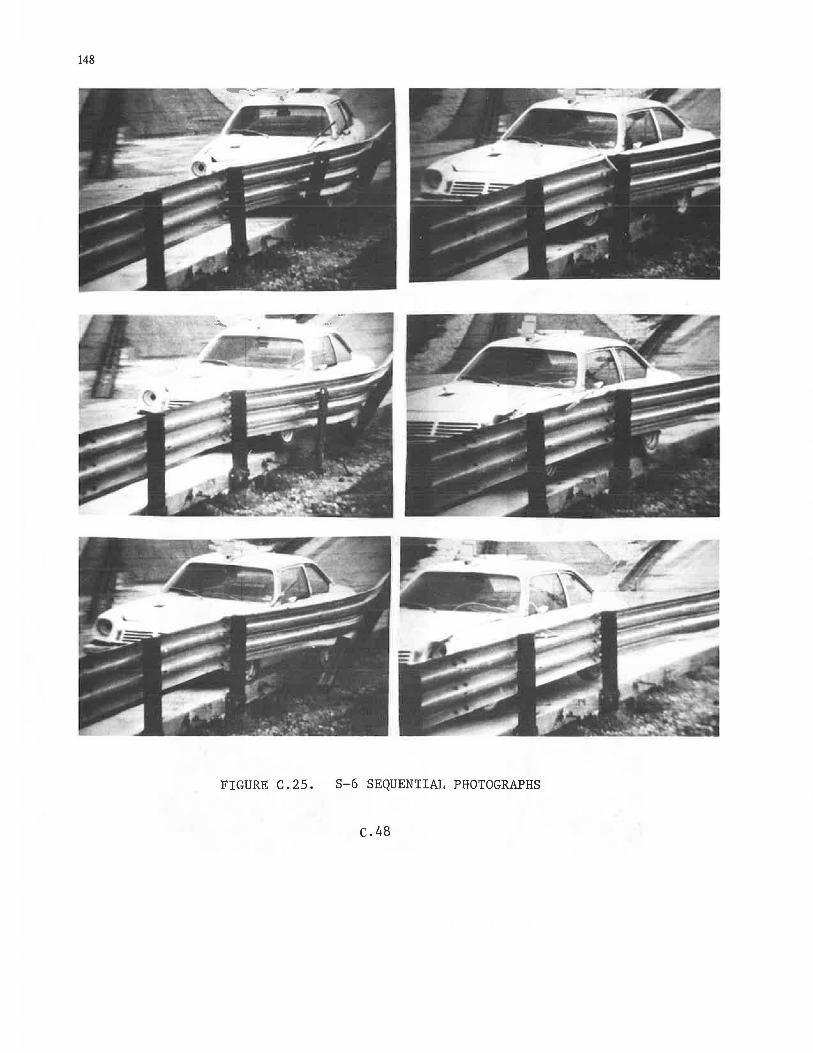
148
FIGURE C.25. S-6 SEQUENTIAL PHOTOGRAPHS
c.48
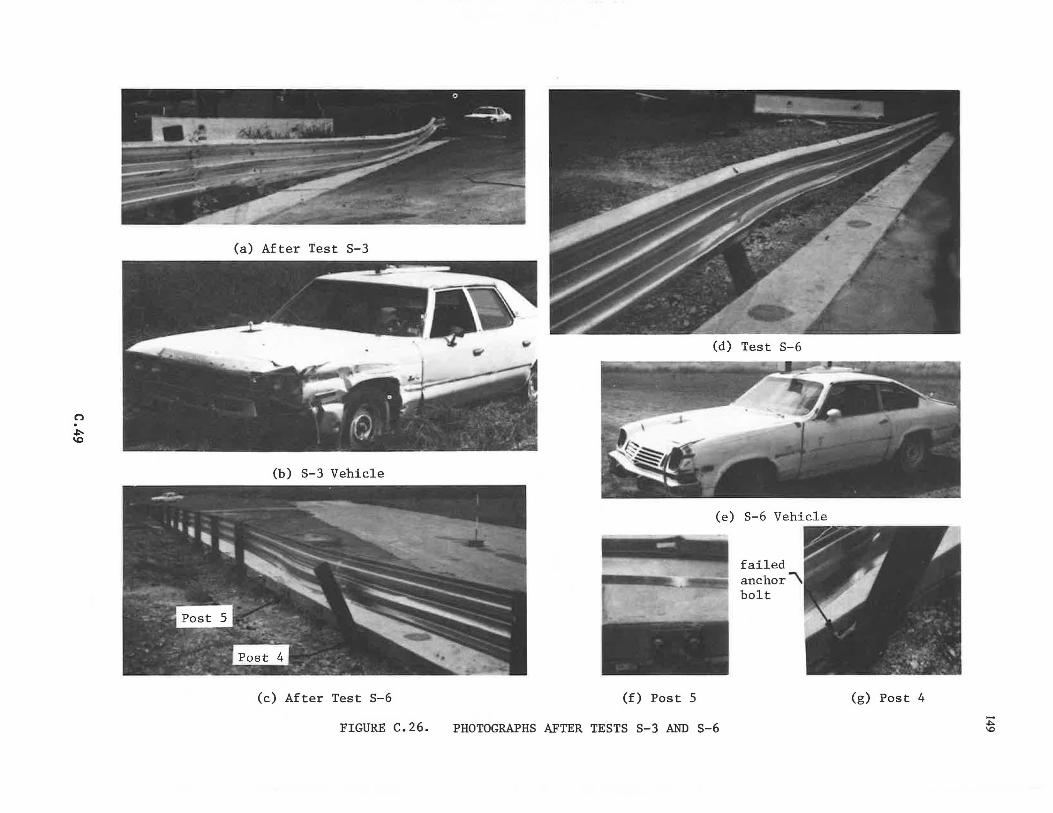
(a) After Test S-3
n . ~
'° (b) S-3 Vehicle
(c) After Test S-6
FIGURE C. 26.
(d) Test S-6
(e) S-6 Vehicle
(f) Post 5
PHOTOGRAPHS AFTER TESTS S-3 AND S-6
failed anchor""\ bolt
/ -/ ~
/~ ... . '
-.;_ ....... (g) Post 4
'.;;: \0
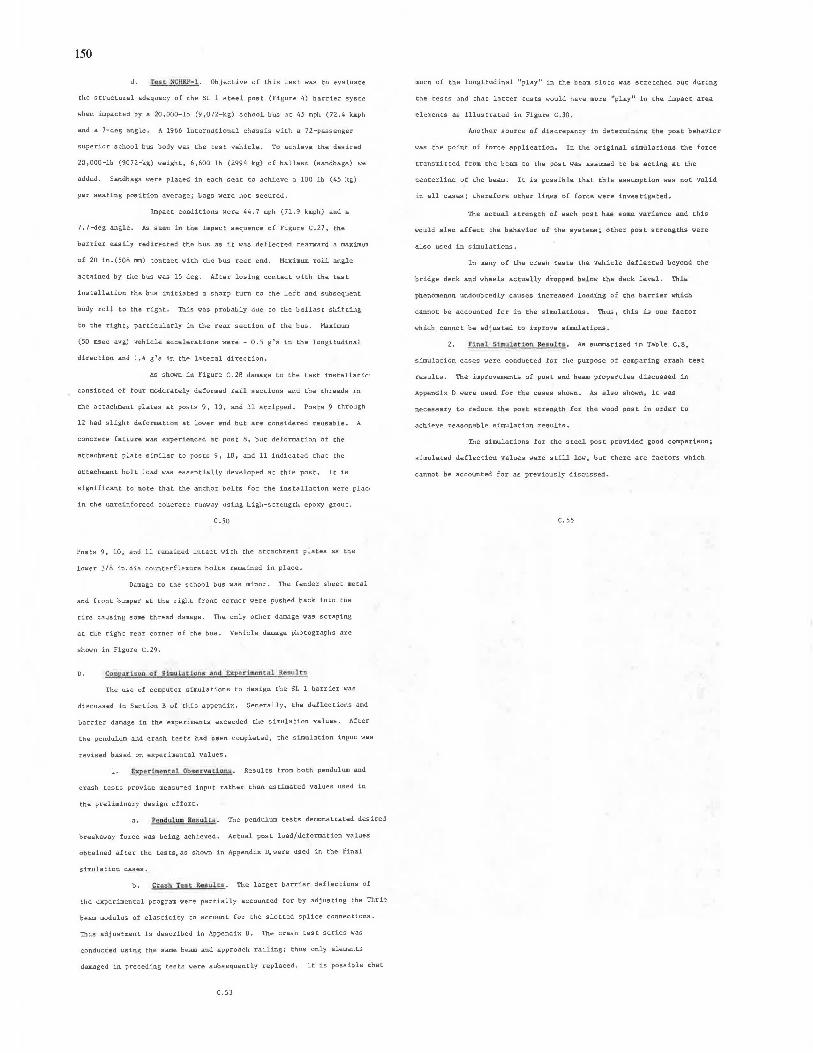
150
d. 'to.li t ~CmW-1. Objective of this test was to evaluate
the structural adequacy of the SL 1 steel post (Figure 4) bat"rier syste
when impacted by a 20,000-lb (9,072-kg) school bus at 45 mph (72,4 kmph
and a 7-deg angle. A 1966 International chassis with a 72-passenger
superior school bus body was the test vehicle, To achieve the desired
20,000-lb (9072-kg) weight, 6,600 lb (2994 kg) of ballast (sandbags) we
added, Sandbags were placed in each seat to achieve a 100 lb (45 kg)
per seating position average; bags were not secured.
Impact conditions were 44, 7 mph (71. 9 kmph) and a
7.7-deg angle, As seen in the impact sequence of Figure C.27, the
barrier easily redirected the bus as it was deflected rearward a maximun
of 20 in. (508 mm) contact with the bus rear end. Maximum roll angle
attained by the bus was 15 deg. After losing contact with the test
installation the bus initiated a sharp turn to the left and subsequent
body roll to the right. This was probably due to the ballast shifting
to the right, particularly in the rear section of the bus. Maximum
(50 msec avg) vehicle accelerations were - 0 .5 g 1 s in the longitudinal
direction and 1.4 g 1 s in the lateral direction.
As sh.awn in Figure C. 28 darnai;i:e to the test installatfo1
consisted of four moderately deformed rail sections and the threads in
the attachment plates at posts 9, 10, and 11 stripped, Posts 9 through
12 had slight deformation at lower end but are considered reusable. A
concrete failure was experienced at post 8, but deformation of the
attachment plate similar to posts 9, 10, and 11 indicated that the
attachment bolt load was essentially developed at this post. It is
significant to note that the anchor bolts for the installation were plac·
in the unreinforced concrete runvay using high-strength epoxy grout.
C.50
Posts 9, 10, and 11 remained intact with the attachment plates as th.e
lower J/8 in. dia counterflexure bolts remained in place.
Damage to the school bus was minor. The fender sheet metal
and front bumper at th.e right front corner were pushed back into th.e
tire causing some th.read damage. The only other damage was scraping
at the right rear corner of the bus. Vehicle damage photographs are
shown in Figure C. 29.
D. Ccmp11.rh1cn or Simululom: and ·Expulm~nt.al !tot1ult s
The use of computer simulations to design the SL 1 barrier was
discussed in Section B of this appendix. Generally, the deflections and
barrier damage in the experiments exceeded the simulation values• After
the pendulum and crash tests had been completed, the simulation input was
revised based on experimental values.
1. Expo d ll!lf!!Dta.l Ob!!!;t.ir"V.\lt..i.cm..Y . Results from both pendulum and
crash tests provide measured input rather than estimated values used in
the preliminary design effort.
a. £1~ndl1.lum Rc:11u1Ui . The pendulum tests demonstrated desired
breakaway force was being achieved. Actual post load/deformation values
obtained after the tests, as shown in Appendix D, were used in the final
simulation cases,
b. Ctash t.i:U Ruul ..u. . The larget" barrier deflections of
the experimental program were partially accounted for by adjusting the Thrie
beam modulus of elasticity to account for the slotted splice connections•
This adjustment is described in Appendix D. The crash test series was
conducted using the same beam and approach railing; thus only elements
damaged in preceding tests were subsequently replaced. It is possible that
C.53
much of the longitudinal 11play 11 in the beam slots was stretched out during
the tests and that latter tests would have more "play" in the impact area
elements as illustrated in Figure C.30.
Another source of discrepancy in determining the post behavior
the point of force application, In the original simulations the force
transmitted from the beam to the post was assumed to be acting at the
centerline of the beam, It is possible that this assumption was not valid
in all cases; therefore other lines of force were investigated.
The actual strength of each post has aome variance and this
would also affect the behavior of the systems; other post strengths were
also used in simulations.
In many of the crash tests the vehicle deflected beyond the
bridge deck and wheels actually dI-opped below the deck level. Thia
phenomenon undoubtedly causes increased loading of the barrier which
cannot be accounted for in the simulations. Thus, this is one factor
which cannot be adjusted to improve simulations.
2. iJ..n11 l SJ.mu.Lation R.e.1l1iulte . AB summarized in Table C.8,
simulation cases were conducted for the purpose of comparing crash test
results. The improvements of post and beam properties discuaaed in
Appendix D were used for the cases shown. ASJ also shown, it was
necessary to reduce the post strength for the wood post in order to
achieve reasonable simulation results.
The simulations for the steel post provided good comparison;
simulated deflection values were still low, but there are factors which
cannot be accounted for as previously discussed.
c. 55
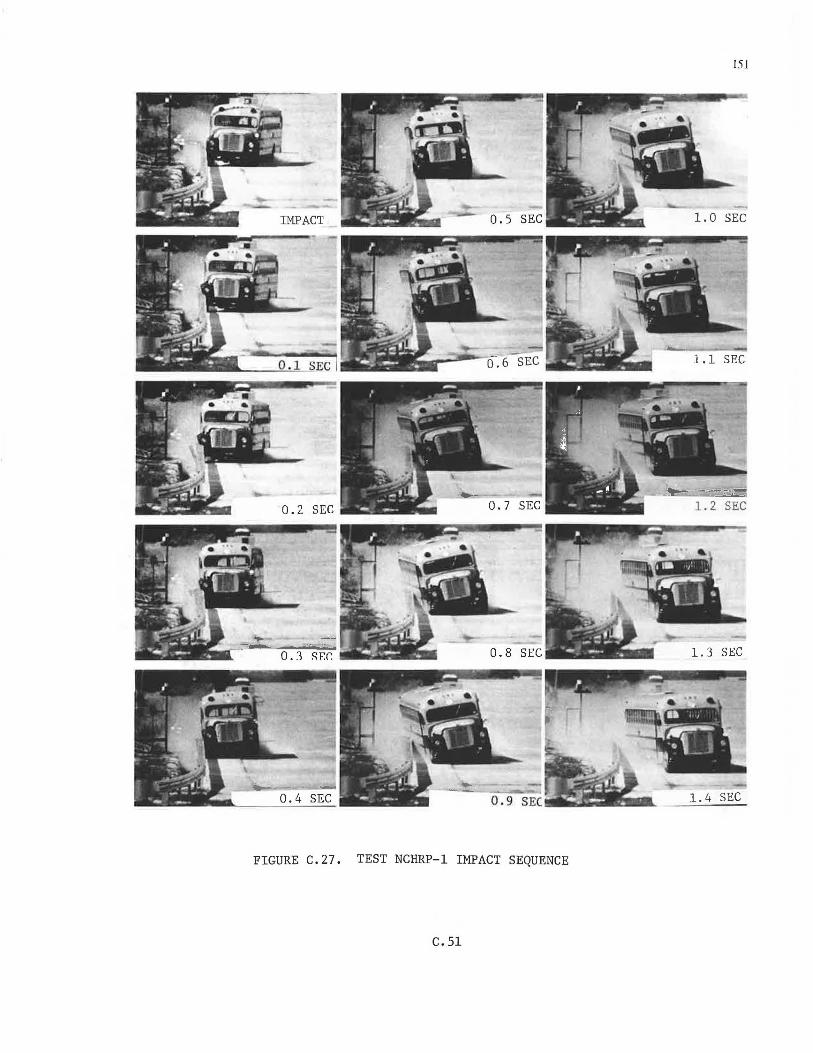
151
FIGURE C.27. TEST NCHRP-1 IMPACT SEQUENCE
C.51
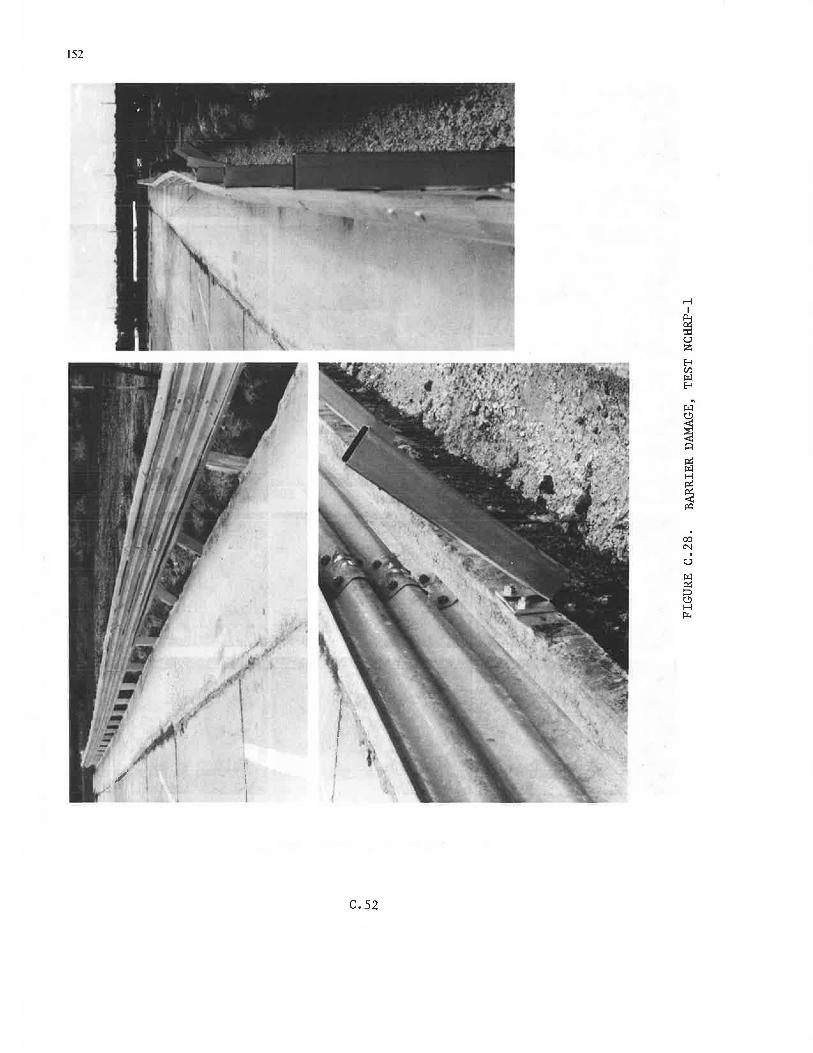
152
C.52
00 N
u
~ H r-..
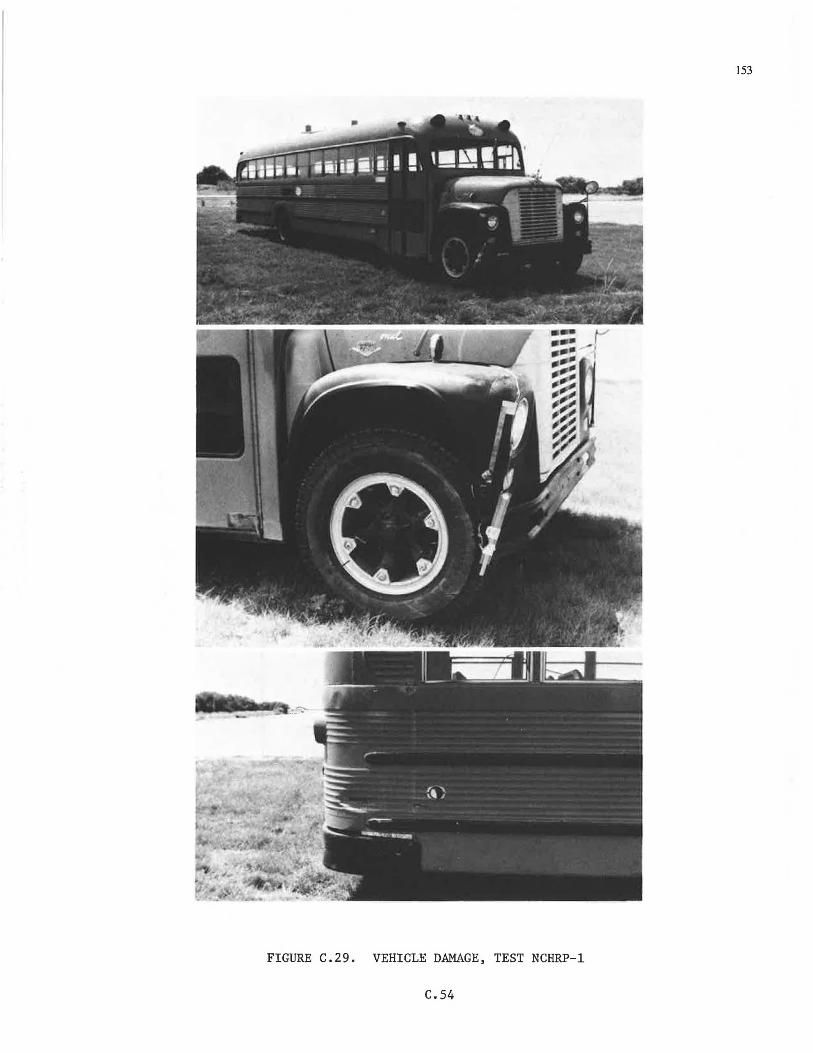
FIGURE C.29. VEHICLE DAMAGE, TEST NCHRP-1
C.54
153
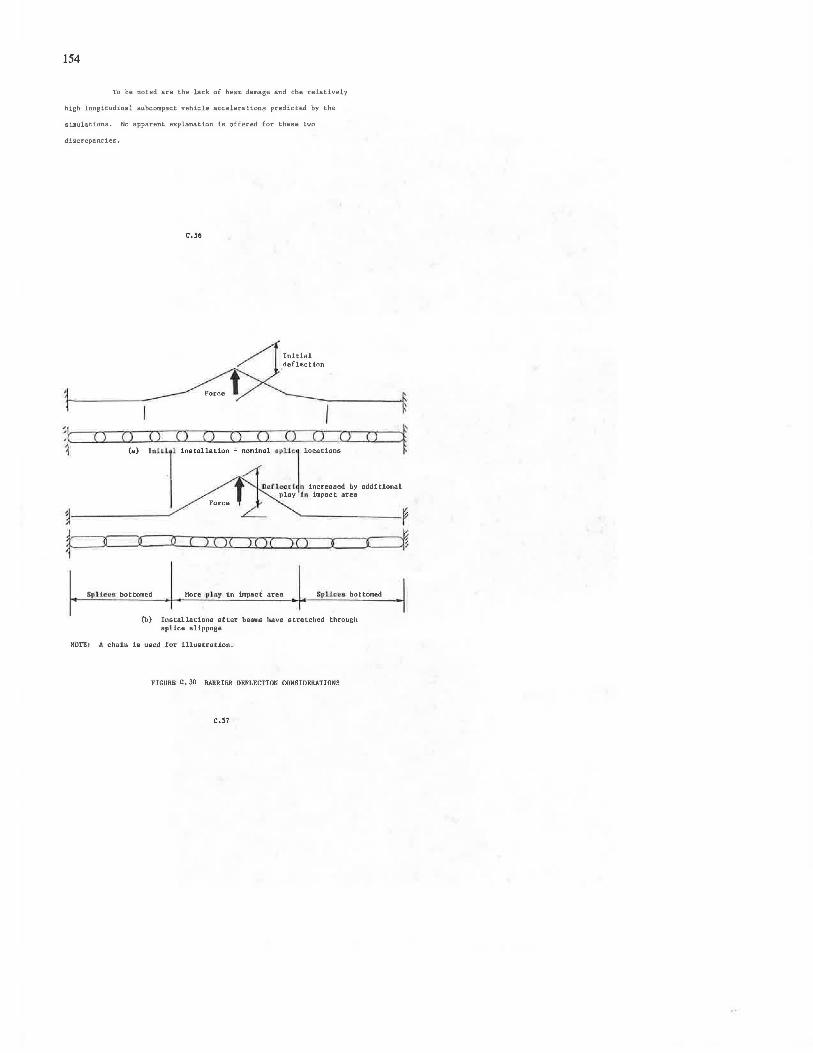
154
To be noted are the lack of beam damage and the relatively
high longitudinal subcompact vehicle accelerations predicted by the
simulations. No apparent explanation is offered for these two
discrepancies.
~
t Q
(a)
C.56
)nJti .l installation .:.. nominal apllcl locatione
Ddl~ctl n increased by additional play tn- impact area
L_ ----~ 0- 0 ) ( )( )( )( )( ) r---~x---r-...., ...... ~~'<""T'-.,,.........-~-..-~---~~~
S:p Uce.&1 bot tamed More p.t ay in impact area -SplJf:!e.ti bottoined
(b) Inetallatioils after beams have stretched through splice slippage
NOTE: A chain is used for illustration.
FIGURE C, 30 BARRIER DEFLECTION CONSIDERATIONS
c.57
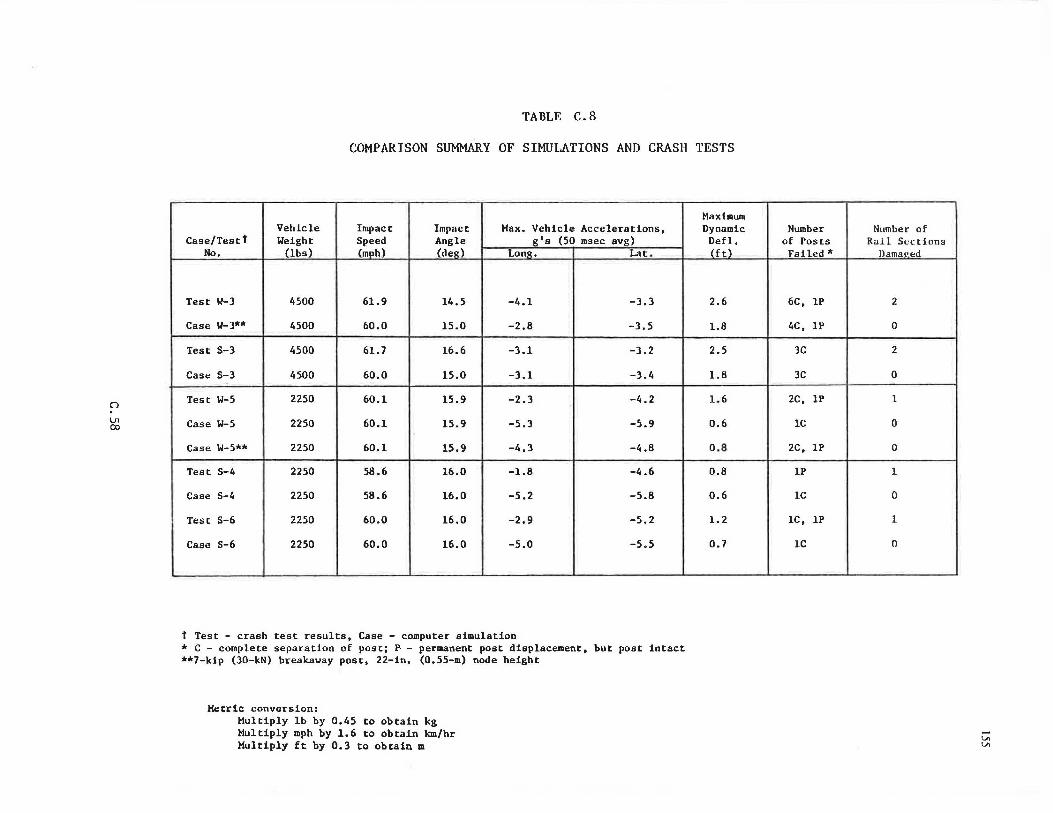
0
\Jl OJ
TABLE C.8
COMPARISON SUMMARY OF SIMULATIONS AND CRASH TESTS
Vehicle Impact Impact Max. Vehicle Accelerations, Case/Testt Weight Speed Angle g's (50 msec avg)
No. (lbs) (mph) (deg) LonR. Lat.
Test W-3 4500 61.9 14.5 -4.1 -3.3
Case W-3*"' 4500 60.0 15.0 -2.8 -J.5
Test S-J 4500 61.7 16.6 -J.l -J.2
Case S-J 4500 60.0 15.0 -3.1 -J.4
Test W-5 2250 60.1 15.9 -2.3 -4.2
Case W-5 2250 60.1 15.9 -5.J -5.9
Case W-5** 2250 60.1 15.9 -4.3 -4.8
Test S-4 2250 58.6 16.0 -1.8 -4.6
Case S-4 2250 58.6 16.0 -5.2 -5.8
Test S-6 2250 60.0 16.0 -2.9 -5.2
Case S-6 2250 60.0 16.0 -5.0 -5.5
t Test - crash test results, Case - computer simulation * C - complete separation of post; P - permanent post displacement, but post intact **7-kip (JO-kN) breakaway post, 22-in. (0.55-m) node height
Metric conversion: Multiply lb by 0.45 to obtain kg Multiply mph by 1.6 to obtain km/hr Multiply ft by 0.3 to obtain m
Maximum Dynamic Defl. {ft)
2.6
1.8
2.5
1.8
1.6
0.6
0.8
0.8
0.6
1.2
0.7
Number of Posts Failed*
6C, lP
4C, IP
JC
JC
2C, lP
lC
2C, lP
lP
lC
lC, lP
IC
Number of Rail Sections
Damav.ed
2
0
2
0
1
0
0
1
0
1
0
-Vi Vi
Related Documents