February 2019 Milliman Client Report Multiple Sclerosis: New Perspectives on the Patient Journey– 2019 Update Prepared by Milliman, Inc. Bruce Pyenson, FSA, MAAA Principal and Consulting Actuary Samantha Tomicki, MPH Senior Healthcare Data Analyst Commissioned by Biogen

Welcome message from author
This document is posted to help you gain knowledge. Please leave a comment to let me know what you think about it! Share it to your friends and learn new things together.
Transcript

February 2019
Milliman Client Report
Multiple Sclerosis: New Perspectives on the Patient Journey– 2019 Update
Prepared by Milliman, Inc.
Bruce Pyenson, FSA, MAAA Principal and Consulting Actuary Samantha Tomicki, MPH Senior Healthcare Data Analyst
Commissioned by Biogen

February 2019
Milliman Client Report
TABLE OF CONTENTS EXECUTIVE SUMMARY ............................................................................................................. 1
MULTIPLE SCLEROSIS OVERVIEW ........................................................................................................... 1 METHODOLOGY ................................................................................................................................. 1 OVERVIEW OF KEY FINDINGS ................................................................................................................ 1
MS Prevalence and Incidence .................................................................................................... 1 MS Treatment With DMTs and Clinical Course .......................................................................... 2 Costs in MS ................................................................................................................................ 2
INTRODUCTION........................................................................................................................ 4 BACKGROUND AND HIGHLIGHTS FROM THE LITERATURE ......................................................... 4 SNAPSHOT ANALYSIS (2015 DATA) ........................................................................................... 7
PREVALENCE ..................................................................................................................................... 7 INCIDENCE ........................................................................................................................................ 8 DMT TREATMENT RATE ...................................................................................................................... 9 HEALTHCARE COSTS ......................................................................................................................... 10
LONGITUDINAL ANALYSIS (2006-2017 DATA) .......................................................................... 13 DISABILITY INDICATORS ..................................................................................................................... 13 DIAGNOSTICS .................................................................................................................................. 18 DMT TREATMENT INITIATION ............................................................................................................ 19 DMT IMPACT ON NON-DMT COSTS ................................................................................................... 20 DMT USE PATTERNS ........................................................................................................................ 21 RELAPSES ....................................................................................................................................... 24
POTENTIAL IMPLICATIONS FOR PAYERS .................................................................................. 25 Important Analytical Implications ........................................................................................... 25 Supports Expert Opinions ........................................................................................................ 25
APPENDIX A: DATA SOURCES ................................................................................................. 26 APPENDIX B: METHODOLOGY ................................................................................................ 27 APPENDIX C: CODE SETS ......................................................................................................... 34 APPENDIX D: SUPPLEMENTAL DATA ....................................................................................... 42 REFERENCES ........................................................................................................................... 46

Biogen An Actuarial Study of the MS Patient Journey – 2019 Update February 2019 Page 1
Milliman Client Report
EXECUTIVE SUMMARY
MULTIPLE SCLEROSIS OVERVIEW
Multiple sclerosis (MS) is a progressive, neurodegenerative, immune-mediated neurological disease that is associated with irreversible physical disability and functional impairment.1 The estimated cumulative prevalence of MS in the US as of 2017 ranges from 851,749 to 913,925 people based on health claims data.2,3
This estimated range should be viewed with caution as it assumes there have been no changes in the different variables of the algorithm since the year 2000. Most individuals are diagnosed between the ages of 28 and 31 years,4 meaning that they will live with MS during their peak working years. Relapsing-remitting multiple sclerosis (RRMS) comprises the most common initial presentation of MS, and its clinical progression is highly variable and unpredictable.4 RRMS is up to 3 times more frequent among women than men.5 Although disease-modifying therapy (DMT) plays a key role in the management of RRMS,4,6 due to the heterogeneity of the patient population, treatment in MS is highly individualized.7,8 MS is associated with a substantial economic burden, which includes direct and indirect costs.1,9 A positive correlation between disability level, as measured by the Expanded Disability Status Scale (EDSS), and total costs (direct and indirect medical costs, productivity losses, and informal care costs) has been reported for the MS population.10 Many MS-related neurologic impairments have been linked to higher healthcare costs and/or lost productivity (eg, absenteeism, presenteeism).11 In addition, cognitive decline, fatigue, depression, and anxiety may limit employability, even for patients with MS who have low levels of physical disability.11
METHODOLOGY
This paper is an update to the April 2016 paper Multiple Sclerosis: New Perspectives on the Patient Journey, using more recent data and methodologies as described in Appendix B. For this paper, a snapshot analysis for the year 2015 and a longitudinal analysis spanning the years 2006 to 2017 were completed on a large administrative commercial claims database. The snapshot analysis yielded findings on MS prevalence rates, MS incidence rates, DMT treatment rates, and healthcare costs. In the longitudinal analysis, disability accumulation, treatment patterns with DMT, and related healthcare costs for newly diagnosed MS patients over the course of 10 years were examined. It was observed that indicators of disability and functional impairment were evident in claims for many patients before MS diagnosis was established and increased during the course of the disease. Our analysis used 2 sets of indicators:
Five categories of EDSS-derived disability indicators were captured from medical and/or pharmacy claims and included spasticity, bladder dysfunction, cognitive/behavioral dysfunction (based on medical claims only), visual impairment, and mobility impairments (see Appendix C for descriptions)
Seven categories of MS-related neurologic impairment indicators were captured from pharmacy claims and included pain, fatigue, depression, and cognitive impairment (see Appendix C for specific codes)
OVERVIEW OF KEY FINDINGS
Our findings reflect the characteristics of the commercially insured population and the information available in administrative claims databases as described in the full report.
MS Prevalence and Incidence The MS prevalence rate was 207 per 100,000 in the commercially insured population, with an average
age of 47.9 years; the majority (76%) were women. Our analysis (years 2006-2017) identified 145,391 people with MS

Biogen An Actuarial Study of the MS Patient Journey – 2019 Update February 2019 Page 2
Milliman Client Report
The MS incidence rate was 20 per 100,000 in the commercially insured sample, with an average age of
45.2 years and the majority (75%) being female In a year, approximately 10% of the commercially insured MS patients were newly diagnosed
MS Treatment With DMTs and Clinical Course Use of DMT treatment: About 1 in 4 patients with MS did not receive DMT treatment in 2015 Time to treatment: The average time to treatment with an MS-specific DMT was about 3 months after
diagnosis for both men and women Switching:
o 28.5% of newly diagnosed patients with MS switched DMTs during a 1-year period, while 20.0% of patients with existing MS who were on DMT therapy switched during a 1-year period
o The majority of patients with MS (85%) remained on the same DMT delivery type (oral, infused, or self-injectable)
Adherence: New patients were slightly less adherent than existing patients across all delivery types
Relapses: MS patients were most likely to have a relapse in their second year after diagnosis (Year 1: Months 13 to 24 post diagnosis)
Indicators of disability and functional impairment were evident in claims for many patients before their MS diagnosis was established and appeared to increase during the course of the disease
Costs in MS DMTs represented 71% of the average cost of MS treatment. The remaining 29% was attributable to
all other costs, including inpatient and outpatient care, emergency room (ER) visits, durable medical equipment (DME) supplies, and non-DMT prescription drugs
Hospitalizations, skilled nursing facility (SNF) stays, and ER visits made up more than 26% of non-DMT costs
In 2015, the unadjusted average monthly non-DMT cost among patients using DMTs was $1571, which was approximately 27% lower ($588) than among those who did not use DMTs ($2159)
There was an increase in non-DMT costs in the 2 years before diagnosis. Costs peaked in the 12 months following diagnosis, but did not fall to prediagnosis levels after diagnosis
Female patients with MS have higher non-DMT costs at younger ages, whereas male patients with MS have higher non-DMT costs at later ages
In the body of this report, we provide additional information based on the 145,391 patients with MS identified in the database, including their course of treatment and their impairments. Our work with these data suggests the feasibility of claims-based predictive modeling for identifying patients at risk for being diagnosed with MS. Important resource use information found in the data include patient drug switching, adherence, and nonuse. Payer considerations based on the results of this analysis include the following:
There may be opportunity for earlier DMT treatment immediately after MS diagnosis, as almost 30% of newly diagnosed patients remained untreated after diagnosis for the entirety of our 2008-2017 examination
The extent of patient switching suggests heterogeneity of patients; in our analysis, 1 in 5 patients switched to a different DMT within 3 years after initiating treatment
The potential to make MS diagnoses earlier is intriguing; the observed increased non-DMT costs in the 2 years before diagnosis suggest the potential of claims-based predictive analytics for case finding

Biogen An Actuarial Study of the MS Patient Journey – 2019 Update February 2019 Page 3
Milliman Client Report
This report was commissioned by Biogen. The findings reflect the research of the authors; Milliman does not intend to endorse any product or organization. If this report is reproduced, it should be reproduced in its entirety, as pieces taken out of context can be misleading. Our analysis of MS patient characteristics, impairment indicators, and utilization of healthcare services and costs is based on historical practice patterns and therapies, which can be expected to change over time. Future experience will vary from the estimates presented in this report for many reasons, including random fluctuation. As with any economic or actuarial analysis, it is not possible to capture all factors that may be significant. Further, no algorithm for identifying MS patients and relapses will be perfect. Different identification algorithms could produce different results. Because we present national average data, the findings should be interpreted carefully before they are applied to any particular situation since there could be considerable variation among subsets of the population. One of the authors, Bruce Pyenson, is a member of the American Academy of Actuaries and meets its qualification standards for this work.

Biogen An Actuarial Study of the MS Patient Journey – 2019 Update February 2019 Page 4
Milliman Client Report
INTRODUCTION Multiple sclerosis (MS) continues to be one of the top specialty drug management priorities for health plans and pharmacy benefit managers,5,12 and payers routinely develop metrics for cost and utilization on a calendar-year basis. However, this calendar-year “snapshot” approach may miss important elements of patient and treatment dynamics for MS that would be apparent in a longer-term study. The objective of this report is to provide insights into patient and treatment dynamics using health insurance claims data in 2 ways.
1. Snapshot analysis for the year 2015: includes descriptive statistics on prevalence and incidence of MS, as well as disease-modifying therapy (DMT) treatment rates and healthcare costs, in a calendar-year timeframe
2. Longitudinal analysis for the years 2006-2017: includes patient-level data capturing patterns of care by following patients for up to 12 years
The longitudinal analysis provides information on the patient journey during the course of MS, including disease progression after diagnosis, treatment patterns with DMT, and related healthcare costs. The longitudinal analysis also captures information about patient conditions and healthcare costs during the years before the MS diagnosis. These analyses of real-world data may supplement currently available evidence and help broaden the understanding of MS among patient advocates and among financial and medical decision-makers within payer organizations. We believe this information also supports the value of using real-world data to help further knowledge and insights about MS.
BACKGROUND AND HIGHLIGHTS FROM THE LITERATURE Multiple sclerosis (MS) is a progressive, neurodegenerative, immune-mediated neurological disease that is associated with irreversible physical disability and functional impairment.1 It has a median age at presentation of 28 to 31 years.4 It is 3 times more common in women than in men,5 and the prevalence increases with distance from the equator, though this geographical skew has decreased over time.4,13 The estimated cumulative prevalence of MS in the US as of 2017 ranges from 851,749 to 913,925 people based on health claims data.2,3 This estimated range should be viewed with caution as it assumes there have been no changes in the different variables of the algorithm since the year 2000. The clinical symptoms of MS depend on which part of the CNS is affected by the demyelinating plaques; the optic nerves, spinal cord, and brainstem are the most common CNS locations for plaques.6 Noticeable symptoms include sensory loss and skin tingling or numbing, motor weakness, bladder and bowel dysfunction, loss of control over bodily movements, and visual impairment; spasticity and motor dysfunction are often seen in more advanced MS cases.6 Patients with MS also have a higher risk of fracture because of increased rates of osteoporosis and susceptibility to falls; vitamin D insufficiency is also common, and may contribute to increases in both fracture risk and disease activity.14 Additionally, comorbidities like obesity and modifiable risks such as smoking are associated with diagnostic delays, increased disability progression, poorer overall health, and decreased adherence to treatment.14
The diagnostic criteria in MS focus on ruling out alternative diagnoses through clinical, radiologic, and laboratory studies.15 Advances in magnetic resonance imaging (MRI) technology and diagnostic criteria may allow for earlier diagnosis in the course of the disease. MS lesions are detectable in MRI of the cerebrum, brainstem, cerebellum, optic nerves, or spinal cord4; additionally, examination of cerebrospinal fluid (CSF) for MS-specific oligoclonal bands and/or elevated immunoglobulin G (IgG) index can be used to diagnose MS.4
Before 2010, at least 2 clinical relapses were required to establish a definitive diagnosis, but the 2010 revised McDonald MS diagnostic criteria allow combining clinical and MRI findings.1,15 For example, a person can be

Biogen An Actuarial Study of the MS Patient Journey – 2019 Update February 2019 Page 5
Milliman Client Report
diagnosed with MS on the basis of a single relapse and relevant MRI findings. This revision to MS diagnostic criteria may result in a decline in the number of people diagnosed with clinically isolated syndrome (CIS) because, rather than being diagnosed with CIS based on a symptomatic neurologic episode, many of these patients are being diagnosed with MS based on meeting diagnostic criteria with an MRI scan.16 However, despite recent changes in diagnostic criteria, diagnosis is still often delayed in MS because patients may postpone seeking diagnosis or may not see an MS specialist promptly.1 By the time diagnosis is established, patients may have sustained functional impairment due to unrecognized disease activity.1 MS is differentiated into subtypes based on how patient symptoms change over time. Approximately 85% to 90% of all new cases present as relapsing remitting MS (RRMS), in which the patient experiences acute periods of neurologic dysfunction (relapses) separated by remission periods of various durations.4 Women tend to have higher relapse rates than men17; relapse rates are highly variable among patients and can change considerably over time for a patient. Some patients present with primary progressive MS (PPMS), where the patient does not experience remission periods. RRMS often leads to eventual secondary progressive MS (SPMS),4 where, as with PPMS, the patient does not experience remission periods. MS symptoms and relapses strongly affect employment or lack of it. In one study, individuals with no MS symptoms reported significantly greater odds of employment than those with severe current symptoms (OR=6.25); however, compared with those with PPMS or SPMS, patients with RRMS had greater odds of employment (OR=2.24).11 The progression of MS means that physical and mental impairments worsen over time. Those with <10 years since MS diagnosis had 2.74 greater odds of employment vs patients with >20 years since diagnosis.11 Cognitive decline, fatigue, depression, and anxiety may limit employability, even for patients with MS who have low levels of physical disability. MS is associated with permanent long-term health consequences and elevated lifetime costs.11 Because the symptoms of MS can restrict income-earning ability and physical activity, a significant financial burden is placed on the patient, family, health system, and society. Studies have shown that an increase in disease severity is associated with a substantial increase in overall costs, which are already high for patients with MS.9
The distribution of these costs changes as the disease progresses, with the direct medical and drug costs being the primary contributor in earlier stages of the disease, giving way to higher indirect costs in later stages as MS disease state worsens and productivity decreases.18 As a patient with MS becomes more disabled, costs outside of the healthcare system increase until they comprise approximately two-thirds of all costs.1
Approximately 30% of patients progress to using a cane or wheelchair within 10 years after diagnosis.6 Our data showed that direct medical costs were relatively flat over time for commercially insured patients with MS, which suggests that indirect costs, which we did not capture, may be increasing. In clinical trials, disability in MS has often been assessed using the Expanded Disability Status Scale (EDSS), which assigns values from 0 (normal neurologic functioning) to 10 (death due to MS) (Table 1).19 The EDSS score is based on the assessment of multiple functional systems (ie, pyramidal, cerebellar, brainstem, sensory, bowel and bladder, visual, and cerebral).1,16,19 A small increase in EDSS score can reflect a significant change in a patient's functionality and daily activities. The EDSS-derived disability level correlates positively with total healthcare and productivity costs.10 EDSS scores tend to correlate with the number of relapses; the more relapses a patient with MS has had, the higher his or her EDSS score is.20 The EDSS score largely reflects the patient’s physical ability and mobility, but it may underrepresent common functional impairments in MS, including cognitive impairment, fatigue, pain, and depression.1

Biogen An Actuarial Study of the MS Patient Journey – 2019 Update February 2019 Page 6
Milliman Client Report
TABLE 1
DISABILITY PROGRESSION BASED ON THE EDSS19 EDSS Score Level of Disability
0.0 Normal neurologic exam 1.0 No disabilitya 2.0 Minimal disabilitya 3.0 Moderate disabilitya 4.0 Relatively severe disability; able to walk without assistance for 500 meters 5.0 Disability affects daily routine; able to walk without assistance for 200 meters 6.0 Assistance required to walk 7.0 Restricted to wheelchair 8.0 Restricted to bed or wheelchair 9.0 Confined to bed 10.0 Death due to MS
aFor EDSS scores of 1.0, 2.0, and 3.0, the disability refers to the maximum impairment in a single functional system. It is possible for such individuals to qualify for disability benefits due to other factors or to combinations of factors.
In addition to physical symptoms, approximately 70% of patients with MS experience cognitive impairment at some time, and the cognitive impairment strongly correlates with symptoms of fatigue and depression.21
Among individuals with MS, 50% will experience depression in their postdiagnosis lifetime, while 36% will experience anxiety.14 Fortunately, there have been significant advances in the treatment of RRMS over the past 20 years with the development of DMTs, which decrease the risk of relapse and MS lesion formation by targeting inflammatory processes.4,6 Though it has not been established that all DMTs have an effect on overall disability progression,22 recent studies have suggested that early therapy with some DMTs may have a favorable impact on long-term disability and death due to MS,23,24 though additional long-term studies are still needed for confirmation. The efficacy of DMTs has led to the concept of “no evidence of disease activity” (NEDA)—an absence of relapses, disability progression, and active MRI lesions—which has appeared in clinical trials.25 MS is a progressive disease, and although NEDA may become a goal of DMT therapy in newly diagnosed patients with MS,25 it may not be a long-term goal if disease progression is inevitable. Routes of DMT administration include injection, infusion, and oral, and the therapy intervals vary. Injectable DMTs were first to the market and an oral option became available in 2010.26 Injectable DMTs are used more often than other delivery types,26 which may be because patients who began using injectable DMTs before orals were introduced hesitate to switch therapies if they are having success with their current regimen. Our real-world study shows that, among the commercial MS population, infused DMTs had the highest adherence, followed by oral DMTs; injectable DMTs had the lowest adherence. Poor adherence to MS DMTs can reduce their clinical benefit, whereas proper adherence is associated with lower risks for MS-related hospitalization and MS relapse, as well as lower MS-related medical costs.27 The MS Coalition emphasizes the importance of early and ongoing DMT treatment immediately after an MS diagnosis; it recommends that DMT treatment continue indefinitely, with a switch to a different DMT if there are intolerable side effects, a more appropriate treatment becomes available, or the patient’s MS progression warrants a change.24

Biogen An Actuarial Study of the MS Patient Journey – 2019 Update February 2019 Page 7
Milliman Client Report
SNAPSHOT ANALYSIS (2015 DATA) These descriptive statistics present a view of the MS population in the 2015 calendar year. Please see Appendices A, B, and C for detailed descriptions of the data sources, methodology, and code sets.
PREVALENCE
MS affected 0.21% of people aged 18 to 64 years in our commercially insured population (Table 2). In this patient population, the average age of patients with MS was approximately 48 years and the majority of patients were women. These statistics are consistent with prior published studies using commercial claims data.28,29
TABLE 2 PREVALENT CASES OF MS IN 2015
Prevalence Rate 207 per 100,000 Average Age 47.9 Proportion of Females 76%
Based on Milliman's analysis of MarketScan® commercial databases, 2015. Please see references in appendices A-D. Figure 1 shows that for women, MS prevalence rose with increasing age until rates peaked in the early 50s. The decline thereafter is directionally consistent with the shift from commercial insurance coverage to Medicare coverage earned through disability, which is expected for patients with a debilitating disease such as MS. The fact that the MS prevalence rate is declining for later-age groups suggests that patients with MS are exiting commercial insurance at a higher rate than the general commercial population of the same ages. For men, MS prevalence increased with age until the late 40s and then remained level.
Figure 1
MS Prevalence by Age Group and Gender in 2015
Includes MS patients identified during or prior to 2015 with any eligibility in 2015. Based on Milliman’s analysis of MarketScan® commercial databases. Please see references in appendices A-D.
0.01%0.04%
0.07%0.11%
0.14% 0.15% 0.15% 0.15% 0.15%
0.04%
0.10%
0.19%
0.31%
0.38%
0.45% 0.46%0.44%
0.41%
0.00%
0.05%
0.10%
0.15%
0.20%
0.25%
0.30%
0.35%
0.40%
0.45%
0.50%
18-24 25-29 30-34 35-39 40-44 45-49 50-54 55-59 60-64Prev
alen
ce R
ate
in th
e Co
mm
ercia
lly
Insu
red
Popu
latio
n
Age Group (years)
MaleFemale
MS prevalence in the commercial population peaked at 50 to 54 years for women and plateaued at 45 to 64 years for men.

Biogen An Actuarial Study of the MS Patient Journey – 2019 Update February 2019 Page 8
Milliman Client Report
INCIDENCE
Newly diagnosed patients with MS were identified through a look-back process whereby patients with MS in a particular year were classified as newly diagnosed if they did not have any MS-specific claims in the previous 24 months. New cases of MS were identified in 0.02% of the commercially insured data (Table 3). Our 24-month look-back process for incident cases removed from consideration people who did not have continuous enrollment during the look-back period. This process excluded the turnover population, which means that the population that generated the incident cases is somewhat different from a typical commercial population. Commercial health plans tend to have greater turnover of younger adults, so our population had fewer younger adults who met the 24-month continuous enrollment criterion. This may dampen the number of newly diagnosed patients who are identified at the younger age range. As a result, prevalent and incident cases generated through claims data have been reported to have similar average ages.29 We normalized the average age by applying a typical commercial population age distribution. Although no algorithm will perfectly identify incident MS cases, our normalization methodology may help insurers and researchers who analyze administrative claims databases.
TABLE 3 INCIDENT CASES OF MS IN 2015a
Incidence Rate 20 per 100,000 Average Age 45.2 years Proportion of Females 75%
aBased on Milliman’s analysis of MarketScan® commercial databases, average of years 2013, 2015, and 2016. Based on Milliman’s analysis of MarketScan® commercial databases. Please see references in appendices A-D.
Figure 2 shows that, compared with the prevalence trends presented above, incident cases for men and women peaked slightly earlier (ages 35-39 years for women and 45-49 years for men).
Figure 2
MS Incidence by Age Group and Gender in 2015b
bBased on Milliman’s analysis of MarketScan® commercial databases, average of years 2013, 2015, and 2016. Please see references in appendices A-D.
0.004%
0.008%
0.013% 0.014%0.012%
0.015%
0.011% 0.011%0.008%
0.012%
0.028%
0.034%
0.038% 0.037% 0.036%
0.029%0.025%
0.021%
0.000%
0.005%
0.010%
0.015%
0.020%
0.025%
0.030%
0.035%
0.040%
18-24 25-29 30-34 35-39 40-44 45-49 50-54 55-59 60-64
Incid
ence
Rat
e in
the
Com
mer
cially
In
sure
d Po
pula
tion
Age Group
MaleFemale
About 10% of MS patients are newly diagnosed in a year.

Biogen An Actuarial Study of the MS Patient Journey – 2019 Update February 2019 Page 9
Milliman Client Report
DMT TREATMENT RATE
Among patients with MS, 73% had at least 1 claim for a DMT during the 12-month period in 2015. This DMT treatment rate was somewhat higher than the previously reported rates of 53% to 58%.28,30 Figure 3 illustrates that among newly diagnosed patients with MS in 2015, 62% had claims for DMT treatment. This percentage may be understated, however, because in this snapshot view we may have missed patients newly diagnosed at the end of 2015 who may have started treatment in the beginning of 2016.
Figure 3
DMT Treatment Rate Among Patients With MS in 2015
This analysis includes only MS-specific DMTs in the “DMT Use” category. Based on Milliman’s analysis of MarketScan® commercial databases, 2006-2017. Please see references in appendices A-D.
73%62%
74%
27%38%
26%
0%
25%
50%
75%
100%
All Patients Patients Diagnosedin 2015
Patients DiagnosedBefore 2015
Snap
shot
MS
Popu
latio
n (%
)
No DMT Use
DMT Use
Approximately 1 out of 4 patients with MS did not receive DMT treatment in 2015.

Biogen An Actuarial Study of the MS Patient Journey – 2019 Update February 2019 Page 10
Milliman Client Report
HEALTHCARE COSTS
Per-patient per-month (PPPM) claim costs were evaluated for all patients with MS in 2015. The PPPM allowed costs included both insurer-paid and patient cost-sharing amounts. The average allowed PPPM claim cost was $6004, which was substantially greater than the average $577 per-member per-month cost for the entire commercially insured population in the database. Figure 4 depicts the variation in allowed costs for patients with MS, particularly for claim costs associated with medical services and non-DMT prescription drugs (non-DMT services). For non-DMT services, the 95th percentile PPPM claim cost ($6871) was almost 4 times the mean ($1851). This finding demonstrates the wide range of resource use for people in the MS population.
Figure 4
Percentile Distribution of Allowed PPPM Claim Costs for Patients With MS in 2015
This analysis includes only MS-specific DMTs in the “DMT” category. DMT costs do not include costs to administer infused drugs, which are captured in non-DMT costs. Based on Milliman’s analysis of MarketScan® commercial databases, 2006-2017. All costs trended to 2017. Please see references in appendices A-D.
10th, $0 10th, $89
Mean, $4153
Mean, $1851
Median, $5137
Median, $654
90th, $7255
90th, $3851
95th, $7901
95th, $6871
$0
$1000
$2000
$3000
$4000
$5000
$6000
$7000
$8000
$9000
DMT Costs Non-DMT Costs
Aver
age
Allo
wed
PPP
M C
ost

Biogen An Actuarial Study of the MS Patient Journey – 2019 Update February 2019 Page 11
Milliman Client Report
DMTs made up 71% of the average allowed cost, while the remaining 29% was attributed to inpatient and outpatient care, emergency room (ER) visits, durable medical equipment (DME) supplies, non-DMT prescription drugs, and other services (Figure 5). Hospitalizations, skilled nursing facility (SNF) stays, and ER visits made up more than 26% of non-DMT costs. A previously published analysis of claim costs among patients with MS reported a similar distribution of healthcare costs across service categories.28
Figure 5 Allowed PPPM Claim Costs by Service Category for Patients With MS in 2015
Based on Milliman’s analysis of MarketScan® commercial databases, 2006-2017. All costs trended to 2017. Please see references in appendices A-D.
$60 $193 $272 $369 $390 $425
$1710
$16
$4236
$0
$1000
$2000
$3000
$4000
$5000
$6000
$7000
Total Cost Non-DMT Cost
Aver
age
Allo
wed
PPP
M C
ost
MS-Specific DMT
Other MS DMT
Non-DMT
Non-DMT Prescription Drugs
Inpatient & SNF
Outpatient
Professional & Other Services
Radiology & Pathology
ER
29% of healthcare spending for patients with MS was attributed to non-DMT costs.
Biogen An Actuarial Study of the MS Patient Journey – 2019 Update February 2019 Page 12
Milliman Client Report
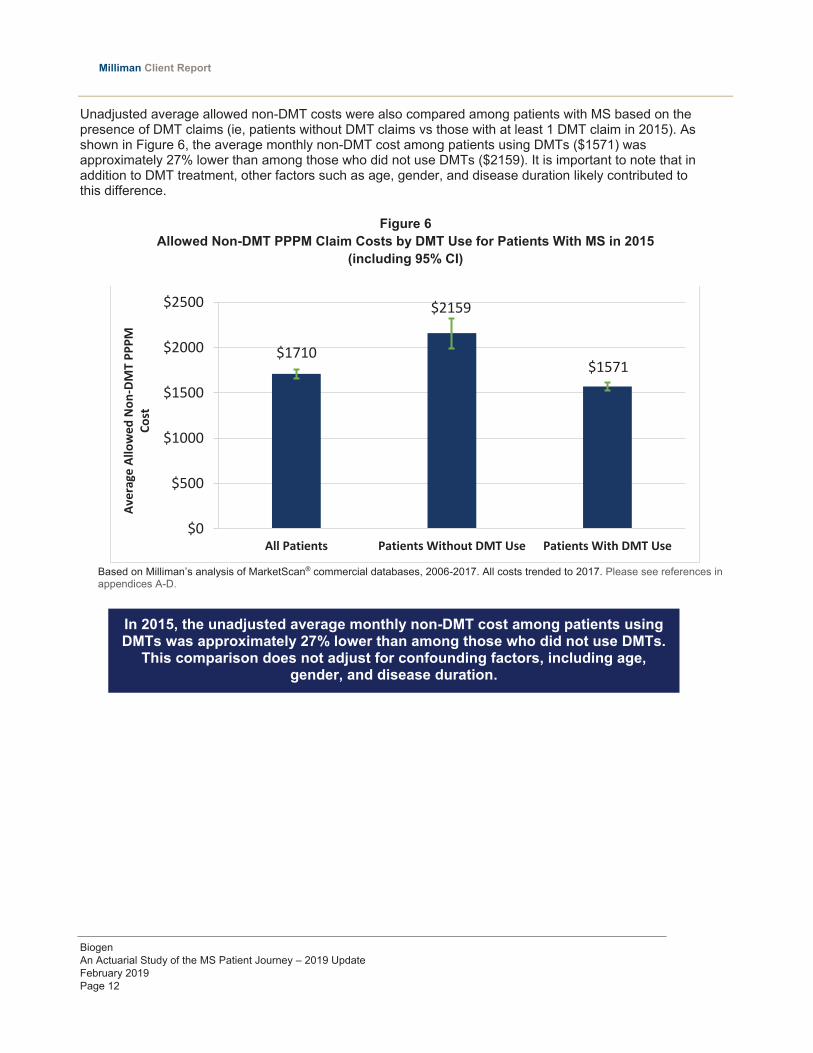
Unadjusted average allowed non-DMT costs were also compared among patients with MS based on the presence of DMT claims (ie, patients without DMT claims vs those with at least 1 DMT claim in 2015). As shown in Figure 6, the average monthly non-DMT cost among patients using DMTs ($1571) was approximately 27% lower than among those who did not use DMTs ($2159). It is important to note that in addition to DMT treatment, other factors such as age, gender, and disease duration likely contributed to this difference.
Figure 6 Allowed Non-DMT PPPM Claim Costs by DMT Use for Patients With MS in 2015
(including 95% CI)
Based on Milliman’s analysis of MarketScan® commercial databases, 2006-2017. All costs trended to 2017. Please see references in appendices A-D.
$1710
$2159
$1571
$0
$500
$1000
$1500
$2000
$2500
All Patients Patients Without DMT Use Patients With DMT Use
Aver
age
Allo
wed
Non
-DM
T PP
PM
Cost
In 2015, the unadjusted average monthly non-DMT cost among patients using DMTs was approximately 27% lower than among those who did not use DMTs.
This comparison does not adjust for confounding factors, including age, gender, and disease duration.

Biogen An Actuarial Study of the MS Patient Journey – 2019 Update February 2019 Page 13
Milliman Client Report
LONGITUDINAL ANALYSIS (2006-2017 DATA) This longitudinal analysis includes patient-level data capturing patterns of care during a 12-year period (2006-2017). The analysis examines disease progression, DMT treatment patterns, and related healthcare costs in newly diagnosed patients with MS over the course of up to 10 years, with a 2-year look-back period. The focus of this analysis was on the identification of disability and functional impairment during the course of MS. Assessments of disease activity in previously published claims analyses have generally been limited to the identification of relapse rates.29 Please see Appendices A, B, and C for detailed descriptions of the data sources, methodology, and code sets. Appendix D includes supplemental data with detailed descriptions of allowed claim costs and annual relapse rates.
DISABILITY INDICATORS
Claims data such as particular prescriptions and diagnosis codes can be used to track some aspects of disability and functional impairment. Even though insurance claims do not capture all clinical details needed to assess functional systems for EDSS scoring (which is frequently used in MS clinical trials), claims data capture disability indicators that are approximate analogues to several categories in the EDSS, such as mobility and visual impairments, spasticity, bladder dysfunction, and cognitive or behavioral dysfunction. Claims data may also track neurologic impairments that are often related to MS. The information about neurologic impairments can supplement the information identified by the EDSS-derived disability indicators.
In this analysis, claims of newly diagnosed patients with MS were used to identify the presence and progression of 2 sets of indicators: EDSS-Derived Disability Indicators and Related Neurologic Impairment Indicators. A patient flagged for any of the indicators continued to be flagged for as long as he or she was observed. To identify patients with persistent disability, we required either 3 30-day prescriptions of relevant drugs in a 6-month period or 2 relevant diagnosis codes at least 3 months apart within a 6-month period. Likewise, to identify persistent neurologic impairment, we required 3 30-day prescriptions in a 6-month period. Relevant conditions and drug classes are shown in Appendix C.
EDSS-Derived Disability Indicators (identified through diagnosis codes and/or drug treatment)
Related Neurologic Impairment Indicators (identified through drug treatment)
Spasticity Bladder dysfunction Visual impairment Mobility impairments requiring cane,
walker, wheelchair, or specialty bed Cognitive/behavioral dysfunctiona
Pain Fatigue Depression Cognitive impairmentb
aIdentified through medical claims with relevant diagnosis codes (eg, International Classification of Diseases, Ninth Revision [ICD-9] codes for dementia, mild cognitive impairment, pseudobulbar affect, etc). bIdentified through pharmacy claims for relevant prescription drug therapies (eg, acetylcholinesterase inhibitors for the treatment of dementia).

Biogen An Actuarial Study of the MS Patient Journey – 2019 Update February 2019 Page 14
Milliman Client Report
One or more EDSS-derived disability indicators were observed in up to 26% of patients by the date of diagnosis (Figure 7). During the course of the disease, more patients developed EDSS-derived disability indicators and the number of indicators increased. For instance, by 5 years after diagnosis, at least 1 EDSS-derived disability indicator was identified for 48% of patients. Moreover, at 5 years, 14% of patients were identified as having 2 or more EDSS-derived disability indicators.
Figure 7 Cumulative Distribution of Patients With MS by the Number of EDSS-Derived Disability Indicators
During the Course of the Disease
Based on Milliman’s analysis of MarketScan® commercial databases, 2006-2017. Please see references in appendices A-D.
88%
66%57%
52% 48% 44%
10%
27%31%
34%35%
35%
1%6% 9% 12% 14% 18%
1% 2% 2% 3% 4%
0%
10%
20%
30%
40%
50%
60%
70%
80%
90%
100%
-2 -1 0 1 2 3 4 5 6 7 8 9
Patie
nts W
ith M
S (%
)
Years From Initial MS Diagnosis
0 1 2 3+ Disabilities

Biogen An Actuarial Study of the MS Patient Journey – 2019 Update February 2019 Page 15
Milliman Client Report
Identification of patients with related neurologic impairment indicators that include pain, fatigue, depression, and cognitive impairment offers additional insights into the patient journey and the burden associated with MS disease activity. Figure 8 shows that 2 years before MS diagnosis, more than 20% of patients filled at least 3 prescriptions in classes generally used to treat pain, fatigue, depression, or cognitive impairment (3 scripts were required to be classified as having 1 consistent symptom). By 1 year after diagnosis, this percentage increased to approximately 44%. Almost 60% of patients met the 3+ prescription requirement for 1 or more prescriptions for the drug classes by 5 years after MS diagnosis; almost half of those met the 3+ prescription requirement in 2 or more of the classes.
Whether the use of such medication was for an MS-related symptom was not determined. There may be overlaps between the EDSS-derived and the related neurologic sets of indicators. Therefore, Figure 8 should be viewed as indicating an increase in impairments rather than as definitively stating the prevalence or incidence of impairments. Our data support previously published findings that these neurologic impairments are commonly reported among patients with MS and may manifest early in the disease course.1,31,32 These findings may have important health and workforce management implications because neurologic impairments such as fatigue, pain, and cognitive impairment have been shown to impact healthcare costs, productivity, and loss of employment.11
Figure 8 Cumulative Distribution of Patients With MS by the Number of Related Neurologic Impairment
Indicatorsa During the Course of the Disease
aIdentified by prescriptions filled for particular drug classes. Based on Milliman’s analysis of MarketScan® commercial databases, 2006-2017. Please see references in appendices A-D.
78%
57%47%
41% 36%
17%
27%
30%
30%29%
4%
12%15%
18%21%
1% 4% 6% 9% 10%
1% 2% 2% 4%
0%
10%
20%
30%
40%
50%
60%
70%
80%
90%
100%
-2 -1 0 1 2 3 4 5 6 7 8
Patie
nts W
ith M
S (%
)
Years From Initial MS Diagnosis
0 1 2 3 4 Symptoms

Biogen An Actuarial Study of the MS Patient Journey – 2019 Update February 2019 Page 16
Milliman Client Report
Combining the indicators of EDSS-derived disability and related neurologic impairment showed that patients with MS can be affected by many different conditions (Figure 9). During the course of the disease, patients tend to accumulate a growing number of indicators of disability progression and functional impairment.
Figure 9 Cumulative Distribution of Patients With MS by the Combined Number of Indicators for EDSS-Derived Disability and Related Neurologic Impairment During the Course
of the Disease
Based on Milliman’s analysis of MarketScan® commercial databases, 2006-2017. Please see references in appendices A-D.
72%
44%34% 29% 25%
19%
27%
27%24%
24%
6%
15%
18%19%
19%
2%
8%11%
14%15%
1%4%
6%8%
10%
0% 2% 4% 6% 9%
0%
10%
20%
30%
40%
50%
60%
70%
80%
90%
100%
-2 -1 0 1 2 3 4 5 6 7 8
Patie
nts W
ith M
S (%
)
Year(s) From Initial MS Diagnosis
0 1 2 3 4 5+ Disabilities/Symptoms

Biogen An Actuarial Study of the MS Patient Journey – 2019 Update February 2019 Page 17
Milliman Client Report
The analysis indicated that this accumulation of impairments often begins years before patients are diagnosed. Non-DMT spending appeared to increase above the prior year’s level in the 1-year period before diagnosis. Costs appeared to spike in the year following MS diagnosis (Year 0), after which costs returned to a relatively steady amount that was consistently higher than prior to diagnosis (Figure 10).
Figure 10 Allowed PPPM Costs Associated With Non-DMT Services During the Course of the Disease (including
95% CI and trended to 2017)
Based on Milliman’s analysis of MarketScan® commercial databases, 2006-2017. All costs trended to 2017. Please see references in appendices A-D.
$716 $723 $748$865
$1210
$2318
$1567 $1550 $1552$1452 $1502
$1647$1696
$0
$500
$1000
$1500
$2000
$2500
Year -5 N=64,483
Year -4 N=98,731
Year -3 N=153,159
Year -2 N=195,080
Year -1 N=195,064
Year 0 N=176,314
Year 1 N=123,243
Year 2 N=82,067
Year 3 N=57,087
Year 4 N=40,037
Year 5 N=26,739
Year 6 N=16,982
Year 7 N=10,240
Aver
age
Allo
wed
PPP
M fo
r Non
-DM
T Co
st
Years From Initial MS DiagnosisN=Member Months.
Patients with MS see increasing medical (non-DMT) costs in the 2 years before diagnosis. Costs peak in the year of diagnosis, but do not fall to
prediagnosis levels after diagnosis.

Biogen An Actuarial Study of the MS Patient Journey – 2019 Update February 2019 Page 18
Milliman Client Report
DIAGNOSTICS
MS lesions are detectable through MRI of the cerebrum, brainstem, cerebellum, optic nerves, and spinal cord; studies have shown that the majority of MS lesions are clinically silent, so MS can be diagnosed during a symptom-free period.4 Another option for diagnosing MS is through examination of the CSF, where MS-specific oligoclonal bands and/or an elevated IgG index indicate MS.4 We used claims data from 2008 to 2017 for newly diagnosed patients to determine the average time from diagnosis to the first MRI or CSF analysis. As Table 4 illustrates, for both men and women, the time to receive an MRI was twice that for a CSF analysis (6.1 months vs 2.7 months). However, patients with MS were much more likely to receive an MRI (80%) than a CSF analysis (21%) (Table 4). One reason for the longer time to an MRI may be that this analysis did not capture procedures before the diagnosis date—if a patient had an MRI without an associated MS diagnosis at a very early part of their diagnosis journey, that MRI would be excluded from this tabulation.
TABLE 4 TIME TO MRI OR CSF PROCEDURE AFTER MS DIAGNOSIS
Procedure Average Time to Procedure in Monthsa (95% CI)
Men Women Total
First MRI 6.3 (5.9, 6.6) [N=3241]
6.1 (5.9, 6.3) [N=9800]
6.1 (5.8, 6.5) [N=13041]
First CSF Analysis 2.2 (1.9, 2.4) [N=887]
2.9 (2.7, 3.1) [N=2506]
2.7 (2.4, 3.1) [N=3393]
First MRI or CSF Analysis 5.5 (5.2, 5.8) [N=3341]
5.5 (5.3, 5.7) [N=9999]
5.5 (5.2, 5.8) [N=13,340]
No MS-Specific or Other DMT – [N=749]
– [N=2166]
– [N=2915]
aTime to treatment is measured from the first encounter that led to MS identification. If a claim occurred before the date of the first encounter that led to MS identification, it was not captured. Based on Milliman’s analysis of MarketScan® commercial databases, 2006-2017. Please see references in appendices A-D.

Biogen An Actuarial Study of the MS Patient Journey – 2019 Update February 2019 Page 19
Milliman Client Report
DMT TREATMENT INITIATION
To examine treatment initiation dynamics, patients who were newly diagnosed from 2008 to 2017 were identified using a 2-year continuous enrollment look-back period. The average time to treatment with an MS-specific DMT was 3.1 months after diagnosis for men and 3.3 months after diagnosis for women (Table 5). Additionally, Table 5 shows that 27% of men and 30% of women had no DMT treatment of any kind, despite clinical guidelines that recommend early and ongoing DMT treatment immediately after diagnosis.24 Interestingly, Table 5 shows that patients with MS who had an MRI or CSF analysis after diagnosis had longer times to treatment.
TABLE 5 TIME TO DMT TREATMENT AFTER MS DIAGNOSIS
Treatment Average Time to Treatment in Monthsa (95% CI)
Men Women Total
All MS DMTs
First MS-Specific DMT 3.1 (2.9, 3.4) [N=2946]
3.3 (3.2, 3.5) [N=8274]
3.3 (3.0, 3.6) [N=11,220]
Other MS DMT 15.5 (14.7, 16.3) [N=122]
15.5 (15.1, 16.0) [N=437]
15.5 (14.7, 16.3) [N=559]
Either MS-Specific or Other DMT 3.2 (2.9, 3.5) [N=2997]
3.4 (3.3, 3.6) [N=8492]
3.4 (3.1, 3.6) [N=11,489]
No MS-Specific or Other DMT – [N=1093]
– [N=3673]
– [N=4766]
Those That Received an MRI or CSF Analysis
First MS-Specific DMT 3.4 (3.1, 3.7) [N=2521]
3.6 (3.4, 3.8) [N=7151]
3.6 (3.3, 3.8) [N=9672]
Other MS DMT 17.0 (16.2, 17.9) [N=108]
17.0 (16.5, 17.5) [N=374]
17.0 (16.2, 17.8) [N=482]
Either MS-Specific or Other DMT 3.5 (3.2, 3.8) [N=2563]
3.7 (3.5, 3.8) [N=7322]
3.6 (3.3, 3.9) [N=9885]
No MS-Specific or Other DMT – [N=778]
– [N=2677]
– [N=3455]
aTime to treatment is measured from the first encounter that led to MS identification. If a claim occurred before the date of the first encounter that led to MS identification, it was not captured. Based on Milliman’s analysis of MarketScan® commercial databases, 2006-2017. Please see references in appendices A-D.
27% of men and 30% of women had no DMT treatment of any kind.

Biogen An Actuarial Study of the MS Patient Journey – 2019 Update February 2019 Page 20
Milliman Client Report
DMT IMPACT ON NON-DMT COSTS
Regression analysis was used to identify key factors that influence non-DMT claim costs for MS patients. The dependent variables considered in this analysis were age, gender, DMT use, MS patient status (new or existing), calendar year, and duration of disease (from diagnosis [Year 0] to Year 11). Patient characteristics such as age, gender, and health status of the underlying sample population in each year of data used were accounted for in the regression analysis. Non-DMT claim costs increased with age for both females and males, but with large variation, as shown in Appendix B. MS patient status (new/existing) was paired with Duration Year for the analysis because they are related variables. For newly diagnosed patients, their diagnosis year (Duration Year 0) was by far their most expensive year for non-DMT costs, and costs dropped significantly through the following 4 years. Costs began to rise in the later years for patients with newly diagnosed MS, as well as those with existing MS, possibly due to advancing age and/or advancing MS state. In general, newly diagnosed patients had higher non-DMT costs than patients with existing MS. Calendar year does not appear to be a significant driver of non-DMT claim costs or relapse rates, and thus was excluded from the final regression model. The final regression model and summary charts are shown in Appendix B. A detailed exhibit of claim costs by duration for patients with MS is included in Appendix D.
Female patients with MS have higher non-DMT costs at younger ages, whereas male patients with MS have higher non-DMT costs at later ages.

Biogen An Actuarial Study of the MS Patient Journey – 2019 Update February 2019 Page 21
Milliman Client Report
DMT USE PATTERNS
MS guidelines discuss DMT switching, particularly in the first months after diagnosis. Clinical reasons for switching DMTs revolve around the heterogeneity of MS—one DMT might work better than another DMT for a particular patient. The range of disease characteristics, severity, and patient response is consistent with therapy switching because different DMTs address different mechanisms of MS; additional or different DMTs may be required as the disease progresses.33 MRI scans are recommended before initiating or modifying DMT treatment, as well as 6 months after any DMT treatment change, followed by annual screens for the first 2 or 3 years.33 This can help monitor the administered DMT’s efficacy in preventing new MS lesions and inform possible treatment changes. Adherence to DMTs is also important for patients with MS; it has been reported that lack of DMT adherence may lead to increased resource utilization, along with higher healthcare and productivity costs.34,35 DMT switching patterns and treatment adherence were evaluated for 2015-2017 for cohorts of patients who were newly diagnosed in 2015 and for existing patients. Switching was defined as a change in DMT distinct chemical entity; product or brand changes within the same drug were not considered switches for this analysis. Switching was also examined by DMT delivery type: oral, injectable, and infused. Table 6 shows that newly diagnosed patients were more likely to switch DMTs at least once compared with existing patients, with annual rates of switching of 14.6% for newly diagnosed patients and 11.5% for existing patients. Newly diagnosed patients also had a shorter average time to their first DMT switch (~316 days vs 400 days for existing patients). Of those who switched from 2015 to 2017, the vast majority made their first switch within 2 years of diagnosis (85.3% of all switchers).
TABLE 6 DMT SWITCHING ANALYSISa
Newly Diagnosed
Therapy Patient Count
% of Total Existing
Avg Days to First Switchb
Avg Number of Switches
Annual Rate of Switching
Total 1097 100.0% 316 0.36 14.6% No Switching 784 71.5%
Switching 313 28.5% 316 1.28 Existing
Total 30,300 100.0% 400 0.26 11.5% No Switching 24,241 80.0%
Switching 6059 20.0% 400 1.30 aNo continuous enrollment was required. This analysis excludes 152 patients whose treatment pattern was not identifiable. bAverage days to first switch for members with switching. Based on Milliman’s analysis of MarketScan® commercial databases, 2006-2017. Please see references in appendices A-D. We also analyzed switching patterns by DMT delivery type (infused, oral, and injectable) within 3 years after initiating treatment. More than half of patients with newly diagnosed MS taking DMTs began with an injectable drug (51.1%); 38.7% began with an oral drug and 10.2% began with an infused drug. Of those who began taking injectable DMTs, 13.6% switched to an oral DMT, whereas only 5.7% of those who began on an oral DMT switched to an injectable drug. Fewer patients with MS switched DMT delivery type than DMTs—only 15.0% of all patients with MS switched their DMT delivery type at least once. Similar to DMT switching above, newly diagnosed patients were more likely to switch delivery types than existing patients: 22.1% of new patients vs 14.7% of existing patients switched delivery types at least once. Very few patients switched delivery types more than once. A detailed journey of patient delivery type switching can be found in Appendix D.

Biogen An Actuarial Study of the MS Patient Journey – 2019 Update February 2019 Page 22
Milliman Client Report
Adherence was calculated using average medication possession ratio (MPR) from 2015 to 2017 for both patients with existing MS and those newly diagnosed in 2015. MPR is the ratio of the number of days for which a patient has medication on hand divided by the total number of days a patient was observed (see below calculation).
𝑴𝑴𝑴𝑴𝑴𝑴𝐚𝐚 = ∑ 𝒅𝒅𝒅𝒅𝒅𝒅𝒅𝒅 𝒘𝒘𝒘𝒘𝒘𝒘𝒘𝒘 𝑫𝑫𝑴𝑴𝑫𝑫𝒏𝒏
𝒙𝒙=𝟎𝟎∑ 𝒅𝒅𝒅𝒅𝒅𝒅𝒅𝒅 𝒘𝒘𝒘𝒘𝒘𝒘𝒘𝒘 𝒘𝒘𝒏𝒏𝒅𝒅𝒊𝒊𝒊𝒊𝒅𝒅𝒏𝒏𝒊𝒊𝒊𝒊 𝒊𝒊𝒄𝒄𝒄𝒄𝒊𝒊𝒊𝒊𝒅𝒅𝒄𝒄𝒊𝒊𝒏𝒏
𝒙𝒙=𝟎𝟎
aThis equation was calculated at the patient/chemical name level using a rolling denominator, in which 0 ≤ n ≤ 1080, and then the average was taken of the patient-level MPRs. Figures 11 to 13 show that new patients were slightly less adherent than existing patients across all delivery types. For existing patients, the highest adherence was for patients using infused DMTs, which may be consistent with the high patient-provider interaction, because those drugs are administered at multiweek intervals by a provider in an outpatient setting. This delivery type also had the greatest adherence differences between newly diagnosed and existing patients (infused 24-month MPR for new=65.4%, existing=74.4%; P<0.001). Oral DMTs had the second highest adherence for existing patients and the highest adherence for new patients (24-month MPR for new=68.6%, existing=72.7%; P=0.002), potentially due to ease of use. Injectable DMTs had the lowest rates of adherence for both newly diagnosed and existing patients (24-month MPR for new=63.0%, existing=70.7%, P<0.001). In all cases, adherence steadily declined during the 3 years observed.
Figure 11 Average MPR for Infused Therapies During a 3-Year Period After DMT Initiation in Patients
With Newly Diagnosed and Existing MS
Based on Milliman’s analysis of MarketScan® commercial databases, 2006-2017. Please see references in appendices A-D.
74.0%65.4% 63.6%
79.4%74.4% 71.2%
0%
20%
40%
60%
80%
100%
Aver
age
MPR
Months from DMT Treatment InitiationNewly Diagnosed Existing

Biogen An Actuarial Study of the MS Patient Journey – 2019 Update February 2019 Page 23
Milliman Client Report
Figure 12
Average MPR for Oral Therapies During a 3-Year Period After DMT Initiation in Patients With Newly Diagnosed and Existing MS
Based on Milliman’s analysis of MarketScan® commercial databases, 2006-2017. Please see references in appendices A-D.
Figure 13 Average MPR for Injectable Therapies During a 3-Year Period After DMT Initiation in Patients With
Newly Diagnosed and Existing MS
Based on Milliman’s analysis of MarketScan® commercial databases, 2006-2017. Please see references in appendices A-D.
74.5% 68.6% 66.8%
78.6%72.7% 70.0%
0%
20%
40%
60%
80%
100%
Aver
age
MPR
Months from DMT Treatment InitiationNewly Diagnosed
73.6%63.0% 60.0%
76.8%70.7% 67.9%
0%
20%
40%
60%
80%
100%
Aver
age
MPR
Months from DMT Treatment InitiationNewly Diagnosed
The majority of MS patients who switched DMTs remained with the same delivery type (85%).

Biogen An Actuarial Study of the MS Patient Journey – 2019 Update February 2019 Page 24
Milliman Client Report
RELAPSES
Classic neurologic symptoms of a relapse that are confirmable via a physical exam include sensory changes, vision issues, and walking difficulties; less quantifiable symptoms include fatigue, pain, and cognitive issues.36 The symptom variability means that relapses may often be undetected in clinical trials, in clinical practice, and in medical claims. These undetected relapses can cause delays in initiating or switching to a more efficacious DMT, which is particularly important early after diagnosis because frequent early relapses can negatively affect a patient’s long-term prognosis.37 In our analysis, relapses were examined in newly diagnosed patients from 2008 to 2017 and were identified by inpatient and ER codes or by administration of IV immunoglobulin or plasmapheresis. Patients with MS were more likely to have a relapse in the second year after diagnosis, with relapse rates decreasing and leveling off after that year (Table 7).
TABLE 7
AVERAGE ANNUAL RELAPSE RATE FOR PATIENTS WITH NEWLY DIAGNOSED MS DURING THE COURSE OF THE DISEASE
Year(0)a Year(1) Year(2) Year(3) Year(4) Year(5) Year(6) Year(7)
Number of Patients 16,255 12,239 8331 5662 3999 2722 1736 1097 Number of Patients With 1 or More Relapses
1654 1883 1006 630 432 278 197 120
Number of Relapses per Patient per Year
0.12 0.20 0.16 0.15 0.14 0.13 0.15 0.15
Average Age 43.6 44.6 45.8 46.9 47.3 49.1 50.9 51.1 aYear 0 begins with the first diagnosis encounter. Based on Milliman’s analysis of MarketScan® commercial databases, 2006-2017. Please see references in appendices A-D.
Patients with MS were more likely to have a relapse in the year after the
diagnosis year, with relapse rates leveling off afterward.
roximately 10% of MS patients are newly diagnosed annually

Biogen
An Actuarial Study of the MS Patient Journey – 2019 Update
February 2019
Page 25
Milliman Client Report
POTENTIAL IMPLICATIONS FOR PAYERS Twelve years of commercial insurance claims were analyzed to help provide insights into the MS patient
journey. We examined disease progression after diagnosis, treatment patterns with DMT, and healthcare
costs. These insights may supplement currently available evidence and may encourage payer organizations to
explore their own data.
Important Analytical Implications:
Claims-based predictive modeling may help identify patients at risk for MS. • Important impairments that are markers of disease progression have been identified in claims data
• Patient drug switching, adherence, and nonuse can be identified
• The appearance of impairments prior to diagnosis suggests the feasibility of claims-based
predictive modeling to identify patients at risk for MS
Disease burden in MS can be assessed through various indicators of disease progression and functional impairment. • Use of disability indicators analogous to those used in the EDSS, along with related neurologic
impairment indicators, may be useful in assessing disease burden in MS
Supports Expert Opinions: Clinical guidelines recommend early and ongoing DMT treatment immediately after diagnosis.23
• Nearly 30% of newly diagnosed patients with MS remained untreated after diagnosis
Due to the heterogeneity of patients with RRMS, access to a broad range of DMT options is important.7,8 • The MS population includes patients with diverse resource utilization as exhibited by considerable
variations in allowed costs
• Approximately 20% of patients switched to a different DMT within 3 years of initiating treatment

Biogen An Actuarial Study of the MS Patient Journey – 2019 Update February 2019 Page 26
Milliman Client Report
APPENDIX A: DATA SOURCES The Truven Health Analytics MarketScan® Commercial Databases (2006-2017) were used to prepare the results found in this memo. MarketScan® databases contain all paid claims generated for millions of commercially insured lives. The 2016 MarketScan® database currently contains about 30 million lives. The MarketScan® database represents the inpatient and outpatient healthcare service use of individuals nationwide who are covered by the benefit plans of large employers, health plans, government, and public organizations. The data include diagnosis codes, procedure codes, diagnosis-related group codes, and national drug codes (NDCs), along with site of service information and the amounts paid by commercial insurers. The MarketScan® database links paid claims and encounter data to detailed patient information across sites, types of providers, and over time. The annual medical database includes private sector health data from approximately 100 payers.
Please note that the contributors to MarketScan® may vary from year to year; therefore, whether a member continues in the database depends on the member continuing coverage in a health plan that continues to contribute its data to MarketScan®. A member may not appear in MarketScan® because the member has stopped or switched coverage or because the member’s health plan has stopped contributing.
In developing non-DMT cost trends, reports of Medical Care Consumer Price Index for All Urban Consumers (CPI-U) were used from the US Bureau of Labor Statistics. For DMT cost trends, Wolters Kluwer’s Medi-Span database was used to identify average wholesale price (AWP) unit prices for all DMT drugs. Medi-Span is a comprehensive drug data source that contains brand and generic drug names, NDCs, generic product identifiers, manufacturer information, and various price metrics for close to 200,000 drug products.

Biogen An Actuarial Study of the MS Patient Journey – 2019 Update February 2019 Page 27
Milliman Client Report
APPENDIX B: METHODOLOGY Denominator Population
The denominator population for the 2015 snapshot analysis of prevalence, incidence, and costs included members who were identified with MS in 2015 or any previous year, and excluded the following characteristics:
Aged <18 years or >65 years Enrolled in unknown or capitated plan types Employment status of part-time or seasonal Medicare-eligible retiree No prescription drug coverage
The denominator population for the 2006-2017 longitudinal analysis excluded months for members with the above exclusions. MS Identification
Patients with MS in the MarketScan® databases were identified if they had at least 3 of any of the following encounters—the encounters could be all the same type or a mixture of types.
Inpatient encounter (IP): Defined as an inpatient admission (acute or nonacute) for which MS ICD-9 diagnosis code 340 or International Classification of Diseases, 10th Revision (ICD-10) diagnosis code G35 was recorded in any diagnosis code position on the inpatient claim. To account for transfers between institutions and to avoid double-counting, multiple overlapping hospital admission and discharge records were counted as one IP encounter. If an IP encounter had an admission date that occurred within 24 hours of the discharge date from the prior IP encounter, the second IP encounter was not considered a separate IP encounter and was included in the first IP encounter
Outpatient encounter (OP): Defined as an outpatient service (ER, observation, evaluation and management [E&M], lab, pathology, radiology, DME, etc) for which MS ICD-9 diagnosis code 340 or ICD-10 diagnosis code G35 was recorded in any diagnosis code position on the outpatient claim. Multiple outpatient encounters by 1 patient on the same day were treated as 1 OP encounter. Additionally, OP service claims for dates within an IP encounter were not counted as an OP encounter
DMT encounter: Defined as dispensation or administration of a DMT. For the drugs in the “MS-Specific DMTs” table in Appendix C, each dispensation or administration would count as an encounter. For natalizumab, the drug was used as a qualifying DMT encounter only if the patient had no diagnosis of inflammatory bowel disease (IBD) in any position on the claim for the IV drug administration. The ICD code ranges for IBD are also listed in Appendix C. Other drugs that have uses other than in MS were not used to identify MS cases in this algorithm
The above methodology is the preferred algorithm recommended by the recently published MS identification algorithm validation study from the United States MS Prevalence Workgroup.3

Biogen An Actuarial Study of the MS Patient Journey – 2019 Update February 2019 Page 28
Milliman Client Report
Newly Diagnosed Patient Identification
Patients with newly diagnosed MS were identified as having 24 months of continuous enrollment prior to first MS diagnosis date with no earlier MS identification possible.
Commercial health plans have greater turnover of younger patients. Thus, there are proportionately fewer members meeting the 24-month continuous enrollment criteria at younger ages than at older ages. This dampens the number of newly diagnosed patients who are identified at the younger age ranges. As a result, prevalent and incident cases may appear to have the same average age, which was also reported by other investigators.
Consequently, the denominator for MS incidence was determined as the number of people in each age group with 24-month continuous enrollment. After making this modification to the normal incidence rate calculation, the average age of newly diagnosed patients was approximately 45 years for females and for males, only marginally lower than for prevalent cases.
Duration Year
For each member, duration year—year(n)—is defined as the nth year before or after the 12-month period starting with the member’s initial diagnosis date (or index date). The initial diagnosis date begins year(0). The following table illustrates our assignment of years for year(-4) through year(4).
Year(-4) Year(-3) Year(-2) Year(-1) Year(0) Year(1) Year(2) Year(3) Year(4)
Full 4 years before initial
diagnosis
Full 3 years before initial
diagnosis
Full 2 years before initial
diagnosis
Full year before initial
diagnosis
1st full year after initial diagnosis, day 1 of year(0)
1 full year after
initial diagnosis
year
2 full years after initial diagnosis
year
3 full years after initial diagnosis
year
4 full years after initial diagnosis
year
Trending of Allowed Claim Costs
Allowed claim costs were trended from the incurral month of the claim to July 1, 2017, using the following trend rates.
Non-DMT claim costs: Based on the change in Medical Care CPI-U
DMT claim costs: Based on annual change in AWP, weighted by the utilization by drug for each year

Biogen An Actuarial Study of the MS Patient Journey – 2019 Update February 2019 Page 29
Milliman Client Report
The resulting trend rates are as follows:
Year Annual Trend Rate
Non-DMT DMT 2006 3.9% 4.3% 2007 4.9% 1.4% 2008 4.9% 2.5% 2009 4.6% 3.4% 2010 5.1% 4.3% 2011 4.1% 4.2% 2012 3.3% 3.6% 2013 3.3% 0.6% 2014 3.2% 3.6% 2015 3.0% 4.6% 2016 3.8% 4.8% 2017 3.0% 3.4%
Regression Analyses
Non-DMT Claim Costs Model
A normal linear regression was chosen to estimate non-DMT claim costs, which is most accurate when compared with other linear regression models based on the Akaike information criterion (AIC), a measure of the relative quality of statistical models for a given dataset.
The regression model–dependent variable is non-DMT claim costs of MS patients. The model explanatory variables were age, gender, DMT use, MS patient status (new or established), and duration from index date.
The non-DMT claim cost regression model output is the marginal allowed non-DMT per-patient-per-year (PPPY) claim costs by explanatory variable. Marginal costs refer to the change in cost from the “base” scenario when changing the parameter variables. The base scenario is represented by the parameters with the lowest marginal non-DMT costs—a newly diagnosed male, aged 18 to 35 years at duration year(2).
The model formula is: Y = intercept + age/gender + (DMT PPPY x coefficient) + duration year + MS status
Claim Cost Regression—Marginal Allowed Non-DMT PPPY Claim Costs
Parameter Estimate Diagnosed 95% Confidence Interval Intercept $19,549 $16,990 - $22,107
Female Aged 18-35 Years $2279 $830 - $3729 Female Aged 36-45 Years $1556 $160 - $2951 Female Aged 46-55 Years $4438 $3029 - $5847 Female Aged 56+ Years $9054 $7558 - $10,550 Male Aged 18-35 Years $0 NA: Base Male Aged 36-45 Years $21 ($1417) - $1460 Male Aged 46-55 Years $5524 $3934 - $7114

Biogen An Actuarial Study of the MS Patient Journey – 2019 Update February 2019 Page 30
Milliman Client Report
Parameter Estimate Diagnosed 95% Confidence Interval Male Aged 56+ Years $12,559 $10,228 - $14,891
Newly Diagnosed / Duration Year(0) $8274 $6145 - $10,403 Newly Diagnosed / Duration Year(1) ($981) ($2954) - $992 Newly Diagnosed / Duration Year(2) $0 NA: Base Newly Diagnosed / Duration Year(3) ($790) ($3008) - $1428 Newly Diagnosed / Duration Year(4) ($1795) ($4030) - $440 Newly Diagnosed / Duration Year(5) ($1289) ($3545) - $968 Newly Diagnosed / Duration Year(6) $347 ($2607) - $3302 Newly Diagnosed / Duration Year(7) $3887 ($1231) - $9006 Newly Diagnosed / Duration Year(8) $3518 ($2104) - $9140 Newly Diagnosed / Duration Year(9) $1473 ($3945) - $6891 Newly Diagnosed / Duration Year(10)
Newly Diagnosed / Duration Year(11)
Parameter Estimate Diagnosed 95% CI Existing / Duration Year(0) $1579 $1088 - $2070 Existing / Duration Year(1) ($263) ($838) - $312 Existing / Duration Year(2) $0 NA: Base Existing / Duration Year(3) $862 $222 - $1501 Existing / Duration Year(4) $1649 $901 - $2397 Existing / Duration Year(5) $1695 $913 - $2478 Existing / Duration Year(6) $2003 $1026 - $2980 Existing / Duration Year(7) $2274 $1238 - $3309 Existing / Duration Year(8) $1863 $357 - $3370 Existing / Duration Year(9) $3634 $1643 - $5625 Existing / Duration Year(10) $2816 $1112 - $4519 Existing / Duration Year(11) $4114 $2376 - $5852
Newly Diagnosed $0 NA: Base Existing ($2121) ($4054) - ($188)
DMT Cost PPPY ($0.02) ($0.04) - $0.01 Notes: Based on Milliman’s analysis of MarketScan® commercial databases, 2006-2017. The “base” scenario, as reflected in the intercept, represents an established male patient with MS aged 18 to 35 years in duration Year(2) (highlighted rows in table). Duration Year(n) is defined as the nth year before or after the 12-month period starting with the member’s initial diagnosis date (or index date). The initial diagnosis date begins Year(0).

Biogen An Actuarial Study of the MS Patient Journey – 2019 Update February 2019 Page 31
Milliman Client Report
For example, if the annual allowed DMT claim costs of a newly diagnosed, 40-year-old female were $20,000 in the index year—year(0)—the model predicts that her annual allowed non-DMT claim costs in duration year(1) would be $14,720, or $1400 less than that of a similar person not using DMT.
Non-DMT PPPY (F40, year(1) = $14,025 + $2075 + ($20,000 x -$0.07) + $20 + $0 = $14,720 Kaplan-Meier Survival Analysis of Functional Impairment The progression of the various functional impairments experienced by patients with MS was measured using a Kaplan-Meier (KM) survival approach, a standard technique used to estimate survival functions for populations with incomplete data. Health insurance claims of patients with newly diagnosed MS were analyzed for the presence and progression of various indicators of functional impairment. Impairment indicators were tabulated for patients with MS identified from MarketScan® as newly diagnosed from several years before their diagnosis for up to 10 years after. Each year, these patients were flagged as having 1 or more of the following functional impairment indicators segmented into EDSS-derived impairments and MS-related CNS impairments. For purposes of the survival analysis, it was assumed that a patient’s impairment, once identified, persisted through the remaining observation years. Due to the limitations associated with claims data, it is not possible to determine definitively when a condition identified by one of these indicators has improved or resolved. For instance, a patient who has discontinued antidepressant therapy might continue to suffer from depression.
EDSS-derived disability indicators (identified through diagnosis and/or drug treatment): Spasticity Bladder dysfunction Cognitive/behavioral dysfunction Visual impairment Mobility impairments requiring
o Bath/commode o Cane o Crutches o Lift o Specialty bed o Walker o Wheelchair
Related neurologic impairment indicators (identified through drug treatment): Pain Fatigue Depression Anticonvulsants used for neurologic symptoms
Drugs used for neurologic impairments were grouped by their common classification; however, the use of many of these drugs for patients with MS may vary from their common classifications. For example, depression medications may have been used to treat pain. For this reason, the potential overlap between functional impairment indicators was not attempted.
A description of the identification criteria for these indicators is shown in Appendix C. A patient flagged for any of these functional impairment indicators was flagged for the remainder of the observation.

Biogen An Actuarial Study of the MS Patient Journey – 2019 Update February 2019 Page 32
Milliman Client Report
DMT Patterns and Adherence
DMT Brands Prescriptions filled for the following DMT drugs were included in the MS-specific DMTs for this analysis: Aubagio (teriflunomide), Avonex (interferon beta-1a), Betaseron (interferon beta-1b), Copaxone (glatiramer acetate), Extavia (interferon beta-1b), Gilenya (fingolimod), Glatopa (glatiramer acetate), Plegridy (peginterferon beta-1a), Rebif (interferon beta-1a), Tecfidera (dimethyl fumarate), Zinbryta (daclizumab), and Zenapax (daclizumab). Visits coded with the following DMT treatments were included in the analysis: Lemtrada (alemtuzumab), Campath (alemtuzumab), Tysabri (natalizumab), Novantrone (mitoxantrone), and Ocrevus (ocrelizumab).
For details on other MS DMT drugs, see the “Other MS DMT Drugs” table in Appendix C. For details on conventions used to define 30-day supplies of DMT drugs, see the “Adherence Conventions” table in Appendix C. Medication Possession Ratio
MPR is typically calculated based on a single prescription medication. The MPR concept was adapted because the analysis included people who may have had prescriptions for multiple DMT drugs. Overlaps in different drugs were ignored. Each newly diagnosed patient (as described in cohort descriptions) with DMT use in the 24-month period following the index date and with full eligibility in the 24 months following the first use of DMT is captured in the graph. For each patient, every eligible day from the date of first use of DMT up to 24 months after was evaluated. If a day fell in this range for a DMT drug (incurred date to incurred date + day supply), then the patient was said to be using DMT on this day. The date of first DMT use was called Day 0. For each Day x, 0 ≤ x ≤ 729 and each patient, a variant of MPR was calculated on the interval Day 0 to Day x as follows: MPR = (# days patient possesses DMT)/(x+1) The average value across patients was taken for each Day (x). Relapse Identification
“Relapse episodes” were identified as:
An acute IP admission with MS diagnosis code 340 or G35 in the primary position of the claim at least 30 days from earliest MS diagnosis date
OR
An ER or E&M claim with MS diagnosis code 340 or G35 in any position of the claim at least 30 days from earliest MS diagnosis date, and a relapse drug treatment claim or script within 7 days of the qualifying ER/E&M claim. Note that the relapse drug treatment claim and the ER/E&M claim could be the same claim
OR
Administration of IV immunoglobulin on a minimum of 3 consecutive days
OR
A plasmapheresis procedure. For a full list of plasmapheresis codes, see the “Plasmapheresis Procedure Codes” table in Appendix C

Biogen An Actuarial Study of the MS Patient Journey – 2019 Update February 2019 Page 33
Milliman Client Report
To prevent counting the same relapse episode more than once, the following algorithm was applied at the patient level to the above criteria:
Identify the earliest relapse episode occurring more than 30 days from the earliest MS diagnosis date. This qualifies as a relapse in our analysis
Identify the next relapse episode occurring at least 30 days from the most recent qualifying relapse
and continue this way until all relapses are identified for each patient Summary of Differences From Earlier Paper
Our 2016 paper analyzed patients with MS in the commercial MarketScan® database from 2003-2014, whereas this updated publication examines 2006-2017 data (http://www.milliman.com/insight/2016/ Multiple-sclerosis-New-perspectives-on-the-patient-journey/). The methodologies have also been updated. These multiple changes make it unadvisable to attempt to interpret changes from our earlier paper as trends. The patient identification methodology in the 2016 paper required 2 IP stays or OP claims (including observation, ER, or E&M) with MS ICD-9 diagnosis code 340 at any time during the claim. The updated patient identification methodology in this paper required at least 3 of any of the following encounters: 1) IP stays; 2) OP claims (including observation, ER, or E&M) with MS ICD-9 diagnosis code 340 or MS ICD-10 diagnosis code G35 at any time during the claim; or 3) dispensation or administration of a DMT. The MS-specific DMT list was slightly modified to include new drugs, such as ocrelizumab, that were not in use during the previous analysis data years, which affected the cost and utilization analyses accordingly. This updated analysis includes additional DMTs that are also used to treat other conditions, which are separated from the MS-specific DMTs for analysis of costs and were not used in the identification of patients with MS. This analysis also included more stringent criteria for persistent disability and related neurologic impairments, requiring either three 30-day drug supplies in a 6-month period or 2 diagnosis codes at least 3 months apart within a 6-month period. The previous analysis used the appearance of any disability or related neurologic code/prescription to flag an MS patient for the remainder of the study.

Biogen An Actuarial Study of the MS Patient Journey – 2019 Update February 2019 Page 34
Milliman Client Report
APPENDIX C: CODE SETS
MS DMT Drugs Used in Patient Identification
Generic Name Brand Name(s)
Daclizumab ZENAPAX ZINBRYTA
Dimethyl fumarate TECFIDERA
Fingolimod GILENYA
Glatiramer acetate COPAXONE GLATOPA
Interferon beta 1b BETASERON EXTAVIA
Interferon beta 1a AVONEX REBIF
Ocrelizumab OCREVUS
Pegylated interferon (peginterferon) beta 1a PLEGRIDY
Teriflunomide AUBAGIO
Natalizumaba TYSABRI
aDrug also used for Crohn’s disease; exclude patients with IBD on the drug claim as designated by the following ICD codes.
ICD-9: 5550 through 5569; ICD-10: K5000 through K51919.
MS-Specific Drugs
Generic Name Brand Name(s)
Alemtuzumaba CAMPATH LEMTRADA Daclizumab ZINBRYTA ZENAPAX Dimethyl fumarate TECFIDERA Fingolimod GILENYA Glatiramer acetate COPAXONE GLATOPA Interferon beta 1b EXTAVIA BETASERON Interferon beta 1a AVONEX REBIF Mitoxantronea NOVANTRONE Natalizumabb TYSABRI Ocrelizumab OCREVUS Pegylated interferon (peginterferon) beta 1a PLEGRIDY Teriflunomide AUBAGIO
aThese drugs are commonly second-line or later MS treatments and have significant use for other conditions. They were not used for identifying the MS population. bDrug also used for Crohn’s Disease; usage associated with IBD was not included to identify MS patients or subsequent analysis.

Biogen An Actuarial Study of the MS Patient Journey – 2019 Update February 2019 Page 35
Milliman Client Report
RELAPSE DRUGSa
Betamethasone (no cream, powder, lotion, ointment, spray)
Betamethasone sodium phosphate
Betamethasone sodium phosphate and acetate
Corticotropin gel (injection)
Dexamethasone
Dexamethasone sodium phosphate (include version with NaCl, no kits, ophth, otic, implant version)
Methylprednisolone
Methylprednisolone acetate
Methylprednisolone sodium succinate
Prednisolone (no ophthalmic version)
Prednisolone sodium phosphate
Prednisone
Intravenous immunoglobulin aUse only injectable or oral versions (no inhaled, otic, skin application, or ophthalmic versions).
Plasmapheresis Procedure Codes
HCPCS Codes
36514 Therapeutic apheresis; forab plasma pheresis
36515 Therapeutic apheresis; with extracorporeal immunoadsorption and plasma reinfusion
36516 Therapeutic apheresis; with extracorporeal immunoadsorption, selective adsorption or selective filtration and plasma reinfusion
ICD-9-PCS Codes
9971 Therapeutic plasmapheresis
ICD-10-PCS Codes
6A550Z3 Pheresis of Plasma, Single
6A551Z3 Pheresis of Plasma, Multiple HCPCS=Healthcare Common Procedure Coding System; ICD-9-PCS=International Classification of Diseases, 9th Revision, Procedure Coding System; ICD-10-PCS=International Classification of Diseases, 10th Revision, Procedure Coding System.
MS Treatment Drugs Also Used to Treat Other Conditionsc
Generic Name Brand Name(s) Azathioprine AZASAN IMURAN
Cladribine LEUSTATIN MAVENCLAD
Cyclophosphamide CYTOXAN ENDOXANA
Methotrexate MAXTREX OTREXUP RASUVO RHEUMATREX TREXALL XATMEP
Mycophenolate mofetil CELLCEPT MYFORTIC
Rituximab RITUXAN cThese drugs are commonly second-line or later MS treatments and have significant use for other conditions.

Biogen An Actuarial Study of the MS Patient Journey – 2019 Update February 2019 Page 36
Milliman Client Report
DRUG THERAPIES USED FOR THE IDENTIFICATION OF MS PATIENT DISABILITY INDICATORS (EDSS)
Bladder Dysfunction Drugs Darifenacin hydrobromide
Desmopressin acetate (including nasal formulation)
Fesoterodine fumarate
Imipramine HCl
Imipramine maleate
Imipramine pamoate
Mirabegron (all versions)
Oxybutynin TD
Oxybutynin chloride (all versions)
Prazosin HCl
Propantheline bromide
Solifenacin succinate
Tamsulosin HCl (not version that includes dutasteride)
Terazosin HCl
Tolterodine tartrate
Trospium chloride Spasticity Drugs Abotulinum toxin A
Baclofen (oral and intrathecal, not cream)
Clonazepam
Clonidine HCl
Dantrolene sodium
Diazepam (not gel)
Gabapentin (no gel or cream)
Gabapentin enacarbil
Levetiracitam (including the version with sodium chloride solution)
Onabotulinum toxin A (including cosmetic version)
Pramipexole hydrochloride
Rimabotulinum toxin B
Rotigotine
Tizanidine HCl
Incobotulinum
HCG
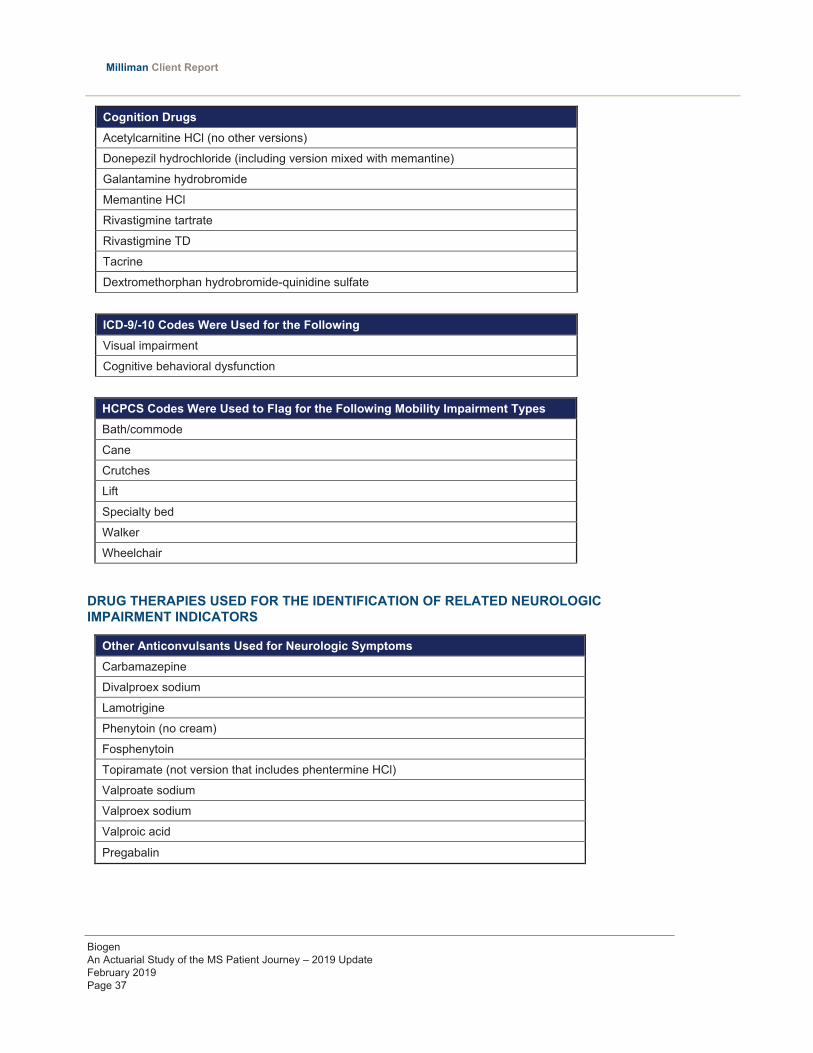
Biogen An Actuarial Study of the MS Patient Journey – 2019 Update February 2019 Page 37
Milliman Client Report
Cognition Drugs Acetylcarnitine HCl (no other versions)
Donepezil hydrochloride (including version mixed with memantine)
Galantamine hydrobromide
Memantine HCl
Rivastigmine tartrate
Rivastigmine TD
Tacrine
Dextromethorphan hydrobromide-quinidine sulfate
ICD-9/-10 Codes Were Used for the Following Visual impairment
Cognitive behavioral dysfunction
HCPCS Codes Were Used to Flag for the Following Mobility Impairment Types Bath/commode
Cane
Crutches
Lift
Specialty bed
Walker
Wheelchair
DRUG THERAPIES USED FOR THE IDENTIFICATION OF RELATED NEUROLOGIC IMPAIRMENT INDICATORS
Other Anticonvulsants Used for Neurologic Symptoms Carbamazepine
Divalproex sodium
Lamotrigine
Phenytoin (no cream)
Fosphenytoin
Topiramate (not version that includes phentermine HCl)
Valproate sodium
Valproex sodium
Valproic acid
Pregabalin

Biogen An Actuarial Study of the MS Patient Journey – 2019 Update February 2019 Page 38
Milliman Client Report
Analgesics Acetaminophen
Aspirin
Buprenorphine HCl
Butorphanol tartrate
Celecoxib
Choline and magnesium salicylates
Codeine sulfate
Diclofenac sodium
Diflunisal
Etodolac
Fenoprofen
Fentanyl (all versions, including sublingual spray, EXCEPT lozenge on a handle)
Flurbiprofen
Hydrocodone bitartrate
Hydromorphone HCl
Ibuprofen
Indomethacin
Ketoprofen
Ketorolac tromethamine
Mefenamic acid
Meloxicam
Meperidine HCl
Meclofenamate sodium
Methadone HCl
Morphine sulfate
Nabumetone
Nalbuphine HCl
Naproxen
Naproxen sodium
Oxaprozin
Oxycodone HCl
Oxymorphone HCl
Pentazocine
Piroxicam
Salsalate
Sulindac
Tapentadol HCl
Tolmetin sodium
Tramadol HCl

Biogen An Actuarial Study of the MS Patient Journey – 2019 Update February 2019 Page 39
Milliman Client Report
Antidepressants Amoxapine
Amitriptyline HCl (no creams or kits, no mixtures with any other drugs)
Bupropion HCl (including versions labelled as smoking deterrent)
Citalopram
Clomipramine HCl
Desipramine HCl
Desvenlafaxine
Desvenlafaxine fumarate
Desvenlafaxine succinate
Doxepin HCl (no cream)
Duloxetine HCl
Escitalopram oxalate
Fluoxetine HCl (not version mixed with olanzapine)
Fluvoxamine maleate
Mirtazapine
Nefazodone HCl
Nortriptyline HCl
Paroxetine HCl
Paroxetine mesylate
Protriptyline HCl
Sertraline HCl
Trazodone HCl
Trimipramine maleate
Venlafaxine HCl
Vilazodone HCl
Vortioxetine hydrobromide
Vortioxetine
Vortioxetine HCl Fatigue Drugs Amantadine HCL (not compound kit mixed with other drugs)
Amphetamine
Amphetamine sulfate
Amphetamine-Dextroamphetamine
Armodafinil
Dextroamphetamine sulfate
Lisdexamfetamine
Methamphetamine HCl
Methylphenidate HCl

Biogen An Actuarial Study of the MS Patient Journey – 2019 Update February 2019 Page 40
Milliman Client Report
Fatigue Drugs (cont’d) Modafinil
Pemoline
Dexmethylphenidate HCl
HCPCS Adherence Convention for Physician-Administered DMT Drugs MS-Specific DMT Drugs
HCPCS Adherence Convention Procedure Code Description
HCPCS code is equivalent to one 30-day supply J7513 Daclizumab, parenteral, 25 mg
HCPCS code is equivalent to 7/30 days of a 30-day supply Q3025 Injection, interferon beta-1a, 11 mcg for
intramuscular use HCPCS code is equivalent to 7/30 days of a 30-day supply Q3027 Injection, interferon beta-1a, 1 mcg for
intramuscular use HCPCS code is equivalent to 7/30 days of a 30-day supply Q3028 Injection, interferon beta-1a, 1 mcg for
subcutaneous use HCPCS code is equivalent to 7/30 days of a 30-day supply J1595 Injection, glatiramer acetate, 20 mg
HCPCS code is equivalent to 7/30 days of a 30-day supply J1826 Injection, interferon beta-1a, 30 mcg
HCPCS code is equivalent to 7/30 days of a 30-day supply J1825 Injection, interferon beta-1a, 33 mcg
HCPCS code is equivalent to 2/30 days of a 30-day supply J1830
Injection, interferon beta-1b, 0.25 mg (code may be used for Medicare when drug administered under the direct supervision of a physician, not for use when drug is self-administered)
HCPCS code is equivalent to 7/30 days of a 30-day supply Q3026 Injection, interferon beta-1a, 11 mcg for
subcutaneous use HCPCS code is equivalent to six 30-day supplies C9494 Injection, ocrelizumab, 1 mg
HCPCS code is equivalent to six 30-day supplies J2350 Injection, ocrelizumab, 1 mg
Other MS Treatment Drugs
HCPCS Adherence convention Procedure Code Description
HCPCS code is equivalent to 28/30 days of a 30-day supply C9126 Injection, Natalizumab, per 5 mg HCPCS code is equivalent to twelve 30-day supplies C9419 Inj cladribine, brand HCPCS code is equivalent to one 30-day supply C9420 Cyclophosphamide inj, brand HCPCS code is equivalent to one 30-day supply C9421 Cyclophosphamide lyo, brand HCPCS code is equivalent to twelve 30-day supplies J0202 Injection, alemtuzumab, 1 mg HCPCS code is equivalent to 28/30 days of a 30-day supply J2323 Injection, natalizumab, 1 mg HCPCS code is equivalent to 1/30 days of a 30-day supply J8530 Cyclophosphamide; oral, 25 mg HCPCS code is equivalent to 7/30 of a 30-day supply J8610 Methotrexate; oral, 2.5 mg HCPCS code is equivalent to twelve 30-day supplies J9010 Injection, alemtuzumab, 10 mg

Biogen An Actuarial Study of the MS Patient Journey – 2019 Update February 2019 Page 41
Milliman Client Report
Other MS Treatment Drugs (cont’d)
HCPCS Adherence convention Procedure Code Description
HCPCS code is equivalent to twelve 30-day supplies J9065 Injection, cladribine, per 1 mg HCPCS code is equivalent to one 30-day supply J9070 Cyclophosphamide, 100 mg HCPCS code is equivalent to one 30-day supply J9080 Cyclophosphamide, 200 mg HCPCS code is equivalent to one 30-day supply J9090 Cyclophosphamide, 500 mg HCPCS code is equivalent to one 30-day supply J9091 Cyclophosphamide, 1.0 gram HCPCS code is equivalent to one 30-day supply J9092 Cyclophosphamide, 2.0 gram HCPCS code is equivalent to one 30-day supply J9093 Cyclophosphamide, lyophilized, 100 mg
HCPCS code is equivalent to one 30-day supply J9094 Cyclophosphamide, lyophilized, 200 mg
HCPCS code is equivalent to one 30-day supply J9095 Cyclophosphamide, lyophilized, 500 mg
HCPCS code is equivalent to one 30-day supply J9096 Cyclophosphamide, lyophilized, 1.0 gram
HCPCS code is equivalent to one 30-day supply J9097 Cyclophosphamide, lyophilized, 2.0 gram
HCPCS code is equivalent to 7/30 of a 30-day supply J9250 Methotrexate sodium, 5 mg HCPCS code is equivalent to 7/30 of a 30-day supply J9260 Methotrexate sodium, 50 mg HCPCS code is equivalent to three 30-day supplies J9293 Injection, mitoxantrone hydrochloride,
per 5 mg HCPCS code is equivalent to twelve 30-day supplies J9310 Injection, rituximab, 100 mg HCPCS code is equivalent to 28/30 days of a 30-day supply Q4079 Natalizumab injection HCPCS code is equivalent to twelve 30-day supplies Q9979 Injection, Alemtuzumab, 1 mg HCPCS code is equivalent to 1/30 days of a 30-day supply J7500 Azathioprine, oral, 50 mg HCPCS code is equivalent to 1/30 days of a 30-day supply J7501 Azathioprine, parenteral, 100 mg HCPCS code is equivalent to 1/30 days of a 30-day supply C9436 Azathioprine parenteral,brnd HCPCS code is equivalent to 1/30 days of a 30-day supply J7517 Mycophenolate mofetil, oral, 250 mg HCPCS code is equivalent to 1/30 days of a 30-day supply C9219 Mycophenolic acid, oral HCPCS code is equivalent to 1/30 days of a 30-day supply J7518 Mycophenolic acid, oral, 180 mg

Biogen An Actuarial Study of the MS Patient Journey – 2019 Update February 2019 Page 42
APPENDIX D: SUPPLEMENTAL DATA
TABLE 5 ALLOWED PPPM COSTS FOR PATIENTS WITH NEWLY DIAGNOSED MS DURING THE COURSE OF THE DISEASE
(trended to 2017)a
Service Line Year (-10)
Year (-9)
Year (-8)
Year (-7)
Year (-6)
Year (-5)
Year (-4)
Year (-3)
Year (-2)
Year (-1)
Year (0)*
Year (1)
Year (2)
Year (3)
Year (4)
Year (5)
Year (6)
Year (7)
Year (8)
Year (9)
Member Months 6714 11,168 17,990 28,845 43,294 64,483 98,731 153,159 195,080 195,064 176,314 123,243 82,067 57,087 40,037 26,739 16,982 10,240 5314 1715
Patients 741 1180 1919 2983 4413 6621 10,095 15,634 16,255 16,255 16,255 12,239 8331 5662 3999 2722 1736 1097 612 260
IP Facility & Professional $103 $126 $120 $108 $134 $186 $169 $159 $200 $256 $789 $300 $323 $354 $290 $270 $426 $405 $262 $340
Skilled Nursing Facility $4 $1 $0 $0 $1 $3 $0 $1 $2 $5 $15 $10 $7 $11 $10 $9 $8 $8 $11 $11
Home Health $1 $3 $1 $4 $19 $3 $5 $9 $13 $12 $31 $27 $25 $20 $26 $37 $32 $35 $24 $14
Hospice $0 $0 $0 $0 $0 $0 $0 $0 $0 $0 $1 $1 $4 $3 $2 $1 $2 $1 $1 $6
Emergency Department $31 $25 $25 $29 $28 $34 $35 $40 $46 $74 $105 $67 $60 $52 $52 $50 $60 $47 $60 $74
Lab & Pathology1 $17 $19 $21 $23 $24 $26 $26 $28 $30 $48 $67 $43 $42 $40 $40 $40 $43 $50 $48 $39
Radiology - Advanced Imaging1 $29 $26 $28 $29 $29 $33 $31 $37 $46 $141 $242 $142 $122 $115 $106 $110 $105 $98 $116 $140
Radiology - Other1 $15 $17 $20 $23 $21 $21 $23 $22 $24 $28 $37 $29 $32 $32 $28 $35 $44 $29 $42 $46
Physical/ Occupational/ Speech Therapy1 $11 $9 $9 $11 $11 $11 $12 $13 $15 $20 $38 $26 $23 $23 $23 $28 $26 $30 $35 $36
Outpatient Other2 $106 $130 $130 $133 $146 $148 $152 $154 $170 $239 $400 $362 $324 $318 $304 $316 $279 $293 $332 $411
DME/Supplies $7 $5 $6 $8 $12 $8 $10 $10 $13 $14 $25 $26 $26 $24 $25 $26 $28 $34 $30 $52
Professional - Other3 $95 $85 $92 $100 $101 $106 $109 $116 $131 $174 $278 $214 $214 $213 $204 $206 $184 $215 $196 $208
Drug - Other4 $117 $117 $129 $131 $132 $137 $150 $161 $176 $198 $292 $319 $348 $347 $342 $374 $409 $450 $422 $388
Biogen An Actuarial Study of the MS Patient Journey – 2019 Update February 2019 Page 43
Milliman Client Report
Year (-12)
Year (-11)
Year (-10)
Year (-9)
Year (-8)
Year (-7)
Year (-6)
Year (-5)
Year (-4)
Year (-3)
Year (-2)
Year (-1)
Year (0)*
Year (1)
Year (2)
Year (3)
Year (4)
Year (5)
Year (6)
Year (7)
Year (8)
Year (9)
Member Months 532 2,915 6714 11,168 17,990 28,845 43,294 64,483 98,731 153,159 195,080 195,064 176,314 123,243 82,067 57,087 40,037 26,739 16,982 10,240 5,314 1,715
Patients 112 393 741 1180 1919 2983 4413 6621 10,095 15,634 16,255 16,255 16,255 12,239 8331 5662 3999 2722 1736 1097 612 260
Subtotal - Non-DMT Services $344 $545 $537 $563 $581 $598 $658 $716 $723 $748 $865 $1210 $2318 $1567 $1550 $1552 $1452 $1502 $1647 $1696 $1578 $1765
Standard Deviation $699 $1961 $1094 $1542 $1207 $1606 $2151 $6051 $1860 $2165 $2777 $2957 $5316 $3760 $4410 $4135 $3802 $3487 $4118 $5625 $4671 $3398
Lower 95% CI $215 $351 $458 $475 $527 $540 $595 $570 $687 $714 $822 $1,165 $2236 $1501 $1455 $1444 $1334 $1371 $1454 $1363 $1208 $1352
Upper 95% CI $474 $738 $616 $651 $635 $656 $722 $862 $760 $782 $908 $1,255 $2399 $1634 $1645 $1660 $1569 $1633 $1841 $2028 $1949 $2178
Subtotal - DMT Drugs $0 $0 $0 $0 $0 $0 $0 $0 $0 $0 $0 $0 $3311 $3511 $3509 $3409 $3397 $3453 $3456 $3465 $3390 $3649
Standard Deviation $0 $0 $0 $0 $0 $0 $0 $0 $0 $0 $0 $0 $3034 $3342 $3435 $3358 $3393 $3428 $3406 $3793 $5200 $5255
Total - All Costs $344 $545 $537 $563 $581 $598 $658 $716 $723 $748 $865 $1210 $5629 $5078 $5059 $4961 $4849 $4955 $5103 $5161 $4969 $5414
Standard Deviation $699 $1961 $1094 $1542 $1207 $1606 $2151 $6051 $1860 $2165 $2777 $2957 $7111 $4901 $5429 $5214 $4964 $4844 $5189 $6806 $6828 $6154
aNotes: Based on Milliman's analysis of MarketScan® commercial databases, 2006-2017. Allowed claim costs trended to 2017. Year(0) is the 12-month period beginning on the earliest claim contributing to an MS diagnosis (index date).Year(n) is the 12-month period (+/-) from the index date. 1. Includes facility and professional. 2. Includes services such as outpatient surgery and psychiatric. Facility costs only. 3. Includes professional services not otherwise listed such as surgery and office visits. 4. Includes prescription drugs only.

Biogen An Actuarial Study of the MS Patient Journey – 2019 Update February 2019 Page 44
TABLE 6 AVERAGE ANNUAL RELAPSE RATE FOR PATIENTS WITH NEWLY DIAGNOSED MS DURING THE
COURSE OF THE DISEASEa
Year (0)* Year(1) Year(2) Year(3) Year(4) Year(5) Year(6) Year(7)
Number of Patients 16,255 12,239 8331 5662 3999 2722 1736 1097
Number of Patients With ≥1 Relapses
1654 1883 1006 630 432 278 197 120
Number of Relapses PPPY 0.12 0.20 0.16 0.15 0.14 0.13 0.15 0.15
Average Age (years) 43.6 44.6 45.8 46.9 47.3 49.1 50.9 51.1
aNotes: Based on Milliman’s analysis of MarketScan® commercial databases, 2006-2017. Year(0) is the 12-month period beginning on the earliest claim contributing to an MS diagnosis (index date); Year(n) is the 12-month period (+/-) from the index date.
TABLE 7 SWITCHING BY DELIVERY TYPE FOR NEWLY DIAGNOSED AND
EXISTING MS PATIENTS New & Existingb
1st Type 2nd Type 3rd Type Oral Oral (No Switch)
12,053 38.7%
10,613 88.1%
Injectable Oral
686 5.7%
107 15.6% Injectable (No Switch)
529 77.1% Infused
50 7.3% Infused Oral
754 6.3%
23 3.1% Injectable
19 2.5% Infused (No Switch)
712 94.4% Injectable Oral Oral (No Switch)
15,915 51.1% 2160 13.6% 1926 89.2%
Biogen An Actuarial Study of the MS Patient Journey – 2019 Update February 2019 Page 45
Milliman Client Report
New & Existingb
1st Type 2nd Type 3rd Type Injectable
137 6.3% Infused
97 4.5% Injectable (No Switch)
13,282 83.5% Infused Oral
473 3.0%
32 6.8% Injectable
22 4.7% Infused (No Switch)
419 88.6% Infused Oral Oral (No Switch)
3185 10.2%
278 8.7%
221 79.5% Injectable
11 4.0% Infused
46 16.5% Injectable Oral
79 2.5%
13 16.5% Injectable (No Switch)
54 68.4% Infused
12 4.3% Infused (No Switch)
2828 88.8%
bThis analysis excludes 396 patients whose treatment pattern was not identifiable.

Biogen An Actuarial Study of the MS Patient Journey – 2019 Update February 2019 Page 46
Milliman Client Report
REFERENCES 1. Giovannoni G, Butzkueven H, Dhib-Jalbut S, et al. Brain Health: Time Matters in Multiple Sclerosis.
http://www.emsp.org/wp-content/uploads/2015/10/time-matters-in-ms-report-oct15.pdf. Published October 2015. Accessed February 14, 2019.
2. Wallin MT, Culpepper WJ, Campbell JD, et al; on behalf of the US Multiple Sclerosis Prevalence Workgroup. The prevalence of MS in the United States: a population-based estimate using health claims data [published online ahead of print]. Neurology. February 15, 2019. doi:10.1212/WNL.0000000000007035.
3. Culpepper WJ, Marrie RA, Langer-Gould A, et al; on behalf of the United States Multiple Sclerosis Prevalence Workgroup (MSPWG). Validation of an algorithm for identifying MS cases in administrative health claims datasets [published online ahead of print]. Neurology. February 15, 2019.
4. Segal BM. Multiple sclerosis. In: Rich RR, Fleisher TA, Shearer WT, Schroeder, Frew AJ, Weyand CM, eds. Clinical Immunology: Principles and Practice. 5th ed. Amsterdam: Elsevier; 2019:891-902.
5. Owens GM. Managed care aspects of managing multiple sclerosis. Am J Manag Care. 2013;19(suppl 16):S307-S312.
6. Lewis PA, Spillane JE. Multiple sclerosis. In: The Molecular and Clinical Pathology of Neurodegenerative Disease. 1st ed. London: Academic Press; 2019:221-251.
7. Multiple Sclerosis Coalition. The Use of Disease-Modifying Therapies in Multiple Sclerosis: Principles and Current Evidence. http://www.nationalmssociety.org/getmedia/5ca284d3-fc7c-4ba5-b005-ab537d495c3c/DMT_Consensus_MS_Coalition_color. Updated September 2018. Accessed February 14, 2019.
8. Corboy JR, Halper J, Langer-Gould AM, Mattson DH, Schwarz H, Homonoff M. Availability of disease modifying therapies (DMT) for treatment of relapsing forms of MS. American Academy of Neurology website. https://www.aan.com/siteassets/home-page/policy-and-guidelines/policy/position-statements/18_dmt-ms-ps_v304.pdf. Accessed February 14, 2019.
9. Kobelt G, Thompson A, Berg J, Gannedahl M, Eriksson J; the MSCOI Study Group; the European Multiple Sclerosis Platform. New insights into the burden and costs of multiple sclerosis in Europe. Mult Scler. 2017;23(8):1123-1136.
10. Kobelt G, Berg J, Atherly D, Hadjimichael O. Costs and quality of life in multiple sclerosis: a cross-sectional study in the United States. Neurology. 2006;66(11):1696-1702.
11. Krause JS, Dismuke-Greer CE, Jarnecke M, Li C, Reed KS, Rumrill P. Employment and gainful earnings among those with multiple sclerosis. Arch Phys Med Rehabil. In press.
12. The 2014 drug trend report. Express Scripts website. http://lab.express-scripts.com/drug-trend-report/~/media/fdc342d554514b2d81973dbcca4d4654.ashx. Accessed February 14, 2019.
13. Wallin MT, Culpepper WJ, Campbell J, et al; for the United States Multiple Sclerosis Prevalence Workgroup. The prevalence of MS in the United States: a population-based healthcare database approach [P344]. Mult Scler. 2017;23(S3):125.
14. Marrie RA, Hanwell H. General health issues in multiple sclerosis: comorbidities, secondary conditions, and health behaviors. Continuum (Minneap Minn). 2013;19(4 Multiple Sclerosis):1046-1057.
15. Polman CH, Reingold SC, Banwell B, et al. Diagnostic criteria for multiple sclerosis: 2010 revisions to the McDonald criteria. Ann Neurol. 2011;69(2):292-302.
16. Lublin FD, Reingold SC, Cohen JA, et al. Defining the clinical course of multiple sclerosis: the 2013 revisions. Neurology. 2014;83(3):278-286.
17. Kalincik T, Vivek V, Jokubaitis V, et al; on behalf of the MSBase Study Group. Sex as a determinant of relapse incidence and progressive course of multiple sclerosis. Brain. 2013 ;136(Pt 12):3609-3617.
18. Naci H, Fleurence R, Birt J, Duhig A. (2010). Economic burden of multiple sclerosis: a systematic review of the literature. Pharmacoeconomics. 2010;28(5):363-379.

Biogen An Actuarial Study of the MS Patient Journey – 2019 Update February 2019 Page 47
Milliman Client Report
19. Kurtzke JF. Rating neurologic impairment in multiple sclerosis: an expanded disability status scale (EDSS). Neurology. 1983;33(11):1444-1452.
20. Schmidt S, Koehler J, Winterstein C, Schicklmaier P, Kallmann B. An epidemiological study on the course of disease and therapeutic considerations in relapsing-remitting multiple sclerosis patients receiving injectable first-line disease-modifying therapies in Germany (EPIDEM). Ther Adv Neurol Disord. 2018;11:1756285617749802.
21. Maloni H. Cognitive impairment in multiple sclerosis. J Nurse Pract. 2018;14(3):172-177.
22. Wingerchuk DM, Weinshenker BG. Disease modifying therapies for relapsing multiple sclerosis. BMJ. 2016;354:i3518.
23. Mitsikostas DD, Goodin DS. Comparing the efficacy of disease-modifying therapies in multiple sclerosis. Mult Scler Relat Dis. 2017;18:109-116.
24. Disease-Modifying Therapies for MS. National Multiple Sclerosis Society website. http://www.nationalmssociety.org/NationalMSSociety/media/MSNationalFiles/Brochures/Brochure-The-MS-Disease-Modifying-Medications.pdf. Updated May 2018. Accessed February 14, 2019.
25. Thompson AJ, Baranzini SE, Geurts J, Hemmer B, Ciccarelli O. Multiple sclerosis. Lancet. 2018;391(10130):1622-1636.
26. Eagle T, Stuart F, Chua AS, et al. Treatment satisfaction across injectable, infusion, and oral disease-modifying therapies for multiple sclerosis. Mult Scler Relat Disord. 2017;18:196-201.
27. Tan H, Cai Q, Agarwal S, Stephenson JJ, Kamat S. Impact of adherence to disease-modifying therapies on clinical and economic outcomes among patients with multiple sclerosis. Adv Ther. 2011;28(1):51-61.
28. Prescott JD, Factor S, Pill M, Levi GW. Descriptive analysis of the direct medical costs of multiple sclerosis in 2004 using administrative claims in a large nationwide database. J Manag Care Pharm. 2007;13(1):44-52.
29. Capkun G, Lahoz R, Verdun E, et al. Expanding the use of administrative claims databases in conducting clinical real-world evidence studies in multiple sclerosis. Curr Med Res Opin. 2015;31(5):1029-1039.
30. Carroll CA, Fairman KA, Lage MJ. Updated cost-of-care estimates for commercially insured patients with multiple sclerosis: retrospective observational analysis of medical and pharmacy claims data. BMC Health Serv Res. 2014;14:286.
31. Sinay V, Akly MP, Zanga G, Ciardi C, Racosta JM. School performance as a marker of cognitive decline prior to diagnosis of multiple sclerosis. Mult Scler. 2015;21(7):945-952.
32. Williams AE, Vietri JT, Isherwood G, Flor A. Symptoms and association with health outcomes in relapsing-remitting multiple sclerosis: results of a US patient survey. Mult Scler Int. 2014;2014:203183
33. McNamara C, Sugrue G, Murray B, MacMahon PJ. Current and emerging therapies in multiple sclerosis implications for the radiologist, part 2 – surveillance for treatment complications and disease progression. AJNR Am J Neuroradiol. 2017;38(9):1672-1680.
34. Yermakov S, Davis M, Calnan M, et al. Impact of increasing adherence to disease-modifying therapies on healthcare resource utilization and direct medical and indirect work loss costs for patients with multiple sclerosis. J Med Econ. 2015;18(9):711-720.
35. Thomas NP, Curkendall S, Farr AM, Yu E, Hurley D. The impact of persistence with therapy on inpatient admissions and emergency room visits in the US among patients with multiple sclerosis. J Med Econ. 2016;19(5):497-505.
36. Matza LS, Kim K, Phillips G, et al. Multiple sclerosis relapse: qualitative findings from clinician and patient interviews. Mult Scler Relat Disord. 2019;27:139-146.
37. Scalfari A, Neuhaus A, Degenhardt A, et al. The natural history of multiple sclerosis, a geographically based study 10: relapses and long-term disability. Brain. 2010;133(Pt 7):1914-1929.

Biogen An Actuarial Study of the MS Patient Journey – 2019 Update February 2019 Page 48
Milliman Client Report
©2019 Biogen. All rights reserved. Printed in the USA. 03/19 FCH-US-4808
Related Documents


