This article was downloaded by: [Erasmus University] On: 16 July 2012, At: 08:16 Publisher: Routledge Informa Ltd Registered in England and Wales Registered Number: 1072954 Registered office: Mortimer House, 37-41 Mortimer Street, London W1T 3JH, UK Cognition and Instruction Publication details, including instructions for authors and subscription information: http://www.tandfonline.com/loi/hcgi20 Multiple Representations in Number Line Estimation: A Developmental Shift or Classes of Representations? Samantha Bouwmeester a & Peter P. J. L. Verkoeijen a a Erasmus University Rotterdam Version of record first published: 10 Jul 2012 To cite this article: Samantha Bouwmeester & Peter P. J. L. Verkoeijen (2012): Multiple Representations in Number Line Estimation: A Developmental Shift or Classes of Representations?, Cognition and Instruction, 30:3, 246-260 To link to this article: http://dx.doi.org/10.1080/07370008.2012.689384 PLEASE SCROLL DOWN FOR ARTICLE Full terms and conditions of use: http://www.tandfonline.com/page/terms-and-conditions This article may be used for research, teaching, and private study purposes. Any substantial or systematic reproduction, redistribution, reselling, loan, sub-licensing, systematic supply, or distribution in any form to anyone is expressly forbidden. The publisher does not give any warranty express or implied or make any representation that the contents will be complete or accurate or up to date. The accuracy of any instructions, formulae, and drug doses should be independently verified with primary sources. The publisher shall not be liable for any loss, actions, claims, proceedings, demand, or costs or damages whatsoever or howsoever caused arising directly or indirectly in connection with or arising out of the use of this material.

Welcome message from author
This document is posted to help you gain knowledge. Please leave a comment to let me know what you think about it! Share it to your friends and learn new things together.
Transcript
This article was downloaded by: [Erasmus University]On: 16 July 2012, At: 08:16Publisher: RoutledgeInforma Ltd Registered in England and Wales Registered Number: 1072954 Registeredoffice: Mortimer House, 37-41 Mortimer Street, London W1T 3JH, UK
Cognition and InstructionPublication details, including instructions for authors andsubscription information:http://www.tandfonline.com/loi/hcgi20
Multiple Representations in Number LineEstimation: A Developmental Shift orClasses of Representations?Samantha Bouwmeester a & Peter P. J. L. Verkoeijen aa Erasmus University Rotterdam
Version of record first published: 10 Jul 2012
To cite this article: Samantha Bouwmeester & Peter P. J. L. Verkoeijen (2012): MultipleRepresentations in Number Line Estimation: A Developmental Shift or Classes of Representations?,Cognition and Instruction, 30:3, 246-260
To link to this article: http://dx.doi.org/10.1080/07370008.2012.689384
PLEASE SCROLL DOWN FOR ARTICLE
Full terms and conditions of use: http://www.tandfonline.com/page/terms-and-conditions
This article may be used for research, teaching, and private study purposes. Anysubstantial or systematic reproduction, redistribution, reselling, loan, sub-licensing,systematic supply, or distribution in any form to anyone is expressly forbidden.
The publisher does not give any warranty express or implied or make any representationthat the contents will be complete or accurate or up to date. The accuracy of anyinstructions, formulae, and drug doses should be independently verified with primarysources. The publisher shall not be liable for any loss, actions, claims, proceedings,demand, or costs or damages whatsoever or howsoever caused arising directly orindirectly in connection with or arising out of the use of this material.

COGNITION AND INSTRUCTION, 30(3), 246–260, 2012Copyright C© Taylor & Francis Group, LLCISSN: 0737-0008 print / 1532-690X onlineDOI: 10.1080/07370008.2012.689384
Multiple Representations in Number Line Estimation:A Developmental Shift or Classes of Representations?
Samantha Bouwmeester and Peter P. J. L. VerkoeijenErasmus University Rotterdam
Children’s estimation patterns on a number line estimation task may provide information about themental representation of the magnitude of numbers. Siegler and his colleagues concluded that chil-dren’s mental representations shift from a logarithmic-ruler representation to a linear-ruler represen-tation. However, there are important methodological issues with respect to their number-line studiesthat threaten the validity of the conclusions. We discuss these methodological issues and proposean alternative method to analyze estimation data. One hundred nineteen children from kindergarten,first, and second grade performed a number-line estimation task in which they had to estimate theposition of 30 numbers on a 0-to-100 number line. The results supported the hypothesis that childrenshow various kinds of estimation patterns. Five classes of children were distinguished, which werecharacterized by different estimation patterns. A remarkable result was that the logarithmic-rulerrepresentation was not found. Although young children were more likely to show overestimation ofsmall numbers than older children, this developmental trend was small and not significant.
Most people are unaware of how many times they actually estimate in everyday life. We estimateat what time we have to leave home in order to catch the bus, we estimate whether we haveenough cash to pay for our groceries, we estimate the amount of salt we add to our meal tomake it tasty yet not too salty. For these and many other examples estimation is used becauseaccurate estimates are sufficient for many purposes and because people often lack the knowledge,time, means, or motivation needed to calculate precise values (Siegler & Booth, 2005). However,estimation in everyday life is a very complex process because to be of practical use it may requireknowledge of the problem context, knowledge of measurement units like time, distance, quantity(Siegler & Booth, 2004) and a good awareness of the boundaries of an estimate.
Despite the fact that people often use estimation in their day-to-day routine, estimation has—until recently—not explicitly been taught in elementary school. However, this may not be prob-lematic, because various studies have demonstrated that estimation performance is related togeneral arithmetic skills, which do receive a lot of attention in elementary school instruc-tion. For instance, Booth and Siegler (2006, 2008), Siegler and Booth (2004) and Schneider,Grabner, and Paetsch (2009) showed that performance on a number line estimation task was a
Correspondence should be addressed to Samantha Bouwmeester, Department of Psychology, Erasmus UniversityRotterdam, P.O. Box 1738, NL-3000 DR Rotterdam, The Netherlands. E-mail: [email protected]
Dow
nloa
ded
by [
Era
smus
Uni
vers
ity]
at 0
8:16
16
July
201
2

MULTIPLE RESPRESENTATIONS IN NUMBER LINE ESTIMATION 247
good predictor of math achievement. Furthermore, it should be noted that general estimation abil-ity has become more and more important since problem-based mathematics gained popularity. Acentral aim of problem-based mathematics is that students think about diverse solution strategiesin realistically framed problems (Gravemeijer & Doorman, 1999; Treffers, 1991, 1993). Besidesthe fact that estimation skills are important in realistic problem solving, they also may play animportant role in pure number arithmetic in which a realistic context is not available. In this study,we focus on the estimation performance of children on a number line estimation task. Learningto estimate on a number line is not an educational goal per se but number lines are often used toteach basic arithmetic skills. We will argue in this article that it is very interesting to investigatechildren’s estimation ability on a number line task because the estimation pattern may tell us alot about the mental representations children have of magnitudes of numbers and of distancesbetween numbers.
NUMBER LINES IN EDUCATION
In the United States, not all researchers support the use of number lines in the primary gradesto teach arithmetic or for other purposes. According to these researchers the continuous quantitycharacter of the number line does not fit with the discrete quantity perspective children generallyhave during the first grades of primary school (Ernest, 1985; Fuson, 2009). For this reason, theNational Research Council (see Fuson, 2009) has recommended against using number lines asan instructional tool before grade 2.
However, in the Netherlands, and also, for example, in Italy (see Di Meo, 2008), children startpracticing with number lines from grade 1. Before grade 1, they mainly practice with counting andordering numbers. During this kindergarten phase, the mental representation of most children isassumed to consist of a list of the counting words. From grade 1, number lines are introduced in theclassroom in order to facilitate basic arithmetic skills like addition and subtraction (Beishuizen,1993; Gravemeijer, 2000). A reason why children in the Netherlands practice with number linesearlier than in the United States may be that until the second half of grade 2 the Dutch arithmeticteaching methods mainly use discrete quantity number lines represented by, for example, ladderson which the numbers are represented by the rungs or on which the numbers are explicitly written.From the second half of grade 2, empty number lines are introduced in which the end poles andthe unit lengths are rough or not presented at all. Children are supposed to represent the arithmeticproblem by first putting the first number on the line, and then add or subtract a certain distance.When children start using number lines to represent addition and subtraction problems they willgradually learn that numbers can be represented as distances on a number line. Although absolutemeasurement units may not be introduced yet—the addition and subtraction problems do notrequire measurement units—a realistic representation of the addends and subtracts ask for anunderstanding of the underlying scale.
Number Line Estimation and Mental Representation
A typical number line estimation task requires children to estimate the position of a number, or thenumber of a position, on a number line in which the endpoints only are labeled (e.g., 0 and 100).The estimation pattern and the kinds of estimation mistakes children make provide important
Dow
nloa
ded
by [
Era
smus
Uni
vers
ity]
at 0
8:16
16
July
201
2

248 BOUWMEESTER AND VERKOEIJEN
information about the processes involved in representing numbers. Hence, a number line estima-tion task is a useful tool to obtain insight into the mental representations children have of thedistances between numbers on a number line. However, it is also important to realize that chil-dren’s estimation patterns—when they show any pattern at all—are not the same as their internalrepresentations. That is, although a certain internal representation is expected to be reflectedin an estimation pattern, the reverse may not be true: There may be a multitude of alternativeexplanations for children’s estimations apart from their internal representations of the magnitudeof numbers.
Pure Numerical Estimation and Age
A central finding emerging from number line estimation research is that people—but also animals(see, e.g., Dehaene, 1997, 2001)—tend to overestimate the magnitude of small numbers andunderestimate the magnitude of large numbers. When the estimated number is presented onthe y-axis and the actual number on the x-axis, the resultant estimation pattern of this inappropriaterepresentation of numbers resembles a logarithmic function (Dehaene, 1997, 2001). Dehaene(1997) showed that for young and old people and even for animals the estimations patterns onseveral tasks can be represented by a logarithmic function.
Despite the large amount of empirical evidence for this logarithmic ruler presentation perspec-tive, it may be questioned whether it also applies specifically for estimation patterns and mentalrepresentations in a number line task. In number line tasks the end pole is fixed by a number(e.g., 100 or 1000) that determines the scale of the number line. When estimating the positionof large numbers, close to the end pole of the line, the end pole may serve as a reference. Thismeans that the underestimation of large numbers may decrease—instead of increase as suggestedby the logarithmic ruler account—for numbers close to the end pole. Thus, the estimation oflarge numbers on a number line task with a reference may be less underestimated than in numberestimation tasks—like the estimation of the number of dots on a paper or the number of marblesin a vase—in which no absolute reference is present.
Another account that may explain the inaccurate estimations and inappropriate mental rep-resentations of numbers is the accumulator model (Gibbon & Church, 1981; Huntley-Fenner,2000). Indeed, there is a considerable body of empirical evidence consistent with the accumulatormodel (see, e.g., Huntley-Fenner, 2001). This model assumes that the variability in estimatesincreases (accumulates) with larger numbers. According to Brannon, Wusthoff, Gallistel, andGibbon (2001) this occurs because the mental representation of the distance between two num-bers becomes fuzzier with increasing number size. Like the logarithmic ruler model of Dehaene(1997), the accumulator model is assumed to be used by people of all ages and even by animals(Brannon et al., 2001). Again, it may be questioned whether this model applies to the number linetask. Because the number line task has a fixed end pole, estimation of large numbers is boundedby the endpoint. Therefore, the variation in estimations of large numbers is also bounded by theendpoint.
In contrast to the logarithmic ruler representation model and the accumulator model, Caseand Okamoto (1996) proposed a model that is not age invariant but shows a developmental shift.According to their multiple representations model young children have a qualitative representationof numbers in which they mainly distinguish between “small” and “large” numbers. When children
Dow
nloa
ded
by [
Era
smus
Uni
vers
ity]
at 0
8:16
16
July
201
2

MULTIPLE RESPRESENTATIONS IN NUMBER LINE ESTIMATION 249
grow up, they shift from a qualitative representation to a linear ruler representation, in whichestimates increase linearly with the actual value. Case and Sowder (1990) propose that children,who have not yet acquired the linear ruler representation, are unable to make accurate estimates.
On the basis of a number of cross-sectional studies using the number line estimation task,Siegler and his colleagues (Booth & Siegler, 2006; Laski & Siegler, 2007; Opfer & Siegler, 2007;Siegler, 1996; Siegler & Booth, 2004; Siegler & Opfer, 2003; Siegler, Thompson, & Opfer, 2009;Thompson & Opfer, 2008) concluded that children indeed show a developmental shift in theirmental representation of numbers on a number line. This shift encompasses a change in the mentalrepresentation of numbers from a logarithmic to a linear relationship between the estimated andthe real locations of numbers on a number line. According to Siegler and colleagues (2009)younger children’s estimates of numerical magnitude typically follow Fechner’s law (y = k × lnx, where y is the estimated number, x is the actual magnitude, and k is a constant) and increaselogarithmically with the actual value. In contrast, estimation patterns of older children tend toreflect a linear ruler representation. Thus, age-group analyses support a developmental shift fromlogarithmic to linear representations of numbers. These findings were taken as strong evidencefor the multiple representations model.
However, we will argue that there are some important methodological issues, which underminethe validity of the conclusions with respect to the multiple representations and the developmentaltrend. As an alternative and to overcome these methodological issues we present in the presentstudy a latent variable model approach to detect estimation patterns of children on a 0 to 100number line task.
METHODOLOGICAL ISSUES
Before we discuss five methodological issues, we will describe the general procedure commonlyemployed to analyze the estimation patterns. Because the distribution of the estimated numbers isgenerally skewed, Siegler and Booth (2004, 2006; see also Siegler, 1996; Siegler & Opfer, 2003;Siegler, Thompson, & Opfer, 2009) used for each estimated number the median estimate of anage group as the dependent variable in a regression analysis with the number to be estimated asa predictor variable. Next, they fitted linear, logarithmic, and exponential regression functionson these medians of the estimated numbers. The model with the highest proportion explainedvariance was chosen to be the best fitting model. In addition, they also fitted the same regressionmodels on the individual estimates of the children. Again, the model that explained the mostvariance was selected as the best fitting model.
The first issue to be discussed is whether the median estimation as a summary score formsan adequate representation of the individual estimation patterns. When children’s individualestimations differ substantively, averaging (or taking the median) over the estimates in a groupmay result in a summary score that may not be representative of even one of the individuals. Byaveraging over individuals, one implicitly assumes that individual deviations from the averagedscore are error (i.e., unrelated to the actual measurement). However, just because the estimationsvary considerably, deviations from the mean, or median, cannot be assumed to be error. Instead,these deviations contain important information about the estimation patterns of the individuals.Suppose a group of same-aged children shows different kinds of estimation patterns. Consider, forexample, that some children in this group do not have an appropriate number representation. This
Dow
nloa
ded
by [
Era
smus
Uni
vers
ity]
at 0
8:16
16
July
201
2

250 BOUWMEESTER AND VERKOEIJEN
type of number representation will lead to a random estimation pattern in which no relationshipexists between the actual number position and the estimated position. However, other children inthis group show a clear linear relationship between the actual number and the estimated number.In this case the average estimation pattern of the complete group of children is a summary of amixture of estimation patterns. If now, a logarithmic and a linear regression function are comparedon the data in this sample, and the logarithmic function provides the best fit then it would beincorrect to conclude that a logarithmic function best describes the estimation patterns of theentire sample.
A second issue concerns the use of age groups to investigate the developmental trend. In allstudies, summary scores are calculated per grade to investigate a potential developmental shiftfrom a logarithmic to a linear representation of numbers. However, although a developmental shiftmay be observed in children’s mental representation of numbers, it is a rather strong assumptionthat this shift is clearly visible between two predefined age groups. Children of the same age maybe in different developmental stages dependent on intelligence, gender, experiences with numbers,and so on. As a consequence, a considerable amount of variation in estimation pattern within anage group is treated as unsystematic error, while in fact this variation may be systematically relatedto development (Wohlwill, 1973). By adding this variation into the error term of the statisticaltest in which age group is used as between subject factor, the power to detect a developmentaltrend is suppressed. This issue may be solved by first using a latent class model in which thedifferent latent classes summarize the estimation patterns present in the total sample. Childrencan be assigned to one of the latent classes on the basis of their estimation patterns. A posterioriit can be investigated how age is related to the estimation patterns distinguished by the latentclasses. Of course, when there is a general developmental trend this will be observed roughlyin age groups, but it is unfortunate to use a suboptimal design when a more powerful designis available. Using a latent class model, a researcher may conclude that part of the within-agevariability may actually be related to systematic differences in estimation ability.
A third issue concerns the predefined functions that are used to fit the estimation patterns.Instead of the linear, logarithmic, and exponential functions, Siegler and Booth (2004, 2008)and Siegler and Opfer (2003) fitted, other less restrictive functions may describe the relationshipbetween the estimated and actual numbers better. For example, in a very recent article, Barthand Paladino (2011) proposed that the estimates on a number line task in which the end polesare bounded are likely to be proportional judgments because people base their estimates onone of the known referents. This idea suggests that estimation patterns follow a cyclical powermodel. According to this model, children overestimate the distance between small numbersand underestimate the numbers to the right of the center of the number line. In addition, theunderestimation may decrease for estimated numbers close to the end of the pole. Consistentwith their hypothesis, Barth and Paladino found that a cyclical power model could explain theestimations on a number line task quite well.
The fourth issue deals with the analysis of the individual estimation patterns. In order toinvestigate whether individual children within an age group show different kinds of estimationpatterns, Siegler and Booth (2004) fitted regression lines on individual estimates and compared thefit of the logarithmic and the linear functions. Beside the questions of whether the two functionsfitted the estimation patterns at all (in an absolute sense) and whether a model other than thelogarithmic and linear functions might better describe the estimation pattern, the difference infit was interpreted absolutely and was not statistically tested. As a consequence, it is not clearwhether the results of the individual analysis are reliable or just based on chance fluctuation.
Dow
nloa
ded
by [
Era
smus
Uni
vers
ity]
at 0
8:16
16
July
201
2

MULTIPLE RESPRESENTATIONS IN NUMBER LINE ESTIMATION 251
The final issue concerns the fact that all studies on number line estimation in which logarithmicand linear functions are fitted concentrate on the difference between logarithmic and linearfunctions while not taking into account that the logarithmic and linear functions themselves canbe completely different as well. For example, suppose the relationship between the position ofthe numbers on a 0–100 number line of a certain child is best described by a linear function, say“estimated position = 20+number.” This function indicates a consequent overestimate of the realposition of the numbers. Another child’s estimations might best be described by the linear function“estimated position = number,” which indicates a perfectly accurate estimation pattern. Althoughthese two children both show linear representations, this fact is hardly informative when no furtherinformation is provided about the differences in intercept and slope. Similarly, a logarithmicfunction looks completely different when for example “estimated position = 20∗ln(number)” isused, than when “estimated position = 4∗ln(number+40)” is used. Thus, when no further detailsare given about the specific parameters of the function, it is hardly informative to know that achild’s estimation pattern is characterized by a linear or logarithmic function.
THE PRESENT STUDY
To solve these five issues, we propose a latent variable modeling approach. We use a latentclass regression analysis (Wedel & DeSarbo, 1994; Vermunt & Magidson, 2005) to analyze theestimation patterns of the individual children studied (this pertains to issues 1 and 4 above).Different latent classes will be estimated for different kinds of estimation patterns. Because theestimation patterns may be described by widely varying functions, we fitted functions that containone to three parameters: a linear term, a quadratic term, and a cubic term (issue 3). Adding thesehigher order terms gives us more freedom to estimate a function, which gives a more realisticreflection of the estimation pattern. That is, when the estimation pattern is best described by alogarithmic curve, the combination of a quadratic and a cubic effect can approach this logarithmiccurve. However, the combination of a quadratic and a cubic effect may also describe estimationpatterns in which children overestimate small numbers and underestimate large numbers as isproposed by the cyclical power model (Hollands & Dyre, 2000). These latter estimation patternscannot be approached by a logarithmic curve.
To account for individual differences in estimation patterns within a latent class we added arandom intercept term to the regression function. This random intercept allows that children havethe same kind of estimation pattern but differ with respect to the exact location of the function(issue 5). When different classes of children can be distinguished showing different estimationpatterns, age can be related to class membership a posteriori to investigate developmental trendsin estimation patterns (issue 2).
METHOD
Participants
The participants were 119 children from two elementary schools in Rotterdam and Spijkenisse,a small town southwest of Rotterdam, the Netherlands [41 kindergarten (Mean age = 6.25,SD = .31), 38 first graders (Mean age = 7.50, SD = .49), and 40 second graders (Mean age =8.50, SD = .54)]. Informed consent was obtained from the parents of all the children. Further,
Dow
nloa
ded
by [
Era
smus
Uni
vers
ity]
at 0
8:16
16
July
201
2

252 BOUWMEESTER AND VERKOEIJEN
the children were predominantly from a middle socio-economic background. The percentages offemales and males were 51.3% versus 48.7%. None of the children had learning problems and itcould be assumed that all children had IQ scores above 70. In the Netherlands children with anIQ score below 70 are referred to special education schools.
Materials and Procedure
Children met one-on-one with the experimenter for a single 35-min session. The session consistedof three number line estimation tasks. In one task, a plain number line was used; in the othertwo tasks a context and short story were used. In this manuscript we focus on the first pure,no-context, number line orienting problem. Children were presented with a sheet of paper with a25-cm line across the middle; the number 0 was printed just below the left end of the line and thenumber 100 just below the right end. We learned from the pilot study that many young childrenneeded some practice in order to understand the task. Therefore, we followed the procedure ofSiegler and Booth (2004) by giving them an introductory task in which they were asked to markwhere they thought 50 would go on the line. After they did so, they were shown an identicalnumber line with 50 marked in the correct position. Subsequently they were told that that waswhere 50 belonged, and they were asked if they knew why 50 went there. All children were thentold, “Because 50 is half of 100, it goes directly in the middle, halfway between 0 and 100. So50 is the middle, and it’s the only number that goes exactly in the middle.” After the orientingproblem, children were presented with 30 sheets of paper, each with an identical 25-cm line, andasked to put a single mark on each line to indicate the location of a given number. The lines wereidentical to the one used in the orienting problem except that a number (different on each trial)was printed above the middle of the line. The 30 numbers that were presented were 3, 4, 6, 8,10, 12, 14, 17, 18, 20, 21, 24, 25, 29, 33, 39, 42, 48, 52, 57, 61, 64, 72, 75, 79, 80, 81, 84, 90,and 96. We used the same numbers that were used in the study of Siegler and Opfer (2003) inorder to replicate this study as closely as possible. Siegler and Opfer (2003) reported that theyused more small numbers (below 50) than large numbers in order to increase the ability to detectoverestimation of small numbers. The order of the sheets was randomized for each child.
There was no time limit for any of the problems. In addition, no feedback was given aboutspecific estimates, though the experimenters frequently offered general encouraging commentsto all children. Following completion of all tasks, children were thanked for participating, toldthey did a good job, and returned to their classroom.
Statistical Analysis
A latent class regression analysis was used to investigate whether different representationscould be distinguished. In the latent class regression model, latent classes of subjects weredistinguished that differed with respect to the regression function. The estimations of the 30numbers formed the dependent vector with the numbers to be estimated, the quadrate of thesenumbers, and the cubic of these numbers as predictor vectors. A random intercept was includedto the model to allow for individual differences. (See the Appendix for the formal description ofthe model and the parameters.)
Dow
nloa
ded
by [
Era
smus
Uni
vers
ity]
at 0
8:16
16
July
201
2
MULTIPLE RESPRESENTATIONS IN NUMBER LINE ESTIMATION 253
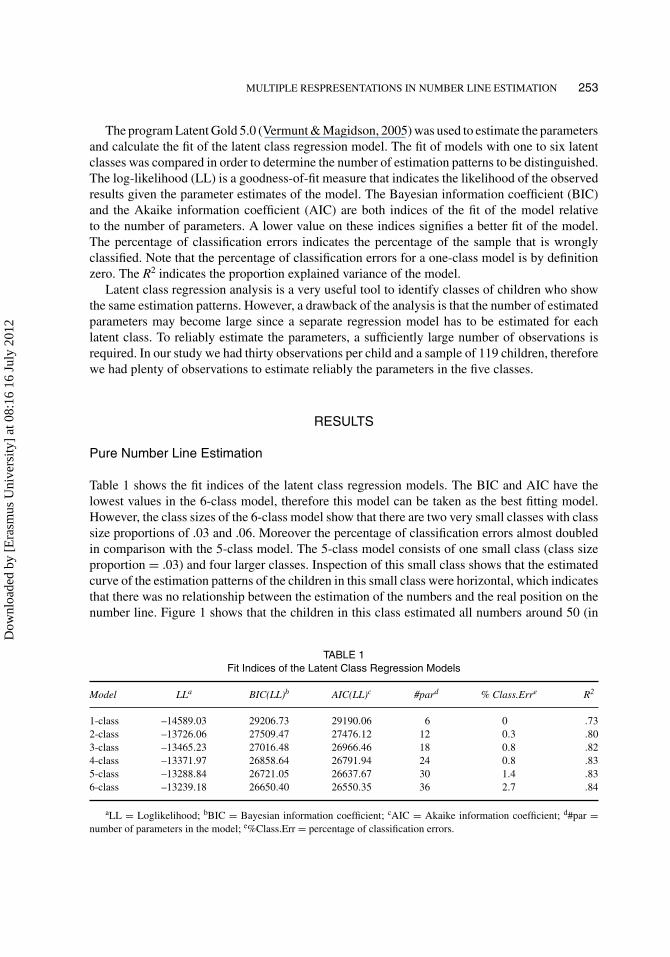
The program Latent Gold 5.0 (Vermunt & Magidson, 2005) was used to estimate the parametersand calculate the fit of the latent class regression model. The fit of models with one to six latentclasses was compared in order to determine the number of estimation patterns to be distinguished.The log-likelihood (LL) is a goodness-of-fit measure that indicates the likelihood of the observedresults given the parameter estimates of the model. The Bayesian information coefficient (BIC)and the Akaike information coefficient (AIC) are both indices of the fit of the model relativeto the number of parameters. A lower value on these indices signifies a better fit of the model.The percentage of classification errors indicates the percentage of the sample that is wronglyclassified. Note that the percentage of classification errors for a one-class model is by definitionzero. The R2 indicates the proportion explained variance of the model.
Latent class regression analysis is a very useful tool to identify classes of children who showthe same estimation patterns. However, a drawback of the analysis is that the number of estimatedparameters may become large since a separate regression model has to be estimated for eachlatent class. To reliably estimate the parameters, a sufficiently large number of observations isrequired. In our study we had thirty observations per child and a sample of 119 children, thereforewe had plenty of observations to estimate reliably the parameters in the five classes.
RESULTS
Pure Number Line Estimation
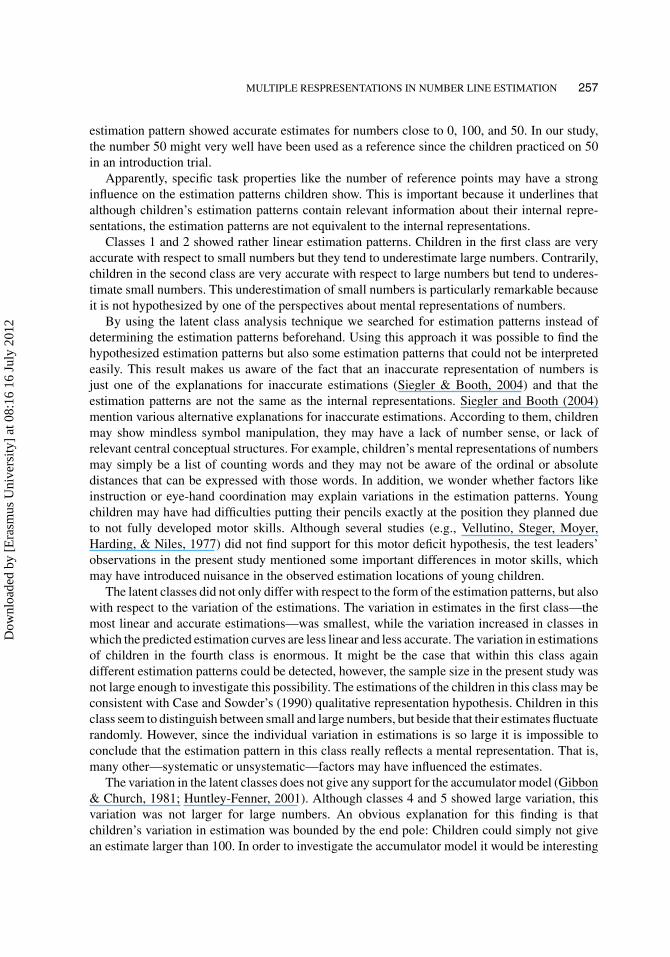
Table 1 shows the fit indices of the latent class regression models. The BIC and AIC have thelowest values in the 6-class model, therefore this model can be taken as the best fitting model.However, the class sizes of the 6-class model show that there are two very small classes with classsize proportions of .03 and .06. Moreover the percentage of classification errors almost doubledin comparison with the 5-class model. The 5-class model consists of one small class (class sizeproportion = .03) and four larger classes. Inspection of this small class shows that the estimatedcurve of the estimation patterns of the children in this small class were horizontal, which indicatesthat there was no relationship between the estimation of the numbers and the real position on thenumber line. Figure 1 shows that the children in this class estimated all numbers around 50 (in
TABLE 1Fit Indices of the Latent Class Regression Models
Model LLa BIC(LL)b AIC(LL)c #pard % Class.Erre R2
1-class –14589.03 29206.73 29190.06 6 0 .732-class –13726.06 27509.47 27476.12 12 0.3 .803-class –13465.23 27016.48 26966.46 18 0.8 .824-class –13371.97 26858.64 26791.94 24 0.8 .835-class –13288.84 26721.05 26637.67 30 1.4 .836-class –13239.18 26650.40 26550.35 36 2.7 .84
aLL = Loglikelihood; bBIC = Bayesian information coefficient; cAIC = Akaike information coefficient; d#par =number of parameters in the model; e%Class.Err = percentage of classification errors.
Dow
nloa
ded
by [
Era
smus
Uni
vers
ity]
at 0
8:16
16
July
201
2

254 BOUWMEESTER AND VERKOEIJEN
FIGURE 1 Estimated function (line) of the relationship between actual magnitude and estimated numbers, observedestimates (grey dots), and accurate reference line (dotted line) for the five classes on the number line estimation task.
the center of the number line). Because the 5-class model had lower BIC and AIC values thanthe 4-class model, we decided to interpret the results of the 5-class model.
Figure 1 shows the estimated regression lines of the five classes. The dotted line is a referenceline that indicates an accurate estimation pattern. The grey dots are the estimates of the individualchildren who are assigned to the particular class (note that children are assigned to a particularclass when they have the highest probability to be in that class, given their estimation pattern).Class 1 has a sample size proportion of .25 and shows a rather accurate linear relationship betweenthe real position and the estimated position of the numbers. The parameter estimates in Table 2
Dow
nloa
ded
by [
Era
smus
Uni
vers
ity]
at 0
8:16
16
July
201
2

MULTIPLE RESPRESENTATIONS IN NUMBER LINE ESTIMATION 255
TABLE 2Parameter and Variance Estimates and Significance Level for the Five Latent Classes
Class Effect Value p
1 Linear 0.0006 .75Quadratic 0.9062 <.0001Cubic 0.0000 .62
2 Linear –0.0044 .97Quadratic 0.0244 <.0001Cubic –0.0002 <.0001
3 Linear 1.709 <.0001Quadratic –0.0223 <.0001Cubic 0.0001 <.0001
4 Linear 2.6620 <.0001Quadratic –0.0485 <.0001Cubic 0.0003 <.0001
5 Linear –0.0267 .87Quadratic –0.0003 .94Cubic 0.0000 .80
Variances
1 34.72 <.00012 52.36 <.00013 109.73 <.00014 354.01 <.00015 20.28 <.0001
show that only the quadratic effect is significant. The estimated function indicates that the largenumbers (close to 100) are slightly underestimated. Class 2 has a sample size proportion of .17.The parameter estimates show that both the quadratic and the cubic effects are significant. Figure 1shows that small numbers are underestimated in this class while the estimation of large numbersis rather accurate. Class 3 is the largest class (.37). Both the linear, the quadratic and the cubiceffects are significant. Children in this class overestimate small numbers and underestimate largenumbers. Their estimations in the center of the number line are rather accurate. Class 4 has asample size proportion of .18. Both the linear, the quadratic and the cubic effects are significant.Figure 1 shows that in comparison with class 3, children in class 4 have a stronger overestimationof small numbers and a stronger underestimation of large numbers. Class 5 is the small class(.03). None of the effects is significant in this class. Table 2 also shows that the individualvariation differs widely for the five classes. The variance in classes 1, 2 and 5 is relatively smallin comparison with the variance in classes 3 and 4. This variation in individual scores is alsoreflected in the variation of the grey dots in Figure 1. Children in class 4 show the largest variationin their estimates.
Age
Table 3 shows the mean age of the children in the five latent classes. An analysis of varianceshowed a significant effect of class on age in months, F(4, 114) = 2.67, p = .04, R2 = 0.09. Posthoc analysis revealed that children in class 1 and class 3 are on average older than children in
Dow
nloa
ded
by [
Era
smus
Uni
vers
ity]
at 0
8:16
16
July
201
2

256 BOUWMEESTER AND VERKOEIJEN
TABLE 3Mean Age and Number of Children Per Grade for the Five Latent Classes
N Mean Age (SD) Kindergarten (%) Grade 1 (%) Grade 2 (%)
Class 1 30 7.64 5 15 10(0.97) (12%) (32%) (25%)
Class 2 20 7.41 5 8 7(0.94) (12%) (21%) (18%)
Class 3 44 7.63 12 15 17(0.98) (29%) (39%) (43%)
Class 4 22 7.03 16 0 6(1.03) (39%) (15%)
Class 5 3 6.40 3 0 0(0.44) (7%)
class 4 and 5. However, after a Bonferroni correction these differences were not significant. Table3 also shows that the classes 4 and 5 mainly consist of kindergarten children but kindergartenchildren are also present in classes 1, 2, and 3. Children from the first and the second grade mostlyshow estimation patterns in accordance with the functions in class 1 and 3.
DISCUSSION
The results from the latent class regression analysis support the multiple-representation hypothesisthat children use different kinds of representations of numbers as reflected in different kinds ofestimation patterns. Moreover, the hypothesis of Siegler and Booth (2004) was confirmed thatchildren within an age group show different kinds of representations. However, a significantdevelopmental trend was not observed for the five- through eight-year-old children. Children fromkindergarten, first, and second grade all have a reasonable probability to show accurate as wellas inaccurate estimation patterns. One very small class—consisting of three children—containedonly kindergarten children. The plot of the estimation pattern of this small class showed thatchildren in this class estimated all numbers around the middle of the number line. It is likely,therefore, that the children in this class did not understand the number line task and that theirestimation patterns do not give us valid information about their mental representation of numberson a number line.
Classes 3 and 4 mostly resembled the logarithmic-like curves that were hypothesized and foundby the studies of Siegler and his colleagues. However, a remarkable finding in these classes thatis not in agreement with the results of Siegler’s studies is that the underestimation of the positionof large number decreases with increasing numbers. The results showed that a cubic trend fittedthese estimation patterns best. It may well be the case that this decreasing underestimation couldhave also been observed in Siegler’s data, but was not detected simply because only logarithmiccurves were fitted. This result shows that it was worthwhile to add quadratic and cubic termsto the model. Conceptually, this result is consistent with the cyclical power model (Hollands &Dyre, 2000; see also Barth & Paladino, 2011) that assumes proportional judgment estimates.The 2-wave cyclical power model predicts accurate estimation performance for numbers that areclose to the reference point and this is exactly what our results in classes 3 and 4 show: The
Dow
nloa
ded
by [
Era
smus
Uni
vers
ity]
at 0
8:16
16
July
201
2
MULTIPLE RESPRESENTATIONS IN NUMBER LINE ESTIMATION 257
estimation pattern showed accurate estimates for numbers close to 0, 100, and 50. In our study,the number 50 might very well have been used as a reference since the children practiced on 50in an introduction trial.
Apparently, specific task properties like the number of reference points may have a stronginfluence on the estimation patterns children show. This is important because it underlines thatalthough children’s estimation patterns contain relevant information about their internal repre-sentations, the estimation patterns are not equivalent to the internal representations.
Classes 1 and 2 showed rather linear estimation patterns. Children in the first class are veryaccurate with respect to small numbers but they tend to underestimate large numbers. Contrarily,children in the second class are very accurate with respect to large numbers but tend to underes-timate small numbers. This underestimation of small numbers is particularly remarkable becauseit is not hypothesized by one of the perspectives about mental representations of numbers.
By using the latent class analysis technique we searched for estimation patterns instead ofdetermining the estimation patterns beforehand. Using this approach it was possible to find thehypothesized estimation patterns but also some estimation patterns that could not be interpretedeasily. This result makes us aware of the fact that an inaccurate representation of numbers isjust one of the explanations for inaccurate estimations (Siegler & Booth, 2004) and that theestimation patterns are not the same as the internal representations. Siegler and Booth (2004)mention various alternative explanations for inaccurate estimations. According to them, childrenmay show mindless symbol manipulation, they may have a lack of number sense, or lack ofrelevant central conceptual structures. For example, children’s mental representations of numbersmay simply be a list of counting words and they may not be aware of the ordinal or absolutedistances that can be expressed with those words. In addition, we wonder whether factors likeinstruction or eye-hand coordination may explain variations in the estimation patterns. Youngchildren may have had difficulties putting their pencils exactly at the position they planned dueto not fully developed motor skills. Although several studies (e.g., Vellutino, Steger, Moyer,Harding, & Niles, 1977) did not find support for this motor deficit hypothesis, the test leaders’observations in the present study mentioned some important differences in motor skills, whichmay have introduced nuisance in the observed estimation locations of young children.
The latent classes did not only differ with respect to the form of the estimation patterns, but alsowith respect to the variation of the estimations. The variation in estimates in the first class—themost linear and accurate estimations—was smallest, while the variation increased in classes inwhich the predicted estimation curves are less linear and less accurate. The variation in estimationsof children in the fourth class is enormous. It might be the case that within this class againdifferent estimation patterns could be detected, however, the sample size in the present study wasnot large enough to investigate this possibility. The estimations of the children in this class may beconsistent with Case and Sowder’s (1990) qualitative representation hypothesis. Children in thisclass seem to distinguish between small and large numbers, but beside that their estimates fluctuaterandomly. However, since the individual variation in estimations is so large it is impossible toconclude that the estimation pattern in this class really reflects a mental representation. That is,many other—systematic or unsystematic—factors may have influenced the estimates.
The variation in the latent classes does not give any support for the accumulator model (Gibbon& Church, 1981; Huntley-Fenner, 2001). Although classes 4 and 5 showed large variation, thisvariation was not larger for large numbers. An obvious explanation for this finding is thatchildren’s variation in estimation was bounded by the end pole: Children could simply not givean estimate larger than 100. In order to investigate the accumulator model it would be interesting
Dow
nloa
ded
by [
Era
smus
Uni
vers
ity]
at 0
8:16
16
July
201
2

258 BOUWMEESTER AND VERKOEIJEN
to analyze the estimation patterns of a task in which the end point is not labeled but insteada position somewhere in the middle of the scale. When the accumulator model is correct, wewould expect to observe heteroscedasticity in the estimations on this task such that children showmore variation in their estimates of larger numbers than in their estimations of smaller numbers.Cohen and Blanc-Goldhammer (2011) indeed showed that the variance in estimation of adultparticipants increased when an unbounded number line was used.
The main purpose of our study was to determine whether multiple representations could bedistinguished with respect to number estimation patterns. The results showed that four classescould clearly be distinguished. In each of these classes, children have different estimation patterns,which may reflect different mental representations. Although the results showed that youngerchildren are more likely to show overestimation of small numbers than older children, a cleardevelopmental trend was not observed in this cross-sectional study. That is, some young childrenshowed linear representations while some older children showed overestimation of the smallnumbers. A longitudinal study is required here and it would be very interesting to answer thequestion whether children—beginning at their own starting points and developing at their ownrate—show a developmental trend from overestimation of small numbers to linear and accuraterepresentations.
As a final point we discuss the significance that the results of this study may have for primaryeducation and in particular for learning addition and subtraction using a number line task. Earlierwe mentioned that the exact notion of measurement units and quantities is not required forsuccessfully using the number line for basic arithmetic skills. However, we think correct internalrepresentation of numbers and distances between numbers may facilitate learning. From theresults of this study we can conclude that Dutch children show large variation in their estimationskills and that this variation is also present within age groups. Therefore, it may well be thecase that children who already start using the number line for arithmetic tasks in grade 1 in facthave a rather poor mental representation of the two-digit numbers. It might be questionable, then,whether the use of a number line as a tool for addition and subtraction really makes sense for thesechildren. Perhaps it would be beneficial to assess the mental representations of first graders bygiving them a number line estimation task. When their estimation performance is poor, practiceon the numbers and the distances between numbers may be considered before using the numberline tasks for practicing basic arithmetic skills.
ACKNOWLEDGMENTS
This study was supported in part by Erasmus University TOPTALENT grants to both authors.We thank Charlotte Bindinga and Marieke Veldkamp for their assistance in collecting the data.
REFERENCES
Barth, H., & Paladino, A. M. (2011). The development of numerical estimation: Evidence against a representational shift.Developmental Science 14, 125–135.
Beishuizen, M. (1993). Mental strategies and materials or models for addition and subtraction up to 100 in Dutch secondgrades. Journal for Research in Mathematics Education, 24(4), 294–323.
Booth, J. L., & Siegler, R. S. (2006). Developmental and individual differences in pure numerical estimation. Develop-mental Psychology, 41, 189–201.
Dow
nloa
ded
by [
Era
smus
Uni
vers
ity]
at 0
8:16
16
July
201
2

MULTIPLE RESPRESENTATIONS IN NUMBER LINE ESTIMATION 259
Booth, J. L., & Siegler, R. S. (2008). Numerical magnitude representations influence arithmetic learning. Child Develop-ment, 79, 1016–1031.
Brannon, E. M., Wusthoff, C. J., Gallistel, C. R., & Gibbon, J. (2001). Numerical subtraction in the pigeon: Evidence fora linear subjective number scale. Psychological Science, 12, 238–243.
Case, R., & Okamoto, Y. (1996). The role of conceptual structures in the development of children’s thought. Monographsof the Society for Research in Child Development, 61(Nos. 1–2, Serial No. 246).
Case, R., & Sowder, J. T. (1990). The development of computational estimation: A neo-Piagetian analysis. Cognitionand Instruction, 7, 79–104.
Cohen, D. J., & Blanc-Goldhammer, D. (2011). Numerical bias in bounded and unbounded number line tasks. Psycho-nomic Bulletin Review, 18, 331–338.
Dehaene, S. (1997). The number sense: How the mind creates mathematics. New York, NY: Oxford University Press.Dehaene, S. (2001). Subtracting pigeons: Logarithmic or linear? Psychological Science, 12, 244–246.Di Meo, M. (2008). Development of numerical estimation in young children (Unpublished master thesis). Universita degli
Studi “G. d’Annunzio” Chieti-Pescara. University of Chieti, Italy.Ernest, P. (1985). The number line as a teaching aid. Educational Studies in Mathematics, 16, 411–424.Fuson, K. (2009). Avoiding misinterpretations of Piaget and Vygotsky: Mathematical teaching without learning, learning
without teaching, or helpful learning-path teaching? Cognitive Development, 24, 343–361.Gibbon, J., & Church, R. M. (1981). Time left: Linear versus logarithmic subjective time. Journal of the Experimental
Analysis of Behavior, 7, 87–107.Gravemeijer, K. P. E. (2000). Meten als basis voor het rekenen met de lege getallenlijn. Tijdschrift voor nascholing en
onderzoek van het reken-wiskundeonderwijs, 18, 37–46.Gravemeijer, K. P. E., & Doorman, M. (1999). Context problems in realistic mathematics education: A calculus course
as an example. Educational Studies in Mathematics, 39, 111–129.Hollands, J. G., & Dyre, B. P. (2000). Bias in proportion judgments: The cyclical power model. Psychological Review,
107, 500–524.Huntley-Fenner, G. (2001). Children’s understanding of number is similar to adults’ and rats’: Numerical estimation by
5- to7-year-olds. Cognition, 78, 27–40.Huntley-Fenner, G., & Cannon, E. (2000). Preschoolers’ magnitude comparisons are mediated by a preverbal analog
mechanism. Psychological Science, 11, 147–152.Opfer, J. E., & Siegler, R. S. (2007). Representational change and children’s numerical estimation. Cognitive Psychology,
55, 169–195.Schneider, M., Grabner, R. H., & Paetsch, J. (2009). Mental number line, number line estimation, and mathematical
achievement: Their interrelations in grades 5 and 6. Journal of Educational Psychology, 101, 359–371.Siegler, R. S., & Booth, J. L. (2004). Development of numerical estimation in young children. Child Development, 75,
428–444.Siegler, R. S. (1996). Emerging minds: The process of change in children’s thinking. New York, NY: Oxford University
Press.Siegler, R. S., & Booth, J. L. (2005). Development of numerical estimation: A review. In J. I. D. Campbell (Ed.),
Handbook of mathematical cognition (pp. 197–212). Boca Ratan, FL: CRC Press.Siegler, R. S., & Opfer, J. (2003). The development of numerical estimation: Evidence for multiple representations of
numerical quantity. Psychological Science, 14, 237–243.Siegler, R. S., Thompson, C. A., & Opfer, J. E. (2009). The logarithmic-to-linear shift: One learning sequence, many
tasks, many time scales. Mind, Brain and Education, 3, 143–150.Treffers, A. (1991). Realistic mathematics education in The Netherlands 1980–1990. In L. Streefland (Ed.), Realis-
tic mathematics education in primary school. Utrecht, the Netherlands: CD-b Press/Freudenthal Institute, UtrechtUniversity.
Treffers, A. (1993). Wiskobas and Freudenthal realistic mathematics education. Educational Studies in Mathematics,25(1–2), 89–108.
Vellutino, F. R., Steger, B. M., Moyer, S. C., Harding, C. J., & Niles, J. A. (1977). Has the perceptual deficit hypothesisled us astray? Journal of Learning Disabilities, 10, 375–385.
Vermunt, J. K., & Magidson, J. (2005). Latent Gold 4.0 user’s guide. Belmont, MA: Statistical Innovations Inc.Wedel, M., & DeSarbo, W. A. (1994). A review of recent developments in latent class regression models. In R. P. Bagozzi
(Ed.), Advanced methods of marketing research (pp. 352–388). Cambridge, MA: Blackwell.Wohlwill, J. F. (1973). The study of behavioral development. New York, NY: AcademicPress.
Dow
nloa
ded
by [
Era
smus
Uni
vers
ity]
at 0
8:16
16
July
201
2

260 BOUWMEESTER AND VERKOEIJEN
APPENDIX
The latent class regression model can be split into two parts. The first part of the latent classregression model is defined by the probability p of being in a particular latent class (realization cof latent variable C), that is, p(c). These marginal probabilities of being in a specific class add to1 over the latent classes c:
c=C∑
c=1
p(c) = 1 (1)
In the second part of the model, the probabilities are estimated that a child i has a particularestimation pattern Yi with realization yi given the latent class c: yi|cz. Because there are multipleobservations per case, the dependent variable Yi is a vector containing the scores on the 30numbers j. Then, the two parts combine into the latent class regression model. The model isdefined by a summation over latent classes of the product of marginal probabilities of being in alatent class and probabilities for the vector of estimated number positions (y) given latent class c:
f (y) =c=C∑
c=1
p(c)f (y | c) (2)
Parameters
The first part of Equation 2 is modeled by a multinomial probability, which is parameterized as:
p(c) = exp(ηc)∑C
c=1 exp(ηc)(3)
in which ηc is the parameter that defines the latent class size of class c. Because the vectorY consists of 30 continuous variables, the second part of the model, f(y|x), is assumed to bemultivariate normal with a mean vector νc and a covariance matrix σ x per latent class. The vectorνc consists of the parameters νyj|c, for the mean score on estimated numbers j (j = 1, . . . ,30).The relationship between estimation and number to be estimated is restricted by a parametricfunction. In the case of our data, linear, quadratic or cubic functions may be appropriate (Note thata logarithmic-shaped curve can approximately approached by a combination of a quadratic and acubic effect.) When the relationship between number and estimation is assumed to be cubicallyrestricted, the function becomes:
ηyj |icz = β0|icz + β1|cz · j + β2|cz · j 2 + β3|cz · j 3 (4)
β0|icz forms the intercept and is defined as: β0icz = γ 0c + γ 0i , in which γ 0c is the effect of clusterc on the intercept, and γ 0i is the random effect of individual i. β1|cz is the linear effect β2|cz isthe quadratic effect and β3|cz is the cubic effect.
Dow
nloa
ded
by [
Era
smus
Uni
vers
ity]
at 0
8:16
16
July
201
2
Related Documents