Multiple refugia and barriers explain the phylogeography of the Valais shrew, Sorex antinorii (Mammalia: Soricomorpha) GLENN YANNIC 1,2 *, LOÏC PELLISSIER 1 , SYLVAIN DUBEY 1,3 , RODRIGO VEGA 4 , PATRICK BASSET 5 , STEFANO MAZZOTTI 6 , ELENA PECCHIOLI 7 , CRISTIANO VERNESI 7 , HEIDI C. HAUFFE 7 , JEREMY B. SEARLE 4 and JACQUES HAUSSER 1 1 Department of Ecology and Evolution, Biophore Building, University of Lausanne, 1015 Lausanne, Switzerland 2 Département de Biologie & Centre d’Études Nordiques, University Laval, 1045 Avenue de la Médecine, Québec (QC), G1V 0A6, Canada 3 Shine Laboratory, School of Biological Sciences, A08, University of Sydney, Sydney, NSW 2006, Australia 4 Department of Ecology and Evolutionary Biology, Corson Hall, Cornell University, Ithaca, NY 14853-2701, USA 5 Hospital Preventive Medicine, University Hospital of Lausanne (CHUV), Lausanne, Switzerland 6 Museo di Storia Naturale, Via Filippo de Pisis, 24, 44100 Ferrara, Italy 7 Fondazione E. Mach, Research and Innovation Centre, Department of Biodiversity and Molecular Ecology, Via E. Mach 1, S. Michele all’Adige, Trento, Italy Received 6 July 2011; revised 23 October 2011; accepted for publication 23 October 2011The aim of the present study was to investigate the genetic structure of the Valais shrew (Sorex antinorii) by a combined phylogeographical and landscape genetic approach, and thereby to infer the locations of glacial refugia and establish the influence of geographical barriers. We sequenced part of the mitochondrial cytochrome b (cyt b) gene of 179 individuals of S. antinorii sampled across the entire species’ range. Six specimens attributed to S. arunchi were included in the analysis. The phylogeographical pattern was assessed by Bayesian molecular phylogenetic reconstruction, population genetic analyses, and a species distribution modelling (SDM)-based hindcasting approach. We also used landscape genetics (including isolation-by-resistance) to infer the determinants of current intra-specific genetic structure. The phylogeographical analysis revealed shallow divergence among haplotypes and no clear substructure within S. antinorii. The starlike structure of the median-joining network is consistent with population expansion from a single refugium, probably located in the Apennines. Long branches observed on the same network also suggest that another refugium may have existed in the north-eastern part of Italy. This result is consistent with SDM, which also suggests several habitable areas for S. antinorii in the Italian peninsula during the LGM. Therefore S. antinorii appears to have occupied disconnected glacial refugia in the Italian peninsula, supporting previous data for other species showing multiple refugia within southern refugial areas. By coupling genetic analyses and SDM, we were able to infer how past climatic suitability contributed to genetic divergence of populations. The genetic differentiation shown in the present study does not support the specific status of S. arunchi. © 2012 The Linnean Society of London, Biological Journal of the Linnean Society, 2012, 105, 864–880. ADDITIONAL KEYWORDS: cytochrome b – isolation-by-resistance – Italian Peninsula – niche modeling – refugia within refugia – Sorex arunchi. *Corresponding author. E-mail: [email protected] Biological Journal of the Linnean Society, 2012, 105, 864–880. With 5 figures © 2012 The Linnean Society of London, Biological Journal of the Linnean Society, 2012, 105, 864–880 864

Welcome message from author
This document is posted to help you gain knowledge. Please leave a comment to let me know what you think about it! Share it to your friends and learn new things together.
Transcript
Multiple refugia and barriers explain thephylogeography of the Valais shrew, Sorexantinorii (Mammalia: Soricomorpha)
GLENN YANNIC1,2*, LOÏC PELLISSIER1, SYLVAIN DUBEY1,3, RODRIGO VEGA4,PATRICK BASSET5, STEFANO MAZZOTTI6, ELENA PECCHIOLI7,CRISTIANO VERNESI7, HEIDI C. HAUFFE7, JEREMY B. SEARLE4 andJACQUES HAUSSER1
1Department of Ecology and Evolution, Biophore Building, University of Lausanne, 1015 Lausanne,Switzerland2Département de Biologie & Centre d’Études Nordiques, University Laval, 1045 Avenue de laMédecine, Québec (QC), G1V 0A6, Canada3Shine Laboratory, School of Biological Sciences, A08, University of Sydney, Sydney, NSW 2006,Australia4Department of Ecology and Evolutionary Biology, Corson Hall, Cornell University, Ithaca, NY14853-2701, USA5Hospital Preventive Medicine, University Hospital of Lausanne (CHUV), Lausanne, Switzerland6Museo di Storia Naturale, Via Filippo de Pisis, 24, 44100 Ferrara, Italy7Fondazione E. Mach, Research and Innovation Centre, Department of Biodiversity and MolecularEcology, Via E. Mach 1, S. Michele all’Adige, Trento, Italy
Received 6 July 2011; revised 23 October 2011; accepted for publication 23 October 2011bij_1824 864..880
The aim of the present study was to investigate the genetic structure of the Valais shrew (Sorex antinorii) by acombined phylogeographical and landscape genetic approach, and thereby to infer the locations of glacial refugia andestablish the influence of geographical barriers. We sequenced part of the mitochondrial cytochrome b (cyt b) geneof 179 individuals of S. antinorii sampled across the entire species’ range. Six specimens attributed to S. arunchi wereincluded in the analysis. The phylogeographical pattern was assessed by Bayesian molecular phylogeneticreconstruction, population genetic analyses, and a species distribution modelling (SDM)-based hindcasting approach.We also used landscape genetics (including isolation-by-resistance) to infer the determinants of current intra-specificgenetic structure. The phylogeographical analysis revealed shallow divergence among haplotypes and no clearsubstructure within S. antinorii. The starlike structure of the median-joining network is consistent with populationexpansion from a single refugium, probably located in the Apennines. Long branches observed on the same networkalso suggest that another refugium may have existed in the north-eastern part of Italy. This result is consistent withSDM, which also suggests several habitable areas for S. antinorii in the Italian peninsula during the LGM. ThereforeS. antinorii appears to have occupied disconnected glacial refugia in the Italian peninsula, supporting previous datafor other species showing multiple refugia within southern refugial areas. By coupling genetic analyses and SDM,we were able to infer how past climatic suitability contributed to genetic divergence of populations. The geneticdifferentiation shown in the present study does not support the specific status of S. arunchi. © 2012 The LinneanSociety of London, Biological Journal of the Linnean Society, 2012, 105, 864–880.
ADDITIONAL KEYWORDS: cytochrome b – isolation-by-resistance – Italian Peninsula – niche modeling –refugia within refugia – Sorex arunchi.
*Corresponding author. E-mail: [email protected]
Biological Journal of the Linnean Society, 2012, 105, 864–880. With 5 figures
© 2012 The Linnean Society of London, Biological Journal of the Linnean Society, 2012, 105, 864–880864
INTRODUCTION
Understanding the factors that both determine thedistribution of species and contribute to the formationand the maintenance of population genetic structureis a central tenet of biogeography. Moreover, suchan understanding enables the prediction of theconsequences of global change, such as future rangecontraction and loss of genetic variation. In Europe,the current patterns of species richness and geneticstructure can partially be explained by constraintsimposed during the Pleistocene ice ages. In particular,the three southern European peninsulas (Iberian,Italian, and Balkan) have traditionally been recog-nized as glacial refugia during these ice ages, and arecurrently considered as species-rich areas, as well ashotspots of intra-specific diversity (Bilton et al., 1998;Hewitt, 2000; Petit et al., 2003; Ruedi et al., 2008).Although the southern European peninsulas are oftenassumed to have been single areas from which speciesrecolonized higher latitudes after the Last GlacialMaximum (LGM; Hewitt, 2000; Petit et al., 2003), ithas recently been suggested that populations withinspecies in a single southern peninsula may have beendistributed among multiple disconnected refugia(Gómez & Lunt, 2007). Evidence for multiple glacialrefugia within single southern peninsulas is now sub-stantial (Schmitt et al., 2006; Canestrelli, Cimmaruta& Nascetti, 2007; Gómez & Lunt, 2007; Kryštufeket al., 2007; Canestrelli & Nascetti, 2008; Ruedi et al.,2008; Centeno-Cuadros, Delibes & Godoy, 2009; Grillet al., 2009). However, further studies are required todetermine whether this is a common pattern or onlyapplicable to a few species, given its importance forour interpretation of European phylogeography andour understanding of biological and genetic diversity.For example, although patterns in current geneticvariation in a certain species may reflect past popu-lation structure at the LGM (i.e. the ‘refugia withinrefugia’ considered above; Gómez & Lunt, 2007), thepatterns could also be explained by current geneticdiscontinuity as a result of strong geographicalbarriers. Therefore, the causes of genetic structureshould be investigated using multiple approaches,including both species distribution modelling (SDM;Guisan & Zimmermann, 2000; Waltari et al., 2007)and the use of current landscape features to inferwhich factor(s) are most responsible for shapingintra-specific genetic subdivision.
SDM uses species occurrences and environmental(usually climatic) data to estimate the range of suit-able environmental conditions for the species (Guisan& Zimmermann, 2000; Pellissier et al., 2010) (i.e. itsenvironmental niche). The defined environmentalniche can then be used to identify areas where thepast climatic environment was suitable for the species
(Nogues-Bravo, 2009), in this case at the LGM. Themajor advantage of such integrative approaches isthat hindcasted models can be used to derive hypoth-eses concerning species distribution, which can sub-sequently be compared with the observed geneticstructure (Knowles, Carstens & Keat, 2007; Richards,Carstens & Knowles, 2007).
Although the aforementioned phylogeographyinvestigates the historical processes generating pat-terns of genetic variation, current landscape features,especially across increasingly fragmented landscapes,can also deeply influence the genetic diversity parti-tioning and gene flow between populations (Manelet al., 2003; Storfer et al., 2007). Genotyping can becombined with spatially explicit data of landscapestructure (LS) and a variety of statistical methods canbe used to evaluate the role that current landscapevariables play in shaping current population struc-ture and genetic diversity (Storfer et al., 2007).
The present study aimed to better understand thefactors determining the current pattern of geneticvariation of the Valais shrew, Sorex antinorii, overits entire distribution by combining these twoapproaches in an investigation of genetic structureusing both SDM (hindcasted in the LGM) and LS.Despite their potential, very few studies have inter-rogated putative ‘refugia within refugia’ using thesecomplementary approaches (Waltari et al., 2007). Inaddition, we used a framework to determine the influ-ence of LS on current gene flow among S. antinoriipopulations. Sorex antinorii is a small insectivorousspecies belonging to the Sorex araneus group (Hoff-mann, 1971; Meylan & Hausser, 1973). Its currentknown distribution is restricted to Italy, southernSwitzerland up to the central Alps and south-easternFrance (Brünner et al., 2002). It was formerly con-sidered a chromosome race of S. araneus, althoughBrünner et al. (2002) argued that morphological,karyotypic, and genetic differences warrant recogniz-ing S. antinorii as a separate species. Sorex antinoriiprobably diverged from the other taxa of the S. ara-neus group during the late Pleistocene glaciations(Taberlet, Fumagalli & Hausser, 1994; Brünner et al.,2002; Yannic, Basset & Hausser, 2008a) in refugiasituated in Italy, when the Alps were covered with animmense ice sheet (Hewitt, 1996). Previous molecularstudies focused in Switzerland suggested that twoalready differentiated genetic lineages colonized theSwiss Alps from Italy after the last glaciations, andcame into secondary contact in the Rhône Valley(Lugon-Moulin & Hausser, 2002; Basset, Yannic &Hausser, 2006; Yannic, Basset & Hausser, 2008b).Mitochondrial DNA (mtDNA) has become a powerfultool for identifying evolutionary lineages or speciesin animals (Hebert et al., 2003; Tautz et al., 2003;Knowles & Carstens, 2007) as a result of its low or
PHYLOGEOGRAPHY OF S. ANTINORII 865
© 2012 The Linnean Society of London, Biological Journal of the Linnean Society, 2012, 105, 864–880
absent recombination, uniparental inheritance, con-served structure, and relatively high evolutionaryrate (Avise, 2000). The cytochrome b (cyt b) gene isone of the most frequently employed mtDNA genes forinvestigating phylogeographical patterns and histo-ries at the intraspecies level. In the present study, weused mtDNA cyt b sequence data to examine thephylogeography of S. antinorii over its range.
MATERIAL AND METHODSPHYLOGEOGRAPHICAL ANALYSIS
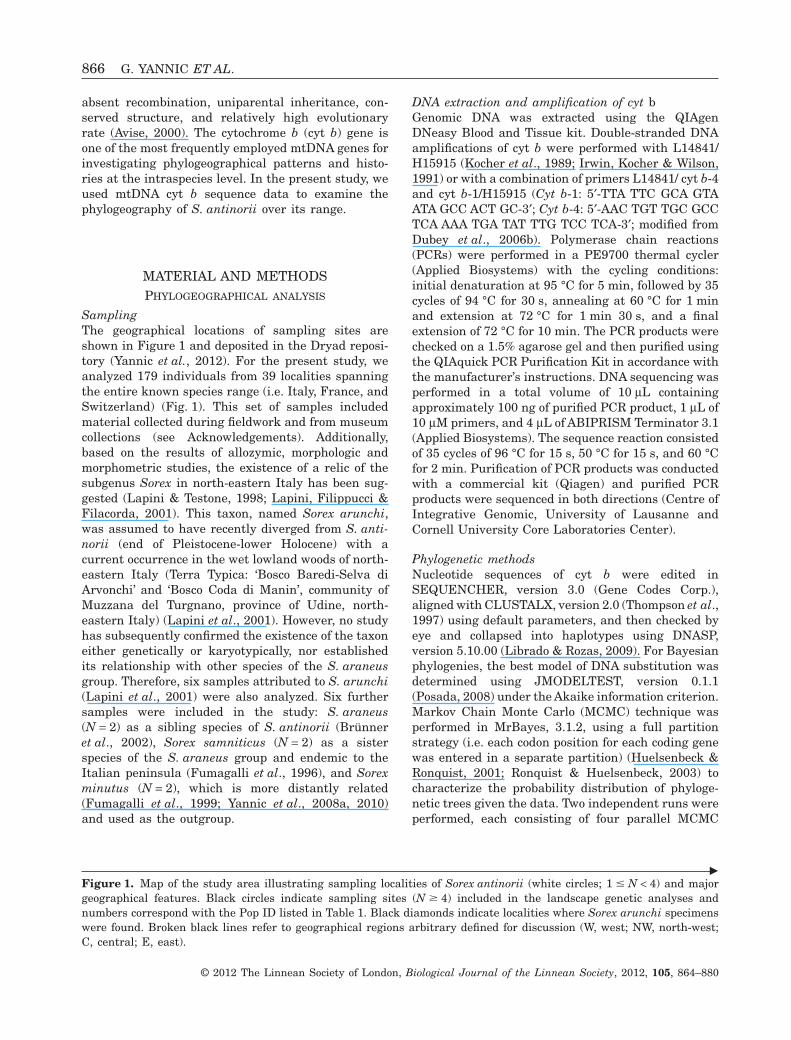
SamplingThe geographical locations of sampling sites areshown in Figure 1 and deposited in the Dryad reposi-tory (Yannic et al., 2012). For the present study, weanalyzed 179 individuals from 39 localities spanningthe entire known species range (i.e. Italy, France, andSwitzerland) (Fig. 1). This set of samples includedmaterial collected during fieldwork and from museumcollections (see Acknowledgements). Additionally,based on the results of allozymic, morphologic andmorphometric studies, the existence of a relic of thesubgenus Sorex in north-eastern Italy has been sug-gested (Lapini & Testone, 1998; Lapini, Filippucci &Filacorda, 2001). This taxon, named Sorex arunchi,was assumed to have recently diverged from S. anti-norii (end of Pleistocene-lower Holocene) with acurrent occurrence in the wet lowland woods of north-eastern Italy (Terra Typica: ‘Bosco Baredi-Selva diArvonchi’ and ‘Bosco Coda di Manin’, community ofMuzzana del Turgnano, province of Udine, north-eastern Italy) (Lapini et al., 2001). However, no studyhas subsequently confirmed the existence of the taxoneither genetically or karyotypically, nor establishedits relationship with other species of the S. araneusgroup. Therefore, six samples attributed to S. arunchi(Lapini et al., 2001) were also analyzed. Six furthersamples were included in the study: S. araneus(N = 2) as a sibling species of S. antinorii (Brünneret al., 2002), Sorex samniticus (N = 2) as a sisterspecies of the S. araneus group and endemic to theItalian peninsula (Fumagalli et al., 1996), and Sorexminutus (N = 2), which is more distantly related(Fumagalli et al., 1999; Yannic et al., 2008a, 2010)and used as the outgroup.
DNA extraction and amplification of cyt bGenomic DNA was extracted using the QIAgenDNeasy Blood and Tissue kit. Double-stranded DNAamplifications of cyt b were performed with L14841/H15915 (Kocher et al., 1989; Irwin, Kocher & Wilson,1991) or with a combination of primers L14841/ cyt b-4and cyt b-1/H15915 (Cyt b-1: 5′-TTA TTC GCA GTAATA GCC ACT GC-3′; Cyt b-4: 5′-AAC TGT TGC GCCTCA AAA TGA TAT TTG TCC TCA-3′; modified fromDubey et al., 2006b). Polymerase chain reactions(PCRs) were performed in a PE9700 thermal cycler(Applied Biosystems) with the cycling conditions:initial denaturation at 95 °C for 5 min, followed by 35cycles of 94 °C for 30 s, annealing at 60 °C for 1 minand extension at 72 °C for 1 min 30 s, and a finalextension of 72 °C for 10 min. The PCR products werechecked on a 1.5% agarose gel and then purified usingthe QIAquick PCR Purification Kit in accordance withthe manufacturer’s instructions. DNA sequencing wasperformed in a total volume of 10 mL containingapproximately 100 ng of purified PCR product, 1 mL of10 mM primers, and 4 mL of ABIPRISM Terminator 3.1(Applied Biosystems). The sequence reaction consistedof 35 cycles of 96 °C for 15 s, 50 °C for 15 s, and 60 °Cfor 2 min. Purification of PCR products was conductedwith a commercial kit (Qiagen) and purified PCRproducts were sequenced in both directions (Centre ofIntegrative Genomic, University of Lausanne andCornell University Core Laboratories Center).
Phylogenetic methodsNucleotide sequences of cyt b were edited inSEQUENCHER, version 3.0 (Gene Codes Corp.),aligned with CLUSTALX, version 2.0 (Thompson et al.,1997) using default parameters, and then checked byeye and collapsed into haplotypes using DNASP,version 5.10.00 (Librado & Rozas, 2009). For Bayesianphylogenies, the best model of DNA substitution wasdetermined using JMODELTEST, version 0.1.1(Posada, 2008) under the Akaike information criterion.Markov Chain Monte Carlo (MCMC) technique wasperformed in MrBayes, 3.1.2, using a full partitionstrategy (i.e. each codon position for each coding genewas entered in a separate partition) (Huelsenbeck &Ronquist, 2001; Ronquist & Huelsenbeck, 2003) tocharacterize the probability distribution of phyloge-netic trees given the data. Two independent runs wereperformed, each consisting of four parallel MCMC
�Figure 1. Map of the study area illustrating sampling localities of Sorex antinorii (white circles; 1 � N < 4) and majorgeographical features. Black circles indicate sampling sites (N � 4) included in the landscape genetic analyses andnumbers correspond with the Pop ID listed in Table 1. Black diamonds indicate localities where Sorex arunchi specimenswere found. Broken black lines refer to geographical regions arbitrary defined for discussion (W, west; NW, north-west;C, central; E, east).
866 G. YANNIC ET AL.
© 2012 The Linnean Society of London, Biological Journal of the Linnean Society, 2012, 105, 864–880
PHYLOGEOGRAPHY OF S. ANTINORII 867
© 2012 The Linnean Society of London, Biological Journal of the Linnean Society, 2012, 105, 864–880
chains of ten million generations. Trees were sampledevery 1000 generations. To assess convergence amongMCMC runs, the trends and distributions of log-likelihoods and parameter values were examined inTRACER, version 1.4 (Rambaut & Drummond, 2007),and the correlations of split frequencies among runswere examined in AWTY (Nylander et al., 2008).Samples showed patterns consistent with stationarityand convergence after at most one million generationsfor all runs and data sets; hence, the first 10% ofsamples were discarded as burn-in for all analyses.The remaining trees were used to construct a 50%majority-consensus tree. Resulting phylograms andposterior probabilities were visualized in FIGTREE,version 1.3.1 (Rambaut, 2009). We follow a conserva-tive approach considering only posterior probabilities� 0.90 as significant. A parsimony phylogeneticnetwork of cyt b haplotypes was constructed usingNETWORK, version 4.5.1.0 (Fluxus Technology Ltd)(Bandelt, Forster & Röhl, 1999) with a median-joiningalgorithm and a greedy FHP (‘prior to further process-ing’) genetic distance calculation method (Bandeltet al., 1999). The median-joining algorithm identifiesgroups of haplotypes and introduces hypothetical (non-observed) haplotypes to construct the parsimonynetwork. Under the circumstances of closely-relatedsequences, there are advantages in using a median-joining network to depict relationships (Posada &Crandall, 2001) and simulation studies have demon-strated that this method provides reliable estimates ofthe true genealogy (Cassens, Mardulyn & Milinko-vitch, 2005; Woolley, Posada & Crandall, 2008).
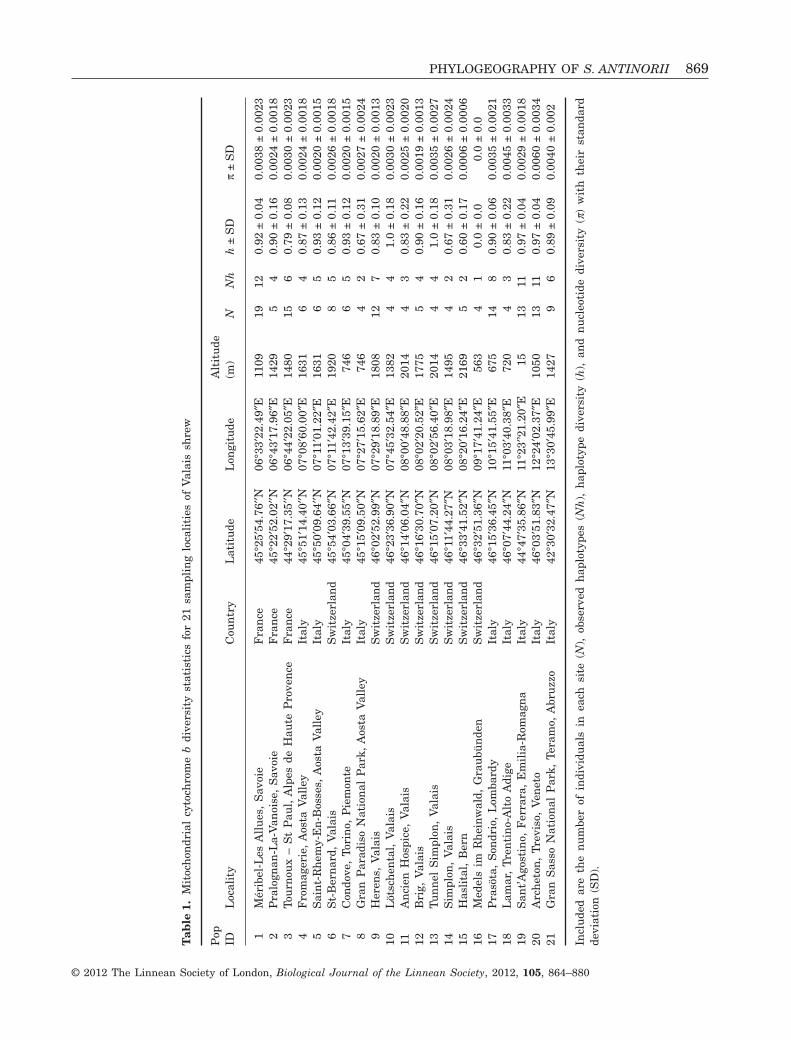
Genetic and statistical analysisStandard sequence polymorphism indices [number ofhaplotypes (Nh), polymorphic sites and parsimonyinformative sites] and molecular diversity indices [i.e.gene diversity (h) and nucleotide diversity (p), whichare equivalent to heterozygosity at the haplotype andnucleotide level, respectively] were estimated usingARLEQUIN, version 3.5.1.2 (Excoffier & Lischer,2010). Populations in refugial regions often show highallelic diversity as a result of refugia persistence andthe accumulation of variation (Hewitt, 1996, 2001).Diversity indices were therefore estimated for thewhole dataset and for the 21 sampling localities forwhich data on at least four specimens were available(Fig. 1, Table 1). The prediction is that a refugialpopulation spreading from its leading edge will expe-rience a series of bottlenecks that will reduce diver-sity. Thus, mtDNA diversity should decrease withdistance from a refugium. This prediction has beenmodelled by computer simulations (Hewitt, 1996) andobserved empirically (Shafer, Côté & Coltman, 2011).
A mismatch distribution (distribution of the numberof differences between pairs of haplotypes) was esti-mated to compare the demography of the populationswith the expectations of a sudden population expan-sion model (Harpending et al., 1998). The raggednessindex (rg), which measures the smoothness of theobserved distribution, was computed and the statisti-cal validity of the estimated expansion model wastested using a parametric bootstrap approach as a sumof square deviations (SSD) between the observed andthe expected mismatch (Schneider & Excoffier, 1999)using ARLEQUIN, version 3.5.1.2 (10 000 replicates).Fu’s (1997) Fs and Tajima’s (1989) D-tests for popula-tion expansion were performed in ARLEQUIN usingcoalescent simulations to test for statistical signifi-cance (10 000 replicates).
SPECIES DISTRIBUTION MODELLING
We used records of S. antinorii throughout its rangeeither from our own fieldwork, from databases(Centre Suisse de Cartographie de la Faune, Neuchâ-tel; Maiorano, Falcucci & Boitani, 2008) or frommuseum specimens obtained for our study (seeAcknowledgements; see also the Supporting informa-tion, Fig. S1). Because the occurrences were highlyaggregated in some areas as a result of trappingintensity, we randomly selected a subset of occur-rences with a minimal distance of 10 km. Becausemost modelling techniques require information aboutboth presence and absence to determine the suitableconditions for a given species, we selected 10 000pseudo-absences randomly over the study area cover-ing the whole Italian peninsula, as well as the Alps;these correspond to the raw boundaries of the rangeoccupied by the species. The modelling techniquesthen discriminate between the conditions suitable forpresence and the background environment (Wisz &Guisan, 2009). The resulting presences and pseudo-absences were used in the subsequent SDM.
We ran species distribution models at a resolutionof 2.5 arc-minutes (5 km at the equator) using eightclimatic variables taken from Worldclim (Hijmanset al., 2005), expected to have a biological meaningfor the distribution of S. antinorii: annual meantemperature (bio1), temperature seasonality (bio4),maximum temperature of the warmest month (bio5),minimum temperature of the coldest month (bio6),annual precipitation (bio12), precipitation of thewettest month (bio13), precipitation of the driestmonth (bio14), and precipitation seasonality (bio15).
We modelled the distribution of the speciesusing the BIOMOD package (Thuiller et al., 2009),implemented for R software (R Development CoreTeam, 2008). Ensemble forecasting approaches have
868 G. YANNIC ET AL.
© 2012 The Linnean Society of London, Biological Journal of the Linnean Society, 2012, 105, 864–880
Tab
le1.
Mit
och
ondr
ial
cyto
chro
me
bdi
vers
ity
stat
isti
csfo
r21
sam
plin
glo
cali
ties
ofV
alai
ssh
rew
Pop
IDL
ocal
ity
Cou
ntr
yL
atit
ude
Lon
gitu
deA
ltit
ude
(m)
NN
hh
±S
Dp
±S
D
1M
érib
el-L
esA
llu
es,
Sav
oie
Fra
nce
45°2
5′54
.76′
′N06
°33′
22.4
9″E
1109
1912
0.92
±0.
040.
0038
±0.
0023
2P
ralo
gnan
-La-
Van
oise
,S
avoi
eF
ran
ce45
°22′
52.0
2′′N
06°4
3′17
.96″
E14
295
40.
90±
0.16
0.00
24±
0.00
183
Tou
rnou
x–
St
Pau
l,A
lpes
deH
aute
Pro
ven
ceF
ran
ce44
°29′
17.3
5′′N
06°4
4′22
.05″
E14
8015
60.
79±
0.08
0.00
30±
0.00
234
Fro
mag
erie
,A
osta
Val
ley
Ital
y45
°51′
14.4
0′′N
07°0
8′60
.00″
E16
316
40.
87±
0.13
0.00
24±
0.00
185
Sai
nt-
Rh
emy-
En
-Bos
ses,
Aos
taV
alle
yIt
aly
45°5
0′09
.64′
′N07
°11′
01.2
2″E
1631
65
0.93
±0.
120.
0020
±0.
0015
6S
t-B
ern
ard,
Val
ais
Sw
itze
rlan
d45
°54′
03.6
6″N
07°1
1′42
.42″
E19
208
50.
86±
0.11
0.00
26±
0.00
187
Con
dove
,To
rin
o,P
iem
onte
Ital
y45
°04′
39.5
5″N
07°1
3′39
.15″
E74
66
50.
93±
0.12
0.00
20±
0.00
158
Gra
nP
arad
iso
Nat
ion
alP
ark,
Aos
taV
alle
yIt
aly
45°1
5′09
.50″
N07
°27′
15.6
2″E
746
42
0.67
±0.
310.
0027
±0.
0024
9H
eren
s,V
alai
sS
wit
zerl
and
46°0
2′52
.99″
N07
°29′
18.8
9″E
1808
127
0.83
±0.
100.
0020
±0.
0013
10L
ötsc
hen
tal,
Val
ais
Sw
itze
rlan
d46
°23′
36.9
0″N
07°4
5′32
.54″
E13
824
41.
0±
0.18
0.00
30±
0.00
2311
An
cien
Hos
pice
,V
alai
sS
wit
zerl
and
46°1
4′06
.04 ″
N08
°00′
48.8
8″E
2014
43
0.83
±0.
220.
0025
±0.
0020
12B
rig,
Val
ais
Sw
itze
rlan
d46
°16′
30.7
0″N
08°0
2′20
.52”
E17
755
40.
90±
0.16
0.00
19±
0.00
1313
Tun
nel
Sim
plon
,V
alai
sS
wit
zerl
and
46°1
5′07
.20″
N08
°02′
56.4
0″E
2014
44
1.0
±0.
180.
0035
±0.
0027
14S
impl
on,
Val
ais
Sw
itze
rlan
d46
°11′
44.2
7″N
08°0
3′18
.98″
E14
954
20.
67±
0.31
0.00
26±
0.00
2415
Has
lita
l,B
ern
Sw
itze
rlan
d46
°33′
41.5
2″N
08°2
0′16
.24″
E21
695
20.
60±
0.17
0.00
06±
0.00
0616
Med
els
imR
hei
nw
ald,
Gra
ubü
nde
nS
wit
zerl
and
46°3
2′51
.36″
N09
°17′
41.2
4″E
563
41
0.0
±0.
00.
0±
0.0
17P
rasö
ta,
Son
drio
,L
omba
rdy
Ital
y46
°15′
36.4
5″N
10°1
5′41
.55″
E67
514
80.
90±
0.06
0.00
35±
0.00
2118
Lam
ar,
Tren
tin
o-A
lto
Adi
geIt
aly
46°0
7′44
.24″
N11
°03′
40.3
8″E
720
43
0.83
±0.
220.
0045
±0.
0033
19S
ant’A
gost
ino,
Fer
rara
,E
mil
ia-R
omag
na
Ital
y44
°47′
35.8
6″N
11°2
3′’2
1.20
″E15
1311
0.97
±0.
040.
0029
±0.
0018
20A
rch
eton
,Tr
evis
o,V
enet
oIt
aly
46°0
3′51
.83″
N12
°24′
02.3
7″E
1050
1311
0.97
±0.
040.
0060
±0.
0034
21G
ran
Sas
soN
atio
nal
Par
k,Te
ram
o,A
bru
zzo
Ital
y42
°30′
32.4
7″N
13°3
0′45
.99″
E14
279
60.
89±
0.09
0.00
40±
0.00
2
Incl
ude
dar
eth
en
um
ber
ofin
divi
dual
sin
each
site
(N),
obse
rved
hap
loty
pes
(Nh
),h
aplo
type
dive
rsit
y(h
),an
dn
ucl
eoti
dedi
vers
ity
(p)
wit
hth
eir
stan
dard
devi
atio
n(S
D).
PHYLOGEOGRAPHY OF S. ANTINORII 869
© 2012 The Linnean Society of London, Biological Journal of the Linnean Society, 2012, 105, 864–880
been shown to significantly improve the accuracy ofspecies distribution models (Marmion et al., 2009).Therefore, we used and combined the results of sevendifferent statistical techniques to model the distribu-tion of the species: (1) generalized linear model(GLM); (2) generalized additive model (GAM); (3)classification tree analysis (CTA); (4) artificial neuralnetworks (ANN); (5) multivariate adaptive regressionsplines (MARS); (6) generalized boosting model(GBM); and (7) Random Forest (RF).
To evaluate the predictive performance of thespecies distribution model, we used a random subsetof 70% of the data to calibrate every model, andused the remaining 30% for the evaluation. Modelswere evaluated using a relative operating character-istic (ROC) curve and the area under the curve(AUC) (Fielding & Bell, 1997). We repeated the split50 times and recalculated the average AUC of therepeated split-samples, which gave a more robustestimate of the predictive performance of eachmodel.
Finally, each model was projected into the pastusing two general circulation model (GCM) simu-lations for the last glacial maximum (LGM:21 000 ± 2000 years): the Worldclim data of the Com-munity Climate System Model (CCSM; Collins et al.,2004) and the Model for Interdisciplinary Research onClimate (MIROC, version 3.2; Hasumi & Emori, 2004)downscaled to a resolution of 2.5 (4 km) arc-minutesresolution. To reflect the central tendency of thesedistributions, accounting for variations among mod-elling techniques, we applied a weighted average ofthe seven modelling techniques based on the predic-tive power (AUC; Araújo & New, 2007). Predictions ofspecies distributions were obtained by classifying theprobabilities into binary presence and absence dataaccording to a ROC-optimized threshold, which isconsidered among the best-performing threshold-based approaches (Liu et al., 2005).
LANDSCAPE DATA AND LANDSCAPE
RESISTANCE MODELS
Although mtDNA evolves too slowly to be useful forinferring most recent and ongoing micro-evolutionaryprocesses, the variations in haplotype frequencies arestill informative for identifying landscape processesshaping genetic structure through gene flow (Wang,2010).
For this analysis, the dataset was reduced to thesampling localities for which data on at least fourspecimens were available, and we excluded the south-ernmost population Gran Sasso, Abruzzo, because itsdistance from the others exceeded computational limi-tations. Therefore, the landscape analysis included154 out of the 179 S. antinorii individuals and 89 out
of the 103 inferred mtDNA haplotypes from 20 differ-ent sampling localities (Fig. 1, Table 1). The popula-tion structure across the study area and betweensampling sites was assessed by calculating fST, usingARLEQUIN. For the genetic model, we used theKimura two-parameter genetic distance (Kimura,1980). Significance values for the two methods ofcomputation of population structure were obtainedafter 10 000 permutations.
We used CIRCUITSCAPE, version 2.2 (McRae,2006) to model the connectivity between populationsaccounting for landscape features, which canenhance or limit the dispersal of S. antinorii. Thealgorithm in CIRCUITSCAPE evaluates landscaperesistance or conductance between the investigatedpopulations from multiple paths (McRae, 2006). Forthis analysis, we first generated a raster of land-scape resistance based on a ‘flat’ landscape (i.e. allpixels with the same resistance value) at a resolu-tion of 300 m for an area containing the 20 popu-lations analyzed. Second, we generated a digitalelevation model (DEM) at a resolution of 300 mfrom the raster DEM. Because it is expected to bemore costly for the species to climb to a higherelevation to disperse, higher altitude can be seenas a resistance to connectivity. Third, because thespecies is known to use moist (i.e. riverside usedas corridor) habitat with a dense vegetation cover(Lugon-Moulin, 2004), we created a raster of dis-tances to rivers, assigning pixels far from rivers asmore resistant to dispersal (RIV). These two land-scape rasters were rescaled to have values between0 and 1. Finally, we extracted a raster of land cover(LAC) from the ESA-GlobCover at a resolution of300 m. We assigned conductance values from 0 to 1to each land cover categories using our knowledge ofthe ecology of the species (Lugon-Moulin et al., 1999;Lugon-Moulin & Hausser, 2002; Lugon-Moulin,2004; Yannic et al., 2008b) and expert knowledgefrom the literature (Murray et al., 2009). All largewater bodies were given a conductance a priori of 0in all rasters. We also generated input rasters forCIRCUITSCAPE combining pairs of landscape fea-tures corresponding to the sum of the rasterspreviously calculated (McRae & Beier, 2007). Wegenerated a pairwise connectivity matrix based onthe four rasters above and their combination. Toevaluate the relative importance of the landscapefeatures in predicting levels of genetic structureacross the population studied, we conducted Mantel(1967) tests examining correlations between pair-wise genetic structure and models of pairwise con-nectivity. All Mantel tests were conducted in theR software package ECODIST (Goslee & Urban,2007) with 10 000 matrix permutations to assesssignificance.
870 G. YANNIC ET AL.
© 2012 The Linnean Society of London, Biological Journal of the Linnean Society, 2012, 105, 864–880
RESULTSPHYLOGEOGRAPHICAL ANALYSIS AND
MOLECULAR DATING
A total of 103 haplotypes was identified among the185 specimens and deposited in GenBank (accessionnumbers: HQ901808–HQ901910). Of the 1011 bpsequenced, 115 sites were variable and 57 parsimony-informative. No insertions or deletions were observed.The average transitions/transversion ratio (5.5) andbase composition (T: 29.2%; C: 28.2%; A: 28.8%; G:13.8%) are similar to values reported in previousstudies of the cyt b gene of several small mammals(Michaux et al., 2003; Deffontaine et al., 2005).
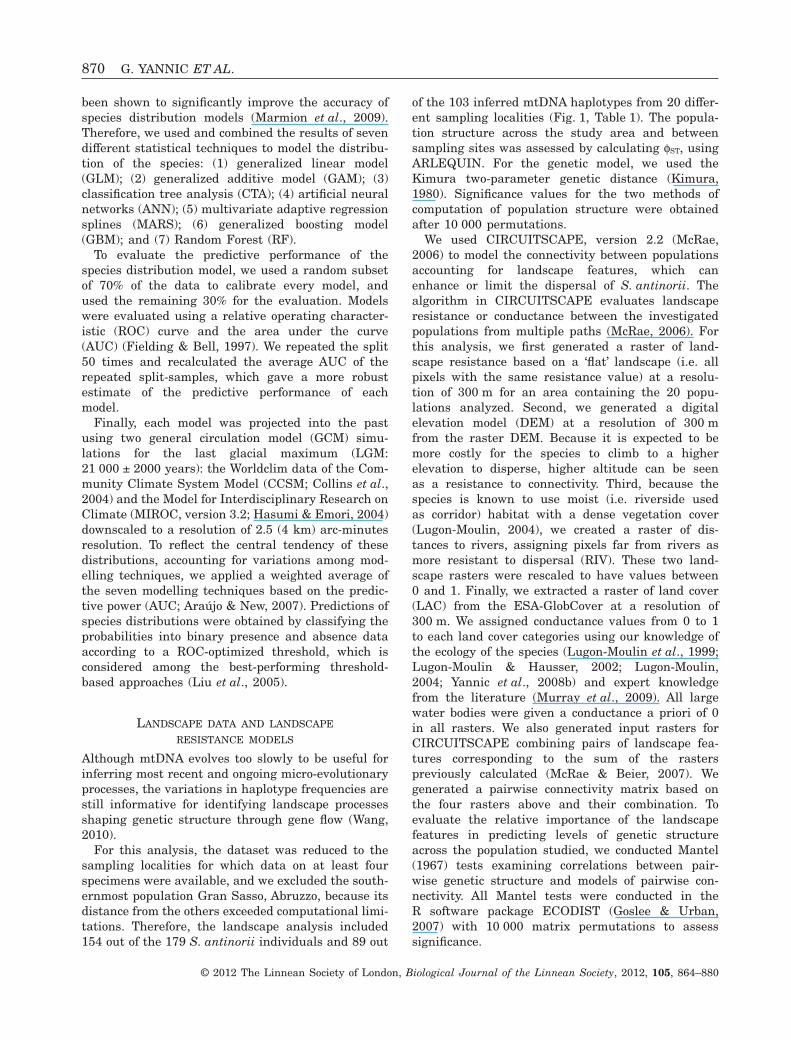
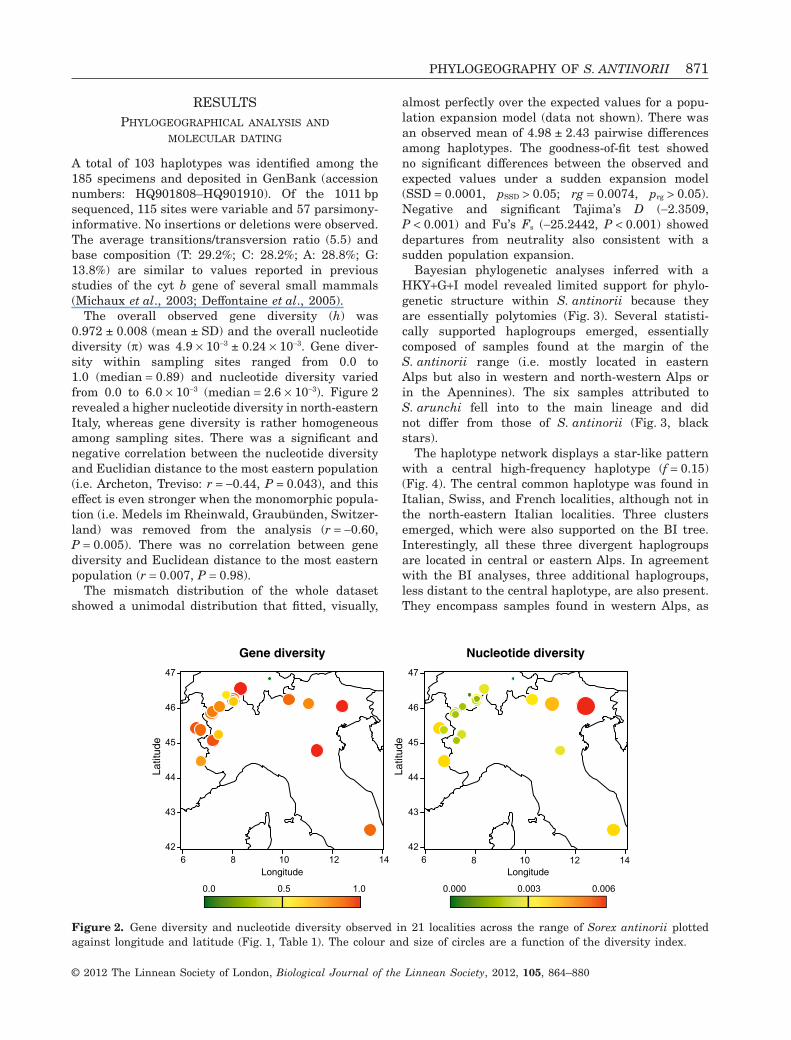
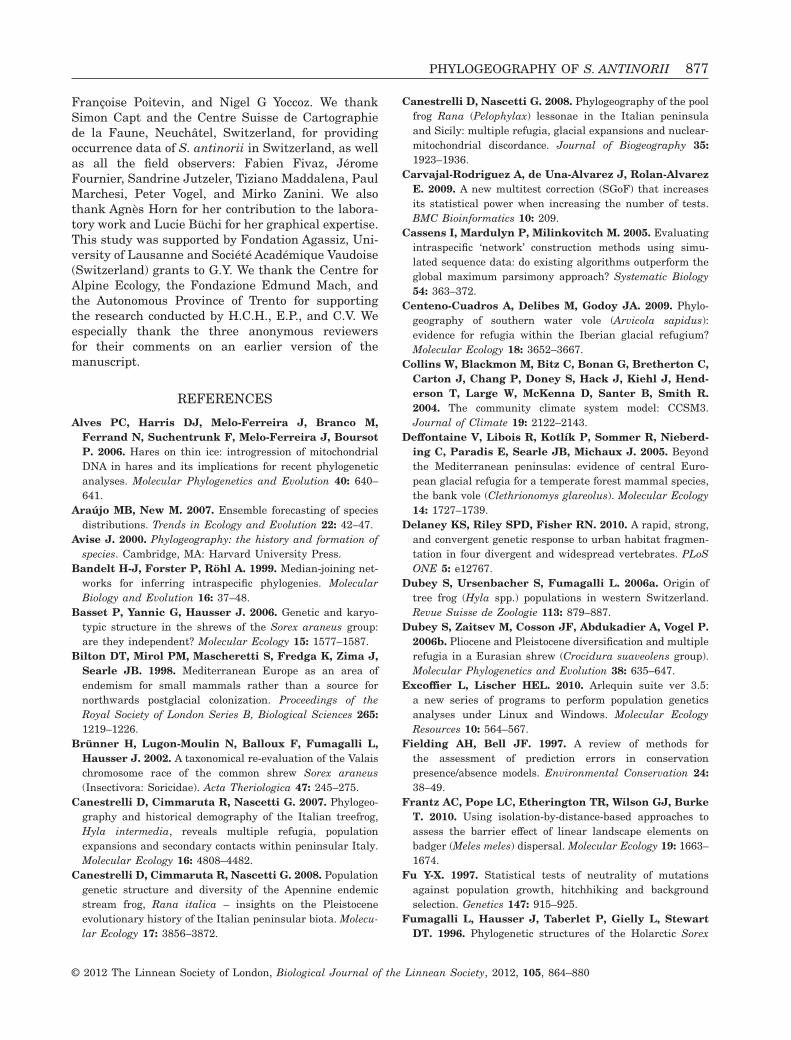
The overall observed gene diversity (h) was0.972 ± 0.008 (mean ± SD) and the overall nucleotidediversity (p) was 4.9 ¥ 10-3 ± 0.24 ¥ 10-3. Gene diver-sity within sampling sites ranged from 0.0 to1.0 (median = 0.89) and nucleotide diversity variedfrom 0.0 to 6.0 ¥ 10-3 (median = 2.6 ¥ 10-3). Figure 2revealed a higher nucleotide diversity in north-easternItaly, whereas gene diversity is rather homogeneousamong sampling sites. There was a significant andnegative correlation between the nucleotide diversityand Euclidian distance to the most eastern population(i.e. Archeton, Treviso: r = -0.44, P = 0.043), and thiseffect is even stronger when the monomorphic popula-tion (i.e. Medels im Rheinwald, Graubünden, Switzer-land) was removed from the analysis (r = -0.60,P = 0.005). There was no correlation between genediversity and Euclidean distance to the most easternpopulation (r = 0.007, P = 0.98).
The mismatch distribution of the whole datasetshowed a unimodal distribution that fitted, visually,
almost perfectly over the expected values for a popu-lation expansion model (data not shown). There wasan observed mean of 4.98 ± 2.43 pairwise differencesamong haplotypes. The goodness-of-fit test showedno significant differences between the observed andexpected values under a sudden expansion model(SSD = 0.0001, pSSD > 0.05; rg = 0.0074, prg > 0.05).Negative and significant Tajima’s D (-2.3509,P < 0.001) and Fu’s Fs (-25.2442, P < 0.001) showeddepartures from neutrality also consistent with asudden population expansion.
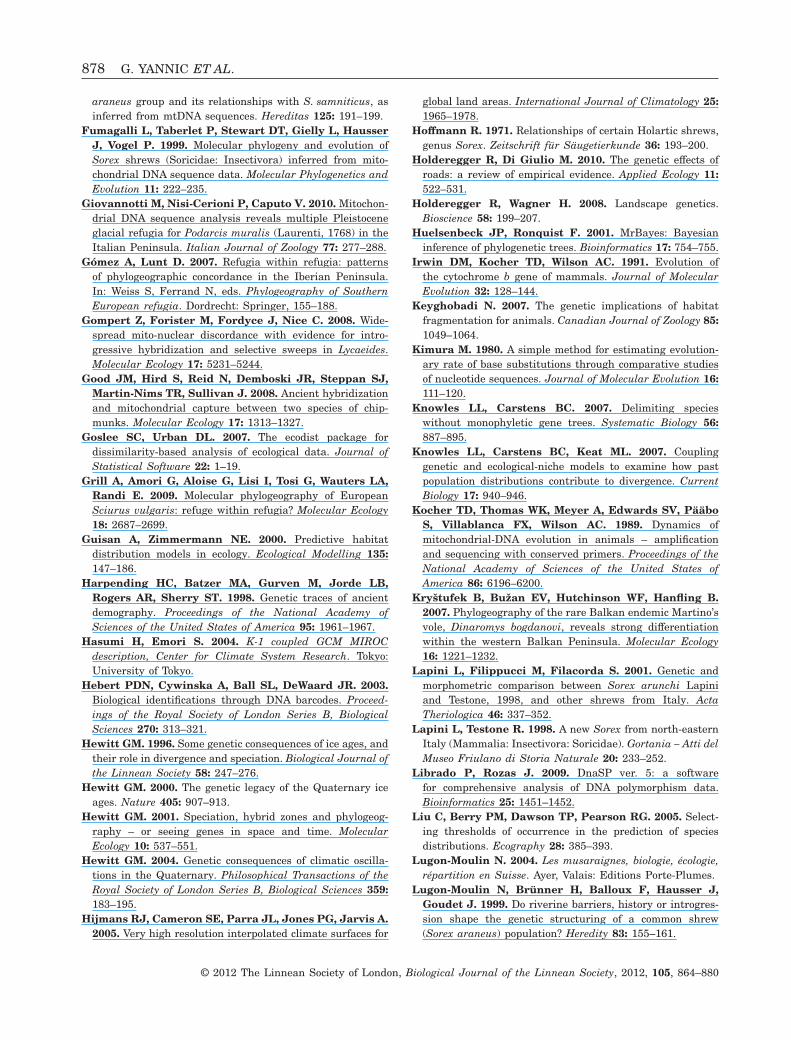
Bayesian phylogenetic analyses inferred with aHKY+G+I model revealed limited support for phylo-genetic structure within S. antinorii because theyare essentially polytomies (Fig. 3). Several statisti-cally supported haplogroups emerged, essentiallycomposed of samples found at the margin of theS. antinorii range (i.e. mostly located in easternAlps but also in western and north-western Alps orin the Apennines). The six samples attributed toS. arunchi fell into to the main lineage and didnot differ from those of S. antinorii (Fig. 3, blackstars).
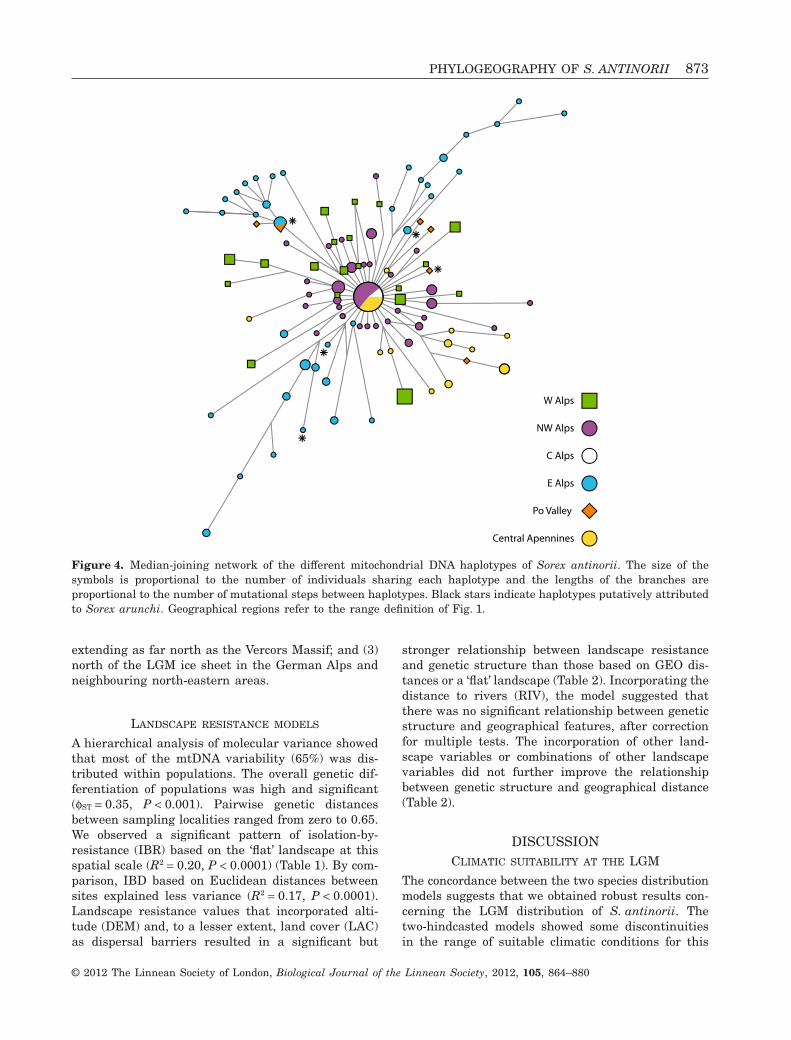
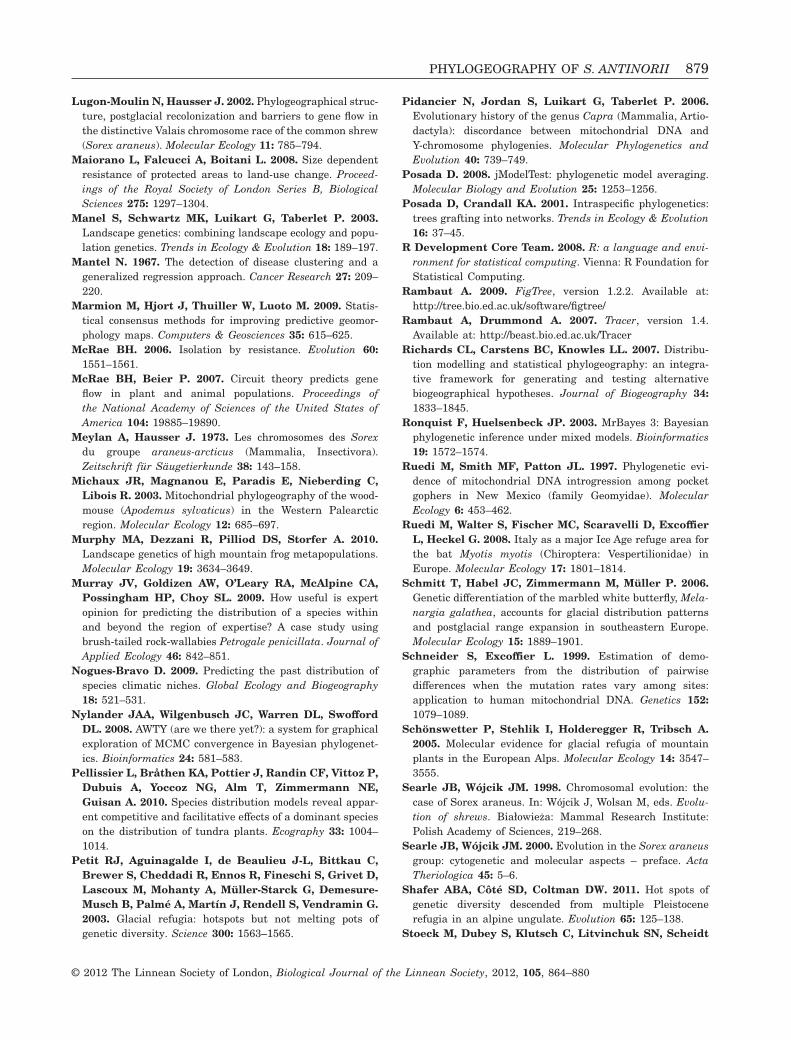
The haplotype network displays a star-like patternwith a central high-frequency haplotype (f = 0.15)(Fig. 4). The central common haplotype was found inItalian, Swiss, and French localities, although not inthe north-eastern Italian localities. Three clustersemerged, which were also supported on the BI tree.Interestingly, all these three divergent haplogroupsare located in central or eastern Alps. In agreementwith the BI analyses, three additional haplogroups,less distant to the central haplotype, are also present.They encompass samples found in western Alps, as
6 8 10 12 14
42
43
44
45
46
47
Nucleotide diversity
Longitude
Latitud
e
0.0030.000 0.006
6 8 10 12 1442
43
44
45
46
47
Gene diversity
Longitude
Latitud
e
0.50.0 1.0
Figure 2. Gene diversity and nucleotide diversity observed in 21 localities across the range of Sorex antinorii plottedagainst longitude and latitude (Fig. 1, Table 1). The colour and size of circles are a function of the diversity index.
PHYLOGEOGRAPHY OF S. ANTINORII 871
© 2012 The Linnean Society of London, Biological Journal of the Linnean Society, 2012, 105, 864–880
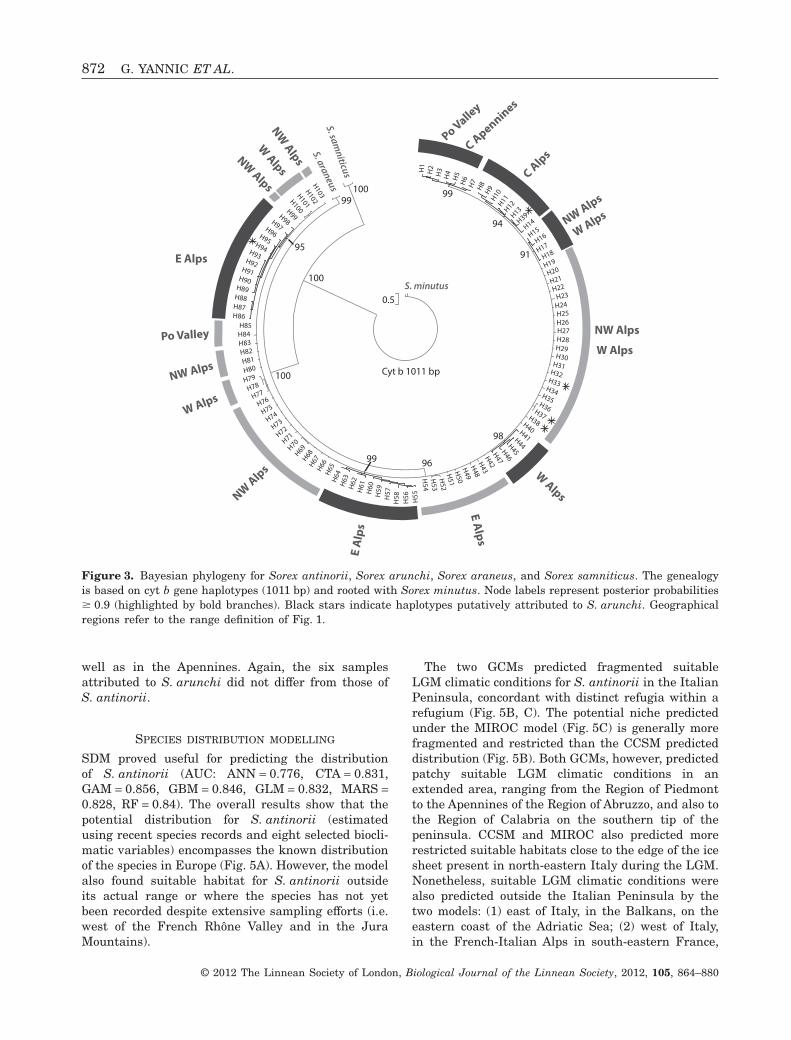
well as in the Apennines. Again, the six samplesattributed to S. arunchi did not differ from those ofS. antinorii.
SPECIES DISTRIBUTION MODELLING
SDM proved useful for predicting the distributionof S. antinorii (AUC: ANN = 0.776, CTA = 0.831,GAM = 0.856, GBM = 0.846, GLM = 0.832, MARS =0.828, RF = 0.84). The overall results show that thepotential distribution for S. antinorii (estimatedusing recent species records and eight selected biocli-matic variables) encompasses the known distributionof the species in Europe (Fig. 5A). However, the modelalso found suitable habitat for S. antinorii outsideits actual range or where the species has not yetbeen recorded despite extensive sampling efforts (i.e.west of the French Rhône Valley and in the JuraMountains).
The two GCMs predicted fragmented suitableLGM climatic conditions for S. antinorii in the ItalianPeninsula, concordant with distinct refugia within arefugium (Fig. 5B, C). The potential niche predictedunder the MIROC model (Fig. 5C) is generally morefragmented and restricted than the CCSM predicteddistribution (Fig. 5B). Both GCMs, however, predictedpatchy suitable LGM climatic conditions in anextended area, ranging from the Region of Piedmontto the Apennines of the Region of Abruzzo, and also tothe Region of Calabria on the southern tip of thepeninsula. CCSM and MIROC also predicted morerestricted suitable habitats close to the edge of the icesheet present in north-eastern Italy during the LGM.Nonetheless, suitable LGM climatic conditions werealso predicted outside the Italian Peninsula by thetwo models: (1) east of Italy, in the Balkans, on theeastern coast of the Adriatic Sea; (2) west of Italy,in the French-Italian Alps in south-eastern France,
H1
H2
H3
H4
H5
H6
H7 H8 H9H10
H11H12
H13
H39
H14
H15H16
H17
H18
H19
H20
H21H22
H23H24H25H26H27H28H29H30
H31H32
H33H34H35
H36H37H38H40H41H44H45H46H47H42H43H48
H49
H50
H51H
52H
53H
54
H55
H56
H58H
57H59H60H61H
62H63H6
4H65H66H67H68H69H70H71H72H73H74H75H76H77
H78H79H80
H81H82
H83H84H85
H86H87H88H89
H90
H91
H92
H93
H94
H95
H96
H97
H98
H99
H100H101
H102H103
S. araneusS. sam
niticus
S. minutus
NW Alps
C Apennines
E Alps
W Alps
Po Valley
E Alps
C Alps
NW Alps
W Alps
W Alps
E A
lps
W Alps
Po Valley
NW Alps
NW Alps
W Alps
NW Alps
NW Alps
Cyt b 1011 bp
91
94
99
95
100
100
100
99 96
99
98
0.5
Figure 3. Bayesian phylogeny for Sorex antinorii, Sorex arunchi, Sorex araneus, and Sorex samniticus. The genealogyis based on cyt b gene haplotypes (1011 bp) and rooted with Sorex minutus. Node labels represent posterior probabilities� 0.9 (highlighted by bold branches). Black stars indicate haplotypes putatively attributed to S. arunchi. Geographicalregions refer to the range definition of Fig. 1.
872 G. YANNIC ET AL.
© 2012 The Linnean Society of London, Biological Journal of the Linnean Society, 2012, 105, 864–880
extending as far north as the Vercors Massif; and (3)north of the LGM ice sheet in the German Alps andneighbouring north-eastern areas.
LANDSCAPE RESISTANCE MODELS
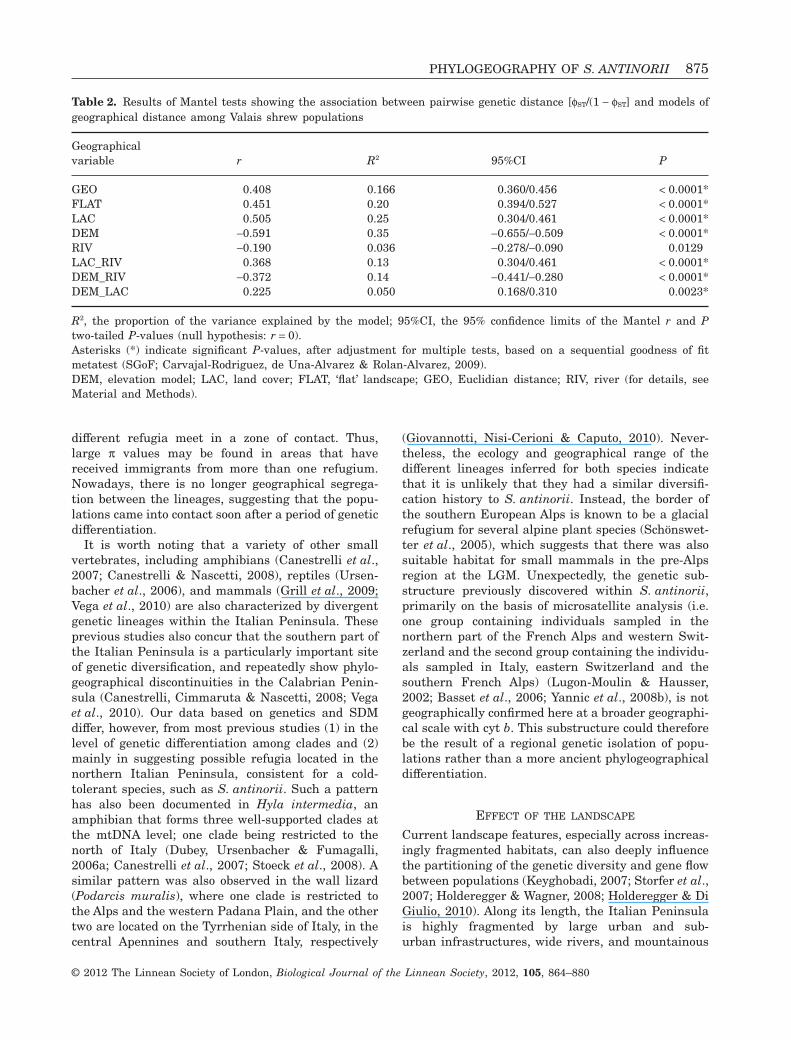
A hierarchical analysis of molecular variance showedthat most of the mtDNA variability (65%) was dis-tributed within populations. The overall genetic dif-ferentiation of populations was high and significant(fST = 0.35, P < 0.001). Pairwise genetic distancesbetween sampling localities ranged from zero to 0.65.We observed a significant pattern of isolation-by-resistance (IBR) based on the ‘flat’ landscape at thisspatial scale (R2 = 0.20, P < 0.0001) (Table 1). By com-parison, IBD based on Euclidean distances betweensites explained less variance (R2 = 0.17, P < 0.0001).Landscape resistance values that incorporated alti-tude (DEM) and, to a lesser extent, land cover (LAC)as dispersal barriers resulted in a significant but
stronger relationship between landscape resistanceand genetic structure than those based on GEO dis-tances or a ‘flat’ landscape (Table 2). Incorporating thedistance to rivers (RIV), the model suggested thatthere was no significant relationship between geneticstructure and geographical features, after correctionfor multiple tests. The incorporation of other land-scape variables or combinations of other landscapevariables did not further improve the relationshipbetween genetic structure and geographical distance(Table 2).
DISCUSSIONCLIMATIC SUITABILITY AT THE LGM
The concordance between the two species distributionmodels suggests that we obtained robust results con-cerning the LGM distribution of S. antinorii. Thetwo-hindcasted models showed some discontinuitiesin the range of suitable climatic conditions for this
NW Alps
Central Apennines
E Alps
C Alps
W Alps
Po Valley
Figure 4. Median-joining network of the different mitochondrial DNA haplotypes of Sorex antinorii. The size of thesymbols is proportional to the number of individuals sharing each haplotype and the lengths of the branches areproportional to the number of mutational steps between haplotypes. Black stars indicate haplotypes putatively attributedto Sorex arunchi. Geographical regions refer to the range definition of Fig. 1.
PHYLOGEOGRAPHY OF S. ANTINORII 873
© 2012 The Linnean Society of London, Biological Journal of the Linnean Society, 2012, 105, 864–880
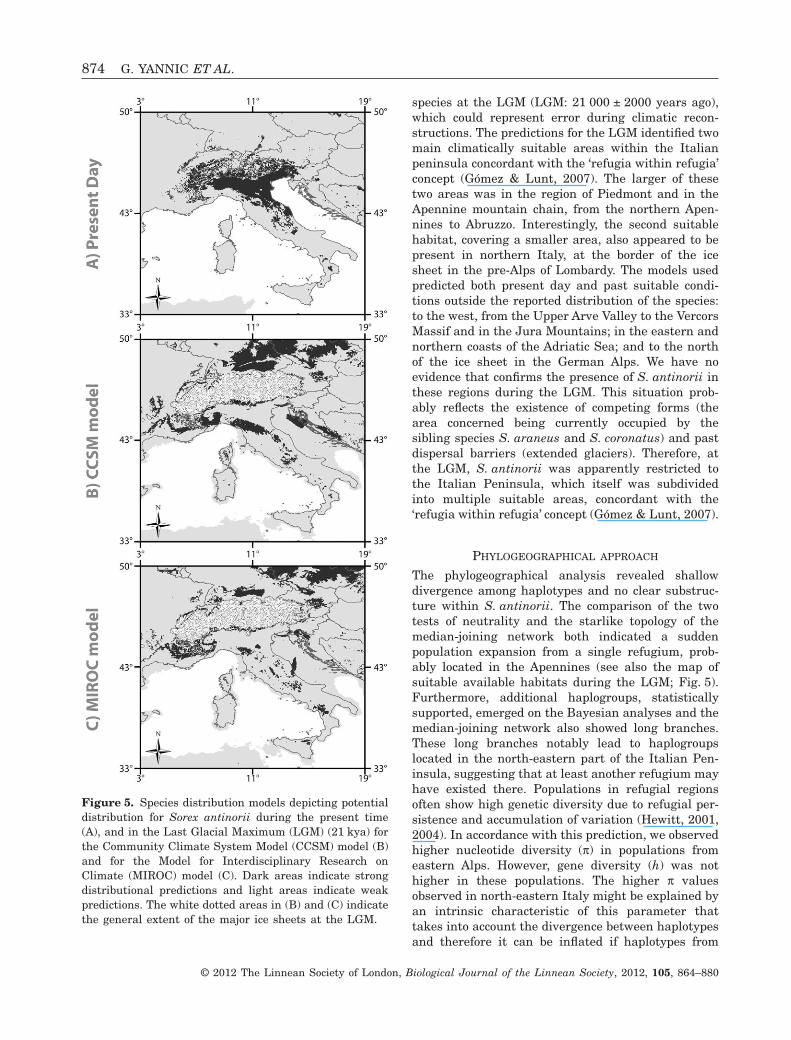
species at the LGM (LGM: 21 000 ± 2000 years ago),which could represent error during climatic recon-structions. The predictions for the LGM identified twomain climatically suitable areas within the Italianpeninsula concordant with the ‘refugia within refugia’concept (Gómez & Lunt, 2007). The larger of thesetwo areas was in the region of Piedmont and in theApennine mountain chain, from the northern Apen-nines to Abruzzo. Interestingly, the second suitablehabitat, covering a smaller area, also appeared to bepresent in northern Italy, at the border of the icesheet in the pre-Alps of Lombardy. The models usedpredicted both present day and past suitable condi-tions outside the reported distribution of the species:to the west, from the Upper Arve Valley to the VercorsMassif and in the Jura Mountains; in the eastern andnorthern coasts of the Adriatic Sea; and to the northof the ice sheet in the German Alps. We have noevidence that confirms the presence of S. antinorii inthese regions during the LGM. This situation prob-ably reflects the existence of competing forms (thearea concerned being currently occupied by thesibling species S. araneus and S. coronatus) and pastdispersal barriers (extended glaciers). Therefore, atthe LGM, S. antinorii was apparently restricted tothe Italian Peninsula, which itself was subdividedinto multiple suitable areas, concordant with the‘refugia within refugia’ concept (Gómez & Lunt, 2007).
PHYLOGEOGRAPHICAL APPROACH
The phylogeographical analysis revealed shallowdivergence among haplotypes and no clear substruc-ture within S. antinorii. The comparison of the twotests of neutrality and the starlike topology of themedian-joining network both indicated a suddenpopulation expansion from a single refugium, prob-ably located in the Apennines (see also the map ofsuitable available habitats during the LGM; Fig. 5).Furthermore, additional haplogroups, statisticallysupported, emerged on the Bayesian analyses and themedian-joining network also showed long branches.These long branches notably lead to haplogroupslocated in the north-eastern part of the Italian Pen-insula, suggesting that at least another refugium mayhave existed there. Populations in refugial regionsoften show high genetic diversity due to refugial per-sistence and accumulation of variation (Hewitt, 2001,2004). In accordance with this prediction, we observedhigher nucleotide diversity (p) in populations fromeastern Alps. However, gene diversity (h) was nothigher in these populations. The higher p valuesobserved in north-eastern Italy might be explained byan intrinsic characteristic of this parameter thattakes into account the divergence between haplotypesand therefore it can be inflated if haplotypes from
Figure 5. Species distribution models depicting potentialdistribution for Sorex antinorii during the present time(A), and in the Last Glacial Maximum (LGM) (21 kya) forthe Community Climate System Model (CCSM) model (B)and for the Model for Interdisciplinary Research onClimate (MIROC) model (C). Dark areas indicate strongdistributional predictions and light areas indicate weakpredictions. The white dotted areas in (B) and (C) indicatethe general extent of the major ice sheets at the LGM.
874 G. YANNIC ET AL.
© 2012 The Linnean Society of London, Biological Journal of the Linnean Society, 2012, 105, 864–880
different refugia meet in a zone of contact. Thus,large p values may be found in areas that havereceived immigrants from more than one refugium.Nowadays, there is no longer geographical segrega-tion between the lineages, suggesting that the popu-lations came into contact soon after a period of geneticdifferentiation.
It is worth noting that a variety of other smallvertebrates, including amphibians (Canestrelli et al.,2007; Canestrelli & Nascetti, 2008), reptiles (Ursen-bacher et al., 2006), and mammals (Grill et al., 2009;Vega et al., 2010) are also characterized by divergentgenetic lineages within the Italian Peninsula. Theseprevious studies also concur that the southern part ofthe Italian Peninsula is a particularly important siteof genetic diversification, and repeatedly show phylo-geographical discontinuities in the Calabrian Penin-sula (Canestrelli, Cimmaruta & Nascetti, 2008; Vegaet al., 2010). Our data based on genetics and SDMdiffer, however, from most previous studies (1) in thelevel of genetic differentiation among clades and (2)mainly in suggesting possible refugia located in thenorthern Italian Peninsula, consistent for a cold-tolerant species, such as S. antinorii. Such a patternhas also been documented in Hyla intermedia, anamphibian that forms three well-supported clades atthe mtDNA level; one clade being restricted to thenorth of Italy (Dubey, Ursenbacher & Fumagalli,2006a; Canestrelli et al., 2007; Stoeck et al., 2008). Asimilar pattern was also observed in the wall lizard(Podarcis muralis), where one clade is restricted tothe Alps and the western Padana Plain, and the othertwo are located on the Tyrrhenian side of Italy, in thecentral Apennines and southern Italy, respectively
(Giovannotti, Nisi-Cerioni & Caputo, 2010). Never-theless, the ecology and geographical range of thedifferent lineages inferred for both species indicatethat it is unlikely that they had a similar diversifi-cation history to S. antinorii. Instead, the border ofthe southern European Alps is known to be a glacialrefugium for several alpine plant species (Schönswet-ter et al., 2005), which suggests that there was alsosuitable habitat for small mammals in the pre-Alpsregion at the LGM. Unexpectedly, the genetic sub-structure previously discovered within S. antinorii,primarily on the basis of microsatellite analysis (i.e.one group containing individuals sampled in thenorthern part of the French Alps and western Swit-zerland and the second group containing the individu-als sampled in Italy, eastern Switzerland and thesouthern French Alps) (Lugon-Moulin & Hausser,2002; Basset et al., 2006; Yannic et al., 2008b), is notgeographically confirmed here at a broader geographi-cal scale with cyt b. This substructure could thereforebe the result of a regional genetic isolation of popu-lations rather than a more ancient phylogeographicaldifferentiation.
EFFECT OF THE LANDSCAPE
Current landscape features, especially across increas-ingly fragmented habitats, can also deeply influencethe partitioning of the genetic diversity and gene flowbetween populations (Keyghobadi, 2007; Storfer et al.,2007; Holderegger & Wagner, 2008; Holderegger & DiGiulio, 2010). Along its length, the Italian Peninsulais highly fragmented by large urban and sub-urban infrastructures, wide rivers, and mountainous
Table 2. Results of Mantel tests showing the association between pairwise genetic distance [fST/(1 - fST] and models ofgeographical distance among Valais shrew populations
Geographicalvariable r R2 95%CI P
GEO 0.408 0.166 0.360/0.456 < 0.0001*FLAT 0.451 0.20 0.394/0.527 < 0.0001*LAC 0.505 0.25 0.304/0.461 < 0.0001*DEM -0.591 0.35 -0.655/-0.509 < 0.0001*RIV -0.190 0.036 -0.278/-0.090 0.0129LAC_RIV 0.368 0.13 0.304/0.461 < 0.0001*DEM_RIV -0.372 0.14 -0.441/-0.280 < 0.0001*DEM_LAC 0.225 0.050 0.168/0.310 0.0023*
R2, the proportion of the variance explained by the model; 95%CI, the 95% confidence limits of the Mantel r and Ptwo-tailed P-values (null hypothesis: r = 0).Asterisks (*) indicate significant P-values, after adjustment for multiple tests, based on a sequential goodness of fitmetatest (SGoF; Carvajal-Rodriguez, de Una-Alvarez & Rolan-Alvarez, 2009).DEM, elevation model; LAC, land cover; FLAT, ‘flat’ landscape; GEO, Euclidian distance; RIV, river (for details, seeMaterial and Methods).
PHYLOGEOGRAPHY OF S. ANTINORII 875
© 2012 The Linnean Society of London, Biological Journal of the Linnean Society, 2012, 105, 864–880
landscapes. Typically, these features are considered toimpede dispersal and reduce gene flow (Trombulak& Frissell, 2000; Delaney, Riley & Fisher, 2010;Frantz et al., 2010; Murphy et al., 2010). Our IBRstudy also showed that some landscape features prob-ably had an impact on the genetic differentiationamong populations of S. antinorii when we controlledfor distance between localities. In particular, weshowed that altitude and land cover had a strongeffect on population genetic differentiation. Althoughcurrent occurrences of S. antinorii are recorded upto 2700 m a.s.l. (Yannic et al., 2008b) and previousstudies showed that alpine passes of up to 2500 ma.s.l. did not represent strong barriers to gene flow forS. antinorii (Lugon-Moulin & Hausser, 2002; Yannicet al., 2008b), it is not so unexpected that glacier-covered mountain ridges and predominately rockyhabitats strongly impact gene flow. Conversely, riversapparently had no significant impact on gene flow.This result is consistent with previous studies(Lugon-Moulin et al., 1999), although such a findingmay depend on the nature of the streams (mountainstreams and moraine may impeded gene flow).
Our LS approach showed that heterogeneous land-scape (e.g. altitude and land cover) might affectgenetic differentiation among shrew populations. Wehave also previously demonstrated that S. antinoriiappears to have occupied disconnected glacial refugiain the Italian peninsula during the LGM. Based onboth approaches, it is however difficult to disentanglethe main factors (i.e. current landscape featuresor past isolation during the LGM) explaining theobserved current genetic differentiation of shrewpopulations. Two main reasons can be advocated.First, the cyt b is not the most suitable marker toinfer current gene flow. Second, the populations usedfor the LS analyses are mainly located in the north-ern range of the species (i.e. where the putativecryptic refugia were located and where the altitudesare also the highest). Therefore, both effects may bemingled.
SPECIFIC STATUS OF S. ARUNCHI,LAPINI & TESTONE, 1998
Sorex antinorii belongs to the S. araneus group,encompassing nine morphologically, genetically, andchromosomally well-described species (Fumagalliet al., 1996; Searle & Wójcik, 2000; Brünner et al.,2002). Sorex antinorii and related species alsoshow impressive diversification involving chromo-somal rearrangements. Such variability reaches itsmaximum in S. araneus, a Palearctic species differ-entiated in > 70 different karyotypic races (Searle &Wójcik, 1998; Wójcik et al., 2003). Sorex arunchi hasbeen described on the basis of morphology and mor-
phometrics (Lapini & Testone, 1998; Lapini et al.,2001). Describing new species from morphologicallyhomogeneous but species-rich groups such as S. ara-neus is notoriously difficult. Analyses of standardDNA markers are often useful for resolving suchtaxonomic problems. Therefore, the present studyincluded six samples attributed to S. arunchi, whichwere kindly provided by Luca Lapini (Museo Friulanodi Storia Naturale, Udine) and morphologically iden-tified. However, despite the possibility of cryptic sub-clades within S. antinorii as shown by our SDMapproach, the phylogenetic positions of these samplesdid not allow the distinction of S. arunchi from S. an-tinorii. Indeed, exactly the same haplotypes wereshared between the two taxa. Introgressive hybrid-ization leading to massive transfer of mtDNA haplo-types from a species to another is not an uncommonphenomenon in mammals (Ruedi, Smith & Patton,1997; Alves et al., 2006; Pidancier et al., 2006;Gompert et al., 2008; Good et al., 2008) and has prob-ably occurred among species of the S. araneus group(Yannic et al., 2008a, 2010). Therefore, additionalsamples from north-eastern Italy, where genetic dif-ferentiation has most likely occurred (Figs 3, 4), aswell as alternative marker systems (autosomal andY-chromosome genes) and karyological data, are cer-tainly required to accurately investigate S. arunchiproperly. For now, the lack of genetic differentiationshown in the present study does not support thespecific status of S. arunchi.
CONCLUSIONS
Long periods of geographical isolation during thePleistocene glaciations are viewed as the main causesof genetic differentiation and subsequent speciation ofcurrent fauna. Our results with SDM confirmed thepossibility of multiple refugia in the Italian Peninsulaand the shallow divergence within S. antinorii mayresult from both historical processes (as demon-strated by phylogeographical approaches) and con-temporary processes (as suggested by our IBRapproach). Contrasting genetic structure inferredfrom mtDNA against markers with faster evolution-ary rates (i.e. nuclear microsatellites) would, however,be required to fully disentangle the intricate role ofhistorical vicariance and contemporary fragmentationthat influence the distribution and abundance ofgenetic diversity in the Valais shrew.
ACKNOWLEDGEMENTS
We are grateful to everyone who provided tissuesamples of shrews over the years: Patrick Brunet-Lecomte, Riccardo Castiglia, Paolo Debernardi, AndréMeylan, Jean-François Noblet, Elena Patriarca,
876 G. YANNIC ET AL.
© 2012 The Linnean Society of London, Biological Journal of the Linnean Society, 2012, 105, 864–880
Françoise Poitevin, and Nigel G Yoccoz. We thankSimon Capt and the Centre Suisse de Cartographiede la Faune, Neuchâtel, Switzerland, for providingoccurrence data of S. antinorii in Switzerland, as wellas all the field observers: Fabien Fivaz, JéromeFournier, Sandrine Jutzeler, Tiziano Maddalena, PaulMarchesi, Peter Vogel, and Mirko Zanini. We alsothank Agnès Horn for her contribution to the labora-tory work and Lucie Büchi for her graphical expertise.This study was supported by Fondation Agassiz, Uni-versity of Lausanne and Société Académique Vaudoise(Switzerland) grants to G.Y. We thank the Centre forAlpine Ecology, the Fondazione Edmund Mach, andthe Autonomous Province of Trento for supportingthe research conducted by H.C.H., E.P., and C.V. Weespecially thank the three anonymous reviewersfor their comments on an earlier version of themanuscript.
REFERENCES
Alves PC, Harris DJ, Melo-Ferreira J, Branco M,Ferrand N, Suchentrunk F, Melo-Ferreira J, BoursotP. 2006. Hares on thin ice: introgression of mitochondrialDNA in hares and its implications for recent phylogeneticanalyses. Molecular Phylogenetics and Evolution 40: 640–641.
Araújo MB, New M. 2007. Ensemble forecasting of speciesdistributions. Trends in Ecology and Evolution 22: 42–47.
Avise J. 2000. Phylogeography: the history and formation ofspecies. Cambridge, MA: Harvard University Press.
Bandelt H-J, Forster P, Röhl A. 1999. Median-joining net-works for inferring intraspecific phylogenies. MolecularBiology and Evolution 16: 37–48.
Basset P, Yannic G, Hausser J. 2006. Genetic and karyo-typic structure in the shrews of the Sorex araneus group:are they independent? Molecular Ecology 15: 1577–1587.
Bilton DT, Mirol PM, Mascheretti S, Fredga K, Zima J,Searle JB. 1998. Mediterranean Europe as an area ofendemism for small mammals rather than a source fornorthwards postglacial colonization. Proceedings of theRoyal Society of London Series B, Biological Sciences 265:1219–1226.
Brünner H, Lugon-Moulin N, Balloux F, Fumagalli L,Hausser J. 2002. A taxonomical re-evaluation of the Valaischromosome race of the common shrew Sorex araneus(Insectivora: Soricidae). Acta Theriologica 47: 245–275.
Canestrelli D, Cimmaruta R, Nascetti G. 2007. Phylogeo-graphy and historical demography of the Italian treefrog,Hyla intermedia, reveals multiple refugia, populationexpansions and secondary contacts within peninsular Italy.Molecular Ecology 16: 4808–4482.
Canestrelli D, Cimmaruta R, Nascetti G. 2008. Populationgenetic structure and diversity of the Apennine endemicstream frog, Rana italica – insights on the Pleistoceneevolutionary history of the Italian peninsular biota. Molecu-lar Ecology 17: 3856–3872.
Canestrelli D, Nascetti G. 2008. Phylogeography of the poolfrog Rana (Pelophylax) lessonae in the Italian peninsulaand Sicily: multiple refugia, glacial expansions and nuclear-mitochondrial discordance. Journal of Biogeography 35:1923–1936.
Carvajal-Rodriguez A, de Una-Alvarez J, Rolan-AlvarezE. 2009. A new multitest correction (SGoF) that increasesits statistical power when increasing the number of tests.BMC Bioinformatics 10: 209.
Cassens I, Mardulyn P, Milinkovitch M. 2005. Evaluatingintraspecific ‘network’ construction methods using simu-lated sequence data: do existing algorithms outperform theglobal maximum parsimony approach? Systematic Biology54: 363–372.
Centeno-Cuadros A, Delibes M, Godoy JA. 2009. Phylo-geography of southern water vole (Arvicola sapidus):evidence for refugia within the Iberian glacial refugium?Molecular Ecology 18: 3652–3667.
Collins W, Blackmon M, Bitz C, Bonan G, Bretherton C,Carton J, Chang P, Doney S, Hack J, Kiehl J, Hend-erson T, Large W, McKenna D, Santer B, Smith R.2004. The community climate system model: CCSM3.Journal of Climate 19: 2122–2143.
Deffontaine V, Libois R, Kotlík P, Sommer R, Nieberd-ing C, Paradis E, Searle JB, Michaux J. 2005. Beyondthe Mediterranean peninsulas: evidence of central Euro-pean glacial refugia for a temperate forest mammal species,the bank vole (Clethrionomys glareolus). Molecular Ecology14: 1727–1739.
Delaney KS, Riley SPD, Fisher RN. 2010. A rapid, strong,and convergent genetic response to urban habitat fragmen-tation in four divergent and widespread vertebrates. PLoSONE 5: e12767.
Dubey S, Ursenbacher S, Fumagalli L. 2006a. Origin oftree frog (Hyla spp.) populations in western Switzerland.Revue Suisse de Zoologie 113: 879–887.
Dubey S, Zaitsev M, Cosson JF, Abdukadier A, Vogel P.2006b. Pliocene and Pleistocene diversification and multiplerefugia in a Eurasian shrew (Crocidura suaveolens group).Molecular Phylogenetics and Evolution 38: 635–647.
Excoffier L, Lischer HEL. 2010. Arlequin suite ver 3.5:a new series of programs to perform population geneticsanalyses under Linux and Windows. Molecular EcologyResources 10: 564–567.
Fielding AH, Bell JF. 1997. A review of methods forthe assessment of prediction errors in conservationpresence/absence models. Environmental Conservation 24:38–49.
Frantz AC, Pope LC, Etherington TR, Wilson GJ, BurkeT. 2010. Using isolation-by-distance-based approaches toassess the barrier effect of linear landscape elements onbadger (Meles meles) dispersal. Molecular Ecology 19: 1663–1674.
Fu Y-X. 1997. Statistical tests of neutrality of mutationsagainst population growth, hitchhiking and backgroundselection. Genetics 147: 915–925.
Fumagalli L, Hausser J, Taberlet P, Gielly L, StewartDT. 1996. Phylogenetic structures of the Holarctic Sorex
PHYLOGEOGRAPHY OF S. ANTINORII 877
© 2012 The Linnean Society of London, Biological Journal of the Linnean Society, 2012, 105, 864–880
araneus group and its relationships with S. samniticus, asinferred from mtDNA sequences. Hereditas 125: 191–199.
Fumagalli L, Taberlet P, Stewart DT, Gielly L, HausserJ, Vogel P. 1999. Molecular phylogeny and evolution ofSorex shrews (Soricidae: Insectivora) inferred from mito-chondrial DNA sequence data. Molecular Phylogenetics andEvolution 11: 222–235.
Giovannotti M, Nisi-Cerioni P, Caputo V. 2010. Mitochon-drial DNA sequence analysis reveals multiple Pleistoceneglacial refugia for Podarcis muralis (Laurenti, 1768) in theItalian Peninsula. Italian Journal of Zoology 77: 277–288.
Gómez A, Lunt D. 2007. Refugia within refugia: patternsof phylogeographic concordance in the Iberian Peninsula.In: Weiss S, Ferrand N, eds. Phylogeography of SouthernEuropean refugia. Dordrecht: Springer, 155–188.
Gompert Z, Forister M, Fordyce J, Nice C. 2008. Wide-spread mito-nuclear discordance with evidence for intro-gressive hybridization and selective sweeps in Lycaeides.Molecular Ecology 17: 5231–5244.
Good JM, Hird S, Reid N, Demboski JR, Steppan SJ,Martin-Nims TR, Sullivan J. 2008. Ancient hybridizationand mitochondrial capture between two species of chip-munks. Molecular Ecology 17: 1313–1327.
Goslee SC, Urban DL. 2007. The ecodist package fordissimilarity-based analysis of ecological data. Journal ofStatistical Software 22: 1–19.
Grill A, Amori G, Aloise G, Lisi I, Tosi G, Wauters LA,Randi E. 2009. Molecular phylogeography of EuropeanSciurus vulgaris: refuge within refugia? Molecular Ecology18: 2687–2699.
Guisan A, Zimmermann NE. 2000. Predictive habitatdistribution models in ecology. Ecological Modelling 135:147–186.
Harpending HC, Batzer MA, Gurven M, Jorde LB,Rogers AR, Sherry ST. 1998. Genetic traces of ancientdemography. Proceedings of the National Academy ofSciences of the United States of America 95: 1961–1967.
Hasumi H, Emori S. 2004. K-1 coupled GCM MIROCdescription, Center for Climate System Research. Tokyo:University of Tokyo.
Hebert PDN, Cywinska A, Ball SL, DeWaard JR. 2003.Biological identifications through DNA barcodes. Proceed-ings of the Royal Society of London Series B, BiologicalSciences 270: 313–321.
Hewitt GM. 1996. Some genetic consequences of ice ages, andtheir role in divergence and speciation. Biological Journal ofthe Linnean Society 58: 247–276.
Hewitt GM. 2000. The genetic legacy of the Quaternary iceages. Nature 405: 907–913.
Hewitt GM. 2001. Speciation, hybrid zones and phylogeog-raphy – or seeing genes in space and time. MolecularEcology 10: 537–551.
Hewitt GM. 2004. Genetic consequences of climatic oscilla-tions in the Quaternary. Philosophical Transactions of theRoyal Society of London Series B, Biological Sciences 359:183–195.
Hijmans RJ, Cameron SE, Parra JL, Jones PG, Jarvis A.2005. Very high resolution interpolated climate surfaces for
global land areas. International Journal of Climatology 25:1965–1978.
Hoffmann R. 1971. Relationships of certain Holartic shrews,genus Sorex. Zeitschrift für Säugetierkunde 36: 193–200.
Holderegger R, Di Giulio M. 2010. The genetic effects ofroads: a review of empirical evidence. Applied Ecology 11:522–531.
Holderegger R, Wagner H. 2008. Landscape genetics.Bioscience 58: 199–207.
Huelsenbeck JP, Ronquist F. 2001. MrBayes: Bayesianinference of phylogenetic trees. Bioinformatics 17: 754–755.
Irwin DM, Kocher TD, Wilson AC. 1991. Evolution ofthe cytochrome b gene of mammals. Journal of MolecularEvolution 32: 128–144.
Keyghobadi N. 2007. The genetic implications of habitatfragmentation for animals. Canadian Journal of Zoology 85:1049–1064.
Kimura M. 1980. A simple method for estimating evolution-ary rate of base substitutions through comparative studiesof nucleotide sequences. Journal of Molecular Evolution 16:111–120.
Knowles LL, Carstens BC. 2007. Delimiting specieswithout monophyletic gene trees. Systematic Biology 56:887–895.
Knowles LL, Carstens BC, Keat ML. 2007. Couplinggenetic and ecological-niche models to examine how pastpopulation distributions contribute to divergence. CurrentBiology 17: 940–946.
Kocher TD, Thomas WK, Meyer A, Edwards SV, PääboS, Villablanca FX, Wilson AC. 1989. Dynamics ofmitochondrial-DNA evolution in animals – amplificationand sequencing with conserved primers. Proceedings of theNational Academy of Sciences of the United States ofAmerica 86: 6196–6200.
Kryštufek B, Bužan EV, Hutchinson WF, Hanfling B.2007. Phylogeography of the rare Balkan endemic Martino’svole, Dinaromys bogdanovi, reveals strong differentiationwithin the western Balkan Peninsula. Molecular Ecology16: 1221–1232.
Lapini L, Filippucci M, Filacorda S. 2001. Genetic andmorphometric comparison between Sorex arunchi Lapiniand Testone, 1998, and other shrews from Italy. ActaTheriologica 46: 337–352.
Lapini L, Testone R. 1998. A new Sorex from north-easternItaly (Mammalia: Insectivora: Soricidae). Gortania – Atti delMuseo Friulano di Storia Naturale 20: 233–252.
Librado P, Rozas J. 2009. DnaSP ver. 5: a softwarefor comprehensive analysis of DNA polymorphism data.Bioinformatics 25: 1451–1452.
Liu C, Berry PM, Dawson TP, Pearson RG. 2005. Select-ing thresholds of occurrence in the prediction of speciesdistributions. Ecography 28: 385–393.
Lugon-Moulin N. 2004. Les musaraignes, biologie, écologie,répartition en Suisse. Ayer, Valais: Editions Porte-Plumes.
Lugon-Moulin N, Brünner H, Balloux F, Hausser J,Goudet J. 1999. Do riverine barriers, history or introgres-sion shape the genetic structuring of a common shrew(Sorex araneus) population? Heredity 83: 155–161.
878 G. YANNIC ET AL.
© 2012 The Linnean Society of London, Biological Journal of the Linnean Society, 2012, 105, 864–880
Lugon-Moulin N, Hausser J. 2002. Phylogeographical struc-ture, postglacial recolonization and barriers to gene flow inthe distinctive Valais chromosome race of the common shrew(Sorex araneus). Molecular Ecology 11: 785–794.
Maiorano L, Falcucci A, Boitani L. 2008. Size dependentresistance of protected areas to land-use change. Proceed-ings of the Royal Society of London Series B, BiologicalSciences 275: 1297–1304.
Manel S, Schwartz MK, Luikart G, Taberlet P. 2003.Landscape genetics: combining landscape ecology and popu-lation genetics. Trends in Ecology & Evolution 18: 189–197.
Mantel N. 1967. The detection of disease clustering and ageneralized regression approach. Cancer Research 27: 209–220.
Marmion M, Hjort J, Thuiller W, Luoto M. 2009. Statis-tical consensus methods for improving predictive geomor-phology maps. Computers & Geosciences 35: 615–625.
McRae BH. 2006. Isolation by resistance. Evolution 60:1551–1561.
McRae BH, Beier P. 2007. Circuit theory predicts geneflow in plant and animal populations. Proceedings ofthe National Academy of Sciences of the United States ofAmerica 104: 19885–19890.
Meylan A, Hausser J. 1973. Les chromosomes des Sorexdu groupe araneus-arcticus (Mammalia, Insectivora).Zeitschrift für Säugetierkunde 38: 143–158.
Michaux JR, Magnanou E, Paradis E, Nieberding C,Libois R. 2003. Mitochondrial phylogeography of the wood-mouse (Apodemus sylvaticus) in the Western Palearcticregion. Molecular Ecology 12: 685–697.
Murphy MA, Dezzani R, Pilliod DS, Storfer A. 2010.Landscape genetics of high mountain frog metapopulations.Molecular Ecology 19: 3634–3649.
Murray JV, Goldizen AW, O’Leary RA, McAlpine CA,Possingham HP, Choy SL. 2009. How useful is expertopinion for predicting the distribution of a species withinand beyond the region of expertise? A case study usingbrush-tailed rock-wallabies Petrogale penicillata. Journal ofApplied Ecology 46: 842–851.
Nogues-Bravo D. 2009. Predicting the past distribution ofspecies climatic niches. Global Ecology and Biogeography18: 521–531.
Nylander JAA, Wilgenbusch JC, Warren DL, SwoffordDL. 2008. AWTY (are we there yet?): a system for graphicalexploration of MCMC convergence in Bayesian phylogenet-ics. Bioinformatics 24: 581–583.
Pellissier L, Bråthen KA, Pottier J, Randin CF, Vittoz P,Dubuis A, Yoccoz NG, Alm T, Zimmermann NE,Guisan A. 2010. Species distribution models reveal appar-ent competitive and facilitative effects of a dominant specieson the distribution of tundra plants. Ecography 33: 1004–1014.
Petit RJ, Aguinagalde I, de Beaulieu J-L, Bittkau C,Brewer S, Cheddadi R, Ennos R, Fineschi S, Grivet D,Lascoux M, Mohanty A, Müller-Starck G, Demesure-Musch B, Palmé A, Martín J, Rendell S, Vendramin G.2003. Glacial refugia: hotspots but not melting pots ofgenetic diversity. Science 300: 1563–1565.
Pidancier N, Jordan S, Luikart G, Taberlet P. 2006.Evolutionary history of the genus Capra (Mammalia, Artio-dactyla): discordance between mitochondrial DNA andY-chromosome phylogenies. Molecular Phylogenetics andEvolution 40: 739–749.
Posada D. 2008. jModelTest: phylogenetic model averaging.Molecular Biology and Evolution 25: 1253–1256.
Posada D, Crandall KA. 2001. Intraspecific phylogenetics:trees grafting into networks. Trends in Ecology & Evolution16: 37–45.
R Development Core Team. 2008. R: a language and envi-ronment for statistical computing. Vienna: R Foundation forStatistical Computing.
Rambaut A. 2009. FigTree, version 1.2.2. Available at:http://tree.bio.ed.ac.uk/software/figtree/
Rambaut A, Drummond A. 2007. Tracer, version 1.4.Available at: http://beast.bio.ed.ac.uk/Tracer
Richards CL, Carstens BC, Knowles LL. 2007. Distribu-tion modelling and statistical phylogeography: an integra-tive framework for generating and testing alternativebiogeographical hypotheses. Journal of Biogeography 34:1833–1845.
Ronquist F, Huelsenbeck JP. 2003. MrBayes 3: Bayesianphylogenetic inference under mixed models. Bioinformatics19: 1572–1574.
Ruedi M, Smith MF, Patton JL. 1997. Phylogenetic evi-dence of mitochondrial DNA introgression among pocketgophers in New Mexico (family Geomyidae). MolecularEcology 6: 453–462.
Ruedi M, Walter S, Fischer MC, Scaravelli D, ExcoffierL, Heckel G. 2008. Italy as a major Ice Age refuge area forthe bat Myotis myotis (Chiroptera: Vespertilionidae) inEurope. Molecular Ecology 17: 1801–1814.
Schmitt T, Habel JC, Zimmermann M, Müller P. 2006.Genetic differentiation of the marbled white butterfly, Mela-nargia galathea, accounts for glacial distribution patternsand postglacial range expansion in southeastern Europe.Molecular Ecology 15: 1889–1901.
Schneider S, Excoffier L. 1999. Estimation of demo-graphic parameters from the distribution of pairwisedifferences when the mutation rates vary among sites:application to human mitochondrial DNA. Genetics 152:1079–1089.
Schönswetter P, Stehlik I, Holderegger R, Tribsch A.2005. Molecular evidence for glacial refugia of mountainplants in the European Alps. Molecular Ecology 14: 3547–3555.
Searle JB, Wójcik JM. 1998. Chromosomal evolution: thecase of Sorex araneus. In: Wójcik J, Wolsan M, eds. Evolu-tion of shrews. Białowieza: Mammal Research Institute:Polish Academy of Sciences, 219–268.
Searle JB, Wójcik JM. 2000. Evolution in the Sorex araneusgroup: cytogenetic and molecular aspects – preface. ActaTheriologica 45: 5–6.
Shafer ABA, Côté SD, Coltman DW. 2011. Hot spots ofgenetic diversity descended from multiple Pleistocenerefugia in an alpine ungulate. Evolution 65: 125–138.
Stoeck M, Dubey S, Klutsch C, Litvinchuk SN, Scheidt
PHYLOGEOGRAPHY OF S. ANTINORII 879
© 2012 The Linnean Society of London, Biological Journal of the Linnean Society, 2012, 105, 864–880
U, Perrin N. 2008. Mitochondrial and nuclear phylogenyof circum-Mediterranean tree frogs from the Hyla arboreagroup. Molecular Phylogenetics and Evolution 49: 1019–1024.
Storfer A, Murphy MA, Evans JS, Goldberg CS, Robin-son S, Spear SF, Dezzani R, Delmelle E, Vierling L,Waits LP. 2007. Putting the ‘landscape’ in landscape genet-ics. Heredity 98: 128–142.
Taberlet P, Fumagalli L, Hausser J. 1994. Chromoso-mal versus mitochondrial-DNA evolution – tracking theevolutionary history of the Southwestern European popula-tions of the Sorex araneus group (Mammalia, Insectivora).Evolution 48: 623–636.
Tajima F. 1989. The effect of change in population size onDNA plymorphism. Genetics 123: 453–464.
Tautz D, Arctander P, Minelli A, Thomas RH, Vogler AP.2003. A plea for DNA taxonomy. Trends in Ecology &Evolution 18: 70–74.
Thompson JD, Gibson TJ, Plewniak F, Jeanmougin F,Higgins DG. 1997. The CLUSTAL_X windows interface:flexible strategies for multiple sequence alignment aided byquality analysis tools. Nucleic Acids Research 25: 4876–4882.
Thuiller W, Lafourcade B, Engler R, Araújo MB. 2009.BIOMOD – a platform for ensemble forecasting of speciesdistributions. Ecography 32: 369–373.
Trombulak S, Frissell C. 2000. Review of ecologicaleffects of roads on terrestrial and aquatic communities.Conservation Biology 14: 18–30.
Ursenbacher S, Carlsson M, Helfer V, Tegelström H,Fumagalli L. 2006. Phylogeography and Pleistocenerefugia of the adder (Vipera berus) as inferred from mito-chondrial DNA sequence data. Molecular Ecology 15: 3425–3437.
Vega R, Amori G, Aloise G, Cellini S, Loy A, Searle JB.2010. Genetic and morphological variation in a Medi-terranean glacial refugium: evidence from Italian pygmyshrews, Sorex minutus (Mammalia: Soricomorpha). Biologi-cal Journal of the Linnean Society 100: 774–787.
Waltari E, Hijmans RJ, Peterson AT, Nyari AS, PerkinsSL, Guralnick RP. 2007. Locating Pleistocene refugia:comparing phylogeographic and ecological niche modelpredictions. PLoS ONE 2: e563.
Wang IJ. 2010. Recognizing the temporal distinctionsbetween landscape genetics and phylogeography. MolecularEcology 19: 2605–2608.
Wisz MS, Guisan A. 2009. Do pseudo-absence selectionstrategies influence species distribution models and theirpredictions? An information-theoretic approach based onsimulated data. BMC Ecology 9: 8.
Wójcik J, Borodin PM, Fedyk S, Fredga K, Hausser J,Mishta A, Orlov VN, Searle JB, Volobouev V, Zima J.2003. The list of the chromosome races of the commonshrew Sorex araneus (updated 2002). Mammalia 67: 169–178.
Woolley S, Posada D, Crandall KA. 2008. A comparison ofphylogenetic network methods using computer simulation.PLoS ONE 3: e1913.
Yannic G, Basset P, Hausser J. 2008a. A new perspectiveon the evolutionary history of Western European Sorexaraneus group revealed by paternal and maternal molecularmarkers. Molecular Phylogenetics and Evolution 47: 237–250.
Yannic G, Basset P, Hausser J. 2008b. Phylogeographyand recolonization of the Swiss Alps by the Valais shrew(Sorex antinorii), inferred with autosomal and sex-specificmarkers. Molecular Ecology 17: 4118–4133.
Yannic G, Dubey S, Hausser J, Basset P. 2010. Additionaldata for nuclear DNA give new insights into the phyloge-netic position of Sorex granarius within the Sorex araneusgroup. Molecular Phylogenetics and Evolution 57: 1062–1071.
Yannic G, Pellissier L, Dubey S, Vega R, Basset P, Maz-zotti S, Pecchioli E, Vernesi C, Hauffe HC, Searle JB,Hausser J. 2012. Data from: Multiple refugia and barriersexplain the phylogeography of the Valais shrew, Sorex anti-norii (Mammalia: Soricomorpha). Dryad Digital Repository.doi:10.5061/dryad.2jj36325
SUPPORTING INFORMATION
Additional Supporting Information may be found in the online version of this article:
Figure S1. Location of samples used for the species distribution modelling analyses.
Please note: Wiley-Blackwell are not responsible for the content or functionality of any supporting materialssupplied by the authors. Any queries (other than missing material) should be directed to the correspondingauthor for the article.
880 G. YANNIC ET AL.
© 2012 The Linnean Society of London, Biological Journal of the Linnean Society, 2012, 105, 864–880
Related Documents


