300 Int. J. Knowledge Engineering and Soft Data Paradigms, Vol. 1, No. 4, 2009 Copyright © 2009 Inderscience Enterprises Ltd. Multiple data structure discovery through global optimisation, meta clustering and consensus methods Ida Bifulco*, Carmine Fedullo, Francesco Napolitano, Giancarlo Raiconi and Roberto Tagliaferri NeuRoNe Lab, DMI, University of Salerno, via Ponte don Melillo, 84084 Fisciano, (SA) Italy E-mail: [email protected] E-mail: [email protected] E-mail: [email protected] E-mail: [email protected] E-mail: [email protected] *Corresponding author Abstract: When dealing with real data, clustering becomes a very complex problem, usually admitting many reasonable solutions. Moreover, even if completely different, such solutions can appear almost equivalent from the point of view of classical quality measures such as the distortion value. This implies that blind optimisation techniques alone are prone to discard qualitatively interesting solutions. In this work we propose a systematic approach to clustering, including the generation of a number of good solutions through global optimisation, the analysis of such solutions through meta clustering and the final construction of a small set of solutions through consensus clustering. Keywords: clustering; global optimisation; meta clustering; consensus methods. Reference to this paper should be made as follows: Bifulco, I., Fedullo, C., Napolitano, F., Raiconi, G. and Tagliaferri, R. (2009) ‘Multiple data structure discovery through global optimisation, meta clustering and consensus methods’, Int. J. Knowledge Engineering and Soft Data Paradigms, Vol. 1, No. 4, pp.300–317. Biographical notes: Ida Bifulco received in 1997 the Laurea degree in Geologic Science from University ‘Federico II’ of Naples, Italy and in 2005 the Laurea degree in Computer Science from the University of Salerno, Italy. In 2006, she was admitted to the PhD program in Computer Science, at the University of Salerno, Italy. Her research activities are focused on global optimisation methodologies and pattern recognition methods for unsupervised learning with particular reference to bioinformatics applications. She is member of SIREN and GNCS. Carmine Fedullo graduated in Computer Science in 2008 at University of Salerno, Italy with the final year dissertation focused on the analysis of different consensus algorithms.

Welcome message from author
This document is posted to help you gain knowledge. Please leave a comment to let me know what you think about it! Share it to your friends and learn new things together.
Transcript
300 Int. J. Knowledge Engineering and Soft Data Paradigms, Vol. 1, No. 4, 2009
Copyright © 2009 Inderscience Enterprises Ltd.
Multiple data structure discovery through global optimisation, meta clustering and consensus methods
Ida Bifulco*, Carmine Fedullo, Francesco Napolitano, Giancarlo Raiconi and Roberto Tagliaferri NeuRoNe Lab, DMI, University of Salerno, via Ponte don Melillo, 84084 Fisciano, (SA) Italy E-mail: [email protected] E-mail: [email protected] E-mail: [email protected] E-mail: [email protected] E-mail: [email protected] *Corresponding author
Abstract: When dealing with real data, clustering becomes a very complex problem, usually admitting many reasonable solutions. Moreover, even if completely different, such solutions can appear almost equivalent from the point of view of classical quality measures such as the distortion value. This implies that blind optimisation techniques alone are prone to discard qualitatively interesting solutions. In this work we propose a systematic approach to clustering, including the generation of a number of good solutions through global optimisation, the analysis of such solutions through meta clustering and the final construction of a small set of solutions through consensus clustering.
Keywords: clustering; global optimisation; meta clustering; consensus methods.
Reference to this paper should be made as follows: Bifulco, I., Fedullo, C., Napolitano, F., Raiconi, G. and Tagliaferri, R. (2009) ‘Multiple data structure discovery through global optimisation, meta clustering and consensus methods’, Int. J. Knowledge Engineering and Soft Data Paradigms, Vol. 1, No. 4, pp.300–317.
Biographical notes: Ida Bifulco received in 1997 the Laurea degree in Geologic Science from University ‘Federico II’ of Naples, Italy and in 2005 the Laurea degree in Computer Science from the University of Salerno, Italy. In 2006, she was admitted to the PhD program in Computer Science, at the University of Salerno, Italy. Her research activities are focused on global optimisation methodologies and pattern recognition methods for unsupervised learning with particular reference to bioinformatics applications. She is member of SIREN and GNCS.
Carmine Fedullo graduated in Computer Science in 2008 at University of Salerno, Italy with the final year dissertation focused on the analysis of different consensus algorithms.
Multiple data structure discovery through global optimisation 301
Francesco Napolitano graduated in Computer Science in 2006 at University of Salerno, Italy. Since 2007, he is a PhD student at the Dept. of Computer Science and Applications (DIA) of the same university. His scientific background is mainly in the area of data mining and data visualisation, with applications to bioinformatics. Particularly, he co-authored a number of papers regarding applications of original clustering techniques to genetic/genomic data. He is a member of SIREN (Neural Network Italian Society) and of the organising committee of Computational Intelligence for Bioinformatics and Biostatistics (CIBB).
Giancarlo Raiconi is Full Professor of Systems Theory at University of Salerno, Italy. His research activities are in the field of systems and control theory, modelling, identification, control and optimisation of systems. He is interested in studying state estimation and parameter identification for distributed parameter systems. His other fields of interests are in tactile sensors and path planning for robotic systems and modelling of behaviours of high TC superconductors. Another research interest concerns optimisation techniques including graph optimisation and global optimisation. More recent interests are in the fields of data mining and data analysis in large database with main applications to astronomy and bioinformatics.
Roberto Tagliaferri is Full Professor at the University of Salerno. His research covers the areas of neural nets, clustering and data visualisation techniques, and their applications to astronomical and geological data, bioinformatics, and medical diagnosis. He has been co-chairman of special sessions at IJCNN and WILF, and co-editor of proceedings of conferences and special issues of international journals in the areas of neural networks, machine learning and bioinformatics. He is member of the BOG of SIREN, a Co-chair of the Bioinformatics SIG of the INNS and a Senior Member of the IEEE.
1 Introduction
Clustering is the process of grouping a set of items in such way that items belonging to the same group are similar and items belonging to different groups are not similar. It is one of the most important unsupervised learning problems and it allows finding underlying structure in a collection of unlabelled data. Clustering techniques have been applied to a wide variety of research problems. For example, in the field of medicine, clustering diseases and cures for diseases gives a key to understand relations between them. In recent years, with the exponential growth in availability of genetic data, clustering proved to be a useful technique in searching for meaning in such huge quantity of information. On the other part, as the amount of analysed data grows, often also both noise intensity and the number of candidate clusters grows: in such a situation the weakness of the most used clustering approaches becomes more evident. Usually, clustering techniques aim at maximising a function indicating the quality of the formed clusters. The well known K-means algorithm, for example, starting from a random initialisation, converges to a local minimum of the distortion function that is used as an indicator of solution quality. As all local iterative techniques, the only properties that can be proved for K-means are that it stops in a finite number of iterations and that any fixed point found by K-means is a stationary (minimum) point for the distortion function. Note that if the number of patterns is not too high and/or if the true structure of data is not

302 I. Bifulco et al.
complex (small number of clusters, well divided) then several runs of the algorithm randomly started are generally sufficient to find the global minimum. If such assumptions are not assured, as it usually happens in real world applications, the only way to attempt to find a good approximation of the global minimum is to resort to an algorithm specifically designed for global optimisation (GO). This approach was employed by several authors using principally genetic algorithms (Di Gesú et al., 2005). The first problem to face when approaching clustering in a systematic way is avoiding solutions corresponding to bad local minima. But even if an algorithm able to always find an approximation of the global optima already existed, other important issues could remain. Two main causes for such issues are noise and ambiguity. Noise is due to experimental conditions and induces perturbations in the data that can force quality measures towards solutions that are not necessarily the best [some discussions about this point can be found in Hu and Hu (2007), Agarwal and Mustafa (2004) and Kaukoranta et al. (1996)]. Ambiguity is an intrinsic property of data that can be inherently clustered in more than one way, with little or no information about which solution is the best. Approaches based on stability, on the other hand, imply the concept of uniqueness of solution. For example, when using k-means the main problem is finding the parameter k assuring the best stability value. But k indicates also the zoom level we choose to analyse data. In some cases, once fixed ,k we can have more than one stable solution. For example, suppose to have a mixture of four well separated Gaussians like those of Figure 1. It is obvious that in this case the best stability is obtained by solutions with four clusters. Let us suppose, instead, that we seek for a more rough grouping of data, for example with only two clusters. In this case there are two obvious different best solutions with respect to the distortion function that are equivalently reasonable. The two solutions cannot be merged together in a good way if we want to maintain 2=k or the complete dataset (Figure 1). In general, in many real cases several minima can explain in a convincing manner the data distribution. In such cases sticking to the global optimum, even if it was possible to find it, would not be the right method. We approach the clustering problem as exploration of possible solutions. As a first step, we generate a number of different clustering solutions by exploiting a clever GO algorithm based on controlled random search (CRS) (Price, 1983) that, as proved in other applications, is much more efficient of a straight genetic one. The solutions found are in turn clustered, that is meta clustering (Caruana et al., 2006). Consensus clustering is applied only to solutions belonging to the same meta-cluster. This is the crucial step that can avoid the problem of trying to merge solutions that are incompatible, like the two shown in Figure 1. Visualisations and interactive tools help us in dealing with the complexity of the process.
Figure 1 Multiple minima example (see online version for colours)
Note: The shown dataset has two equivalent and symmetric 2-clusters solutions.
Multiple data structure discovery through global optimisation 303
2 Exploration of the space of solutions through the Price algorithm
A GO algorithm aims at finding a global minimiser or its close approximation of a function : .⊂ →R Rnf S A point ∗y is said to be a global minimiser of f if
( ) ( ) .∗ ∗= ≤ ∀f f y f y y S∈ CRS is a direct search technique based on a mix of random
and heuristic steps. It is a kind of contraction process where an initial sample of N points is iteratively concentrated by replacing the worst point with a better point. The replacement point is either determined by a global or a local technique. The global technique is an iterative process in which a trial point, the new point, is defined in terms of 1+n points selected from the whole current sample of points until a replacement point is found (Price, 1983). Some CRS algorithms also apply a local technique where the replacement point is searched for a subset of best points in the current sample. The Price algorithm belongs to the class of CRS methods and, in particular, its key point is the set
lS ( l is the iteration counter): at the first iteration ( )0=l this set is constituted by m randomly chosen points (centroid) over a compact set D and then it collects the best points produced in the procedure. At each iteration a new trial point is produced along a direction which is randomly chosen over a finite number of vectors determined by the points belonging to .lS
The rationale behind this approach is that, as the number of iterations increases, the set lS should cluster points around the most promising area and the directions used should become more effective than directions chosen at random on .Rn Modification of the original Price’s algorithm was proposed in Brachetti et al. (1997) and Bresco et al. (2005) (Algorithm 1: the version used in this paper) improving the local search phase without significant increase in computational cost. More precisely, in Brachetti et al. (1997) a global model of the function based on the interpolation by a quadratic form is used to find new good candidate points, but such an approach works if a definite quadratic form can be defined. In Bresco et al. (2005) they use the same scheme but in the case that the algorithm fails to find a positive definite matrix, a global minimisation step base on a genetic algorithm approach is executed. The resulting hybrid algorithm fully retains the appreciable characteristic of both CRS and of genetic algorithm approaches giving a good gain in performance.
Algorithm 1 (genetic Price)
Step 0 Set 0;=l determine the initial set { }1 2, , , ,= Kl l l lmS y y y where the points
( )1, ,= Kliy i m are chosen at random over D; evaluate f at each point .liy
Step 1 Determine the points ,l lmin maxy y and the values ,l l
min maxf f such that
( ) ( )max= =l
l lmax max
y S
f f y f y∈
( ) ( )min= =l
l lmin min
y S
f f y f y∈

304 I. Bifulco et al.
If the stopping criterion is satisfied, then stop.
Step 2 Choose at random 1+n points liry over ;lS determine the weighted centroid
lwcentr of the n points { }1 2
, , ,Kn
l l li i iy y y where
1=
=∑ r
nl l lw r i
r
centr w y
with weight
1
ηη=
=∑
ll rr n l
r r
w
( )1η
φ=
− +r
lr l l l
i minf y f
( )20 0φ
−=
−
l lmax minl
max min
f f
f fω
and ω sufficiently large real number.
Step 3 Determine the trial point %ly given by
( ) ( )( ) ( )
0 0
0 0
α
α
⎧ − − ≤⎪= ⎨+ −⎪⎩
%
l l l l l lw i w w il
l l l l l lw i w w i
centr y centr if f f yy
centr y centr if f f y>
with
( )1=
=∑ j
nl l lw j i
i
f w f y
and
( ) ( )( ) ( )
0
0
0
0
1
1
α
⎧ −⎪ − ≤⎪ − +⎪= ⎨
−⎪−⎪
− +⎪⎩
l li w l l
w il l lmax minl
l lw i l l
w il l lmax min
f y fif f f y
f f
f f yif f f y
f f
ψ
ψ>
If %ly D∉ go to Step 2, otherwise compute ( )%lf y
Step 4 If ( )%l lmaxf y f> them choose a random point y in :D
if ( )ˆl lmaxf y f< then set

Multiple data structure discovery through global optimisation 305
{ } { }1 ˆ+ = −Ul l lmaxS S y y
1= +l l and go to Step 1.
Else set 1+ =l lS S
1= +l l and go to Step 2.
Step 5 If ( )%l l lmin maxf f y f< < then set
{ } { }1+ = %Ul l l lmaxS S y y−
1= +l l and go to Step 1.
Step 6 If ( )%l lminf y f< then set
{ } { }=% %Ul l lmaxS S y y−
and select the subset minS constituted by the 2 1+n points of %S corresponding to the smallest values of .f Determine the diagonal ×n n matrix
( ) ,iQ = diag q the vector c and the scalar d of the quadratic form interpolating
f on %S
( ) 1 ,2
= + + ∀ %T Tf y y Qy c y d y S∈
Step 7 If 0,∃ ≤iq then consider the set:
= −(
%min maxS S y
with %maxy such that
( ) ( )max=%
%maxy S
f y f y∈
Using the 2n points of (S form n random chosen couples of points, for any
couple compute two new vectors by single point crossover with random cutting point. Then define the set S of all new vectors then evaluate f on all points of ˆ.S Set 1+lS as the set of m points of the set ˆUlS S corresponding to the
smallest values of ,f set 1= +l l and go to Step 1.
Step 8 If 0, 1,2, ,∃ > = Kiq i n let
1−= −qy Q c
if lqy D ∉ or ( ) ( )%l l
qf y f y then take
306 I. Bifulco et al.
1+ = %lS S
else take
1+ = −% Ul l lq maxS S y y
set 1= +l l and go to Step 1.
We carried out the cluster optimisation using the following procedure. Let be , 1, ,= Kn
ix i M∈R the data to be clustered, 1 , ,∗ ∗ ∗=K kc c y the unknown k-centroids that represent the global optimiser for J (distortion):
2
,1
arg min=
⎧ ⎫⎪ ⎪= −⎨ ⎬⎪ ⎪⎩ ⎭
∑ ∑j j
i j
k
i jC c
j x C
J x c∈
(1)
We first construct the initial population of N k-centroids chosen at random in the solution space:
, 1, 2, , , 1, 2, ,= =K Kr njc j k r N∈R
then the Price/genetic algorithm (Bresco et al., 2005) is started to minimise the figure of merit J as function of , 1, 2, ,= Kjc j k only, so that at each iteration the function f is
well defined as follows. Given a set of centroids { },= jy c data is grouped according to:
{ }{ }1, , 1, ,∗ = − ≤ − ∀ =K Kj i i j i pC x x c x c p k for j k∈
then the objective function of GO is computed as
( ) ( )1 1, , , , ,∗ ∗= K Kk kf y J c c C C
The Price algorithm is iterated and, at the last step, a new population is available, which is concentrated around the most pronounced minima of J and characterised by a much lower average value of .J Because the GO step has been performed considering only the centroid vectors as independent variables, therefore they do not necessarily correspond to effective local minima and so the k-means algorithm is iterated until convergence to the final population itself. As a consequence, at most we have a population of N local minima for problem (1). Since, as one can easily imagine, not all the so obtained solutions are distinct, then the next step is that of eliminating duplicated solutions, obtaining a population of ′ ≤N N different solutions of the clustering problem. The described algorithm is referred to the k-means approach but it can be extended to any other approach by substituting the appropriated figure of merit.
3 Quality of the exploration of the space of solutions
As pointed out above, the clustering problem for large datasets characterised by a high level of noise is ‘ill posed’ in the sense that, if the structure underlying data is complex

Multiple data structure discovery through global optimisation 307
and depending on how much the data sampling is adapted to capture this structure, the solution of the problem is not unique. In such situation the number of solutions obtained starting from different starting points is surprisingly high. As an example, consider the results obtained for E.coli dataset (Nakai and Kanehisa, 1991); it is a dataset constituted by 336 patterns (genes), any of those characterised by seven attributes (real numbers). We have used:
1 mcg: McGeoch’s method for signal sequence recognition
2 gvh: von Heijne’s method for signal sequence recognition
3 lip: von Heijne’s Signal Peptidase II consensus sequence score
4 chg: presence of charge on N-terminus of predicted lipoproteins
5 aac: score of discriminant analysis of the amino acid content of outer membrane and periplasmic proteins
6 alm1: score of the ALOM membrane spanning region prediction program
7 alm2: score of ALOM program after excluding putative cleavable signal regions from the sequence.
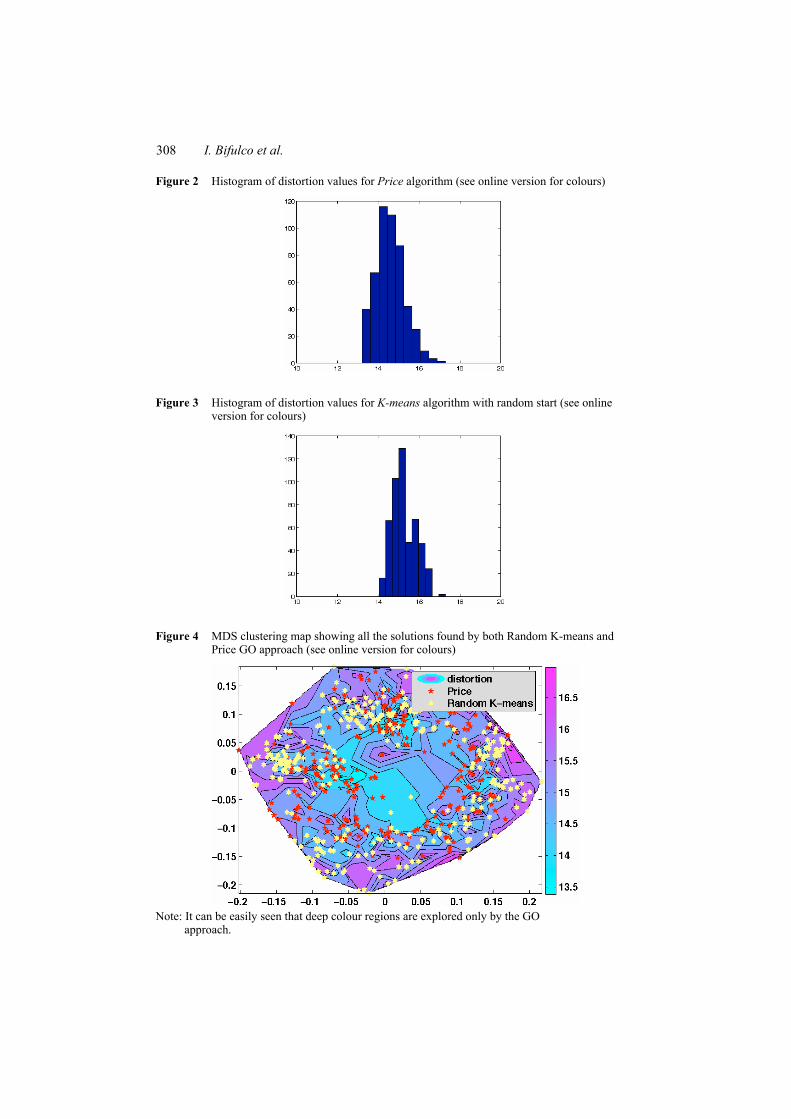
Any record is also characterised by a label identifying one of eight classes (the class is the localisation site) and the dataset has been designed to test classification algorithms. Here we are interested only in unsupervised learning and we shall not consider the labels. By applying the GO with 8=k and 500 random starting points, a final population of 255 distinct clustering is obtained. In Figure 2 the histogram of corresponding distortion values is showed. It is interesting to compare these results with those obtained performing 500 random started runs of the clustering algorithm (Figure 3) and it is clear that GO finds the best local minimum. The effect of the aforementioned ill-posedness is that data itself can be grouped in several different ways giving not too different distortion values (1). In such cases the blind acceptance of the absolute minimum of distortion cannot be the right answer, and a plausibility criterion, based on the judgment of the expert of domain, can be very useful to resolve the indeterminacy. In order to formulate such judgment the expert must be supplied with information about the ‘most attracting’ alternatives in a clearly understandable manner. The use of a CRS approach gives the advantage of furnishing not only an estimate of the absolute minimum but also the ability to locate areas of the search domain where critical points are located, by maintaining a population of candidate points (representing candidate clusterings) that tend to cluster around most ‘interesting’ areas, thus giving a lot of information about the global behaviour of the function (Figure 4). On the other hand, if data points are high dimensional, then it is not easy to elicit the meaning of the terminal population. Our approach consists in introducing a similarity measure between clustering and using such measure to visualise relations between candidate clusterings. This can be obtained either grouping similar clusterings in cluster of clustering or projecting them in a low (2 or 3) dimensional space where interpretation of results is much easier (Caruana et al., 2006).
308 I. Bifulco et al.
Figure 2 Histogram of distortion values for Price algorithm (see online version for colours)
Figure 3 Histogram of distortion values for K-means algorithm with random start (see online version for colours)
Figure 4 MDS clustering map showing all the solutions found by both Random K-means and Price GO approach (see online version for colours)
Note: It can be easily seen that deep colour regions are explored only by the GO
approach.
Multiple data structure discovery through global optimisation 309
4 Similarity measures and similarity plots
Given a number of clustering solutions for a given dataset, a measure to assess the similarity between them must be defined. Well known similarity functions are found in literature, like Minkowski Index, Jaccard Coefficient, correlation and matching coefficients [all found in Ben-Hur et al. (2002)]. In our studies we used a measure based on the entropy of the confusion matrix between clustering solutions (Bishehsari et al., 2007). The measure is defined as follows.
Given two clustering solutions A and ,B where A is made of n clusters and B is made of m clusters, the confusion matrix M between A and B is an ×n m matrix, in which the entry ( ),i j reports the number of objects in the i th cluster of the clustering A falling into the j th cluster of the clustering .B Let iR be the i th row of M and
( )iH R the corresponding entropy, then we can compute the dissimilarity between B and A as the mean entropy of the clusters of B versus .A The a-priori class probability ( ) ,iP C that is the probability of a randomly chosen pattern of belonging to ,iC can be
approximated as (number-of-objects-in- iC )/(total-number-of-objects), giving rise to the formula:
( ) ( ) ( )= ⋅∑ i ii
S M P C H R
We finally define our dissimilarity measure as:
( ) ( ) ( )= + ⋅ TaS M S M a S M
which is symmetric for 1=a and has interesting properties in discovering subclustering relationships when 1≠a , as discussed in Bishehsari et al. (2007).
When L clusterings , 1,2, ,= KlC l L are concerned, the measure ,l tS can be computed for any pair of clusterings lC and tC and assembled in a similarity matrix.
On the basis of such a matrix, several graphical representations can be devised to explore the whole set of solutions. Solutions (clusterings) themselves can be viewed as points to group together in order to find a smaller number of solutions, where each one represents a particular alternative. Moreover, if a solution is found which is reasonable, solutions in its neighbourhood can be easily explored to discover the most suitable.
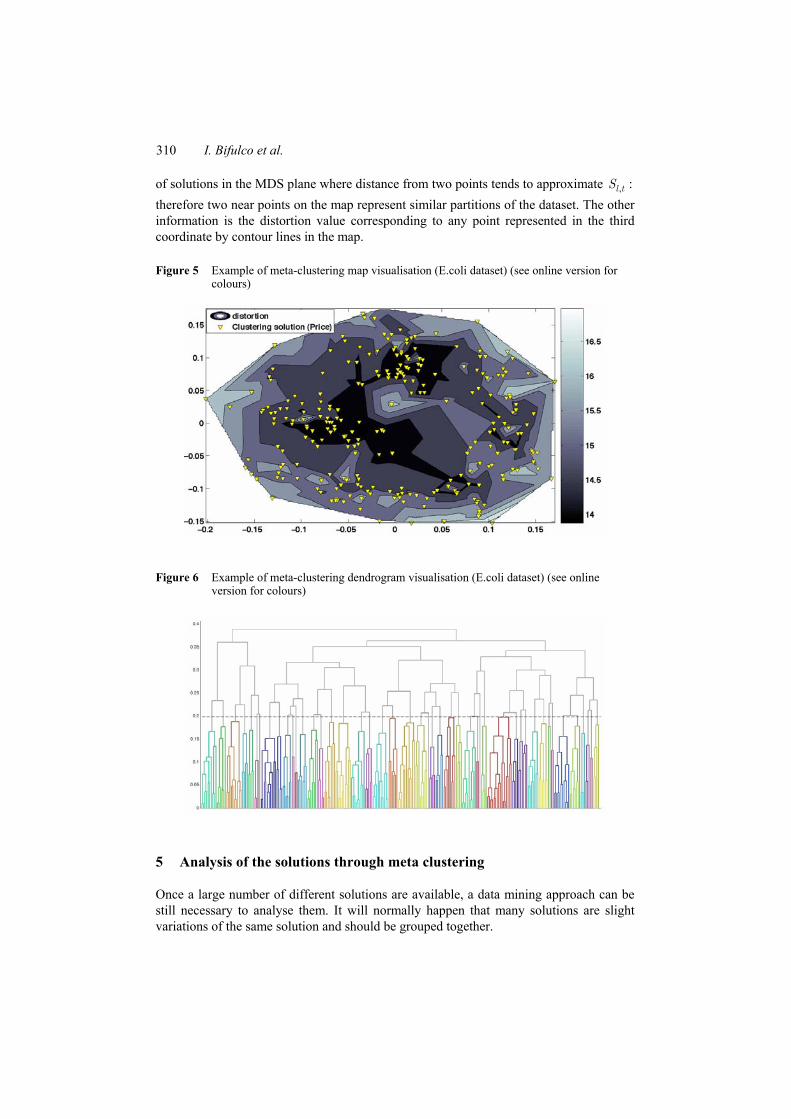
The first graphical representation that can be used is based on the agglomerative hierarchical clustering approach; in Figure 6 the corresponding dendrogram is plotted for the 255 distinct solutions of the E.coli dataset. In the figure a threshold is set (horizontal dotted line) which puts into evidence several groups of clusterings that are similar, identified by the same colour.
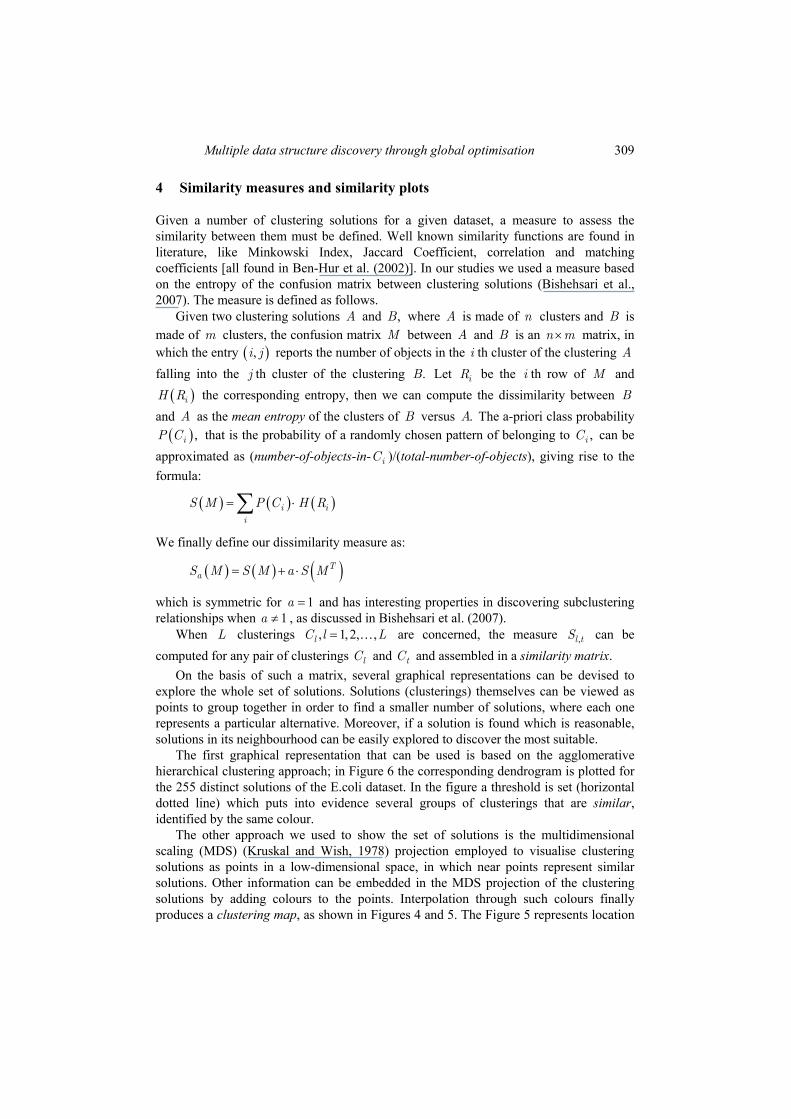
The other approach we used to show the set of solutions is the multidimensional scaling (MDS) (Kruskal and Wish, 1978) projection employed to visualise clustering solutions as points in a low-dimensional space, in which near points represent similar solutions. Other information can be embedded in the MDS projection of the clustering solutions by adding colours to the points. Interpolation through such colours finally produces a clustering map, as shown in Figures 4 and 5. The Figure 5 represents location
310 I. Bifulco et al.
of solutions in the MDS plane where distance from two points tends to approximate , :l tS therefore two near points on the map represent similar partitions of the dataset. The other information is the distortion value corresponding to any point represented in the third coordinate by contour lines in the map.
Figure 5 Example of meta-clustering map visualisation (E.coli dataset) (see online version for colours)
Figure 6 Example of meta-clustering dendrogram visualisation (E.coli dataset) (see online version for colours)
5 Analysis of the solutions through meta clustering
Once a large number of different solutions are available, a data mining approach can be still necessary to analyse them. It will normally happen that many solutions are slight variations of the same solution and should be grouped together.
Multiple data structure discovery through global optimisation 311
Grouping similar clustering solutions together is in turn a clustering problem. This process is called meta clustering (Caruana et al., 2006). Mainly following the approach of Caruana et al. (2006), we divide the meta clustering process into four steps:
1 generate many good different base-level clusterings (in our case local minima of the objective function generated by global optimisation techniques)
2 measure the similarity between each couple of base clusterings
3 exploit the computed similarities to build a dendrogram and an MDS Euclidean embedding of the clustering solutions.
4 use consensus algorithms to obtain a single solution from each meta-cluster.
Quality measures for the aggregations [such as accuracy, compactness etc. (Caruana et al., 2006)] are used to decide the threshold of ‘mergeability’ of the clusterings: a high decrease of quality for an aggregated solution suggests that the base solutions should not be merged.
The use of interactive tools derived from our previous work (Napolitano et al., 2008; Ciaramella et al., 2007) permits to give the user information he needs to make decisions on the best meta clustering solutions.
6 Reduction of the number of solutions through consensus clustering
Consensus clustering, also known in literature as clustering ensembles and clustering aggregation, is the process of extrapolating a single clustering solution from a collection, in such a way to maximise a measure of agreement. This problem is NP complete (Barthlemy and Leclerc, 1995). In Gionis et al. (2007) some methods are introduced for consensus proving a three-approximation algorithm. On the other hand, Bertolacci and Wirth (2007) suggest that the complexity of approximation algorithms can be unjustified, given the comparable performances of heuristic approaches. They also indicate the combined use of unsampling techniques and approximation algorithms as the best compromise. In Nguyen and Caruana (2007) three EM-like methods are illustrated showing comparable performance with other 11 algorithms. EM approach is also exploited in Topchy et al. (2005), but combining weak clusterings. In Topchy et al. (2004) consensus clustering was improved by adaptive weighted subsampling of data. In the following we shall consider two kinds of approach: the consensus method of Gionis et al. (2007) and a novel method that obtains a subpartition of data using the intersection between corresponding clusters belonging to all solutions that are included in a meta cluster.
6.1 Clustering aggregation
The first algorithm we use in this paper is the consensus ‘Balls algorithm’ proposed in Gionis et al. (2007) for the correlation clustering problem. It first computes the matrix of pairwise distances between patterns. Then, it builds a graph whose vertices are the tuples of the dataset and the edges are weighted by the distances. Aim of the algorithm is to find a set of vertices that are close to each other and far from other vertices. Given such a set, it can be considered a cluster and removed from the graph. The algorithm proceeds with
312 I. Bifulco et al.
the rest of the vertices. The algorithm is defined with an input parameter α that guarantees a constant approximation ratio.
6.2 Intersection method
Let be { }1, , ,= K nN iX x x x R∈ a set of N data points and { }1, ,= K mC C C a set of
partitions (clustering) of such data, we want to infer from these a new solution (consensus clustering) in agreement with all the collected information. To achieve this we must first state a model for comparing different partitions. This problem is defined as m-partition clustering in Berman et al. (2007) as follows: let ( ) ( ) ( ), \ \Δ =A B A B B A∪ for two
sets (partitions) A and B and let Σ be a collection of m partitions 1 2, , ,K mC C C of Σ
with each partition { }1 2, , ,= Ki i i ikC C C C containing exactly the same number k of
subsets. Let a valid solution be a sequence of m permutations ( )1 2, , ,σ σ σ σ= K m of
{ }1,2, ,K k that aligns the partitions. For any permutation ρ of { }1,2, , ,K k ( )ρ i is the i th element of ρ for 1 ,i k we want to find σ that minimise:
( ) ( ) ( )( )1 1
,σ σσ Δ= ≤ ≤
=∑ ∑ j r
ki i
rji j r m
f C C<
(2)
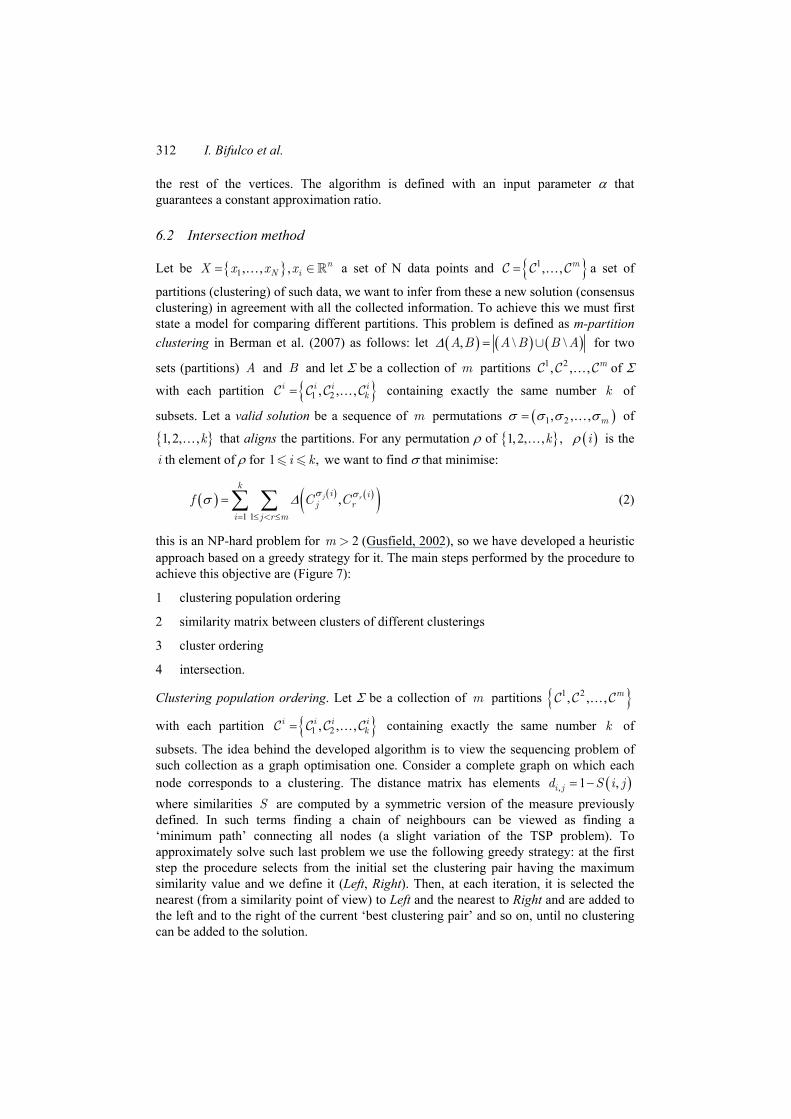
this is an NP-hard problem for 2m > (Gusfield, 2002), so we have developed a heuristic approach based on a greedy strategy for it. The main steps performed by the procedure to achieve this objective are (Figure 7):
1 clustering population ordering
2 similarity matrix between clusters of different clusterings
3 cluster ordering
4 intersection.
Clustering population ordering. Let Σ be a collection of m partitions { }1 2, , ,K mC C C
with each partition { }1 2, , ,= Ki i i ikC C C C containing exactly the same number k of
subsets. The idea behind the developed algorithm is to view the sequencing problem of such collection as a graph optimisation one. Consider a complete graph on which each node corresponds to a clustering. The distance matrix has elements ( ), 1 ,= −i jd S i j where similarities S are computed by a symmetric version of the measure previously defined. In such terms finding a chain of neighbours can be viewed as finding a ‘minimum path’ connecting all nodes (a slight variation of the TSP problem). To approximately solve such last problem we use the following greedy strategy: at the first step the procedure selects from the initial set the clustering pair having the maximum similarity value and we define it (Left, Right). Then, at each iteration, it is selected the nearest (from a similarity point of view) to Left and the nearest to Right and are added to the left and to the right of the current ‘best clustering pair’ and so on, until no clustering can be added to the solution.
Multiple data structure discovery through global optimisation 313
Figure 7 Process flow for the intersection method (see online version for colours)
Compute similarity matrix for cluster. Let be { }1, , ,= K mC C C a sorted clustering set,
and { }1 , ,= Ki i ikC C C for 1, , ,= Ki m the k clusters of i th clustering. A similarity
measure between clusters of a sorted clustering pair can be defined as follow:
( )1
1, , 1, ,+
+= = =I
K
i ij li i
j l ij
C CC C j l k
Csim (3)
which summarises the amount of common data between two clusters of lined up clustering solutions. This is a ‘forward’ measure because it takes into account only the similarity between clusters of successive clustering ( )1, +i iC C for 1, , 1.= −Ki m
Cluster ordering. Let { }1, ,= K mC C C the set of clusterings sorted as described in the
previous subsection, where each { } { }1 , ,= =Ki i ik set of k clustersC C C and sim is a
similarity matrix between clusters defined by (3). We can compute a greedy approximation for the cluster ordering problem as follows (Figure 8):
Step 1 Sort the clusters 1C such that1:
1 1 11 2 K kC C C≥ ≥ ≥
Step 2 Set 1ˆ =1j jC C for 1, ,= Kj k
314 I. Bifulco et al.
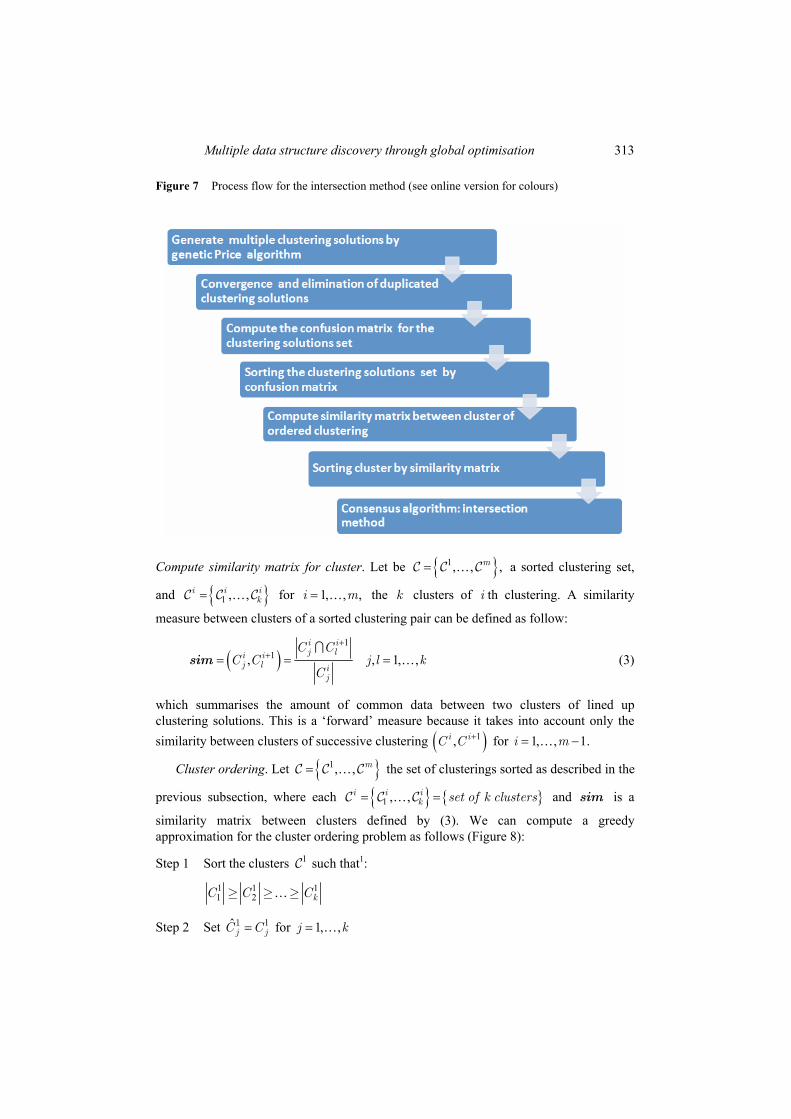
Step 3 For each cluster in the current clustering and for each clustering in the solution set compute:
( ){ }1
1 1 1 1ˆ ˆ ˆarg max ,+
+ + + += ≠is
i i i i ij j s s r
CC C C C C r j<sim
note that the max value in (4) is computed taking into account only clusters not previously chosen.
Step 4 Output the sequence of clusterings { }1ˆ ˆ, , .K mC C
Figure 8 Graphical representation of the cluster ordering process (see online version for colours)
Intersection of solutions. The final step of our procedure attempts to compute a consensus clustering among a set of ordered clusters by (4) as follows:
{ }1 2ˆ ˆ ˆ 1, ,= =% I ILI Kintersect mj j j jC C C C j k (5)
7 Experimental results
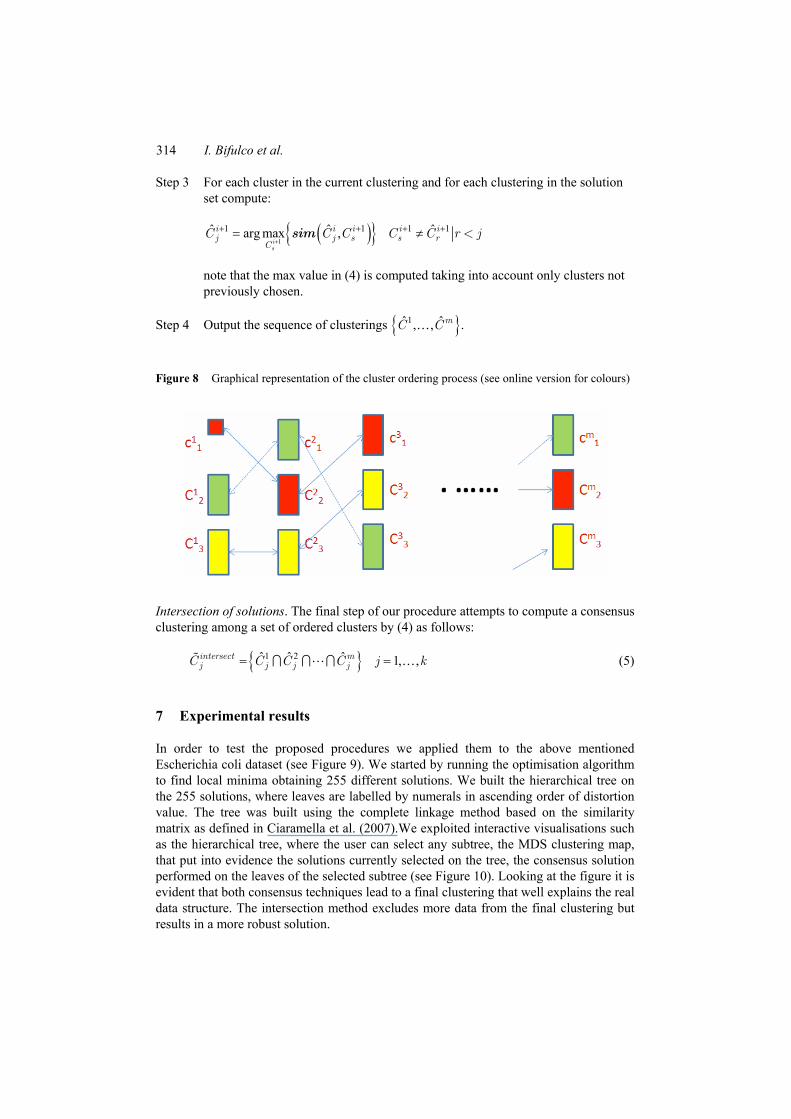
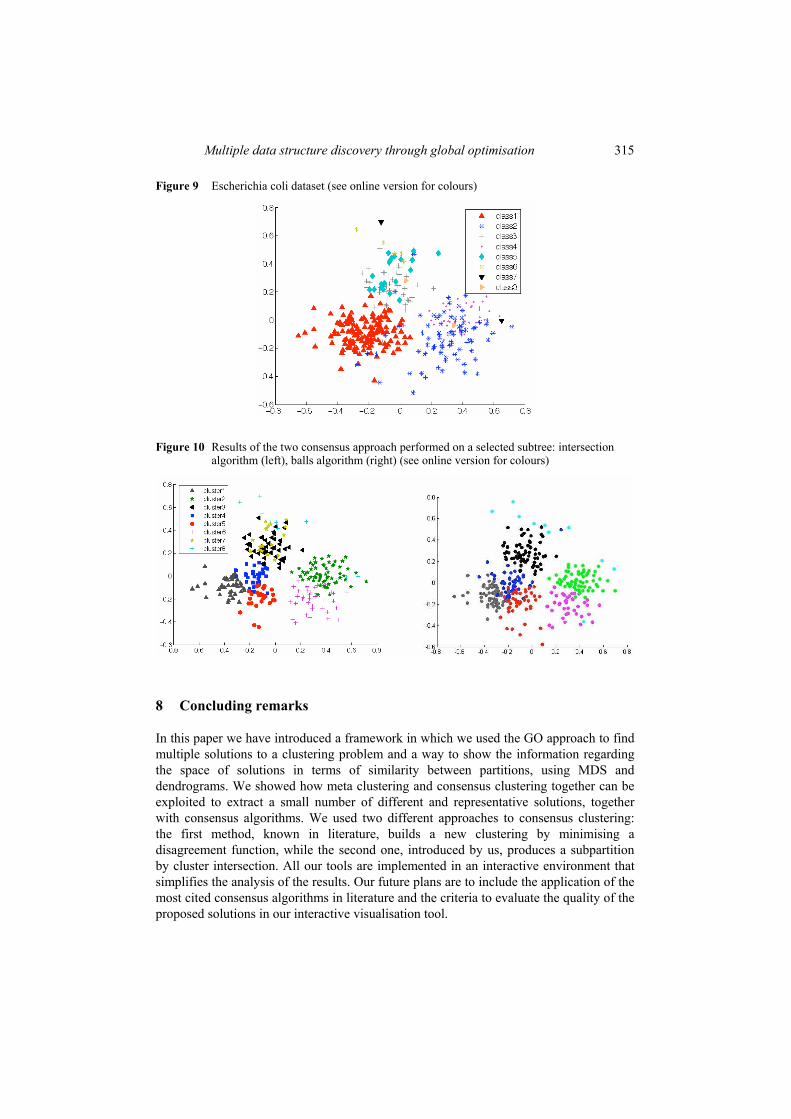
In order to test the proposed procedures we applied them to the above mentioned Escherichia coli dataset (see Figure 9). We started by running the optimisation algorithm to find local minima obtaining 255 different solutions. We built the hierarchical tree on the 255 solutions, where leaves are labelled by numerals in ascending order of distortion value. The tree was built using the complete linkage method based on the similarity matrix as defined in Ciaramella et al. (2007).We exploited interactive visualisations such as the hierarchical tree, where the user can select any subtree, the MDS clustering map, that put into evidence the solutions currently selected on the tree, the consensus solution performed on the leaves of the selected subtree (see Figure 10). Looking at the figure it is evident that both consensus techniques lead to a final clustering that well explains the real data structure. The intersection method excludes more data from the final clustering but results in a more robust solution.
Multiple data structure discovery through global optimisation 315
Figure 9 Escherichia coli dataset (see online version for colours)
Figure 10 Results of the two consensus approach performed on a selected subtree: intersection algorithm (left), balls algorithm (right) (see online version for colours)
8 Concluding remarks
In this paper we have introduced a framework in which we used the GO approach to find multiple solutions to a clustering problem and a way to show the information regarding the space of solutions in terms of similarity between partitions, using MDS and dendrograms. We showed how meta clustering and consensus clustering together can be exploited to extract a small number of different and representative solutions, together with consensus algorithms. We used two different approaches to consensus clustering: the first method, known in literature, builds a new clustering by minimising a disagreement function, while the second one, introduced by us, produces a subpartition by cluster intersection. All our tools are implemented in an interactive environment that simplifies the analysis of the results. Our future plans are to include the application of the most cited consensus algorithms in literature and the criteria to evaluate the quality of the proposed solutions in our interactive visualisation tool.
316 I. Bifulco et al.
References Agarwal, P.K. and Mustafa, N.H. (2004) ‘K-means projective clustering’, Proceedings of the
Twenty-Third ACM SIGMOD-SIGACT-SIGART Symposium on Principles of Database Systems, ACM Press, New York, NY, pp.155–165.
Barthlemy, J.P. and Leclerc, B. (1995) ‘The median procedure for partitions’, in I.J. Cox, P. Hansen and B. Julesz (Eds.): Partitioning Data Sets, American Mathematical Society, Providence, RI, pp.3–34.
Ben-Hur, A., Elisseeff, A. and Guyon, I. (2002) ‘A stability based method for discovering structure in clustered data’, Pacific Symposium on Biocomputing, Vol. 7, pp.6–17.
Berman, P., DasGupta, B., Kao, M. and Wang, J. (2007) ‘On constructing an optimal consensus clustering from multiple clusterings’, Inf. Process. Lett., Vol. 104, No. 4, pp.137–145.
Bertolacci, M. and Wirth, A. (2007) ‘Are approximation algorithms for consensus clustering worthwhile?’, 7th SIAM International Conference on Data Mining.
Bishehsari, F., Mahdavinia, M., Malekzadeh, R., Mariani-Costantini, R., Miele, G., Napolitano, F., Raiconi, G., Tagliaferri, R. and Verginelli, F. (2007) ‘PCA based feature selection applied to the analysis of the international variation in diet’, Lecture Notes in Artificial Intelligence, ISSN: 0302-9743, pp.551–556.
Brachetti, P., De Felice Ciccoli, M., Di Pillo, G. and Lucidi, S. (1997) ‘A new version of the Price’s algorithm for global optimization’, Journal of Global Optimization, Vol. 10, pp.165–184.
Bresco, M., Raiconi, G., Barone, F., De Rosa, R. and Milano, L. (2005) ‘Genetic approach helps to speed classical Price algorithm for global optimization’, Soft Computing Journal, Vol. 9, pp.525–535.
Caruana, R., Nam Nguyen, M.E. and Smith, C. (2006) ‘Meta clustering’, Proceedings of the Sixth International Conference on Data Mining (ICDM’06), pp.107–118.
Ciaramella, A., Cocozza, S., Iorio, F., Miele, G., Napolitano, F., Pinelli, M., Raiconi, G. and Tagliaferri, R. (2007) ‘Interactive data analysis and clustering of genomic data’, Neural Networks, Vol. 21, pp.368–378.
Di Gesú, V., Giancarlo, R., Lo Bosco, G., Raimondi, A. and Scaturro, D. (2005) ‘GenClust: a genetic algorithm for clustering gene expression data’, BMC Bioinformatics, Vol. 6, pp.289–300.
Gionis, A., Mannila, H. and Tsaparas, P. (2007) ‘Clustering aggregation’, ACM Trans. Knowl. Discov. Data., Vol. 1, No. 1, article 4.
Gusfield, D. (2002) ‘Partition-distance: a problem and class of perfect graphs arising in clustering’, Information Processing Letters, Vol. 82, pp.159–164.
Hu, Y. and Hu, Y.P. (2007) ‘Global optimization in clustering using hyperbolic cross points’, Pattern Recognition, Vol. 40, No. 6, pp.1722–1733.
Kaukoranta, T., Franti, P. and Nevalainen, O. (1996) ‘Reallocation of GLA code vectors for evading local minima’, Electronics Letters, Vol. 32, No. 17, pp.1563–1564.
Kruskal, J.B. and Wish, M. (1978) ‘Multidimensional scaling’, Sage University Paper Series on Quantitative Applications in the Social Sciences.
Nakai, K. and Kanehisa, M. (1991) ‘Expert system for predicting protein localization sites in gram-negative bacteria’, PROTEINS: Structure, Function, and Genetics, Vol. 11, pp.95–110.
Napolitano, F., Raiconi, G., Tagliaferri, R., Ciaramella, A., Staiano, A. and Miele, A. (2008) ‘Clustering and visualization approaches for human cell cycle gene expression data analysis’, International Journal of Approximate Reasoning, Vol. 47, No. 1, pp.70–84.
Nguyen, N. and Caruana, R. (2007) ‘Consensus clustering’, ICDM, pp.607–612. Price, W.L. (1983) ‘Global optimization by controlled random search’, Journal of Optimization
Theory and Applications, Vol. 55, pp.333–348.

Multiple data structure discovery through global optimisation 317
Topchy, A., Jain, A.K. and Punch, W. (2005) ‘Clustering ensembles: models of consensus and weak partitions’, IEEE Transactions on Pattern Analysis and Machine Intelligence, ISSN: 0162-8828, Vol. 27, No. 12, pp.1866–1881.
Topchy, A., Minaei-Bidgoli, B., Jain, A.K. and Punch, W.F. (2004) ‘Adaptive clustering ensembles’, Proceedings of the 17th International Conference on Pattern Recognition, Vol. 1, pp.272–275.
Notes
1 C is the number of elements in C.
Related Documents