Multiphase flow of CO 2 and water in reservoir rocks at reservoir conditions Ronny Pini, Sam Krevor, Lin Zuo, Sally Benson Department of Energy Resources Engineering Stanford University

Welcome message from author
This document is posted to help you gain knowledge. Please leave a comment to let me know what you think about it! Share it to your friends and learn new things together.
Transcript
Multiphase flow of CO2 and water in reservoir rocks at reservoir conditions
Ronny Pini, Sam Krevor, Lin Zuo, Sally Benson Department of Energy Resources Engineering
Stanford University

2
Multiphase flow properties
Ronny Pini – [email protected] - Stanford University
Core flooding experiments
sample collection
relative permeability residual trapping
capillary pressure
simulations
X - 16 BALES ET AL.: MULTIPHASE FLOW OF CO2 AND WATER
Berea
Mt. Simon
Water Saturation
Rel
ativ
e pe
rmea
bilit
y
Paaratte
Tuscaloosa1
0.4
Figure 11. Drainage CO2 and water relative permeabil-
ity curves for the four samples. Dashed lines are Brooks-
Corey or Purcell-Burdine relative permeability curves de-
rived from the mercury porosimetry measurements. Solid
lines are best fit Brooks-Corey curves. For the Berea, the
best fit curve and mercury porosimetry curve were nearly
the same and only the best-fit curve is shown.
Rel
ativ
e pe
rmea
bilit
y
Water saturation
CO2
water
0 . 4 0 . 6 0 . 8 1
24 Samuel C.M. Krevor et al.
Berea Paaratte
Mt. Simon Tuscaloosa
00.8
00.8
S CO
2 ,r [-]
SCO2 ,i [-]
Fig. 13 Plots of maximal CO2 saturation vs. the residual CO2 saturation achieved with100% water flooding. Black dots show measurements, solid lines show the best-fit Spiterihysteresis model and dashed lines show the Land hysteresis model using the average Landcoefficient. All parameters are provided in table 5.
carbonate, shale, and anhydrite rocks. SPE Reservoir Evaluation and Engineering,June:487–496, 2008.
3. D. Brant Bennion and Stefan Bachu. Drainage and imbibition co2/brine relative perme-ability curves at reservoir conditions for carbonate formations. In SPE Annual TechnicalConference and Exhibition, number SPE 134028, 2010.
4. McMillan Burton, Navanit Kumar, and Steven L. Bryant. Co2 injectivity into brineaquifers: Why relative permeability matters as much as absolute permeability. EnergyProcedia, 1(1):3091–3098, 2009.
5. P. Chiquet, D. Broseta, and S. Thibeau. Wettability alteration of caprock minerals bycarbon dioxide. Geofluids, 7:112–122, 2007.
6. Y. Cinar, A. Riaz, and H.A. Tchelepi. Experimental study of co2 injection into salineformations. In SPE Annual Technical Conference and Exhibition, number 110628-MS,2007.
CO
2 max
. sat
urat
ion
CO2 initial saturation 0 0 . 2 0 . 4 0 . 6 0 . 8
Land
Spiteri
0 0.2 0.4 0.6 0.8 10
5
10
15
20
25
30
Water saturation
Cap
illary
Pre
ssur
e [k
Pa]
298K
323K
CO2 - water
CO2
!!!

3
Core-flooding experiments • Replicate reservoir conditions
• Ppore : 9 MPa
• Pconf: 11.8 MPa
• T : 50C
• Continuous circulation
• Immiscible displacement
• Experimental variables:
• Flow rates
• Pressure drop
• Saturation (CT scanner) !"#
Perrin, J.C., Benson, S.M.: An Experimental Study on the Influence of Sub-Core Scale
Heterogeneities on CO2 Distribution in Reservoir Rocks. Transport in Porous Media, DOI
10.1007/s11242-009-9426-x, 82:93–109 (2010)
Riaz, A., Hesse, M.A., Tchelepi, H.A., Orr, F. M.: Onset of Convection in a Gravitationally
Unstable Diffusive Boundary Layer in Porous Media. Journal of Fluid Mechanics, 548: 87-
111 (2006)
Riaz, A., Tchelepi, H.A.: Unstable Dynamics of Vertical Displacement in Porous Media
Associated With CO2 Sequestration. SPE 103169 (2006)
Saadatpoor, E., Bryant, S.L., Sepehrnoori, K.: Effect of Heterogeneous Capillary Pressure on
Buoyancy-Driven CO2 Migration. SPE 113984-MS (2008)
Silin, D., Patzek, T. W., Benson, S. M.: A one-dimensional model of vertical gas plume migration
through a heterogeneous porous medium. International Journal of Greenhouse Gas Control
(2008). ISSN 1750-5836, DOI: 10.1016/j.ijggc.2008.09.003
Smith, G.E.: Fluid Flow and Sand Production in Heavy Oil Reservoirs Under Solution Gas Drive.
SPE Production Engineering, 3(2):169-180 (1988)
Tang, G.Q., Firoozabadi, A.: Gas and Liquid-Phase Relative Permeabilities for Cold Production
from Heavy Oil Reservoir. SPE 56540 (2003)
Tang, G.Q., et al.: Heavy-oil Solution Gas Drive in Consolidated and Unconsolidated Rock. SPE
87226 (2006)
Wilt, P.M.: Nucleation Rates and Bubble Stability in Water Carbon Dioyde Solutions. J. Coll. Int.
Sci., 112, 530-538 (1989)
Zhang, Y.Q., Oldenburg, C.M.,Benson, S.M.: Vadose Zone Remediation of Carbon Dioxide
Leakage from Geologic Carbon Dioxide Sequestration Sites. Vadose Zone Journal, 3:858-866
(2004)
Figure Legend
two-phase separator
R
RC
O2
Cyl
ind
er
CO2 water
back pressure pump
core holder confining pressure pump
heater
R
pressure transducer
manual valve
electric valve
relief valve
check valve
two-phase separator
RR
RRC
O2
Cyl
ind
er
CO2 water
back pressure pump
core holder confining pressure pump
heater
RR
pressure transducer
manual valve
electric valve
relief valve
check valve
X-ray CT scanner Core-holder
8
!"#$%&'()*+,-#./,0)1.2)$.23
4+5#%6)$+,%7,*%$" 6.78%$%.7*& '2+**"2+& 9+:5+2)$"2+& ;2%7+,6.:5.*%$%.7
CO2/Water ISCO pumps
Perrin J-C. and Benson S., Trans Porous Media. 2010, 82, 93-109
Ronny Pini – [email protected] - Stanford University

4
Multiphase flow properties
Ronny Pini – [email protected] - Stanford University
Core flooding experiments relative permeability
residual trapping capillary pressure
X - 16 BALES ET AL.: MULTIPHASE FLOW OF CO2 AND WATER
Berea
Mt. Simon
Water Saturation
Rel
ativ
e pe
rmea
bilit
y
Paaratte
Tuscaloosa1
0.4
Figure 11. Drainage CO2 and water relative permeabil-
ity curves for the four samples. Dashed lines are Brooks-
Corey or Purcell-Burdine relative permeability curves de-
rived from the mercury porosimetry measurements. Solid
lines are best fit Brooks-Corey curves. For the Berea, the
best fit curve and mercury porosimetry curve were nearly
the same and only the best-fit curve is shown.
Rel
ativ
e pe
rmea
bilit
y
Water saturation
CO2
water
0 . 4 0 . 6 0 . 8 1
24 Samuel C.M. Krevor et al.
Berea Paaratte
Mt. Simon Tuscaloosa
00.8
00.8
S CO
2 ,r [-]
SCO2 ,i [-]
Fig. 13 Plots of maximal CO2 saturation vs. the residual CO2 saturation achieved with100% water flooding. Black dots show measurements, solid lines show the best-fit Spiterihysteresis model and dashed lines show the Land hysteresis model using the average Landcoefficient. All parameters are provided in table 5.
carbonate, shale, and anhydrite rocks. SPE Reservoir Evaluation and Engineering,June:487–496, 2008.
3. D. Brant Bennion and Stefan Bachu. Drainage and imbibition co2/brine relative perme-ability curves at reservoir conditions for carbonate formations. In SPE Annual TechnicalConference and Exhibition, number SPE 134028, 2010.
4. McMillan Burton, Navanit Kumar, and Steven L. Bryant. Co2 injectivity into brineaquifers: Why relative permeability matters as much as absolute permeability. EnergyProcedia, 1(1):3091–3098, 2009.
5. P. Chiquet, D. Broseta, and S. Thibeau. Wettability alteration of caprock minerals bycarbon dioxide. Geofluids, 7:112–122, 2007.
6. Y. Cinar, A. Riaz, and H.A. Tchelepi. Experimental study of co2 injection into salineformations. In SPE Annual Technical Conference and Exhibition, number 110628-MS,2007.
CO
2 max
. sat
urat
ion
CO2 initial saturation 0 0 . 2 0 . 4 0 . 6 0 . 8
Land
Spiteri
0 0.2 0.4 0.6 0.8 10
5
10
15
20
25
30
Water saturation
Cap
illary
Pre
ssur
e [k
Pa]
298K
323K
CO2 - water
CO2

5
Relative permeability
Ronny Pini – [email protected] - Stanford University
u
P1
P2
BP PCO2
Pw
ui = !kkri (Si )µi
dPidz
CO2 / water injection
z = 0 z = L
steady state
PC
fi
Si = constant ! dPc
dz= 0
ui = !kkri (Si )µi
"PL
Steady state method
rock sample

6
Rock samples
Porosity
0.18 0.24 0.30
Ronny Pini – [email protected] - Stanford University
• Sandstones • Berea: “model” rock
• Others: target CO2 storage reservoirs
X - 2 BALES ET AL.: MULTIPHASE FLOW OF CO2 AND WATER
flow properties of the rocks. In addition, flow experiments
were performed using the steady state relative permeability
method with x-ray CT imaging. With this method, the re-
sults are independent of the assumptions necessary to justify
the use of Buckley-Leverett theory. The absence of common
problems in core-flooding experiments such as capillary end
effects and gravity fluid segregation can also be confirmed
through x-ray imaging. The main goal of this work is to de-
rive important petrophysical flow parameters for a range of
sandstone rock types at reservoir conditions including suffi-
cient observation and analysis to address major uncertain-
ties common in these types of characterizations.
2. Materials2.1. Rocks
Four sandstone rock cores, 5.08cm in diameter, were used
representing a range of reservoir properties and rock types.
Table 1 summarizes various properties of the rocks. Fig-
ure 1 shows the variation in porosity of each rock along the
length of the cores. A Berea was used because of its utility in
making comparisons with other studies. Three other rocks,
one each from the Paaratte formation in Southern Australia,
the Mt. Simon in Illinois, and the Tuscaloosa massive sand
from Alabama are from target reservoirs where large volume
CO2 injection pilot projects are either underway or under
development.
Berea sandstone: A high permeability homogenous
Berea sandstone was obtained from the Berea sandstone core
company. A thin section micrograph is shown in figure 2.
The rock is typical of Berea sandstones; well sorted with sub-
mature granular features and around 10% clay. The rock is
homogeneous with no apparent bedding planes and minimal
porosity variation along the length of the core. The rock was
fired at 700◦C to stabilize swelling clays which are known to
be present in Berea sandstones. Firing was not performed
on the other cores so as to best preserve their original flow
properties.
Paaratte sandstone: A high permeability core from
the Paaratte sandstone formation was obtained from the
CO2CRC’s Otway pilot sequestration project in Southern
Australia [Sharma and Cook , 2007]. The core was taken
from 1400m depth where the reservoir is at 13.8 MPa and
55◦C. A thin section micrograph is shown in figure 3. The
sandstone is well sorted but otherwise texturally subma-
ture. There is no apparent cementing material and little
clay. There are several low-porosity bedding planes perpen-
dicular to the direction of flow (Fig. 1). Outside of these
zones, porosity ranges between .28-.29. The rock is simi-
lar in morphology and component composition to the Berea
sandstone.
Mt. Simon: A low permeability sandstone from the
Mt. Simon sandstone formation was obtained from a well
in Macon County, Illinois. The Mt. Simon underlies one
of the largest concentrations of coal-fied power stations in
the world and is the target formation of actively develop-
ing CO2 storage projects [Leetaru et al., 2009]. The core
was taken from 1650m depth. A thin section micrograph
Table 1. Rock properties and experimental conditions
Name Porosity Absolute Length[-] Permeability [mD] [cm]
Berea 22.1 914 10Paaratte 28.3 1156 9.5Mt. Simon 24.4 7.5 9.6Tuscaloosa 23.6 220 10.8
is shown in figure 4. The rock grains are well sorted and
have mature textural features. The grain-size is generally
smaller than the Berea and Otway cores and grain-coating
and pore-filling clays (fibrous illite) can be seen clearly in
the thin-section and SEM micrographs (Fig. 4). The rock
has sloping changes in the porosity along the core length
which range from .23-.26.
Tuscaloosa: A conglomerate sandstone from the
Tuscaloosa Massive Sand formation was obtained from the
Cranfield CO2 injection site in Alabama [Lu et al., 2011].
The core was taken from 3200m depth. Thin-section and
SEM micrographs are shown in Fig. 5. The rocks grains are
compositionally and texturally immature, with significant
rock fragment components, a wide range in grain sizes, and a
high angularity and low sphericity. There is significant pore-
filling and grain-lining quartz cementation, as can be seen
in both the thin-section and SEM micrographs. Clay com-
ponents are platy and appear to be the serpentine-chlorite
clay that has been identified in Tuscaloosa sands [Ryan and
Reynolds, 1996; Hosseini and Hayatdayoudi , 1986]. There is
significant heterogeneity in the porosity of the core, which is
randomly distributed along its length ranging from .21-.26.
2.2. Fluids
CO2 and tap water (salinity less than 50 mg/kg) were
used for the flow experiments. At 9 MPa and 50◦C, the vis-
cosities of the fluids are taken to be µCO2 = 2.3×10⁻⁵
[Pa
s] and µwater = 5.5×10⁻⁴
[Pa s] [Lemmon et al., 2011]. The
viscosity ratio of CO2:water, M = .042, is midrange for tem-
perature and pressure conditions seen in sedimentary basins
of North America [Nordbotten et al., 2005].
2.3. Core flooding experimental setup
The core flooding apparatus is a modified version of a
setup described in a previous study [Perrin et al., 2009]. A
schematic is shown in figure 6. The rock sample is wrapped
in a sleeve with layering from the core outwards of heat-
shrinkable teflon, nickel foil, another layer of heat-shrinkable
teflon, and a viton rubber sleeve and placed in an aluminum
core holder. Two high accuracy pressure transducers (Oil
filled Digiquartz Intelligent Transmitter, Model 9000-3K-
101) are tapped into the core holder with pressure measured
at the inlet and outlet faces of the core. A displacement
pump (Teledyne Isco, Model 260D) injects water around
the sleeve to create the overburden pressure. Two electric
heaters heat the water inside the confining fluid to maintain
the core at the experimental temperature. Two dual-pump
systems are used to inject water and CO2 in the core sam-
ple (Teledyne Isco, Model 500D). The systems are composed
of two pumps connected with a set of electric valves. The
dual pump configuration provides continuous fluid delivery
by synchronizing the pump and refill strokes so that one
pump is always delivering fluid. The refill and delivery of
each pump is automated through a controller. The bodies of
the CO2 pumps are surrounded by water-regulated temper-
ature jackets and CO2 was kept at a constant temperature
of 50◦C during the experiments so that delivery rates from
the CO2 pumps corresponded to flow rates in the core. Be-
fore entering the core, CO2 and water pass through a heat
exchanger heated to the experimental temperature. The flu-
ids combine in the lines prior to the core holder and then
enter the core. After flowing through the core, the CO2 and
water are separated in a TEMCO AMS-900 high pressure
two-phase separator. The separator includes an electronic
pulser receiver and uses acoustic signals to constantly mon-
itor the volume of fluids in the separator. CO2 from the top
of the separator returns to the CO2 pumps as they refill,
whereas water passes through a pressure regulating pump
(Teledyne Isco, Model 1000D) that is set to deliver or re-
ceive as is necessary to maintain the fluid pressure at the
Berea Paaratte (Australia)
Mt. Simon (Illinois) Tuscaloosa (Alabama) 10 cm

7
Relative permeability - Results
• Flow rate:
• Steady-state: 5 PVI • 100% CO2 injection
alternative technique* à Flat saturation profiles à Core heterogeneity
Mt. Simon
Distance from the inlet [mm]
CO2
satu
ratio
n [-]
Paaratte
Tuscaloosa
Berea
9010 20 30 40 50 60 70 800
.2
.4
.6
.8
9010 20 30 40 50 60 70 80
0
.2
.4
.6
.8
fCO2 =qCO2qt
= 0.1!1
qt =10!15ml/min100% CO2
0.9
0.1
fCO2
100% CO2
0.9
0.1
fCO2
100% CO2
0.9
0.1
fCO2
100% CO2
0.9
0.1
fCO2
CO2 saturation profiles
Berea Paaratte
Mt. Simon Tuscaloosa
Ronny Pini – [email protected] - Stanford University
*Ramakrishnan T.S. and A. Cappiello, Chem. Eng. Sci. 1991, 46(4), 1157-1163

8
• Features are qualitatively predicted from MICP measurements
• Typical behavior of a strongly water-wet gas/water system
• Viscosity ratio controls end-point saturation ( fCO2=1 )
Berea
Mt. Simon
Water Saturation
Rel
ativ
e pe
rmea
bilit
y
Paaratte
Tuscaloosa1
0.4
CO2 / water rel. perm. curves Berea Paaratte
Mt. Simon Tuscaloosa
Relative permeability curves
Rel
ativ
e pe
rmea
bilit
y
Water saturation
Krevor S. et al., Water Resources Research 2011, submitted
prediction from Pc curve
prediction
fit
Ronny Pini – [email protected] - Stanford University
CO2
water
kri (Si ) = !Lµiui"Pk

9
Multiphase flow properties
Ronny Pini – [email protected] - Stanford University
Core flooding experiments relative permeability
residual trapping capillary pressure
X - 16 BALES ET AL.: MULTIPHASE FLOW OF CO2 AND WATER
Berea
Mt. Simon
Water Saturation
Rel
ativ
e pe
rmea
bilit
y
Paaratte
Tuscaloosa1
0.4
Figure 11. Drainage CO2 and water relative permeabil-
ity curves for the four samples. Dashed lines are Brooks-
Corey or Purcell-Burdine relative permeability curves de-
rived from the mercury porosimetry measurements. Solid
lines are best fit Brooks-Corey curves. For the Berea, the
best fit curve and mercury porosimetry curve were nearly
the same and only the best-fit curve is shown.
Rel
ativ
e pe
rmea
bilit
y
Water saturation
CO2
water
0 . 4 0 . 6 0 . 8 1
24 Samuel C.M. Krevor et al.
Berea Paaratte
Mt. Simon Tuscaloosa
00.8
00.8
S CO
2 ,r [-]
SCO2 ,i [-]
Fig. 13 Plots of maximal CO2 saturation vs. the residual CO2 saturation achieved with100% water flooding. Black dots show measurements, solid lines show the best-fit Spiterihysteresis model and dashed lines show the Land hysteresis model using the average Landcoefficient. All parameters are provided in table 5.
carbonate, shale, and anhydrite rocks. SPE Reservoir Evaluation and Engineering,June:487–496, 2008.
3. D. Brant Bennion and Stefan Bachu. Drainage and imbibition co2/brine relative perme-ability curves at reservoir conditions for carbonate formations. In SPE Annual TechnicalConference and Exhibition, number SPE 134028, 2010.
4. McMillan Burton, Navanit Kumar, and Steven L. Bryant. Co2 injectivity into brineaquifers: Why relative permeability matters as much as absolute permeability. EnergyProcedia, 1(1):3091–3098, 2009.
5. P. Chiquet, D. Broseta, and S. Thibeau. Wettability alteration of caprock minerals bycarbon dioxide. Geofluids, 7:112–122, 2007.
6. Y. Cinar, A. Riaz, and H.A. Tchelepi. Experimental study of co2 injection into salineformations. In SPE Annual Technical Conference and Exhibition, number 110628-MS,2007.
CO
2 max
. sat
urat
ion
CO2 initial saturation 0 0 . 2 0 . 4 0 . 6 0 . 8
Land
Spiteri
0 0.2 0.4 0.6 0.8 10
5
10
15
20
25
30
Water saturation
Cap
illary
Pre
ssur
e [k
Pa]
298K
323K
CO2 - water
CO2

10
The method
Ronny Pini – [email protected] - Stanford University
P1
P2
BP
u = ! kµ"PL
u
100% water (single phase)
Capillary pressure measurement during a core-flooding experiment
Darcy’s law:

11
The method
Ronny Pini – [email protected] - Stanford University
u
P1
P2
BP PCO2
Pw
uw = 0 ! dPdz
=dPc
dz ! "P = Pc z=0
100% CO2 (drainage)
Capillary pressure measurement during a core-flooding experiment
z = 0 z = L
Steady state:

12
Experiment - Pressure drop
Ronny Pini – [email protected] - Stanford University
T = 323K 2 4
7 10
15
25 35
50
1
Flow rate [ml/min]
T = 298K
• Berea (280 mD) • Flow rates:
• 1 – 50 ml/min • Injection of 5 PVI
for each step • Average over the
last 1 PVI • Viscosity
• 298 K: 7.1 10-5 Pa s • 323 K: 2.3 10-5 Pa s
2 4
7 10 15
25
35
50
1
Flow rate [ml/min]

13 Ronny Pini – [email protected] - Stanford University
Experiment – CT scan (323 K) Inlet slice (20x) Outlet slice
CO
2 saturation CO2
water
aluminum
4 ml/min
15 ml/min
50 ml/min
2 ml/min
10 ml/min
35 ml/min
1 ml/min
7 ml/min
25 ml/min
4 ml/min
15 ml/min
50 ml/min

14
Inlet slice (20x)
Ronny Pini – [email protected] - Stanford University
Experiment – CT scan (298 K)
4 ml/min
15 ml/min
50 ml/min
2 ml/min
10 ml/min
35 ml/min
1 ml/min
7 ml/min
25 ml/min
Outlet slice
CO2
water
aluminum
4 ml/min
15 ml/min
50 ml/min
CO
2 saturation
15
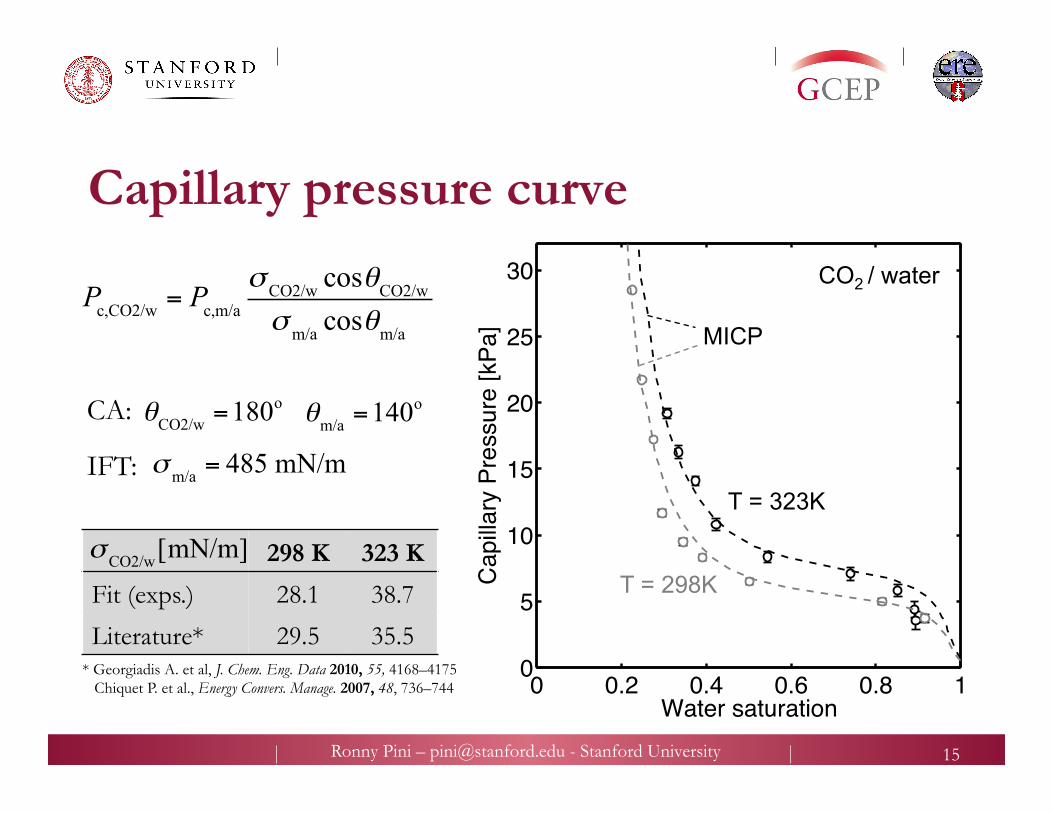
CA: IFT:
Capillary pressure curve
Ronny Pini – [email protected] - Stanford University
0 0.2 0.4 0.6 0.8 10
5
10
15
20
25
30
Water saturation
Cap
illary
Pre
ssur
e [k
Pa]
T = 323K
T = 298K
CO2 / water
MICP Pc,CO2/w = Pc,m/a
! CO2/w cos"CO2/w!m/a cos"m/a
!CO2/w =180o
!m/a = 485 mN/m
298 K 323 K
Fit (exps.) 28.1 38.7
Literature* 29.5 35.5
! CO2/w[mN/m]
* Georgiadis A. et al, J. Chem. Eng. Data 2010, 55, 4168–4175 Chiquet P. et al., Energy Convers. Manage. 2007, 48, 736–744
!m/a =140o

16
Capillary pressure - heterogeneity
Ronny Pini – [email protected] - Stanford University
CO
2 saturation
Porosity
Porosity Saturation*
At the sub-core scale, a saturation distribution can be associated to a given capillary pressure
* 323 K, 10 ml/min

17
CT scan precision - assessment
• Normal distribution
• Random error averaging helps! • Error propagation
Ronny Pini – [email protected] - Stanford University
100 50 0 50 1000
0.05
0.1
0.15
0.2
CT units
Prob
abilit
y
observations normal distribution
µ = -0.35 σ = 25.6
Subtracting two scans
*120 kV, 200 mA, 25 DFOV
c = f (a,b) ! ! c2 =! a
2 !c!a!
"#
$
%&
2
+! b2 'c'b!
"#
$
%&
2
N µ,! 2( )

18
CT scan precision - assessment
Ronny Pini – [email protected] - Stanford University
*120 kV, 200 mA, 25 DFOV
CO2 saturation
Uncertainty σS,1 σS,20
1×1 0.22 0.049
3×3 0.13 0.03
5×5 0.077 0.017
g/rws/r
wsg/rws/r
CTCTCTCT
S−
−=
2
g/rws/r
wsg/rws/r
g/rws/r
pix 12
⎟⎟⎠
⎞⎜⎜⎝
⎛
−
−+
−=
CTCTCTCT
CTCTS
σσ
with CTi/r affected by σpix
≈ 1
5 10 15 200.01
0.1
0.3
1x1
3x3
5x5
S
Repeated scans

19 Ronny Pini – [email protected] - Stanford University
Experiment – CT scan (323 K) Inlet slice (20x) – CO2 saturation
CO
2 saturation 4 ml/min
15 ml/min
50 ml/min
2 ml/min
10 ml/min
35 ml/min
1 ml/min
7 ml/min
25 ml/min

20
Experiment – CT scan (323 K)
Ronny Pini – [email protected] - Stanford University
Inlet slice (20x + 5x5) – CO2 saturation C
O2 saturation
4 ml/min
15 ml/min
50 ml/min
2 ml/min
10 ml/min
35 ml/min
1 ml/min
7 ml/min
25 ml/min

21
0 0.2 0.4 0.6 0.8 10
5
10
15
20
25
Water saturation
Cap
illary
Pre
ssur
e [k
Pa]
Capillary pressure - heterogeneity
Ronny Pini – [email protected] - Stanford University
4 ml/min
10 ml/min
• Coarsening • 5 x 5
• Pixel size: • 2.5 x 2.5 mm
• Uncertainty S • σS = 1.7% (abs.)
Each pixel possesses a unique capillary pressure curve!

22
Concluding remarks • CO2/water relative permeability and capillary pressure curves
have been measured on reservoir rocks at reservoir conditions
• Generally, results are typical for a strongly water-wet system
• Relative permeability: • Low CO2:water viscosity ratio results in low CO2 saturations and
accordingly low relative permeability
• Capillary pressure: • Results are consistent with MICP and expectations from changes in
temperature • The technique allows to assess and quantify the heterogeneity of the
capillary pressure at the sub-core scale
Ronny Pini – [email protected] - Stanford University
Related Documents