Multi-objective Evolutionary Algorithms for Energy-aware Scheduling on Distributed Computing Systems Mateusz Guzek a , Johnatan E. Pecero b , Bernab´ e Dorronsoro c , Pascal Bouvry b a Interdisciplinary Centre for Security Reliability and Trust, University of Luxembourg e-mail: {firstname.lastname}@uni.lu b Faculty of Science, Technology, and Communications, University of Luxembourg e-mail: {firstname.lastname}@uni.lu c Laboratoire d’Informatique Fondamentale de Lille, University of Lille 1, France e-mail: bernabe.dorronsoro [email protected] Abstract The ongoing increase of energy consumption by IT infrastructures forces data center managers to find innovative ways to improve energy efficiency. The latter is also a focal point for different branches of computer science due to its financial, ecological, political, and technical consequences. One of the answers is given by scheduling combined with dynamic voltage scaling technique to optimize the energy consumption. The way of reasoning is based on the link between current semiconductor technologies and energy state management of processors, where sacrificing the performance can save energy. This paper is devoted to investigate and solve the multi-objective precedence constrained application scheduling problem on a distributed computing system, and it has two main aims: the creation of general algorithms to solve the problem and the examination of the problem by means of the thorough analysis of the results returned by the algorithms. The first aim was achieved in two steps: adaptation of state-of-the-art multi- objective evolutionary algorithms by designing new operators and their valida- tion in terms of performance and energy. The second aim was accomplished by performing an extensive number of algorithms executions on a large and diverse benchmark and the further analysis of performance among the proposed algo- rithms. Finally, the study proves the validity of the proposed method, points out the best-compared multi-objective algorithm schema, and the most important factors for the algorithms performance. Keywords: Evolutionary Algorithms, Multi-objective Optimization, Scheduling, Energy Efficiency, Dynamic Voltage Scaling Preprint submitted to Applied Soft Computing September 15, 2014

Welcome message from author
This document is posted to help you gain knowledge. Please leave a comment to let me know what you think about it! Share it to your friends and learn new things together.
Transcript
Multi-objective Evolutionary Algorithms forEnergy-aware Scheduling on Distributed
Computing Systems
Mateusz Guzeka, Johnatan E. Pecerob, Bernabe Dorronsoroc, Pascal Bouvryb
aInterdisciplinary Centre for Security Reliability and Trust, University of Luxembourge-mail: {firstname.lastname}@uni.lu
bFaculty of Science, Technology, and Communications, University of Luxembourg e-mail:{firstname.lastname}@uni.lu
cLaboratoire d’Informatique Fondamentale de Lille, University of Lille 1, France e-mail:bernabe.dorronsoro [email protected]
Abstract
The ongoing increase of energy consumption by IT infrastructures forces datacenter managers to find innovative ways to improve energy efficiency. The latteris also a focal point for different branches of computer science due to its financial,ecological, political, and technical consequences. One of the answers is given byscheduling combined with dynamic voltage scaling technique to optimize theenergy consumption. The way of reasoning is based on the link between currentsemiconductor technologies and energy state management of processors, wheresacrificing the performance can save energy.
This paper is devoted to investigate and solve the multi-objective precedenceconstrained application scheduling problem on a distributed computing system,and it has two main aims: the creation of general algorithms to solve the problemand the examination of the problem by means of the thorough analysis of theresults returned by the algorithms.
The first aim was achieved in two steps: adaptation of state-of-the-art multi-objective evolutionary algorithms by designing new operators and their valida-tion in terms of performance and energy. The second aim was accomplished byperforming an extensive number of algorithms executions on a large and diversebenchmark and the further analysis of performance among the proposed algo-rithms. Finally, the study proves the validity of the proposed method, points outthe best-compared multi-objective algorithm schema, and the most importantfactors for the algorithms performance.
Keywords: Evolutionary Algorithms, Multi-objective Optimization,Scheduling, Energy Efficiency, Dynamic Voltage Scaling
Preprint submitted to Applied Soft Computing September 15, 2014
1. Introduction
The energy efficiency of Information Technologies (IT) is one of the biggestcurrent issues in the field of computing. The global data center power is es-timated as 38.9 GW, and increased by 19% in 2012, and consecutively by 7%in 2013 [1]. The rapid increase of energy consumption of IT infrastructures,caused by growing scale and power of computing systems, resulted in develop-ment of a new discipline of IT – called commonly as GreenIT. Researchers andengineers make advances in every aspect of the domain to ensure increasing en-ergy efficiency, with an important distinction between two categories of energyusage optimization, called static and dynamic power management [2]. The dif-ference between them is that static power management takes place during thedesign time of the IT element on which it is applied. Oppositely, dynamic powermanagement is a technique, which is executed during running of such element.One of the main dynamic management methods to optimize performance incomputing systems is to use the best schedulers.
Classically, the optimal schedule is the one that executes the workload mini-mizing one of the execution time functions, e.g. minimizing total execution time.However, an energy-efficient scheduling algorithm has to minimize consumedenergy. Such algorithms exploit power management technologies available inhardware to achieve this aim. As the biggest influence for power consumptionof a server is its processor [3], this study focuses on minimizing its energy con-sumption. The processors manufacturers offer two main technologies: resourcehibernation and Dynamic Voltage Frequency Scaling (DVFS) [2, 4].
In this work, we focus on DVFS technology that exploits the characteris-tics of power function of electronic circuits. The most common modern circuittechnology, Complementary Metal-Oxide-Semiconductor (CMOS), has a con-vex power function of supplied voltage and frequency. Additionally, frequencyin such circuit is linear function of voltage. Therefore, using low voltage levelsleads to energy savings. This technique may also result in decreased Quality ofService (hereinafter, QoS), as decreasing processing speed may increase total ex-ecution time. However, this technique is much more adaptable to changes thanresource hibernation, as DVFS transition time (30-150µs) is much shorter thanhibernating a resource (few seconds, which decreases system responsiveness andthus QoS) [5]. Such elasticity of DVFS enables its direct incorporation into thescheduling process for each task. The only requirement needed to successfullyand meaningfully apply that technique is that single task execution times aresignificantly bigger than DVFS transition time.
The most common state-of-the-art technique using DVFS is called slackreclamation [6]. It is a post-processing algorithm, which takes an already con-structed schedule and uses tasks’ slack times to reduce performance of processorswhenever it is possible without increasing total completion time. It has beenadopted in many algorithms as it is easy to apply and gives considerable energysavings (see Section 3). The main assumption that leads to the next generationof algorithms using DVFS is that involving it into the scheduling step itself willlead to greater energy savings. This work follows this direction, as used methods
2
allow to apply DVFS at each step of a schedule creation.The problem of precedence constrained task scheduling is NP-hard in the
simplified case of equal length tasks, homogeneous processors, and no com-munication costs [7]. This work tackles a generalization of the problem, withprecedence constraints, heterogeneous processors using DVFS technology, com-munication costs, and another objective – the energy consumption.
The contributions of this paper are threefold. (1) We propose three schedul-ing algorithms to solve the heterogeneous multiprocessor multi-objective schedul-ing problem. They based on state-of-the-art multi-objective (MO) algorithmsschemas, with new grouping crossover and mutation operators. (2) We do athorough empirical study of the problem, evaluating the performance of dif-ferent operators in the algorithms and the influence of instance parameters onthe solutions obtained. Finally, (3) we identify the most important factors ofthe problem, as well as the best performing algorithm for the problem, withstatistical confidence.
The remainder of the paper is structured as follows: in Section 2 the tackledproblem is described. The state of the art on energy-aware scheduling is pre-sented in Section 3. Section 4 describes the proposed solution for the problemand Section 5 analyses the results of simulations over the large set of instances.Section 6 includes conclusion and presents future research directions.
2. Problem Description
The addressed scheduling problem deals with the optimal allocation of a setof tasks that compose a parallel application to the set of processing elements ina distributed system. The target is minimizing both the total execution timeand energy consumed by the execution of the application.
2.1. System
The distributed computing system consists of a set R of m heterogeneousprocessors. For each processor rl, a set of DVFS pairs Dl is defined. A DVFSpair k, denoted as dk, is a tuple (vk, sk), where vk ∈ R+ is the operationalvoltage of the processor and sk ∈ R+ is the ratio of the operational speed tothe maximal processor’s speed, further called as relative speed.
We consider a parallel application represented by a Directed Acyclic Graph(DAG) G = (T,E, pil, cij), where T denotes the set of t tasks, and the set Eof directed edges indicates the precedence relation between tasks. Each nodeni ∈ T is associated with one non-divisible task ti of the parallel application.The processing time or weight pil ∈ R+ of task ti denotes its computation timeon processor rl ∈ R. For each edge eij ∈ E there is a cost cij ∈ R+ to communi-cate data between tasks ti and tj . The partial order ti ≺ tj models precedenceconstraints, i.e. if there is an edge eij ∈ E. In this case, ti is said to be animmediate predecessor of tj , and Γ+(tj) denotes the set of immediate prede-cessors of tj . Also, tj is said to be an immediate successor of ti, and Γ−(ti)
3
represents the set of immediate successors of task ti. A task ti without prede-cessors, Γ+(ti) = ∅, is called an entry task. If it does not have any successors,when Γ−(ti) = ∅, it is a sink task.
A scheduling is defined as a tuple of functions (σ, π, λ, γ), such that σ : T 7→R+, π : T 7→ R, λ : T 7→ Dl, and γ : R × X 7→ D, where σ(ti) representsthe time at which task ti starts its execution, π(ti) provides the processor rl onwhich ti is executed, λ(ti) supplies the relative speed sli to run ti, and γ(rl, x)provides the DVFS pair dk used by the processor l at time x. The real executiontime of a task i scheduled on a processor l with a DVFS pair k is defined as:pilk = pil/sk.
2.2. Constraints
A schedule is feasible if the following conditions are fulfilled for all tasks in G.
1. The Processor Constraint. For any pair of tasks ti, tj ∈ T , one processormay not execute more than one task at a time. That is, if π(ti) = π(tj) =rl, then σ(ti) + pilλ(i) ≤ σ(tj) or σ(tj) + pjlλ(j) ≤ σ(ti).
2. The Precedence Constraint. ∀ (eij ∈ E), the task tj cannot be executedbefore task ti has finished its execution: σ(tj) ≥ σ(ti) + pilλ(i) if π(ti) =π(tj). Otherwise, if π(ti) = rk and π(tj) = rl and rk 6= rl, σ(tj) =maxti∈Γ+(tj)σ(ti) + pikλ(i) + cij , the time when all communications fromtj ’s predecessors have arrived at rl.
3. The DVFS Constraint. For any time, a processor rl has allocated exactlyone DVFS pair, i.e. ∀ (x ∈ X) ∀ (rl ∈ R) ∃! (dk ∈ Dl) such thatγ(rl, x) = dk, where X represents the time when the system is used.
2.3. Objectives
The completion time of each task ti ∈ T is defined by Ctj ≡ σ(tj) + pjlλ(tj).The makespan of the schedule is defined as: Cmax ≡ maxtj∈T Ctj and is themaximum completion time of a task of G. The first objective of the optimizationis to find a schedule for G on the processors R with the minimum makespan:minCmax.
The second objective is related to the energy consumed by the system. It isbased on the equation of dynamic power consumed by the CMOS circuit (theprevalent technology used in modern integrated circuits) [6]:
P = ACefV2f = αV 2f, (1)
where A is the number of switches per clock cycle, Cef is the total capacitanceload, V is the supplied voltage, and f is the corresponding frequency. Relativespeed rsj is proportional to frequency f , so we use directly rsj as reported byprocessor manufacturers instead of f . As A and Cef are constant for a machine,we simplify them to single coefficient α. The value of α is always set to 1 tonormalize the voltage-frequency tables. Finally the consumed energy is definedas:
4
Et =
m∑j=0
∫ Cmax
0
Pl(x)dx =
m∑l=0
∫ Cmax
0
vl(x)sl(x)2dx, (2)
where x is time, Pl(x) is the power of machine rl over time, vl(x) is the voltageof machine rl over time, and sl(x) is the relative speed of the machine rl overtime. The second objective is to minimize the consumed energy: minEt.
The problem of scheduling DAGs with minimum makespan and energy is atrade-off between schedule length and energy consumption. The reduction inenergy consumption in DVFS-enabled processors is made by decreasing supplyvoltage and frequency, resulting in a slower tasks execution and an increase inthe schedule length. As energy is a convex function of relative speed, running atask using lower frequency results in lower total energy consumption.
3. Energy-aware Scheduling: Related Work
An important number of scheduling algorithms have been proposed for en-ergy consciousness. These algorithms differ on the assumptions they consider [4].However, the most common technique to save energy they exploit is DVFS withslack sharing or slack reclamation.
Zhu et al. present in [8] slack reclamation-based scheduling algorithms. Thealgorithms adopt a global scheduling in which all tasks wait in a global queueand are dispatched based on their priorities. Zhang et al. [9] report a schedulingalgorithm based on a two-phases process. The first phase aims to optimize thepossibilities for selecting different voltages based on the priority of tasks. Then,the voltage scaling problem is modeled as an integer programming problem inthe second phase. The authors considered continuous supply voltage selectionand showed that the integer programming problem is solvable in polynomialtime. To solve the discrete version of the problem, the authors proposed anapproximation algorithm.
Aupy et al. [10] study the problem of scheduling precedence-constrainedapplications aiming to minimize energy consumption while considering a givenbound on the makespan and a reliability threshold. The target architecture isa set of homogeneous processors. The authors propose several polynomial timescheduling algorithms under the continuos speed model.
Wang et al. exploit the idea of extending the execution time of non-criticaljobs by lowering the speed of processors without extending the makespan’s ap-plication [11]. Two scheduling algorithms are proposed. The first algorithmexploits the best-effort idea: it first optimizes makespan under maximum volt-age and speed assumption using a list scheduling algorithm and then energy isoptimized in a second step with a voltage scaling algorithm, by lowering the pro-cessor’s voltage for extending the execution time of non-critical jobs, or when itis in idle time. The second algorithm is a clustering-based scheduling algorithmthat gather tasks into clusters according to the edge zeroing policy. It is guidedwith aim of reducing power consumption.
5
Baskiyar and Palli [12] use the Heterogeneous Earliest Finish Time (HEFT)heuristic as a best-effort scheduling algorithm, then it performs voltage scalingwithout performance degradation. The authors considered continuous voltage.In [13] the authors combined the Decisive Path Scheduling (DPS) list schedulingalgorithm and dynamic voltage scaling with dynamic power technique.
Rizvandi et al. report in [14] a heuristic called Multiple Frequency Selec-tion DVFS. The algorithm exploits the idea of executing tasks using a linearcombination of processors’ frequencies so that the utilization of all slack timesis optimized. For each task its energy consumption is formulated as a con-strained optimization problem. Then, the authors show that a combination oftwo frequencies lead to minimum energy consumption.
Some recent approaches incorporate DVFS during the scheduling process.Shekar and Izadi develop in [15] an algorithm that schedules tasks to proces-sors with low-power capability. The authors proposed a weighted cost functionthat considers the energy consumptions while taking scheduling decisions. Leeand Zomaya [6] report a set of Dynamic Voltage Scaling (DVS)-based heuris-tics to optimize a summation of two objectives: schedule length and energyconsumption. After the heuristic computes the schedule of the application thearrangement is improved by using a local search algorithm. The local searchonly applies changes if it does not increase the schedule length and energy isminimized.
Some researchers address the energy issue in a Pareto based approach. Mez-maz et al. proposed in [16] a parallel bi-objective hybrid genetic algorithm thatis improved with the heuristics reported in [6]. The parallelization is based onthe cooperative approach of the island and multi-start parallel models using thefarmer-worker paradigm. The goal of the multi-start parallel model is to reducethe running time of a resolution. Pecero et al. developed in [17] a bi-objectiveGreedy Randomized Adaptive Search Procedure (GRASP). The GRASP algo-rithm starts by generating a feasible solution using a greedy evaluation functionat maximum voltage. Then, the solution is improved by a post-processing bi-objective local search. The bi-objective local search exploits the DVS technique.
4. Algorithms Description
This section presents the algorithms used to solve the considered problemin this study. They are three state-of-the-art algorithms with different featuresthat have been specialized for the problem at hands with a novel representationand operators. The source code of the implementation is published as an opensource greenMetal project and available online1.
4.1. MOEAs schemas
The chosen three state-of-the-art techniques to find accurate solutions tothe investigated problem are: NSGA-II [18], MOCell [19], and IBEA [20].
1http://greenmetal.gforge.uni.lu/download.html
6
Pseudocode of MOCell
1: //Algorithm parameters in ‘mocell’2: InitializeParetoFront(mocell.ParetoFr)3: while ! StopCondition() do4: for ind ← 1 to mocell.popSize do5: n list←GetNeighb(mocell, ind);6: parents←Selection(n list);7: offspr←Recomb(parents);8: offspr←Mutation(offspr);9: Evaluation(offspr);
10: Insert(offspr,aux pop[ind]);11: InsertParetoFront(ind);12: end for13: mocell.pop←aux pop;14: mocell.pop←Feedback(mocell,ParetoFr);15: end while
Pseudocode of NSGA-II
1: //Algorithm parameters in ‘nsga’2: InitializePopulation(nsga.pop);3: Evaluation(nsga.pop);4: while ! StopCondition() do5: for index ← 1 to nsga.popSize/2 do6: parents←Selection(nsga.pop);7: offspr←Crossover(parents);8: offspr←Mutate(offspr);9: offspringPop←Add(offspr);
10: end for11: Evaluation(offspringPop);12: union←Merge(nsga.pop, offspringPop);13: fronts←SortFronts(union);14: (Pop’, lastFront)←GetBestFronts(fronts);15: if size(nextPop) < nsga.popsize then16: Pop’←BestAccToCrowding(lastFront,
nsga.popsize-size(Pop’));17: end if18: end while
Pseudocode of IBEA (Adaptive Version)
1: //Algorithm parameters in ‘ibea’2: InitializePopulation(ibea.pop);3: EvaluationUsingHypervolume(ibea.pop);4: while ! StopCondition() do5: union←Merge(ibea.paretoFr,offsprPop);6: EvaluationUsingHypervolume(union);7: RemoveWorstIndivs(ibea.paretoFr);8: while offsprPop ≤ ibea.popSize do9: parents←Selection(ibea.paretoFr);
10: offspr←Crossover(parents);11: offspr←Mutate(offspr);12: EvaluationUsingHypervolume(offspr);13: offsprPop←Add(offspr);14: end while15: end while
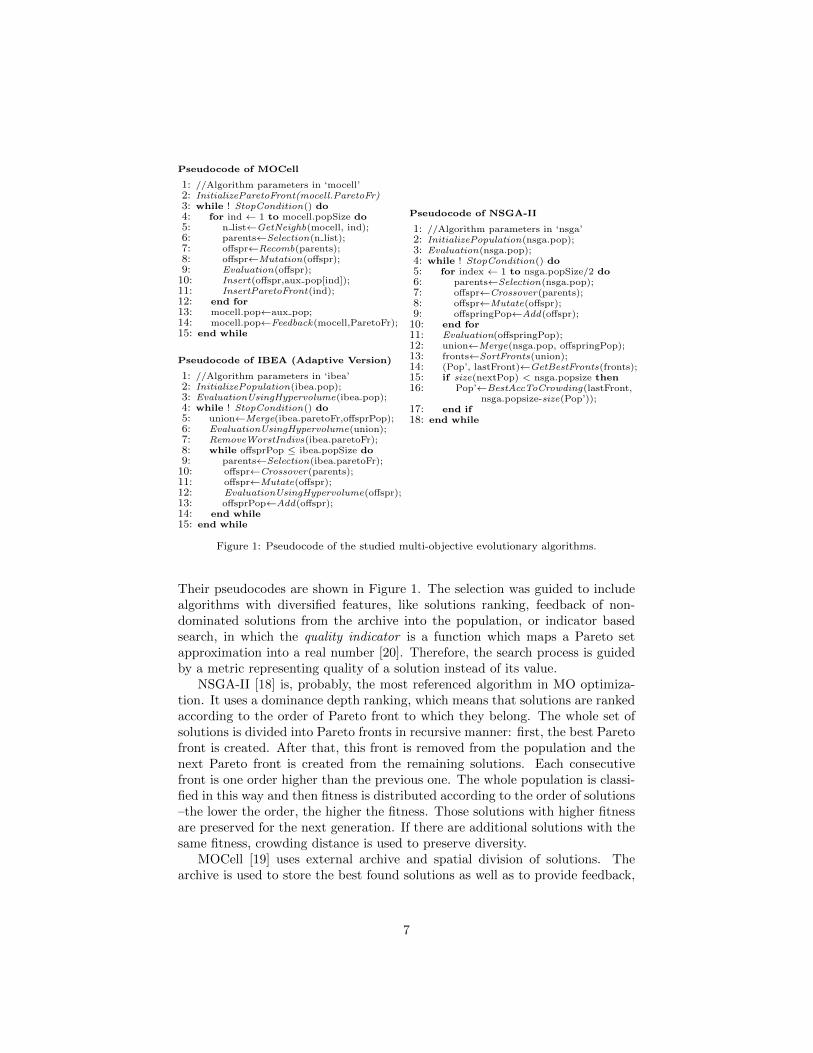
Figure 1: Pseudocode of the studied multi-objective evolutionary algorithms.
Their pseudocodes are shown in Figure 1. The selection was guided to includealgorithms with diversified features, like solutions ranking, feedback of non-dominated solutions from the archive into the population, or indicator basedsearch, in which the quality indicator is a function which maps a Pareto setapproximation into a real number [20]. Therefore, the search process is guidedby a metric representing quality of a solution instead of its value.
NSGA-II [18] is, probably, the most referenced algorithm in MO optimiza-tion. It uses a dominance depth ranking, which means that solutions are rankedaccording to the order of Pareto front to which they belong. The whole set ofsolutions is divided into Pareto fronts in recursive manner: first, the best Paretofront is created. After that, this front is removed from the population and thenext Pareto front is created from the remaining solutions. Each consecutivefront is one order higher than the previous one. The whole population is classi-fied in this way and then fitness is distributed according to the order of solutions–the lower the order, the higher the fitness. Those solutions with higher fitnessare preserved for the next generation. If there are additional solutions with thesame fitness, crowding distance is used to preserve diversity.
MOCell [19] uses external archive and spatial division of solutions. Thearchive is used to store the best found solutions as well as to provide feedback,
7
i.e., to randomly replace solutions from the main population with solutions fromthe archive. The spatial division is done as in the canonical cellular GA [21]:each individual has its own place in a toroidal mesh and only the solutionsfrom the certain neighborhood have chance to compete during the selectionprocedure. MOCell uses typical C9 neighborhood (including solution and its8 closest neighbors). The spatial distribution of population provides more ex-ploration possibilities by creating distinct areas, where different good solutionsmay emerge and by slowing down the convergence. When the archive is full,the crowding distance is used to remove the solutions from the most crowdedregions.
IBEA [20] implements hypervolume, a quality indicator, to assign fitnessto solutions. Each solution is compared with all others in the population byhypervolume and its final fitness is set according to its aggregated performanceagainst the others. Then, during the environmental selection phase, the worstsolutions are removed until population reaches its allowed size.
Despite all mentioned differences, all three algorithms share large part oftheir characteristics. They all use binary tournament selection as mating se-lection mechanism, which creates new individuals for the population. In theimplementations in this work, they share the representation (presented in Sec-tion 4.2), the grouping recombination operator, and the bit-flip mutation (bothdescribed in Section 4.3). The probability for crossover and mutation has thesame influence for all of them. Finally, they use the same concepts of individual,population, generation, and evaluation.
The selected algorithms ensure that different state-of-the-art approacheswere used to explore the problem, to avoid possible biased or unexpected be-havior of one of the algorithms. Using the same parameters and operators ofthe algorithms ensures a fair comparison and is intended to neglect the impactof auxiliary factors. Additionally, the algorithms schemas were implementedusing the jMetal [22] framework which was extended by a new GreenMetal setof libraries, which implements the studied MOP as well as the representationand operators described in further sections.
4.2. Representation
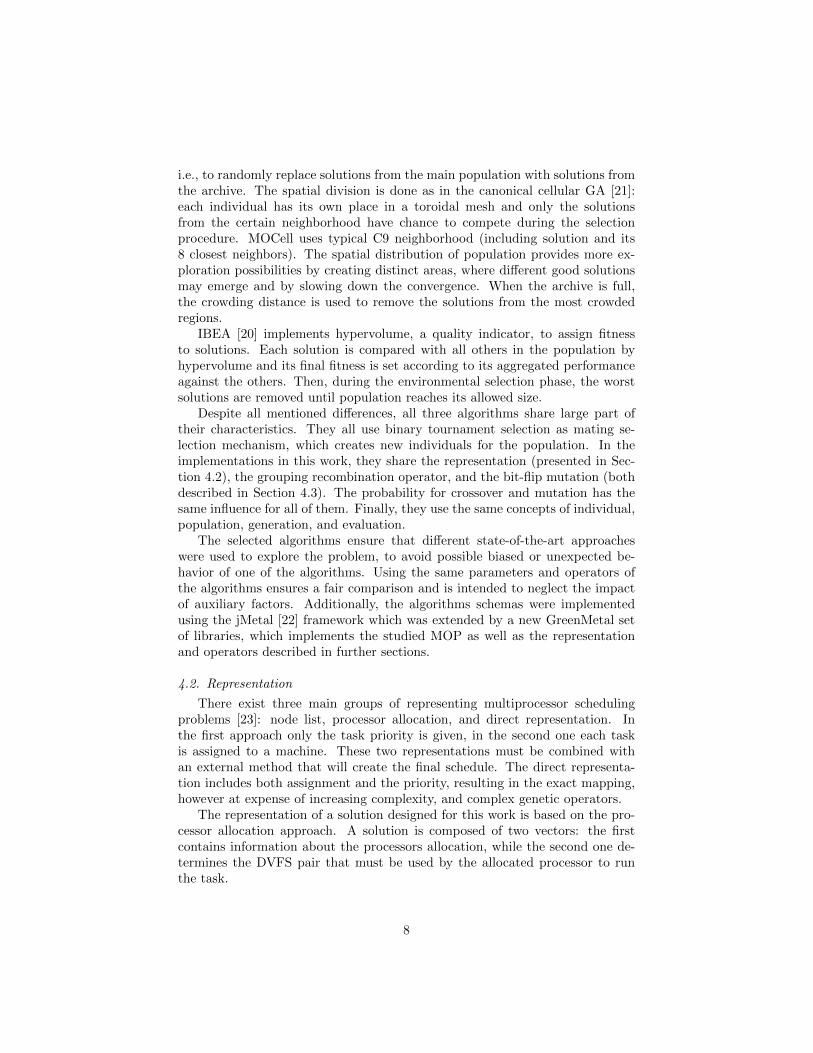
There exist three main groups of representing multiprocessor schedulingproblems [23]: node list, processor allocation, and direct representation. Inthe first approach only the task priority is given, in the second one each taskis assigned to a machine. These two representations must be combined withan external method that will create the final schedule. The direct representa-tion includes both assignment and the priority, resulting in the exact mapping,however at expense of increasing complexity, and complex genetic operators.
The representation of a solution designed for this work is based on the pro-cessor allocation approach. A solution is composed of two vectors: the firstcontains information about the processors allocation, while the second one de-termines the DVFS pair that must be used by the allocated processor to runthe task.
8
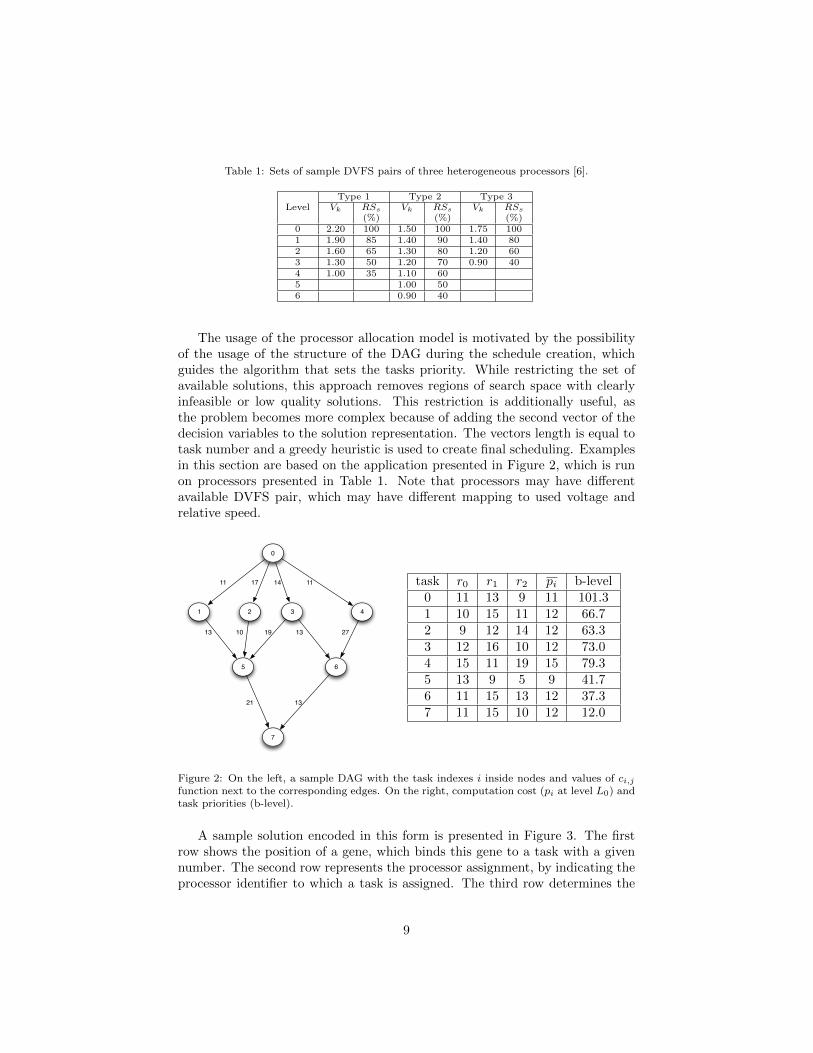
Table 1: Sets of sample DVFS pairs of three heterogeneous processors [6].
Type 1 Type 2 Type 3Level Vk RSs Vk RSs Vk RSs
(%) (%) (%)0 2.20 100 1.50 100 1.75 1001 1.90 85 1.40 90 1.40 802 1.60 65 1.30 80 1.20 603 1.30 50 1.20 70 0.90 404 1.00 35 1.10 605 1.00 506 0.90 40
The usage of the processor allocation model is motivated by the possibilityof the usage of the structure of the DAG during the schedule creation, whichguides the algorithm that sets the tasks priority. While restricting the set ofavailable solutions, this approach removes regions of search space with clearlyinfeasible or low quality solutions. This restriction is additionally useful, asthe problem becomes more complex because of adding the second vector of thedecision variables to the solution representation. The vectors length is equal totask number and a greedy heuristic is used to create final scheduling. Examplesin this section are based on the application presented in Figure 2, which is runon processors presented in Table 1. Note that processors may have differentavailable DVFS pair, which may have different mapping to used voltage andrelative speed.
0
1 2 3 4
5 6
7
11 17 14 11
13 10 19 13 27
21 13
task r0 r1 r2 pi b-level0 11 13 9 11 101.31 10 15 11 12 66.72 9 12 14 12 63.33 12 16 10 12 73.04 15 11 19 15 79.35 13 9 5 9 41.76 11 15 13 12 37.37 11 15 10 12 12.0
Figure 2: On the left, a sample DAG with the task indexes i inside nodes and values of ci,jfunction next to the corresponding edges. On the right, computation cost (pi at level L0) andtask priorities (b-level).
A sample solution encoded in this form is presented in Figure 3. The firstrow shows the position of a gene, which binds this gene to a task with a givennumber. The second row represents the processor assignment, by indicating theprocessor identifier to which a task is assigned. The third row determines the
9
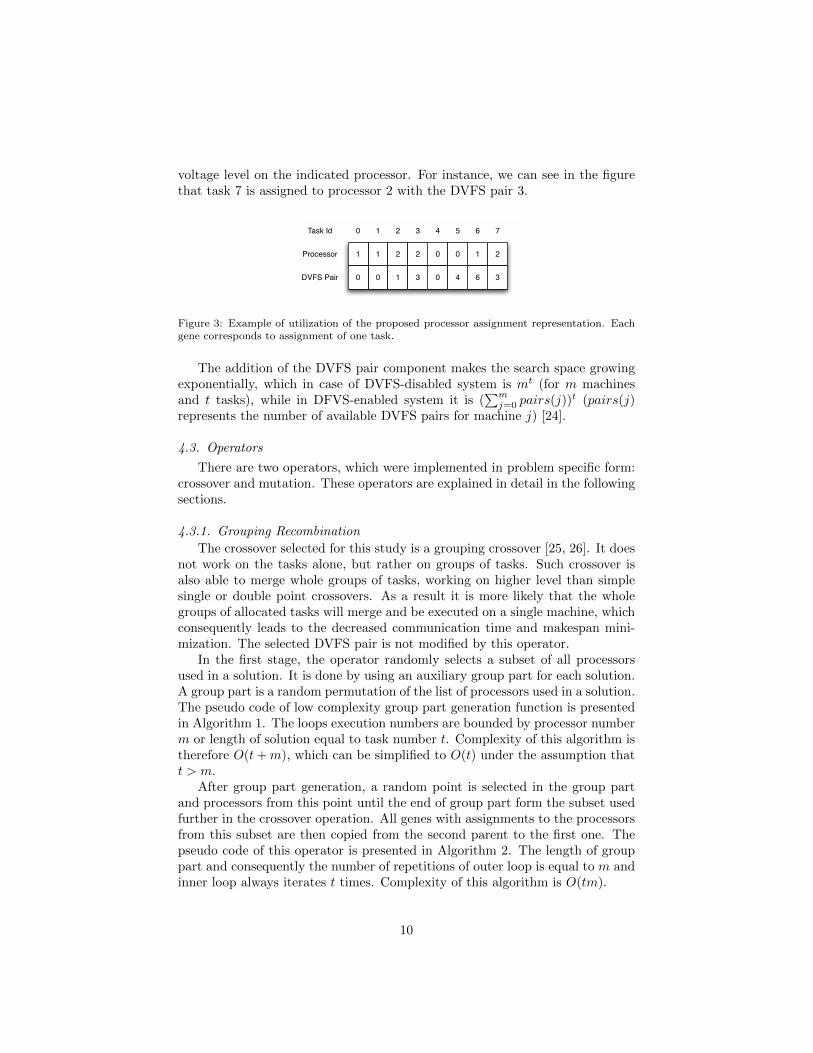
voltage level on the indicated processor. For instance, we can see in the figurethat task 7 is assigned to processor 2 with the DVFS pair 3.
0 1
0
1
3
1 0
1
0
21
3
62
2
6
2
0
4 75
4
0
3DVFS Pair
Task Id
Processor
Figure 3: Example of utilization of the proposed processor assignment representation. Eachgene corresponds to assignment of one task.
The addition of the DVFS pair component makes the search space growingexponentially, which in case of DVFS-disabled system is mt (for m machinesand t tasks), while in DFVS-enabled system it is (
∑mj=0 pairs(j))
t (pairs(j)represents the number of available DVFS pairs for machine j) [24].
4.3. Operators
There are two operators, which were implemented in problem specific form:crossover and mutation. These operators are explained in detail in the followingsections.
4.3.1. Grouping Recombination
The crossover selected for this study is a grouping crossover [25, 26]. It doesnot work on the tasks alone, but rather on groups of tasks. Such crossover isalso able to merge whole groups of tasks, working on higher level than simplesingle or double point crossovers. As a result it is more likely that the wholegroups of allocated tasks will merge and be executed on a single machine, whichconsequently leads to the decreased communication time and makespan mini-mization. The selected DVFS pair is not modified by this operator.
In the first stage, the operator randomly selects a subset of all processorsused in a solution. It is done by using an auxiliary group part for each solution.A group part is a random permutation of the list of processors used in a solution.The pseudo code of low complexity group part generation function is presentedin Algorithm 1. The loops execution numbers are bounded by processor numberm or length of solution equal to task number t. Complexity of this algorithm istherefore O(t+m), which can be simplified to O(t) under the assumption thatt > m.
After group part generation, a random point is selected in the group partand processors from this point until the end of group part form the subset usedfurther in the crossover operation. All genes with assignments to the processorsfrom this subset are then copied from the second parent to the first one. Thepseudo code of this operator is presented in Algorithm 2. The length of grouppart and consequently the number of repetitions of outer loop is equal to m andinner loop always iterates t times. Complexity of this algorithm is O(tm).
10
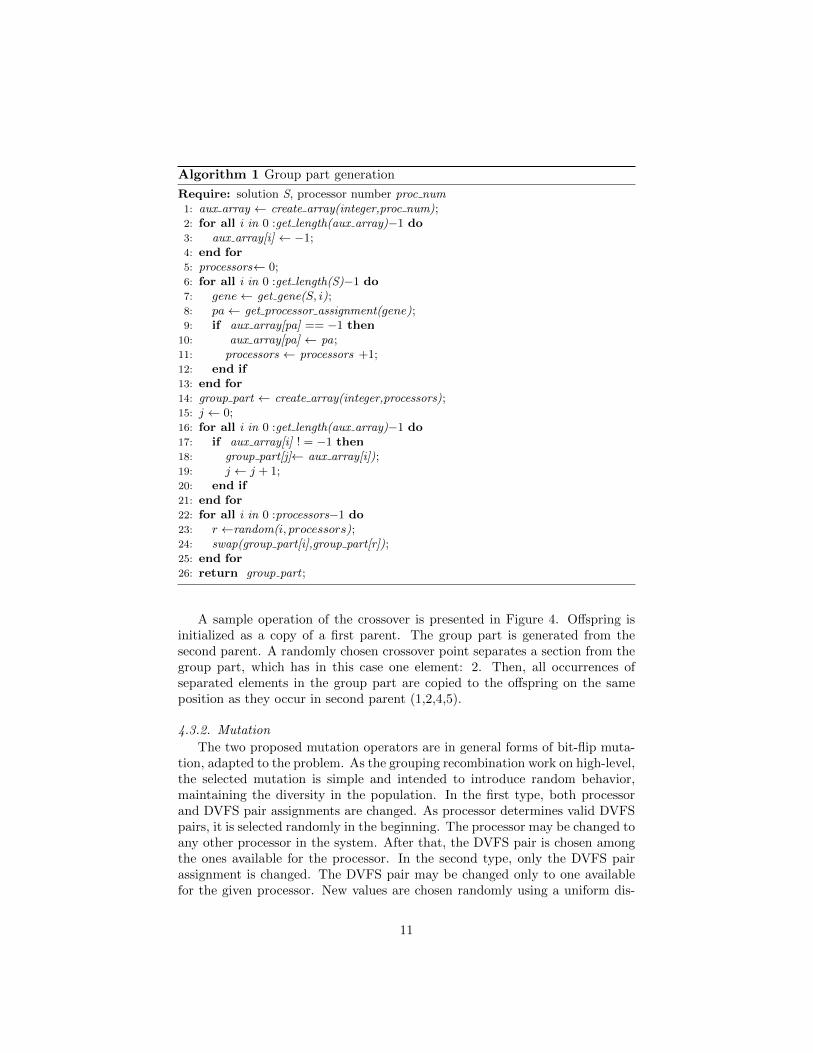
Algorithm 1 Group part generation
Require: solution S, processor number proc num1: aux array ← create array(integer,proc num);2: for all i in 0 :get length(aux array)−1 do3: aux array[i] ← −1;4: end for5: processors← 0;6: for all i in 0 :get length(S)−1 do7: gene← get gene(S, i);8: pa← get processor assignment(gene);9: if aux array[pa] == −1 then
10: aux array[pa] ← pa;11: processors ← processors +1;12: end if13: end for14: group part ← create array(integer,processors);15: j ← 0;16: for all i in 0 :get length(aux array)−1 do17: if aux array[i] ! = −1 then18: group part[j]← aux array[i]);19: j ← j + 1;20: end if21: end for22: for all i in 0 :processors−1 do23: r ←random(i, processors);24: swap(group part[i],group part[r]);25: end for26: return group part ;
A sample operation of the crossover is presented in Figure 4. Offspring isinitialized as a copy of a first parent. The group part is generated from thesecond parent. A randomly chosen crossover point separates a section from thegroup part, which has in this case one element: 2. Then, all occurrences ofseparated elements in the group part are copied to the offspring on the sameposition as they occur in second parent (1,2,4,5).
4.3.2. Mutation
The two proposed mutation operators are in general forms of bit-flip muta-tion, adapted to the problem. As the grouping recombination work on high-level,the selected mutation is simple and intended to introduce random behavior,maintaining the diversity in the population. In the first type, both processorand DVFS pair assignments are changed. As processor determines valid DVFSpairs, it is selected randomly in the beginning. The processor may be changed toany other processor in the system. After that, the DVFS pair is chosen amongthe ones available for the processor. In the second type, only the DVFS pairassignment is changed. The DVFS pair may be changed only to one availablefor the given processor. New values are chosen randomly using a uniform dis-
11
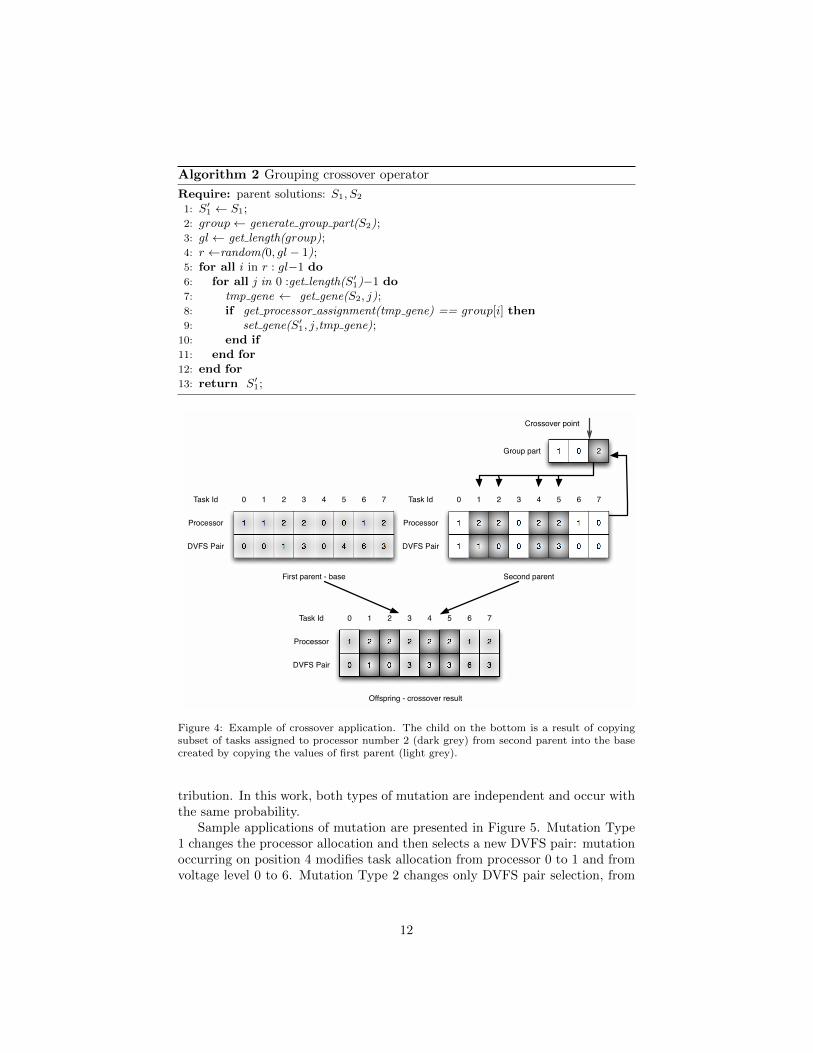
Algorithm 2 Grouping crossover operator
Require: parent solutions: S1, S2
1: S′1 ← S1;
2: group← generate group part(S2);3: gl← get length(group);4: r ←random(0, gl − 1);5: for all i in r : gl−1 do6: for all j in 0 :get length(S′
1)−1 do7: tmp gene ← get gene(S2, j);8: if get processor assignment(tmp gene) == group[i] then9: set gene(S′
1, j,tmp gene);10: end if11: end for12: end for13: return S′
1;
0 1
0
1
3
1 0
1
0
21
3
62
2
6
2
0
4 75
4
0
3DVFS Pair
Task Id
Processor
1 0
0
1
3
2 2
1
3
01
0
62
2
0
0
1
4 75
3
2
0DVFS Pair
Task Id
Processor
1 0
0
1
3
2 2
1
3
21
3
62
2
6
2
0
4 75
3
2
3DVFS Pair
Task Id
Processor
First parent - base Second parent
Offspring - crossover result
01 2
Crossover point
Group part
Figure 4: Example of crossover application. The child on the bottom is a result of copyingsubset of tasks assigned to processor number 2 (dark grey) from second parent into the basecreated by copying the values of first parent (light grey).
tribution. In this work, both types of mutation are independent and occur withthe same probability.
Sample applications of mutation are presented in Figure 5. Mutation Type1 changes the processor allocation and then selects a new DVFS pair: mutationoccurring on position 4 modifies task allocation from processor 0 to 1 and fromvoltage level 0 to 6. Mutation Type 2 changes only DVFS pair selection, from
12
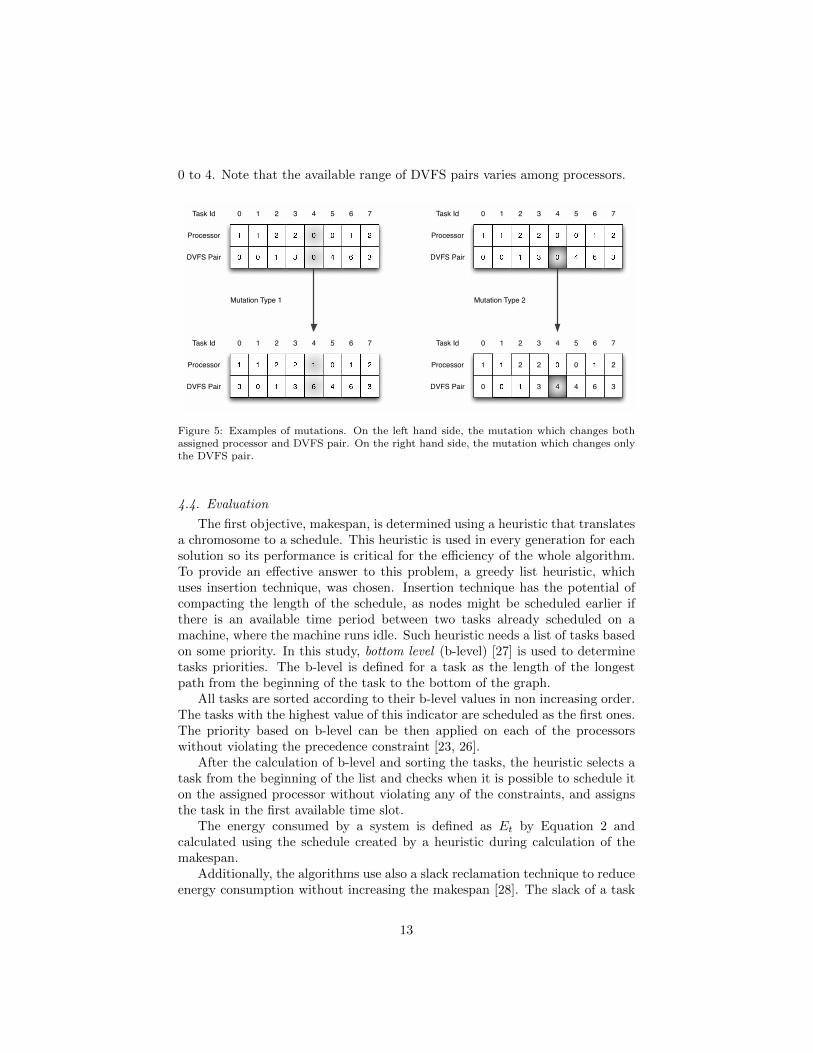
0 to 4. Note that the available range of DVFS pairs varies among processors.
0 1
0
1
3
1 0
1
0
21
3
62
2
6
2
0
4 75
4
0
3DVFS Pair
Task Id
Processor
0 1
0
1
3
1 0
1
0
21
3
62
2
6
2
0
4 75
4
0
3DVFS Pair
Task Id
Processor
0 1
0
1
3
1 1
1
6
21
3
62
2
6
2
0
4 75
4
0
3DVFS Pair
Task Id
Processor
0 1
0
1
3
1 0
1
4
21
3
62
2
6
2
0
4 75
4
0
3DVFS Pair
Task Id
Processor
Mutation Type 1 Mutation Type 2
Figure 5: Examples of mutations. On the left hand side, the mutation which changes bothassigned processor and DVFS pair. On the right hand side, the mutation which changes onlythe DVFS pair.
4.4. Evaluation
The first objective, makespan, is determined using a heuristic that translatesa chromosome to a schedule. This heuristic is used in every generation for eachsolution so its performance is critical for the efficiency of the whole algorithm.To provide an effective answer to this problem, a greedy list heuristic, whichuses insertion technique, was chosen. Insertion technique has the potential ofcompacting the length of the schedule, as nodes might be scheduled earlier ifthere is an available time period between two tasks already scheduled on amachine, where the machine runs idle. Such heuristic needs a list of tasks basedon some priority. In this study, bottom level (b-level) [27] is used to determinetasks priorities. The b-level is defined for a task as the length of the longestpath from the beginning of the task to the bottom of the graph.
All tasks are sorted according to their b-level values in non increasing order.The tasks with the highest value of this indicator are scheduled as the first ones.The priority based on b-level can be then applied on each of the processorswithout violating the precedence constraint [23, 26].
After the calculation of b-level and sorting the tasks, the heuristic selects atask from the beginning of the list and checks when it is possible to schedule iton the assigned processor without violating any of the constraints, and assignsthe task in the first available time slot.
The energy consumed by a system is defined as Et by Equation 2 andcalculated using the schedule created by a heuristic during calculation of themakespan.
Additionally, the algorithms use also a slack reclamation technique to reduceenergy consumption without increasing the makespan [28]. The slack of a task
13
is the time slot between the task end and the following task start. In theevaluation function, each slack is used to combine the DVFS pair selected by aMOEA with the lowest possible DVFS pair of the assigned processor to reducethe total consumed energy [6]. Finally, the minimum DVFS pair of the processoris assigned to all remaining idle time slots.
5. Experimentation
This section contains the experimental study of the algorithms and the prob-lem. Section 5.1 describes the choice of instances for the study. Section 5.2presents the validity of the approach proven by a set of experimental tests.Section 5.3 contains results obtained by simulations performed over the set ofinstances, which are subsequently discussed in Section 5.5.
5.1. Problem Instances
The diversified benchmark used in this work includes real applications DAGs,structured synthetic graphs, and random graphs. The total number of variousinstances used throughout the study is 2100. Instances can be described by theirsize: number of tasks and edges. The ratio between tasks and edges (Edge TaskRatio or ETR) gives information on the average node degree that determinesthe possibilities of parallelization and the number of required communications.Communication to Computation Ratio (CCR) is another metric that describesa DAG, and it is computed as the division of the average communication cost (c)by the average computation cost (p) on a target system, as defined by Equation3. All instances were generated with five different CCRs: 0.1, 0.5, 1, 5 and 10 topresent a wide range of possible applications, from computation-intensive (CCR= 0.1) to the communication-intensive (CCR = 10) ones. The final parameterof an instance is the processors heterogeneity values [29], which value β is usedto generate the computational weight of a task pil. The weight is generatedusing a uniform distribution around initially homogenous value pi, defined asU(pi× 1− β
2 ); pi× (1 + β2 )). For each possible configuration, all values from the
set {0.1, 0.25, 0.5, 0.75, 1.0} were used to test a range from quasi-homogenous(heterogeneity = 0.1) to fully heterogenous (heterogeneity = 1.0) systems.
The randomization procedure used to introduce heterogeneity is composedof the following steps: first, if the homogenous weights are not included in theinput graph, they are generated using a distribution U(0; 2× r), where r, in thiswork, is a random value from the distribution U(1; 30). Then, the homogenousweights are altered using the heterogeneity parameter. Finally, the edge weightsare generated using the distribution U(0; 2× p×CCR), which ensures that thegenerated instance has required CCR.
CCR = c/p. (3)
To present a wide range of possible platforms, systems containing from 8 to128 processors were used. The generated systems were using five distinct DVFSsettings presented in Table 2 and cyclically assigned to the processors. The
14
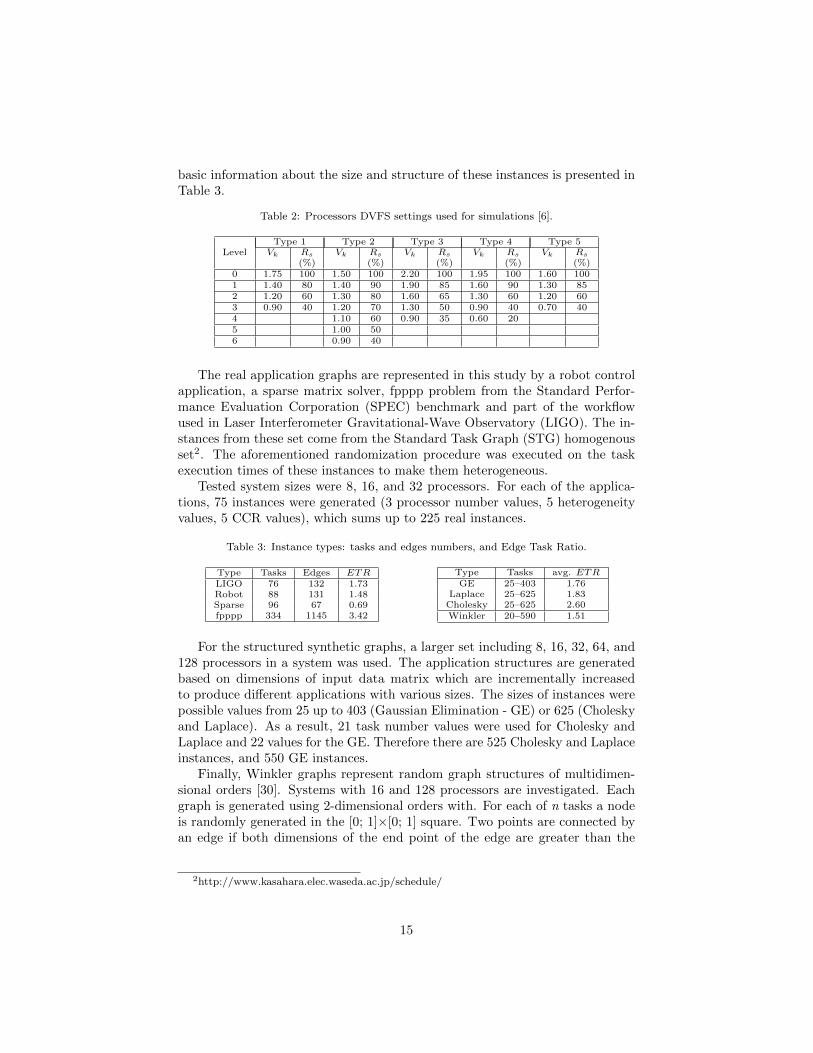
basic information about the size and structure of these instances is presented inTable 3.
Table 2: Processors DVFS settings used for simulations [6].
Type 1 Type 2 Type 3 Type 4 Type 5Level Vk Rs Vk Rs Vk Rs Vk Rs Vk Rs
(%) (%) (%) (%) (%)0 1.75 100 1.50 100 2.20 100 1.95 100 1.60 1001 1.40 80 1.40 90 1.90 85 1.60 90 1.30 852 1.20 60 1.30 80 1.60 65 1.30 60 1.20 603 0.90 40 1.20 70 1.30 50 0.90 40 0.70 404 1.10 60 0.90 35 0.60 205 1.00 506 0.90 40
The real application graphs are represented in this study by a robot controlapplication, a sparse matrix solver, fpppp problem from the Standard Perfor-mance Evaluation Corporation (SPEC) benchmark and part of the workflowused in Laser Interferometer Gravitational-Wave Observatory (LIGO). The in-stances from these set come from the Standard Task Graph (STG) homogenousset2. The aforementioned randomization procedure was executed on the taskexecution times of these instances to make them heterogeneous.
Tested system sizes were 8, 16, and 32 processors. For each of the applica-tions, 75 instances were generated (3 processor number values, 5 heterogeneityvalues, 5 CCR values), which sums up to 225 real instances.
Table 3: Instance types: tasks and edges numbers, and Edge Task Ratio.
Type Tasks Edges ETRLIGO 76 132 1.73Robot 88 131 1.48Sparse 96 67 0.69fpppp 334 1145 3.42
Type Tasks avg. ETRGE 25–403 1.76
Laplace 25–625 1.83Cholesky 25–625 2.60Winkler 20–590 1.51
For the structured synthetic graphs, a larger set including 8, 16, 32, 64, and128 processors in a system was used. The application structures are generatedbased on dimensions of input data matrix which are incrementally increasedto produce different applications with various sizes. The sizes of instances werepossible values from 25 up to 403 (Gaussian Elimination - GE) or 625 (Choleskyand Laplace). As a result, 21 task number values were used for Cholesky andLaplace and 22 values for the GE. Therefore there are 525 Cholesky and Laplaceinstances, and 550 GE instances.
Finally, Winkler graphs represent random graph structures of multidimen-sional orders [30]. Systems with 16 and 128 processors are investigated. Eachgraph is generated using 2-dimensional orders with. For each of n tasks a nodeis randomly generated in the [0; 1]×[0; 1] square. Two points are connected byan edge if both dimensions of the end point of the edge are greater than the
2http://www.kasahara.elec.waseda.ac.jp/schedule/
15
corresponding dimensions of the start point. Winkler graphs are therefore fullyrandomized. The instance task number covers a range from 20 to 590 with aninstance every step of 30 tasks. Therefore there are 20 tasks numbers with 2processors numbers and five CCR values which give the number of 200 instances.
5.2. Algorithms testing and configuration
This section describes how the initial experiments and algorithms configu-ration were conducted. It includes a presentation of the performance metrics, aconvergence test and a validation of performance of the proposed recombination.
5.2.1. Performance metrics
Three independent quality indicators are selected for this study:
1. Unary Additive Epsilon (I1ε+,Epsilon) [31] presents the degree of conver-
gence of the approximated set to the Pareto front. It returns the smallestdistance needed for every point of the approximated set to be translatedso that it dominates the Pareto front.
2. Inverted Generational Distance (IGD) [32] summarizes how close are thepoints in the approximated set to the closest points of the Pareto front.In contrary to Epsilon, it aggregates the results of all points. When IGDis equal to 0, it means that all points from approximated set belongs tothe Pareto Front.
3. Spread [33] gives information about the distribution of the solutions alongthe approximated front. When it is equal to 0, it means that solutions areideally distributed along the front.
The reason for this choice is to provide the metrics for convergence (Ep-silon) as well as for distribution (Spread). The third metric (IGD) presentsthe aggregated results which involve convergence as well as distribution. Usageof these metrics allows to statistically analyze the results obtained from manyindependent runs. In order to apply these indicators, the optimal Pareto frontis required. However, it is not known for the studied instances. Therefore, webuild a pseudo-optimal Pareto front by aggregating the best non-dominated so-lutions found by all algorithms in all independent runs into one single front, forevery problem instance. This pseudo-optimal Pareto front will be used to applythe indicators.
5.2.2. Convergence test
The first proof of concept for the proposed MOEAs is the convergence check.It was performed on the 36 instances from the set of real applications, which areselected to be diversified and cover different specifics of various implementations.
The convergence test was prepared in two stages. First, all the algorithmswere run for 100,000 evaluations. The initial population was initialized by ran-dom values for processors assignment and the highest DVFS pairs (coded as0). This choice is motivated by the need of finding a good assignment firstand by the applied runtime slack reclamation (Section 4.4), which is able to
16
exploit existing slack. The probabilities of crossover and mutation were set topcrossover = 0.9, pmutation = 1/t (the probability that mutation will happenfor a single position in a chromosome, equal for the two mutation operators),where t is number of tasks. The selected value of the mutation probability wassuccessfully used for combinatorial optimization problems [34, 35, 36] and itis set to apply on average a single mutation of each type in a solution, whichintroduces variability but is not destructive. The population and archive sizewere set to 100. Each experiment was independently executed 50 times. Theproposed grouping crossover was used for all simulations. In the second step,the same simulations as in the previous tests were run.
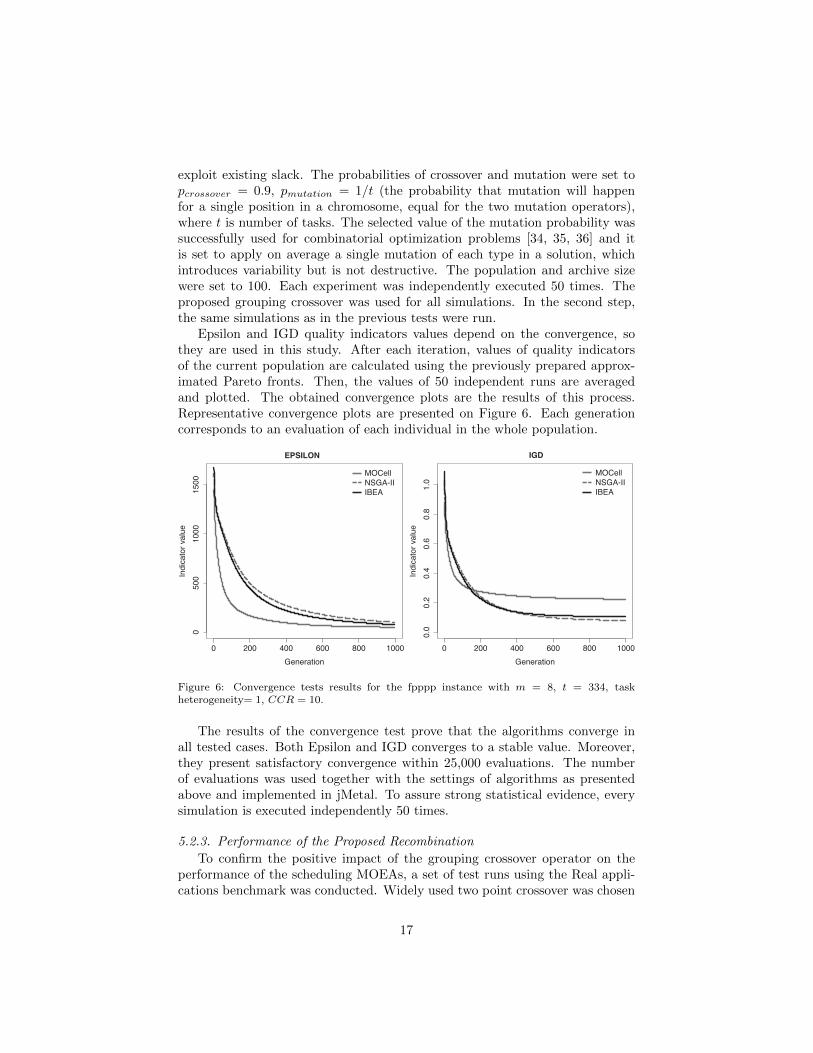
Epsilon and IGD quality indicators values depend on the convergence, sothey are used in this study. After each iteration, values of quality indicatorsof the current population are calculated using the previously prepared approx-imated Pareto fronts. Then, the values of 50 independent runs are averagedand plotted. The obtained convergence plots are the results of this process.Representative convergence plots are presented on Figure 6. Each generationcorresponds to an evaluation of each individual in the whole population.
0 200 400 600 800 1000
050
010
0015
00
EPSILON
Generation
Indic
ator
value
MOCellNSGA-IIIBEA
0 200 400 600 800 1000
0.0
0.2
0.4
0.6
0.8
1.0
Generation
Indic
ator
value
IGD
MOCellNSGA-IIIBEA
Figure 6: Convergence tests results for the fpppp instance with m = 8, t = 334, taskheterogeneity= 1, CCR = 10.
The results of the convergence test prove that the algorithms converge inall tested cases. Both Epsilon and IGD converges to a stable value. Moreover,they present satisfactory convergence within 25,000 evaluations. The numberof evaluations was used together with the settings of algorithms as presentedabove and implemented in jMetal. To assure strong statistical evidence, everysimulation is executed independently 50 times.
5.2.3. Performance of the Proposed Recombination
To confirm the positive impact of the grouping crossover operator on theperformance of the scheduling MOEAs, a set of test runs using the Real appli-cations benchmark was conducted. Widely used two point crossover was chosen
17
for the comparison. As a result, each instance was run using six different config-urations of MOEA and crossover (three MOEAs and two crossover operators).Values of Epsilon, IGD and Spread quality indicators are the basis for the pre-sented comparison. Finally, the scores of the configurations were given as aninput to the Friedman test.
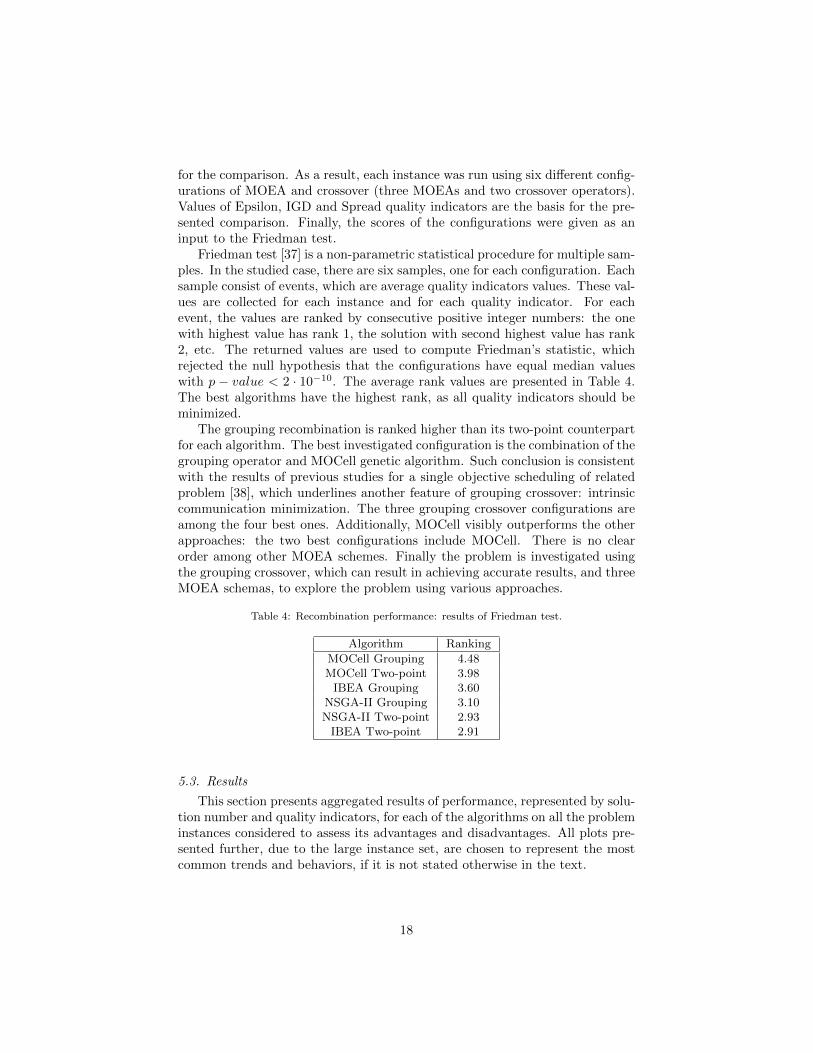
Friedman test [37] is a non-parametric statistical procedure for multiple sam-ples. In the studied case, there are six samples, one for each configuration. Eachsample consist of events, which are average quality indicators values. These val-ues are collected for each instance and for each quality indicator. For eachevent, the values are ranked by consecutive positive integer numbers: the onewith highest value has rank 1, the solution with second highest value has rank2, etc. The returned values are used to compute Friedman’s statistic, whichrejected the null hypothesis that the configurations have equal median valueswith p − value < 2 · 10−10. The average rank values are presented in Table 4.The best algorithms have the highest rank, as all quality indicators should beminimized.
The grouping recombination is ranked higher than its two-point counterpartfor each algorithm. The best investigated configuration is the combination of thegrouping operator and MOCell genetic algorithm. Such conclusion is consistentwith the results of previous studies for a single objective scheduling of relatedproblem [38], which underlines another feature of grouping crossover: intrinsiccommunication minimization. The three grouping crossover configurations areamong the four best ones. Additionally, MOCell visibly outperforms the otherapproaches: the two best configurations include MOCell. There is no clearorder among other MOEA schemes. Finally the problem is investigated usingthe grouping crossover, which can result in achieving accurate results, and threeMOEA schemas, to explore the problem using various approaches.
Table 4: Recombination performance: results of Friedman test.
Algorithm Ranking
MOCell Grouping 4.48MOCell Two-point 3.98IBEA Grouping 3.60
NSGA-II Grouping 3.10NSGA-II Two-point 2.93IBEA Two-point 2.91
5.3. Results
This section presents aggregated results of performance, represented by solu-tion number and quality indicators, for each of the algorithms on all the probleminstances considered to assess its advantages and disadvantages. All plots pre-sented further, due to the large instance set, are chosen to represent the mostcommon trends and behaviors, if it is not stated otherwise in the text.
18
5.3.1. Solution number analysis
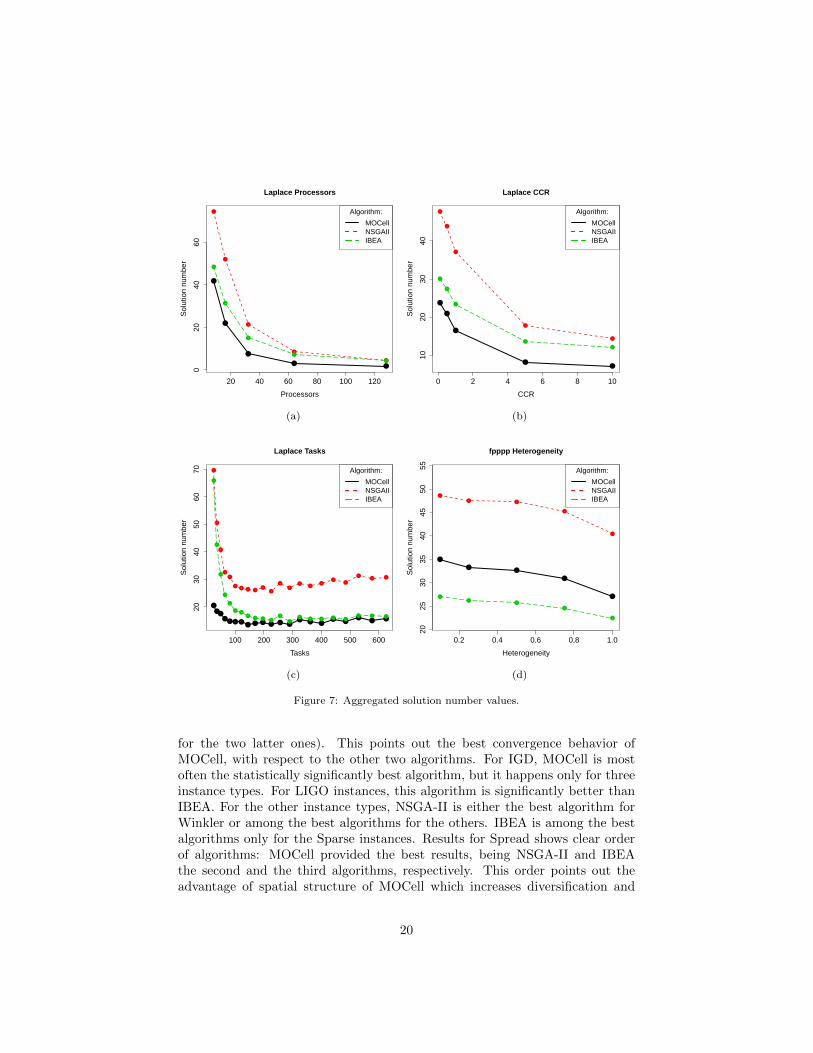
The solution number analysis reflects the problem complexity. The algo-rithms were able to fill the archive only for the simplest instances. The resultspresented in Figure 7 are aggregated values of average solution number from 50independent runs. For all instance types NSGA-II returns the biggest numberof solutions, IBEA the second biggest while MOCell the smallest one. It is dif-ferent only for the fpppp instances for which ranks of MOCell and IBEA areexchanged (Figure 7d). The most influential parameter for solution number isprocessor number (Figure 7a), as its increase is almost inversely proportional tosolution number. Similar behavior but with lower impact has CCR (Figure 7b).Regarding task number, the parameter with the largest range, solution num-ber tends to converge to a constant value or slowly increases (Figure 7c) afterreaching instance size of 200 tasks. The last investigated parameter, processorsheterogeneity, has the least impact (Figure 7d) slightly decreasing the solutionnumber with its growth.
5.3.2. Quality indicators analysis
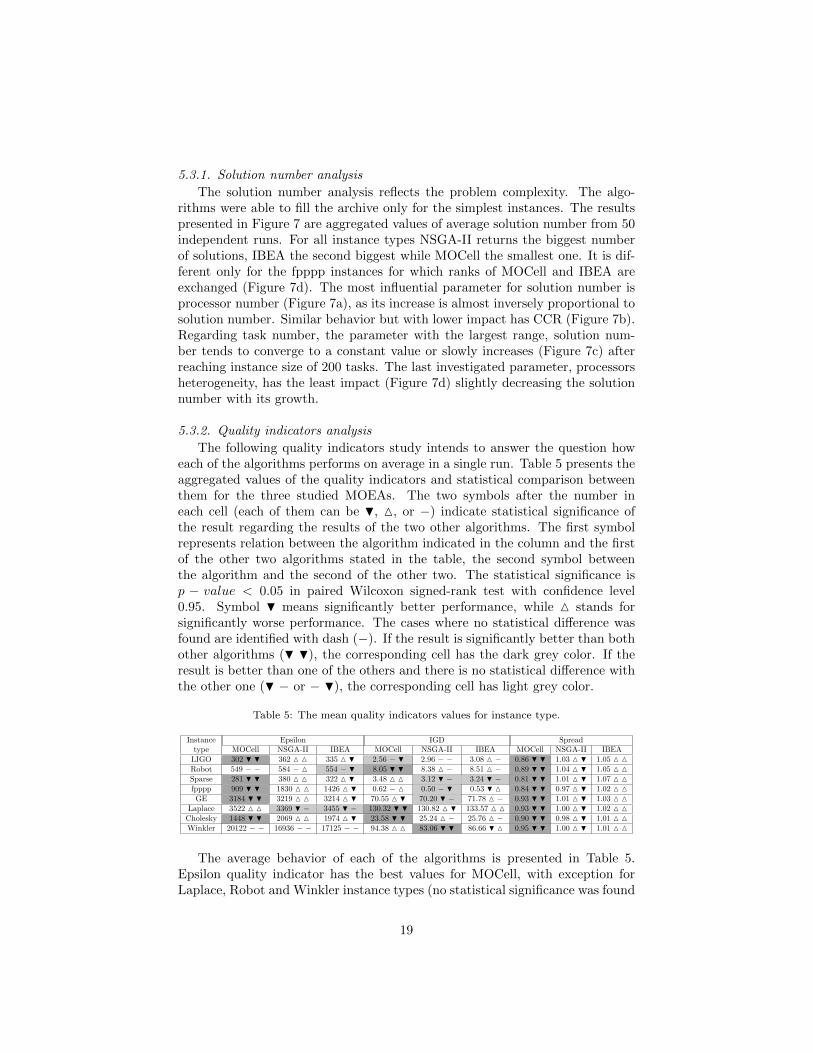
The following quality indicators study intends to answer the question howeach of the algorithms performs on average in a single run. Table 5 presents theaggregated values of the quality indicators and statistical comparison betweenthem for the three studied MOEAs. The two symbols after the number ineach cell (each of them can be H, M, or −) indicate statistical significance ofthe result regarding the results of the two other algorithms. The first symbolrepresents relation between the algorithm indicated in the column and the firstof the other two algorithms stated in the table, the second symbol betweenthe algorithm and the second of the other two. The statistical significance isp − value < 0.05 in paired Wilcoxon signed-rank test with confidence level0.95. Symbol H means significantly better performance, while M stands forsignificantly worse performance. The cases where no statistical difference wasfound are identified with dash (−). If the result is significantly better than bothother algorithms (H H), the corresponding cell has the dark grey color. If theresult is better than one of the others and there is no statistical difference withthe other one (H − or − H), the corresponding cell has light grey color.
Table 5: The mean quality indicators values for instance type.
Instance Epsilon IGD Spreadtype MOCell NSGA-II IBEA MOCell NSGA-II IBEA MOCell NSGA-II IBEA
LIGO 302 H H 362 M M 335 M H 2.56 − H 2.96 − − 3.08 M − 0.86 H H 1.03 M H 1.05 M MRobot 549 − − 584 − M 554 − H 8.05 H H 8.38 M − 8.51 M − 0.89 H H 1.04 M H 1.05 M MSparse 281 H H 380 M M 322 M H 3.48 M M 3.12 H − 3.24 H − 0.81 H H 1.01 M H 1.07 M Mfpppp 909 H H 1830 M M 1426 M H 0.62 − M 0.50 − H 0.53 H M 0.84 H H 0.97 M H 1.02 M MGE 3184 H H 3219 M M 3214 M H 70.55 M H 70.20 H − 71.78 M − 0.93 H H 1.01 M H 1.03 M M
Laplace 3522 M M 3369 H − 3455 H − 130.32 H H 130.82 M H 133.57 M M 0.93 H H 1.00 M H 1.02 M MCholesky 1448 H H 2069 M M 1974 M H 23.58 H H 25.24 M − 25.76 M − 0.90 H H 0.98 M H 1.01 M MWinkler 20122 − − 16936 − − 17125 − − 94.38 M M 83.06 H H 86.66 H M 0.95 H H 1.00 M H 1.01 M M
The average behavior of each of the algorithms is presented in Table 5.Epsilon quality indicator has the best values for MOCell, with exception forLaplace, Robot and Winkler instance types (no statistical significance was found
19
●
●
●
●●
20 40 60 80 100 120
020
4060
Laplace Processors
Processors
Sol
utio
n nu
mbe
r
●
●
●
●
●
●
●
●
●
●
Algorithm:
MOCellNSGAIIIBEA
(a)
●
●
●
●●
0 2 4 6 8 10
1020
3040
Laplace CCR
CCR
Sol
utio
n nu
mbe
r
●
●
●
●
●
●
●
●
●
●
Algorithm:
MOCellNSGAIIIBEA
(b)
●
●●
●● ● ●
● ● ●● ●
●
●● ●
●●
●●
●
100 200 300 400 500 600
2030
4050
6070
Laplace Tasks
Tasks
Sol
utio
n nu
mbe
r
●
●
●
●
●
●● ● ●
●●
●
●
●●
●●
●
●● ●
●
●
●
●
●
●●
●● ●
●
●
●
●● ● ● ●
● ● ●
Algorithm:
MOCellNSGAIIIBEA
(c)
●
●●
●
●
0.2 0.4 0.6 0.8 1.0
2025
3035
4045
5055
fpppp Heterogeneity
Heterogeneity
Sol
utio
n nu
mbe
r
●
● ●
●
●
●●
●
●
●
Algorithm:
MOCellNSGAIIIBEA
(d)
Figure 7: Aggregated solution number values.
for the two latter ones). This points out the best convergence behavior ofMOCell, with respect to the other two algorithms. For IGD, MOCell is mostoften the statistically significantly best algorithm, but it happens only for threeinstance types. For LIGO instances, this algorithm is significantly better thanIBEA. For the other instance types, NSGA-II is either the best algorithm forWinkler or among the best algorithms for the others. IBEA is among the bestalgorithms only for the Sparse instances. Results for Spread shows clear orderof algorithms: MOCell provided the best results, being NSGA-II and IBEAthe second and the third algorithms, respectively. This order points out theadvantage of spatial structure of MOCell which increases diversification and
20
results in more even distribution of solutions. Additionally, MOCell is the onlyalgorithm which achieves to be significantly better than the two others, exceptthe NSGA-II for IGD and Winkler instances.
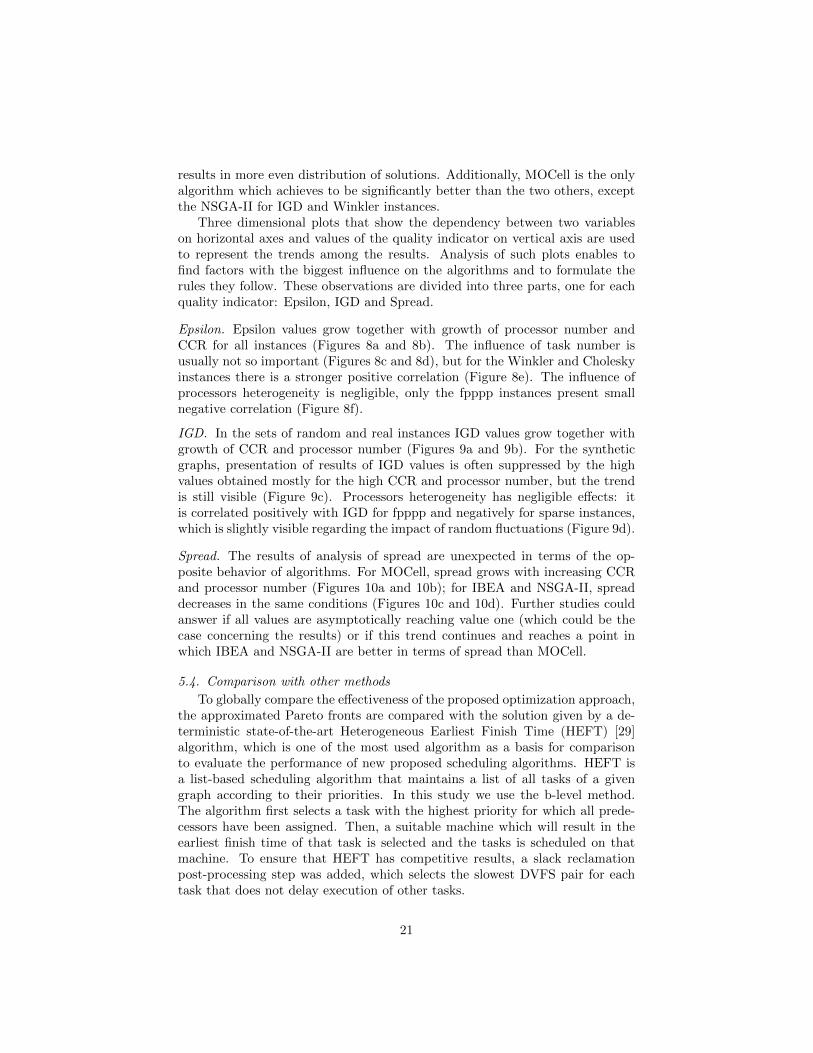
Three dimensional plots that show the dependency between two variableson horizontal axes and values of the quality indicator on vertical axis are usedto represent the trends among the results. Analysis of such plots enables tofind factors with the biggest influence on the algorithms and to formulate therules they follow. These observations are divided into three parts, one for eachquality indicator: Epsilon, IGD and Spread.
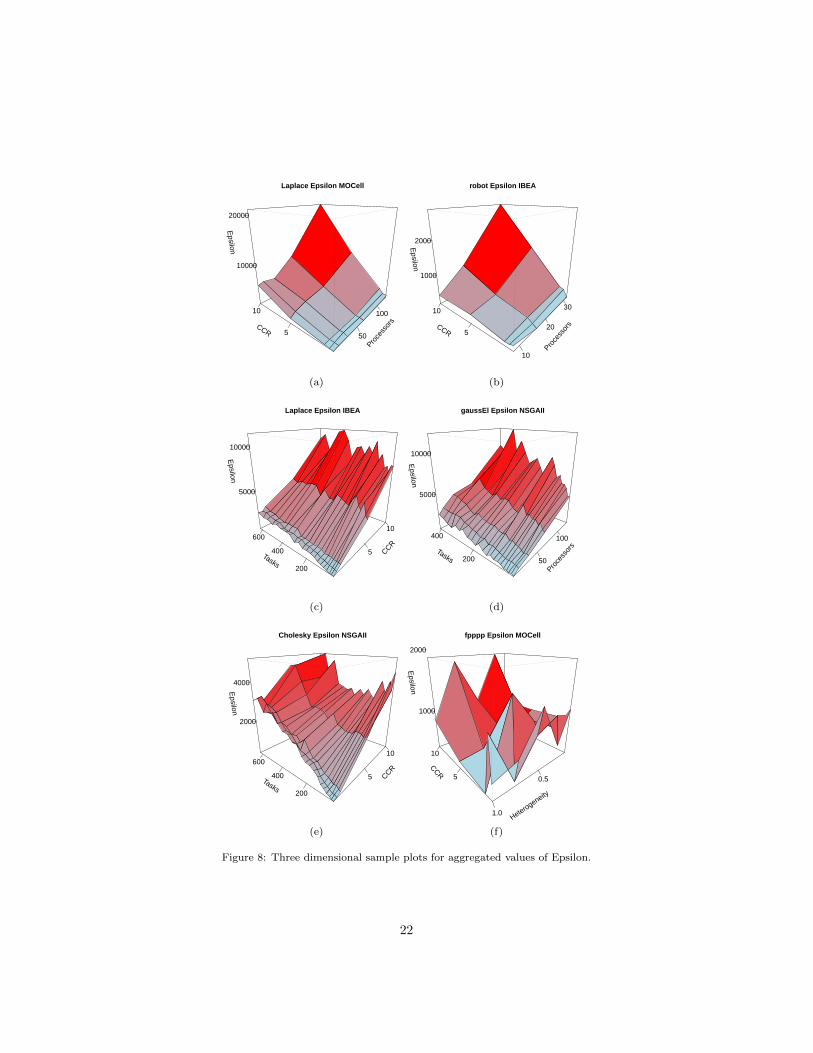
Epsilon. Epsilon values grow together with growth of processor number andCCR for all instances (Figures 8a and 8b). The influence of task number isusually not so important (Figures 8c and 8d), but for the Winkler and Choleskyinstances there is a stronger positive correlation (Figure 8e). The influence ofprocessors heterogeneity is negligible, only the fpppp instances present smallnegative correlation (Figure 8f).
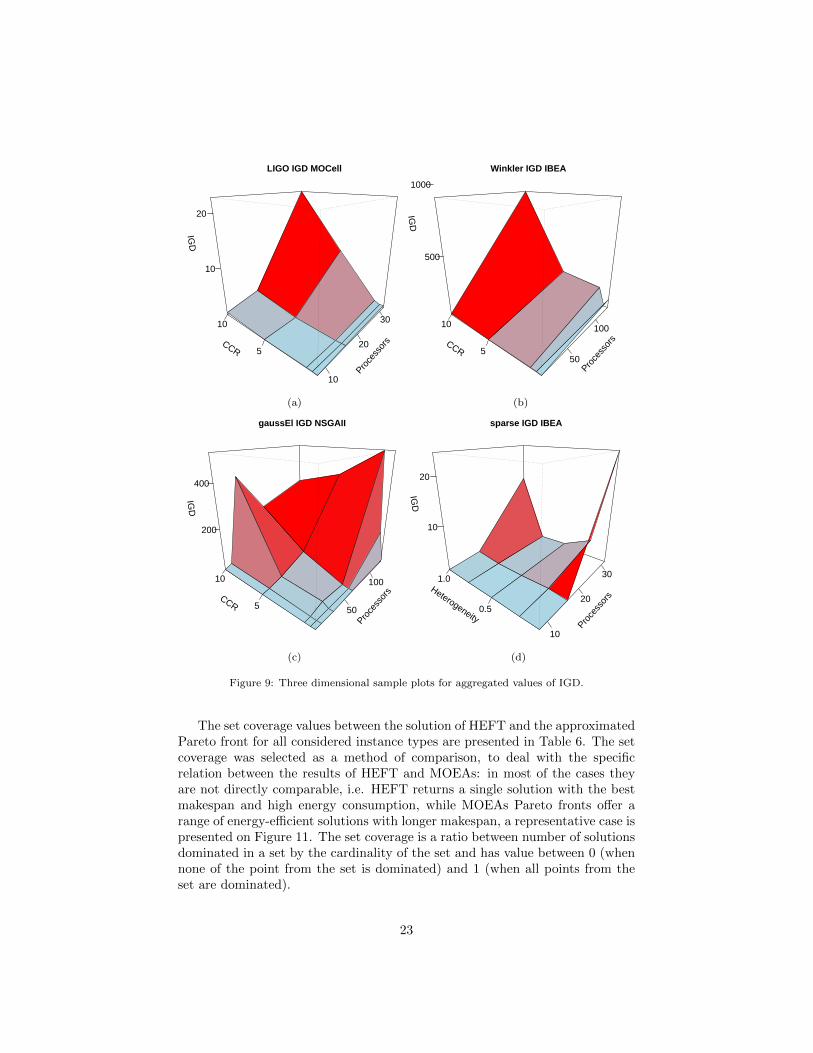
IGD. In the sets of random and real instances IGD values grow together withgrowth of CCR and processor number (Figures 9a and 9b). For the syntheticgraphs, presentation of results of IGD values is often suppressed by the highvalues obtained mostly for the high CCR and processor number, but the trendis still visible (Figure 9c). Processors heterogeneity has negligible effects: itis correlated positively with IGD for fpppp and negatively for sparse instances,which is slightly visible regarding the impact of random fluctuations (Figure 9d).
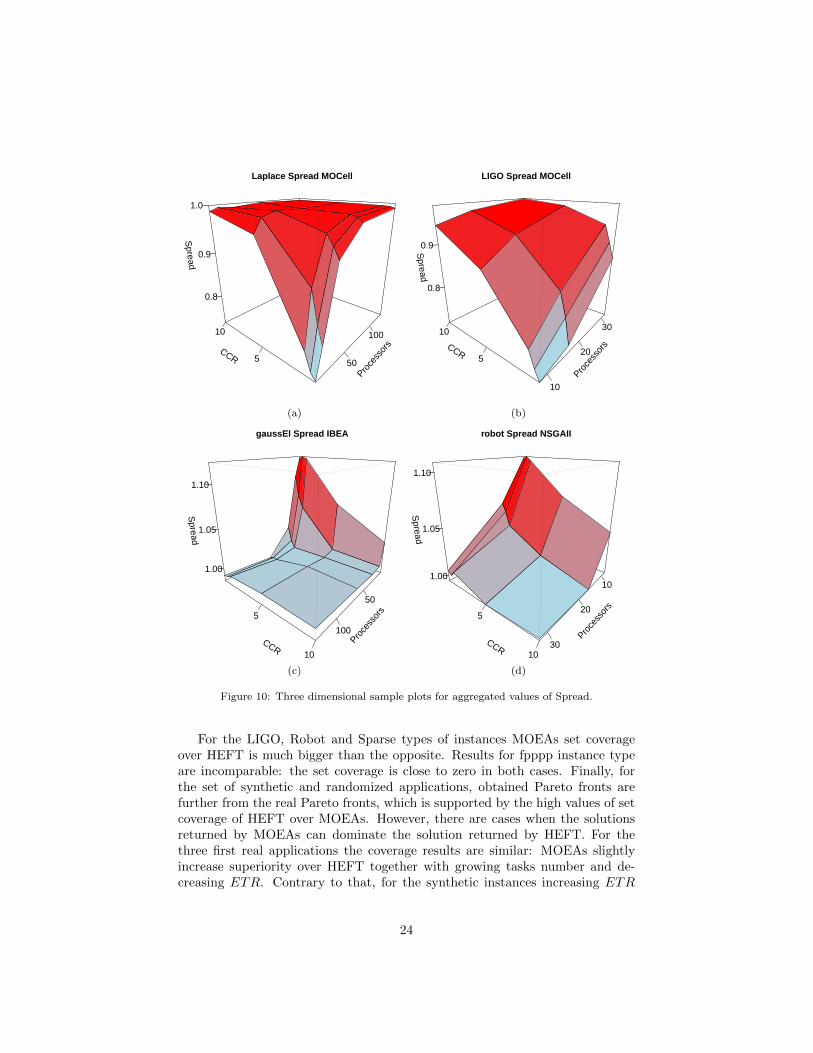
Spread. The results of analysis of spread are unexpected in terms of the op-posite behavior of algorithms. For MOCell, spread grows with increasing CCRand processor number (Figures 10a and 10b); for IBEA and NSGA-II, spreaddecreases in the same conditions (Figures 10c and 10d). Further studies couldanswer if all values are asymptotically reaching value one (which could be thecase concerning the results) or if this trend continues and reaches a point inwhich IBEA and NSGA-II are better in terms of spread than MOCell.
5.4. Comparison with other methods
To globally compare the effectiveness of the proposed optimization approach,the approximated Pareto fronts are compared with the solution given by a de-terministic state-of-the-art Heterogeneous Earliest Finish Time (HEFT) [29]algorithm, which is one of the most used algorithm as a basis for comparisonto evaluate the performance of new proposed scheduling algorithms. HEFT isa list-based scheduling algorithm that maintains a list of all tasks of a givengraph according to their priorities. In this study we use the b-level method.The algorithm first selects a task with the highest priority for which all prede-cessors have been assigned. Then, a suitable machine which will result in theearliest finish time of that task is selected and the tasks is scheduled on thatmachine. To ensure that HEFT has competitive results, a slack reclamationpost-processing step was added, which selects the slowest DVFS pair for eachtask that does not delay execution of other tasks.
21
Proce
ssor
s
50
100
CCR 5
10
Epsilon
10000
20000
Laplace Epsilon MOCell
(a)
Proce
ssor
s
10
20
30
CCR 5
10
Epsilon
1000
2000
robot Epsilon IBEA
(b)CCR
5
10
Tasks200
400
600
Epsilon
5000
10000
Laplace Epsilon IBEA
(c)
Proce
ssor
s50
100
Tasks 200
400
Epsilon
5000
10000
gaussEl Epsilon NSGAII
(d)
CCR
5
10
Tasks200
400
600
Epsilon
2000
4000
Cholesky Epsilon NSGAII
(e)
CCR 5
10
Heterogeneity
0.5
1.0
Epsilon
1000
2000
fpppp Epsilon MOCell
(f)
Figure 8: Three dimensional sample plots for aggregated values of Epsilon.
22
Proce
ssor
s10
20
30
CCR 5
10
IGD
10
20
LIGO IGD MOCell
(a)
Proce
ssor
s
50
100
CCR 5
10
IGD
500
1000
Winkler IGD IBEA
(b)
Proce
ssor
s
50
100
CCR 5
10
IGD
200
400
gaussEl IGD NSGAII
(c)
Proce
ssor
s
10
20
30
Heterogeneity0.5
1.0
IGD
10
20
sparse IGD IBEA
(d)
Figure 9: Three dimensional sample plots for aggregated values of IGD.
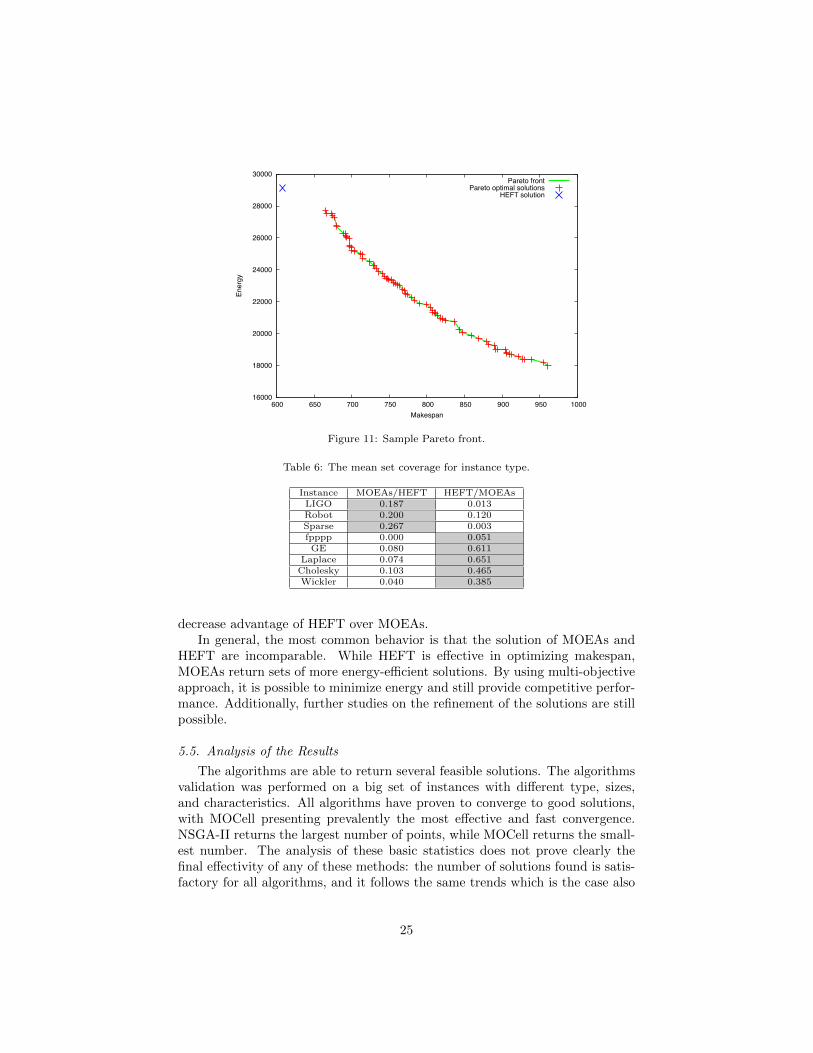
The set coverage values between the solution of HEFT and the approximatedPareto front for all considered instance types are presented in Table 6. The setcoverage was selected as a method of comparison, to deal with the specificrelation between the results of HEFT and MOEAs: in most of the cases theyare not directly comparable, i.e. HEFT returns a single solution with the bestmakespan and high energy consumption, while MOEAs Pareto fronts offer arange of energy-efficient solutions with longer makespan, a representative case ispresented on Figure 11. The set coverage is a ratio between number of solutionsdominated in a set by the cardinality of the set and has value between 0 (whennone of the point from the set is dominated) and 1 (when all points from theset are dominated).
23
Proce
ssor
s
50
100
CCR 5
10
Spread
0.8
0.9
1.0
Laplace Spread MOCell
(a)
Proce
ssor
s
10
20
30
CCR5
10
Spread
0.8
0.9
LIGO Spread MOCell
(b)
Proce
ssor
s
50
100CCR
5
10
Spread
1.00
1.05
1.10
gaussEl Spread IBEA
(c)
Proce
ssor
s
10
20
30CCR
5
10
Spread
1.00
1.05
1.10
robot Spread NSGAII
(d)
Figure 10: Three dimensional sample plots for aggregated values of Spread.
For the LIGO, Robot and Sparse types of instances MOEAs set coverageover HEFT is much bigger than the opposite. Results for fpppp instance typeare incomparable: the set coverage is close to zero in both cases. Finally, forthe set of synthetic and randomized applications, obtained Pareto fronts arefurther from the real Pareto fronts, which is supported by the high values of setcoverage of HEFT over MOEAs. However, there are cases when the solutionsreturned by MOEAs can dominate the solution returned by HEFT. For thethree first real applications the coverage results are similar: MOEAs slightlyincrease superiority over HEFT together with growing tasks number and de-creasing ETR. Contrary to that, for the synthetic instances increasing ETR
24
16000
18000
20000
22000
24000
26000
28000
30000
600 650 700 750 800 850 900 950 1000
Ener
gy
Makespan
Pareto frontPareto optimal solutions
HEFT solution
Figure 11: Sample Pareto front.
Table 6: The mean set coverage for instance type.
Instance MOEAs/HEFT HEFT/MOEAsLIGO 0.187 0.013Robot 0.200 0.120Sparse 0.267 0.003fpppp 0.000 0.051GE 0.080 0.611
Laplace 0.074 0.651Cholesky 0.103 0.465Wickler 0.040 0.385
decrease advantage of HEFT over MOEAs.In general, the most common behavior is that the solution of MOEAs and
HEFT are incomparable. While HEFT is effective in optimizing makespan,MOEAs return sets of more energy-efficient solutions. By using multi-objectiveapproach, it is possible to minimize energy and still provide competitive perfor-mance. Additionally, further studies on the refinement of the solutions are stillpossible.
5.5. Analysis of the Results
The algorithms are able to return several feasible solutions. The algorithmsvalidation was performed on a big set of instances with different type, sizes,and characteristics. All algorithms have proven to converge to good solutions,with MOCell presenting prevalently the most effective and fast convergence.NSGA-II returns the largest number of points, while MOCell returns the small-est number. The analysis of these basic statistics does not prove clearly thefinal effectivity of any of these methods: the number of solutions found is satis-factory for all algorithms, and it follows the same trends which is the case also
25
for convergence. The analysis of quality indicators is intended to finally reviewthe algorithms. The MOCell algorithm schema has the best average values forEpsilon and Spread and it slightly outperforms the NSGA-II average values forIGD. MOCell performed the best in the crossover comparison and quality indi-cators analysis for Epsilon and Spread. As the analysis of IGD also favors thisalgorithm and returned solution number values are similar for all algorithms,usage of MOCell is advised for this problem. Generally, it can be observed thatquality indicator values increase (worsen) with the growth of processor numberand CRR, and to less extent with the growth of task number. This scalabil-ity issue could be tackled by the algorithm hybridization with seeding initialpopulation or with usage of local search.
The main outcome is not only the presented algorithms, but also the study ofthe problem performed by the unbiased stochastic search processes. The qualityindicators study shows that processor number and CCR are the most influentialcharacteristics of the instances regarding the quality of the obtained results. Theimpact of task number is lower and the impact of processors heterogeneity seemsto be negligible. It is important to note that these specifics do not correspondto the computational complexity of the problem, which depends on tasks andedges number. The study shows also the fact of the importance of the instancekind on the results: depending on the instance structure, the results are verydifferent. Analysis of number of tasks, edges or ratio between number of edgesand tasks does not solve this issue solely. The algorithms present similar trendsfor Epsilon and IGD and two distinct behaviors for Spread.
6. Conclusions and Future Work
This study investigated the problem of scheduling precedence-constrainedapplications on heterogeneous, DVFS-enabled, distributed computing systems,considering simultaneously two independent objectives: schedule length andminimization of the energy consumption. Three algorithms are proposed andevaluated, based on state-of-the-art MOCell, NSGA-II and IBEA algorithms.Results show that MOEAs are able to provide accurate solutions for the ad-dressed problem and confirm the effectivity of the method in which processorassignment and DVFS pair setting are done simultaneously, which is proven bythe comparison with the HEFT algorithm. The MOEAs perform especially wellin scheduling the DAGs that represents real applications. MOCell is the MOEAschema identified as the most suitable for this problem.
The results present also an exploration of the problem by testing the al-gorithms on the large and diversified benchmark. The difficulty of solving theenergy-efficiency scheduling problem by MOEAs is dependent mainly on proces-sor number and CCR, with minor influence of task number. These observationsare supported by Wilcoxon and Friedman statistical tests performed on thevalues of three quality indicators: Epsilon, IGD and Spread.
There are three main directions of development, which can follow up thiswork. First of them is addressing the scalability issues and increasing the qual-ity of solution for harder and bigger instances. This includes improving the
26
algorithmic part by such steps as seeding the initial population, adding lo-cal search step, or optimizing the algorithm runtime. Advances in these fieldscould facilitate addressing scheduling problems with more than two objectives:for this problem the robustness and flexibility of a schedule could be additionalobjectives. The last proposed research direction is refining the algorithm en-ergy model, to include more factors such as memory energy consumption andnetworking system components, as well as the heat dissipation issue.
Acknowledgements
The work of P. Bouvry and J. Pecero is partly funded by INTER/CNRS/11/03Green@Cloud. B. Dorronsoro acknowledges that the present project is partiallysupported by the National Research Fund, Luxembourg, and cofunded underthe Marie Curie Actions of the European Commission (FP7-COFUND), underAFR contract no 4017742. M. Guzek acknowledges the support of the NationalResearch Fund of Luxembourg (FNR) and Tri-ICT, with the AFR contract no.1315254. Experiments presented in this paper were carried out using the HPCfacility of the University of Luxembourg.
References
[1] DatacenterDynamics, Dcd industry census 2013: Data center power,http://www.datacenterdynamics.com/focus/archive/2014/01/
dcd-industry-census-2013-data-center-power (January 2014).
[2] A. Beloglazov, R. Buyya, Y. C. Lee, A. Y. Zomaya, A taxonomy and surveyof energy-efficient data centers and cloud computing systems, Advances inComputers 82 (2011) 47–111.
[3] L. Minas, B. Ellison, Energy Efficiency for Information Technology: Howto Reduce Power Consumption in Servers and Data Centers, Intel Press,USA, 2009.
[4] G. Valentini, W. Lassonde, S. Khan, N. Min-Allah, S. Madani, J. Li,L. Zhang, L. Wang, N. Ghani, J. Kolodziej, H. Li, A. Zomaya, C.-Z.Xu, P. Balaji, A. Vishnu, F. Pinel, J. Pecero, D. Kliazovich, P. Bouvry,An overview of energy efficiency techniques in cluster computing systems,Cluster Computing 16 (2013) 3–15.
[5] D. C. Snowdon, E. L. Sueur, S. M. Petters, G. Heiser, Koala: a platformfor os-level power management, in: EuroSys, 2009, pp. 289–302.
[6] Y.-C. Lee, A.-Y. Zomaya, Energy conscious scheduling for distributed com-puting systems under different operating conditions, IEEE T Parall Distr22 (8) (2011) 1374 –1381.
27
[7] M. R. Garey, D. S. Johnson, Computers and Intractability, A Guide tothe Theory of NP-Completeness, W.H. Freeman and Company, New York,1979.
[8] D. Zhu, D. Moss, R. Melhem, Power-aware scheduling for and/or graphsin real-time systems, IEEE T Parall Distr 15 (2004) 849–864.
[9] Y. Zhang, X. S. Hu, D. Z. Chen, Task scheduling and voltage selectionfor energy minimization, in: Procs. of the 39th annual Design AutomationConference, DAC ’02, ACM, New York, NY, USA, 2002, pp. 183–188.
[10] G. Aupy, A. Benoit, Y. Robert, Energy-aware scheduling under reliabilityand makespan constraints, in: High Performance Computing (HiPC), 201219th International Conference on, Pune, India, 2012, pp. 1–10.
[11] L. Wang, S. Khan, D. Chen, J. Koodziej, R. Ranjan, C.-Z. Xu, A. Zomaya,Energy-aware parallel task scheduling in a cluster, Future Generation Com-puter Systems 29 (7) (2013) 1661–1670.
[12] S. Baskiyar, K. Palli, Low power scheduling of dags to minimize finishtimes, in: High Performance Computing - HiPC 2006, Vol. 4297 of LNCS,Springer Berlin / Heidelberg, 2006, pp. 353–362.
[13] S. Baskiyar, R. Abdel-Kader, Energy aware dag scheduling on heteroge-neous systems, Cluster Comput 13 (2010) 373–383.
[14] N. B. Rizvandi, J. Taheri, A. Y. Zomaya, Y. C. Lee, Linear combinations ofdvfs-enabled processor frequencies to modify the energy-aware schedulingalgorithms, in: Procs of the 10th IEEE/ACM CCGRID ’10, IEEE Com-puter Society, Washington, DC, USA, 2010, pp. 388–397.
[15] V. Shekar, B. Izadi, Energy aware scheduling for dag structured applica-tions on heterogeneous and dvs enabled processors, in: GREENCOMP ’10,IEEE Computer Society, Washington, DC, USA, 2010, pp. 495–502.
[16] M. Mezmaz, N. Melab, Y. Kessaci, Y. C. Lee, E. G. Talbi, A. Y. Zomaya,D. Tuyttens, A parallel bi-objective hybrid metaheuristic for energy-awarescheduling for cloud computing systems, J Parallel Distr Com 71 (2011)1497–1508.
[17] J. E. Pecero, P. Bouvry, H. J. F. Huacuja, S. U. Khan, A multi-objectivegrasp algorithm for joint optimization of energy consumption and schedulelength of precedence-constrained applications, in: DASC, IEEE, 2011, pp.510–517.
[18] K. Deb, S. Agrawal, A. Pratap, T. Meyarivan, A fast and elitist multiob-jective genetic algorithm: Nsga-ii, IEEE T Evolut Comput 6 (2) (2002)182–197.
28
[19] A. J. Nebro, J. J. Durillo, F. Luna, B. Dorronsoro, E. Alba, Design issuesin a multiobjective cellular genetic algorithm, in: EMO, 2006, pp. 126–140.
[20] E. Zitzler, S. Kunzli, Indicator-based selection in multiobjective search, in:PPSN, 2004, pp. 832–842.
[21] E. Alba, B. Dorronsoro, Cellular Genetic Algorithms, Vol. 42 of OperationsResearch/Computer Science Interfaces, Springer-Verlag Heidelberg, 2008.
[22] J. Durillo, A. Nebro, E. Alba, The jMetal framework for multi-objectiveoptimization: Design and architecture, in: CEC 2010, Barcelona, Spain,2010, pp. 4138–4325.
[23] O. Sinnen, Task Scheduling for Parallel Systems, John Wiley & Sons, Hobo-ken, NJ, USA, 2007.
[24] M. Guzek, C. O. Diaz, J. E. Pecero, P. Bouvry, A. Zomaya, Impact of volt-age levels number for energy-aware bi-objective dag scheduling for multi-processors systems, in: Advances in Information Technology, Vol. 344 ofCCIS, Springer, Berlin, Heidelberg, 2012, pp. 70–80.
[25] E. Falkenauer, Genetic Algorithms and Grouping Problems, John Wiley &Sons, Inc., England, 1997.
[26] J. E. Pecero, D. Trystram, A. Y. Zomaya, A new genetic algorithm forscheduling for large communication delays, Euro-Par ’09, Springer-Verlag,Berlin, Heidelberg, 2009, pp. 241–252.
[27] I. Ahmad, Y.-K. Kwok, M.-Y. Wu, Analysis, evaluation, and comparisonof algorithms for scheduling task graphs on parallel processors, in: ParallelArchitectures, Algorithms, and Networks, 1996. Proceedings., Second Int.Symposium on, Beijing, 1996, pp. 207–213.
[28] J. E. Pecero, B. Dorronsoro, M. Guzek, P. Bouvry, Memetic algorithms forenergy-aware computation and communications optimization in computingclusters, in: I. Ahmad, S. Ranka (Eds.), Handbook energy-aware and greencomputing, Chapman and Hall/CRC Press, 2012, pp. 443–473.
[29] H. Topcuoglu, S. Hariri, M.-Y. Wu, Performance-effective and low-complexity task scheduling for heterogeneous computing, IEEE T ParallDistr 13 (3) (2002) 260 –274.
[30] P. Winkler, Random orders, Order 1 (1985) 317–331.
[31] J. Knowles, L. Thiele, E. Zitzler, A Tutorial on the Performance Assess-ment of Stochastic Multiobjective Optimizers, TIK Report 214, ComputerEngineering and Networks Laboratory (TIK), ETH Zurich (Feb. 2006).
[32] D. A. Van Veldhuizen, Multiobjective evolutionary algorithms: classifica-tions, analyses, and new innovations, Ph.D. thesis, Wright Patterson AFB,OH, USA, adviser-Lamont, Gary B. (1999).
29
[33] A. J. Nebro, F. Luna, E. Alba, B. Dorronsoro, J. J. Durillo, A. Beham,Abyss: Adapting scatter search to multiobjective optimization, IEEE TEvolut Comput 12 (4) (2008) 439–457.
[34] K. Deb, et al., Multi-objective optimization using evolutionary algorithms,Vol. 2012, John Wiley & Sons Chichester, 2001.
[35] C. R. Reeves, J. E. Rowe, Genetic algorithms: principles and perspectives:a guide to GA theory, Vol. 20, Springer, 2003.
[36] E. A. Torres, S. Khuri, Applying evolutionary algorithms to combinatorialoptimization problems, in: Computational Science-ICCS 2001, Springer,2001, pp. 689–698.
[37] M. Friedman, The Use of Ranks to Avoid the Assumption of NormalityImplicit in the Analysis of Variance, Journal of the American StatisticalAssociation 32 (200) (1937) 675–701.
[38] M. Guzek, J. E. Pecero, B. Dorronsoro, P. Bouvry, S. U. Khan, A cellulargenetic algorithm for scheduling applications and energy-aware communi-cation optimization, in: HPCS’10, Caen, France, 2010, pp. 241–248.
30
Related Documents