Multinational enterprises, industrial relatedness and employment in European regions Nicola Cortinovis * ,† , Riccardo Crescenzi ** and Frank van Oort*** *Department of Human Geography and Spatial Planning, Utrecht University, Princetonlaan 8a, 3584 CB Utrecht, The Netherlands **Department of Geography and Environment, London School of Economics, Houghton Street, WC2A 2AE, UK ***Department of Applied Economics, Erasmus Universiteit Rotterdam, E building, Burgemeester Oudlaan 50, 3062 PA Rotterdam, The Netherlands † Correspondence to: email <[email protected]> Abstract This article investigates the link between multinational enterprises (MNEs) and em- ployment in their host regions by cross-fertilising the literature on MNE externalities with the emerging body of research on industrial relatedness. The link between em- ployment and MNE presence in the same and related industries is tested for European regions. The results suggest that cross-sectoral MNE spillovers are medi- ated through industrial relatedness and that they are positively and significantly asso- ciated with higher employment levels, independently of input–output relations. Our results indicate that regions characterised by lower factor prices are likely to benefit the most from the presence of multinationals in terms of employment, but these benefits are concentrated in high knowledge-intensive sectors, potentially fostering inequalities within less-developed economies. Keywords: Employment, foreign direct investment, relatedness, Europe, regions JEL classifications: O33, F22 Date submitted: 10 May 2019 Editorial decision: 3 April 2020 Date accepted: 8 April 2020 1. Introduction The capability of firms to control and organise their activities in multiple countries and the corresponding increase in global investment flows have fostered scholarly and policy debates on multinational enterprises (MNEs) and their effects on host economies (Narula and Dunning, 2000; Fu et al., 2011; Javorcik, 2013). These impacts have received signifi- cant attention in economics, economic geography and international business. Various con- tributions in these fields have highlighted a number of mechanisms through which MNEs, especially when pursuing knowledge-intensive and innovative activities in the host econ- omy (Javorcik et al., 2018), have a beneficial effect on domestic firms in terms of innov- ation and productivity. Based on this evidence, countries and regions across the globe have started to actively compete with each other in order to attract foreign investors (Bitzer et al., 2008; Harding and Javorcik, 2011; Narula and Pineli, 2016). At the same time, new empirical research has highlighted various potential ambiguities in the link be- tween MNE presence and local innovation, development and wealth, shedding new light on the pre-conditions for these positive effects to materialise (Go ¨rg and Greenaway, 2004; Crespo and Fontoura, 2007). # The Author (2020). Published by Oxford University Press. This is an Open Access article distributed under the terms of the Creative Commons Attribution License (http://creativecommons.org/licenses/by/4.0/), which permits unrestricted reuse, distribution, and reproduction in any medium, provided the original work is properly cited. Journal of Economic Geography 20 (2020) pp. 1165–1205 doi: 10.1093/jeg/lbaa010 Advance Access Published on 4 August 2020 Downloaded from https://academic.oup.com/joeg/article/20/5/1165/5880238 by London School of Economics user on 24 November 2020

Welcome message from author
This document is posted to help you gain knowledge. Please leave a comment to let me know what you think about it! Share it to your friends and learn new things together.
Transcript

Multinational enterprises, industrial relatednessand employment in European regionsNicola Cortinovis *,†, Riccardo Crescenzi ** and Frank van Oort***
*Department of Human Geography and Spatial Planning, Utrecht University, Princetonlaan 8a, 3584 CBUtrecht, The Netherlands**Department of Geography and Environment, London School of Economics, Houghton Street, WC2A 2AE,UK***Department of Applied Economics, Erasmus Universiteit Rotterdam, E building, Burgemeester Oudlaan 50,3062 PA Rotterdam, The Netherlands†Correspondence to: email <[email protected]>
AbstractThis article investigates the link between multinational enterprises (MNEs) and em-ployment in their host regions by cross-fertilising the literature on MNE externalitieswith the emerging body of research on industrial relatedness. The link between em-ployment and MNE presence in the same and related industries is tested forEuropean regions. The results suggest that cross-sectoral MNE spillovers are medi-ated through industrial relatedness and that they are positively and significantly asso-ciated with higher employment levels, independently of input–output relations. Ourresults indicate that regions characterised by lower factor prices are likely to benefitthe most from the presence of multinationals in terms of employment, but thesebenefits are concentrated in high knowledge-intensive sectors, potentially fosteringinequalities within less-developed economies.
Keywords: Employment, foreign direct investment, relatedness, Europe, regionsJEL classifications: O33, F22Date submitted: 10 May 2019 Editorial decision: 3 April 2020 Date accepted: 8 April 2020
1. Introduction
The capability of firms to control and organise their activities in multiple countries andthe corresponding increase in global investment flows have fostered scholarly and policydebates on multinational enterprises (MNEs) and their effects on host economies (Narulaand Dunning, 2000; Fu et al., 2011; Javorcik, 2013). These impacts have received signifi-cant attention in economics, economic geography and international business. Various con-tributions in these fields have highlighted a number of mechanisms through which MNEs,especially when pursuing knowledge-intensive and innovative activities in the host econ-omy (Javorcik et al., 2018), have a beneficial effect on domestic firms in terms of innov-ation and productivity. Based on this evidence, countries and regions across the globehave started to actively compete with each other in order to attract foreign investors(Bitzer et al., 2008; Harding and Javorcik, 2011; Narula and Pineli, 2016). At the sametime, new empirical research has highlighted various potential ambiguities in the link be-tween MNE presence and local innovation, development and wealth, shedding new lighton the pre-conditions for these positive effects to materialise (Gorg and Greenaway, 2004;Crespo and Fontoura, 2007).
# The Author (2020). Published by Oxford University Press.
This is an Open Access article distributed under the terms of the Creative Commons Attribution License (http://creativecommons.org/licenses/by/4.0/), which
permits unrestricted reuse, distribution, and reproduction in any medium, provided the original work is properly cited.
Journal of Economic Geography 20 (2020) pp. 1165–1205 doi: 10.1093/jeg/lbaa010Advance Access Published on 4 August 2020
Dow
nloaded from https://academ
ic.oup.com/joeg/article/20/5/1165/5880238 by London School of Econom
ics user on 24 Novem
ber 2020

Multinationals are often seen as key generators of innovation, accounting for a largeshare of global research and development (R&D) spending and possessing superior know-ledge on the true competitive advantage of their host countries vis-a-vis international mar-kets for specific products (Iammarino and McCann, 2013; Crescenzi et al., 2014; Javorciket al., 2018). Empirical evidence indeed suggests that multinationals do transfer knowledgeto their foreign affiliates (Arnold and Javorcik 2009; Brambilla, 2009; Guadalupe et al.,2012). Yet, spillover effects to domestic firms in host economies may still fail to material-ise or may even be negative. On the one hand, MNEs actively protect their knowledge inorder to minimise knowledge leakages in favour of domestic competitors (Alcacer andDelgado, 2016). On the other hand, competition from MNEs, both in the product and fac-tor markets, may lower productivity and innovation efforts in domestic firms (Aitken andHarrison, 1999). These mechanisms are typically used to explain the limited evidence forpositive horizontal (i.e. intra-industry) spillovers (Javorcik, 2004; Lin and Saggi, 2007;Havranek and Irsova, 2011; Javorcik et al., 2018). Differently, research has found strongersupport for vertical (i.e. inter-industry following the supply chain) externalities, which areconceptually justified by the higher incentives for multinationals to provide knowledgeand technological insights to their suppliers (backward spillovers) and their customers (for-ward spillovers; Lu et al., 2017).The aim of this article is to add to this debate from a different perspective and explore
the link between MNEs activities and local labour markets by cross-fertilising the MNEspillover literature with the growing body of research on industrial relatedness. A smallstream of literature has recently emerged on this subject, mainly focussing on the impactsof industrial or technological relatedness on domestic firm innovation in developing andtransition regions. Lo Turco and Maggioni (2019) show that the relatedness of the produc-tion portfolio of foreign firms correlates with the diversification into new products by do-mestic manufacturing firms in Turkish regions. They also observe a higher degree ofcomplexity for new products, but conditioned upon the presence of relevant absorptivecapacity of domestic firms. The article focuses on the entry of new industries in regionsas dependent variable (following Cortinovis et al., 2017) and argues, in line with Hidalgoet al. (2007), that developing economies like Turkey are often poorly diversified and theireconomy relies on a limited number of traditional products that offer a limited contributionto long-run economic growth. Following a similar approach, Zhu et al. (2017) look at theemergence of new sources of competitive advantage in manufacturing firms in Chinesedistricts. They show that technological relatedness to the local export mix interacts withinternal and external knowledge sources (including foreign direct investment (FDI)) to es-tablish new entry of products. Following a similar approach, Elekes et al. (2019) analysedforeign-owned firms as agents of structural change in Hungarian regions with similar con-clusions. However, these recent papers do not link their findings to economy-wide out-comes beyond the firm/industry level. Conversely, the analysis of regional employmentgrowth takes centre stage in Boschma and Iammarino (2009): using a relatedness frame-work they find that related regional imports play a particularly important role in Italy(while correlations with value-added growth and labour productivity are less robust). Morerecently, Elekes and Lengyel (2016) analysed regional employment growth contributionsof foreign and domestic firms. In a different conceptual framework, Waldkirch (2009)looks at the employment impact of FDI across sectors at the country level in Mexico.The analysis of the local employment consequences of MNE activities in a European-
wide regional perspective is still a largely under-explored area of research, notwithstandingits importance for public policies. The European Union is heavily relying on the concept
1166 � Cortinovis et al.
Dow
nloaded from https://academ
ic.oup.com/joeg/article/20/5/1165/5880238 by London School of Econom
ics user on 24 Novem
ber 2020

of relatedness (Thissen et al., 2013; McCann 2015) to underpin its innovation, SmartSpecialization and Cohesion Policy strategies. At the same time, policymakers are comingto the realisation that these strategies need to embrace the FDI and Global Value Chainsfully, understanding regional development as a (global) connectivity phenomenon(Crescenzi et al., 2018, 2019). Yet, coherent conceptualisations and robust empirical evi-dence at the regional level on the employment–FDI nexus are still missing. The lack ofconsensus in the existent literature on knowledge spillover effects from FDI is magnifiedwhen it comes to employment effects. Local employment effects are the balance betweencompetition effects and learning effects. Stronger competition might not only push weakerfirms out of the market—with significant employment losses—but might also foster capitalintensity in the most dynamic firms, outweighing direct job creation from new FDI.Knowledge spillovers might also improve the competitive profile of domestic firms withpositive effect on their expansion and growth (also in terms of employment), but domestictechnological upgrading might also lead to local job losses with the adoption of labour-saving technologies.Therefore, the analysis of local employment growth—the direct result of relatedness as
a means of knowledge transmission for MNEs—is a highly needed contribution to the lit-erature. The European Union (EU)—encompassing a wide range of territorial conditionsfrom less developed to frontier regions—offers an ideal testing ground for theory-drivenempirical analyses, making it possible to explore the heterogeneity of these links.In capturing local employment effects, the article furthers the current understanding of
the sectoral nature of MNE effects by adopting a relatedness perspective to capture broadsimilarities across industries, which we consider complementary to (vertical) input–outputlinkages1 traditionally explored in the literature. Considering that knowledge-intensiveindustries and product relatedness are generally associated with employment opportunities(Frenken et al., 2007), this article is first looking at sectoral employment in European sub-national regions in relation to MNE presence both within and across related sectors. Theanalysis also explores the heterogeneity of these relations with reference to industrialknowledge intensity and regional development levels, reflecting the large diversity of ab-sorptive and labour market conditions in the regions of Europe. The empirical analysis ofrelated sectors (either in its own right or in addition to input–output relations) as mediatorsof MNE employment effects has not been introduced before in an EU context, but mayprove beneficial for understanding spillovers and policy strategies when a convincing rela-tion is found. The existing literature has focused on individual emerging economies(Turkey in Lo Turco and Maggioni 2019; Hungary in Elekes and Lengyel , 2016, Elekeset al., 2019; and China in Zhu et al., 2017). In so doing, it has been able to leverage firm-and product-level microdata in a single country setting, to distinguish foreign vis-a-vis do-mestic firm transmission channels and capability measures and track structural change in adetailed manner. In this article, the focus is on industry-level employment effects where re-latedness acts as a mediator (and not as outcome variable as in the existing literature). Inaddition, by covering the EU in its entirety (and territorial diversity), this article can cap-ture a wider heterogeneity of effects. Finally, special attention is given to the identificationof these effects in order to exclude possible endogeneity.
1 As discussed by Hidalgo et al. (2007), relatedness captures different types of linkages and similarities driving theco-location of firms, in a way that may include but it is not limited to input–output relations. We argue and showin Table A2 in Appendix A that our relatedness measure encompasses more than input–output linkages.
MNEs, relatedness and employment � 1167
Dow
nloaded from https://academ
ic.oup.com/joeg/article/20/5/1165/5880238 by London School of Econom
ics user on 24 Novem
ber 2020

The empirical results show that positive and significant cross-sectoral employment effectfrom MNE activities materialise among related industries. This provides an initial confirm-ation to the idea that industrial relatedness—possibly encompassing but not limited to I-Orelations—is an important channel for employment-enhancing effects from MNE activitiesin European regions. While the use of relatively aggregated sectors at the EU regionallevel does not allow us to capture relatedness at a fine-grained level, the influence ofMNEs on related industries across two-digit NACE sectors, confirms the importance oflooking beyond vertical linkages when exploring the employment consequences of inter-nationalisation. These results, however, are contingent on the modelling of both regionaland industrial heterogeneity. In relation to regional and industrial heterogeneity, the resultssuggest, in line with previous studies (Bitzer et al., 2008; Fu, 2008; Fu et al., 2011), thatinter-industry effects are not negligible and tend to be stronger in relatively less-developedregions. To address potential sources of bias in our results, we perform various robustnesschecks: first, we apply a Bartik-type instrument (Ascani and Gagliardi, 2015; Crescenziet al., 2015), in combination with deep lags, to approximate the distribution of MNEsacross regions and sectors, while removing region–industry-specific characteristics; sec-ondly, we re-estimate our models considering only sectoral employment from domesticfirms (i.e. non-MNEs), as previous research showed that this is an important distinction inthe question where new varieties stem from and spill over into (Zhu et al., 2017; LoTurco and Maggioni, 2019). Both robustness checks confirm the validity of ourconclusions.The article is organised as follows. In Section 2, the relevant literature on MNE exter-
nalities, their preconditions and their intra- and inter-industrial scope is reviewed, in orderto derive four testable hypotheses in Section 3. Empirical strategy and data to test thesehypotheses are presented in Section 4. Results and robustness tests are discussed inSection 5. The final section acknowledges some key limitations of the article and presentspolicy implications and directions for further research.
2. MNE spillover literature
2.1. Ambiguity of MNE effects on domestic firms
MNEs are among the most important actors in the process of knowledge creation and dif-fusion. Thanks to their technological capabilities and their capacity to control activities inmultiple technological environments, MNEs can leverage their network of subsidiaries andexploit local knowledge resources in multiple locations (Narula and Dunning, 2000; Ernstand Kim, 2002; Iammarino and McCann, 2013). On this basis, foreign subsidiaries canbring about externalities for domestic firms, some of which may lead to higher domesticproductivity and (under certain circumstances) employment growth (Javorcik, 2013;Crescenzi et al., 2015).In the last decades, a significant body of research has studied the impact of MNE sub-
sidiaries on their host economy (Burger et al, 2013; Perri and Peruffo, 2016; Karremanet al, 2017), with multinational companies potentially affecting, either positively or nega-tively, the host country. Theoretical and empirical contributions have explored the differentchannels through which these impacts can unfold. First, local companies can learn andimitate the technologies and procedures used by MNEs (Ernst and Kim, 2002; Crespo andFontoura, 2007). In the same way, foreign MNE networks can also offer new insightsabout foreign market opportunities and relational channels, facilitating the
1168 � Cortinovis et al.
Dow
nloaded from https://academ
ic.oup.com/joeg/article/20/5/1165/5880238 by London School of Econom
ics user on 24 Novem
ber 2020

internationalisation of domestic firms (Gorg and Greenaway, 2004). Secondly, domesticfirms can acquire specialised knowledge by hiring workers previously employed by MNEs(Poole, 2013). Labour mobility, however, can also work in the opposite direction: MNEstend to offer higher wages than domestic ones, making them more attractive for the mosttalented workers in the local labour market (Javorcik, 2013). Thirdly, the increase in com-petition due to MNE entry can force domestic companies to become more efficient andmake better use of existing technologies and resources (Jacobs et al., 2014). However,competitive pressure might also be harmful: more advanced MNEs may push competitorsout of the market or induce local companies to operate on a smaller and less efficient scale(Fu et al., 2011).
2.2. Inter-industry effects: buyer–supplier linkages and industrial relatedness
In the quest for cross-sectoral MNE spillovers, most of the existing literature has identifiedinput–output relations as the main channel through which such effects materialise (Lin andSaggi, 2007; Perri and Peruffo, 2016; Lu et al., 2017). Vertical linkages to MNEs engen-der productivity-enhancing effects, for instance, through increased demand for local goodsor stronger competition for supplying multinationals (Javorcik, 2004, 2013; Alvarez andLopez, 2008; Crespo et al., 2009; Javorcik et al., 2018). Besides, to guarantee certain qual-ity or technical standards, foreign companies have the incentive to share knowledge withlocal producers (Ernst and Kim, 2002; Javorcik et al., 2018), through visits and periodicinspections or training programmes (Fu et al., 2011). Similar dynamics apply to forwardlinkages. By sourcing from MNEs, local firms may benefit from goods of higher qualityor technological sophistication, which in turn may streamline their production process, fos-tering efficiency and productivity (Crespo and Fontoura, 2007; Javorcik, 2004). Specificknowledge might also be acquired along with the good itself or via after-sale care or sup-port services.Whereas studies on within-industry spillovers often give inconclusive results (Fu et al.,
2011), significant evidence exists confirming the relevance of inter-industry effects(Kugler, 2006; Crespo et al., 2009; Javorcik, 2013; Javorcik et al., 2018). In general, theseanalyses suggest that backward linkages positively contribute to the increase in level ofproductivity within the local economy (Javorcik, 2004; Lin and Saggi, 2007; Bitzer et al.,2008; Crespo et al., 2009), with few exceptions (Damijan et al., 2003). Conversely, for-ward linkages do not have significant effects on local productivity (Crespo and Fontoura,2007).Within the debate on inter- and intra-sectoral MNE spillovers, types of linkages other
than input–output relations have received limited attention (some exceptions: Branstetter,2006; Kugler, 2006). This contrasts with other literatures, which consider a broader set ofdimensions through which industries might be connected. In the economic geography lit-erature, externalities emerge from the recombination of both proximate (Boschma, 2005;Frenken et al., 2007) and highly diverse types of knowledge (Jacobs, 1969; Glaeser et al.,1992). In these respects, the concept of relatedness aims at capturing how local know-ledge, technologies and assets influence the possibility of knowledge recombination anddiversification of the economy over time (Hidalgo et al., 2007). In other words, the oppor-tunities to diversify and operate in new (for the region) sectors depend on the industriesalready present in the economy: the more two sectors are related, the easier it is for firmsto re-deploy their assets, acquire new capabilities and move from one sector to the other(Hausmann and Klinger, 2007; Hidalgo et al., 2007; Boschma et al., 2013; Boschma and
MNEs, relatedness and employment � 1169
Dow
nloaded from https://academ
ic.oup.com/joeg/article/20/5/1165/5880238 by London School of Econom
ics user on 24 Novem
ber 2020

Capone, 2015; Cortinovis et al., 2017). The concept of relatedness thus synthesises the dif-ferent dimensions in which two sectors can be proximate, be it because of similar technol-ogies, skills or production processes, because of input–output relations, or because ofsimilar institutional arrangements (Hidalgo et al., 2007).Foreign-owned companies, with their ability to gather and use knowledge and technolo-
gies from different locations (Narula and Dunning, 2000; Iammarino and McCann, 2013;Crescenzi et al., 2015), may bring about significant cross-industrial knowledge flows out-side of their own supply chains. While more specialised knowledge is more difficult to beredeployed, this can still happen. For instance, technical expertise may provide valuableknowledge and insights to successfully operate in similar industries, as in the case of spin-off dynamics (Boschma and Wenting, 2007; Boschma and Frenken, 2011). On this basis,confining the impacts of MNEs within the boundaries of backward and forward linkagesmight offer at best a partial picture of the cross-sectoral spillovers.Based on the arguments and evidence outlined above, we propose that knowledge in
one sector can find useful applications also in different but related sectors, influencingtheir employment levels. Whereas this idea of industrial relatedness may encompass alsovertical linkages (Hidalgo et al., 2007), it specifically entails the possibility of knowledgespilling over to proximate sectors outside the supply chain. The channels for knowledgespillovers already identified in the literature, such as labour mobility, demonstration effectsor other informal linkages (Ernst and Kim, 2002; Perri and Peruffo, 2016), can thus beexpected to work not only within vertical relations, but also by connecting different buttechnologically or cognitively similar industries.If knowledge flows across industries are key to understand the diffusion of MNE effects
into domestic firms, the overall employment implications of these effects have remainedlargely unexplored in the existing literature. The ambiguity of the MNE direct local em-ployment effects discussed in the previous section is mirrored by the ambiguity in the dif-fusion of local employment effects across sectors. It remains empirically under-exploredhow competitive pressures from MNEs coupled by the diffusion of efficiency-enhancingpractices (reducing employment in domestic firms) might be counter-balanced byemployment-enhancing effects associated with higher demand (domestic and through theopening of new export markets), lower input costs, diversification into related but locallyunexplored markets, and product and value chain upgrading.2
2.3. Heterogeneity in MNE effects
The existing literature has highlighted how local conditions and MNE characteristics mayaffect the ability of domestic firms to benefit (or not) from the presence of foreign compa-nies (Ernst and Kim, 2002; Perri and Peruffo, 2016). Productivity and knowledge spill-overs are found to be more marked in economies with higher levels of development(Crespo and Fontoura, 2007; Meyer and Sinani, 2009), whereas the picture is more mixedfor transition and developing economies (Gorg and Greenaway, 2004; Bitzer et al., 2008;Javorcik, 2013). This relation between local development and MNE spillovers depends,however, on more fundamental factors, affecting the ability of domestic firms to benefitfrom MNE presence (Fu et al., 2011).
2 MNEs may influence industrial employment both directly (e.g. through demand effects, attracting and formingskilled labour, etc.) and indirectly (e.g. stimulating firm entry, innovation, etc.). Given our empirical approachand the nature of our data, we cannot disentangle these effects more specifically.
1170 � Cortinovis et al.
Dow
nloaded from https://academ
ic.oup.com/joeg/article/20/5/1165/5880238 by London School of Econom
ics user on 24 Novem
ber 2020

Among the factors, ranging from institutional and social features (Cipollina et al., 2012;Karreman et al., 2017) to MNE characteristics (Beugelsdijk et al., 2008; Neto et al.,2008), which mediate MNE presence and its effects, one of the most relevant is thetechnological gap between local firms and multinationals. In these respects, whereaslarger differences in terms of technological endowment between domestic and foreignfirms entail greater room for learning, a larger gap also entails greater investment and risk,making the assimilation of insights, processes and technologies more difficult (Kokko,1994; Boschma, 2005; Javorcik et al., 2018). Relatedness in terms of co-occurring sectoralspecialisations, shared labour inputs and skills potentially facilitates the assimilationprocess.A second critical factor mediating externalities from foreign MNEs and domestic per-
formance is ‘absorptive capacity’ (Narula and Dunning, 2000; Blomstrom and Kokko,2003), conceptualised as the stock of prior knowledge (Cohen and Levinthal, 1990). Thefact that firms with stronger absorptive capacity have a greater potential to benefit fromMNE spillovers suggests that certain industries might have a greater potential to benefitfrom MNE activities. Given the greater knowledge intensity of advanced industries, boththeory and empirics suggest that MNE have stronger positive impacts in more knowledge-intensive sectors (Crespo and Fontoura, 2007; Fu et al., 2011). Conversely, in low-knowledge-intensive sectors competition effects from MNEs might prevail over learninggenerating a negative effect on domestic activity and employment.
3. Research setting
The literature on multinational corporations and their effects on the local economy havewitnessed an upsurge in recent years. However, as highlighted in the critical review of theexisting evidence, some significant knowledge gaps still exist.First, existing research has devoted limited attention to the local domestic employment
consequences of MNE entry. From a conceptual standpoint, MNEs generate employment-enhancing opportunities for domestic firms but they also increase competitive pressures(on both the product and the factor markets) and tend to boost capital deepening and prod-uctivity at the expenses of local jobs. The overall net balance in terms of employment indomestic firms has remained under-explored.Secondly, theoretical and empirical research suggests the existence of both intra- and
inter-sectoral spillovers. Existing evidence suggests that the former are weaker given thatMNE actively limits knowledge leakages to potential competitors. The latter type ofeffects—referring to spillovers spanning across industrial sectors—are instead associatedwith knowledge diffusion along the value and supply chain and have found strong empir-ical support. However, as the majority of research has concentrated on input–output rela-tions as channels for spillovers, the broader linkages related to industrial proximity havebeen overlooked. Differently from previous contributions, we argue that insights, technolo-gies and workers from MNE can also flow to industries that are not connected via verticallinkages but similar in terms of productive processes, skills, competences and knowledgeassets.Thirdly, because such industrial relatedness co-evolves with sectoral diversity more nat-
urally than with specialisation, beneficial effects are expected for employment (related toearly-stage product innovation) rather than for productivity (due to later-stage process in-novation; Abernathy and Clark, 1985). In other words, similar to the mechanisms behind
MNEs, relatedness and employment � 1171
Dow
nloaded from https://academ
ic.oup.com/joeg/article/20/5/1165/5880238 by London School of Econom
ics user on 24 Novem
ber 2020

related variety (Frenken et al., 2007), relatedness-mediated spillovers are likely to mostlyimpact the level of employment. Even though this reasoning strongly resonates with thetraditional arguments on agglomeration economies, only a very limited literature (andnone on an EU-wide scale) considered the role of industrial relatedness in MNE spilloversand its potential employment effects.Fourthly, the effects of MNEs on domestic firms are mediated and influenced by local
characteristics (Ernst and Kim, 2002; Gorg and Greenaway, 2004; Meyer and Sinani,2009). The characteristics of the local labour markets in which both MNEs and domesticfirms operate—in terms of human capital, knowledge or institutional conditions—shapethe nature and magnitude of the employment effects. Local economic conditions affectboth the creation of new jobs in response to job-enhancing shocks due to MNE entry andthe capability of the local economy to absorb job losses (due to job-adverse effects of in-coming MNEs). Given the considerable differences in terms of sectoral composition, in-dustrial sophistication and overall level of development across European regions (Annoniet al., 2017), our work aims at disentangling the heterogeneity of effects of foreign compa-nies on the domestic regional economy.Based on these considerations, we develop four hypotheses on the employment effects
of multinational corporations on industries in European regions. In our baseline models,we want to study the intra-industry role of MNE presence on local sectoral employment.Whereas it is difficult to formulate a priori expectations given the ambiguity in previouscontributions, we envisage sectors with higher presence of foreign companies may performbetter due to intra-industries externalities.
Hypothesis 1: The level of employment in a given sector and region is positively related to thepresence of MNEs in the same sector–region.
As argued in the previous sections, the main focus of this article is on industrial related-ness and its ability to mediate MNE spillovers across sectors, shaping employment levels.Combining the literature on inter-industry MNE spillovers, diversity externalities (Jacob,1969; Glaeser et al., 1992; Frenken et al., 2007) and relatedness (Boschma, 2005; Hidalgoet al., 2007), in Hypothesis 2, we theorise that knowledge spillovers from foreign compa-nies affect employment in sectors related to that of the MNE.
Hypothesis 2: The level of employment in a given sector and region is positively related to thepresence of MNEs in related industries in the same region.
Our final two hypotheses deal with regional and industrial heterogeneity in our sample.Knowledge assets and absorptive capacity are necessary for benefitting from foreign com-panies (Gorg and Greenaway, 2004; Crespo and Fontoura, 2007; Fu et al., 2011). Againstthis background, we expect that relations to MNEs, both within the same industry and inrelated sectors, will have a stronger effect in more knowledge-intensive industries, as theyare better equipped in terms of human capital and R&D resources and therefore in a stron-ger position to benefit in terms of employment from MNE presence.
Hypothesis 3: The effects of MNE presence on employment, both within-industry and across-industry, are stronger for knowledge-intensive industries in the target region.
Finally, the effects of MNEs have been shown to depend on the level of development ofthe target area, with firms in less-developed regions benefitting more from foreign compa-nies (Crespo and Fontoura, 2007; Javorcik, 2013). Whereas our sample gathers relativelydeveloped economies, significant regional differences persist in the EU, with Southern
1172 � Cortinovis et al.
Dow
nloaded from https://academ
ic.oup.com/joeg/article/20/5/1165/5880238 by London School of Econom
ics user on 24 Novem
ber 2020

(less growing) and Central Eastern European regions (less developed) being on averageless prosperous than Western ones. On these bases, we hypothesise that:
Hypothesis 4: The effects of MNE presence on employment, both within-industry and across-industry, are heterogenous depending on the level of development of the target region.
4. Models, methods and data
4.1. Modelling framework
This article studies short-term effects of MNE presence, both within the same industriesand in related ones, on employment in the sectors within regions. The empirical investiga-tion of this relationship poses a number of challenges from an econometric point of view,both in terms of capturing the effects on related industries, and due to endogeneity and re-verse causality. In this section, we discuss our modelling choices, providing more detailson endogeneity while discussing the econometric application of this article.In Model 1, employment in each sector–region is modelled as a function of the number
of MNEs active in the region/sector in the previous year as specified in Equation (1).
yi;r;t ¼ ai;r þ st þ dMNEnumi; r; t � 1þ knoMNEi; r; t � 1þ cControli:r;t�1 þ ei;r;t; (1)
where yi;r;t stands for the level of employment (in logs) in sector i, in region r at time t,MNE represents the log count of MNE3 at time t � 1, while noMNE is a dummy variablewith value 1 when no foreign company is present in sector i, in region r at time t � 1.Our model includes also control variables (Control) as well as sector–region (ai;r) andyearly (st) fixed effects. Along with sector–region and yearly fixed effects, we thus controlfor within-region dependence in the error terms and potential heteroscedasticity by usingrobust and regionally clustered errors.Testing for Hypothesis 2, requires an extension of the baseline model discussed above, so
to include the terms for capturing MNE presence in related industries. In the case of Model2, the variable MNEnum is interacted with the proximity matrix W to generate MNEnumrel.This matrix, as explained in the following sections, captures industrial proximity betweenindustries based on the co-occurrence of pairwise sectoral specialisation.
yi;r;t ¼ ai;r þ st þ d MNEnumi; r; t � 1þ q MNEnumreli;r;t�1 þ k noMNEi; r; t � 1þ c Controli:r;t�1 þ ei;r;t; (2)
Finally, we test for Hypotheses 3 and 4 by splitting the sample according to differenttypes of sectors and regions. In other words, the same models will be estimated separatelyfor advanced manufacturing industries,4 knowledge-intensive services and low-knowledgesectors, as well as for more prosperous EU regions and for less-developed EU regions.
4.2. Methodology
This article aims to test whether MNE regional employment effects are perceived acrossindustries, based on a measure of pairwise industrial proximity.
3 As discussed more thoroughly in the section on data and in Appendix D, our dataset captures the presence of for-eign firms, both via M&A and greenfield foreign direct investments.
4 See Appendix B for details on the subdivision of sectors and regions in different categories.
MNEs, relatedness and employment � 1173
Dow
nloaded from https://academ
ic.oup.com/joeg/article/20/5/1165/5880238 by London School of Econom
ics user on 24 Novem
ber 2020

To do so, we apply the concept of relatedness proposed by Hidalgo et al. (2007), fol-lowing a method proposed by Van Eck and Waltman (2009) and refined by Steijn (2016).These methods allow us to create a measure of similarity across industries at the two-digitof NACE classification. To perform these calculations, we used data on sectoral employ-ment in 2006 from the Bureau Van Dijk Orbis database (cf. Variables and Data inAppendix D). Since our analysis will focus on the period 2008–2013, we choose to useonly data from 2006 in order to reduce possible endogeneity.Following Hidalgo et al. (2007), we start by defining the sectors in which each region
is specialized. We consider region r to be specialised in sector i when it’s location quotientfor that sector is larger than 1. In more formal terms:
LQir ¼Eir=E�rEi�=E��
� �; (3)
and
xi;r ¼1; if LQir > 1
0; otherwise
8<: (4)
Once the sectoral measure of specialisation is computed, we count how many regionsare jointly specialised in sectors i and j. We then consider i and j related if the two indus-tries tend to systematically co-locate. Our measure of relatedness is calculated as the ratiobetween the observed co-occurrences and a random benchmark (Van Eck and Waltman,2009).5 Equation 5 represents formally the computation performed:
uij ¼cij
SiT
� �� Sj
T�Si
� �þ Sj
T
� �� Si
T�Sj
� �� �� T
2
� ; (5)
where cij is the co-occurrence count of specialisations in sectors i and j, Si and Sj are thetotal number of occurrences of i and j, respectively, and T is the total number of occur-rences of any sector. In the equation, the nominator is equal to the number of times (i.e.in how many regions) specialisations in i and j occur together, while the denominatorcomputes the number of co-occurrences under the assumption of the i and j areindependent.The result of Equation 5 is a n� n W matrix, with n being the number of sectors in our
sample. Each cell in W contains the relatedness score between two sectors, with eachvalue ranging between 0 and infinity and taking value 1 when the expected number of co-occurrences is the same as expected under the random scenario. In order to capture theeffects of strong relatedness across sectors, we exclude cells in the main diagonal of Wand we set to 0 the cells with relatedness less or equal to 1 (i.e. pairs of industries whichoccur less or as frequently as at random). Finally, we rescale the values of the matrix tomake them range between 0 and 1. Simply multiplying the relatedness matrix W and the
5 Appendix E discusses and motivates in more detail our choice vis-a-vis possible alternative options (e.g. standardHidalgo relatedness, Hidalgo relatedness based on bootstrapping procedure). In Appendix E, we also show thatour results are consistent across several specifications of the relatedness matrix.
1174 � Cortinovis et al.
Dow
nloaded from https://academ
ic.oup.com/joeg/article/20/5/1165/5880238 by London School of Econom
ics user on 24 Novem
ber 2020

sectoral vectors of MNEnum in each region, we generate the variable MNEnumrel, capturingrelatedness-mediated effects of MNE presence. More formally:
MNEnumreli;r;t ¼Xj 6¼i
ui;j�MNEnumj; r; t: (6)
The main intuition behind the construction of this indicator is the same as the one usedin spatial econometrics for computing spatial lag variables (LeSage, 2014), with ourweights capturing proximity in the industrial space rather than geographical distance. Inother words, MNEnumreli;r;t captures how exposed sector i, in region r at time t is toMNEs in related industries. Intuitively, the more exposed the sector is, the larger the chan-ces of spillover effects from MNEs. While different in the method, this approach is con-ceptually close to the work of Cicerone et al. (2019 on Italian provinces.In Figure 1, we give a direct representation of the relatedness measure captured by W.
In Figure 1, each node represents one of the 68 industries we collected data for, and theposition relative to the other nodes is based on the pairwise relatedness scores (Hidalgoet al., 2007). As shown in the legend, round nodes are low-knowledge industries (LKI),whereas square nodes represent most advanced sectors. Each of the nodes is colouredaccording to the first-digit NACE sector it belongs to. As Figure 1 clearly highlights, sec-tors are not homogeneously related one to each other. Square nodes have sorted them-selves in the bottom-left side of the graph, where the network relations appear to bedense. This indicates that knowledge-intensive industries tend to be more closely relatedwith each other and less with medium- and lower-knowledge-intensive sectors.Figure 1 thus gives some preliminary support to the idea that spillover effects may be
stronger within the knowledge-intensive part of the economy (to be tested with Hypothesis3) compared to spillovers across sectors with various degrees of knowledge intensity. Amirroring pattern emerges on the top-right part of the graph, where mostly low-knowledge-intensive manufacturing industries locate. In spite of the fact that lowerknowledge-intensity of these industries may limit MNE externalities, also in this case, theconfiguration suggests opportunities for cross-sectoral spillovers.
4.3. Variables and data
In order to construct our dataset, we resort to different data sources, namely Eurostat,Cambridge Econometrics (CE) and Bureau Van Dijk (BVD). Table 1 reports the sources,period and descriptive statistics of the variables (pairwise correlation among variablesreported in Table A3 in Appendix B). More details on the sectors and regions included inthis study are in Appendix B, while an overview on the data cleaning process for BVDdata is provided in Appendix D (Kalemli-Ozcan et al., 2015).As shown in Table 1, we resort to official data for computing our dependent variable,
Empl (ln). The Structural Business Survey (SBS) of Eurostat provides information for 68two-digit sectors on characteristics, among which the number of employees. Whereas mostof the literature focuses on (total factor) productivity as dependent variable (Javorcik,2004; Altomonte and Pennings, 2009; Beugelsdijk et al., 2008), we argued that employ-ment is appropriate for analysing innovative crossover opportunities between sectors indiversified economies that are prone to spillovers from MNEs in the EU (Frenken et al.,2007; Content and Frenken, 2016). Besides, the gap in the literature on the relation be-tween MNEs and the local employment balance, the policy relevance of MNE employ-ment effects in a context of economic turmoil and a wave of potential relocation of
MNEs, relatedness and employment � 1175
Dow
nloaded from https://academ
ic.oup.com/joeg/article/20/5/1165/5880238 by London School of Econom
ics user on 24 Novem
ber 2020

international businesses following Brexit (Chen et al., 2017) makes the use of employmentas the dependent variable particularly interesting and relevant.The main variables of interests in our article are three. As a measure of the presence of
MNE in a given sector, we use a count variable (in logs) for the number of foreign-owned
Figure 1. Network representation of relatedness.
Table 1. Descriptive statistics
Variables Source N Mean SD Min Max
Empl (ln) Eurostat 92,309 7.729 1.822 0 13.13MNE_num (ln) BVD 138,528 1.108 1.377 0 8.214MNE_num_rel (ln) BVD 138,528 8.116 6.292 0 46.93MNE_num_bl (ln) BVD 138,528 1.453 1.022 0 5.328MNE_num_fl (ln) BVD 138,528 1.384 0.961 0 5.431No_MNE (dummy) BVD 138,528 0.337 0.473 0 1HK_tert Eurostat 136,960 0.122 0.0449 0.0366 0.328TotR&D Eurostat 137,520 1.526 1.229 0.0600 11.36GDP (ln) Eurostat 136,960 3.353 0.984 0.0751 6.242Firm_num (ln) Eurostat 98,014 5.466 2.003 0 11.81PhK (ln) CE 136,552 5.273 0.602 0.284 7.029MNE_num_sp (ln) BVD 138,528 69.34 37.95 0 230.9iv_b_nor_eu BVD 138,528 12.98 49.33 0 2436rel_iv_b_nor_eu BVD 138,528 96.37 130.1 0.299 1555dl_log_f10 BVD 69,264 1.048 1.339 0 8.070dl_rel_log_f10 BVD 69,264 7.676 6.039 0 43.34Period 2008–2013
1176 � Cortinovis et al.
Dow
nloaded from https://academ
ic.oup.com/joeg/article/20/5/1165/5880238 by London School of Econom
ics user on 24 Novem
ber 2020

companies operating (MNE_num (ln) in Table 1).6 As explained above, MNE_num_relreflects the interaction of MNE_num with the relatedness matrix W, and it captures theeffects due to the presence of foreign companies in related industries. Whereas no explicithypothesis applies to No_MNE,7 the coefficient for this dummy variable can be consideredof interest because it captures the average effect of hosting no foreign company.As mentioned in the presentation of Equations (1) and (2), our models include various
control variables. HK_tert and TotR&D control for the knowledge endowment of each re-gion (Crespo and Fontoura, 2007; Fu et al., 2011): the former is computed as the share ofemployees having obtained tertiary education over the working age population; the latteris the percentage of total R&D expenditure over regional GDP. Similarly, we included thelevel of GDP of the region (GDP (ln)) to control for the economic size of the region.Whereas these three variables are measured at regional level, PhK is measured for the six‘macro’ sectors available from CE. Finally, in order to control for local agglomerationeconomies and spatial effects, we include two variables. For each two-digit NACE indus-try, we include the log number of local units (Firm_num (ln)) to capture within-region ag-glomeration effects. Besides, we capture possible cross-regional effects by including thetotal number of MNEs (i.e. all MNEs across all industries) in the neighbouring regions(MNE_num_sp (ln); Alfaro and Chen, 2014). Specifically, we compute the average of thetotal number of MNEs in regions sharing a border with the focal region r (LeSage, 2014).
5. Econometric analysis
The results from our baseline models are reported in Tables 2 and 3. In the tables, theheading of each column indicates whether the coefficients refer to the economy as a whole(All), to low- LKI, to high-knowledge industries (HKI)8 or to knowledge-intensive busi-ness services (KIBS). KIBS are important knowledge-intensive facilitators of growth(Jacobs et al., 2014; Content et al., 2019) as well as generators of high-quality high-value-added jobs, which makes this group of industries interesting to focus on specifically.The heading also specifies whether the estimates refer to the whole sample, more
advanced regions (with GDP per capita above the EU average in 2010) or less advancedareas (with GDP per capita below the EU average in 2010). The estimates reported inTable 2 confirm our Hypotheses 1, 3 and 4. More specifically, a high presence of foreigncompanies at time t � 1 is associated with a high level of employment at time t withinthe same sector. The coefficients for the variable MNE_num are positive and significant
6 We opt for using the log count of MNEs rather than the share for two main reasons. First, using shares may in-duce a downward bias in our estimates as suggested by Aitken and Harrison (1999) and discussed in Castellaniand Zanfei (2006). To the extent that domestic firms are more susceptible to economic downturns, it would belikely to induce an increase in the share of MNEs (due to a lower denominator) with lower employment levels.Secondly, previous contributions (Altomonte and Pennings, 2009) suggest the effect of MNEs is not linear andthat the effect of one additional MNE differs when moving from 0 to 1 MNEs than when moving from 100 to101 MNEs. Log-transforming the variable helps accounting for such ‘diminishing returns’.
7 The log transformation of our variable of interest would imply that region-sector observations with 0 MNEwould get a missing value. After taking the logs we replace these missing values with 0, and create the No_MNEdummy to identify ‘true zeros’ (those industry–region observations with 0 MNE) from the cases of region–sec-tors with only 1 MNE (which become 0 once we log-transform them). We consider this a better approach to thelogþ1 strategy, which effectively creates a bias in the estimations. Our results are nonetheless consistent whenwe use either logþ1, share of MNEs over total firms, share of MNE employment over total employment as meas-ures of exposure to multinationals. For sake of brevity, the results using these alternative approaches are availableon request to the authors.
8 HKI include both more advanced manufacturing and knowledge-intensive business services.
MNEs, relatedness and employment � 1177
Dow
nloaded from https://academ
ic.oup.com/joeg/article/20/5/1165/5880238 by London School of Econom
ics user on 24 Novem
ber 2020

Tab
le2.
Model
1—intra-industry
effectsof
MNEpresence
Whole
sample
LKI
HKI
KIBS
(1)
(2)
(3)
(4)
(5)
(6)
(7)
(8)
(9)
(10)
Variables
Employment
—All
Employment
Employment
—above
av.Reg.
Employment
—below
av.Reg.
Employment
Employment
—above
av.Reg.
Employment
—below
av.Reg.
Employment
Employment
—above
av.Reg.
Employment
—below
av.Reg.
MNE_num
(ln)
0.0427***
0.0266**
0.0149
0.0325*
0.0744***
0.0446**
0.0935***
0.0736***
0.0435*
0.0940***
(0.0113)
(0.0113)
(0.0134)
(0.0170)
(0.0164)
(0.0199)
(0.0234)
(0.0177)
(0.0232)
(0.0253)
No_MNE
(dum
my)
�0.0127
�0.00301
0.0163
�0.0174
�0.0259*
�0.0233
�0.0257
�0.0162
�0.0121
�0.0208
(0.0130)
(0.0199)
(0.0247)
(0.0291)
(0.0143)
(0.0247)
(0.0177)
(0.0169)
(0.0288)
(0.0209)
HK_tert
0.952***
1.063***
0.866**
1.311**
0.947**
0.861*
0.960
1.096**
1.227**
0.926
(0.340)
(0.374)
(0.408)
(0.608)
(0.458)
(0.485)
(0.760)
(0.523)
(0.556)
(0.912)
TotR&D
0.0107
0.00833
0.0149
�0.00159
0.0130
0.0319**
�0.0115
0.00511
0.0191*
�0.0128
(0.00915)
(0.00869)
(0.0107)
(0.0105)
(0.0121)
(0.0132)
(0.0158)
(0.0112)
(0.00988)
(0.0189)
GDP(ln)
0.393***
0.424***
0.485***
0.392**
0.278
0.461***
0.212
0.258
0.506**
0.155
(0.137)
(0.135)
(0.133)
(0.166)
(0.173)
(0.162)
(0.218)
(0.159)
(0.213)
(0.204)
PhK
(ln)
0.0763***
0.0484**
0.0768*
0.0345
0.128***
0.0919**
0.133***
0.173***
0.0974**
0.191***
(0.0198)
(0.0220)
(0.0415)
(0.0273)
(0.0325)
(0.0356)
(0.0447)
(0.0448)
(0.0481)
(0.0631)
Firm_num
(ln)
0.0940***
0.0748***
0.0560***
0.0964***
0.138***
0.0950***
0.180***
0.169***
0.128***
0.192***
(0.00800)
(0.00765)
(0.00745)
(0.0127)
(0.0133)
(0.00903)
(0.0180)
(0.0194)
(0.0184)
(0.0238)
MNE_num
_sp
(ln)
0.00419***
0.00210***
0.00368***
0.00108
0.0114***
0.0132***
0.00915***
0.0106***
0.0127***
0.00876***
(0.000742)
(0.000782)
(0.00106)
(0.00109)
(0.00207)
(0.00335)
(0.00262)
(0.00221)
(0.00295)
(0.00310)
Observations
75,547
46,501
18,535
27,966
29,046
12,235
16,811
20,732
8776
11,956
R2
0.026
0.024
0.021
0.027
0.038
0.042
0.041
0.040
0.048
0.040
Num
berof
id15,515
9574
3770
5804
5941
2474
3467
4233
1773
2460
Sector_
region
FE
Yes
Yes
Yes
Yes
Yes
Yes
Yes
Yes
Yes
Yes
YearFE
Yes
Yes
Yes
Yes
Yes
Yes
Yes
Yes
Yes
Yes
Notes:Clustered
standard
errors
inparentheses.
***p<0.01,**p<0.05,*p<0.1.
1178 � Cortinovis et al.
Dow
nloaded from https://academ
ic.oup.com/joeg/article/20/5/1165/5880238 by London School of Econom
ics user on 24 Novem
ber 2020

Tab
le3.
Model
2—Intra-
andinter-industry
effectsof
MNEpresence
Whole
sample
LKI
HKI
KIBS
(1)
(2)
(3)
(4)
(5)
(6)
(7)
(8)
(9)
(10)
Variables
Employment
—All
Employment
Employment
—above
av.Reg.
Employment
—below
av.Reg.
Employment
Employment
—above
av.Reg.
Employment
—below
av.Reg.
Employment
Employment
—above
av.Reg.
Employment
—below
av.Reg.
MNE_num
(ln)
0.0299***
0.0193*
0.0187
0.0179
0.0566***
0.0478**
0.0632***
0.0577***
0.0503**
0.0641***
(0.00898)
(0.0103)
(0.0133)
(0.0151)
(0.0134)
(0.0201)
(0.0181)
(0.0151)
(0.0233)
(0.0201)
MNE_num
_rel(ln)
0.0248***
0.0163**
�0.00947
0.0326***
0.0277**
�0.00514
0.0495***
0.0232**
�0.0102
0.0462***
(0.00823)
(0.00734)
(0.00776)
(0.00987)
(0.0110)
(0.00781)
(0.0166)
(0.0110)
(0.00840)
(0.0176)
No_MNE
(dum
my)
�0.0118
�0.00232
0.0160
�0.0157
�0.0252*
�0.0236
�0.0259
�0.0162
�0.0126
�0.0225
(0.0130)
(0.0199)
(0.0246)
(0.0291)
(0.0143)
(0.0246)
(0.0176)
(0.0169)
(0.0288)
(0.0208)
HK_tert
0.823**
0.977***
0.947**
1.250**
0.801*
0.895*
0.825
0.976*
1.297**
0.824
(0.345)
(0.370)
(0.393)
(0.609)
(0.464)
(0.493)
(0.760)
(0.517)
(0.568)
(0.912)
TotR&D
0.0110
0.00861
0.0148
�0.000335
0.0132
0.0320**
�0.00880
0.00541
0.0194*
�0.00939
(0.00906)
(0.00869)
(0.0107)
(0.0106)
(0.0119)
(0.0133)
(0.0158)
(0.0108)
(0.0101)
(0.0188)
GDP(ln)
0.378***
0.414***
0.485***
0.374**
0.264
0.458***
0.181
0.243
0.498**
0.120
(0.135)
(0.134)
(0.132)
(0.163)
(0.170)
(0.163)
(0.214)
(0.158)
(0.215)
(0.205)
PhK
(ln)
0.0753***
0.0481**
0.0773*
0.0378
0.126***
0.0913**
0.133***
0.173***
0.0940*
0.188***
(0.0196)
(0.0222)
(0.0416)
(0.0280)
(0.0314)
(0.0355)
(0.0424)
(0.0438)
(0.0476)
(0.0600)
Firm_num
(ln)
0.0935***
0.0746***
0.0555***
0.0940***
0.137***
0.0946***
0.173***
0.166***
0.128***
0.184***
(0.00760)
(0.00760)
(0.00756)
(0.0127)
(0.0123)
(0.00926)
(0.0149)
(0.0179)
(0.0184)
(0.0202)
MNE_num
_sp
(ln)
0.00423***
0.00215***
0.00364***
0.00111
0.0114***
0.0132***
0.00919***
0.0110***
0.0125***
0.00960***
(0.000740)
(0.000782)
(0.00106)
(0.00109)
(0.00207)
(0.00335)
(0.00260)
(0.00217)
(0.00296)
(0.00303)
Observations
75,547
46,501
18,535
27,966
29,046
12,235
16,811
20,732
8776
11,956
R2
0.027
0.024
0.021
0.028
0.040
0.042
0.044
0.041
0.048
0.043
Num
berof
id15,515
9574
3770
5804
5941
2474
3467
4233
1773
2460
Sector_
region
FE
Yes
Yes
Yes
Yes
Yes
Yes
Yes
Yes
Yes
Yes
YearFE
Yes
Yes
Yes
Yes
Yes
Yes
Yes
Yes
Yes
Yes
Notes:Clustered
standard
errors
inparentheses.
***p<0.01,**p<0.05,*p<0.1.
MNEs, relatedness and employment � 1179
Dow
nloaded from https://academ
ic.oup.com/joeg/article/20/5/1165/5880238 by London School of Econom
ics user on 24 Novem
ber 2020

across the different types of sectors. However, the size of the coefficients changes whenthe analysis is performed across different groups of industries: the effect of MNEs on localemployment more than doubles when moving from less advanced industries (Table 2, column2) to high-knowledge ones and knowledge-intensive services (Columns 5 and 8). As theorisedin Hypothesis 3, more knowledge-intensive parts of the economy are more strongly influencedby the presence of foreign companies and are also more prone to expand their employmentlevels in response to the new competitive and knowledge landscape. At the same time, sectorsthat host no foreign company do not seem to do significantly worse than the others. The coef-ficients for No_MNE are in fact negative, though only one of them is significantly differentfrom zero. With respect to Hypothesis 4 and regional heterogeneity, the results of the baselinemodel suggest a stronger intra-industry effect of MNE in less advanced regions. Finally,whereas different control variables did not produce significant coefficients, the levels of invest-ments (PhK) and of sectoral level agglomerations (Firm_num) are both strongly associatedwith higher regional employment rates, as expected.We investigate the role of industrial relatedness as a mediator for MNE employment
effects in our last two models. Table 3 reports the estimated coefficients for Equation (2).The estimates reported in the columns of Table 3 highlight heterogeneity in the relation
between the presence of foreign companies and their employment effects on the hostingeconomy. Hypothesis 1 finds further support, as MNE_num remains positive and significantin most of the specifications. The differences in terms of the size of the coefficients betweenmore and less advanced EU regions and between more and less knowledge-intensive indus-tries remain unchanged. The coefficients reported in Table 3 relative to the effect of MNEpresence in related industries also provide valuable insights: the number of foreign compa-nies from related industries appears to significantly impact sectoral employment.Remarkably, as for the results for MNE_num, also MNE_num_rel indicates a stronger effectof MNE presence in related industries in the case of most knowledge-intensive sectors. Inline with Hypothesis 4, the effect of multinationals in related industries appears to be mostlydriven by less-advanced regions: the coefficients for MNE_num_rel are always positive sig-nificant except in the case of regions with above-average per capita income.To summarise, our analysis aimed at studying the employment effects of MNE presence
within and across industries, as well as across different types of sectors and regions. As asignificant innovation compared to previous studies, we use industry pair co-occurrence re-latedness rather than IO-relations as a framework of capturing spillovers. Our baselinehypotheses find overall support. Both the intra-industry impact (Hypothesis 1) and inter-industry effects (Hypothesis 2) of MNE appear to be positive, though with substantial differ-ences across groups of industries and regions. Domestic firms in knowledge-intensiveindustries show the stronger potential to benefit from the presence of MNEs. Stronger posi-tive employment effects are also concentrated in less-developed regions where the potentialfor learning is possibly higher and competition in the product market is lower given that bothdomestic firms and MNEs might be serving different (distant) markets. Less sophisticatedlocal firms might be more oriented to the local markets while MNEs might target more theexport markets benefitting from the price advantage offered by cheap labour locations.
5.1. Instrumental variable estimations
Different methodological issues may be affecting the models and results previously dis-cussed. A first concern reflects the fact that MNE location choices are endogenous, imply-ing that the relations found in the previous models may be biased by reverse causality.
1180 � Cortinovis et al.
Dow
nloaded from https://academ
ic.oup.com/joeg/article/20/5/1165/5880238 by London School of Econom
ics user on 24 Novem
ber 2020

Given the direct relation between MNE location choices and sectoral performance, thisproblem is likely to be especially acute in the case of intra-industry effects.Multinationals, with their location choices, self-select into region–industry pairs and theirchoices will be based on considerations pertaining local economic performance and avail-ability of critical resources, either in the form of infrastructure, human capital or other (in)-tangible assets (see Crescenzi et al., 2014; Karreman et al., 2017). This implies that thenumber of MNEs active in an industry–region might be driven by current (or projected)performance including employment levels. The direction of the bias induced by this typeof endogeneity is unknown. If MNE location choices are driven by previous region–sectorperformance, we would expect an upward bias in our coefficients, leading us to overstatethe effect of MNE spillovers on employment. Conversely, given that MNEs tend to bemore productive and innovative than local firms, they may rely less on local labour as aninput for production. For instance, if MNEs are more prone to automate their productionthis would imply that our spillover measure and (unobservable) automation are positivelycorrelated. As a result, the negative correlation between an omitted variable (automation)and the dependent variable (employment) would induce a downward bias in our results.Even without any strong prior on the bias of our baseline results, we address endogeneityconcerns by constructing deep lags and a Bartik-type of instrumental variable (IV) and re-estimate our models using two-stage panel data techniques.The IV strategy leverages a shift-share Bartik instrument (Faggio and Overman, 2014;
Crescenzi et al., 2015). The aim of the instrument is to approximate the number of multi-nationals present in each industry–region group, excluding the effect of characteristics thatmay drive the location choices of MNEs. For this purpose, we compute the instrument forthe (log) number of MNEs as specified in Equation (7):
ivbnoreui; r; t ¼numfirms2006i;rPr numfirms2006i;r
�Xr
numMNEi; r; t � numMNEi; r; t� �
(7)
where i refers to the industry and r to the region. The instrument redistributes the totalnumber of MNEs (over the entire sample of EU regions) active in sector i (excludingfrom the count MNEs in sector i in focal region r) according to the respective share offirms in sector i in region r in 2006. Specifically, the first term of Equation (7) provides aweight based on how many firms in industry i are located in region r in 2006. This weightis interacted with the second term of Equation (7), which captures the time-varying num-ber of MNEs in industry i across Europe, excluding those from the focal region r.Exploiting only the variation over time of the second term of our instrument drasticallyreduces the concerns for using the potentially endogenous share of firms by sector in 2006(the first term in Equation 7). Besides, as our estimates rely on within variation in the sec-tor–region dimension, the first term of Equation (6) is unlikely to violate the exclusion re-striction. Similarly, the exclusion of the number of MNEs in the region (the second termin the second term in Equation 7) helps further addressing the problems with the exclusionrestriction (Faggio and Overman, 2014). To test directly whether our identification strategymeets the exclusion restriction, we also use deeper lags to instrument for more recent val-ues of our endogenous variables. Within the limits of our dataset, we maximise the timegap in our deep lagging strategy using 4-years lagged variables as instruments: for in-stance, the number of MNEs in 2010 was instrumented using the number of MNEs in2006. Whereas this leads to a reduction in the number of observations included in our
MNEs, relatedness and employment � 1181
Dow
nloaded from https://academ
ic.oup.com/joeg/article/20/5/1165/5880238 by London School of Econom
ics user on 24 Novem
ber 2020

models, using data before the 2009 crisis is useful to increase the potential exogeneity ofour instruments.Estimating IV regressions with more than one endogenous variable is technically chal-
lenging and generally advised against (Angrist and Pischke, 2009). In our case, the num-ber of potentially endogenous variables, the similarity of the instruments to be used andthe different industrial and regional dimensions cutting across our sample, make the IV es-timation especially problematic. Considering these challenges, and the fact that reverse-causality may be a problem especially for intra-industry effects, we focus our robustnesschecks on endogeneity of the MNE_num (ln) and MNE_num_rel (ln) variables separately.9
Tables 4 and 5 report the estimates and the statistics referring to IV estimation. The coeffi-cients for the first-stage regressions are reported in Appendix C.Overall, the results shown in Table 4 provide more solid confirmation of the tentative
findings presented in the previous part of the analysis. The F-tests reported at the bottomof Table 4 are mostly above the rule of thumb threshold of 10 (or reasonably close to it),usually applied in the literature, thus indicating the validity of the chosen instrument.Besides, the first two columns show that both our instruments are strongly relevant, whichallows us to correctly overidentify the 2SLS regressions: the column marked with ‘(BI)’refers to the second stage using only the Bartik-type of instrument, while the columnmarked with ‘(DL)’ uses the deep lagging approach. From columns 3–12 of Table 4, weuse both instruments and we test whether they meet the exclusion restriction. Throughoutour specifications, the Hansen J-test is consistently insignificant suggesting the validity ofour approach. In terms of the estimated coefficients, the second-stage coefficients are notfound to be significant in the whole sample and in the LKI. However, the effects of MNEpresence on employment in the same industry are positive significant for high-knowledgesectors and KIBS and the pattern of sectoral heterogeneity in the effects matches the onein Table 2, with HKI and KIBS presenting bigger and more significant coefficients thanLKI.10 By comparing the coefficients in the 2SLS with the OLS regressions, the pointestimates are much stronger in our robustness checks, indicating our baseline results wereunderestimated.While trying to instrument for both endogenous variables at the same time strongly
curbs the power of our instruments (see Footnote 4), assuming MNE_num (ln) as exogen-ous and instrumenting for MNE_num_rel (ln) offers a further confirmation to our results.Also in the case of Table 5, the F-test for the excluded instruments is above rule of thumbthreshold and the Hansen J-test confirms the validity of our exclusion restriction. Asexpected from our baseline results, MNE spillovers mediated via relatedness have a sig-nificant and positive impact on sectoral employment both in the whole sample (column 3of Table 5) and in more knowledge-intensive industries (columns 7 and 9 of Table 5).
9 We tried also adopting a similar strategy for instrumenting for the number of MNEs in related industries, byinteracting the instrument iv_b_nor_eu with the previously computed relatedness matrix (Javorcik et al., 2018).Whereas the IV estimations appear to work solidly for Model 1, which is not the case for Model 2: once bothendogenous variables are included, the instruments do not perform as good.
10 The main difference with the baseline results is the lack of significance in the coefficient concerning LKI indus-tries. This may suggest some selection issues which were not duly taken into account in our OLS estimates.Aspects like the introduction of policy interventions for fostering employment (e.g. the European GlobalizationAdjustment Fund) or industry- and location-specific MNEs attraction schemes (Crescenzi et al. 2019) are pos-sible factors confounding OLS estimates, leading to a significant OLS coefficient. Our IVs exclude these factors(either by taking long lags or by directly excluding region–industry characteristics in the case of the Bartikinstruments), therefore, the 2SLS coefficients for LKI are not as significant as before.
1182 � Cortinovis et al.
Dow
nloaded from https://academ
ic.oup.com/joeg/article/20/5/1165/5880238 by London School of Econom
ics user on 24 Novem
ber 2020

Tab
le4.
Model
2(IV)—
intra-industry
effectsof
MNEpresence
Whole
Sam
ple
LKI
HKI
KIBS
(1)
(2)
(3)
(4)
(5)
(6)
(7)
(8)
(9)
(10)
(11)
(12)
Variables
Employment
—All(BI)
Employment
—All(D
L)
Employment
—All
Employment
Employment
—above
av.Reg.
Employment
—below
av.Reg.
Employment
Employment
—above
av.Reg.
Employment
—below
av.Reg.
Employment
Employment
—above
av.Reg.
Employment
—below
av.Reg.
MNE_num
(ln)
0.189
0.229
0.242
0.0770
0.218
0.118
0.949***
0.751**
1.198***
0.936***
0.551
1.201***
(0.131)
(0.171)
(0.160)
(0.161)
(0.290)
(0.198)
(0.279)
(0.299)
(0.345)
(0.294)
(0.343)
(0.345)
No_MNE(dum
my)
�0.00380
0.0284*
0.0291*
0.0302
0.0432
0.0313
0.0544**
0.0793**
0.0244
0.0503*
0.0723*
0.0261
(0.0147)
(0.0172)
(0.0169)
(0.0245)
(0.0484)
(0.0237)
(0.0261)
(0.0392)
(0.0288)
(0.0276)
(0.0393)
(0.0342)
Neigh.MNEs(ln)
0.00307***
0.00162
0.00157
0.00172
0.00307
�0.000364
0.00396
0.00688*
0.000598
0.00435
0.00941**
�0.00117
(0.00119)
(0.00126)
(0.00126)
(0.00176)
(0.00310)
(0.00230)
(0.00310)
(0.00383)
(0.00439)
(0.00354)
(0.00402)
(0.00497)
Observations
75,506
46,071
46,071
28,390
11,173
17,217
17,681
7,364
10,317
12,617
5280
7337
R2
0.019
�0.007
�0.009
0.009
�0.015
0.010
�0.252
�0.284
�0.291
�0.262
�0.158
�0.303
Num
berof
reg_ind
15,474
15,428
15,428
9511
3747
5764
5917
2465
3452
4217
1765
2452
Sector_region
FE
Yes
Yes
Yes
Yes
Yes
Yes
Yes
Yes
Yes
Yes
Yes
Yes
YearFE
Yes
Yes
Yes
Yes
Yes
Yes
Yes
Yes
Yes
Yes
Yes
Yes
Control
vars.
Yes
Yes
Yes
Yes
Yes
Yes
Yes
Yes
Yes
Yes
Yes
Yes
Flogf10
13.21***
23.44***
18.54***
19.47***
7.391***
14.23***
14.22***
7.620***
10.21***
13.68***
6.342***
9.557***
Flogf10
p-val
0.000335
2.20e-06
2.97e-08
1.31e-08
0.000989
2.14e-06
1.37e-06
0.000809
6.84e-05
2.24e-06
0.00250
0.000122
HansenJ
00
0.0248
0.0107
0.453
2.330
0.0822
0.0223
0.103
0.119
0.239
0.303
Hansenp-val
00
0.875
0.917
0.501
0.127
0.774
0.881
0.748
0.730
0.625
0.582
Notes:Clustered
standard
errors
inparentheses.
***p<0.01,**p<0.05,*p<0.1.
MNEs, relatedness and employment � 1183
Dow
nloaded from https://academ
ic.oup.com/joeg/article/20/5/1165/5880238 by London School of Econom
ics user on 24 Novem
ber 2020

Tab
le5.
Model
2(IV)—
inter-industry
effectsof
MNEpresence
Whole
Sam
ple
LKI
HKI
KIBS
(1)
(2)
(3)
(4)
(5)
(6)
(7)
(8)
(9)
(10)
(11)
(12)
Variables
Employment
—All(BI)
Employment
—All(D
L)
Employment
—All
Employment
Employment
—above
av.Reg.
Employment
—below
av.Reg.
Employment
Employment
—above
av.Reg.
Employment
—below
av.Reg.
Employment
Employment
—above
av.Reg.
Employment
—below
av.Reg.
MNE_num
(ln)
0.0458***
0.00394
0.00274
�0.00304
�0.0223
0.00612
0.0193
0.00780
0.0498**
0.0108
0.0208
0.0412
(0.0156)
(0.0163)
(0.0161)
(0.0225)
(0.0165)
(0.0372)
(0.0183)
(0.0276)
(0.0232)
(0.0222)
(0.0360)
(0.0270)
MNE_num
_rel
(ln)
�0.00595
0.0315
0.0342*
0.0153
0.0377
0.0126
0.0414*
0.00527
0.0573*
0.0321
�0.0199
0.0468
(0.0205)
(0.0211)
(0.0203)
(0.0248)
(0.0295)
(0.0341)
(0.0227)
(0.0311)
(0.0299)
(0.0237)
(0.0373)
(0.0294)
No_MNE(dum
my)
�0.0130
0.0186
0.0188
0.0269
0.0294
0.0269
0.00795
0.0234
�0.0109
0.0149
0.0445
�0.0140
(0.0129)
(0.0144)
(0.0144)
(0.0222)
(0.0405)
(0.0223)
(0.0165)
(0.0280)
(0.0179)
(0.0200)
(0.0343)
(0.0208)
Neigh.MNEs(ln)
0.00417***
0.00270**
0.00272**
0.00234*
0.00551***
0.000294
0.00259
0.00289
0.00129
0.00221
0.00515*
�0.00120
(0.000741)
(0.00123)
(0.00123)
(0.00141)
(0.00198)
(0.00194)
(0.00264)
(0.00298)
(0.00376)
(0.00295)
(0.00311)
(0.00428)
Observations
75,506
46,071
46,071
28,390
11,173
17,217
17,681
7,364
10,317
12,617
5280
7337
R2
0.026
0.007
0.006
0.011
0.007
0.014
0.002
0.010
0.005
�0.001
0.017
0.002
Num
berof
reg_ind
15,474
15,428
15,428
9511
3747
5764
5917
2465
3452
4217
1765
2452
Sector_regionFE
Yes
Yes
Yes
Yes
Yes
Yes
Yes
Yes
Yes
Yes
Yes
Yes
YearFE
Yes
Yes
Yes
Yes
Yes
Yes
Yes
Yes
Yes
Yes
Yes
Yes
Control
vars.
Yes
Yes
Yes
Yes
Yes
Yes
Yes
Yes
Yes
Yes
Yes
Yes
Frel
27.61***
87.73***
54.01***
46.94***
17.30***
27.60***
50.44***
19.21***
30.22***
42.90***
13.46***
27.58***
Frelp-val
3.08e-07
00
03.15e-07
5.68e-11
07.58e-08
00
6.17e-06
5.78e-11
HansenJ
00
0.276
0.244
0.630
0.0677
0.0206
0.860
0.135
0.00798
1.183
0.326
Hansenp-val
00
0.600
0.621
0.428
0.795
0.886
0.354
0.713
0.929
0.277
0.568
Notes:Clustered
standard
errors
inparentheses.
***p<0.01,**p<0.05,*p<0.
1184 � Cortinovis et al.
Dow
nloaded from https://academ
ic.oup.com/joeg/article/20/5/1165/5880238 by London School of Econom
ics user on 24 Novem
ber 2020

Also in this case, the significance and magnitude of the results are well in line with theresults reported in Table 3. By comparing the results in Tables 4 and 6, we conclude thereis a downward bias in the baseline regressions, though much less sizeable than in the caseof Model 1.
5.2. Robustness check on domestic employment
A second potentially problematic aspect in our estimation relates to the fact that the pres-ence of multinationals may, by itself, induce a positive effect on employment within thesame sector–region. As multinationals tend to be larger in terms of employment, it cannotbe excluded that their presence may by construction lead to a higher level of sectoral em-ployment. Therefore, we test our results looking at non-MNE employment in a subsampleof industry–regions.With respect to the second issue (non-MNE employment), we perform the same analysis
as in Table 3, this time looking only at employment in non-multinational firms. To imple-ment this robustness check, we use information from Orbis to compute the level of em-ployment in each industry–region accruing to firms that are not foreign owned. Becauseof the low reliability of information for certain countries (Kalemli-Ozcan et al., 2015) anddue to the missing information on firm-level employment, we restrict the sample consid-ered in our robustness check, selecting only regions in countries for which the minimumcorrelation between employment data in Orbis and Eurostat SBS is at least 70%.11
Having selected only countries with highly reliable data, we compute the (log) numberof employees in domestically owned firms and re-estimate Models 1 and 2 once again.Both models are also estimated for the HKI, LKI and KIBS industries, whereas we do notgroup the regions along the per capita income categories due to the reduced heterogeneityin the sample for this robustness check.Tables 6 and 7 reproduce the results for the robustness checks on non-MNE employ-
ment. The estimates on the reduced sample highlight positive significant relations betweenMNE_num and MNE_num_rel, from the one hand, and non-MNE employment on theother hand.All in all, our robustness checks provide a general confirmation of our main findings.
Our IV strategy, based on deep lags and a Bartik-type of instrument, confirms the exist-ence of positive intra-industry spillovers, as well as their stronger effects in the case ofmore knowledge-intensive industries. Whereas we are not able to apply the same IVmethod simultaneously including within industry and relatedness mediated spillovers, wetest the validity of our results instrumenting for MNE_num_rel (ln) alone. The results fromthis robustness check are in line with those obtained in our baseline regressions, suggest-ing that relatedness-mediated spillovers positively impact local sectoral employment.Hypotheses 3 and 4 theorise a stronger effect of MNEs for advanced industries and heter-ogenous effects across different levels of local development. Hypothesis 3 proves to be ac-curate. High-knowledge sectors and knowledge-intensive services consistently show higherand more significant coefficients for MNE presence, both within and across industries.Results are less clear-cut when investigating regional heterogeneity. From our standard
11 This implies that if even for only one sector in one region, a country has correlation lower than 70%, it will notbe included in the analysis. Finally, region–industries within the following 19 countries are included in the ro-bustness check: Austria, Belgium, Bulgaria, Czech Republic, Denmark, Finland, France, Hungary, Lithuania,Latvia, Luxembourg, Norway, Poland, Portugal, Romania, Slovenia, Slovakia, Spain and Swede.
MNEs, relatedness and employment � 1185
Dow
nloaded from https://academ
ic.oup.com/joeg/article/20/5/1165/5880238 by London School of Econom
ics user on 24 Novem
ber 2020

panel results, less advanced EU regions seem to benefit more than other areas from thepresence of foreign companies (Hypothesis 4).
6. Conclusions
The cross-sectoral effect of MNEs and the existence of preconditions for the local econ-omy to benefit from foreign companies are nowadays well-established facts. The aim ofthis article is to explore the significantly under-researched link between MNEs activities
Table 7. Model 2—intra- and inter-industry effects of MNE presence on non-MNE employment
Whole sample LKI HKI KIBSVariables Non-MNE
employment—AllNon-MNEemployment
Non-MNEemployment
Non-MNEemployment
MNE_num (ln) 0.0466** 0.0394* 0.0584* 0.0746**(0.0194) (0.0234) (0.0299) (0.0331)
MNE_num_rel (ln) 0.0544*** 0.0490*** 0.0608*** 0.0499***(0.0121) (0.0146) (0.0136) (0.0146)
No_MNE (dummy) �0.00440 �0.0146 0.0100 0.00555(0.0250) (0.0311) (0.0423) (0.0500)
Observations 26,980 16,895 10,085 7165R2 0.049 0.056 0.044 0.048Number of id 5426 3403 2023 1438Sector_region FE Yes Yes Yes YesYear FE Yes Yes Yes YesControl variables Yes Yes Yes Yes
Notes: Clustered standard errors in parentheses.***p< 0.01, **p< 0.05, *p< 0.1.
Table 6. Model 1—intra-industry effects of MNE presence on non-MNE employment
Whole sample LKI HKI KIBSVariables Non-MNE
employment—AllNon-MNEemployment
Non-MNEemployment
Non-MNEemployment
MNE_num (ln) 0.0863*** 0.0714*** 0.110*** 0.120***(0.0258) (0.0263) (0.0374) (0.0396)
No_MNE (dummy) �0.00190 �0.0125 0.0136 0.0117(0.0248) (0.0308) (0.0430) (0.0505)
Observations 26,980 16,895 10,085 7165R2 0.041 0.049 0.033 0.040Number of id 5426 3403 2023 1438Sector_region FE Yes Yes Yes YesYear FE Yes Yes Yes YesControl variables Yes Yes Yes Yes
Notes: Clustered standard errors in parentheses.***p< 0.01, **p< 0.05, *p< 0.1.
1186 � Cortinovis et al.
Dow
nloaded from https://academ
ic.oup.com/joeg/article/20/5/1165/5880238 by London School of Econom
ics user on 24 Novem
ber 2020

and local employment at the EU-level from the perspective of industrial relatedness.Therefore, the innovative contribution of the article is 3-fold.First, the article has unveiled a positive link between MNE presence and local employ-
ment, suggesting that internationalisation through inward FDI is a positive-sum game inEurope whereby jobs created outnumber jobs losses.Secondly, the article offers new insights on the cross-sectoral dimension of MNE em-
ployment effects, showing that these are not limited to vertical input–output linkages(Javorcik, 2004; Alvarez and Lopez, 2008; Liang, 2017; Javorcik et al., 2018). One of themain contributions of this article is its original use of pairwise industrial relatedness,through which we capture how knowledge, technologies and assets available locally in aregion influence firms’ opportunities of knowledge and skill recombination. In our frame-work, the more two sectors are related, the easier it is for firms to re-deploy their assets,acquire new capabilities, and change, upgrade or expand their portfolio of products andtherefore expand employment. In this sense, we argue that our relatedness measure cap-tures industrial proximity in a broader sense (Boschma, 2005) than simple input–outputrelations. Skill relatedness (Neffke and Henning, 2013) and technological and cognitivesimilarities (Cortinovis et al., 2017; Farinha-Fernandes et al., 2019) in products as well asprocesses are likely to be the main drivers behind industrial relatedness. The positive androbust results obtained by our relatedness-based measure provide a confirmation that in-put–output relations do not function in isolation as channels through which MNEs influ-ence employment in their host economies.Thirdly, the article disentangles the heterogeneous employment effects of MNEs by link-
ing them to sectoral and regional differences in Europe (Crescenzi and Iammarino, 2017).Our results suggest that these sources of heterogeneity have to be adequately taken into ac-count in order to better grasp the mechanics of MNE employment effects. We show thatwithin- and cross-sector linkages to foreign company are particularly important forknowledge-intensive industries and for low-income regions in Europe. Our results indicatethat regions hosting knowledge-intensive industries and characterised by lower factor pricesare likely to benefit the most from the presence of multinationals in terms of employment.In other words, we confirm the economic geography insights that economies in low-incomeEuropean regions have much to gain from MNE’s (Defever, 2006; Crespo and Fontoura,2007; Javorcik, 2013, Elekes and Legyel, 2016) but we show that this is especially true inhigher knowledge-intensive sectors within these economies. While MNEs can provideknowledge that can be absorbed by local (knowledge-intensive) industries (Content et al.,2019) by boosting their job-creation capabilities, building capacity for further absorption isan important precondition to achieve better overall economic performance and higher em-ployment levels in the periphery of Europe (Cortinovis and van Oort, 2019).These results offer a number of key insights to policymakers in Europe and beyond. In
terms of place-based development strategies and policies in European regions, interre-gional MNE (but also trade and knowledge) network dependencies are an underexploredyet important aspect (Thissen et al., 2013). Apart from productivity-enhancing effects, theattraction of MNEs can contribute to regional job creation, especially in a relatednessframework. Whereas local and industrial conditions appear to be important, place-basedpolicy tools such as investment promotion agencies (studied by Crescenzi et al., 2019) cansignificantly stimulate local employment creation through internationalisation. Importantly,our contribution also suggests that conditional on the local industrial portfolio, regionaleconomies can leverage MNE effects in more encompassing ways than suggested by
MNEs, relatedness and employment � 1187
Dow
nloaded from https://academ
ic.oup.com/joeg/article/20/5/1165/5880238 by London School of Econom
ics user on 24 Novem
ber 2020

previous literature, thus facilitating sectoral revival and employment creation across the in-dustrial space.Intra- and inter-industry relatedness (in terms of co-occurring sectoral specialisations,
shared labour inputs, IO relations and skill relatedness) facilitates the assimilation ofMNEs in regional economic development, broadens the scope of regional developmentpolicies and connects our results with an emerging body of research on the regionalimpacts of Global Value Chain connectivity (Crescenzi et al., 2018). Building on the no-tion that innovation and knowledge transfer stem from the recombination and cross-overcapabilities of existing and complementary knowledge and technologies (Frenken et al.,2007; Enkel et al., 2009), (regional) policy tools targeting (intra- and inter-sectoral) know-ledge transfer mechanisms have the potential to enhance the MNE-employment nexus.Policies on labour mobility, education, technology transfer, public–private partnerships, taxexemptions and intellectual property rights are examples of this (Borras and Edquist,2013) and they should be carefully assessed on their effectiveness in relation to the em-ployment generation capacities of MNEs in own and related industries.Nonetheless, some limitations apply to our study and its results. The lack of more dis-
aggregated data forced us to perform the relatedness analysis based on 68 two-digitNACE sectors. This implies at least two caveats. First, our intra-regional spillovers are bydefinition rather broad, potentially encompassing what other researchers have been able tocapture as cross-sectoral linkages. Although this represents a limitation for this study, italso highlights the possible drawbacks in the use of input–output relations as channels forknowledge spillovers. If some effects of relatedness are found across relatively broadlydefined sectors, even stronger results can be expected using relatedness in more disaggre-gated settings. Secondly, in this article, we account for endogeneity issues as much as pos-sible by using an IV estimation. Besides, the use of sector–region fixed effects anddifferent types of control variables further reduces concerns for omitted variable bias.However further methodological refinements in order to fully capture causal effects de-serve attention in future work (e.g. following Javorcik et al., 2018).
Funding
The research leading to these results has received funding from the European ResearchCouncil under the European Union Horizon 2020 Programme (H2020/2014-2020) (GrantAgreement no. 639633-MASSIVE-ERC-2014-STG).
References
Abernathy, W. J., Clark, K. B. (1985) Innovation: mapping the winds of creative destruction.Research Policy, 14: 3–22.
Aitken, B. J., Harrison, A. E. (1999) Do domestic firms benefit from direct foreign investment?Evidence from Venezuela. American Economic Review, 89: 605–618.
Alcacer, J., Delgado, M. (2016) Spatial organization of firms and location choices through the valuechain. Management Science, 62: 3213–3234.
Alfaro, L., Chen, M. (2014) The global agglomeration of multinational firms. Journal ofInternational Economics, 94: 263–276.
Altomonte, C., Pennings, E. (2009) Domestic plant productivity and incremental spillovers from for-eign direct investment. Journal of International Business Studies, 40: 1131–1148.
Alvarez, R., Lopez, R. (2008). Is exporting a source of productivity spillovers? Review of WorldEconomics, 144: 723–749.
Angrist, J. D., Pischke, J.-S. (2009) Mostly Harmless Econometrics: An Empiricist’s Companion.Princeton, NJ: Princeton University Press.
1188 � Cortinovis et al.
Dow
nloaded from https://academ
ic.oup.com/joeg/article/20/5/1165/5880238 by London School of Econom
ics user on 24 Novem
ber 2020

Annoni, P., Dijkstra, L., Gargano, N. (2017) The European Regional Competitiveness Index 2016.Brussels, EU Working Paper 02/2017.
Arnold, J. M., Javorcik, B. S. (2009) Gifted kids or pushy parents? Foreign direct investment andplant productivity in Indonesia. Journal of International Economics, 79: 42–53.
Ascani, A., Gagliardi, L. (2015) Inward FDI and local innovative performance. An empirical investi-gation on Italian provinces. Review of Regional Research, 35:29–47.
Beugelsdijk, S., Smeets, R., Zwinkels, R. (2008) The impact of horizontal and vertical FDI on host’scountry economic growth. International Business Review 17: 452–472.
Bitzer J., Geishecker I., and Gorg H. (2008) Productivity spillovers through vertical linkages: evi-dence from 17 OECD countries. Economics Letters 99: 328–331.
Blomstrom, M., Kokko, A. (2003) The Economics of Foreign Direct Incentives. NBER WorkingPaper 9489.
Borras, S., Edquist, C. (2013) The choice of innovation policy instruments. TechnologicalForecasting and Social Change, 80: 1513–1522.
Boschma, R. (2005) Proximity and innovation: a critical assessment. Regional Studies, 39: 61–74.Boschma, R., Capone, G. (2015) Institutions and diversification: related versus unrelated diversifica-
tion in a varieties of capitalism framework. Research Policy, 44: 1902–1914.Boschma, R., Frenken, K. (2011) The emerging empirics of evolutionary economic geography.
Journal of Economic Geography, 11: 295–307.Boschma, R., Iammarino, S. (2009) Related variety, trade linkages and regional growth in Italy.
Economic Geography, 85: 289–311.Boschma, R. A., Wenting, R. (2007) The spatial evolution of the British automobile industry: does
location matter? Industry and Corporate Change, 16: 213–238.Boschma, R., Minondo, A., Navarro, M (2013) The emergence of new industries at the regional
level in Spain: a proximity approach based on product relatedness. Economic Geography, 89:29–51.
Brambilla, I. (2009) Multinationals, technology, and the introduction of varieties of goods. Journalof International Economics, 79: 89–101.
Branstetter, L. (2006) Is foreign direct investment a channel of knowledge spillovers? Evidence fromJapan’s FDI in the United States. Journal of International Economics, 68: 325–344.
Burger, M. J., Van der Knaap, B., Wall, R. S. (2013) Revealed competition for greenfield invest-ments between European regions. Journal of Economic Geography, 13: 619–648.
Castellani, D., Zanfei, A. (2006) Multinational Firms, Innovation and Productivity. Chelthenam:Edward Elgar.
Chen, W., Los, B., McCann, P., Ortega-Argiles, R., Thissen, M., Van Oort, F. (2017) The continentaldivide? Exposure to Brexit in regions and countries on both sides of the Channel. Papers inRegional Science, 97: 25–54.
Cicerone, G.,.McCann P., Venhorst, V. A. (2019) Promoting regional growth and innovation: re-latedness, revealed comparative advantage and the product space. Journal of EconomicGeography; doi:10.1093/jeg/lbz001.
Cipollina, M., Giovannetti, G., Pietrovito, F., Pozzolo, A. F. (2012) FDI and growth: whatcross-country industry data say. The World Economy, 35: 1599–1629.
Cohen, W. M., Levinthal D. A. (1990) Absorptive capacity: a new perspective on learning and in-novation. Administrative Science Quarterly, 35: 128–152.
Content, J., Frenken, K. (2016) Related variety and economic development: a literature review.European Planning Studies, 24: 2097–2112.
Content, J., Cortinovis, N., Frenken, K., Jordaan, J. (2019) Regional diversification and industry re-latedness: on the importance of KIBS, GVCs & R&D. Mimeo.
Cortinovis, N., van Oort, F. (2019) Between spilling over and boiling down: network-mediated spill-overs, local knowledge base and productivity in European regions. Journal of EconomicGeography, 19: 1233–1260.
Cortinovis, N., Xiao, J., Boschma, R., Van Oort, F. (2017) Quality of government and social capitalas drivers of regional diversification in Europe. Journal of Economic Geography, 17: 1179–1208.
Crescenzi, R., Di Cataldo, M., Giua, M. (2019) FDI inflows in Europe: does investment promotionwork? LSE IGA - Institute of Global Affairs Working Paper #10/2019. Available online at:https://t.co/QlpKIRAwtQ?amp¼1 [Accessed 21 April 2020].
MNEs, relatedness and employment � 1189
Dow
nloaded from https://academ
ic.oup.com/joeg/article/20/5/1165/5880238 by London School of Econom
ics user on 24 Novem
ber 2020

Crescenzi, R., Harman, O., Arnold, D. (2018) Embedding and Reshaping Global Value ChainsThrough Investment Flows: Insights for Regional Innovation Policies. Background paper for anOECD/EC Workshop on 28 September 2018 within the workshop series “Broadening innovationpolicy: New insights for regions and cities”, Paris.
Crescenzi, R., Gagliardi, L., Iammarino, S. (2015) Foreign multinationals and domestic innovation:intra-industry effects and firm heterogeneity. Research Policy, 44: 596–609.
Crescenzi, R., Pietrobelli, C., Rabellotti, R. (2014) Innovation drivers, value chains and the geog-raphy of multinational corporations in Europe. Journal of Economic Geography, 14: 1053–1086.
Crescenzi, R., Iammarino, S. (2017) Global investments and regional development trajectories: themissing links. Regional Studies, 51: 97–115.
Crespo, N., Fontoura, M. P. (2007) Determinant factors of FDI spillovers—what do we really know?World Development, 35: 410–425.
Crespo, N., Fontoura, M. P., Proenca, I. (2009) FDI spillovers at regional level: evidence fromPortugal. Papers in Regional Science, 88: 591–560.
Damijan, J., Knell, M., Majcen, B., Rojec, M. (2003) Technology transfer through FDI in top 10transition countries: how important are direct effects, horizontal and vertical spillovers? WilliamDavidson Working Paper no. 549.
Defever, F. (2006) Functional fragmentation and the location of multinationals in the enlargedEurope. Regional Science and Urban Economics, 36: 658–677.
Elekes, Z., Boschma, R., Lengyel, B. (2019) Foreign-owned firms as agents of structural change inregions. Regional Studies, 53: 1603–1613.
Elekes, Z., Lengyel, B. (2016) Related trade linkages, foreign firms and employment growth in lessdeveloped regions. Papers in Evolutionary Economic Geography 1620.
Enkel, E., Gassmann, O., Chesborough, H. (2009) Open R&D and open innovation: exploring thephenomenon. R&D Management, 39: 311–316.
Ernst, D., Kim, L. (2002) Global production networks, knowledge diffusion, and local capability for-mation. Research Policy, 31: 1417–1429.
Farinha-Fernandes, T., Balland, P.-A., Morrison, A., Boschma, R. (2019) What drives the geographyof jobs in the US? Unpacking relatedness. Industry and Innovation, 26: 988–1022.
Faggio, G., Overman, H. (2014) The effect of public sector employment on local labour markets.Journal of Urban Economics, 79: 91–107.
Frenken, K., Van Oort, F., Verburg, T. (2007) Related variety, unrelated variety and regional eco-nomic growth. Regional Studies, 41: 685–697.
Fu, X. (2008) Foreign direct investment, absorptive capacity and regional innovation capabilities.Oxford Development Studies, 36: 89–110.
Fu, X., Pietrobelli, C., Soete, L. (2011) The role of foreign technology and indigenous innovation inthe emerging economies: technological change and catching-up. World Development, 39:1204–1212.
Glaeser, E., Kallal, H., Scheinkman, J., Shleifer, A. (1992) Growth in cities. Journal of PoliticalEconomy, 100: 1126–1152.
Gorg, H., Greenaway, D. (2004) Much ado about nothing? Do domestic firms really benefit fromforeign direct investment? World Bank Research Observer, 19: 171–197.
Guadalupe, M., Kuzmina, O., Thomas, C. (2012) Innovation and foreign ownership. AmericanEconomic Review, 102: 3594–3627.
Harding, T., Javorcik, B. (2011) Roll out the red carpet and they will come: investment promotionand FDI inflows. Economic Journal, 121: 1445–1476.
Hausmann, R., Klinger, B. (2007) The structure of the product space and the evolution of compara-tive advantage. CID Working Paper, No. 146. Cambridge, MA: Center for InternationalDevelopment, Harvard University.
Havranek, T., Irsova, Z. (2011) Estimating vertical spillovers from FDI: why results vary and whatthe true effect is. Journal of International Economics, 85: 234–244.
Hidalgo, C. A., Klinger, B., Barabasi, A. L., Hausmann, R. (2007) The product space conditions thedevelopment of nations. Science, 317: 482–487.
Iammarino, S., McCann, P. (2013) Multinationals and Economic Geography: Location, Technologyand Innovation. Cheltenham: Edward Elgar.
Jacobs, J. (1969) The Economy of Cities. New York: Random House.
1190 � Cortinovis et al.
Dow
nloaded from https://academ
ic.oup.com/joeg/article/20/5/1165/5880238 by London School of Econom
ics user on 24 Novem
ber 2020

Jacobs, W., Koster, H., Van Oort, F. G. (2014) Co-agglomeration of knowledge-intensive businessservices and multinational Enterprises. Journal of Economic Geography, 14: 443–475.
Javorcik, B. (2004) Does foreign direct investment increase the productivity of domestic firms? Insearch of knowledge spillovers through backward linkages. American Economic Review, 94:605–627.
Javorcik B. (2013) Does FDI bring good jobs to host countries? World Bank Research Observer, 30:74–94.
Javorcik, B., Lo Turco, A., Maggioni, D. (2018) New and improved: does FDI boost productioncomplexity in host countries? Economic Journal, 128: 2507–2537.
Kalemli-Ozcan, S., Sorensen, B., Villegas-Sanchez, C., Volosovych, V., Yesiltas S. (2015) How toconstruct nationally representative firm level data from the ORBIS Global Database. NBERWorking Paper No. 21558.
Karreman, B., Burger, M., van Oort, F. (2017) Location choices of Chinese multinationals inEurope: the role of overseas communities. Economic Geography, 93: 131–161.
Kugler, M. (2006) Spillovers from foreign direct investment: within or between industries? Journalof Development Economics, 80: 444–477.
Kokko, A. (1994) Technology, market characteristics, and spillovers, Journal of DevelopmentEconomics, 43: 279–229.
LeSage, J. P. (2014) What regional scientists need to know about spatial econometrics. The Reviewof Regional Studies, 44: 13–32.
Liang, F.H. (2017) Does foreign direct investment improve the productivity of domestic firms?Technology spillovers, industry linkages, and firm capabilities. Research Policy 46: 138–159.
Lin, P., Saggi, K. (2007) Multinational firms, exclusivity, and backward linkages. Journal ofInternational Economics, 71: 206–220.
Lo Turco, A., Maggioni, D. (2019) Local discoveries and technological relatedness: the role ofMNEs, imports and domestic capabilities. Journal of Economic Geography, 19: 1077–1098.
Lu, Y., Tao, Z., Zhu, L. (2017) Identifying FDI spillovers. Journal of International Economics, 107:75–90.
McCann, P. (2015) The regional and urban policy of the European Union. Cohesion,Results-Orientation and Smart Specialisation. Cheltenham: Edward Elgar.
Meyer, K., Sinani, E. (2009) Where and when does foreign direct investment generate positive spill-overs? A meta analysis. Journal of International Business Studies, 40: 1075–1094.
Neffke, F., Henning, M. (2013) Skill relatedness and firm diversification. Strategic ManagementJournal, 34: 297–316.
Narula, R., Dunning, J. (2000) Industrial development, globalization and multinational enterprises:new realities for developing countries. Oxford Development Studies, 28: 141–167.
Narula, R., Pineli, A. (2016) Multinational enterprises and economic development in host countries:what we know and what we don’t know. John H. Dunning Centre for International BusinessDiscussion Papers 2016–01.
Neto, P., Brand~ao, A., Cerqueira, A. (2008) The impact of FDI, cross border mergers and acquisi-tions and greenfield investments on economic growth. FEP No. 291.
Oberhofer, H. (2013) Employment effects of acquisitions: evidence from acquired European firms.Review of Industrial Organization, 42: 345–363.
Perri, A., Peruffo, E. (2016) Knowledge spillovers from FDI: a critical review from the internationalbusiness perspective. International Journal of Management Reviews, 18: 3–27.
Poole, J. (2013) Knowledge transfers from multinational to domestic firms: evidence from workermobility. Review of Economics and Statistics, 95: 393–406.
Steijn, M. P. A. (2016) Improvement on the association strength: implementing probability measuresbased on combinations without repetition. Mimeo, Utrecht University.
Thissen, M. J. P. M., Van Oort, F. G., Diodato, D., Ruijs, A. (2013) Regional Competitiveness andSmart Specialisation in Europe. Place-Based Development in International Economic Networks.Cheltenham: Edward Elgar.
Van Eck, N. J., Waltman, L. (2009) How to normalize co-occurrence data? An analysis of somewell-known similarity measures. Journal of the Association for Information Science andTechnology, 60: 1635–1651.
Zhu, S., He, C., Zhou, Y. (2017) How to jump further and catch up. Path-breaking in an uneven in-dustry space. Journal of Economic Geography, 17: 521–545.
MNEs, relatedness and employment � 1191
Dow
nloaded from https://academ
ic.oup.com/joeg/article/20/5/1165/5880238 by London School of Econom
ics user on 24 Novem
ber 2020

Appendix
A. Relatedness and I-O matrix
One concern in relation to our definition of relatedness is that this measure would simply cap-ture buyer–supplier relations. After all, Hidalgo et al. (2007, 482–483) directly refer to ‘theinputs or outputs involved in a product’s value chain (e.g., cotton, yarn, cloth, and garments)’as one of the factors potentially driving relatedness. To reduce the concerns of relatednessbeing simply capturing input–output linkages, we compare the pairwise relatedness score weobtained from Equation (5) with each of the national input–output matrices from the WorldInput–Output Database for the same year (2006). A graphic representation of the relationsbetween the two measures of inter-industry linkages is reported in Appendix Figure A1. Inthe graphs in Appendix Figure A1, each dot represents one of the 4624 pairs of sectors,including the diagonal elements which are set to zero in both the relatedness and input–out-put matrices. As the graphs show, there is no clear association between input–output intensityand relatedness scores.
This is confirmed also by Table A1: the average correlation score across the differentcountries is only 0.06, with the maximum correlation being 0.1. By summing the input-out-put matrices across European countries, the sectoral pairwise correlation is 0.09. We considerthis evidence reassuring: considering that most part of the variation in relatedness is notexplained by input-output relations, we believe other approach genuinely captures forms ofsimilarities and drivers of co-location which are other than buyer-supplier linkages.
A.1. Relatedness and/or input–output linkages?
In spite of the relatively low correlation between the relatedness and input–output weights,the concern that such our relatedness-weighted measure may simply capture buyer–supplierlinkages along with cognitive and technological similarities between industries would re-main. We explore this potential problem both graphically and using regression analysis.Appendix Figure A2 shows, by country, the correlation between relatedness-mediated spill-overs and spillovers through backward and forward linkages. In spite of the relatively lowcorrelation between relatedness and I-O table, the spillover measures appear to be correlated,potentially affecting the validity of our study.To fully address this concern, and as a further identification effort of our approach, we esti-
mate our baseline regression on industrial employment levels including the same measure ofMNE spillovers applied to backward and forward linkages matrices.12
MNE�num�bli;r;t ¼Xj 6¼i
ni;j�MNE�numj;r;t:
Specifically, in Appendix Table A2, we gradually expand our specification by includingone at a time the variables capturing, respectively, spillovers mediated by backward linkages,
12 We compute backward and forward linkages following the standard approach in the literature, in which the in-tensity of relations across industries is measured as share of total production of sector i supplied to sector j(backward linkages) and the share of total purchase of sector i provided by sector k (forward linkages). In thecase of backward linkages, with ni;j being the share of output of i supplied to sector j:
1192 � Cortinovis et al.
Dow
nloaded from https://academ
ic.oup.com/joeg/article/20/5/1165/5880238 by London School of Econom
ics user on 24 Novem
ber 2020

Figure
A1.
Correlationsbetweenrelatednessscores
andinput–output
intensityby
country.
MNEs, relatedness and employment � 1193
Dow
nloaded from https://academ
ic.oup.com/joeg/article/20/5/1165/5880238 by London School of Econom
ics user on 24 Novem
ber 2020

forward linkages and relatedness. Interestingly, we see that MNE presence is in general asso-ciated with higher levels of employment, with backward linkages appearing to dominate overforward linkages. Whereas obviously these coefficients do not capture causal effects, it isinteresting to notice that our results are in line with those on productivity-enhancing MNEspillovers (Javorcik, 2004). With respect to relatedness, once we include the measure ofrelatedness-mediated spillovers, the coefficient for backward linkages turns insignificantwhile the one for relatedness is positive and strongly significant. Whereas this result shouldnot be interpreted as the primacy of relatedness over buyer–supplier linkages, also in the lightof the high correlation among the three spillover variables (cf. correlations in AppendixTable A3), it supports the idea that relatedness can capture employment spillovers in a moreencompassing way, thus confirming the potential of our approach. Since our aim is not tomethodologically establish the superiority of relatedness over backward linkages, and consid-ering the likely overlap between the two spillover measures, the remainder of the analysiswill focus only on relatedness and the heterogenous impacts of MNE externalities acrossindustries and regions.
Table A1. Correlation between relatedness and national input–outputmatrices
Country Correlation
Austria 0.07248859Belgium 0.08934118Bulgaria 0.04303621Cyprus 0.02533528Czech Republic 0.07352089Denmark 0.08866313Estonia 0.06133714Finland 0.05600721France 0.07532422Germany 0.08431157Greece 0.03813855Hungary 0.06300398Ireland 0.09564528Italy 0.08906841Latvia 0.03162895Lithuania 0.05224235Luxembourg 0.08319002Malta 0.02225585Netherlands 0.08941054Norway 0.07974073Polonia 0.05801462Portugal 0.06386989Romania 0.05993557Slovakia 0.0556302Slovenia 0.05888733Spain 0.03488573Sweden 0.10063751United Kingdom 0.0939608All EU 0.0908432Average correlation 0.06569685
1194 � Cortinovis et al.
Dow
nloaded from https://academ
ic.oup.com/joeg/article/20/5/1165/5880238 by London School of Econom
ics user on 24 Novem
ber 2020
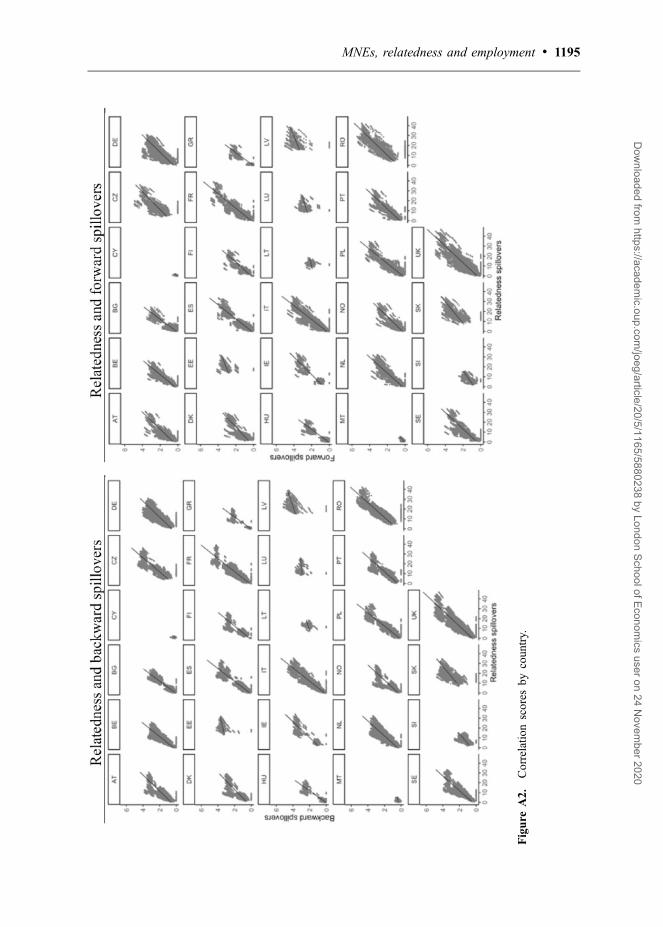
Figure
A2.
Correlation
scores
bycountry.
MNEs, relatedness and employment � 1195
Dow
nloaded from https://academ
ic.oup.com/joeg/article/20/5/1165/5880238 by London School of Econom
ics user on 24 Novem
ber 2020

Table A2. I-O linkages, relatedness and sectoral employment levels
(1) (2) (3) (4) (5) (6)Variables W WþBL WþFL WþBLþFL WþRL WþBLþFLþRL
MNE_num (ln) 0.0427*** 0.0333*** 0.0356*** 0.0331*** 0.0299*** 0.0300***(0.0113) (0.00947) (0.00949) (0.00934) (0.00898) (0.00897)
MNE_num_bl (ln) 0.123** 0.110** 0.0120(0.0485) (0.0485) (0.0555)
MNE_num_fl (ln) 0.0986** 0.0167 �0.0255(0.0457) (0.0434) (0.0419)
MNE_num_rel (ln) 0.0248*** 0.0263***(0.00823) (0.00996)
No_MNE (dummy) �0.0127 �0.0124 �0.0123 �0.0123 �0.0118 �0.0118(0.0130) (0.0130) (0.0130) (0.0130) (0.0130) (0.0130)
HK_tert 0.952*** 0.879** 0.886*** 0.876** 0.823** 0.825**(0.340) (0.340) (0.339) (0.340) (0.345) (0.345)
TotR&D 0.0107 0.0105 0.0106 0.0105 0.0110 0.0110(0.00915) (0.00893) (0.00893) (0.00892) (0.00906) (0.00911)
GDP (ln) 0.393*** 0.378*** 0.387*** 0.379*** 0.378*** 0.377***(0.137) (0.135) (0.136) (0.135) (0.135) (0.135)
PhK (ln) 0.0763*** 0.0756*** 0.0752*** 0.0755*** 0.0753*** 0.0754***(0.0198) (0.0197) (0.0197) (0.0197) (0.0196) (0.0196)
Firm_num (ln) 0.0940*** 0.0934*** 0.0936*** 0.0934*** 0.0935*** 0.0936***(0.00800) (0.00765) (0.00770) (0.00764) (0.00760) (0.00760)
MNE_num_sp (ln) 0.00419*** 0.00453*** 0.00434*** 0.00452*** 0.00423*** 0.00423***(0.000742) (0.000751) (0.000744) (0.000750) (0.000740) (0.000749)
Observations 75,547 75,547 75,547 75,547 75,547 75,547R2 0.026 0.027 0.027 0.027 0.027 0.027Number of reg_ind 15,515 15,515 15,515 15,515 15,515 15,515Sector_region FE Yes Yes Yes Yes Yes YesYear FE Yes Yes Yes Yes Yes YesR2 0.0264 0.0270 0.0268 0.0270 0.0275 0.0275
Notes: Clustered standard errors in parentheses. ***p< 0.01, **p< 0.05, *p< 0.1.
1196 � Cortinovis et al.
Dow
nloaded from https://academ
ic.oup.com/joeg/article/20/5/1165/5880238 by London School of Econom
ics user on 24 Novem
ber 2020

B. Further descriptives and data coverage
The table below (A4) provides an overview of the industries included in our sample. Thecodes are the two-digit industrial codes of the NACE classification, based on the 2008 revi-sion. These have been split in low knowledge and high-knowledge sectors based on the clas-sification provided by Eurostat13.
Table A3. Correlation table
Variables 1 2 3 4 5 6 7 8 9 10 11 12 13 14 15 16
Empl (ln) 1 1MNE_num (ln) 2 0.6 1
MNE_num_rel (ln) 3 0.33 0.56 1
MNE_num_bl (ln) 4 0.35 0.55 0.89 1
MNE_num_fl (ln) 5 0.38 0.58 0.89 0.93 1No_MNE (dummy) 6 �0.5 �0.57 �0.38 �0.39 �0.41 1
HK_tert 7 0.09 0.17 0.29 0.32 0.26 �0.13 1
TotR&D 8 0.12 0.13 0.21 0.24 0.21 �0.14 0.46 1
GDP (ln) 9 0.37 0.31 0.51 0.54 0.52 �0.27 0.41 0.44 1Firm_num (ln) 10 0.79 0.55 0.24 0.19 0.26 �0.39 0.02 0.04 0.24 1
PhK (ln) 11 0 0.01 0.01 �0.05 �0.02 0.05 �0.19 �0.11 �0.17 0.1 1
MNE_num_sp (ln) 12 0.25 0.31 0 �0.04 0 �0.18 0.01 0.01 0 0.29 0.01 1
iv_b_nor_eu 13 0.31 0.48 0.21 0.19 0.2 �0.17 0.09 0.05 0.19 0.35 0.02 0.29 1rel_iv_b_nor_eu 14 0.29 0.35 0.67 0.54 0.55 �0.21 0.28 0.15 0.56 0.29 0.01 0 0.25 1
dl_log_f10 15 0.6 0.98 0.55 0.54 0.57 �0.54 0.18 0.13 0.32 0.55 0.03 0.3 0.49 0.35 1
dl_rel_log_f10 16 0.34 0.57 0.99 0.88 0.88 �0.37 0.32 0.21 0.53 0.24 0.04 �0.01 0.21 0.68 0.56 1
Table A4. List of sectors
High knowledge ¼ Advanced manufacturing (in bold)
þ Knowledge-intensive services
Low knowledge
20 05 37
21 06 38
26 07 3927 08 41
28 09 42
29 10 43
30 11 4550 12 46
51 13 47
58 14 49
59 15 5260 16 53
61 17 55
62 18 56
63 19 6869 22 77
70 23 79
71 24 81
(continued)
13 Please find the classification at this link: https://ec.europa.eu/eurostat/statistics-explained/index.php/Glossary:High-tech_classification_of_manufacturing_industries.
MNEs, relatedness and employment � 1197
Dow
nloaded from https://academ
ic.oup.com/joeg/article/20/5/1165/5880238 by London School of Econom
ics user on 24 Novem
ber 2020
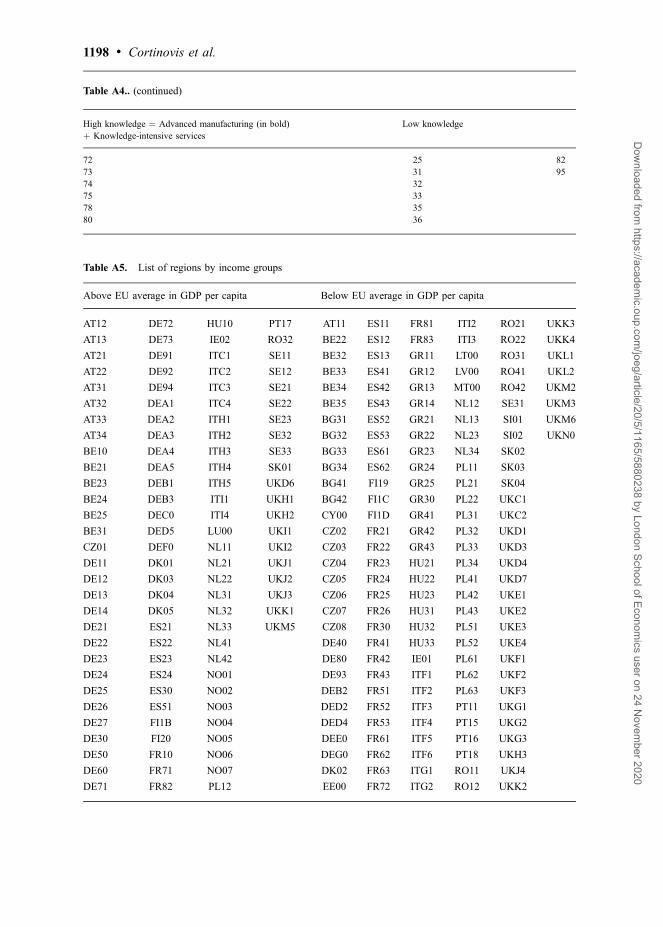
Table A5. List of regions by income groups
Above EU average in GDP per capita Below EU average in GDP per capita
AT12 DE72 HU10 PT17 AT11 ES11 FR81 ITI2 RO21 UKK3
AT13 DE73 IE02 RO32 BE22 ES12 FR83 ITI3 RO22 UKK4
AT21 DE91 ITC1 SE11 BE32 ES13 GR11 LT00 RO31 UKL1
AT22 DE92 ITC2 SE12 BE33 ES41 GR12 LV00 RO41 UKL2
AT31 DE94 ITC3 SE21 BE34 ES42 GR13 MT00 RO42 UKM2
AT32 DEA1 ITC4 SE22 BE35 ES43 GR14 NL12 SE31 UKM3
AT33 DEA2 ITH1 SE23 BG31 ES52 GR21 NL13 SI01 UKM6
AT34 DEA3 ITH2 SE32 BG32 ES53 GR22 NL23 SI02 UKN0
BE10 DEA4 ITH3 SE33 BG33 ES61 GR23 NL34 SK02
BE21 DEA5 ITH4 SK01 BG34 ES62 GR24 PL11 SK03
BE23 DEB1 ITH5 UKD6 BG41 FI19 GR25 PL21 SK04
BE24 DEB3 ITI1 UKH1 BG42 FI1C GR30 PL22 UKC1
BE25 DEC0 ITI4 UKH2 CY00 FI1D GR41 PL31 UKC2
BE31 DED5 LU00 UKI1 CZ02 FR21 GR42 PL32 UKD1
CZ01 DEF0 NL11 UKI2 CZ03 FR22 GR43 PL33 UKD3
DE11 DK01 NL21 UKJ1 CZ04 FR23 HU21 PL34 UKD4
DE12 DK03 NL22 UKJ2 CZ05 FR24 HU22 PL41 UKD7
DE13 DK04 NL31 UKJ3 CZ06 FR25 HU23 PL42 UKE1
DE14 DK05 NL32 UKK1 CZ07 FR26 HU31 PL43 UKE2
DE21 ES21 NL33 UKM5 CZ08 FR30 HU32 PL51 UKE3
DE22 ES22 NL41 DE40 FR41 HU33 PL52 UKE4
DE23 ES23 NL42 DE80 FR42 IE01 PL61 UKF1
DE24 ES24 NO01 DE93 FR43 ITF1 PL62 UKF2
DE25 ES30 NO02 DEB2 FR51 ITF2 PL63 UKF3
DE26 ES51 NO03 DED2 FR52 ITF3 PT11 UKG1
DE27 FI1B NO04 DED4 FR53 ITF4 PT15 UKG2
DE30 FI20 NO05 DEE0 FR61 ITF5 PT16 UKG3
DE50 FR10 NO06 DEG0 FR62 ITF6 PT18 UKH3
DE60 FR71 NO07 DK02 FR63 ITG1 RO11 UKJ4
DE71 FR82 PL12 EE00 FR72 ITG2 RO12 UKK2
Table A4.. (continued)
High knowledge ¼ Advanced manufacturing (in bold)þ Knowledge-intensive services
Low knowledge
72 25 82
73 31 95
74 32
75 3378 35
80 36
1198 � Cortinovis et al.
Dow
nloaded from https://academ
ic.oup.com/joeg/article/20/5/1165/5880238 by London School of Econom
ics user on 24 Novem
ber 2020
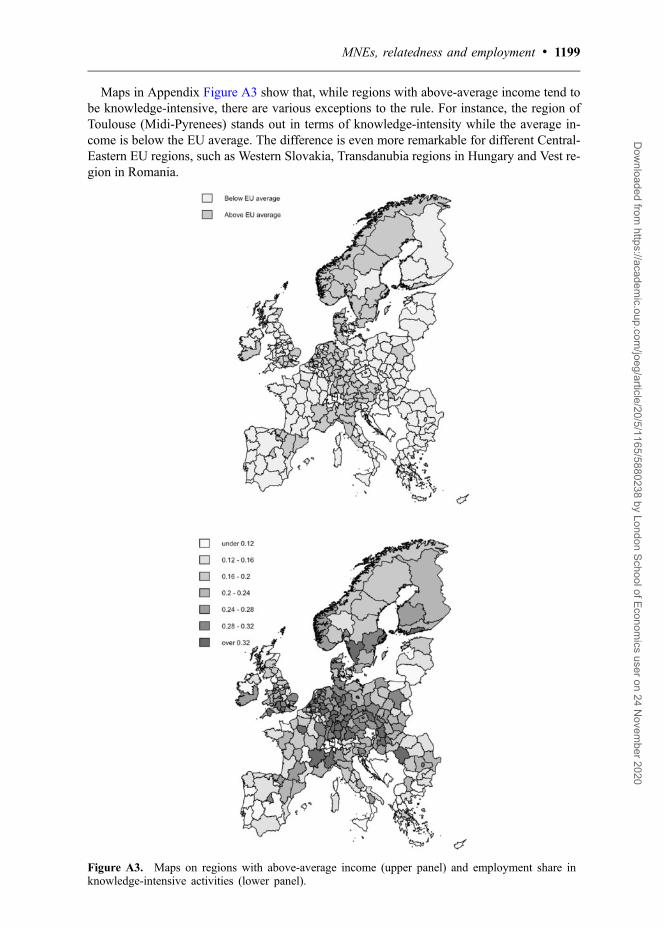
Maps in Appendix Figure A3 show that, while regions with above-average income tend tobe knowledge-intensive, there are various exceptions to the rule. For instance, the region ofToulouse (Midi-Pyrenees) stands out in terms of knowledge-intensity while the average in-come is below the EU average. The difference is even more remarkable for different Central-Eastern EU regions, such as Western Slovakia, Transdanubia regions in Hungary and Vest re-gion in Romania.
Figure A3. Maps on regions with above-average income (upper panel) and employment share inknowledge-intensive activities (lower panel).
MNEs, relatedness and employment � 1199
Dow
nloaded from https://academ
ic.oup.com/joeg/article/20/5/1165/5880238 by London School of Econom
ics user on 24 Novem
ber 2020

Tab
leA6.
First-stage
regressionsfor2S
LSin
Table
4(endogenousvariable:MNE_num
(ln))
(1)
(2)
(3)
(4)
(5)
(6)
(7)
(8)
(9)
(10)
(11)
(12)
Variables
First
stage—
All
First
stage—
All
First
stage—
All
First
stage—
LKI
Firststage
—Abav.
Reg.—
LKI
Firststage
—be
av.
REG.—
LKI
Firststage
—HKI
Firststage
—Abav.
Reg.—
HKI
Firststage
—Beav.
Reg.—
HKI
Firststage
—KIBS
Firststage
—Abav.
Reg.—
KIBS
Firststage
—Beav.
Reg.—
KIBS
iv_b
_nor_eu
0.00
134*
**0.00
128*
**0.00
0987
***
0.00
0496
**0.00
233*
**0.00
364*
**0.00
251*
**0.0118
***
0.00
343*
**0.00
230*
**0.0119
***
(0.000
369)
(0.000
385)
(0.000
331)
(0.000
206)
(0.000
863)
(0.000
738)
(0.000
652)
(0.002
86)
(0.000
742)
(0.000
663)
(0.003
10)
dl_log
_f10
0.04
66**
*0.04
45**
*0.05
57**
*0.04
14**
0.06
44**
*0.01
850.01
290.01
740.03
27*
0.02
360.03
10
(0.009
63)
(0.009
71)
(0.0110)
(0.016
4)(0.014
7)(0.015
2)(0.022
5)(0.019
7)(0.017
7)(0.027
7)(0.022
4)
No_
MNE(dum
my)
�0.06
18**
*�0.05
92**
*�0.05
94**
*�0.06
16**
*�0.07
26**
*�0.05
04**
*�0.05
58**
*�0.07
79**
*�0.03
31**
�0.04
39**
*�0.04
82*
�0.03
64*
(0.009
16)
(0.010
6)(0.010
7)(0.014
4)(0.025
5)(0.015
5)(0.015
9)(0.028
6)(0.016
3)(0.015
9)(0.025
2)(0.019
9)
HK_tert
0.67
4*0.72
4**
0.67
2*0.79
9**
1.41
7**
0.33
70.38
90.99
60.24
70.53
90.95
80.50
9
(0.346
)(0.364
)(0.359
)(0.355
)(0.617
)(0.406
)(0.456
)(0.773
)(0.512
)(0.517
)(0.917
)(0.568
)
TotR&D
�0.00
103
0.00
291
0.00
328
0.00
324
0.01
00*
�0.00
993
0.00
409
0.00
815
0.00
0315
0.00
328
0.00
773
0.00
240
(0.004
56)
(0.005
18)
(0.005
16)
(0.006
16)
(0.005
49)
(0.009
12)
(0.005
09)
(0.006
23)
(0.009
48)
(0.005
79)
(0.007
18)
(0.012
0)
GDP(ln)
0.03
280.02
790.02
580.00
692
�0.81
8***
0.07
470.07
06�1.32
1***
0.25
5**
0.06
84�1.43
0***
0.21
3
(0.081
4)(0.095
2)(0.094
0)(0.090
9)(0.314
)(0.084
0)(0.125
)(0.358
)(0.119
)(0.162
)(0.496
)(0.161
)
Firm_n
um(ln)
0.02
09**
*0.01
63**
*0.01
62**
*0.01
57**
*0.01
370.01
83**
*0.01
69**
0.01
010.02
25**
*0.01
79*
0.00
484
0.03
12**
*
(0.004
69)
(0.004
99)
(0.004
97)
(0.005
33)
(0.013
5)(0.004
98)
(0.007
70)
(0.013
6)(0.008
20)
(0.009
19)
(0.014
6)(0.009
54)
PhK
(ln)
0.01
290.02
430.02
610.04
510.00
529
0.04
36�0.00
279
�0.03
420.01
70�0.02
07�0.08
680.02
50
(0.016
6)(0.032
3)(0.032
2)(0.030
5)(0.061
7)(0.034
8)(0.042
1)(0.077
0)(0.049
1)(0.053
4)(0.106
)(0.065
1)
Neigh
.MNEs(ln)
0.00
731*
**0.00
325*
**0.00
320*
**0.00
598*
**0.00
719*
**0.00
528*
**�0.00
258
�0.00
600*
*�0.00
0528
�0.00
356*
*�0.00
694*
*�0.00
149
(0.000
681)
(0.000
974)
(0.000
975)
(0.001
26)
(0.001
94)
(0.001
65)
(0.001
60)
(0.002
68)
(0.001
94)
(0.001
76)
(0.003
07)
(0.002
08)
Observations
75,506
46,071
46,071
28,390
11,173
17,217
17,681
7364
10,317
12,617
5280
7337
Num
berof
reg_
ind
15,474
15,428
15,428
9511
3747
5764
5917
2465
3452
4217
1765
2452
Sector_regionFE
Yes
Yes
Yes
Yes
Yes
Yes
Yes
Yes
Yes
Yes
Yes
Yes
YearFE
Yes
Yes
Yes
Yes
Yes
Yes
Yes
Yes
Yes
Yes
Yes
Yes
Notes:Clustered
standard
errors
inparentheses.
***p<0.01,**p<0.05,*p<0.1.
C.F
irst
stag
eof
IVregressions
1200 � Cortinovis et al.
Dow
nloaded from https://academ
ic.oup.com/joeg/article/20/5/1165/5880238 by London School of Econom
ics user on 24 Novem
ber 2020

Tab
leA7.
First-stage
regressionsfor2S
LSin
Table
5(endogenousvariable:MNE_num
_rel
(ln))
(1)
(2)
(3)
(4)
(5)
(6)
(7)
(8)
(9)
(10)
(11)
(12)
Variables
Firststage
—All
Firststage
—All
Firststage
—All
Firststage
—LKI
Firststage
—Abav.
Reg.—
LKI
Firststage
—Beav.
Reg.—
LKI
Firststage
—HKI
Firststage
—Abav.
Reg.—
HKI
Firststage
—Beav.
Reg.—
HKI
Firststage
—KIBS
Firststage
—Abav.
Reg.—
KIBS
Firststage
—Beav.
Reg.—
KIBS
rel_iv_b_nor_eu
0.00747***
0.00525***
0.00507***
0.00211
0.00961*
0.00524***
0.00286**
0.0124**
0.00502***
0.00256*
0.0123**
(0.00142)
(0.00135)
(0.00155)
(0.00152)
(0.00519)
(0.00130)
(0.00131)
(0.00521)
(0.00134)
(0.00139)
(0.00580)
dl_rel_log_f10
0.317***
0.289***
0.292***
0.300***
0.302***
0.286***
0.290***
0.291***
0.285***
0.284***
0.292***
(0.0338)
(0.0357)
(0.0372)
(0.0620)
(0.0466)
(0.0371)
(0.0713)
(0.0435)
(0.0390)
(0.0775)
(0.0457)
MNE_num
(ln)
0.468***
0.371***
0.363***
0.291***
0.384***
0.185***
0.471***
0.617***
0.286***
0.559***
0.737***
0.333***
(0.0571)
(0.0397)
(0.0389)
(0.0356)
(0.0638)
(0.0354)
(0.0537)
(0.0795)
(0.0593)
(0.0644)
(0.0937)
(0.0704)
No_MNE(dum
my)�0.0577***�0.0836***�0.0867***�0.0781***�0.0751*�0.0575**�0.0978***�0.129***
�0.0392
�0.116***�0.166***
�0.0419
(0.0192)
(0.0186)
(0.0185)
(0.0221)
(0.0387)
(0.0229)
(0.0277)
(0.0432)
(0.0331)
(0.0346)
(0.0531)
(0.0399)
HK_tert
3.103
2.761
1.370
1.534
5.541
�0.269
1.172
4.244
0.521
0.916
3.963
0.525
(2.114)
(2.084)
(2.018)
(1.966)
(3.492)
(2.239)
(2.249)
(4.065)
(2.668)
(2.584)
(4.775)
(3.102)
TotR&D
0.00296
0.0235
0.0339
0.0196
0.0677**
�0.0721
0.0572
0.130***
�0.0568
0.0697
0.157***
�0.0604
(0.0291)
(0.0401)
(0.0392)
(0.0360)
(0.0310)
(0.0490)
(0.0456)
(0.0442)
(0.0575)
(0.0521)
(0.0517)
(0.0661)
GDP(ln)
0.579
�0.647
�0.661
�0.411
�6.813***
0.221
�1.128
�9.557***
�0.0240
�1.143
�10.71***
�0.122
(0.512)
(0.600)
(0.571)
(0.509)
(1.599)
(0.475)
(0.743)
(1.965)
(0.700)
(0.899)
(2.414)
(0.970)
Firm_num
(ln)
0.0321
�0.0119
�0.0128
0.00245
�0.00462
0.0168
�0.0337
�0.0801*
0.0142
�0.0391
�0.0764
0.0172
(0.0279)
(0.0196)
(0.0193)
(0.0179)
(0.0417)
(0.0164)
(0.0289)
(0.0479)
(0.0283)
(0.0364)
(0.0542)
(0.0373)
PhK
(ln)
0.0213
�0.130
�0.0755
�0.0379
�0.167
�0.0727
�0.123
�0.364
�0.0306
�0.205
�0.510
0.00169
(0.118)
(0.168)
(0.165)
(0.160)
(0.340)
(0.169)
(0.194)
(0.332)
(0.235)
(0.259)
(0.398)
(0.352)
Neigh.MNEs(ln)�0.00393***�0.0111***�0.0119***�0.00853***�0.0192***
0.000131�0.0172***�0.0301***�0.00593*�0.0182***�0.0312***�0.00525
(0.00137)
(0.00247)
(0.00246)
(0.00215)
(0.00392)
(0.00188)
(0.00333)
(0.00530)
(0.00351)
(0.00345)
(0.00551)
(0.00343)
Observations
75,506
46,071
46,071
28,390
11,173
17,217
17,681
7364
10,317
12,617
5280
7337
Num
berof
reg_ind
15,474
15,428
15,428
9511
3747
5764
5917
2465
3452
4217
1765
2452
Sector_regionFE
Yes
Yes
Yes
Yes
Yes
Yes
Yes
Yes
Yes
Yes
Yes
Yes
YearFE
Yes
Yes
Yes
Yes
Yes
Yes
Yes
Yes
Yes
Yes
Yes
Yes
Notes:Clustered
standard
errors
inparentheses.***p<0.01,**p<0.05,*p<0.1.
MNEs, relatedness and employment � 1201
Dow
nloaded from https://academ
ic.oup.com/joeg/article/20/5/1165/5880238 by London School of Econom
ics user on 24 Novem
ber 2020

D. Data development
The main sources used in this article are the Eurostat SBS, Cambridge EconometricsRegional Database and Bureau Van Dijk Orbis and Zephyr databases. As for the former twosources, no significant elaboration was performed. The only exception is the nearest neigh-bour interpolation order to fill gaps in the data, mostly on SBS employment data andEurostat R&D and human capital information. Besides, whereas SBS provides data on em-ployment from 2008, we decided to exclude 2008 as, out of the 15,369 observations for thatyear, around 4500 are flagged as potentially problematic.The treatment of BVD data was instead more complex. Orbis database provides detailed
information at firm level on sector of operation, number of employees, registration date andlast available year. Zephyr instead gathers information on Merger and Acquisition (M&A)deals, reporting the name and code of the firms involved, the stake of the deal, the date, etc.Data on 18 million firms in the period 2006–2014 (from Orbis) and on more than17,000M&A deals between 1997 and 2014 (from Zephyr) were downloaded, cleaned andgeo-coded14 (Kalemli-Ozcan et al., 2015). Whereas Orbis provides information on whether agiven firm is foreign owned or not, and with what share of ownership, only the most recentinformation is recorded with no historical records about ownership. In other words, past in-formation on ownership, such as whether a given firm was already foreign-owned and whenit was acquired, is not provided.In order to overcome this obstacle, information on M&A from Zephyr was used to estab-
lish when a domestic firm acquired or was acquired by a foreign company. After mergingdata from Zephyr and Orbis, we proceeded as follows:
1. Firms that are present in both Orbis and Zephyr are considered as MNE from theyear in which the first M&A in which they were involved took place. For instance,Firm A is acquired by the MNE B in 2008: Firm A becomes MNE from 2008 on.
2. Firms that are recorded as foreign in Orbis but missing in Zephyr are assumed to beMNE throughout the whole period. In this way, our dataset is also able to capture,at least to some extent, greenfield investments, previous M&A and deals whichwere not reported in Zephyr.
We exclude each firm from the dataset for the years subsequent to the last available yearrecorded in Orbis. For example, Firm A, which was acquired by MNE B in 2008, providedinformation to its local chamber of commerce only until 2011. As 2011 is its last availableyear, Firm A is considered as domestic firm in the years 2006 and 2007 (period preceding itsacquisition), is counted as MNE between 2008 and 2011 (after the first detected M&A), andexcluded from the sample in 2012 and 2013 (since no information is reported after 2011).Besides, we considered as MNE only those firms which are owned at least at 10% by a for-eign counterpart.As the last step, firm-level data from the dataset obtained after these operations have been
collapsed to the second digit of NACE code, in order to be compatible with the data obtainedfrom Eurostat SBS. As a robustness check, we compute the correlation between the employ-ment data constructed from Orbis and the one provided by SBS. The overall correlation be-tween the two datasets is a re-assuring, being above 75%.
14 For our analysis, we included only information on firms with unconsolidated accounts, in order to avoid intro-ducing some bias (Oberhofer, 2013; Kalemli-Ozcan et al. 2015).
1202 � Cortinovis et al.
Dow
nloaded from https://academ
ic.oup.com/joeg/article/20/5/1165/5880238 by London School of Econom
ics user on 24 Novem
ber 2020
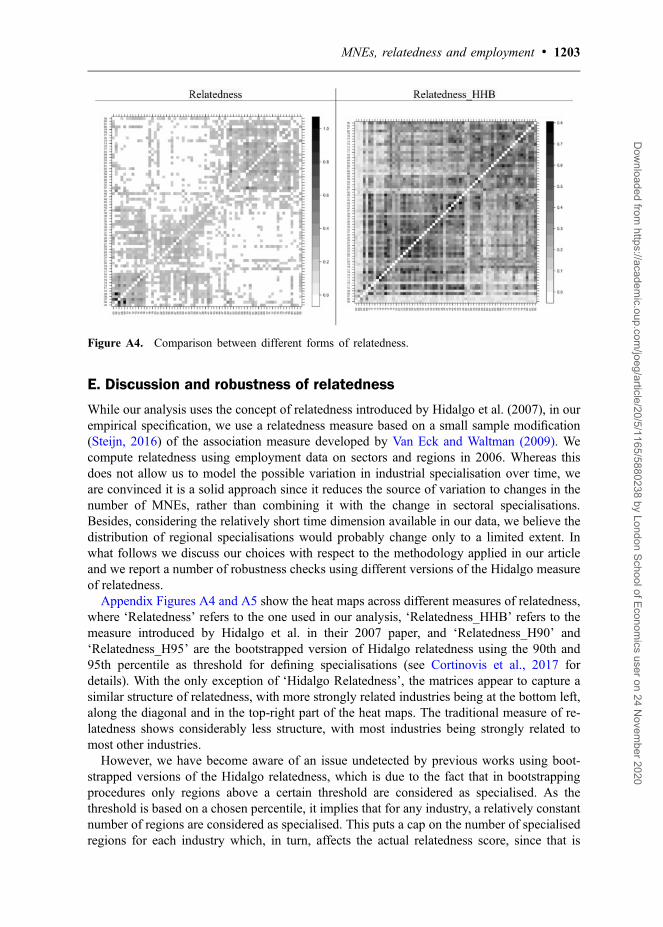
E. Discussion and robustness of relatedness
While our analysis uses the concept of relatedness introduced by Hidalgo et al. (2007), in ourempirical specification, we use a relatedness measure based on a small sample modification(Steijn, 2016) of the association measure developed by Van Eck and Waltman (2009). Wecompute relatedness using employment data on sectors and regions in 2006. Whereas thisdoes not allow us to model the possible variation in industrial specialisation over time, weare convinced it is a solid approach since it reduces the source of variation to changes in thenumber of MNEs, rather than combining it with the change in sectoral specialisations.Besides, considering the relatively short time dimension available in our data, we believe thedistribution of regional specialisations would probably change only to a limited extent. Inwhat follows we discuss our choices with respect to the methodology applied in our articleand we report a number of robustness checks using different versions of the Hidalgo measureof relatedness.Appendix Figures A4 and A5 show the heat maps across different measures of relatedness,
where ‘Relatedness’ refers to the one used in our analysis, ‘Relatedness_HHB’ refers to themeasure introduced by Hidalgo et al. in their 2007 paper, and ‘Relatedness_H90’ and‘Relatedness_H95’ are the bootstrapped version of Hidalgo relatedness using the 90th and95th percentile as threshold for defining specialisations (see Cortinovis et al., 2017 fordetails). With the only exception of ‘Hidalgo Relatedness’, the matrices appear to capture asimilar structure of relatedness, with more strongly related industries being at the bottom left,along the diagonal and in the top-right part of the heat maps. The traditional measure of re-latedness shows considerably less structure, with most industries being strongly related tomost other industries.However, we have become aware of an issue undetected by previous works using boot-
strapped versions of the Hidalgo relatedness, which is due to the fact that in bootstrappingprocedures only regions above a certain threshold are considered as specialised. As thethreshold is based on a chosen percentile, it implies that for any industry, a relatively constantnumber of regions are considered as specialised. This puts a cap on the number of specialisedregions for each industry which, in turn, affects the actual relatedness score, since that is
Figure A4. Comparison between different forms of relatedness.
MNEs, relatedness and employment � 1203
Dow
nloaded from https://academ
ic.oup.com/joeg/article/20/5/1165/5880238 by London School of Econom
ics user on 24 Novem
ber 2020

Figure
A5.
Com
parisonbetweendifferentform
sof
relatedness(bootstrapping).
1204 � Cortinovis et al.
Dow
nloaded from https://academ
ic.oup.com/joeg/article/20/5/1165/5880238 by London School of Econom
ics user on 24 Novem
ber 2020
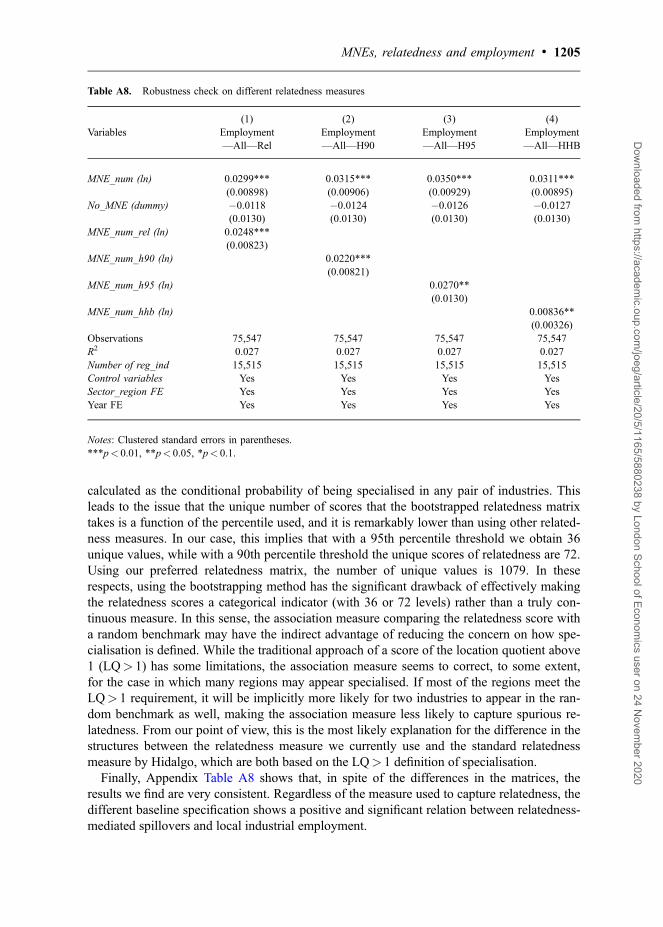
calculated as the conditional probability of being specialised in any pair of industries. Thisleads to the issue that the unique number of scores that the bootstrapped relatedness matrixtakes is a function of the percentile used, and it is remarkably lower than using other related-ness measures. In our case, this implies that with a 95th percentile threshold we obtain 36unique values, while with a 90th percentile threshold the unique scores of relatedness are 72.Using our preferred relatedness matrix, the number of unique values is 1079. In theserespects, using the bootstrapping method has the significant drawback of effectively makingthe relatedness scores a categorical indicator (with 36 or 72 levels) rather than a truly con-tinuous measure. In this sense, the association measure comparing the relatedness score witha random benchmark may have the indirect advantage of reducing the concern on how spe-cialisation is defined. While the traditional approach of a score of the location quotient above1 (LQ> 1) has some limitations, the association measure seems to correct, to some extent,for the case in which many regions may appear specialised. If most of the regions meet theLQ> 1 requirement, it will be implicitly more likely for two industries to appear in the ran-dom benchmark as well, making the association measure less likely to capture spurious re-latedness. From our point of view, this is the most likely explanation for the difference in thestructures between the relatedness measure we currently use and the standard relatednessmeasure by Hidalgo, which are both based on the LQ> 1 definition of specialisation.Finally, Appendix Table A8 shows that, in spite of the differences in the matrices, the
results we find are very consistent. Regardless of the measure used to capture relatedness, thedifferent baseline specification shows a positive and significant relation between relatedness-mediated spillovers and local industrial employment.
Table A8. Robustness check on different relatedness measures
(1) (2) (3) (4)Variables Employment
—All—RelEmployment—All—H90
Employment—All—H95
Employment—All—HHB
MNE_num (ln) 0.0299*** 0.0315*** 0.0350*** 0.0311***(0.00898) (0.00906) (0.00929) (0.00895)
No_MNE (dummy) �0.0118 �0.0124 �0.0126 �0.0127(0.0130) (0.0130) (0.0130) (0.0130)
MNE_num_rel (ln) 0.0248***(0.00823)
MNE_num_h90 (ln) 0.0220***(0.00821)
MNE_num_h95 (ln) 0.0270**(0.0130)
MNE_num_hhb (ln) 0.00836**(0.00326)
Observations 75,547 75,547 75,547 75,547R2 0.027 0.027 0.027 0.027Number of reg_ind 15,515 15,515 15,515 15,515Control variables Yes Yes Yes YesSector_region FE Yes Yes Yes YesYear FE Yes Yes Yes Yes
Notes: Clustered standard errors in parentheses.***p< 0.01, **p< 0.05, *p< 0.1.
MNEs, relatedness and employment � 1205
Dow
nloaded from https://academ
ic.oup.com/joeg/article/20/5/1165/5880238 by London School of Econom
ics user on 24 Novem
ber 2020
Related Documents