Multimodality Imaging Population Analysis using Manifold Learning Jean-Baptiste Fiot 1,2 Laurent D. Cohen 1 Pierrick Bourgeat 2 Parnesh Raniga 2 Oscar Acosta 2,3,4 Victor Villemagne 5,6 Olivier Salvado 2 Jurgen Fripp 2 1 CEREMADE, UMR 7534 CNRS Universit´ e Paris Dauphine, France 2 CSIRO Preventative Health National Research Flagship ICTC,The Australian e-Health Research Centre - BioMedIA, Royal Brisbane and Women’s Hospital, Herston, QLD, Australia 3 INSERM, U 642, Rennes, F-35000, France 4 Universit´ e de Rennes 1, LTSI, F-35000, France 5 Department of Nuclear Medicine and Centre for PET, and Department of Medicine, University of Melbourne, Austin Hospital, Melbourne, VIC, Australia 6 The Mental Health Research Institute, University of Melbourne, Parkville, VIC, Australia Characterizing the variations in anatomy and tissue properties in large populations is a challenging problem in medical imaging. Various statistical analysis, dimension reduction and clustering techniques have been developed to reach this goal. These techniques can provide insight into the effects of demographic and genetic factors on disease progression. They can also be used to improve the accuracy and remove biases in various image segmentation and registration algorithms. In this paper we explore the potential of some non linear dimensionality reduction (NLDR) techniques to establish simple imaging indicators of ageing and Alzheimers Disease (AD) on a large population of multimodality brain images (Magnetic Resonance Imaging (MRI) and PiB Positron Emission Tomography (PET)) composed of 218 patients including healthy control, mild cognitive impairment and AD. Using T1-weighted MR images, we found using laplacian eigenmaps that the main variation across this population was the size of the ventricles. For the grey matter signal in PiB PET images, we built manifolds that showed transition from low to high PiB retention. The combination of the two modalities generated a manifold with different areas that corresponded to different ventricle sizes and beta-amyloid loads. Keywords: Population Analysis, Non Linear Dimensionality Reduction, Manifold Learning, Brain Imaging 1 INTRODUCTION Analysing trends and modes in a population, as well as computing meaningful regressions, are chal- lenges in the field of medical imaging. A consider- able amount of work has been done to simplify the use of medical images for clinicians, and summaris- ing the information in just few imaging biomarkers, that would for example quantify and easily allow the interpretation of disease evolution. This is of great in- terest not only for clinical diagnosis, but also to study clinical studies and stratify cohorts during clinical tri- als. Large medical databases challenge manual anal- ysis of a population. Unbiased atlases can be used to describe a population (Lorenzen et al. 2005). (Blezek and Miller 2007) introduced the atlas strati- fication technique, discovering modes of variation in a population using a mean shift algorithm. (Sabuncu et al. 2009) introduced iCluster, a clustering algo- rithm computing multiple templates that represent different modes in the population. (Davis et al. 2007) demonstrated the use of manifold kernel regression to regress the images with regard to a known pa- rameter, such as age. (Wolz et al. 2009) introduced the Learning Embeddings for Atlas Propagation tech- nique, and showed that the use of manifold learning can improve the segmentation results compared to the simple use of image similarity in multi-atlas segmen- tation techniques. (Gerber et al. 2010) developed a generative model to describe the population of brain images, under the assumption that the whole popu- lation derive from a small number of brains. These techniques usually rely on computations of diffeo- morphisms or transformations to compute distances 1 hal-00662345, version 1 - 23 Jan 2012 Author manuscript, published in "VipIMAGE 2011 - III ECCOMAS THEMATIC CONFERENCE ON COMPUTATIONAL VISION AND MEDICAL IMAGE PROCESSING, Olhão : Portugal (2011)"

Welcome message from author
This document is posted to help you gain knowledge. Please leave a comment to let me know what you think about it! Share it to your friends and learn new things together.
Transcript
Multimodality Imaging Population Analysis using Manifold Learning
Jean-Baptiste Fiot 1,2 Laurent D. Cohen 1 Pierrick Bourgeat 2 Parnesh Raniga 2
Oscar Acosta2,3,4 Victor Villemagne 5,6 Olivier Salvado 2 Jurgen Fripp 2
1 CEREMADE, UMR 7534 CNRS Universite Paris Dauphine, France2 CSIRO Preventative Health National Research Flagship ICTC,The Australian e-Health Research Centre- BioMedIA, Royal Brisbane and Women’s Hospital, Herston, QLD, Australia3 INSERM, U 642, Rennes, F-35000, France4 Universite de Rennes 1, LTSI, F-35000, France5 Department of Nuclear Medicine and Centre for PET, and Department of Medicine, University of Melbourne,Austin Hospital, Melbourne, VIC, Australia6 The Mental Health Research Institute, University of Melbourne, Parkville, VIC, Australia
Characterizing the variations in anatomy and tissue properties in large populations is a challenging problemin medical imaging. Various statistical analysis, dimension reduction and clustering techniques have beendeveloped to reach this goal. These techniques can provide insight into the effects of demographic and geneticfactors on disease progression. They can also be used to improve the accuracy and remove biases in variousimage segmentation and registration algorithms. In this paper we explore the potential of some non lineardimensionality reduction (NLDR) techniques to establish simple imaging indicators of ageing and AlzheimersDisease (AD) on a large population of multimodality brain images (Magnetic Resonance Imaging (MRI) andPiB Positron Emission Tomography (PET)) composed of 218 patients including healthy control, mild cognitiveimpairment and AD. Using T1-weighted MR images, we found using laplacian eigenmaps that the mainvariation across this population was the size of the ventricles. For the grey matter signal in PiB PET images, webuilt manifolds that showed transition from low to high PiB retention. The combination of the two modalitiesgenerated a manifold with different areas that corresponded to different ventricle sizes and beta-amyloid loads.
Keywords: Population Analysis, Non Linear Dimensionality Reduction, Manifold Learning, Brain Imaging
1 INTRODUCTION
Analysing trends and modes in a population, aswell as computing meaningful regressions, are chal-lenges in the field of medical imaging. A consider-able amount of work has been done to simplify theuse of medical images for clinicians, and summaris-ing the information in just few imaging biomarkers,that would for example quantify and easily allow theinterpretation of disease evolution. This is of great in-terest not only for clinical diagnosis, but also to studyclinical studies and stratify cohorts during clinical tri-als.
Large medical databases challenge manual anal-ysis of a population. Unbiased atlases can be usedto describe a population (Lorenzen et al. 2005).(Blezek and Miller 2007) introduced the atlas strati-fication technique, discovering modes of variation in
a population using a mean shift algorithm. (Sabuncuet al. 2009) introduced iCluster, a clustering algo-rithm computing multiple templates that representdifferent modes in the population. (Davis et al. 2007)demonstrated the use of manifold kernel regressionto regress the images with regard to a known pa-rameter, such as age. (Wolz et al. 2009) introducedthe Learning Embeddings for Atlas Propagation tech-nique, and showed that the use of manifold learningcan improve the segmentation results compared to thesimple use of image similarity in multi-atlas segmen-tation techniques. (Gerber et al. 2010) developed agenerative model to describe the population of brainimages, under the assumption that the whole popu-lation derive from a small number of brains. Thesetechniques usually rely on computations of diffeo-morphisms or transformations to compute distances
1
hal-0
0662
345,
ver
sion
1 -
23 J
an 2
012
Author manuscript, published in "VipIMAGE 2011 - III ECCOMAS THEMATIC CONFERENCE ON COMPUTATIONAL VISIONAND MEDICAL IMAGE PROCESSING, Olhão : Portugal (2011)"
between images. Alternatively it is also possible touse dimensionality reduction techniques directly onthe image pixels intensities (Wolz et al. 2009), aswe propose in this paper. Most dimensionality reduc-tion techniques rely either on information theory orgeometry. Information-based assumptions can be re-lated to the maximum of variance (Principal Com-ponent Analysis (PCA), kernel Principal ComponentAnalysis (kPCA)), entropy measure, etc. Geomet-ric assumptions are either global (Multi DimensionScaling (MDS), ISOmetric MAPping (ISOMAP)), orlocal (Local Linear Embeddings (LLE), LaplacianEigenmaps (LEM), Hessian Eigenmaps (HEM), Dif-fusion Maps (DM), Local Tangent Space Alignment(LTSA)). References to these algorithms can be foundin (van der Maaten et al. 2007).
In this publication, we examine the use of NLDRtechniques to analyse multi-modality brain images.AD is associated with the deposition in the brain ofamyloid plaques, which can be imaged with PET us-ing the Pittsburgh compound B markers (PiB), andwith brain atrophy, which can be imaged with MRIT1 weighted (T1-w) images. We are investigating theuse of manifold learning techniques for studying PET-PiB and T1-w.
2 MATERIAL AND METHODS2.1 DataThe dataset is composed of 218 patients from theAIBL study (Ellis et al. 2009). T1-w (image matrix60x240x256, image spacing of 1.2x1x1 mm in thesagittal, coronal and axial directions, TR=2300ms,TR=2.98ms, TI=900ms, flip angle=9◦) and PiB (re-constructed image matrix 28x128x90, 2x2x2mmspacing) scans were acquired.
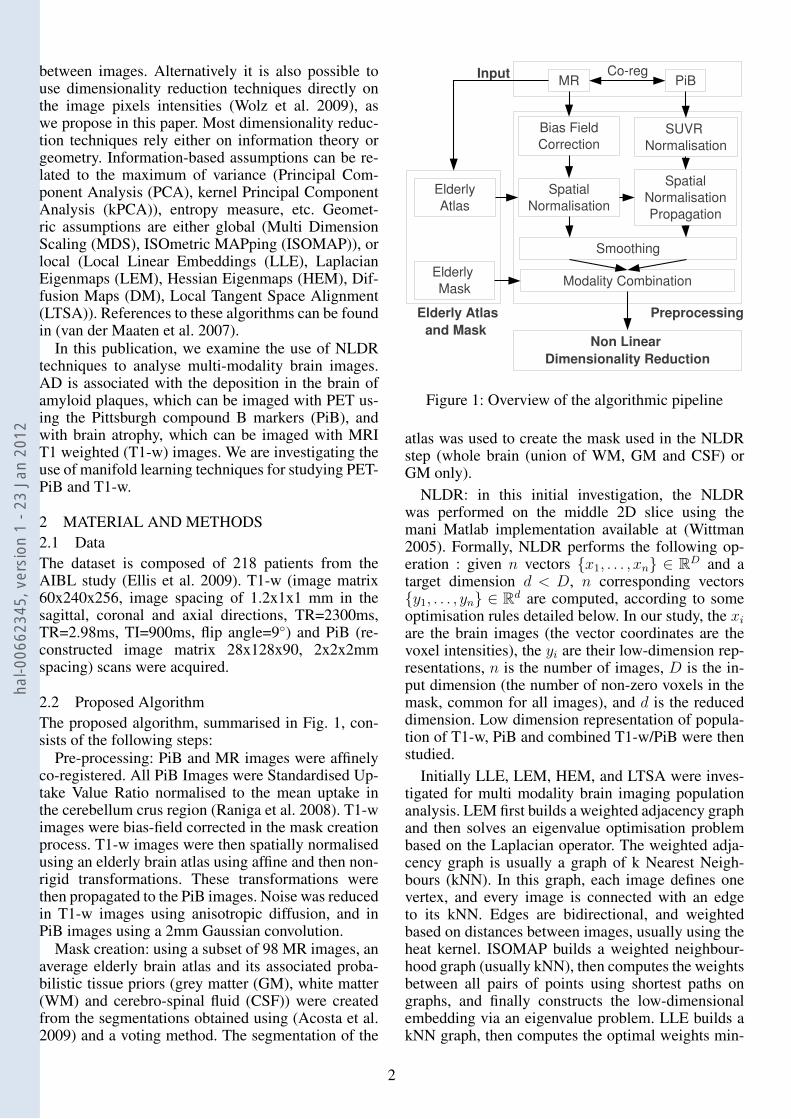
2.2 Proposed AlgorithmThe proposed algorithm, summarised in Fig. 1, con-sists of the following steps:
Pre-processing: PiB and MR images were affinelyco-registered. All PiB Images were Standardised Up-take Value Ratio normalised to the mean uptake inthe cerebellum crus region (Raniga et al. 2008). T1-wimages were bias-field corrected in the mask creationprocess. T1-w images were then spatially normalisedusing an elderly brain atlas using affine and then non-rigid transformations. These transformations werethen propagated to the PiB images. Noise was reducedin T1-w images using anisotropic diffusion, and inPiB images using a 2mm Gaussian convolution.
Mask creation: using a subset of 98 MR images, anaverage elderly brain atlas and its associated proba-bilistic tissue priors (grey matter (GM), white matter(WM) and cerebro-spinal fluid (CSF)) were createdfrom the segmentations obtained using (Acosta et al.2009) and a voting method. The segmentation of the
MR
Elderly Mask
SUVR Normalisation
Non Linear Dimensionality Reduction
Input
Preprocessing
PiBCoreg
Elderly Atlas and Mask
Modality Combination
Smoothing
Bias Field Correction
Elderly Atlas
Spatial NormalisationPropagation
Spatial Normalisation
Figure 1: Overview of the algorithmic pipeline
atlas was used to create the mask used in the NLDRstep (whole brain (union of WM, GM and CSF) orGM only).
NLDR: in this initial investigation, the NLDRwas performed on the middle 2D slice using themani Matlab implementation available at (Wittman2005). Formally, NLDR performs the following op-eration : given n vectors {x1, . . . , xn} ∈ RD and atarget dimension d < D, n corresponding vectors{y1, . . . , yn} ∈ Rd are computed, according to someoptimisation rules detailed below. In our study, the xiare the brain images (the vector coordinates are thevoxel intensities), the yi are their low-dimension rep-resentations, n is the number of images, D is the in-put dimension (the number of non-zero voxels in themask, common for all images), and d is the reduceddimension. Low dimension representation of popula-tion of T1-w, PiB and combined T1-w/PiB were thenstudied.
Initially LLE, LEM, HEM, and LTSA were inves-tigated for multi modality brain imaging populationanalysis. LEM first builds a weighted adjacency graphand then solves an eigenvalue optimisation problembased on the Laplacian operator. The weighted adja-cency graph is usually a graph of k Nearest Neigh-bours (kNN). In this graph, each image defines onevertex, and every image is connected with an edgeto its kNN. Edges are bidirectional, and weightedbased on distances between images, usually using theheat kernel. ISOMAP builds a weighted neighbour-hood graph (usually kNN), then computes the weightsbetween all pairs of points using shortest paths ongraphs, and finally constructs the low-dimensionalembedding via an eigenvalue problem. LLE builds akNN graph, then computes the optimal weights min-
2
hal-0
0662
345,
ver
sion
1 -
23 J
an 2
012
imising the sum of the errors of linear reconstructionsin the high dimensional space, and finally solve aneigenvalue problem to map to embedded coordinates.HEM identifies the kNN, obtains tangent coordinatesby singular value decomposition, and then computesthe embedding coordinates using the Hessian operatorand eigenanalysis. LTSA uses the tangent space in theneighbourhood of a data point (typically the kNN) torepresent the local geometry, and then align those tan-gent spaces to construct the global coordinate systemfor the nonlinear manifold by minimizing the align-ment error for the global coordinate learning.
Although we initially investigated several algo-rithms, we only report the LEM results as it was theonly method we found to give stable manifold struc-tures and that did not lead to numerical issues. Inparticular, HEM was found to have a prohibitive pro-cessing time. On our data, LLE had numerical stabil-ity problems that resulted from nearly-singular matri-ces (some eigenvalues being close to zero). LTSA didnot reveal any meaningful manifold structures on ourdata. Moreover, several target dimensions were ini-tially investigated, however we only report the resultsof 2D dimensional manifolds within, as they providedmore stable and meaningful structures.
As the following results were computed using LEM(Belkin and Niyogi 2003), here are additional detailsabout this algorithm. LEM aims is a distance-baseddimensionality reduction algorithm. It aims at mini-mizing a weighted sum of the distances in the finalspace (equation 1). The closer are the points in theoriginal space, the higher are the weights.
φ(Y ) =∑ij
wij||yi − yj||2 (1)
First a graph is built with edges connecting nearbypoints to each other. There are 2 variants: ε-graph(nodes i and j are connected if ||xi − xj||2 ≤ ε)and K-NN graph (nodes i and j are connected if iis among the K nearest neighbors of j or j is theamong K nearest neighbors of i). In this paper, theK-NN version is used. The default K parameter from(Wittman 2005) (K = 8) was used. The robustnessof the manifold with regard to K was also analysed.Second the edge weights are computed. Two variants
are available: heat kernel (wij = e−||xi−xj ||
2
σ if nodes iand j are connected, 0 otherwise) and simple-minded(wij = 1 if nodes i and j are connected, 0 otherwise).In this paper, we are using the simple-minded ver-sion (equivalent to a heat kernel version with σ =∞).Third, the eigenmaps are computed. Let the the de-gree matrix D of W be the diagonal matrix withdii =
∑j wij . The graph Laplacian L is computed by
L = D −W . The optimization problem can be re-written:
φ(Y ) = 2Y TLY (2)
� �
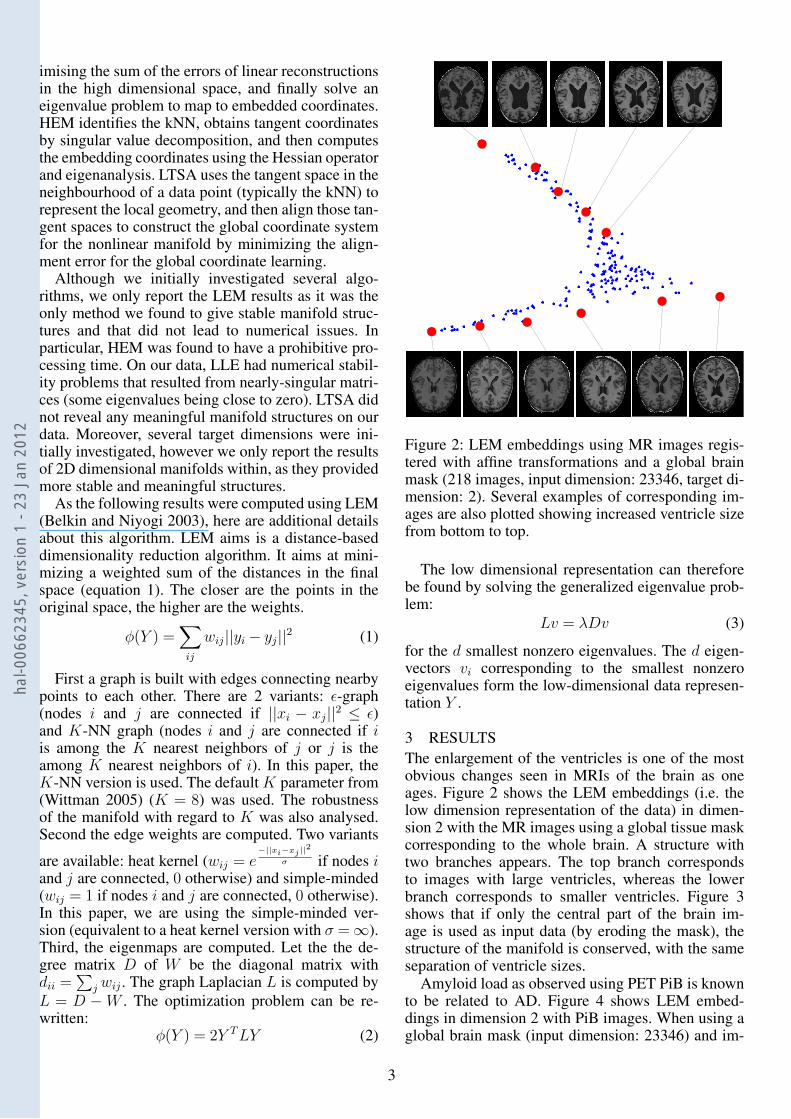
Figure 2: LEM embeddings using MR images regis-tered with affine transformations and a global brainmask (218 images, input dimension: 23346, target di-mension: 2). Several examples of corresponding im-ages are also plotted showing increased ventricle sizefrom bottom to top.
The low dimensional representation can thereforebe found by solving the generalized eigenvalue prob-lem:
Lv = λDv (3)
for the d smallest nonzero eigenvalues. The d eigen-vectors vi corresponding to the smallest nonzeroeigenvalues form the low-dimensional data represen-tation Y .
3 RESULTSThe enlargement of the ventricles is one of the mostobvious changes seen in MRIs of the brain as oneages. Figure 2 shows the LEM embeddings (i.e. thelow dimension representation of the data) in dimen-sion 2 with the MR images using a global tissue maskcorresponding to the whole brain. A structure withtwo branches appears. The top branch correspondsto images with large ventricles, whereas the lowerbranch corresponds to smaller ventricles. Figure 3shows that if only the central part of the brain im-age is used as input data (by eroding the mask), thestructure of the manifold is conserved, with the sameseparation of ventricle sizes.
Amyloid load as observed using PET PiB is knownto be related to AD. Figure 4 shows LEM embed-dings in dimension 2 with PiB images. When using aglobal brain mask (input dimension: 23346) and im-
3
hal-0
0662
345,
ver
sion
1 -
23 J
an 2
012
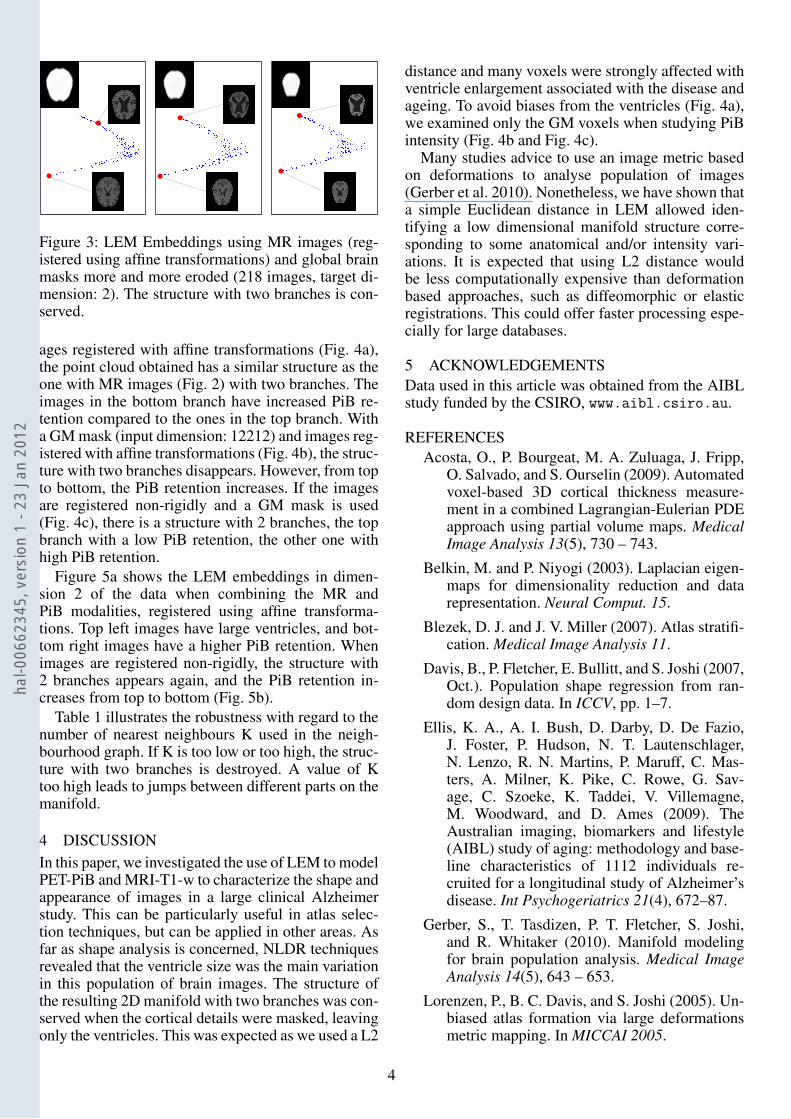
Figure 3: LEM Embeddings using MR images (reg-istered using affine transformations) and global brainmasks more and more eroded (218 images, target di-mension: 2). The structure with two branches is con-served.
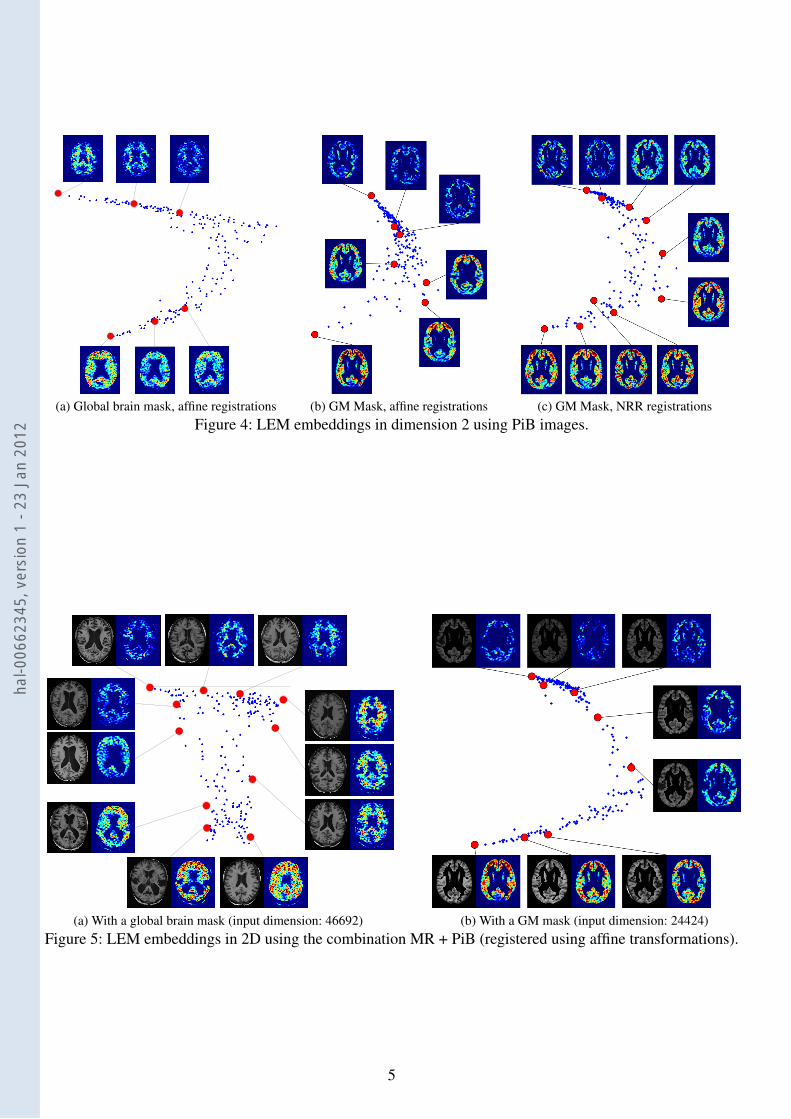
ages registered with affine transformations (Fig. 4a),the point cloud obtained has a similar structure as theone with MR images (Fig. 2) with two branches. Theimages in the bottom branch have increased PiB re-tention compared to the ones in the top branch. Witha GM mask (input dimension: 12212) and images reg-istered with affine transformations (Fig. 4b), the struc-ture with two branches disappears. However, from topto bottom, the PiB retention increases. If the imagesare registered non-rigidly and a GM mask is used(Fig. 4c), there is a structure with 2 branches, the topbranch with a low PiB retention, the other one withhigh PiB retention.
Figure 5a shows the LEM embeddings in dimen-sion 2 of the data when combining the MR andPiB modalities, registered using affine transforma-tions. Top left images have large ventricles, and bot-tom right images have a higher PiB retention. Whenimages are registered non-rigidly, the structure with2 branches appears again, and the PiB retention in-creases from top to bottom (Fig. 5b).
Table 1 illustrates the robustness with regard to thenumber of nearest neighbours K used in the neigh-bourhood graph. If K is too low or too high, the struc-ture with two branches is destroyed. A value of Ktoo high leads to jumps between different parts on themanifold.
4 DISCUSSIONIn this paper, we investigated the use of LEM to modelPET-PiB and MRI-T1-w to characterize the shape andappearance of images in a large clinical Alzheimerstudy. This can be particularly useful in atlas selec-tion techniques, but can be applied in other areas. Asfar as shape analysis is concerned, NLDR techniquesrevealed that the ventricle size was the main variationin this population of brain images. The structure ofthe resulting 2D manifold with two branches was con-served when the cortical details were masked, leavingonly the ventricles. This was expected as we used a L2
distance and many voxels were strongly affected withventricle enlargement associated with the disease andageing. To avoid biases from the ventricles (Fig. 4a),we examined only the GM voxels when studying PiBintensity (Fig. 4b and Fig. 4c).
Many studies advice to use an image metric basedon deformations to analyse population of images(Gerber et al. 2010). Nonetheless, we have shown thata simple Euclidean distance in LEM allowed iden-tifying a low dimensional manifold structure corre-sponding to some anatomical and/or intensity vari-ations. It is expected that using L2 distance wouldbe less computationally expensive than deformationbased approaches, such as diffeomorphic or elasticregistrations. This could offer faster processing espe-cially for large databases.
5 ACKNOWLEDGEMENTSData used in this article was obtained from the AIBLstudy funded by the CSIRO, www.aibl.csiro.au.
REFERENCESAcosta, O., P. Bourgeat, M. A. Zuluaga, J. Fripp,
O. Salvado, and S. Ourselin (2009). Automatedvoxel-based 3D cortical thickness measure-ment in a combined Lagrangian-Eulerian PDEapproach using partial volume maps. MedicalImage Analysis 13(5), 730 – 743.
Belkin, M. and P. Niyogi (2003). Laplacian eigen-maps for dimensionality reduction and datarepresentation. Neural Comput. 15.
Blezek, D. J. and J. V. Miller (2007). Atlas stratifi-cation. Medical Image Analysis 11.
Davis, B., P. Fletcher, E. Bullitt, and S. Joshi (2007,Oct.). Population shape regression from ran-dom design data. In ICCV, pp. 1–7.
Ellis, K. A., A. I. Bush, D. Darby, D. De Fazio,J. Foster, P. Hudson, N. T. Lautenschlager,N. Lenzo, R. N. Martins, P. Maruff, C. Mas-ters, A. Milner, K. Pike, C. Rowe, G. Sav-age, C. Szoeke, K. Taddei, V. Villemagne,M. Woodward, and D. Ames (2009). TheAustralian imaging, biomarkers and lifestyle(AIBL) study of aging: methodology and base-line characteristics of 1112 individuals re-cruited for a longitudinal study of Alzheimer’sdisease. Int Psychogeriatrics 21(4), 672–87.
Gerber, S., T. Tasdizen, P. T. Fletcher, S. Joshi,and R. Whitaker (2010). Manifold modelingfor brain population analysis. Medical ImageAnalysis 14(5), 643 – 653.
Lorenzen, P., B. C. Davis, and S. Joshi (2005). Un-biased atlas formation via large deformationsmetric mapping. In MICCAI 2005.
4
hal-0
0662
345,
ver
sion
1 -
23 J
an 2
012
� �
(a) Global brain mask, affine registrations (b) GM Mask, affine registrations (c) GM Mask, NRR registrationsFigure 4: LEM embeddings in dimension 2 using PiB images.
� �
(a) With a global brain mask (input dimension: 46692) (b) With a GM mask (input dimension: 24424)Figure 5: LEM embeddings in 2D using the combination MR + PiB (registered using affine transformations).
5
hal-0
0662
345,
ver
sion
1 -
23 J
an 2
012
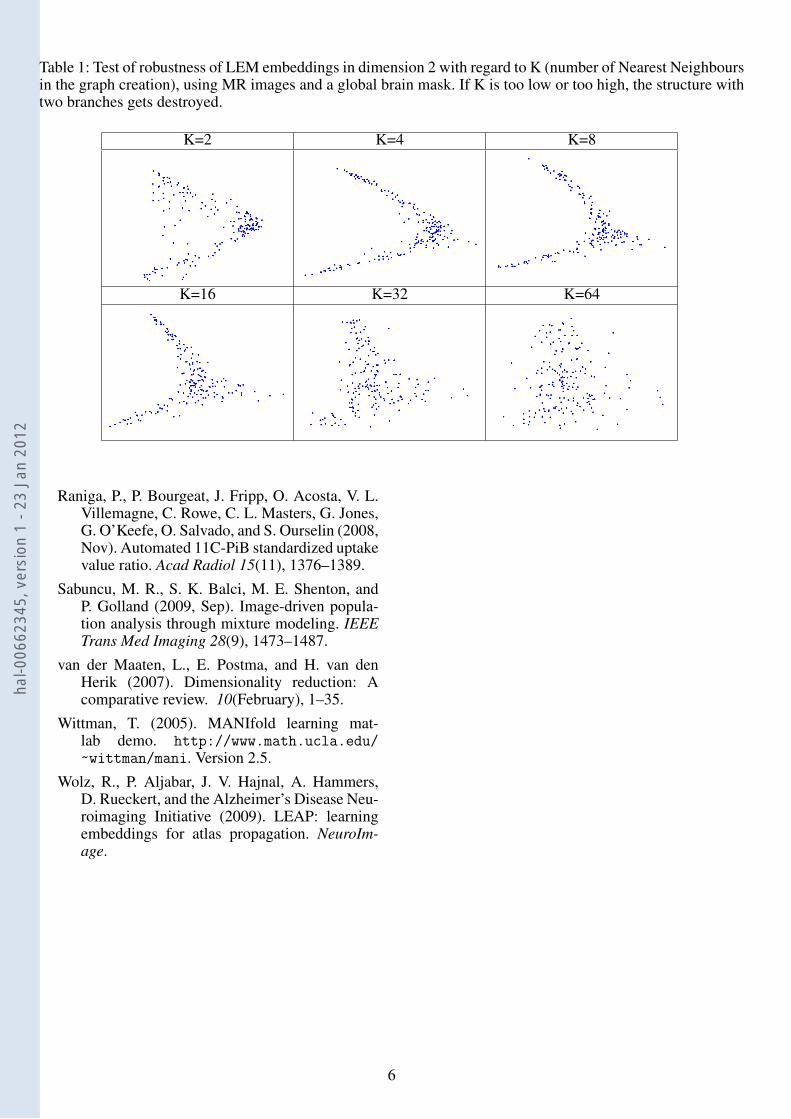
Table 1: Test of robustness of LEM embeddings in dimension 2 with regard to K (number of Nearest Neighboursin the graph creation), using MR images and a global brain mask. If K is too low or too high, the structure withtwo branches gets destroyed.
K=2 K=4 K=8
K=16 K=32 K=64
Raniga, P., P. Bourgeat, J. Fripp, O. Acosta, V. L.Villemagne, C. Rowe, C. L. Masters, G. Jones,G. O’Keefe, O. Salvado, and S. Ourselin (2008,Nov). Automated 11C-PiB standardized uptakevalue ratio. Acad Radiol 15(11), 1376–1389.
Sabuncu, M. R., S. K. Balci, M. E. Shenton, andP. Golland (2009, Sep). Image-driven popula-tion analysis through mixture modeling. IEEETrans Med Imaging 28(9), 1473–1487.
van der Maaten, L., E. Postma, and H. van denHerik (2007). Dimensionality reduction: Acomparative review. 10(February), 1–35.
Wittman, T. (2005). MANIfold learning mat-lab demo. http://www.math.ucla.edu/
~wittman/mani. Version 2.5.Wolz, R., P. Aljabar, J. V. Hajnal, A. Hammers,
D. Rueckert, and the Alzheimer’s Disease Neu-roimaging Initiative (2009). LEAP: learningembeddings for atlas propagation. NeuroIm-age.
6
hal-0
0662
345,
ver
sion
1 -
23 J
an 2
012
Related Documents