Multimedia Pivot Tables Marcel Worring, Senior Member IEEE * , Dennis C. Koelma † ABSTRACT Image collections are a tremendous source of information. Yet due to the semantic gap it is difficult to get access to their content, while at the same time it is difficult to properly employ their context such as tags and metadata. To move forward we propose a multimedia analytics solution. The most widespread and universally used ana- lytic tools are spreadsheets, where a powerful feature is the possibil- ity to generate pivot table reports. They provide flexible interactive summaries of the data along various dimensions. Pivot tables have been designed and are in use for structured data. Our goal is cre- ating pivot tables for accessing collections of images, their content, tags, and metadata. This is a challenging task as automatic descrip- tors for image content are noisy, tags are numerous and subjective, and metadata can have many types. To tackle these challenges we present methods and visualizations for semi-interactively catego- rizing an image collection and from there design and develop pivot tables for such a collection. Keywords: Multimedia Analytics, Aggregation, Semantic Con- cepts, Multimedia Summarization, Multimedia Reporting. 1 I NTRODUCTION The ease with which large amounts of images and videos can be ac- quired with cameras, mobile camera phones, and webcams has led to an explosion of digital data. For consumers images and videos have become a vehicle for social communication. In biology, as- trophysics, or medicine images are a valuable source of scientific knowledge. In forensics and security, visual information is becom- ing a prime carrier of evidence and clues. Next to the images or videos, collections contain metadata, such as camera used, date, owner, website, age, geo-location, country of origin, tags, name, measurements or observations. Such collections potentially con- tain a wealth of information for scientific, investigative, or business purposes. But deriving insight or knowledge from such collections is a non trivial task as the data are of varying types. Furthermore, interpreting visual data is hampered by the semantic gap, the lack of coincidence of the visual data and the interpretations humans give to it. Current image retrieval systems are still dominated by the query - result list presentation paradigm. For analytics new tools are needed to help users in employing such complex data sets. We propose to consider spreadsheets as candidate analytic tools to extend to multimedia. Spreadsheets are ubiquitous and have proven their strength in a broad range of applications. The Pho- tospread [3] system extends the spreadsheet to multimedia by al- lowing groups of images in the individual cells with formula like definitions to fill the cells with the user desired selection. In [2] a framework to add visual data to spreadsheets is presented. An alter- native for combining information could be the visualization mosaic in [4], but they have not been put into a spreadsheet setting. The above solutions are fully based on metadata and do no take the con- tent of the visual data into account. The MediaTable [1] uses auto- matic concept detection to analyze the content and organizes them * [email protected] † [email protected] Figure 1: Multimedia Pivot Tables: an analytics approach for images. in a tabular form following the lines of the pioneering Tablelens system. The above methods are interesting, but have only scratched the surface of the functionality of spreadsheets in a multimedia an- alytics context. A powerful feature of a spreadsheet is the pivot table. These ta- bles let the user interactively create reports which summarize the data in the spreadsheet in various ways. In a simple, yet versatile, way the user selects variables to use as column or row variables and for the cells in the resulting matrix. In this way the user gets dif- ferent views of the data, aggregated along different dimensions and hence can see patterns and trends. In an incremental way the user can then get insight in the collection. But pivot tables are primarily based on nominal and ordinal variables. In this paper we introduce and develop the notion of multimedia pivot tables. It provides users with a new approach to understanding large multimedia collections. 2 METHODS To arrive at multimedia pivot tables we start with describing compo- nents and techniques underlying our method. We first consider the essentials of pivot tables as used in standard spreadsheet programs. We then move to the techniques we employ to derive probabilis- tic scores for the presence of semantic concepts in the visual data. These probabilities form the basis for the semi-interactive catego- rization process underlying our MediaTable system. Having these components as basis, we can define our proposed multimedia pivot tables. 2.1 Basics of pivot tables Pivot tables are a way of summarizing data in a spreadsheet which can be interactively defined by a user. At its core the pivot table is a matrix of cells which can contain values. The usefulness of pivot tables comes from the flexibility in assigning different roles for the variables in the dataset. These roles are Filter, Row, Column and Value. When a variable is used as value in the matrix, the content of the cell is defined by all the possible values of the variables which have the corresponding column and row label. The values are typically combined by applying a user selected aggregation operator such as mean, mode, or maximum value. In addition to these aggregations,

Welcome message from author
This document is posted to help you gain knowledge. Please leave a comment to let me know what you think about it! Share it to your friends and learn new things together.
Transcript
Multimedia Pivot TablesMarcel Worring, Senior Member IEEE ∗, Dennis C. Koelma †
ABSTRACT
Image collections are a tremendous source of information. Yet dueto the semantic gap it is difficult to get access to their content, whileat the same time it is difficult to properly employ their context suchas tags and metadata. To move forward we propose a multimediaanalytics solution. The most widespread and universally used ana-lytic tools are spreadsheets, where a powerful feature is the possibil-ity to generate pivot table reports. They provide flexible interactivesummaries of the data along various dimensions. Pivot tables havebeen designed and are in use for structured data. Our goal is cre-ating pivot tables for accessing collections of images, their content,tags, and metadata. This is a challenging task as automatic descrip-tors for image content are noisy, tags are numerous and subjective,and metadata can have many types. To tackle these challenges wepresent methods and visualizations for semi-interactively catego-rizing an image collection and from there design and develop pivottables for such a collection.
Keywords: Multimedia Analytics, Aggregation, Semantic Con-cepts, Multimedia Summarization, Multimedia Reporting.
1 INTRODUCTION
The ease with which large amounts of images and videos can be ac-quired with cameras, mobile camera phones, and webcams has ledto an explosion of digital data. For consumers images and videoshave become a vehicle for social communication. In biology, as-trophysics, or medicine images are a valuable source of scientificknowledge. In forensics and security, visual information is becom-ing a prime carrier of evidence and clues. Next to the images orvideos, collections contain metadata, such as camera used, date,owner, website, age, geo-location, country of origin, tags, name,measurements or observations. Such collections potentially con-tain a wealth of information for scientific, investigative, or businesspurposes. But deriving insight or knowledge from such collectionsis a non trivial task as the data are of varying types. Furthermore,interpreting visual data is hampered by the semantic gap, the lack ofcoincidence of the visual data and the interpretations humans giveto it. Current image retrieval systems are still dominated by thequery - result list presentation paradigm. For analytics new toolsare needed to help users in employing such complex data sets.
We propose to consider spreadsheets as candidate analytic toolsto extend to multimedia. Spreadsheets are ubiquitous and haveproven their strength in a broad range of applications. The Pho-tospread [3] system extends the spreadsheet to multimedia by al-lowing groups of images in the individual cells with formula likedefinitions to fill the cells with the user desired selection. In [2] aframework to add visual data to spreadsheets is presented. An alter-native for combining information could be the visualization mosaicin [4], but they have not been put into a spreadsheet setting. Theabove solutions are fully based on metadata and do no take the con-tent of the visual data into account. The MediaTable [1] uses auto-matic concept detection to analyze the content and organizes them
∗[email protected]†[email protected]
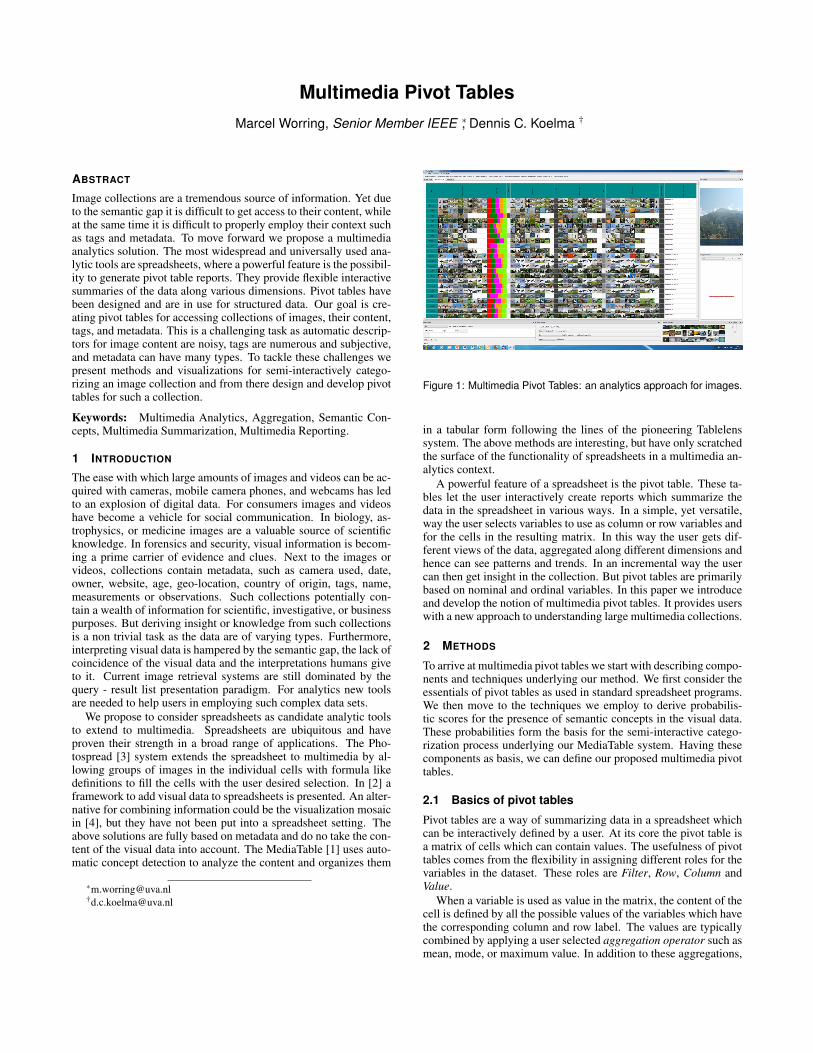
Figure 1: Multimedia Pivot Tables: an analytics approach for images.
in a tabular form following the lines of the pioneering Tablelenssystem. The above methods are interesting, but have only scratchedthe surface of the functionality of spreadsheets in a multimedia an-alytics context.
A powerful feature of a spreadsheet is the pivot table. These ta-bles let the user interactively create reports which summarize thedata in the spreadsheet in various ways. In a simple, yet versatile,way the user selects variables to use as column or row variables andfor the cells in the resulting matrix. In this way the user gets dif-ferent views of the data, aggregated along different dimensions andhence can see patterns and trends. In an incremental way the usercan then get insight in the collection. But pivot tables are primarilybased on nominal and ordinal variables. In this paper we introduceand develop the notion of multimedia pivot tables. It provides userswith a new approach to understanding large multimedia collections.
2 METHODS
To arrive at multimedia pivot tables we start with describing compo-nents and techniques underlying our method. We first consider theessentials of pivot tables as used in standard spreadsheet programs.We then move to the techniques we employ to derive probabilis-tic scores for the presence of semantic concepts in the visual data.These probabilities form the basis for the semi-interactive catego-rization process underlying our MediaTable system. Having thesecomponents as basis, we can define our proposed multimedia pivottables.
2.1 Basics of pivot tables
Pivot tables are a way of summarizing data in a spreadsheet whichcan be interactively defined by a user. At its core the pivot table isa matrix of cells which can contain values. The usefulness of pivottables comes from the flexibility in assigning different roles for thevariables in the dataset. These roles are Filter, Row, Column andValue.
When a variable is used as value in the matrix, the content of thecell is defined by all the possible values of the variables which havethe corresponding column and row label. The values are typicallycombined by applying a user selected aggregation operator such asmean, mode, or maximum value. In addition to these aggregations,
a pivot tables also aggregates all values for respectively one columnor row.
2.2 Multimedia data characteristics and analysis
For this paper we consider four different types of variables. Coreto the approach are the images themselves. Each of these imagesmight have a set of tags, taken from an unconstrained vocabulary,which could range from describing specific aspects of the contentto personalized interpretations or contexts of the images. In addi-tion to those we consider any numeric or nominal metadata of theimages. The final variables are indicators of the concepts present,derived using automatic content analysis.
Deriving the concepts present in an image or video is a difficulttask for which many methods have been defined [5]. State-of-the-art techniques are based on SVM models learned from negative andpositive examples for each concept. The result of a concept de-tector is a score for the presence of the concept with an inherentuncertainty. It depends on many factors including the actual pres-ence, but also on priors and data quality. Consequently, the valuein its absolute form has limited meaning. They should mainly beused for ranking the images in the collection with respect to thepresence of the particular concept. When the aim is filtering outimages not containing the concept, thresholding the list should bedone with care and preferably by visual inspection of the image list.Semi-interactive approaches are thus most appropriate.
2.3 Filter and categorize
For the process of filtering and basic categorization of the imageswe rely on our MediaTable [1]. The MediaTable is a tabular visual-ization based system which aids users in semi-interactively catego-rizing a collection of images. It is based on the above observationthat rankings are core to the analysis of image collections and thefact that many different semantic concepts can play a role in analyz-ing an image collection. Instead of having a grid based query resultvisualization where a single ranking is shown, the set of imagesis presented as individual rows where the columns contain eitherregular metadata or the scores derived using the semantic conceptdetectors. The scores in the cells are represented by shades of grey.Users can employ a faceted filter, combining several variables, toreduce the active dataset. The sort, filter, select operators aid theusers in interactively assigning images to the different buckets rep-resenting the categories.
2.4 Design of multimedia pivot tables
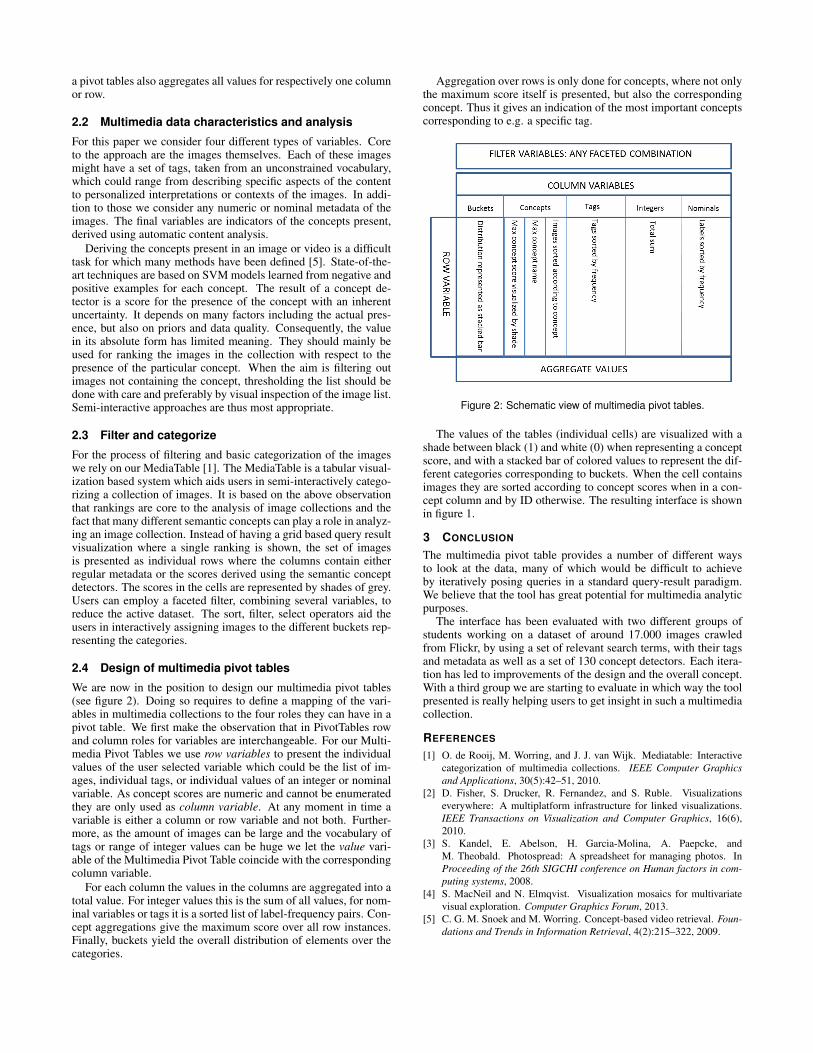
We are now in the position to design our multimedia pivot tables(see figure 2). Doing so requires to define a mapping of the vari-ables in multimedia collections to the four roles they can have in apivot table. We first make the observation that in PivotTables rowand column roles for variables are interchangeable. For our Multi-media Pivot Tables we use row variables to present the individualvalues of the user selected variable which could be the list of im-ages, individual tags, or individual values of an integer or nominalvariable. As concept scores are numeric and cannot be enumeratedthey are only used as column variable. At any moment in time avariable is either a column or row variable and not both. Further-more, as the amount of images can be large and the vocabulary oftags or range of integer values can be huge we let the value vari-able of the Multimedia Pivot Table coincide with the correspondingcolumn variable.
For each column the values in the columns are aggregated into atotal value. For integer values this is the sum of all values, for nom-inal variables or tags it is a sorted list of label-frequency pairs. Con-cept aggregations give the maximum score over all row instances.Finally, buckets yield the overall distribution of elements over thecategories.
Aggregation over rows is only done for concepts, where not onlythe maximum score itself is presented, but also the correspondingconcept. Thus it gives an indication of the most important conceptscorresponding to e.g. a specific tag.
Figure 2: Schematic view of multimedia pivot tables.
The values of the tables (individual cells) are visualized with ashade between black (1) and white (0) when representing a conceptscore, and with a stacked bar of colored values to represent the dif-ferent categories corresponding to buckets. When the cell containsimages they are sorted according to concept scores when in a con-cept column and by ID otherwise. The resulting interface is shownin figure 1.
3 CONCLUSION
The multimedia pivot table provides a number of different waysto look at the data, many of which would be difficult to achieveby iteratively posing queries in a standard query-result paradigm.We believe that the tool has great potential for multimedia analyticpurposes.
The interface has been evaluated with two different groups ofstudents working on a dataset of around 17.000 images crawledfrom Flickr, by using a set of relevant search terms, with their tagsand metadata as well as a set of 130 concept detectors. Each itera-tion has led to improvements of the design and the overall concept.With a third group we are starting to evaluate in which way the toolpresented is really helping users to get insight in such a multimediacollection.
REFERENCES
[1] O. de Rooij, M. Worring, and J. J. van Wijk. Mediatable: Interactivecategorization of multimedia collections. IEEE Computer Graphicsand Applications, 30(5):42–51, 2010.
[2] D. Fisher, S. Drucker, R. Fernandez, and S. Ruble. Visualizationseverywhere: A multiplatform infrastructure for linked visualizations.IEEE Transactions on Visualization and Computer Graphics, 16(6),2010.
[3] S. Kandel, E. Abelson, H. Garcia-Molina, A. Paepcke, andM. Theobald. Photospread: A spreadsheet for managing photos. InProceeding of the 26th SIGCHI conference on Human factors in com-puting systems, 2008.
[4] S. MacNeil and N. Elmqvist. Visualization mosaics for multivariatevisual exploration. Computer Graphics Forum, 2013.
[5] C. G. M. Snoek and M. Worring. Concept-based video retrieval. Foun-dations and Trends in Information Retrieval, 4(2):215–322, 2009.
Related Documents


![Excel Training Pivot Tables[1]](https://static.cupdf.com/doc/110x72/55cf8ab355034654898d1682/excel-training-pivot-tables1.jpg)