Multimedia Analysis Over 3G Wireless Interface Jeremy Yee Chiat TAY B.E. (Electronics) (Hons) / B.Inf.Tech Queensland University of Technology School of Electrical and Electronic systems Engineering Queensland University of Technology G.P.O. Box 2434, Brisbane, QLD, 4001, Australia Submitted as a requirement for the degree of Master of Engineering (Research) Queensland University of Technology July 2003.

Welcome message from author
This document is posted to help you gain knowledge. Please leave a comment to let me know what you think about it! Share it to your friends and learn new things together.
Transcript
Multimedia Analysis
Over 3G Wireless Inter face
Jeremy Yee Chiat TAY
B.E. (Electronics) (Hons) / B.Inf.Tech Queensland University of Technology
School of Electrical and Electronic systems Engineering Queensland University of Technology
G.P.O. Box 2434, Brisbane, QLD, 4001, Australia
Submitted as a requirement for the degree of Master of Engineering (Research) Queensland University of Technology
July 2003.

Multimedia Quality Analysis over 3G Wireless Inter face
i
Abstract
Recent rapid advancements in mobile communication and emerging demands for
complicated multimedia content and services over mobile systems have caused a dramatic
increase in research interest in this area. Among the topics covering multimedia service
performance over the wireless interface, the quality of received multimedia content is an
important issue. With the increase of visual media in mobile services, user opinion
acquired through perception of received image quality will play an increasingly important
role in determining the effectiveness of such services.
The work documented in this thesis is motivated by the general lack of published work on
software test beds for Third Generation Mobile Network (3G) and in particular for
investigating mobile environment multimedia quality degradation. A 3G multimedia
quality analysis system is presented, subjecting the input multimedia stream to the
simulated 3G radio activities and measuring its degradation in terms of human perception.
This approach takes a new and different model of multimedia quality measurement in a
wireless communication domain, showing the possibility of a more effective approach that
can be applied in many cases for assisting service quality assurance research across this
area.
The development of this software system is covered in detail together with in-depth
analysis of multimedia image quality over a simulated 3G radio interface. Universal
Mobile Telecommunications System (UMTS) is the 3G standard chosen for study in this
work. The suggested test bed simulates a single Frequency Division Duplex (FDD)
downlink UMTS Territorial Radio Access (UTRA) channel, where the received media’s
image analysis is performed using a Human Vision System (HVS) based image quality
metric. The system aims to provide a multipurpose and versatile multimedia 3G test bed
for use in testing of various solutions for protecting multimedia data across a 3G radio
interface. Furthermore, it produces effective human vision oriented feedback on visual

Multimedia Quality Analysis over 3G Wireless Inter face
ii
media degradation, providing a new and efficient method to address effectiveness of
solutions in multimedia delivery over a mobile environment.
This thesis shows the ability of HVS-based image quality metric in analyzing degradation
of visual media over a noisy mobile environment. This presents a novel direction in the
area of telecommunication service multimedia quality analysis, with potential user quality
perception being considered on top of data or signal-based error measurements. With such
a new approach, development of multimedia protection solutions can be made more
effective. Effective feedback provided by considering quality measurement with strong
correlation to human perception allows close analysis of user visual discrimination across
an image. An example of the usefulness of this information is especially visible if
considering development of a content-based multimedia data protective system that
provides different levels of protection, depending on the importance of visual media.
An apparent potential application of this thesis is in the testing of a multimedia/image
protection protocol in a downlink channel. Future work might aim to extend the current
system by adding network level traffic simulations and further addition of dynamic
network control components, further considering network traffic conditions.

Multimedia Quality Analysis over 3G Wireless Inter face
iii
Contents
Abstract ............................................................................................................................ i
List of Figures .................................................................................................................v
List of Tables................................................................................................................ viii
Acronyms and Units....................................................................................................... ix
Publications................................................................................................................... xv
Authorship.................................................................................................................... xvi
Acknowledgements ..................................................................................................... xvii
Chapter 1. Introduction....................................................................................................1
Chapter 2. 3G Background Information ...........................................................................6
2.1 UMTS General Specifications................................................................................8
2.2 UTRA Air Interface Radio Channels....................................................................10
2.3 UMTS Network Architecture...............................................................................12
2.4 Core Network Entities..........................................................................................14
2.4.1 CN Entities Common to PS and CS...............................................................14
2.4.2 CN Entities Specific to CS Domain...............................................................18
2.4.3 CN Entities Specific to PS Domain................................................................20
2.5 Access Network Entities and Mobile Station Entities...........................................21
Chapter 3. UMTS Radio Interface..................................................................................23
3.1 Multiplexing and Channel Coding........................................................................26
3.1.1 CRC Attachment ...........................................................................................27
3.1.2 Transport Block Processing...........................................................................27
3.1.3 Channel Coding.............................................................................................28
3.1.4 Radio Frame Equalization & First Interleaving..............................................28
3.1.5 Radio Frame Segmentation, Rate Matching and Transport Channel Multiplexing
..............................................................................................................................29
3.1.6 Discontinuous Transmission Indication Insertion...........................................30
3.1.7 Physical Channel Segmentation and Second Interleaving ..............................31
3.1.8 Physical Channel Mapping............................................................................32

Multimedia Quality Analysis over 3G Wireless Inter face
iv
3.2 Modulation and Spreading ...................................................................................34
Chapter 4. HVS-Based Image Quality Metric ................................................................37
4.1 A Question of Measuring Image Quality ..............................................................38
4.2 HVS Fidelity System ...........................................................................................43
4.2.1 Channel Decomposition and Band-limited Contrast.......................................44
4.2.2 Contrast Sensitivity Function.........................................................................46
4.2.3 Spatial Masking.............................................................................................46
4.2.4 Summation....................................................................................................48
4.3 Importance Map System.......................................................................................49
Chapter 5. Test Bed Methodology..................................................................................55
5.1 3G/UMTS Test Bed Methodology........................................................................57
5.2 Image Quality Metric Methodology .....................................................................60
5.3 System Testing and Validation Strategy ...............................................................61
Chapter 6. ADS Implementation....................................................................................63
6.1 ADS Implementation Main Design Schematics....................................................65
6.2 ADS Implementation Base Station Design Schematics.........................................72
6.3 ADS User Equipment Implementation Design Schematics...................................77
Chapter 7. HVS-Based Quality Metric System Implementation .....................................81
7.1 HVS Fidelity Module Implementation..................................................................83
7.2 Importance Map Implementation..........................................................................84
7.3 Combination of HVS-Based Fidelity and IM Results ...........................................86
Chapter 8. Individual System Testing ............................................................................87
8.1 UTRA/3G Test Bed Module System Testing........................................................87
8.1.1 General Image Testing ..................................................................................87
8.1.2 Image Subjected to Variable Environment Parameters and Velocity..............96
8.1.3 Image Subjected to Variable Arriving Angle...............................................112
8.2 Image Quality Metric: HVS-Based Fidelity Test Bed Module System Testing ...115
8.3 Image Quality Metric: Importance Map Test Bed Module System Testing.........121
Chapter 9. Integrated system testing.............................................................................131
9.1 System Result ....................................................................................................131
9.2 System Result Summary ....................................................................................140
Chapter 10. Discussion and Conclusion .......................................................................148
Bibliography................................................................................................................152

Multimedia Quality Analysis over 3G Wireless Inter face
v
List of Figures Figure 2.1: UMTS/UTRA Architecture Illustration .........................................................7
Figure 2.2 UTRA bandwidth distribution ........................................................................8
Figure 2.3 UMTS AN OSI Illustration...........................................................................12
Figure 2.4 Basic UMTS PLMN Configuration ..............................................................13
Figure 2.5 Generic HSS Structure .................................................................................16
Figure 3.1 Transport/Physical Channel Downlink Structure ..........................................25
Figure 3.2 Downlink spreading .....................................................................................34
Figure 3.3 Multiplexing of Multiple Physical Channels .................................................35
Figure 3.4 Channelization Code Definition ...................................................................35
Figure 3.5 QPSK Modulator .........................................................................................36
Figure 4.1 Spatial Frequency .........................................................................................39
Figure 4.2 HVS Early Vision Model .............................................................................43
Figure 4.3 Filter Structure .............................................................................................45
Figure 4.4 Log-Log relation of ThE VS Background Contrast .......................................47
Figure 4.5 IM Processing ..............................................................................................50
Figure 4.6 Illustration of 4-connected Relationship........................................................51
Figure 4.7 Isize Calculation ............................................................................................52
Figure 4.8 Location zones weightings ...........................................................................53
Figure 5. 1 System overview..........................................................................................55
Figure 6.1 UTRA Block Diagram..................................................................................63
Figure 6.2 ADS Main Schematic Overview ...................................................................65
Figure 6.3 BS Variable Rate Source...............................................................................66
Figure 6.4 UE Variable Rate Receiver ...........................................................................67
Figure 6.5 3G Physical Channel Model..........................................................................68
Figure 6.7 Modulation Components...............................................................................69
Figure 6.8 RF Component..............................................................................................69
Figure 6.9 Signal Conversion Component......................................................................70
Figure 6.10 Matlab Server Output Components.............................................................70
Figure 6.11 ADS Base Station Internal Block Schematic ...............................................72
Figure 6.12 Matlab Server Data Input Section................................................................73

Multimedia Quality Analysis over 3G Wireless Inter face
vi
Figure 6.13 Transport Channel Coding ..........................................................................74
Figure 6.14 DPCH Processing .......................................................................................75
Figure 6.15 OVSF Sequences and OCNS Noise Generation...........................................75
Figure 6.16 Multiple Physical Channel Multiplexing .....................................................76
Figure 6.17 ADS User Equipment Internal Block Structure...........................................77
Figure 6.18 Receiver, De-spreading and De-multiplexing..............................................78
Figure 6.19 Physical Channel De-segmentation and Transport Channel De-multiplexing79
Figure 6.20 Transport Channel Decoding.......................................................................80
Figure 7.1 HVS Quality Metric .....................................................................................81
Figure 8.1 Image “Baboon” Subjected to Channel of Three Different Velocities............88
Figure 8.2 Image “Football” Subjected to Channel of Three Different Velocities...........89
Figure 8.3 Image “Lena” Subjected to Channel of Three Different Velocities................90
Figure 8.4 Image “Soccer” Subjected to Channel of Three Different Velocities.............91
Figure 8.5 Image “Bike” Subjected to Channel of Three Different Velocities ................92
Figure 8.6 Image “Light house” Subjected to Channel of Three Different Velocities .....92
Figure 8.7 General Image Testing MSE Graph...............................................................93
Figure 8.8 General Image Testing PSNR Graph.............................................................94
Figure 8.9 Image “Announcer” subjected to Indoor Environment Parameter ..................96
Figure 8.10 Image “Announcer” subjected to Indoor Environment Parameter ................97
Figure 8.11 Image “Announcer” subjected to Pedestrian Environment Parameter ..........99
Figure 8.12 Image “Announcer” subjected to Vehicular Environment Parameter .........100
Figure 8.13 Image “Announcer” subjected to Vehicular Environment Parameter .........101
Figure 8.14 Image “Football” subjected to Indoor Environment Parameter ..................103
Figure 8.15 Image “Football” subjected to Indoor Environment Parameter ..................104
Figure 8.16 Image “Football” subjected to Pedestrian Environment Parameter ............106
Figure 8.17 Image “Football” subjected to Vehicular Environment Parameter .............107
Figure 8.18 Image “Football” subjected to Vehicular Environment Parameter .............108
Figure 8.19 Image “announcer” PSNR Result Plot.......................................................109
Figure 8.20 Image “Football” PSNR Result Plot ..........................................................110
Figure 8.21 Image “Announcer” Subjected to Different Arriving Angle.......................112
Figure 8.22 Image “Football” Subjected to Different Arriving Angle...........................113
Figure 8.23 Image “Airplane” ......................................................................................115
Figure 8.24 Image “Announcer” ..................................................................................116
Figure 8.25 Image “Baboon” .......................................................................................117
Multimedia Quality Analysis over 3G Wireless Inter face
vii
Figure 8.26 Image “Bike” ............................................................................................118
Figure 8.27 Image “Light House” ................................................................................118
Figure 8.28 Image “Miss America” ..............................................................................119
Figure 8.29 Image “Pens” ............................................................................................120
Figure 8.30 Original Images Part I ...............................................................................121
Figure 8.31 Original Images Part II ..............................................................................122
Figure 8.32 Image “Airplane” ......................................................................................123
Figure 8.33 Image “Announcer” ..................................................................................124
Figure 8.34 Image “Baboon” .......................................................................................125
Figure 8.35 Image “Bike” ............................................................................................126
Figure 8.36 Image “Light House” ................................................................................127
Figure 8.37 Image “Miss America” ..............................................................................128
Figure 8.38 Image “Pens” ............................................................................................129
Figure 9.1 Image “Announcer” ....................................................................................132
Figure 9.2 Image “Baboon” .........................................................................................133
Figure 9.3 Image “Football” ........................................................................................134
Figure 9.4 Image “Lena” ..............................................................................................135
Figure 9.5 Image “Soccer” ...........................................................................................137
Figure 9.6 Image “Bike” ..............................................................................................138
Figure 9.7 Image “Light House” ..................................................................................139
Figure 9.8 Image “Announcer” IPQR Result Plot ........................................................142
Figure 9.9 Image “Football” IPQR Result Plot.............................................................144
Figure 9.10 Multiple images with Varying Velocity System Result Summary Plot ......146
Multimedia Quality Analysis over 3G Wireless Inter face
viii
List of Tables Table 2.1 UMTS Summary .............................................................................................9
Table 3.1 Channel Coding Scheme................................................................................28
Table 3.2 Inter-column permutation patterns for 1st interleaving ....................................29
Table 3.3 Inter-column permutation patterns for 2nd interleaving....................................32
Table 3.4 Transport Channel to Physical Channel Mapping ..........................................33
Table 8.1 General Image Testing Result Summary.........................................................93
Table 8.2 MSE Result Statistics of Error Mean and Deviation .......................................95
Table 8.3 PSNR Table Summary for Varying Environment Parameter and Velocity....102
Table 8.4 Varying Environment Parameter and Velocity System Result Summary.......109
Table 8.5 Result Summary for Image “Announcer” Subjected to Varying Arriving Angle
......................................................................................................................113
Table 8.6 Result Summary for Image “Football” Subjected to Varying Arriving Angle114
Table 9.1 System Result Summary ..............................................................................140
Table 9.2 Image “Announcer” Varying Environment Parameter and Velocity system Result
Summary.......................................................................................................141
Table 9.3 “Announcer” Arriving Angle System Result Summary ................................142
Table 9.4 Image “Football” Varying Environment Parameter and Velocity system Result
Summary.......................................................................................................143
Table 9.5 “Football” Arriving Angle System Result Summary.....................................143
Table 9.6 Multiple images with Varying Velocity System Result Summary.................145

Multimedia Quality Analysis over 3G Wireless Inter face
ix
Acronyms and Units Acronyms 3G Third Generation Mobile Network
AICH Acquisition Indicator Channel
AN Access Network
AP-AICH Access Preamble AICH
ATM Asynchronous Transfer Mode
AuC Authentication Centre
AWGN Additive White Gaussian Noise
BCCH Broadcast Control Channel
BCH Broadcast Channel
BER Bit Error Rate
BG Border Gateway
BS Base Station
BSS Base Station System
BTS Base Transceiver Station
CAMEL Customized Applications for Mobile Network Enhanced Logic
CBC Cell Broadcast Centre
CC Call Control
CCTrCH Coded Composite Transport Channel
CD/CA-ICH Collision-Detection/Channel-Assignment Indicator Channel
CDMA Code Division Multiple Access
CN Core Network
CPCH Control Physical Channel
CPICH Common Pilot Channel
CS Circuit Switch
CSCF Call Session Control Function
Multimedia Quality Analysis over 3G Wireless Inter face
x
CSF Contrast Sensitivity Function
CSICH CPCH Status Indicator Channel
DCH Dedicated Channel
DL Downlink
DPDCH Dedicated Physical Data Channel
DPCCH Dedicated Physical Control Data Channel
DS-CDMA Direct Spread CDMA
DSCH Downlink Share Channel
DTX Discontinuous Transmission
EIR Equipment Identity Register
EV Early Vision
FACH Forward Access Channel
FDD Frequency Division Duplex
FACH Forward Access Channel
FR Frame Relay
GCR Group Call Register
GGSN Gateway GPRS Support Node
GMLC Gateway Mobile Location Centre
GMSC Gateway Mobile Switching Centre
GPRS Generic Packet Radio Service
GPS Global Positioning System
GSM Global Systems for Mobile
HLR Home Location Register
HSS Home Subscriber Server
HVS Human Vision System
IM Importance Map
IMEI International Mobile Equipment Identity
IMSI International Mobile Station Identity
IP Internet Protocol
IPDM IM enhanced PDM
IPM IP Multimedia
IPQR IM weighted PQR
ISDN Integrated Service Digital Network

Multimedia Quality Analysis over 3G Wireless Inter face
xi
ITU International Telecommunication Union
IWF InterWorking Function
JND Just Noticeable Difference
LAC Link Access Control
LBC Local Band-limit Contrast
LCS Location Service
LMU Location Measurement Unit
LMSI Local Mobile Station Identity
MAC Medium Access Control
MAP Mobile Application Part
ME Mobile Equipment
MGW Media Gateway Function
MM Mobility Management
MMsk Mutual Masking
MS Mobile Station
MSC Mobile Switching Centre
MSE Mean Square Error
MSISDN Mobile Station International ISDN Number
MSRN Mobile Station Roaming Number
MT Mobile Termination
N-ISDN Narrowband ISDN
OSI Open System Interconnect
OVSF Orthogonal Variable Spread Factor
P-SCH Primary Synchronization channel
PCCPCH Primary Common Control Physical Channel
PCH Paging Channel
PCPCH Physical Common Packet Channel
PDCP Packet Data Convergence Protocol
PDM Perceptual Distortion Map
PDP Packet Data Protocol
PDSCH Physical Downlink Shared Channel
PhCH Physical Channel
PGM Portable Gray Map

Multimedia Quality Analysis over 3G Wireless Inter face
xii
PICH Paging Indicator Channel
PLMN Public Land Mobile Network
PQR Perceptual Quality Rating
PRACH Physical Random Access Channel
PS Packet Switch
PSNR Peak Signal-to-Noise Ratio
PSTN Public Service Telephone Network
QoS: Quality of Service
QAM Quadrature Amplitude Modulation
QPSK Quadri-Phase Shift Keying
R-SGW Roaming signaling Gateway Function
RA Routing Area
RACH Random Access Channel
RF Radio Frequency
RLC Radio Link Control
RNC Radio Network Controller
RNS Radio Network System
ROI Region of Interest
SCCPCH Secondary Common Control Physical Channel
SCH Synchronization Channel
SGSN Serving GPRS Support Node
SICH Acquisition Indicator Channel
SIM Subscriber Identity Module
SM Service Manager
SMSC Short Message Service Centre
SMS-GMSC Short Message Service GMSC
SOHO Small Office Home Office
SS Subscriber Server
SWIF Shared InterWorking Function
TA Terminal Adapter
TD-CDMA Time Division CDMA
TDD Time Division Duplex
TE Terminal Equipment
Multimedia Quality Analysis over 3G Wireless Inter face
xiii
TFCI Transport Format Combination Indicator
TFI Transport Format Indicator
ThE Threshold Elevation
TMSI Temporary Mobile Station Identity
TPC Transmit Power Control
TrBk Transport Block
TrCH Transport Channel
TTI Transmission Time Interval
UE User Equipment
UL Uplink
UMTS Universal Mobile Telecommunications System
UTRA UMTS Territorial Radio Access
UTRAN UTRA Network
VDP Visible Differences Predictor
VLR Visitor Location Register
W-CDMA Wideband CDMA

Multimedia Quality Analysis over 3G Wireless Inter face
xiv
Units c/deg cycle per degree
db Decibel
Hz Hertz
kbit/s kilo bit per second
k symbols/s kilo symbols per second
M symbols/s Mega symbols per second
Mbit/s Mega bit per second
Mbps Mega bit per second
MCPS Mega chip per second
MHz Mega Hertz
Ms Millisecond
µs microsecond

Multimedia Quality Analysis over 3G Wireless Inter face
xv
Publications*
These are the publications on topics associated with the thesis, which have been produced
by, or in conjunction with, the author during his Master by Research candidacy:
Conference Papers
1. J. Tay and J.Chebil, “A Software Test Bed for Analysis of Image Quality over UTRA
(UMTS Territorial Radio Access) Wireless Interface,” WOSPA 2002, Brisbane,
Australia, 17-18 October 2002.
*Note: The early stages of this Masters Degree program is associated with an industrial
program which precludes any earlier publication

Multimedia Quality Analysis over 3G Wireless Inter face
xvi
Authorship The work contained in this thesis has not been previously submitted for a degree or
diploma at this or any other higher education institution. To the best of my knowledge and
belief, the thesis contains no material previously published or written by another person
except where due reference is made.
Signed:…………………………………………………….
Date:…………………………
Multimedia Quality Analysis over 3G Wireless Inter face
xvii
Acknowledgements My journey through this Master Degree is no doubt full of obstacles and hurdles. As it has
finally come to an end, I would like to take this opportunity to express my sincere gratitude
and appreciation to all those who have lent me a hand one way or another in supporting me
through this rough journey of mine.
Firstly, I would like to thank my family: my mother, my father and Chauses. I thank them
with all my heart for it is them that build the prime driving force for me to overcome
multiple impossibility and continue where numerous failure were encountered. To my
mother who never stops believing in me, thank you for all your support and your devotion
for none of this is possible without you. To my father who always encourages me, thank
you for your advice and affirmation when things are rough and very little seems achievable.
To Chauses who under all circumstances supported me and believed in me, it is you who
gives me the will to reach the finishing point. Thank you, my family.
Secondly, numerous sincere and special thanks goes to my supervisors, friends and
colleagues from the academic domain. I would like to thank Prof. Anthony Maeder, who
supervised me during the last few months of my candidature, for giving me constant
support, helpful advices and showing me skills, mindset and paradigm required to be
competence in both industrial and academic domain. Special thanks to Dr. Adriana
Bodnarova for being my associate supervisor and for your countless help that I cannot do
without. I would especially like to acknowledge and thank Dr. Wilfried Osberger for his
technical advice and for giving me in-depth technical details on his PHD work. Thank you
also to my friends and colleagues, Arvin Lamana, Dr. John Williams, Haris Pandzo, Birgit
Planitz, Greg Hislop, George Mamic, Jason Baker, Clinton Fookes, Alex Pongpech and
Judith Planitz, who all “did time” with me in the RCCVA dungeon, for your wisdom,
friendship and support. Last, but not least, my thanks to Dr. Mohammed Bennamoun, who
is my initial principle supervisor, for giving me a chance to be a Master candidate.
Lastly, I would like to thank all my friends and associates that I failed to mention. I thank
you all, sincerely for your friendship.

Multimedia Quality Analysis over 3G Wireless Inter face
xviii

Multimedia Quality Analysis over 3G Wireless Inter face
1
Chapter 1. Introduction
Recent advancements in mobile communication, especially the introduction of the Third
Generation mobile network (3G) [1, 2] standard, has caused a dramatic increase of research
interest in this area. Among the topics which have received concentrated attention,
multimedia services and their performance over a wireless interface stands out as an
important issue. Due to the versatile nature of the new generation of mobile infrastructure,
the user can now transfer a high volume of data in a short time frame. Consequently, a
small error over the wireless interface inflicts a large amount of quality loss among delicate
operations such as multimedia delivery. Usage of a protection protocol can assist error
recovery and minimize such losses; however, the effectiveness of the many protocols may
not be fully tested due to the lack of availability of a versatile 3G software test bed.
Furthermore, the differences in efficiency of two protocols on multimedia content may well
depend on their effectiveness to protect image quality in addition to minimizing Bit Error
Rate (BER).
This thesis presents the development of a universal 3G software test bed of UMTS
standard, coupled with an image quality metric for media image quality analysis. The
system is an expandable module package with the capability to be constructed into a fully
functional multimedia application or packet data protection protocol testing unit.
The study concentrates on the popular Universal Mobile Telecommunications System
(UMTS) [3] with UMTS Territorial Radio Access (UTRA) radio standards for the software
test bed and a model for early vision in the Human Vision System (HVS) for the image
quality analysis. This system is designed to mimic the processing of DCH into UTRA level
signal and passing the physical layer signal through a physical channel model. An
implementation of HVS system response is used to grade the quality degradation, the
results of which are presented and analyzed. The scenarios considered are limited to
UTRA’s Frequency Division Duplex (FDD) in downlink mode.
Multimedia Quality Analysis over 3G Wireless Inter face
2
The main motivation for this work is the general lack of published material on software test
beds for lower service layers of mobile network, especially 3G. In addition, the analysis of
mobile network multimedia service is mainly performed in terms of Quality of
Service, with has little consideration of the human perception quality loss. Developed form
this viewpoint, this research work aims to address this short fall in literature by producing a
versatile 3G test bed, with the ability to analyze degradation in multimedia image quality.
An extended literature review has been conducted in search of published works on
UTRA/UMTS test beds, analytical models and also multimedia quality analysis over 3G.
However, minimal work on degradation in multimedia image quality can be found. The
relevant published works found usually focus on areas such as:
• Multi user detection and channel estimation (e.g. [4] etc…);
• Channel modeling (e.g. [5-8] etc…);
• Dynamic channel allocation (e.g.[9] etc…); and
• Network level traffic modeling (e.g. [10] etc..).
However, a limited number of works can be found that completely describe a test bed and
network simulation implementation to emulate UTRA transmission and receiving
operations, as listed in [11] and [12]. Furthermore, in terms of quality analysis and
outlining multimedia service requirements, the majority of literature focuses primarily on
traffic level [13] or service level [14] Quality of Service (QoS) and network-based
measurements (e.g. Bit Error Rate (BER) and latency) or primitive image measurement of
PSNR. Examples of such literature includes [6, 14-23].
The problem covered in this research can be formulated as follows: The majority of quality
analyses performed on multimedia communications are network solutions, which seldom
take into account the user response. The novelty of this research is to take a new and more
effective approach to analyzing visual quality degradation in 3G multimedia
communications that correlates closely to human understanding and perception of visual
media content. As the audience is usually the primary user of multimedia services, it is
therefore appropriate that the response of such a user relative to quality degradation is
investigated. QoS and network solutions will provide numbers to quantify loss of

Multimedia Quality Analysis over 3G Wireless Inter face
3
multimedia data but such solutions fail to consider the level of impact such events have on
the user. Examples where such inefficiency is especially clear include:
• Development of a content-based media protection protocol for 3G radio interface;
and
• Dynamic multimedia content delivery adaptation for change in network conditions.
Therefore, using HVS-based error quantification not only helps to provide a more effective
measure of visual media degradation, it can also act as a feed back mechanism to allow
more accurate indications for direct use in executing operations to control the transmitting
multimedia.
The primary contribution of this research centres on constructing a HVS image metric and
integrating it onto a simulated 3G test bed module. Using the 3G test bed module as a
platform, HVS can then provide quantitative analysis on the image media exposed to
various mobile channel conditions. While many HVS image quality metrics are well
documented, the author has not found a system that describes close coupling with a mobile
environment simulation module. This research contributes in this area by fusing HVS
image quality analysis with simulated 3G activities and illustrates the usefulness of such a
combination by presenting quantifiable, consistent and effective image quality
measurement in the developed system. By taking this step, a more ergonomic error
quantification methodology is developed to provide effective and human-oriented feedback
to assist in many areas of multimedia research.
The main objective of this work is to construct a seamless 3G multimedia quality analysis
testing platform (commonly referred to in this thesis as the system). This system addresses
the contribution by using a HVS-based approach to analyze visual content quality
degradation while providing a detailed simulation of lower level 3G activities. The
majority of work centres on constructing a working UTRA simulator test bed component, a
working HVS-based image quality metric and verification of the functionality of the said
system. System development employs published 3G standards and a published robust HVS
image quality metric as system design. Methodology of the system is justified further in
Chapter 5.
Multimedia Quality Analysis over 3G Wireless Inter face
4
Designed to be versatile, the system demonstrates the novelty of using HVS methods to
analyze visual media distorted using a detailed simulation of 3G radio interface activities.
The system is configurable to perform operations from a multiple spectrum, based upon
user specifications (addressed further in Chapter 5). Reliable methods are used to develop
the major modules. The 3G test bed is developed directly from the UMTS specification,
using a reliable development tool (Advance Design System 2001 by Agilent Technologies).
Furthermore, the HVS module is implemented from a model of HVS behavior for
quantifying degradation of quality in visual media.
The system can be further considered as a first stage of an expandable system that is
extendable by modeling UMTS network behavior and UMTS connection with HiperLAN2
[24, 25] using the OPNET package. This future system is aimed to act as a testing base,
assisting the development of a dynamic media quality adaptation protocol for routing multi-
media service components over fast changing available channel capacity. Discussion on
this aspect will be carried out further in the discussion and conclusion.
This thesis can be logically broken down into the following sections: namely, the UMTS
background information (Chapter 2), system theory and design of system modules
(Chapters 3-4), system development and implementation (Chapters 5-7), system testing and
verification (Chapters 8-9) and conclusion (Chapter 10).
The chapter on UMTS background information covers the basic specifications for UMTS,
giving a general overview of the 3G standard and related infrastructure of its operation.
This aims to provide the reader with a conceptual understanding on the background
operation of 3G technologies, allowing them to appreciate the significance and internal
workings of 3G. This is necessary for the author to justify the contribution brought forward
by the work presented in this thesis. The chapter on system theory and design of system
modules conveys technical knowledge and specifications used during the development of
various major components of the system.
The chapter on system development and implementation presents the methodology behind
the development of the system, together with the internal structures of the implemented
system. The chapter on system testing and verification presents a series of tests and related

Multimedia Quality Analysis over 3G Wireless Inter face
5
results for verifying the system and its internal modules. The conclusion relates the entire
thesis presentation to the objectives stated here in the introduction and discusses possible
future work. The author has also published a refereed paper, which briefly summarizes the
theory and design behind the system and gives a number of related results.
Multimedia Quality Analysis over 3G Wireless Inter face
6
Chapter 2. 3G Background Information
Third generation mobile network (3G) is the latest advancement in the field of mobile
technology. Providing high bandwidth communication of 8kbit/s-2Mbit/s and a revolu-
tionary introduction of multimedia services over mobile communication, it aims to make
mobile devices into versatile mobile user terminals. The highlight of 3G is to make the
handset act more like a networked computer terminal rather than just a simple phone in
order to bring the long anticipated multimedia capability straight into the user's hand. With
this, there comes the promise of online e-commerce transactions, video conferencing,
seamless web connection and packet video services.
Because these new services demand both high bandwidth and packet-based data handling,
3G standards need to accommodate the newly surfaced wireless bandwidth and user
network management problem. These are subsequently handled by the W-CDMA
(Wideband Code Division Multiple Access) wireless technology, TD-CDMA (Time
Division CDMA) wireless technology and the all-IP network infrastructure respectively.
The all-IP network is beyond the scope of this thesis and will not be discussed any further.
Various 3G standards using W-CDMA technology have been proposed to the International
Telecommunication Union (ITU) among which Universal Mobile Telecommunications
System (UMTS) led by 3GPP and CDMA2000 led by 3GPP2 is among the popular 3G
standard.
This chapter provides an overview of UMTS standards in 3G technologies by building a
general skeletal picture of the widely-accepted standard. Information shown here is mainly
a general inclusion of UMTS technical knowledge, helping readers to grasp its concept and
appreciate its technological complexity. The presentation takes on a network level point of
view, where brief UMTS network architecture and service functions are presented. General
areas covered in this chapter include core network architecture, network control entities,
traffic management function and radio interface channel resources. The purpose of this
chapter is to demonstrate the author’s awareness of basic UMTS technical knowledge and
to further clarify the areas of UMTS/3G this research fits into.

Multimedia Quality Analysis over 3G Wireless Inter face
7
ATM: Asynchronous Transfer Mode (channel transmission protocol) CAMEL: Customized Applications for Mobile network Enhanced Logic FR: Frame Relay (channel transmission protocol) GGSN: Gateway GPRS Support Node (3rd generation packet data service for efficient data service) IN: Intelligent Network IP: Internet Protocol (Internet defined terminals network) N-ISDN: Narrowband Integrated Service Digital Network PSTN: Public Service Telephone Network (normal telephony) RNC: Radio network controller SGSN: Serving GPRS (Generic Packet Radio Service) Support Node SOHO: Small Office Home Office high-speed wireless network access
UMTS has been designed for deployment over GSM-MAP core network infrastructure
while CDMA 2000 uses ANSI-41 mobile infrastructure [26]. GSM-MAP and ANSI-41 are
both core networks for a second generation mobile network, with GSM-MAP servicing
Global Systems for Mobile (GSM) digital cellular phone systems and ANSI-41 supporting
IS-95 (CDMA based). Usage of the previous core network for support of third generation
mobile is feasible after minor upgrade while leaving the majority of the core network intact.
The reason for this is the fact that the evolution from second to third generation mobile
technology happens mainly in the wireless interface and service/data handling area. The
importance of 3G lies in its ability to interconnect with other networks. A simple
illustration is listed below. Note the roles of the core and wireless/radio network (e.g.
UTRA: UMTS Territorial Radio Access) in Figure 2.1.
Figure 2.1: UMTS/UTRA Architecture I llustration [26]
grasso
grasso
This figure is not available on line. Please consult the hardcopy thesis available from the QUT library
grasso

Multimedia Quality Analysis over 3G Wireless Inter face
8
2010 1980 2025 2110 2170 2200 1900 1920
W-CDMA (TDD)
W-CDMA
uplink (FDD)
MS W-CDMA (TDD)
W-CDMA Downlink (FDD)
MS
UMTS has been chosen as the 3G standard to be investigated in this thesis, because of its
flexibility and increasing popularity among researchers. This is mainly due to its planned
deployment over the existing GSM core network, which is already globally deployed.
Furthermore, it also supports both GSM (2nd Generation Mobile technology) and UMTS
(3rd Generation Mobile Technology) concurrently. The following sections attempt to give
some background information that relates to this work.
2.1 UMTS General Specifications
UMTS utilizes a bandwidth of 5 MHz with a basic chip rate of 4.096 Mcps over the 1900-
2200 MHz wireless spectrum. Orthogonal Variable Spread Factor (OVSF) is used to
provide different Quality of Service (QoS) and user bit rate up to 2 Mbps. The general
frequency band distribution can be seen as below:
Figure 2.2 UTRA bandwidth distr ibution [27] MS: Mobile Satellite application
FDD: Frequency Division Duplex (uplink and downlink has different frequency carrier
(f1 & f2), separated by frequency guard
TDD: Time Division Duplex (uplink and downlink has same frequency fc, this mode is
better utilized for asymmetric services e.g. download/upload, video on demand)
Blank area: For other high bandwidth wireless applications currently in existence
As shown above, the radio access in the UMTS/UTRA has two duplex modes for effective
utilization of the available radio spectrum: the Frequency Division Duplex (FDD) and Time
Division Duplex (TDD). FDD uses different frequencies in downlink and uplink, while
TDD uses time slot to synchronize between uplink and downlink (reciprocal transmission).
FDD & TDD may share the same bandwidth if interference is acceptable
Employing coherent detection for better performance, UMTS has the ability to invoke
dedicated pilot symbol embedded in user's data stream for support of adaptive antenna at
Base Station (BS). Furthermore, it includes short spreading code to implement
Multimedia Quality Analysis over 3G Wireless Inter face
9
performance enhancement techniques and requires no beacon or Global Positioning System
(GPS) inter-cell operation in FDD mode, as it is asynchronous.
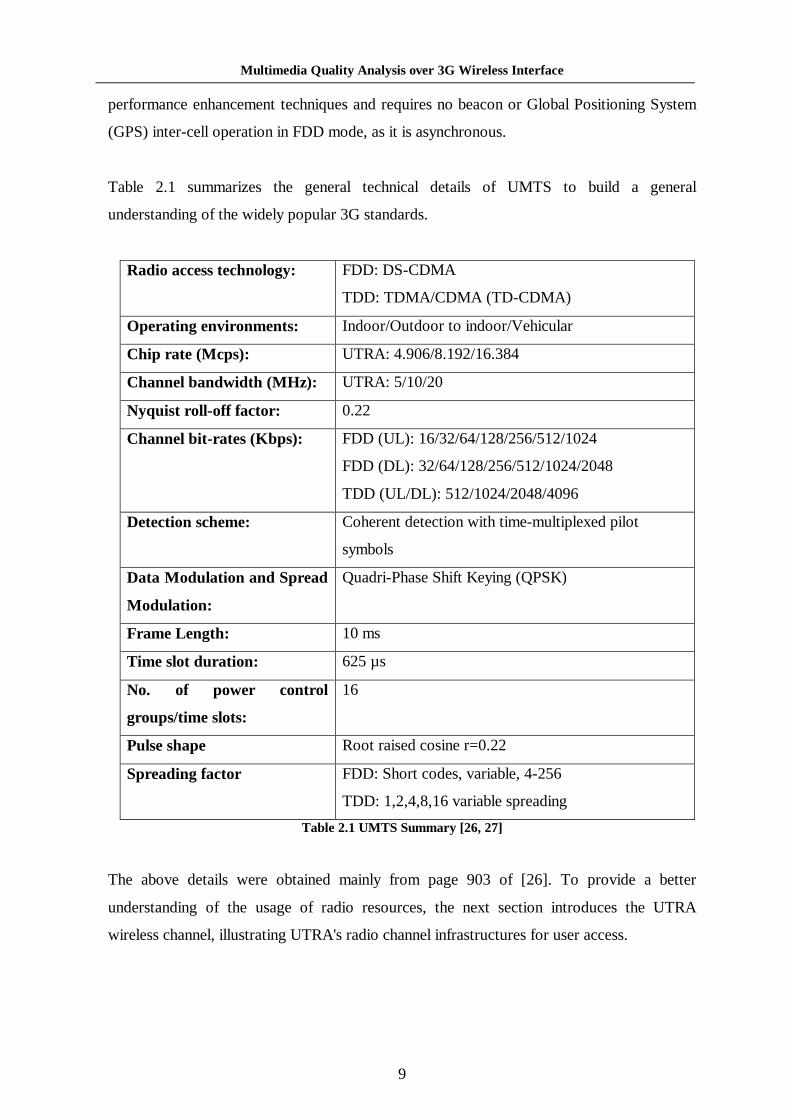
Table 2.1 summarizes the general technical details of UMTS to build a general
understanding of the widely popular 3G standards.
Radio access technology: FDD: DS-CDMA
TDD: TDMA/CDMA (TD-CDMA)
Operating environments: Indoor/Outdoor to indoor/Vehicular
Chip rate (M cps): UTRA: 4.906/8.192/16.384
Channel bandwidth (M Hz): UTRA: 5/10/20
Nyquist roll-off factor: 0.22
Channel bit-rates (K bps): FDD (UL): 16/32/64/128/256/512/1024
FDD (DL): 32/64/128/256/512/1024/2048
TDD (UL/DL): 512/1024/2048/4096
Detection scheme: Coherent detection with time-multiplexed pilot
symbols
Data M odulation and Spread
M odulation:
Quadri-Phase Shift Keying (QPSK)
Frame Length: 10 ms
Time slot duration: 625 µs
No. of power control
groups/time slots:
16
Pulse shape Root raised cosine r=0.22
Spreading factor FDD: Short codes, variable, 4-256
TDD: 1,2,4,8,16 variable spreading
Table 2.1 UMTS Summary [26, 27]
The above details were obtained mainly from page 903 of [26]. To provide a better
understanding of the usage of radio resources, the next section introduces the UTRA
wireless channel, illustrating UTRA's radio channel infrastructures for user access.

Multimedia Quality Analysis over 3G Wireless Inter face
10
2.2 UTRA Air Interface Radio Channels
This section describes some of the physical UTRA radio channels used for connection of
Base Station (BS), the ending node of the UMTS network and the User Equipment (UE),
also known as the Mobile Station (MS). Two major types of physical channel are available,
the dedicated transport channel for data transportation and the common transport channel
for system messages. These channels exist to service the upper layer transport channel.
UTRA channels are logically divided into physical and transport channels in accordance
with the Open System Interconnect (OSI) [28] system model definition.
The transport channel can be classed as either a dedicated transport channel or a common
transport channel. The former consists of a bi-directional Dedicated Channel (DCH) for
carrying user and control data between network and UE; it is mainly for user-oriented
usage. The other is for common network management-oriented usage, which includes
channels such as the Broadcast Control Channel (BCCH), Forward Access Channel
(FACH), Paging Channel (PCH) and Random Access Channel (RACH). BCCH is a
downlink channel that carries user and control information between network and UE (also
known as mobile station (MS)). FACH is a downlink channel for carrying control
information and a short user package. It comes into use when the BS serving the MS is
known. PCH is a downlink channel for carrying control information during call alert when
the serving BS of the MS being paged is not known. RACH is an uplink channel that
carries control information and a short user package for call setup [29].
The physical channels consist of a Dedicated Physical Data Channel (DPDCH), Dedicated
Control Physical Data Channel (DPCCH), Physical Random Access Channel (PRACH),
Primary Common Control Physical Channel (PCCPCH), Secondary Common Control
Physical Channel (SCCPCH) and Synchronization Channel (SCH) [27]. Both DPDCH and
DPCCH are used for carrying DCH data, of which DCH is directly mapped onto the two
channels. In the same context, RACH is mapped onto PRACH, BCCH onto PCCPCH and
FACH with PCH onto SCCPCH. SCH is an independent channel for physical layer use and
is not mapped onto by transport layer channels.
Multimedia Quality Analysis over 3G Wireless Inter face
11
DPDCH and DPCCH are both bi-directional channels, of which DPDCH is for data
transmission and DPCCH is for transmission sending of DCH information including the
pilot symbols, Transmit Power Control (TPC) command and Transport-Format Indicator
(TFI). Pilot symbols are used for facilitating coherent detection on both uplink and
downlink, TPC is for the CDMA power control scheme and TFI carries information related
to the instantaneous parameters of transport channels multiplexed on the physical channel
[27].
PCCPCH is a downlink channel used by BS to continuously broadcast the BCCH to all MS
in the mobile cell. SCCPCH is a downlink channel for carrying FACH and PCH
information, where transmission is made only when data are available. PRACH is an uplink
channel for random access of MS, where the MS needs to register itself on the network.
SCH is a downlink channel used for synchronization of BS and MS.
Ending the brief description of major channels in UTRA used for connecting mobile phone
and the fixed networks, the next section introduces the UMTS networking concept for the
fixed network in managing mobile services.

Multimedia Quality Analysis over 3G Wireless Inter face
12
User plane Control plane
Layer 2 Transport Layer
Layer 1 Physical layer
Layer 3 Network Layer
LAC
MAC
RRC
MM/CC
2.3 UMTS Network Architecture
This section aims to give the overview on UMTS network architecture, showing the overall
functional working and management of UMTS from a network prospective. As with earlier
mobile networks, UMTS needs to introduce specific functions to provide various mobile
services. These functional entities can be implemented using different functional
equipment or groups of equipment. The network architecture also varies in its
configuration to support specific functions. Functions are grouped into classes and
functional entities are created to deliver the specified function. These functional entities in
a UMTS Public Land Mobile Network (PLMN) can be divided into three separate groups,
namely the Core Network (CN) entities, Access Network (AN) entities and MS entities.
CN is the switching network for overall provision of mobile service, line management and
connection to fixed line networks (e.g. land telephone line, data network etc…). AN is the
radio/wireless interface between MS and CN, while MS is the end node for the entire
network. In terms of OSI model, AN can be presented into Layers 1-3 as per Figure 2.3.
Layer 1 is the physical layer while layer 2 divided into two sub-layers of Link Access
Control (LAC) and Medium Access Control (MAC) while layer 3 and LAC are divided into
Control and User Planes. Layer 3 is divided into Radio Resource control (RRC, interface
with layer 2), with higher layer of Mobility Management (MM) and Call control (CC) [29].
Figure 2.3 UMTS AN OSI I llustration
Some other specific mobile system entities are also available for dedication towards support
of specific services. However, their absence should have limited impact on other entities of

Multimedia Quality Analysis over 3G Wireless Inter face
13
the PLMN. These entities are: Group Call Register (GCR) entities, Shared InterWorking
function (SWIF) entity, Location Service (LCS) entities, Customized Applications for
Mobile network Enhanced Logic (CAMEL) entities, Cell Broadcast Centre (CBC) entities,
Number Portability Specific entities and IP Multimedia (IPM) Subsystem entities.
Note that Figure 2.4 illustrates the basic network architecture for the UMTS PLMN
configuration. It mainly consists of the basic mobile communication entities with
configuration that can support both GSM (2G) and UTMS (3G) radio access as shown in
the block configuration of UMTS showing the relationship of CN, AN and MS. The
following sections aim to provide a functionally-based description of UMTS, to further
revise the internal processes of UMTS. These sections (2.4-2.5) provide detailed insight
into the 4 major groups of entities namely the CN, AN, MS and other miscellaneous
entities, as described above.
Figure 2.4 Basic UMTS PLMN Configuration [30]
grasso
This figure is not available online. Please consult the hardcopy thesis available from the QUT library

Multimedia Quality Analysis over 3G Wireless Inter face
14
2.4 Core Network Entities
The Core Network (CN) entities include entities for both Packet Switched (PS) and Circuit
Switched (CS) domains. PS is a service mode intended for pure data communication (e.g.
internet browsing) and CS mode for constant traffic services such as conventional phone
calls. Functional entities in CN can be classified into the PS domain, CS domain or can be
common to both domains. The following subsections describe the three groups of CN
functional entities in detail, with the technical information sourced from [30].
2.4.1 CN Entities Common to PS and CS
Entities that are common to both PS and CS include Home Location Register (HLR), Home
Subscriber Server (HSS), Visitor Location Register (VLR), Equipment Identity Register
(EIR), Short Message Service Gateway Mobile Switching Centre (SMS-GMSC), SMS
Interworking MSC and Roaming Signaling Gateway Function (R-SGW).
Home Location Register (HLR) is a database for mobile subscribers (user of service)
management. It stores subscription information such as:
• Location information of subscriber equipment for MSC usage;
• Location information for SGSN usage (for GPRS support);
• Location Service (LCS) privacy exception list (for LCS support);
• Gateway Mobile Location Centre (GMLC) list (for LCS support); and
• MO-LR list (for LCS support).
HLR also stores various mobile subscription identity attachments, for example:
• International Mobile Station Identity (IMSI): for use as key to identify
Mobile Station (UE)/User Equipment (UE);
• Mobile Station International ISDN Number (MSISDN): one or more of this
is stored to be used as a key to identify MS/UE;
• Packet Data Protocol (PDP) address (for GPRS support) – 0 or more; and
• Location Measurement Unit (LMU) indicator (for LCS support).
Multimedia Quality Analysis over 3G Wireless Inter face
15
HLR may be used to store other information as well, including:
• Teleservice and bearer services subscription information;
• Service restrictions (e.g. roaming limitation);
• Parameters attached to supplementary;
• List of all group IDs usable by subscriber to establish voice group or
broadcast calls; and
• Information about GGSN (for GPRS support) – to allocate Packet Data
Protocol (PDP) address for a subscriber dynamically.
Home Subscriber Server (HSS) is used to substitute the HLR when IP Multimedia (IPM)
sub-network is implemented for delivery of multimedia over a UMTS All-IP network. It is
a master database that holds subscription information to support network entities that
handle calls or sessions. Some of its functions support call control in completing the
routing/roaming procedure by solving ambiguity in authentication, authorization,
naming/addressing resolution and location dependencies. As with HLR, it directly
interfaces with other functional entities such as the Mobile Switching Centre (MSC) Server,
Gateway MSC (GMSC) Server, Serving GPRS (Generic Packet Radio Service) Support
Node (SGSN), Gateway GPRS Support Node (GGSN), Roaming Signaling Gateway
Function (R-SGW) and Call Session Control Function (CSCF).
Some user information is held by HSS, including:
• User Identification, Numbering and addressing information;
• User Security information (Network access control information for
authentication and authorization);
• Inter-system level user location information (e.g. handling user registration,
stores inter-system location information etc.); and
• User profile (services, service specification information).
The HSS is responsible for supporting Call Control (CC)/ Service Manager (SM) entities of
various control systems (CS Domain control, PS Domain control, IP Multimedia control
etc.) offered by a service operator. It can also integrate heterogeneous information and
offers enhanced features in core network to applications and services domains, while
maintaining transparency of the heterogeneity to application and services domains. It does
not have to deal with the complex heterogeneous variety of the information.

Multimedia Quality Analysis over 3G Wireless Inter face
16
The various functionalities offered by HSS include:
• User control functions as required by the IPM subsystem;
• Subset of HLR functions as required by the PS Domain; and
• CS part of HLR (for subscriber access to CS Domain or legacy GSM/UMTS
CS Domain networks roaming).
Figure 2.5 Gener ic HSS Structure [30]
Figure 2.5 illustrates the generic conceptual view on HSS’s protocol structure and various
interfaces to other functional entities. These interfaces include Mobile Application Part
(MAP) termination, addressing protocol termination, authentication, authorization protocol
termination and IPM Control termination.
MAP termination is the procedure HSS uses to terminate MAP protocol. In MAP
termination, those are:
• User Location Management procedure;
• User Authentication Management procedure;
• Subscriber profile Management procedure;
• Call handling support procedure (routing information handling); and
• Subscriber Server (SS) related procedure.
As illustrated in Figure 2.5, addressing protocol termination is where HSS terminates a
protocol to solve addressing issues by using appropriate protocol. This is used primarily for
user name/numbers/addresses resolution. Authentication & authorization protocol
termination takes place after HSS terminates authentication and authorization protocols
according to appropriate standards. This is used primarily for user authentication and
grasso
This figure is not available online. Please consult the hardcopy thesis available from the QUT library
grasso
grasso
grasso

Multimedia Quality Analysis over 3G Wireless Inter face
17
authorization procedures in IP-based Multimedia services. IPM Control termination is used
when HSS terminates the IP-based multimedia call control protocol, according to
appropriate standards. This is used primarily for User Location Management procedure for
IP-based multimedia service and includes IP-based Multimedia call handling support
procedure.
Visitor Location Register (VLR) is the functional entity used to control Mobile Station
(MS) roaming in an MSC controlled area. When the area’s MSC receives MS’s registration
procedure for entering a new location area, it transfers the identity of MS current location
area to VLR for storage. VLR and HLR exchange information to allow proper handling of
calls if MS is not yet registered on VLR. VLR may be in charge of several MSC areas
simultaneously, storing information elements for call setup-up/receive by MS
(supplementary service may require additional information obtained from HLR). The
elements included are:
• International Mobile Subscriber Identity (IMSI);
• Mobile Station International ISDN Number (MSISDN);
• Mobile Station Roaming Number (MSRN);
• Temporary Mobile Station Identity (TMSI);
• Local Mobile Station Identity (LMSI);
• MS’s registered location ;
• Identity of SGSN with MS’s registration (for GPRS support which has Gs
interface between MSC/VLR and SGSN); and
• Initial and last known location of MS.
VLR also contains supplementary service parameters applicable for registered mobile
subscribers.
Authentication Centre (AuC) stores data for each mobile subscriber, allowing authen-
tication of International Mobile Subscriber Identity (IMSI) and communication over radio
path between MS and the network to be ciphered. It transmits authentication and ciphering
data to VLR, MSC and SGSN via HLR for their authentication purpose. AuC also stores
an identification key in association with HLR for each mobile subscriber. The key is used
to generate IMSI authentication data and key for cipher communication between MS and

Multimedia Quality Analysis over 3G Wireless Inter face
18
network over the radio path. AuC communicates only with its associated HLR over the H-
interface.
Equipment Identity Register (EIR) is the GSM system logical entity that is responsible for
storing International Mobile Equipment Identity (IMEI) in the network using self-contained
one or several databases. Mobile equipment needs to be classified into three separate lists
of “white listed” , “gray listed” and “black listed” , in EIR. However, IMEI may still be
unknown to EIR.
SMS Gateway MSC (SMS-GMSC) acts as an interface for Short Message Service Centre
(SMSC) to MSC for delivery of messages to MS. SMS Interworking MSC acts as an
interface for Short Message Service Centre (SMSC) to MSC for submission of messages
from MS.
Roaming Signaling Gateway Function (R-SGW) performs bi-directional signaling
conversion between SS and based transport signaling in older Pre release 4 (release
standard of IMT-2000) network and IP-based transport signaling of release 1999 network.
It inter-works with Sigtran SCTP/IP signaling protocol and SS7 MTP signaling protocol.
This includes interfacing pre release 4 network MSC/VLR to IP transport of MSP-E and
MAP-G. This section has provided an overview on functional entities common to both CS
and DS domains. The next section continues with an overview of core network entities
specific to the CS domain.
2.4.2 CN Entities Specific to CS Domain
This section continues with the functional entities that are specific to the CS domain. The
functional entities that fall under this group include the Mobile-service Switching Centre
(MSC), Gateway MSC (GMSC) and Interworking Function (IWF).
Mobile-service Switching Centre (MSC) is the interface between a radio access system and
a fixed network, which performs all required functions to allow Circuit Switched (CS)
service to and from MSs. It acts as a switching exchange to handle all switching and
signaling functions for MS in the location area designated for individual MSCs.
Furthermore, the other factors that need to be considered are the impact of radio resources

Multimedia Quality Analysis over 3G Wireless Inter face
19
allocation on a network, action appropriate for the mobile nature of the subscribers,
performance of the procedure required for location registration and performance of the
procedure required for handover (from BS to BS, MSC to MSC etc.). MSC can be
implemented in two modules, the MSC Server and the Media Gateway Function (MGW).
MSC server mainly comprises of Call Control (CC) and mobility control parts of the MSC.
It terminates user-network signaling and initiates appropriate network-network signaling. It
contains a VLR to hold mobile subscriber’s service data and CAMEL related data. It
handles the connection control part of a call state for media channels in a MGW.
Media Gateway Function (MGW) has the role of defining the PSTN/PLMN transport
termination point in the mobile network, while interfacing UTRA Network (UTRAN) with
core network (mobile network backbone). It may also terminate bearer channel from
switched circuit network and media streams from a packet network (e.g. RTP streams in IP
network) and may support media conversation, bearer control, and payload processing (e.g.
MPEG-4 codec processing). Furthermore, it exhibits the characteristics of interacting with
the Media Gateway Control Function (MGCF), MSC server and GMSC server for resource
control, owning and handling resources (e.g. echo cancellers) and may at times need to
have appropriate codec for media processing. Resource arrangement allows MGW to be
provisioned with necessary resources, for support of UMTS/GSM transport media.
Gateway MSC (GMSC) performs a routing function (interrogate appropriate HLR and then
route call to MSC holding MS’s registration) to MS on behalf of external network that
cannot interrogate HLR directly (barred by network operator). Network operator may
choose to appoint MSC to become GMSC to handle voice group/broadcast call directly,
routing it to VBS/VBGS Anchor MSC based on call reference contained in the dialed
number. GMSC can be implemented in two different entities: Gateway MSC Server
(GMSC Server) and MGW. GMSC Server handles only signaling and comprises mainly of
call control and mobility parts of the GMSC.
Interworking Function (IWF) is a functional entity associated with the MSC that provides
interworking between a PLMN and fixed networks (e.g. ISDN, PSTN, PDNs), with the
functionality dependent on service and fixed network type. It is required to interchange
protocol between both networks of Public Land Mobile Network (PLMN) and fixed lined
Multimedia Quality Analysis over 3G Wireless Inter face
20
network. Where PLMN service implementation is directly compatible with the interfacing
network, this function is omitted.
This ends the section on functional entities specific to the Circuit Switch (CS) domain,
running through the functionality of the various entities within the CS domain. The next
section continues on related topics by covering the functional entities specific to the Packet
Switch (PS) domain.
2.4.3 CN Entities Specific to PS Domain
UMTS Packet Switch domain (or GPRS) consists of the interface between the radio access
system and fixed networks (ISDN, PSTN etc) for Packet switch service. It is responsible
for performing functions that allow packet transmission to and from a MS. The entities
associated with this domain are Serving Generic Packet Radio Service (GPRS) Support
Node (SGSN), Gateway GPRS Support Node (GGSN) and Border Gateway (BG).
Serving GPRS Support Node (SGSN) has a location register that stores two types of
subscriber data for the handling of the packet data transfer originating and terminating
operation. This includes subscriber information and location information. The former
contains the International Mobile Subscriber Identity (IMSI), one or more temporary
identities and zero or more Packet Data Protocol (PDP) addresses. The later has
information on the cell or Routing Area (RA) where MS was registered (selection depends
on operational mode of MS) and Gateway GPRS Support Node (GGSN) number of all
GGSN that maintains active Packet Data Protocol (PDP) context with current SGSN.
Gateway GPRS Support Node (GGSN) has a location register that stores two types of
subscriber data for the handling of the packet data transfer originating and terminating
operation. The subscriber data as received from HLR and SGSN has subscriber
information that contains IMSI and zero or more Packet Data Protocol (PDP) addresses.
Available together with the subscriber data are location information, storing SGSN address
of SGSN where MS was registered and GGSN number of all GGSN that maintains active
PDP context with current SGSN.

Multimedia Quality Analysis over 3G Wireless Inter face
21
Border Gateway (BG) acts as the gateway PLMN, which supports GPRS and external Inter-
PLMN backbone (backbone network to interconnect PLMNs) that supports GPRS. It
provides an appropriate level of security for PLMN and its subscriber and is needed in
PLMN to support GPRS only. This point concludes the entire section on Core Network
(CN) functional entities, which provided a detailed overview of the functional entities
within the UMTS CN. The next section continues with a description of the functional
entities within the other two networks, Access Network (AN) and Mobile Station (MS).
2.5 Access Network Entities and Mobile Station Entities
AN entities provide access technology support (to access MS) for core network using two
different types of access network, Base Station System (BSS) and Radio Network System
(RNS). The MSC has the option to connect to either or both of the access networks.
Base Station System (BSS) offers TDMA-based access technology (i.e. for GSM). This is
the system of base station equipment (e.g. transceivers, controllers etc.) responsible for
communicating with Mobile Stations in a defined area. It is accessed by MSC through A
interface and SGSN through Gb interface, supporting one or more mobile cells. If Abis-
interface is implemented, then BSS consists of one Base Station Controller (BSC) and
several Base Transceiver Stations (BTS). BSC is used for controlling an area of radio
coverage consisting of one or more cells in GSM and it can control one or more BTS. BTS
is the network component that serves a single cell in the GSM environment [30].
Radio Network System (RNS) offers W-CDMA-based access technology for UTRA air
interface. It is also a system of base station equipment responsible for communicating with
Mobile Stations in a defined area. Accessed by MSC through Iu-CS interface and SGSN
through Iu-PS interface, RNS may support one or more cell. It consists of one or more base
stations, one Radio Network Controller (RNC) and one or more Nodes. RNC is used to
control an area of radio coverage consisting of one or more cells in UMTS, so it controls
one or more Node B. Node B is a network component that serves a single cell [30].
Mobile Station (MS) functional entities consist of physical user equipment usable by a
subscriber of the PLMN. It includes Mobile Equipment (ME) and Mobile Termination
Multimedia Quality Analysis over 3G Wireless Inter face
22
(MT) for supporting various TA and TE functions, depending on application and services
parameters. Terminal Adapter (TA) is any network device, which TE uses to interface with
the network. Terminal Equipment (TE) is actual service equipment used by user, e.g.
mobile phone, Personal Digital Assistance (PDA) etc. [30].
Subscriber Identity Module (SIM) for GSM or UMTS Subscriber Identity Module (USIM)
for UMTS is the functional entity residing on the MS and used for accessing services with
appropriate security [30].
This ends the section on AN and MS functional entities to illustrate their functional roles
within the mobile network. It also concludes the sub-section of UMTS network
architecture and the entire section on UMTS background as well. These sections have
introduced the general definition of UMTS, the main components of UTRA radio channels
and how the network architecture delivers UMTS.
The research presented in this thesis is conducted on the transport and physical layer of
UMTS, specifically the interface between AN and MS. Overall, this research concentrates
on quality of multimedia content at application level, while considering the impairment
injected by operations at the lower level of UMTS, namely the transport and physical layer.
It is assumed that the reader now possesses the basic information on the roles of various
components and the internal working of UMTS and UTRA, and thus can identify how the
work presented in this thesis relates to the UMTS technology.
The remainder of the thesis progresses through the development of the main contributions
and related essential information, namely covering the UMTS radio specification and image
quality metric background information.

Multimedia Quality Analysis over 3G Wireless Inter face
23
Chapter 3. UMTS Radio Interface
This section pursues a direction closer towards defined objectives by investigating the topic
directly related to building the 3G/UMTS test bed. The UMTS radio interface [31] in the
access network is described, probing the issue of providing multiple access of Mobile
Stations (MS) by Base Stations (BS) and data processing from transport to physical
channel. The aspects discussed in this section are limited to Layer 1 (Physical Layer) and
Layer 2 (Transport Layer) of the UMTS radio access interface.
To provide effective multiple high data rate (up to 2 MBit/s) access for multiple users,
UTRA utilizes the multiple access technology in the limited bandwidth (1900 MHz – 2200
MHz) by using Wideband Code Division Multiple Access (W-CDMA) technology [26, 27].
More details on W-CDMA can be found in [32]. The radio access in the UMTS/UTRA has
two duplex modes for further effective utilization of the spectrum: the Frequency Division
Duplex (FDD) and Time Division Duplex (TDD).
FDD uses different frequencies in each downlink and uplink channels, where a separate
band with distinct separation is assigned for the downlink and uplink channels. TDD uses
time slots to synchronize between uplink and downlink, while using the same radio
frequency. Time slots are divided into transmission and reception parts and information is
transmitted reciprocally. A typical radio frame is 10 ms long and is divided into 15 slots
(2560 chip/slot at 3.84 Mcps rate). As defined by CDMA, a distinct code is defined as a
physical channel. The base technology used can be either a 5MHz wide spread bandwidth
Direct Spread CDMA (DS-CDMA) in FDD (i.e. W-CDMA) or 3.84 Mega Chip Per Second
(Mcps) in TDD, or the 1.6 MHz spread DS-CDMA (narrowband CDMA) for 1.28 Mcps
TDD[12].
For 3.84 Mcps physical access, channel information rate varies with symbol rate derived
from 3.84 Mcps chip rate and spreading factor. It ranges from 4 to 256 with FDD uplink
and 4 to 512 with FDD downlink and 1 to 16 for TDD uplink and downlink. Modulation
symbol rate varies from 15 k symbols/s to 960 k symbols/s in FDD uplink and downlink

Multimedia Quality Analysis over 3G Wireless Inter face
24
and 3.84 M symbols/s to 240 k symbols/s for TDD. TDD in 1.28 Mcps uses 10 ms radio
frame that divides into two 5 ms sub-frames, which each contain seven normal time slot
and three special time slots. Modulation symbol rate varies from 80.0 K symbols/s to
1.28M symbol/s, as the spreading factors vary from 1 to 16 [12].
Whichever duplex mode is chosen, a common procedure (with different details) applies to
process input bits into transmittable data (physical layer signal). Starting from the data link
layer, the four common steps involved are multiplexing, channel coding, spreading and
modulation. This section concentrates on the procedure specific in FDD Duplex.
Multiplexing and channel coding are among the processes of providing Media Access
Control (MAC) from the physical layer to the upper layer. Channel coding is for
randomizing transmission errors, with options including convolution coding, turbo coding
or no coding. The modulation scheme used by UTRA is QPSK (8PSK for 1.28 Mcps
TDD), with spreading and scrambling closely associated with modulation. A different
spread code family is used for different spreading situations. For separating different cells
(downlink):
• FDD: 10 ms period gold codes (38400 chips at 3.84 Mcps) with code length of 218-1
chips [11]; and
• TDD: Scrambling code with length 16 [33].
For separating different UE (uplink) [12]:
• FDD: 10 ms period gold code or S(2) codes with 256 chip period; and
• TDD: 16 chips period codes and midamble sequences of different length,
environmentally dependent.
The general process is illustrated in Figure 3.1, where multiplexing and channel coding
involve a combination of error detection, error correction, rate matching, interleaving and
mapping transport channel into the physical channel. The spreading and modulation
operation is applied to the signal produced from the process shown [12].
The area chosen to be investigated for this thesis is UTRA FDD downlink. The following
subsections give more specific details on the four major functions mentioned, specifically
those related to the Dedicated Channel (DCH).

Multimedia Quality Analysis over 3G Wireless Inter face
25
Figure 3.1 Transpor t/Physical Channel Downlink Structure [11, 12]
Spread and Scrambled data
Channel mapped data symbol blocks
Receiver (reverse the above processes)
grasso
grasso
This figure is not available online. Please consult the hardcopy thesis available from the QUT library

Multimedia Quality Analysis over 3G Wireless Inter face
26
3.1 Multiplexing and Channel Coding
This section concentrates on the multiplexing and channel coding aspects of UTRA
transport layer processing. The processes covered are transport layer procedures that
process transport layer data into an acceptable form for the physical layer. The transport
channels are hereby mapped onto physical radio channels as well. A simplistic breakdown
of the overall process is provided below, followed by a more detailed analysis of the
individual processes.
Incoming data are packaged into a series of Transport Blocks (TrBk) of which CRC [34] is
the error detection provided upon each of them. In a Transmission Time Interval (TTI),
transport blocks are serially concatenated but are code block segmented if the number of
bits in the code blocks exceed the maximum size limit Z. Channel coding is then
performed, with a choice of convolutional coding, turbo coding and no coding, with its
corresponding coding rate. Rate matching is applied to repeat or puncture transport channel
bits, to match the appropriate rate. Indication of Discontinuous Transmission (DTX) is
added prior to first interleave, where block interleave with inter-column permutation is
used.
To fit the blocks within an appropriate time frame, the blocks are segmented and mapped
into 10 ms radio frames. Upon each 10 ms interval, a radio frame from Transport Channel
(TrCH) is sent into the TrCH multiplexing process, where frames from multiple channels
are multiplexed serially into a Coded Composite Transport Channel (CCTrCH). The
second DTX indicated is then added, follow by physically segmenting the data stream into
the Physical Channel (PhCH). If more than one PhCH is in use, the bits are divided among
the different PhCHs. This is followed immediately by the second interleave, which uses a
block interleaver in 3 steps. First, one places the input bits into the matrix and applies
padding, then applies column permutation to the matrix and output bits from the matrix and
applies pruning. The bits are then mapped onto the Physical Channel (PhCH). The DTX
indication bits are used to fill up the radio frame, indicating when the transmission should
be turned on or off. First DTX insertion is inserted only if the position of the TrCH in the

Multimedia Quality Analysis over 3G Wireless Inter face
27
radio frame is fixed. Second insertion is at the end of the radio frame. Physical channel
mapping follows before the handing over to spreading and modulation. These will be
covered in more detail in the subsections below, while further details can be located in [35].
3.1.1 CRC Attachment
CRC is used as error detection on transport blocks, of which parity bit size can be 24, 16,
12, 8 or 0 bit. The parity bit block Li is applied upon transport block m of Transport
Channel (TrCH) I of size Ai. The polynomials of the cyclic generator are [35]:
• gCRC24(D) = D24 + D23 + D6 + D5 + D + 1;
• gCRC16(D) = D16 + D12 + D5 + 1;
• gCRC12(D) = D12 + D11 + D3 + D2 + D + 1;
• gCRC8(D) = D8 + D7 + D4 + D3 + D + 1.
3.1.2 Transport Block Processing
The representation for tranport block concatenation is as listed below[35]:
• bim1,bim2…bimBi represent the tranport block;
• i is the TrCH number;
• m is transport block number;
• Bi the number of bits in each block (CRC included);
• xi1,xi2…xixi represent the pro concatenation bits.
The relation is defined as:
• xik = bi1k (k=1,2,…,Bi);
• xik = bi,2,(k-Bi) (k= Bi +1, Bi +2,…,2Bi) ……;
• xik = bi,Mi,(k-Bi) (k= (M i-1)Bi +1, (M i-1)Bi +2,…, M iBi.
Code block segmention is performed on the transport block if the size of the block X i is
larger than maximum allowable code block size Z. Z is determined by the channel coding
method used, where convolution coding [36] gives Z = 504; turbo coding [37] gives Z =
5114 and no channel coding yields Z = unlimited.

Multimedia Quality Analysis over 3G Wireless Inter face
28
3.1.3 Channel Coding
Representation for channel coding block is as listed below [35]:
• 0ir1,0ir2…0irki represents the channel coding block;
• r is the code block number
• Ki is the number of bits in each code block
• Yi is the number of encoded bits
The choices of channel coding available are convolutional coding k, turbo coding and no
coding, Table 3.1 showing the coding scheme and rate for the various transport channels
while the coding scheme is described below:
• Convoluntional coding: with rate 1/2 yields Y i = 2*Ki + 16; rate 1/3:
Y i = 3*Ki + 24;
• Turbo coding: with rate 1/3: Y i = 3*Ki + 12;
• No coding: Yi = Ki.
Type of TrCH Coding Scheme Coding
rate
Broadcast Channel(BCH)
Paging Channel(PCH)
Random Access Channel(RACH)
1/2
Convolutional
Coding
1/3, 1/2
Turbo Coding 1/3
Control Physical Channel(CPCH), Dedicated
Channel(DCH), Downlink Share Channel(DSCH), Forward
Access Channel(FACH) No Coding
Table 3.1 Channel Coding Scheme
3.1.4 Radio Frame Equalization & First Interleaving
Radio Frame Equalization is the process of padding the input bit sequence ensuring that
output can be segmented into a size required in rate matching. This is only performed in
the uplink as downlink rate matching output block length is always conformed to the
required criteria.

Multimedia Quality Analysis over 3G Wireless Inter face
29
A block interleaver with inter-column permutaions is used to perform the first interleaving.
xi,1,xi,2…xi,xi denotes the input bit into block interleaver. i is the TrCH number and Xi the
number of bits. The number of columns needed for permutation is listed in Table 3.2 [35].
Transmission Time
Interval
(TTI)
Number of columns (c1) Inter-column permutation
paterns
<P1c1(0)…P1c1(c1-1)>
10 ms 1 <0>
20 ms 2 <0,1>
40 ms 4 <0,2,1,3>
80 ms 8 <0,4,2,6,1,5,3,7>
Table 3.2 Inter -column permutation patterns for 1st inter leaving
The procedure is as follows:
1. Construct a matrix X with column number c1 as selected from Table 3.2 and
number it 0..c1 from left to right.
2. Number of rows of the matrix is calculated as Xi/c1.
3. Write input bit sequence into matrix row by row from left to right and top to
bottom.
4. Shufflle columns (inter-column permutation) as per specified in the inter-
column permutation table to form new matrix Y.
5. Read output bit sequence from Y column by column, top to bottom and left to
right.
3.1.5 Radio Frame Segmentation, Rate M atching and Transport Channel
M ultiplexing
In radio frame segmentation, the input bit sequence is segmented when Transmission Time
Interval (TTI) is longer than 10 ms. Given radio frame block length Fi, the input bit
sequence length is semented into a series of bits in segments of Fi length [35].

Multimedia Quality Analysis over 3G Wireless Inter face
30
Rate matching is a process by which bits on a transport channel are repeated or punctured
to match the attributes of the assigned rate. Number of bits to be repeated or punctured are
calculated based on TTI. This is done to ensure total bit rate after TrCH multiplexing is
identical to total channel bit rate of allocated dedicated physical channels.
Transport Channel (TrCH) multiplexing is performed when a multiple transport channel is
available. Given multiple (more than one) Transport Channel (TrCH), a radio frame from
each TrCH is delivered for TrCH multiplexing every 10 ms, where it is serially multiplexed
into a Coded Composite Transport Channel (CCTrCH).
3.1.6 Discontinuous Transmission Indication Insertion
Discontinuous Transmission Indication (DTX) is the downlink process of filling the radio
frame with bits. It indicates when the transmission should be turned off and when it is not
transmitted. Two insertions of DTX indication bits are performed. The insertion point of
DTX indication bits is dependent on the fixation option in TrCHs (fixed or flexible
position) [35]. First DTX insertion is used if the position of the TrCHs in the radio frame is
fixed. Insertion of the 2nd indication bits is placed at the end of the radio frame. However,
the DTX is distributed over all slots after the second interleaving.
The first insertion of DTX indication bits fills up the TTI with the following format:
• hik = gik k = 1,2…,Gi;
• hik = δ k = Gi + 1, Gi+2…DI,
where:
• hik is the bits output from the DTX insertion;
• gik is the input bits;
• Gi is the number of bits in one TTI of TrCH i;
• Di is the number of radio frames multiplied by the number of bits in a radio
frame minus bits that have been punctured; and
• δ is the DTX inserted.
The second insertion of DTX indication bits has the following format:
• wk = sk k = 1,2…,S;

Multimedia Quality Analysis over 3G Wireless Inter face
31
• wk = δ k = S + 1, S+2…P.R,
where:
• wk is the bits output from the DTX insertion;
• sk is the input bits;
• S is the number of bits from TrCH multiplexing;
• P is the number of physical channels;
• R is the number of bits in one radio frame, including DTX bits for each physical
channel; and
• δ is the DTX inserted.
3.1.7 Physical Channel Segmentation and Second Interleaving
When multiple physical channels (more than one) is used to transport data, physical
segmentation is needed to divide bits among different physical channels. The bit
distribution is noted as follows [35]:
• u1,k = xf(k) k = 1..U;
• u2,k = xf(k+U) k = 1..U;
• uP,k = xf(k+(P-1)xU) k = 1..U,
where:
• xX is the input bits;
• uP,k is the output bits;
• P is the number of physical channels;
• U is the ratio between the number of input bits and the number of physical
channels; and
• F is conditional. During non-compressed mode f(k) = k. But when compression
by puncturing:
��U1,1 corresponds to bit xk, with k being the smallest index if bits p are not
counted; and
��U1,2 corresponds to bit xk, with k being the smallest index if bits p are not
counted and this continues for u1,3 until uP,u.

Multimedia Quality Analysis over 3G Wireless Inter face
32
In the second interleaving, a similar operation to the first interleaving is used, but 30
columns are used this time, where the permutation pattern is:
Number of columns (c2) Inter-column permutation pattern
<P2(0), P2(1)…P2(c2-1)
30 <0, 20, 10, 5, 15, 25, 3, 13, 23, 8, 18, 28, 1, 11, 21, 6, 16,
4, 14, 24, 19, 9, 29, 12, 2, 7, 22, 27, 17>
Table 3.3 Inter -column permutation patterns for 2nd inter leaving
3.1.8 Physical Channel M apping
Physical mapping is done by mapping bits vpk onto the Physical Channels (PhCHs). The
bits for each PhCH are to be transmitted over the air interface in ascending order, following
k. Notation in this section is denoted as follows [35]:
• vp1….vpU are the input bits;
• p is the physical channel number; and
• U is the number of bits in one radio frame in one physical channel.
Downlink physical channels do not need to be completely filled with bits. The association
of transport channels with physical channels is as listed below:
Transport Channels Physical Channels
grasso
grasso
grasso
This figure is not available online. Please consult the hardcopy thesis available from the QUT library
Multimedia Quality Analysis over 3G Wireless Inter face
33
Table 3.4 Transpor t Channel to Physical Channel Mapping [35]
This section describes the operations involved in multiplexing and channel coding,
processing transport level data into a form suitable for conversion into a physical signal.
The next section covers the remainder of the transport data conversion process, providing
details with spreading and modulation in the preparation of the physical layer data for radio
transmission.
grasso
This figure is not available online. Please consult the hardcopy thesis available from the QUT library
grasso
grasso
Multimedia Quality Analysis over 3G Wireless Inter face
34
Spreaded signal
3.2 Modulation and Spreading
This section covers the modulation and spreading technique used by the UTRA FDD
downlink channel. This technique is used for the Primary Common control Physical
channel (P-CCPCH), Secondary Common Control Physical Channel (S-CCPCH), Common
Pilot Channel (CPICH), Acquisition Indicator Channel (AICH), Page Indication Channel
(PICH), Physical Dedicated Shared Channel (PDSCH) and Downlink Dedicated Physical
Channel (DPCH), which is the common phrase referring to the Dedicated Physical Data
Channel (DPDCH) and the Dedicated Physical Control Channel (DPCCH). See the details
derived from [11].
Figure 3.2 Downlink spreading [11]
The downlink data are first serial-to-parallel converted and mapped onto I and Q arm (each
symbol pair converts to even and odd numbers respectively) as shown in Figure 3.2. The
two notable processes of channelization (Cch,SF,m) and scrambling (Sdl,n) are visible. The
channelization is used to spread the real value code Cch,SF,m to the actual chip rate. The
chips are then scrambled via complex chip-wisemultiplication using complex-valued
scrambling code Sdl,n. The channels are then individually weighted and convolved. The
spreaded channels are complex added, before being complex added again with the non
spreaded channels, and then handed to the modulator. Note that the physical channels feed
into the spreading process (except Acquisition Indicator Channel (AICH)) and can have
value of +1, -1 and 0 (0 indicates DTX). The various downlink physical channels are
multiplexed as shown in Figure 3.3.
grasso
grasso
grasso
This figure is not available online. Please consult the hardcopy thesis available from the QUT library
Multimedia Quality Analysis over 3G Wireless Inter face
35
Downlink Physical Channels from Spreading in Figure 3.2-1
Figure 3.3 Multiplexing of Multiple Physical Channels [11]
The channelization code used in spreading is called the Orthogonal Variable Spreading
Factor (OVSF, maintains orthogonality between channels of different rates and spreading
factors). P-CPICH and P-CCPCH are fixed with channelization codes Cch,256,0 and Cch,256,1
respectively, while the remaining channel is dynamically assigned into another
channelization code by the UMTS access network UTRA Network (UTRAN). OVSF is
defined as per Figure below, noting the format is Cch,SF,k where k is the code number and 0
≤ k ≤ SF-1.
Figure 3.4 Channelization Code Definition [11]
grasso
This figure is not available online. Please consult the hardcopy thesis available from the QUT library
grasso

Multimedia Quality Analysis over 3G Wireless Inter face
36
A total of 262143 separate and distinctly different scrambling codes are utilized from the
218-1 combination. It is divided into 512 sets of primary scrambling codes and each has 25
secondary scrambling codes. It is generated by combining two real sequences into a
complex sequence. The real sequence is constructed as position-wise modulo-2 sum of
38400 chip segments of two binary m-sequence generated by a two-polynomial generator
of degree 18. The resulting sequence is a set of gold sequence, which is repeated every 10
ms radio frame. Suppose x and y are the two real sequences, x sequence is constructed
using polynomial 1 + X7 + X18 and y sequence constructed using polynomial 1 + X5 + X7 +
X10 + X18. Taking the m-sequence as Zn(i) = x((i+n) modulo (218-1)) + y(i) modulo 2,
where I = 0….. 218-2. The scrambling code Sdl,n(i) is thus = Xn(i) + jZn(i+131072) modulo
(218-1)), i = 0,1,…,38399. [11]
The spread complex-valued chip sequence is then modulated using a QPSK [38] modulator,
illustrated as below (downlink modulation chip rate is 3.84 Mcps):
Figure 3.5 QPSK Modulator [11]
This ends the section on spreading and modulation, and also the entire section on the
UMTS radio interface. This section has provided a conceptual but technical overview of
the actual process of the wireless connection between UTRA network and UE. It is
assumed now that the reader has acquired enough information about UTRA to allow an
understanding of the section on the UTRA simulation test bed module. This section has
formed the conceptual design for the building of the UTRA module in the test bed, as
shown in later sections. The next section is concerned with the other element, which is
equally important in this thesis, the HVS-based image quality metric.
grasso
grasso
This figure is not available online. Please consult the hardcopy thesis available from the QUT library

Multimedia Quality Analysis over 3G Wireless Inter face
37
Chapter 4. HVS-Based Image Quality Metric
With the incremental advancement of mobile communication technology, the presence of a
multimedia component in the communication services is forever on the increase. Example
applications of the heavy usage of a multimedia component include web browsing, video
streaming, video conferencing etc. Such user services are already commonplace within the
wired network but are gradually being introduced onto the mobile network, following the
ongoing deployment of technology that enables such high demand applications. UMTS
standards currently define several classes of services covered by the standard [16], this
includes conversational classes (e.g. voice), streaming class (e.g. video streaming),
interactive class (e.g. web browsing) and background class (e.g. email download). Quality
assurance can be establish via a Quality of Service (QoS) contract, where the parameters
listed are ensured to stay within an acceptable level. Examples of measurements of quality
in terms of QoS are, for example, the guaranteed bit rate, maximum bit rate, transfer delay
and bit error ratio [39].
At present, it is the only early stages of 3G/UMTS deployment, and the majority of
communications task will concentrate on delivering connectionless data-oriented services
(e.g. web browsing). Mobile networks have wireless behavior which is dramatically
different from the wired network as it operates in an open-air environment within which a
greater injection of error is inevitable. Without proper communication protocols at both
application and service level, much of the contents may be rendered useless. Upon failure
of protocols to protect such impairment, the content will need to be reconstructed at the
user end. Graphic and text content are still easy to reconstruct; however, pictures or still
images in web page contents are a much more difficult task. Therefore, when measuring
quality of user end service, it is important to consider the deformation and impairment of
still images. Furthermore the subsequent effect on the human subject is important, as the
purpose of 3G is to bring multimedia content closer to the user.
An effective visual media quality measurement can provide constructive feedback towards
measuring the accuracy and effectiveness of solutions many researchers have proposed to

Multimedia Quality Analysis over 3G Wireless Inter face
38
improve multimedia delivery. Note from before that the quality measurements at UMTS
service and traffic level are in terms of QoS parameters, which do not effectively represent
quality of visual media. Consequently, it is common to quote physical data quality
measurement (e.g. bit error rate, packet error rate) or video signal measurement (e.g.
PSNR) when testing for multimedia quality over the wireless network although the quality
of the multimedia content is actually the main concern. QoS parameters do not necessarily
reflect the perceptual quality of the visual content; a more advanced and ergonomic
perceptual quality metric is needed for a different yet effective approach to measuring
media visual content quality [40].
This chapter aims to investigate an effective and ergonomic method of measuring the
quality of multimedia visual content, especially for still images. The following is divided
into three sections, with the first discussing the basic concepts of HVS-based image quality
measurements. This is closely followed by presentation of two major in-depth concepts of
this area, in two separate sections.
4.1 A Question of Measuring Image Quality
Image and picture quality has become an increasingly important issue in the incremental
usage of multimedia in our daily routine. However, unlike physical and analog signals
where quality is effectively determined using traditional signal processing methods, a good
specialized picture quality measurement is needed to comprehend the likely response of a
human viewer.
As recommended by ITU-R Recommendation BT.500-6 [41], images may be assessed
using subjective or objective methods. Subjective methods involve using human subjects to
judge the quality of a picture or image, while objective methods use mathematical
algorithms that correlate well with the human perceptual response. It is obvious that an
automated image quality assessment metric needs to be of an objective nature. A wide
number of objective methods have been proposed and documented; however, many still use
the simple calculation of Mean Square Error (MSE), Peak Signal-to-Noise Ratio (PSNR)
and subjectively correlative parameters such as blurriness, blockiness, noisiness and
jerkiness [42]. However, these monotonic methods seldom correlate well with the response
of the Human Visual System (HVS), which is very complicated and non linear.
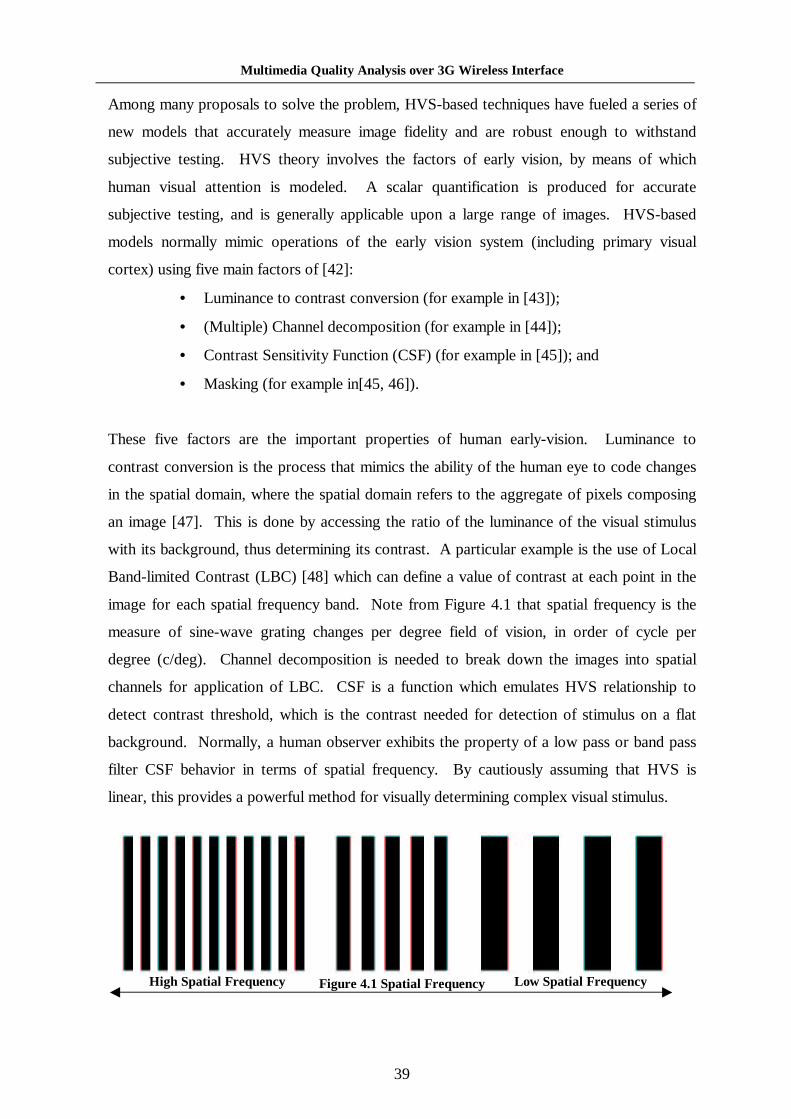
Multimedia Quality Analysis over 3G Wireless Inter face
39
High Spatial Frequency Low Spatial Frequency
Among many proposals to solve the problem, HVS-based techniques have fueled a series of
new models that accurately measure image fidelity and are robust enough to withstand
subjective testing. HVS theory involves the factors of early vision, by means of which
human visual attention is modeled. A scalar quantification is produced for accurate
subjective testing, and is generally applicable upon a large range of images. HVS-based
models normally mimic operations of the early vision system (including primary visual
cortex) using five main factors of [42]:
• Luminance to contrast conversion (for example in [43]);
• (Multiple) Channel decomposition (for example in [44]);
• Contrast Sensitivity Function (CSF) (for example in [45]); and
• Masking (for example in[45, 46]).
These five factors are the important properties of human early-vision. Luminance to
contrast conversion is the process that mimics the ability of the human eye to code changes
in the spatial domain, where the spatial domain refers to the aggregate of pixels composing
an image [47]. This is done by accessing the ratio of the luminance of the visual stimulus
with its background, thus determining its contrast. A particular example is the use of Local
Band-limited Contrast (LBC) [48] which can define a value of contrast at each point in the
image for each spatial frequency band. Note from Figure 4.1 that spatial frequency is the
measure of sine-wave grating changes per degree field of vision, in order of cycle per
degree (c/deg). Channel decomposition is needed to break down the images into spatial
channels for application of LBC. CSF is a function which emulates HVS relationship to
detect contrast threshold, which is the contrast needed for detection of stimulus on a flat
background. Normally, a human observer exhibits the property of a low pass or band pass
filter CSF behavior in terms of spatial frequency. By cautiously assuming that HVS is
linear, this provides a powerful method for visually determining complex visual stimulus.
Figure 4.1 Spatial Frequency
Multimedia Quality Analysis over 3G Wireless Inter face
40
The image quality metric is for measurement of the distortion of the original image relative
to the received/coded images. Quality metric based on HVS techniques measures the
perceptual importance of an image by discounting its psychophysically redundant features.
Please note that beyond this stage, the term “stimulus” is referred to as the distortion of the
received/coded image relative to the original image and the original image is identified
using the term “background”. Masking is the phenomenon where reduction in visibility is
brought about when stimuli are viewed on a non-uniform background, relative to viewing
in a uniform background. This affects the CSF as the masker increases, causing the CSF
threshold to rise. The effect is known as Threshold Elevation (ThE) [49]. Summation is
the weighted inclusion of all the four mentioned components to produce a more complete
HVS model.
Among all perceptual image quality metric with HVS-based fidelity models, two important
factors must be observed:
• Model parameters: Chosen to reflect the viewer visual response to both
complex natural scenes and simple artificial stimuli; and
• Quality rating: It is important for model to convert the visual error map into
a single number for determining overall quality distortion. Therefore, higher
level cognitive factors need to be carefully employed.
Numerous HVS based quality metrics have been proposed. Among the notable models are
those developed by Daly [50]; Karunasekera and Kingsbury [51]; Lubin [52]; Osberger
[42]; Teo and Heeger [53] and Watson [46]. These are summarized briefly below.
Daly proposed the Visible Differences Predictor (VDP) algorithm in [50]. This is a multi-
channel (decomposition) image quality metric for assessing image fidelity. It can be
calibrated for specific viewing characteristics such as viewing distance, pixel spacing etc.
Luminance values of the original and distorted image are pass through a luminance non-
linearity process, followed by a robust CSF. The image is then decomposed into multiple
frequency and orientation sensitive channels and passes into the masking process to adjust
each channel’s visible threshold. A process termed Mutual Masking (MMsk) is then
performed to account for different type of artifact. The resulted differences are compared

Multimedia Quality Analysis over 3G Wireless Inter face
41
to the thresholds to produce a map of visually notable differences, which traces the extent
and location of the errors.
Karunasekera and Kingsbury present a single channel decomposition model in [51] for
detection of image distortion, particularly blocking artifacts. This model is extendable to
include other image distortion artifacts such as ringing and blurring. HVS modeling used
here is based on parameters derived from measurement of subject reaction time to various
clearly visible (suprathreshold) stimuli. Luminance non-linearity and spatial activity
masking stages is also included, followed by determining magnitude of the image artifacts
by averaging errors around artifact edge. Results with good correlation with subjective
rankings have been achieved. However, image quality metrics built using this technique
cannot be applied generally, as the quality grading is highly dependent on types of image
artifact present.
In [52], Lubin presents another multi-channel model, which again calibrates for viewing
characteristics. The raw luminance signal is effectively converted to local contrast in this
model and decomposition into separate spatial frequencies occurs. Orientation selectivity,
contrast sensitivity and spatial masking follow, where the intra-channel masking effect is
simulated using a sigmoid non-linearity. Summation across all channels using a
Minkowski metric is applied following thresholding to produce a visually notable
difference map. A single quality figure is then obtained by summation across the map,
which allows comparison of quality between images. Lubin’s model achieves result with
close correlation with subjective testing.
The model proposed by Osberger in [42] and [54] includes multiple channel contrast
conversion, frequency sensitivity and masking. It also includes the Importance Map (IM)
concept in the model for a more accurate access to quality by identifying the relative
importance of various areas in an image. Osberger uses the IM of an image to scale the
fidelity found to obtain a more complete error assessment. A quality grading is produced to
enable comparison between different results. This model is specifically tuned for natural
images and Osberger presents strong verification testing with favorable result [42] to show
that his system is robust, efficient and accurate.

Multimedia Quality Analysis over 3G Wireless Inter face
42
Teo and Heeger [53] based their model on the response of a cat’s vision system. In their
system the original and distorted images are first decomposed into spatial frequency and
orientation sensitive channels using a linear transform. Contrast masking is then applied
using squaring and normalization. Summing response differences between both images
(over small patches of the images) completes the detection process. Although Teo and
Heeger present a sound system, they did not produce comparison of their results with that
obtained using subjective opinion. Therefore it is difficult to verify the accuracy of this
model.
Watson presents a video quality metric in [46], which can be adapted to process images.
The model first converts image illumination values to local contrast form, where a sequence
of noticeable visual difference is then obtained by dividing the contrast values with spatial
thresholds of respective spatial frequencies. A nett difference sequence is further produced
by subtraction of the two sequences from the two images. Contrast masking is then
applied, followed by Minkowski pooling to sum the result over difference frequency
channels, yielding a summary measurement of visual error.
Osberger’s model stands out among the others listed above, providing techniques that are
both accurate and extendable. Therefore, this model is selected for implementation in this
thesis. The remainder of this chapter covers the two major concepts in Osberger model, the
HVS-based fidelity system and the Importance Map.

Multimedia Quality Analysis over 3G Wireless Inter face
43
4.2 HVS Fidelity System The early vision model proposed by Osberger in [42] and [54] is for assessing both the
fidelity and the quality of natural images, based on the operation of neurons in the primary
visual cortex of the human eye. This Early Vision (EV) model is tuned for natural images
and is of an adaptive and non-linear nature. Figure 4.2 illustrated the EV model (2 images).
Figure 4.2 HVS Ear ly Vision Model [54]
The model accepts the luminance values at the same location of both images then converts
it into band-limited contrast, using a Local Band-limited Contrast (LBC) function. The
function decomposes the contrast into 1-octave bandwidth channels, which are further
decomposed into orientation selective channels (using fan filters). The result and its
difference is then processed using the Contrast Sensitivity Function (CSF) [45],
determining the frequency-dependent threshold of detection. Threshold Elevation (ThE)
models the spatial masking process to raise the detection threshold. Visibility of difference
between the original and distorted image is determined using the new threshold. This
process repeats for each channel at each location by subtracting the original LBC signals
from the coded LBC signals. The method of identifying the visibility difference is by
dividing the individual difference for each channel at each location by the detection
threshold [42].
grasso
This figure is not available online. Please consult the hardcopy thesis available from the QUT library

Multimedia Quality Analysis over 3G Wireless Inter face
44
Minkowski summation is performed across multiple channels to produce a single fidelity
map for indication of the visible distortion locations. This map is the same size as the
original image and is known as the Perceptual Distortion Map (PDM). It indicates the
number of Just Noticeable Differences (JND) [46, 55, 56] of the distorted image that is
above detection threshold. A further Minkowski summation across the PDM space
produces a single number known as the Perceptual Quality Rating (PQR), which is in the
range of 1.0-5.0. PQR is the ranged number produced from PDM to rank the distorted
image and it correlates well with validation tests. Note that a higher number corresponds to
lower distortion, hence higher quality.
Individual factors from channel decomposition to summation are discussed in the section
below.
4.2.1 Channel Decomposition and Band-limited Contrast
The model accepts luminance values as input. Therefore, a set of image gray levels needs
to be converted into luminance using determined parameters from the display device. The
model described here is from [42]. Parameters of importance include viewing distance,
pixel spacing, image dimensions, ambient luminance and display luminance response
(monitor gamma level). The default value in the implemented model should carries the
values that correlate with the physical properties of the equipment used to subjectively
verify the model.
As mentioned before, LBC algorithm [48] is used to decompose the input image luminance
into multiple channels, of which the images are represented as local band-limited contrasts.
Cosine log filters with 1-octave bandwidth are used to implement the spatial frequency
decomposition in LBC. Original image is recoverable via simple addition. The filter has a
1-octave bandwidth and centred at frequency 2k-1 c/deg, with r being the radial spatial
frequency, the expression becomes:
(4.1) ))} ,1(logcos(1{2/1)( 2 −Π−Π+= krrGk
Multimedia Quality Analysis over 3G Wireless Inter face
45
(a) (b)
of which the representation can be seen in Figure 4.3 (a):
Figure 4.3 Filter Structure [42]
(a) Spatial frequency response of cosine log filters (with 1-octave bandwidth) (b) Or ientation response of fan filter with 30degree bandwidth
Fourier transform F(r,θ) is performed upon the image f(x,y) then filtered using a cosine log
filter, producing a band-limited image:
(4.2)
Channel orientation sensitivity is implemented using a fan filter, observe Figure 4.3(b), of
which the equation of the fan filter [50, 57] with orientation is:
(4.3)
note that θtw is the angular transition width and θc(l) is the orientation of the peak fan filter l
as represented by:
(4.4)
Typically, four (using orientation bandwidth 45 degree) or six (30 degree bandwidth) fan
filters are used. This corresponds with the mean bandwidth in the cortical neurons of the
monkey and the cat. To ensure filtering is fully reversible, the θtw or angular transition
width is set to the angular spacing between adjacent fan filters. However, as
implementation of orientation sensitivity (i.e. fan filtering) increases, the computational
).(),(),( rGrfrA kk θθ =
twcl lif
tw
c θθθθθθπ <−+ − |)(|]}cos[1{ )(|
21
=)(θlfan 0.0 otherwise,
2/)1()( πϑθ −−= twc ll
grasso
This figure is not available online. Please consult the hardcopy thesis available from the QUT library

Multimedia Quality Analysis over 3G Wireless Inter face
46
cost increases significantly. Because this does not give much improvement in result
accuracy, it is therefore omitted.
Usually, six frequency channels are used, giving k=1..6. Individual spatial frequency band
Ak(r,θ) is transformed back into the spatial domain using inverse Fourier transform, giving
ak(x,y). Now, the local band limited contrast needs to be calculated as ck(x,y) by [42]:
(4.5)
given that lk(x,y) is the mean local luminance. Given that a0 is the residual low frequency
image, it is calculated by:
(4.6)
4.2.2 Contrast Sensitivity Function
CSF detailed in this model must be appropriate for the visual stimuli in the task of assessing
fidelity and quality of natural images. The spatial extent of the grating patch identifiable by
the CSF must be small (1 cycle) with temporal presentation of l.0 seconds. The question of
lighting level also needs to be considered. Typically, high light levels dim a stable CSF
(typically > 10 cd/m2) while at lower levels it reduces in proportion to the square root of the
luminance (DeVries-Rose law). Given that l is local luminance, CSFbase is the base
threshold for high luminance values [58-61] and l th is the cut-off luminance, which is
consistent with DeVries-Rose law, CSF can be defined as [42]:
(4.7)
4.2.3 Spatial M asking
As mentioned before, contrast of the background and the uncertainty created by the
background are the main factors that influence the amount of masking taking place. This
model uses a threshold elevation process to model spatial masking. Typically, low
,),(
),(),(
yxl
yxayxc
k
kk =
�−
=+=
2
10 ),,(),(),(
k
iik yxayxayxl
thll ≥
,thll <
CSFbase
baseth
CSFl
lCSF(l) =

Multimedia Quality Analysis over 3G Wireless Inter face
47
ε=1.0
Background contrast (Log)
Thr
esho
ld E
leva
tion
(L
og)
uncertainty stimuli exhibit ThE curve with log-log of gradient 0.7 while high uncertainty
(complex) stimuli exhibit gradient of 1.0 [42]. This is as shown in Figure 4.4.
Figure 4.4 Log-Log relation of ThE VS Background Contrast [42]
In short, human viewers tolerate greater error in textured areas (high complexity) than
among edges (low complexity). In this model, the spatial masking effect is emulated by
classifying images into flat, edge and texture regions. Point is classified as flat if local
contrast of the region is below the threshold needed to induce masking (contrast <Cth0). In
contrast, where an orientation is dominant, the point is classified as an edge, while the rest
is classified as being a texture. The ThE is used to implement masking, as stated in page
112 of [42]:
(4.8)
Note that:
• Cthk is the detection threshold, where a masker is present for frequency k
• Cth0k is the base threshold for k (frequency band from CSF)
• Cmk is the contrast of the masker for k
• Use ε = 0.7 for edge and ε = 1.0 for textured.
The masking process for this model is for single frequency band only, not across multiple
channels. Now that masking dynamically changes the detection threshold for scene error
using local scene content, the difference between original and coded images Vk(x,y) is now
represented as in page 113 of [42]:
(4.9)
ε)(0
0kth
mkkth C
CC
Cth0k If Cmk < Cth0k,
otherwise Cthk =
),(
),(),(),(
'
yxC
yxcyxcyxV
thk
kkk
−=
grasso
grasso
grasso
This figure is not available online. Please consult the hardcopy thesis available from the QUT library

Multimedia Quality Analysis over 3G Wireless Inter face
48
Note that ck is the original image contrast while ),(' yxck is the coded image contrast. It
goes without saying that when Vk(x,y) = 1.0, the difference is equal to the threshold of
detection.
4.2.4 Summation
After division of the error signal by detection threshold in each channel and location, the
visible distortion is spread in a multi-resolution way. A single map is needed to effectively
show the visibility of distortion, where summation across different channels is needed.
Minkowski summation is used across different channels to produce the Perceptual
Distortion Map (PDM) where the error at each point is effectively represented. The
location and magnitude of visible distortion is clearly visible, representing the image
fidelity. The PDM equation is shown below, where β1 is the probability summation
exponent with a typical value of 4.0, as in page 114 of [42].
(4.10)
A single number to present the overall picture quality is required for ease of comparison.
Minkowski summation is again used for summation of N pixels PDM to produce a fidelity
to quality conversion. The Quality rating is termed Perceptual Quality Rating (PQR) and is
calculated as in page 114 of [42]:
(4.11)
Note that β2 = 1.0 gives the quality that is proportional to the error average over the entire
image, while β2 = 3.0 gives the most accurate result according to page 114 of [42]. To
scale it into a range of 1.0-5.0 for ease of referencing, the following equation is used with p
= 0.8:
(4.12)
11 /1)),((),( ββ�= k
k yxVyxPDM
22 /1)),(1
( ββ�= N
yxPDMN
PQR
PQRpPQR
⋅+=− 1
551

Multimedia Quality Analysis over 3G Wireless Inter face
49
This ends the section on the HVS-based fidelity system for determining distortion across
two images. The next section focuses on the Importance Map concept for identification of
the spread of the importance area across an image.
4.3 Importance Map System
The Importance Map (IM) technique used in this thesis is outlined in both [62] and [54]. It
is a region-based attention model, with its main approach based upon combining multiple
feature maps into an overall map that grades attention. The approach is to first segment the
image into homogeneous regions, then derive a series of intermediate feature maps using
factors known to influence visual attention [63]. Next, these maps are fused together with
individual weighting upon each feature map to generate an overall IM.
Factors that influence attention can be either regional based properties like size and shape,
or object oriented based properties like contrast and texture. The success of generating IM
depends on the image segmentation, which is an active research area of its own. In this
model, a recursive split and merge technique is used, as it is efficient as well as low in
computational cost. The recursive split and merge technique is based upon local region
variance. Split process is performed via comparison of an image block's variance to the
split variance threshold. While exceeding the threshold, the block is divided into four sub-
blocks, and recursively splitting the individual sub-blocks until the blocks either satisfy
split criteria or the block size is smaller than the pre-determined minimum (e.g. 1 pixel).
Upon completion of the splitting process, the result is then merged. Adjacent regions are
merged into a single region if the merged region has a lower variance than the merge
variance threshold. The minimum region size threshold is set at 16 pixels to avoid
accumulation of regions that are too small. Both the split variance threshold and the
merged variance threshold are recommended to be 250 to provide good results for most
natural scenes [42].
Multimedia Quality Analysis over 3G Wireless Inter face
50
Figure 4.5 describes the overall process of the IM processing proposed by [62] and [54].
Figure 4.5 IM Processing [64]
As shown, the segmented area is analyzed by different factors that influences attention, the
area of interest as shown below [54, 62]:
• Contrast of region with its surroundings: Area with high contrast relative to local
surrounding regions is a strong visual attractor. This is due to the behavior of the
human eyes, converting luminance to contrast at the early stage of processing, as
described in a previous section.
• Size of the region: larger regions are stronger visual attractors, relative to smaller
regions. However, there is a saturation point.
• Shape of the region: unusual (e.g. multiple corners and angle) or long and thin
shapes are attractors of attention, over smooth and homogenous region.
• Location of region: the region around the centre is stronger, and so attracts more
visual attention.
• Foreground/Background region: the foreground region is a stronger visual attractor
than the background region.
• Others: Color, skin tone etc…
grasso
grasso
This figure is not available online. Please consult the hardcopy thesis available from the QUT library
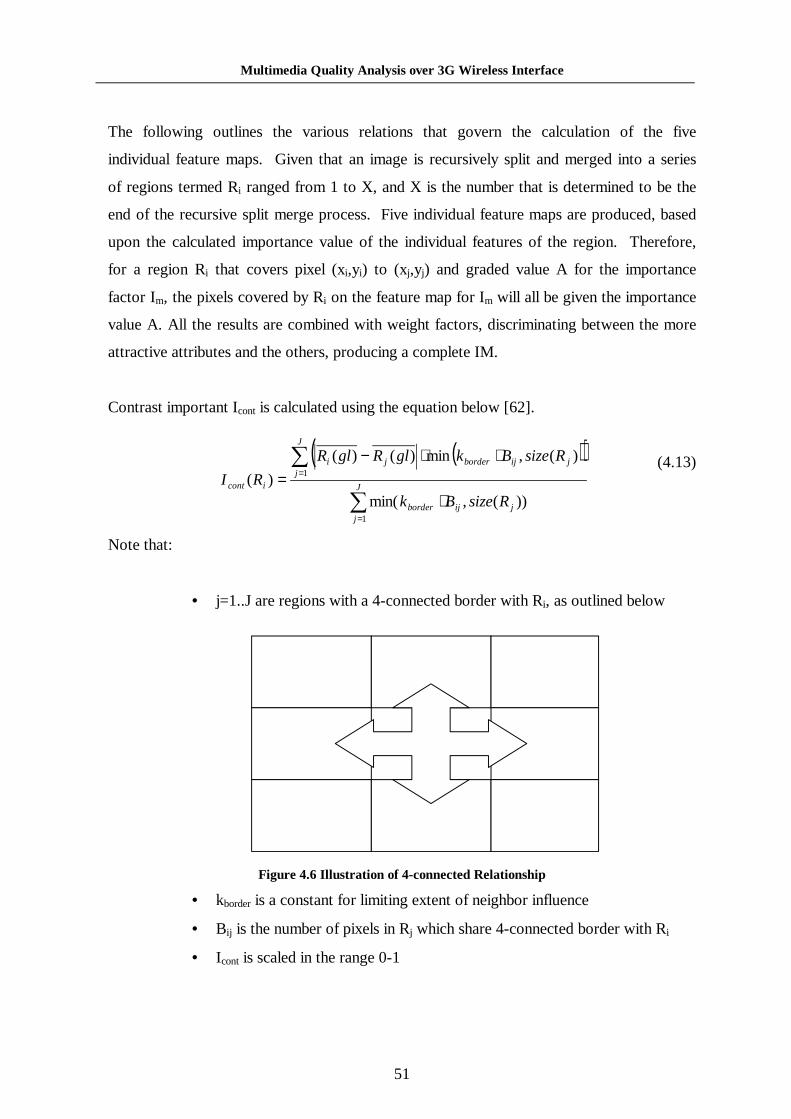
Multimedia Quality Analysis over 3G Wireless Inter face
51
Rj
Rj
Rj
Rj
Ri
The following outlines the various relations that govern the calculation of the five
individual feature maps. Given that an image is recursively split and merged into a series
of regions termed Ri ranged from 1 to X, and X is the number that is determined to be the
end of the recursive split merge process. Five individual feature maps are produced, based
upon the calculated importance value of the individual features of the region. Therefore,
for a region Ri that covers pixel (xi,yi) to (xj,yj) and graded value A for the importance
factor Im, the pixels covered by Ri on the feature map for Im will all be given the importance
value A. All the results are combined with weight factors, discriminating between the more
attractive attributes and the others, producing a complete IM.
Contrast important Icont is calculated using the equation below [62].
(4.13)
Note that:
• j=1..J are regions with a 4-connected border with Ri, as outlined below
Figure 4.6 I llustration of 4-connected Relationship
• kborder is a constant for limiting extent of neighbor influence
• Bij is the number of pixels in Rj which share 4-connected border with Ri
• Icont is scaled in the range 0-1
( )( )�
�
=
=
⋅
⋅⋅−=
J
jjijborder
J
jjijborderji
icont
RsizeBk
RsizeBkglRglR
RI
1
1
))(,min(
)(,min)()(
)(
Multimedia Quality Analysis over 3G Wireless Inter face
52
Ratio of Size of Region Ri to size of image
Size importance Isize is calculated based upon the size of the region, as given in Figure 4.6
[62]. The Isize value is calculated based on the size of Ri using the relationship of:
• Isize(Ri) = 0 if size(Ri) ≤ thsize1;
• Isize(Ri) = 12
1
sizesize thth − if thsize1 < size(Ri) ≤ thsize2;
• Isize(Ri) = 1 if thsize2 < size(Ri) ≤ thsize3;
• Isize(Ri) = 1 - 34
1
sizesize thth − if thsize3 < size(Ri) ≤ thsize4; and
• Isize(Ri) = 0 if size(Ri) > thsize4.
Note that the threshold is selected as thsize1 = 0, thsize2 = 0.01 thsize3 = 0.05 and thsize4 = 0.50.
Figure 4.7 I size Calculation [62]
Important of region shape Ishape is calculated as below [62]:
(4.14)
Note that:
• bp(Ri) is the number of pixels in Ri that shares a 4-connected border relation with
another region
• powshape is a factor used for increasing size-invariance of Ishape
• kshape is a scaling constant (adaptive) for reducing shape importance for regions with
many neighbors
• Ishape is scaled to range 0-1
( ))(
)(
i
powi
shapeishape Rsize
RbpkRI
shape
⋅=
grasso
grasso
This figure is not available online. Please consult the hardcopy thesis available from the QUT library

Multimedia Quality Analysis over 3G Wireless Inter face
53
Importance of region location is calculated using the equation below [54]:
(4.15)
Note that:
• numpix(Riz) is the number of pixels in region Ri that locates in zone z
• wz are the zone weightings as shown below:
Figure 4.8 Location zones weightings [62]
The foreground/background region importance is based on the assumption that fore-ground
objects do not locate on the borders of the scene. Regions are assigned to be in the
foreground or the background by considering the number of pixel the region has on the
frame border. High frame border pixel count distinguishes the region to be in the
background and vice versa. The generalized equation used is shown below [62]:
(4.16)
Note that:
• borderpix(Ri) is the number of pixels in Ri that are also on the edge of the frame
)(
)()(
4
1
i
zizz
ilocation Rsize
RnumpixwRI
�=
⋅=
)0.1,))(),(min(3.0
)(min(1
riixperimeterpframeborderpix
RborderpixI i
FGBG ⋅−=
grasso
This figure is not available online. Please consult the hardcopy thesis available from the QUT library

Multimedia Quality Analysis over 3G Wireless Inter face
54
• perimeterpix(Ri) is the number of pixel in Ri, which shares a 4-connected border
with another region.
To produce an overall IM, the various factors for the various regions must be effectively
added together, using the following equation [62]:
(4.17)
Note that:
• f is a particular importance feature;
• wf is the feature weight, which is assigned as the following for maximum
effectiveness:
��Location: 0.270,
��Foreground/background: 0.246,
��Shape: 0.182,
��Contrast: 0.169, and
��Size: 0.133;
• poww is the feature weighting exponent for control relative impact of wf of which in
this thesis it is taken as 1 for all features;
• powerf is the IM weighting exponent, which is also taken as 1 for all features in this
thesis’s implementation; and
• Furthermore, the highest importance region is scaled to have a value of 1.0.
This ends the section on Importance Maps and thus concludes the section on HVS-based
image quality metrics. This Chapter has run through the concepts used for implementing
the image quality metric chosen for use in the system. The following chapters describe the
implementation of the entire 3G multimedia software test bed, as stated in the introduction.
The information on HVS-based system is visited again in a later section describing its
implementation. The next chapter identifies the methodology used in the design of the
software test bed.
�=
⋅=5
1
))(()(f
powif
powfispatial
fw RIwRI
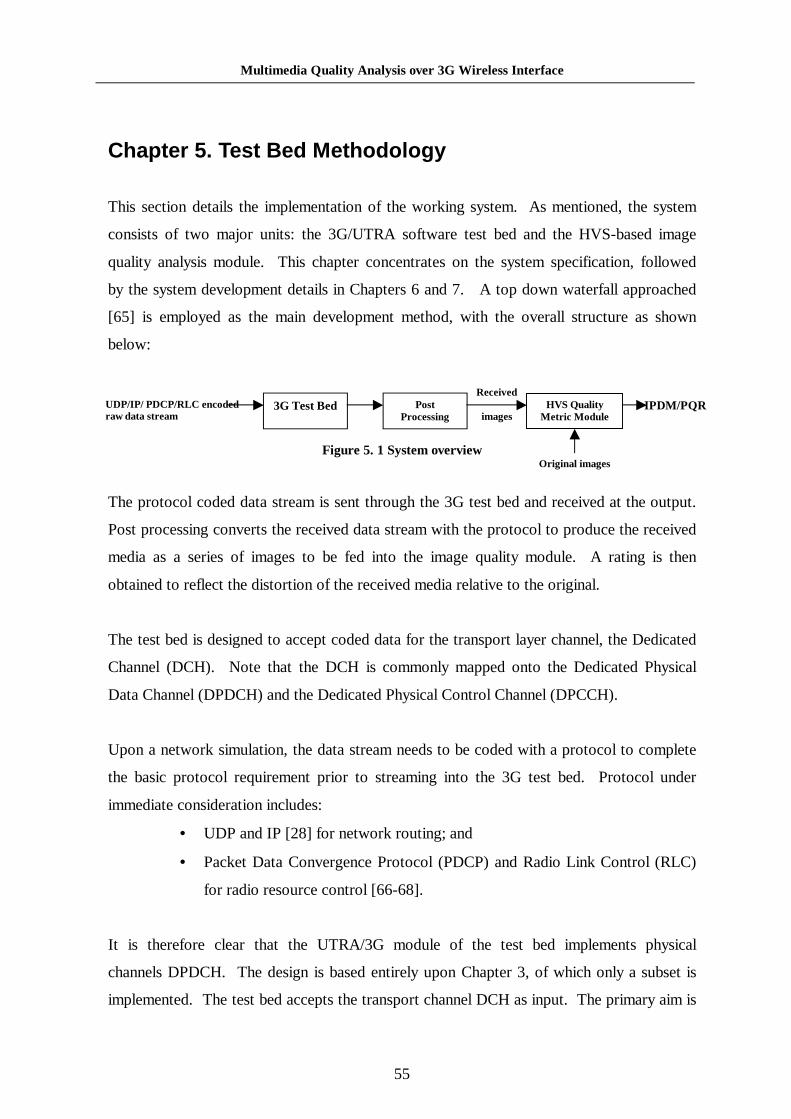
Multimedia Quality Analysis over 3G Wireless Inter face
55
Received
images 3G Test Bed HVS Quality
M etr ic M odule UDP/IP/ PDCP/RLC encoded raw data stream
IPDM/PQR Post Processing
Or iginal images
Chapter 5. Test Bed Methodology
This section details the implementation of the working system. As mentioned, the system
consists of two major units: the 3G/UTRA software test bed and the HVS-based image
quality analysis module. This chapter concentrates on the system specification, followed
by the system development details in Chapters 6 and 7. A top down waterfall approached
[65] is employed as the main development method, with the overall structure as shown
below:
Figure 5. 1 System overview
The protocol coded data stream is sent through the 3G test bed and received at the output.
Post processing converts the received data stream with the protocol to produce the received
media as a series of images to be fed into the image quality module. A rating is then
obtained to reflect the distortion of the received media relative to the original.
The test bed is designed to accept coded data for the transport layer channel, the Dedicated
Channel (DCH). Note that the DCH is commonly mapped onto the Dedicated Physical
Data Channel (DPDCH) and the Dedicated Physical Control Channel (DPCCH).
Upon a network simulation, the data stream needs to be coded with a protocol to complete
the basic protocol requirement prior to streaming into the 3G test bed. Protocol under
immediate consideration includes:
• UDP and IP [28] for network routing; and
• Packet Data Convergence Protocol (PDCP) and Radio Link Control (RLC)
for radio resource control [66-68].
It is therefore clear that the UTRA/3G module of the test bed implements physical
channels DPDCH. The design is based entirely upon Chapter 3, of which only a subset is
implemented. The test bed accepts the transport channel DCH as input. The primary aim is
grasso
Multimedia Quality Analysis over 3G Wireless Inter face
56
to implement a single channel FDD downlink user channel, with variable channel
conditions that can be controlled to reflect different situations which the physical signal can
be exposed to. Some basic environmental parameters include speed and signal arriving
angles, which are presented in the next section. Furthermore, the information/data rate and
physical traffic rate, together with other variables, are also available for selection. Two
models of the 3G test bed are implemented, with one using a variable rate downlink and the
other using a fixed rate downlink. The model presented in this thesis uses a variable rate
downlink, as time and resources allow only effective presentation of a single model.
HVS-based quality metric is implemented using the design stated in Chapter 7 by molding
the HVS-based fidelity system together with the IM system, of which design details are
stated in Chapter 4. An implementation of this quality metric is currently limited to
processing Portable Gray Map (PGM) files. Adaptation to process color images is feasible.
Post-processing is the process of extracting transmitted media into the form able to be
processed by the HVS-based quality metric. In this case, the accepted format is a series of
PGM files or, in a later implementation, PPM files for color images.
The system structure module is developed in a module format for ease of structural and
functional expansion and maintenance. Objectively collected functionality has controlled
the natural breakdown of functions to be grouped into the 3G test bed, image quality metric
and post-processing module, as mentioned. The purpose of the 3G test bed and image
quality metric differs greatly, and although strong cohesiveness is built into the system, it is
logical to develop the test bed and quality metric separately, using tools more suitable for
telecommunication and image processing, respectively. These two modules are the
common part of this system, where, at its minimum, it allows the system to serve as a
simple 3G test bed for the testing of raw images.
This system is designed to be flexible and versatile, to dynamically fulfill the user’s
requirements, as controlled by the post-processing module. An example of this is use of
the system to perform an efficiency test for a new multimedia application protection
protocol. In the case where the input into the system is the transport level coded signal of
the said media, post-processing is required to extract a series of images from the received
data to be fed into the image quality metric. The system then produces a HVS oriented

Multimedia Quality Analysis over 3G Wireless Inter face
57
quality evaluation on the received images, providing a guide for improving the tested
protection protocol.
This chapter concerns mainly system methodology and functional specification. Chapters 6
and 7 further extend the general functional model presented here by bringing in domain
specific design architectures. The 3G test bed module is presented in an object oriented
manner, dividing up individual functional modules for detailed analysis, progressing using
a general data flow direction. The image quality metric module is presented as an
integration of the HVS fidelity module and the Importance Map module, illustrating the
relationship between the two modules and the method used to integrate them. The
development method of this module is different from the 3G test bed, where the
architecture is generally functionally-based and is not objectively grouped. To effectively
present this module, a functional flow model has been employed, describing the model by
stepping through all the individual processes involved in data processing.
Following an explanation of the purpose of the individual functional modules, the
remainder of this chapter presents brief specifications of the individual modules, and a brief
discussion of the approach taken and validation tactics used for the system.
5.1 3G/UMTS Test Bed Methodology
The 3G/UMTS test bed aims to emulate the processing of DCH data into a physical layer
signal (transmission), and the 3G physical channel condition and processing of the physical
layer signal back into DCH data (receiving). Transmission and receiving processing is
implemented directly from the specifications in Chapter 3, following UMTS multiplexing,
channel coding, spreading and modulation outlines, as described. The physical channel
condition is modeled to reflect the distortion experienced by the physical signal in a
channel subject to multi-path fading effect, Doppler effect [69], channel delay and
impregnated with Additive White Gaussian Noise [70] (AWGN).
This test bed models the actual process in 3G physical layer signal transmission, including
transforming the transport layer data into a physical signal (transmitting) and processing the
physical signal into transport layer data (receiving). The purpose of using this physically
Multimedia Quality Analysis over 3G Wireless Inter face
58
precise model rather than a compact mathematical model that would statistically corrupt the
data stream, is to enable closer approximation of the conditions the data stream is likely to
be subjected to. Hence, this provides a more accurate and far more useful approach,
allowing the system to be used in multiple applications, even those that require delicate
modeling of the 3G physical layer functional processes (e.g. complex multimedia downlink
applications).
The implementation of this module is a complex process, of which the selection of effective
development tools and deployment platform is an important issue. Versatility should be
preserved, allowing deployment of the 3G test bed onto both Linux and Windows-based
PCs with minimal effort. Therefore, the development tools chosen should laterally use the
translation language concept, with the language interpretation virtual machine available in
both Linux and Windows platforms.
An in-depth search was carried out for possible tools, with the candidate being immediately
narrowed down subjectively with the availability of resources to host them. The likely
options include Ericsson’s RedWine package [71], Matlab [72], Matlab Communication
Blockset [72], OPNET [73], Agilent’s Advance Development System (ADS) 2001 or direct
development using C/C++. Red Wine is a private system used by Ericsson that is not
within the author’s access. Developing the test bed using C/C++ or Matlab using code
written purely by the author will consume a large amount of time, not to mention the large
amount of complicated testing that would need to be performed on every piece of code
before the system could be validated. The likely candidate was narrowed down to Matlab
Communication Blocksets, OPNET and ADS.
Each of the three remaining tools has been carefully tested for suitability. Matlab
Communication Blocksets proved to be versatile, but lacked a large number of 3G
functionalities, crippling its usefulness. OPNET has proved to be useful, providing the
ability to simulate low-level 3G activities while also considering network level traffic
management. However, the internal workings of OPNET are off-limits to the user, causing
extreme difficulty in input and output of data for the system developed. Finally, the test
bed implemented uses Agilent's ADS 2001, where selection was based largely on its
versatile nature for telecommunications data processing system development. It consists of
multiple 3G components, based upon UTRA, but ADS too experienced a large number of

Multimedia Quality Analysis over 3G Wireless Inter face
59
input/output interfacing problems but these have been overcame. A large number of basic
3G functional components have been implemented, allowing the user to concentrate on
developing the infrastructure of the system. Although the available basic components from
ADS 2001 are at times inflexible, this package remains the most suitable developing
environment used by the author to date.
The implementation process logically follows the specification in Chapter 3. The basic
structure is collectively explained in correspondence to the four major functional processes
of multiplexing, channel coding, spreading and modulation, as mentioned before.
Additional consideration has been given to modeling the effect of transmission of multiple
user signals and physical channel loses. These are presented in detail in Chapter 8.
Post-processing is primarily responsible for extracting a series of images from the received
media. This process includes extracting the coded multimedia data from the received
protocol coded data stream, followed by recovering the impaired data into the form closest
to the original as possible. Next, extraction of image inputs to be fed into the image quality
metrics is done with a dynamic process, which depends on the media type being tested. For
example, if the media being tested is a JPEG image, the post-processing module is
responsible for extracting an image of acceptable form for the metric. However, if the
media handed is a MPEG stream, a series of images will be extracted and serialized for
input into the metric.
Development of the 3G test bed module is among the most complex in this system. As
shown, the methodology behind this module involves the implementation of the published
3G standards using an incremental developing software engineering model. The purpose
and requirements of this module have been justified, including the role of the post-
processing module. The next section continues with methodology of the image quality
metric.

Multimedia Quality Analysis over 3G Wireless Inter face
60
5.2 Image Quality Metric Methodology
The image quality metric in this system is used to provide an effective quality analysis
indicator for the visible portion of the tested media. For image quality, it is one thing to say
that the image has been corrupted using a subjective rating, but another to provide a valid
metrical evaluation system that provides quality, with results correlating to relative grading
by human subjects. As previously mentioned, objective methods like MSE and PSNR can
be used to provide numbers for measurement of quality; however, these seldom correspond
well to the grading provided by human subjects. This module combines the two major
human vision emulation techniques described in Chapter 4 to provide a complete HVS-
based image quality metric that is capable of providing quantitative measurements of
quality degradation that are correlative to human subject ratings. Data obtained in this
manner are not only comparative but they also reflect more accurate detection of image
quality degradation as the behavior of the HVS is taken into account. Therefore, the image
quality metric is integrated into the overall system to further extend the versatile nature of
the system, allowing effective testing for degradation in multimedia quality.
The development model chosen for this module is a top down functional-based model,
where the functions are grouped together according to their logical relations. Chapter 7
presents the implementation of the HVS-based fidelity sub-module and Importance Map
(IM) sub-module with specifications outlined in Chapter 4, followed by overall integration
of the two modules into the image quality metric. The merging enhances the result from
the HVS-based fidelity sub-module using the IM sub-module, giving a more accurate HVS-
based quality rating.
The two sub-modules are implemented separately and integrated together, with the HVS-
based fidelity sub-module being implemented using Matlab, and the IM sub-module using
C. This is the case, as the base code available for the author to use was originally in those
formats, and this will be addressed in detail later. The first sub-module is functional-based,
in reference to the development model chosen. The basic processes are built in a bottom up
fashion with the logical grouping of small processes into repetitively used functions. The
second sub-module is slightly more compact, due to the strong cohesive nature of the
Multimedia Quality Analysis over 3G Wireless Inter face
61
processes involved. This module is implemented largely as a single function to yield
stronger efficiency. Following presentation of the details of the implementation method,
testing and verification approaches are shown in the next section.
5.3 System Testing and Validation Strategy
The system was tested using a black box testing strategy overall, as it is too complex to be
fully tested function by function in a functional verification manner. Various functionality
tests were performed during the building of the system but these tests are not presented as
they do not enhance the purpose of this thesis which is to effectively present a system that
addresses the objective stated in the introduction. Modules are tested individually for
behavior to consolidate the specification outlined in relevant chapters. Upon satisfactory
completion of the individual modules, overall system testing will be carried out on the
intergradations of every modules, by subjecting the overall system to a continuous test run.
During individual testing, the 3G test bed module, the HVS fidelity module (commonly
known as the HVS module) and the IM module will be tested. The 3G test bed module
takes various images as input, while varying various adjustable parameters within the
module that are significant (e.g. velocity, channel condition etc.).
The HVS module will take various images and their impaired images to test for fidelity of
the damaged area. The IM module will take various images and constructs a series of IM
based upon the single influencing factors and also the summation of all the influencing
factors. Overall system testing will take the same path as the testing of the 3G test bed
module. However, it will produce quality ratings, related fidelity map and IM map.
Testing and presentation in this thesis is limited to proving the feasibility and workability of
the entire system. Therefore, no protocols (i.e. RLC, PDCP etc.) are implemented. Raw
PGM files are processed by the system to produce individual modules and overall system
result for presentation in Chapters 8 and 9.

Multimedia Quality Analysis over 3G Wireless Inter face
62
This chapter has presented the system methodology, together with the infrastructure of the
individual modules. All modules and infrastructure have been justified, followed by an
explanation of the development strategy used. The testing and validation technique is also
presented. The next two sections follow by presenting and outlining the progress and
design prospective used in the implementation of the two main modules.

Multimedia Quality Analysis over 3G Wireless Inter face
63
UMTS MAC layer Data
UMTS MAC layer Data
UTRA Transmitter
W-CDMA Physical Channel
UTRA Receiver
Chapter 6. ADS Implementation
Figure 6.1 UTRA Block Diagram
The system implements a single user downlink channel as shown above, which includes the
Base Station (BS) source, 3G traffic channel and the User Equipment (UE) receiver. The
basic physical channel Dedicated Physical Data Channel (DPDCH) is implemented to carry
the transport channel Dedicated Channel (DCH), while assuming that the input into the
system is readily coded DCH data. For an all-IP network enhanced UMTS, a DCH data
stream should basically be the actual raw data being coded into UDP/IP [28] subsequently
with header by Packet Data Convergence Protocol (PDCP) and BS’s Radio Link Control
(RLC).
System implementation is done via the 3G/UMTS component library and a strategic
modification to the major components. The structural portions of the test bed design are
carried out with some components being omitted (e.g. RLC). A major problem with
implementing the test bed is due to ADS's lacking in I/O interface. This hurdle was
overcame by using the MATLAB server interface. The input streams are placed in a binary
file, to be read by ADS via the Matlab server interface, while the output is handled in the
same fashion. The sub-images shown are the internal modified parts of the source
components, for reading the input stream fusing Matlab server. The system default model
set DPCH at 960 kbps and effective information data rate of 256 kbps. Simulation is non
real time, and begins with a long setup time, where simulation of 30 data frames (1kb) takes
around 11 minutes on a CPU with AMD 1800 XP processor and 256 MB RAM.
The following sections present the three major schematics of the implementation. Note that
the diagrams in these sections are enlisted from [74]. Section 6.1 is the main schematics
implementation for the test bed and is constructed using functional components provided by
ADS with some modifications. The roles and functionalities of these individual

Multimedia Quality Analysis over 3G Wireless Inter face
64
components are described in section 6.1. Section 6.2 and 6.3 provide further details into
two major components used by the author to construct the main schematics. These
schematics for the two major components were originally provided by ADS but were
modified by the author by adding several special purpose additional modules. This
modification was done using existing functional components provided by ADS. Note that
ADS is a component based developing environment, with similar construction methods
used in Visual Basic and Matlab Blockset: however, it contains more constraints and most
basic components are not modifiable.

Multimedia Quality Analysis over 3G Wireless Inter face
65
76.1 ADS Implementation Main Design Schematics
Figure 6.2 ADS Main Schematic Overview

Multimedia Quality Analysis over 3G Wireless Inter face
66
����������� ��������� �
��
������������� ����� !"#�� "$�%"$�%�
�#��
����
� ��
��� $!
����&�� �'(��
�)*�+��������� ���%
�+��������� ���%
)��)�+��������� ���%
�)�+��������� ���%
� �(����,��-�*�-�.�%
�/�)01�+213���)�+�4!%5�3��2�6�26�)�!
�� ����������7��
22*��%(�
����213��*���� $!�5�3�
%�%%�%����%%%�%%%%�%�
��� �
�' ���� �����
2���.
��-� �'�3'�
Figure 6.2 illustrates the main schematics of the UTRA/3G test bed module
implementation. As shown, a single user downlink channel is implemented with a single
Base Station (BS) variable rate source, a 3G physical channel module and a User
Equipment (UE) variable rate receiver. The main variables are controlled using DF and
variable array as listed in the top left hand corner of the schematic. The physical layer
signal data are output from the BS source, then modulated and handed to the up-converter
Radio Frequency (RF) transmitter. The radio signal is then passed through the 3G physical
channel before being received via the down-converter RF receiver and handed to the UE
receiver. The receiver then processes the incoming signal back to transport layer Dedicated
Channel (DCH) signal and handed to the Matlab server for recording. The following lists
the major components.
Figure 6.3 BS Var iable Rate Source
Figure 6.3 shows the variable rate source that can provide a variable information signal rate
range from 8 to 512 kbps for downlink. The transport channel interface for the data part of
the Dedicated Channel (DCH) is provided on the physical channel being implemented here.
The transport interface is hereby implemented as a Matlab server interface and this is
discussed further in a later section. Channel coding, transport channel multiplexing,
physical channel mapping, spreading and scrambling operations are also included for
DPDCH and common control channels. The control channel includes a Primary Common

Multimedia Quality Analysis over 3G Wireless Inter face
67
Control Channel (PCCPCH), Primary Synchronization Channel (P-SCH), Secondary
Synchronization (S-SCH), and Common Pilot Channel (CPICH). An orthogonal channel is
also included which simulates up to 4 users in orthogonal code channels.
Both the Transmission Time Interval (TTI) and downlink physical channel rate are
controllable. SF1-SF4 controls the spreading factor for the 4 user orthogonal channels.
This component implements the simulation of base station physical traffic. It covers the
procedure in Figure 3.1 (CRC Attachment to Scrambling code) and the internal details are
covered later.
Figure 6.4 UE Var iable Rate Receiver
Figure 6.4 show the UE variable rate receiver, with comparable information rate and related
parameters with the BS variable rate source. For receiving the downlink channel signal,
this component includes the rake receiver, spreading code and scrambling code generation,
transport channel de-multiplexing, channel decoding and Bit Error Rate (BER)
measurement. The component parameters should be the same as the BS source. Signal
sample rate and arriving path as well as maximum anticipated delay is selectable. This
component reverses the process applied in the previous component and the internal details
of this component are described in later sections.
��������&8��� ��������������9�
�6
�#��
����
� ��
��� $!
8�����0�-�*��� 3�������
�� �0�� ���5:� -
��.����1�#%
)��0�'(��
�(3�������6
� �( ����,��-�*�-�.�%
�/�)01�+213���)�+�4!%5�3��2�6�26�)�!
22*��%(�
����213��*���� $!�5�3�
����
&8
�� ���������
2���.
��;����
��-� �'�3'�
�)�+����

Multimedia Quality Analysis over 3G Wireless Inter face
68
���������+��-��
� �
� �9��,��,�����$�%"#$�%"�$�%"<�$�%"<#$�%"<�$�%�
�������3����%�%�$
��������'(�� ��
���%%
�������1��%�%
�(3�������#
�0�3������6#%%%%
�� �� ����� �=��+>
�0�������-���)�-��� ���"�
��� �
�+��-��
���
,�����"���� �=��0>
�2�( 3�< ����$
���� �=� �#%
*��� �= ��4%
*��� �=���%%%
����� �/��,�0��!
2���3�$� %?1(2�( �
�0�3��3� ����� $!%
� �( ��'(���!%
1(2�( ��2���3?�( 3����3� ��0�3
2��3�,�����%@A�6#%%%%?�( 3����3� ��0�3?# B
2���3��%@A�6#%%%%?�( 3����3� ��0�3?# B
�'( �������
���� �=��+>� ��#
�(3����3� ��0�3�6
8=���
� �
� � �
� � � - �� � 5� � � � , � � � � 3 � � � � � - �� � 5
� 0 � - ' �� 2 13 � � � �' �� � / � � 3
� ' � � � � �� � ( � � ' ( �
� � ;� ' � � � � - � � � # $ ! �
� � ;� ' � � 2 � ( � � � 3 � � � ( � � ' ( <� "�� �
� � ;� ' � � 2 � ( � � � � � % "�� �
� � ;� ' � � � ' ( � � � � � 3 � � � ( � � ' ( <�
� � ;� ' � � � ' ( � � � � � � � %
Figure 6.5 shows the 3G Physical Channel Model used in this simulation schematic. This
component implements the AWGN and Multi-path channel in Figure 3.1 Six types of
channel model are available, with varying delay, power and Doppler spectrum of the
channel path.
Figure 6.5 3G Physical Channel Model
The available channel model includes Indoor A, Indoor B, Pedestrian A, Pedestrian B,
Vehicular A and Vehicular B. Special note must be taken that the carrier frequency must
be synchronized between BS source and UE receiver. This component simulates a multi-
path fading channel based on a tapped-delay line model. Varying delay is simulated using
a delay component, power distribution simulated using the power amplifier while the
Doppler spectrum is simulated using phase shifter and Jakes model. Antenna array is also
considered, with the multi-path signal being summed and coupled prior to placing to output.
The arriving angle detailed the arriving angle in degrees for each incoming path [74]. Note
that the indoor environment uses a flat Doppler spectrum and the others use a classic
Doppler spectrum. This component is replaceable with a customized user model using
Matlab, with example models in [7], [8] and [5].
Figure 6.6 Main Schematic Parameters
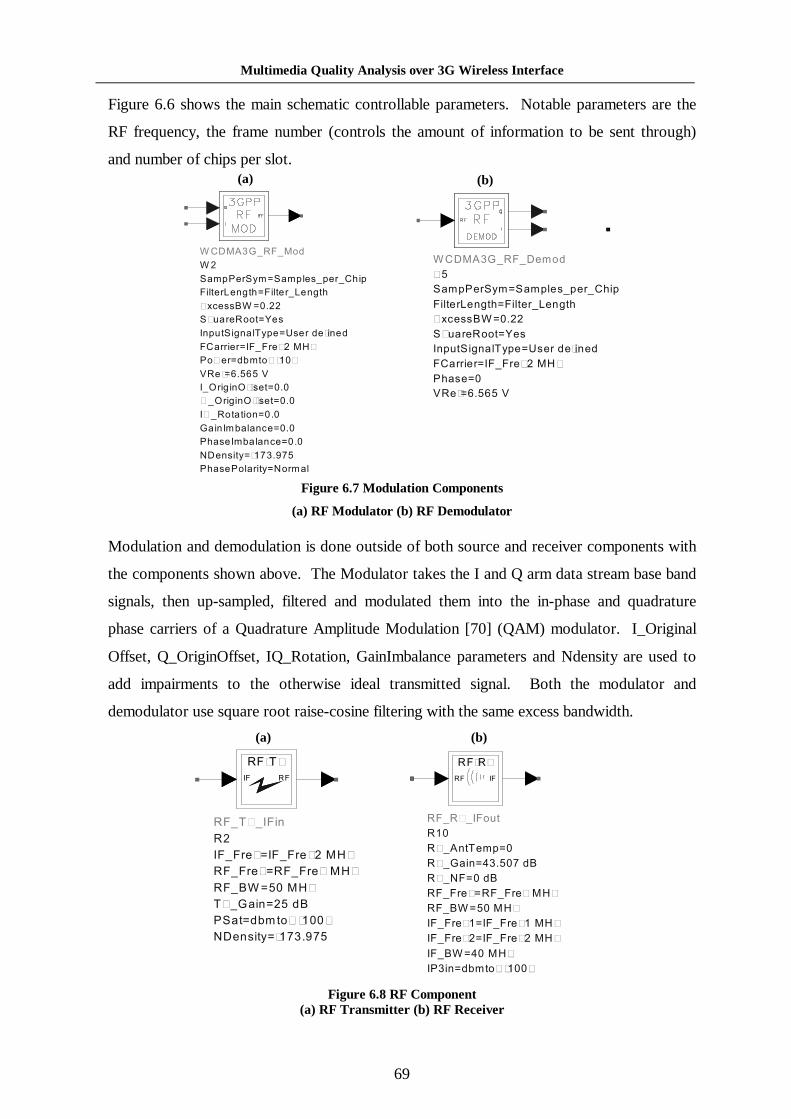
Multimedia Quality Analysis over 3G Wireless Inter face
69
���2C�*���
�
*��� �=�*��� �= "�+>
���� �=����� �="�+>
�����$%"�+>
2C������ $"-
)���-�( ��:A�%%B
�������1�<����4�$
��*�
��<2C
����C�*��'�
��%
*)����-�( ��:A�%%B
*����#%"�+>
*��� �= �*��� �= "�+>
*��� �=��*��� �=�"�+>
�����$%"�+>
���� �=����� �="�+>
�C����%"-
�C������#��$%�"-
�C����2�(3�%
*���
��<�C
(a) (b)
Figure 6.6 shows the main schematic controllable parameters. Notable parameters are the
RF frequency, the frame number (controls the amount of information to be sent through)
and number of chips per slot.
Figure 6.7 Modulation Components (a) RF Modulator (b) RF Demodulator
Modulation and demodulation is done outside of both source and receiver components with
the components shown above. The Modulator takes the I and Q arm data stream base band
signals, then up-sampled, filtered and modulated them into the in-phase and quadrature
phase carriers of a Quadrature Amplitude Modulation [70] (QAM) modulator. I_Original
Offset, Q_OriginOffset, IQ_Rotation, GainImbalance parameters and Ndensity are used to
add impairments to the otherwise ideal transmitted signal. Both the modulator and
demodulator use square root raise-cosine filtering with the same excess bandwidth.
Figure 6.8 RF Component (a) RF Transmitter (b) RF Receiver
�������������(�-
C$
�(3)� 1(��(3����3� ��0�3
����� /��,�0������ �/��,�0
8.������%�
='� ������7��
*�3'��,���213��&�� "-�;���-
��� �� �*��� �= "�+>
)0����%
���;�!�$!$"�
�������������-
�
)0���)��� ��1��� ( ��
�������1�<����4�$
)0���*(��������%�%
����*( ��������%�%
*D����������%�%
D�� �,���;;����%�%
*�� �,���;;����%�%
���;�!�$!$"�
)�:� �-�( ��:A�%B
��� �� �*��� �= "�+>
*�3'��,���213��&�� "-�;���-
='� ������7��
8.������%�
����� /��,�0������ �/��,�0
�(3)� 1(��(3����3� ��0�3
(a) (b)
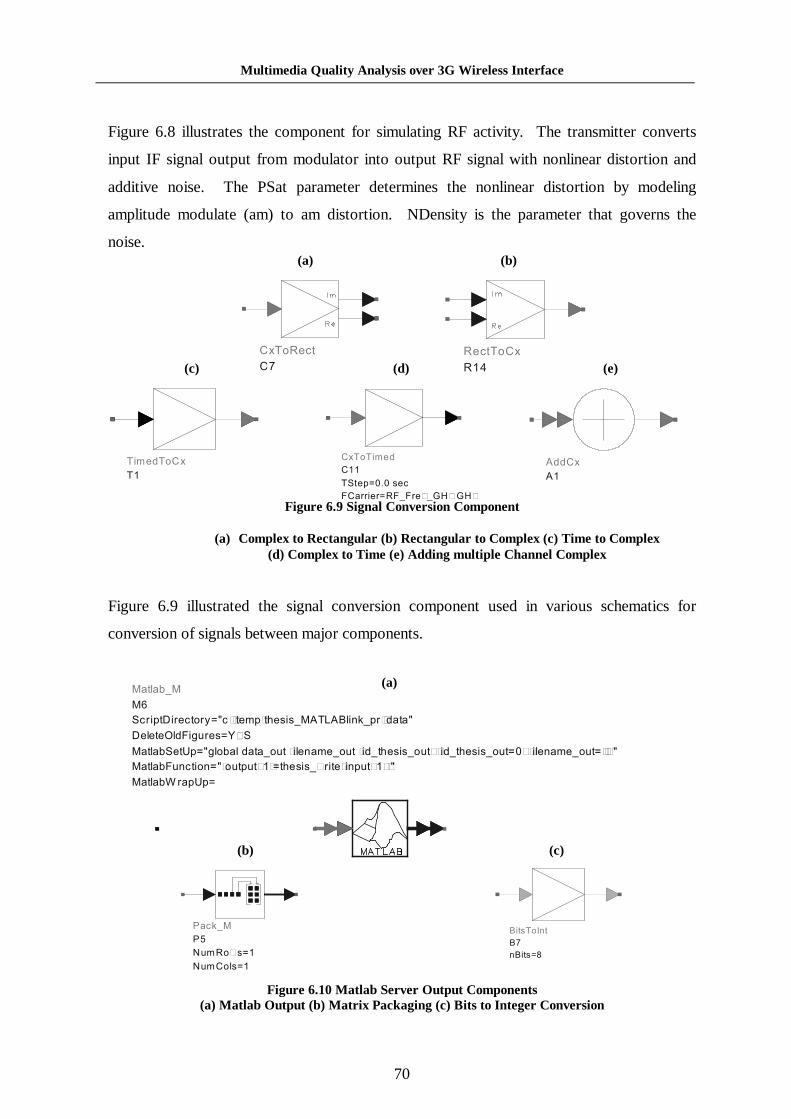
Multimedia Quality Analysis over 3G Wireless Inter face
70
Figure 6.8 illustrates the component for simulating RF activity. The transmitter converts
input IF signal output from modulator into output RF signal with nonlinear distortion and
additive noise. The PSat parameter determines the nonlinear distortion by modeling
amplitude modulate (am) to am distortion. NDensity is the parameter that governs the
noise.
Figure 6.9 Signal Conversion Component
Figure 6.9 illustrated the signal conversion component used in various schematics for
conversion of signals between major components.
Figure 6.10 Matlab Server Output Components (a) Matlab Output (b) Matr ix Packaging (c) Bits to Integer Conversion
�.2�����
�� ����2��.
��#
2�( �-2��.
2� �--�.
��
�.2�2�(�-
���
��� �� ����� �=��+>"�+>
2��3�%�%"���
(a) (b)
(c) (d) (e)
(a) Complex to Rectangular (b) Rectangular to Complex (c) Time to Complex
(d) Complex to Time (e) Adding multiple Channel Complex
��������
�!
������� �3&3�
�������'��������E�'�3'�F�G��0�����: ���A��3'�F�BH�
��������&3��,�����"-�����'�";�����(���'�";�-��0������'�H";�-��0������'��%H";�����(���'��IIH"�
��������-��,' ���78
� �3��� ���� 1���J@��(3@�0�������2/����5�3 K@-����
)��5��
)$
�'(������
�'(��:���
���2�*��
�
�����6
(a)
(b) (c)

Multimedia Quality Analysis over 3G Wireless Inter face
71
Figure 6.10 shows the various components used for outputting the processed data from
ADS. Specific written Matlab code allows Matlab Server loaded separately from ADS to
accept the output signal output using the Matlab Output component. The data are first
converted from bits to integer and packed into a 1x1 matrix prior to outputting onto Matlab.
This schematic presented in Figure 6.2 is the first level view of the 3G test bed module,
implementing the specification in Chapter 3. It is constructed using the main functional
modules provided by ADS 3G module libraries. These modules are as presented in this and
the next two sections. BS source and UE receiver modules in this section are high level
modules that are built using more fundamental functional modules. The internal schematics
of these two modules are modified from that obtained from the ADS library. The new
schematics are presented in the next two sub sections.
This ends the section on the main schematic for the UTRA/3G test bed module where the
main structure has been explained. The next two sections illustrate the BS and UE
components.

Multimedia Quality Analysis over 3G Wireless Inter face
72
6.2 ADS Implementation Base Station Design Schematics Figure 6.11 ADS Base Station Internal Block Schematic
Fig
ure
6.11
AD
S B
ase
Stat
ion
Inte
rnal
Blo
ck S
chem
atic
1.
2.
3.
4.
5.

Multimedia Quality Analysis over 3G Wireless Inter face
73
This section illustrates the BS variable source. The schematic is modified from the original
design from [74]. Upon every eight firings of the simulated source, to Matlab server inputs
a byte from the testing data file, which is converted back to bit before handing over to the
next section. The input from the Matlab component is taken as transport channel Dedicated
Channel (DCH) data at this stage. It is then transport channel coded and then multiplexed
together again into a single Coded Composite Transport Channel (CCTrCH) prior to
handing to segmentation into the Dedicated Physical Data Channel (DPDCH). Transport
Format Combination Indicator (TFCI) mapping and encoding is done concurrently with the
mentioned processes.
The data stream is then power allocated, then spread and scrambled using OVSF channel
code before being multiplexed with Common Pilot Channel (CPICH), Primary Common
Control Channel (PCCPCH) and simulated channel noise to complete the final output.
Note that for easy functionality explanation, the schematic is divided into 5 blocks, which
are presented in the following.
Figure 6.12 Matlab Server Data Input Section
Figure 6.12 illustrates block 1, the Matlab server data input block that allows input of the
data file from the output ADS. The tokens from the variable sources are grouped using
Pack_M components into a group of 8 to represent a byte. Then the Matlab input
component is invoked, receiving a byte of data in the form of a matrix. The matrix is then
unpacked and converts back into bits for further processing in following sections.
*��2� ���
*�
�� ���6
���� �2�*��
��
&�)5��
&�
�'( ������
�'( ��:���
)��5��
)
�'( �����6
�'( ��:���
��������
�
������� �3&3�
�������'��������E�'�3'�F�G��0����� ��-A��3'�F�BH�
��������&3��,�����"-������";�����( ��";�-��0����H";�-��0�����%H";�����( ���IIH"�
��������-��,' ���78
� �3��� ���� 1���J@��( 3@�0�������2/����5�3 K@-����

Multimedia Quality Analysis over 3G Wireless Inter face
74
Figure 6.13 Transpor t Channel Coding
Figure 6.13 illustrates the major components in block 2, which relates to coding of the
transport channels. The variable rate source mentioned before is listed here, as it provides
the variable rate data source as well as the maximum transport format, which govern
transport channel coding. The main component here is the DnLkTrCHCoding, which is
responsible for CRC encoding, code block segmentation, channel coding, rate matching,
first interleaving and radio frame segmentation. Convolutional coding is used if TTI count
is greater than 504 and turbo coding if TTI count is greater than 5114. The details are as
presented in section 3.1, covering the section on channel coding and related operations.
TFCIMap component is used for Transport Format Combination Indicator (TFCI) mapping
of the transmission side and subsequently TFCIEncoder is used to encode the TFCI. TFCI
is for indication of multiple transport channel in and CCTrCH. Although a single variable
source is used here, it is compulsory for further extension. The encoded TFCI is used in the
component in the later section.
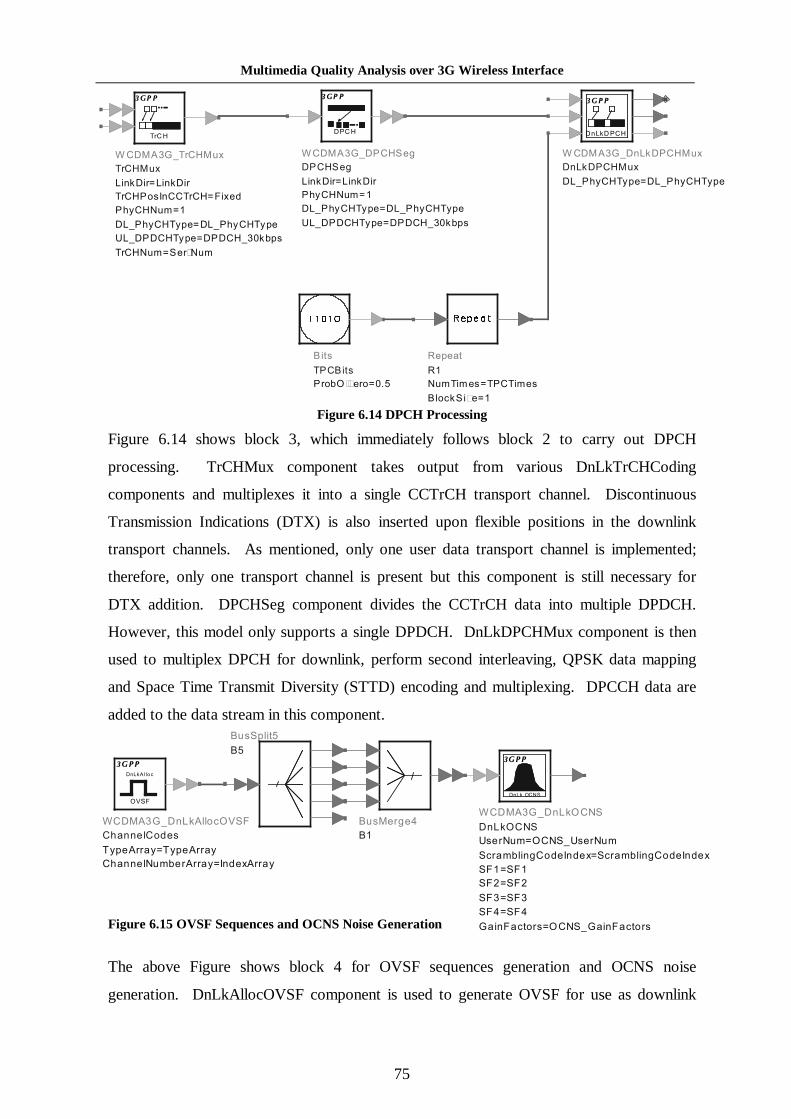
Multimedia Quality Analysis over 3G Wireless Inter face
75
��������2 �+�'.
2 �+�'.
/��5�� �/��5��
2 �+)��*���2 �+���.�-
)01�+�'(��
�/�)01�+213���/�)01�+213�
&/��)��+213���)��+��%5�3�
2 �+�'(�� 9�'(
2 �+
��� �
���������)�+�,
�)�+�,
/��5�� �/��5��
)01�+�'(��
�/�)01�+213���/�)01�+213�
&/��)��+213���)��+��%5�3�
��� �
�)�+
����������/5�)�+�'.
��/5�)�+�'.
�/�)01�+213���/�)01�+213�
��� �
��/5�)�+
���
2)����
) ���;L� ��%�$
��3���
��
�'(2�( ���2)�2�( ��
���5�>���
'��� ,�#
�
'�3���$
$
����������/5���
��/5���
&�� �'(�����&�� �'(
� �(����,��-�*�-�.�� �(����,��-�*�-�.
�����
� ��
�����
�#��#
��������� ��������������� �
����
��/5"���
����������/5��������
�0�������-��
213�� �1�213�� �1
�0������'(�� � �1�*�-�.� �1
����
��/5� ����
���
Figure 6.14 DPCH Processing
Figure 6.14 shows block 3, which immediately follows block 2 to carry out DPCH
processing. TrCHMux component takes output from various DnLkTrCHCoding
components and multiplexes it into a single CCTrCH transport channel. Discontinuous
Transmission Indications (DTX) is also inserted upon flexible positions in the downlink
transport channels. As mentioned, only one user data transport channel is implemented;
therefore, only one transport channel is present but this component is still necessary for
DTX addition. DPCHSeg component divides the CCTrCH data into multiple DPDCH.
However, this model only supports a single DPDCH. DnLkDPCHMux component is then
used to multiplex DPCH for downlink, perform second interleaving, QPSK data mapping
and Space Time Transmit Diversity (STTD) encoding and multiplexing. DPCCH data are
added to the data stream in this component.
Figure 6.15 OVSF Sequences and OCNS Noise Generation
The above Figure shows block 4 for OVSF sequences generation and OCNS noise
generation. DnLkAllocOVSF component is used to generate OVSF for use as downlink
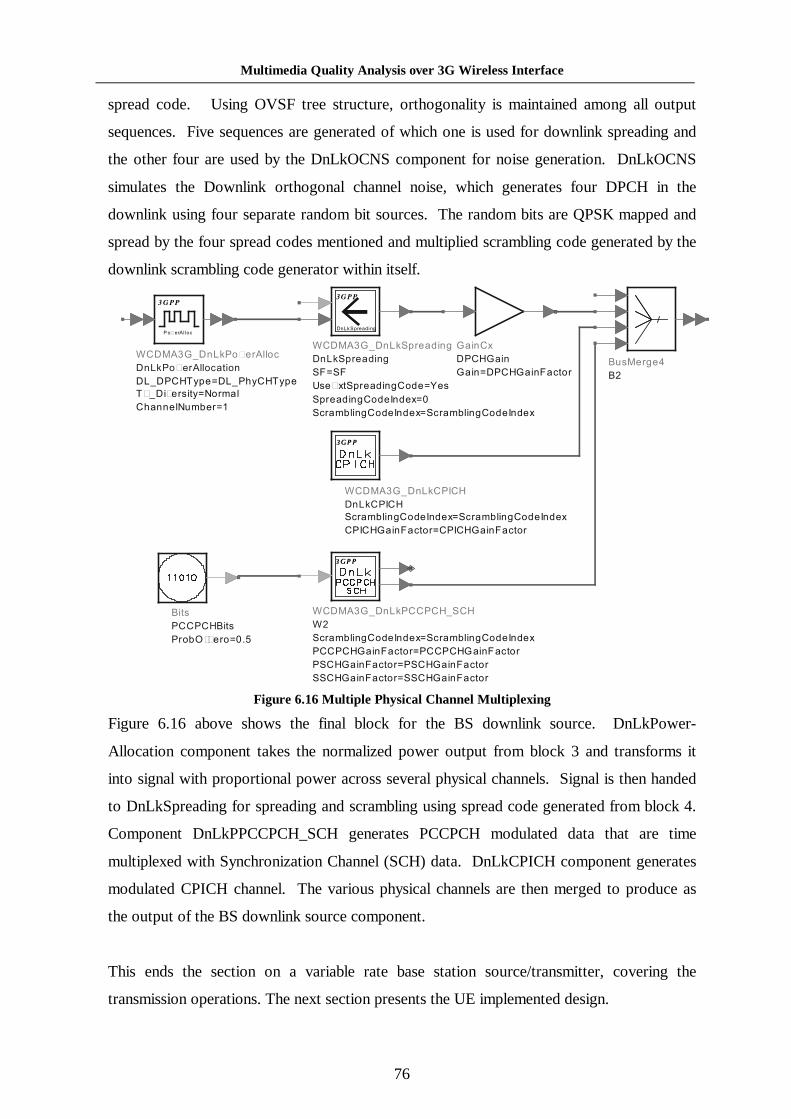
Multimedia Quality Analysis over 3G Wireless Inter face
76
����������/5)�:� �����
��/5)�:� ����������
�/��)�+213���/�)01�+213�
2C���9� ���1��� (��
�0������'(�� ��
����
)�:� �� ���
'��� ,�#
�����.
�)�+����
������)�+���������
����������/53 ��-��,
��/53 ��-��,
���
&��8.�3 ��-��,��-��7��
3 ��-��,��-�*�-�.�%
� �(����,��-�*�-�.�� �(����,��-�*�-�.
��/53 ��-��,
����
����������/5�)*�+
��/5�)*�+
� �(����,��-�*�-�.�� �(����,��-�*�-�.
�)*�+��������� ��)*�+���������
��� �
����������/5)��)�+��+
�
� �(����,��-�*�-�.�� �(����,��-�*�-�.
)��)�+��������� �)��)�+���������
)�+��������� �)�+���������
�+��������� ��+���������
��� �
���
)��)�+���
) ���;L� ��%�$
spread code. Using OVSF tree structure, orthogonality is maintained among all output
sequences. Five sequences are generated of which one is used for downlink spreading and
the other four are used by the DnLkOCNS component for noise generation. DnLkOCNS
simulates the Downlink orthogonal channel noise, which generates four DPCH in the
downlink using four separate random bit sources. The random bits are QPSK mapped and
spread by the four spread codes mentioned and multiplied scrambling code generated by the
downlink scrambling code generator within itself.
Figure 6.16 Multiple Physical Channel Multiplexing
Figure 6.16 above shows the final block for the BS downlink source. DnLkPower-
Allocation component takes the normalized power output from block 3 and transforms it
into signal with proportional power across several physical channels. Signal is then handed
to DnLkSpreading for spreading and scrambling using spread code generated from block 4.
Component DnLkPPCCPCH_SCH generates PCCPCH modulated data that are time
multiplexed with Synchronization Channel (SCH) data. DnLkCPICH component generates
modulated CPICH channel. The various physical channels are then merged to produce as
the output of the BS downlink source component.
This ends the section on a variable rate base station source/transmitter, covering the
transmission operations. The next section presents the UE implemented design.
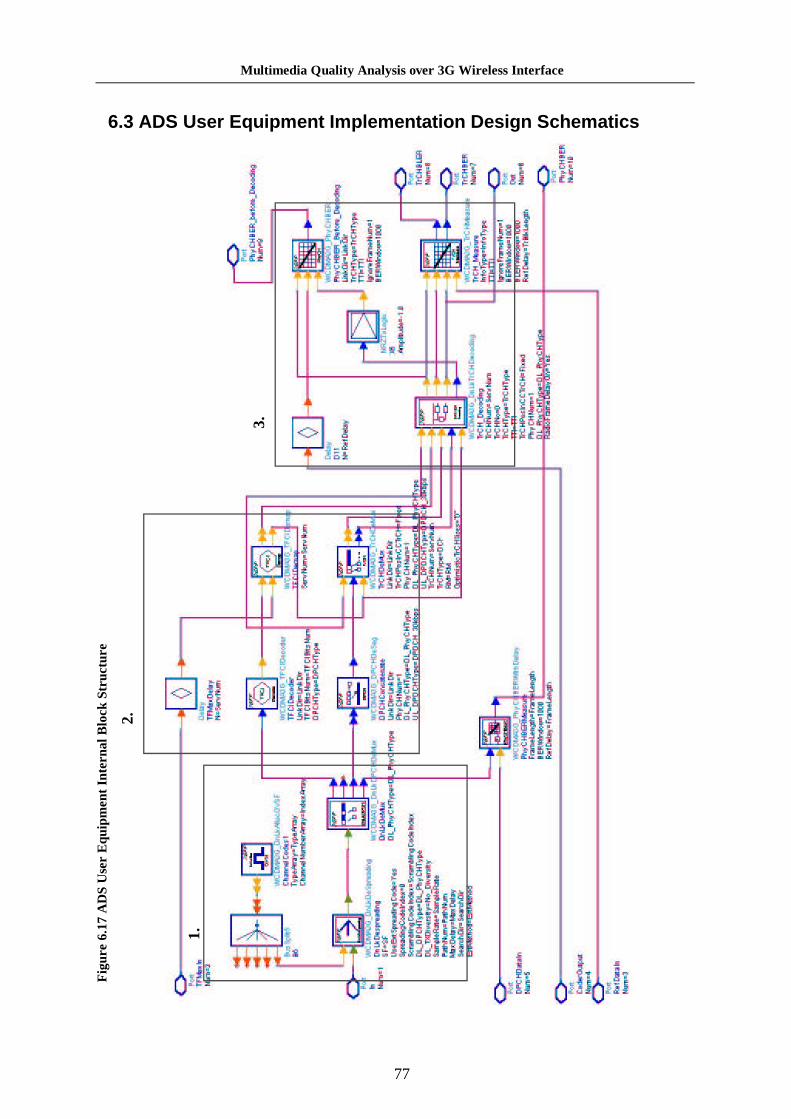
Multimedia Quality Analysis over 3G Wireless Inter face
77
6.3 ADS User Equipment Implementation Design Schematics
Figure 6.17 ADS User Equipment Internal Block Structure
Fig
ure
6.17
AD
S U
ser
Equ
ipm
ent
Inte
rnal
Blo
ck S
truc
ture
3.
1.
2.
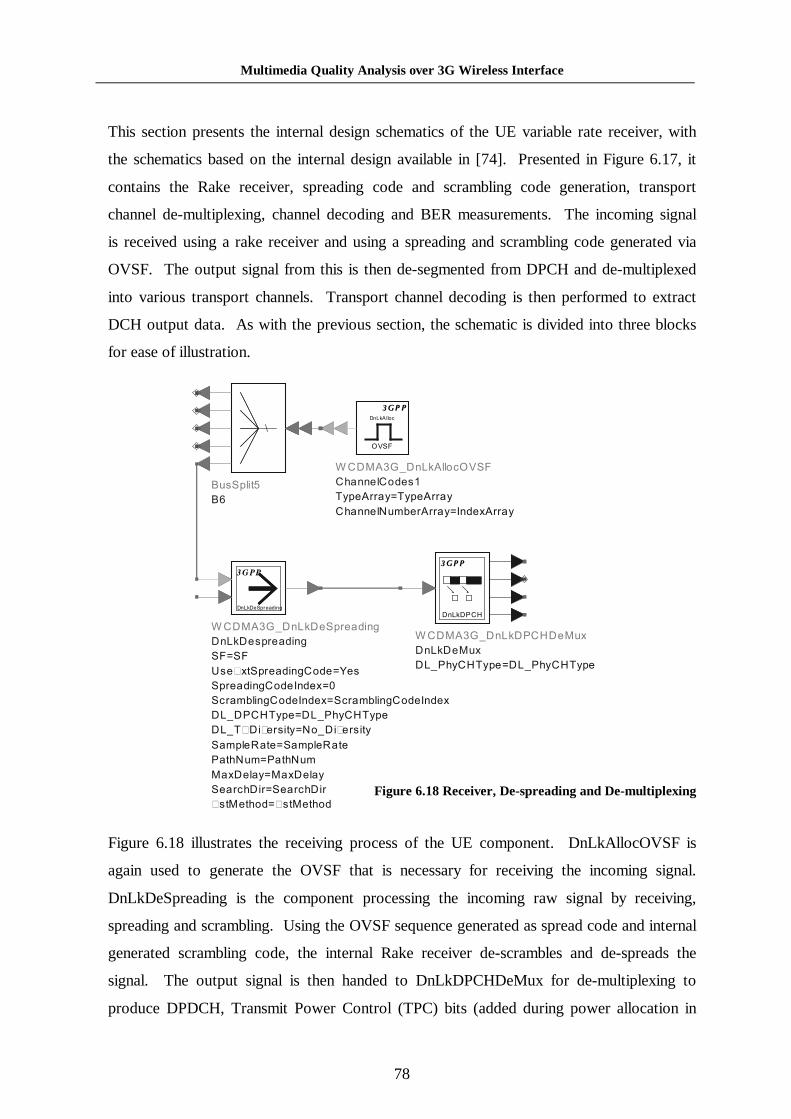
Multimedia Quality Analysis over 3G Wireless Inter face
78
This section presents the internal design schematics of the UE variable rate receiver, with
the schematics based on the internal design available in [74]. Presented in Figure 6.17, it
contains the Rake receiver, spreading code and scrambling code generation, transport
channel de-multiplexing, channel decoding and BER measurements. The incoming signal
is received using a rake receiver and using a spreading and scrambling code generated via
OVSF. The output signal from this is then de-segmented from DPCH and de-multiplexed
into various transport channels. Transport channel decoding is then performed to extract
DCH output data. As with the previous section, the schematic is divided into three blocks
for ease of illustration.
Figure 6.18 Receiver , De-spreading and De-multiplexing
Figure 6.18 illustrates the receiving process of the UE component. DnLkAllocOVSF is
again used to generate the OVSF that is necessary for receiving the incoming signal.
DnLkDeSpreading is the component processing the incoming raw signal by receiving,
spreading and scrambling. Using the OVSF sequence generated as spread code and internal
generated scrambling code, the internal Rake receiver de-scrambles and de-spreads the
signal. The output signal is then handed to DnLkDPCHDeMux for de-multiplexing to
produce DPDCH, Transmit Power Control (TPC) bits (added during power allocation in
'�3���$
!
����������/5�)�+���'.
��/5���'.
�/�)01�+213���/�)01�+213�
��/5�)�+
��� �
����������/5��������
�0�������-���
213�� �1�213�� �1
�0������'(�� � �1�*�-�.� �1
��� �
��/5�����
���
����������/5��3 ��-��,
��/5���3 ��-��,
���
&��8.�3 ��-��,��-��7��
3 ��-��,��-�*�-�.�%
� �(����,��-�*�-�.�� �(����,��-�*�-�.
�/��)�+213���/�)01�+213�
�/�2C��9� ���1������9� ���1
�(3��������(3������
)��0�'(�)��0�'(
��.����1���.����1
�� �0�� ��� �0��
8�����0�-�8�����0�-
����
��/5��3 ��-��,

Multimedia Quality Analysis over 3G Wireless Inter face
79
��������2��*��(�3
2��*��(�3
� 9�'(�� 9�'(
����
2��*
��(�3
����1
2���.����1
��� 9�'(
��������2��*����-�
2��*����-�
/��5�� �/��5��
2��*����'(�2��*����'(
�)�+213���)�+213�
����
2��*
����-�
���������)�+���,
�)�+�����������
/��5�� �/��5��
)01�+�'(��
�/�)01�+213���/�)01�+213�
&/��)��+213���)��+��%5�3�
�)�+
����
��������2 �+���'.
2 �+���'.
/��5�� �/��5��
2 �+)��*���2 �+���.�-
)01�+�'(��
�/�)01�+213���/�)01�+213�
&/��)��+213���)��+��%5�3�
2 �+�'(�� 9�'(
2 �+213����+
�����
�3��( �����2 �+�>����%�
2 �+
����
BS) and TFCI bits. Note that DPDCH data are de-interleaved for the 2nd interleaving
process (in Figure 3.1).
Figure 6.19 Physical Channel De-segmentation and Transpor t Channel De-multiplexing
Figure 6.19 shows block 2, which involves TFCI operations, DPCH de-segmentation and
transport channel de-multiplexing. The TFCIDecoder decodes the TFCI output from the
DnLk-DPCHDeMux while the output data are handed to DPCHDeSeg for de-segmentation.
Bits from different DPDCH are concatenated into a single CCTrCH. TFCI de-mapping is
done in TFCIDemap while TrCHDeMux handles the Transport Channel de-multiplexing.
This processes de-multiplex radio frames from all transport channels from a single
CCTrCH and also punctures DTX with flexible transport channel positions.
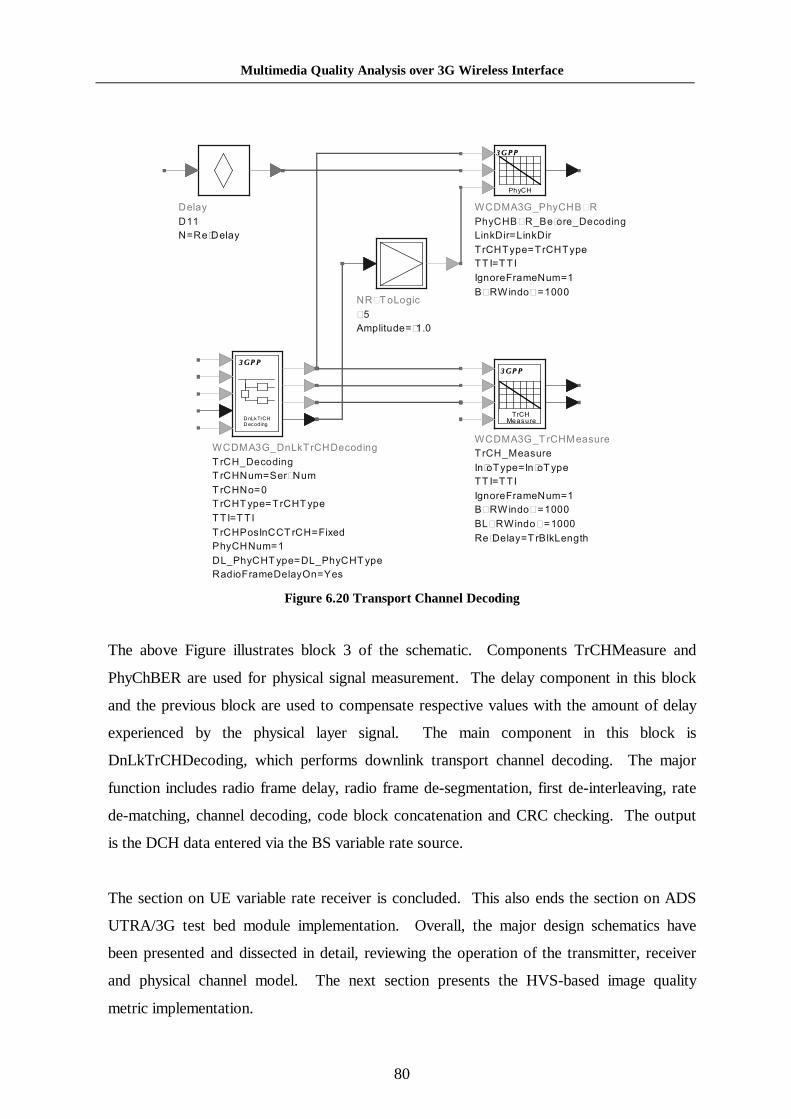
Multimedia Quality Analysis over 3G Wireless Inter face
80
��������2 �+����' �
2 �+�����' �
*�;�213��*�;�213�
22*�22*
*,�� �� �(��'(��
8����-�:��%%%
/8����-�:��%%%
��;����1�2 �5/��,�0
��� �
2 �+����' �
����������/52 �+����-��,
2 �+�����-��,
2 �+�'(�� 9�'(
2 �+���%
2 �+213��2 �+213�
22*�22*
2 �+)��*���2 �+���.�-
)01�+�'(��
�/�)01�+213���/�)01�+213�
��-��� �(�����1���7��
��� �
��/52 �+����-��,
��L2�/�,��
C$
�(3���'-��<��%
����1
���
����;����1
��������)01�+8�
)01�+8���;� ������-��,
/��5�� �/��5��
2 �+213��2 �+213�
22*�22*
*,�� �� �(��'(��
8����-�:��%%%
����
)01�+
Figure 6.20 Transpor t Channel Decoding
The above Figure illustrates block 3 of the schematic. Components TrCHMeasure and
PhyChBER are used for physical signal measurement. The delay component in this block
and the previous block are used to compensate respective values with the amount of delay
experienced by the physical layer signal. The main component in this block is
DnLkTrCHDecoding, which performs downlink transport channel decoding. The major
function includes radio frame delay, radio frame de-segmentation, first de-interleaving, rate
de-matching, channel decoding, code block concatenation and CRC checking. The output
is the DCH data entered via the BS variable rate source.
The section on UE variable rate receiver is concluded. This also ends the section on ADS
UTRA/3G test bed module implementation. Overall, the major design schematics have
been presented and dissected in detail, reviewing the operation of the transmitter, receiver
and physical channel model. The next section presents the HVS-based image quality
metric implementation.
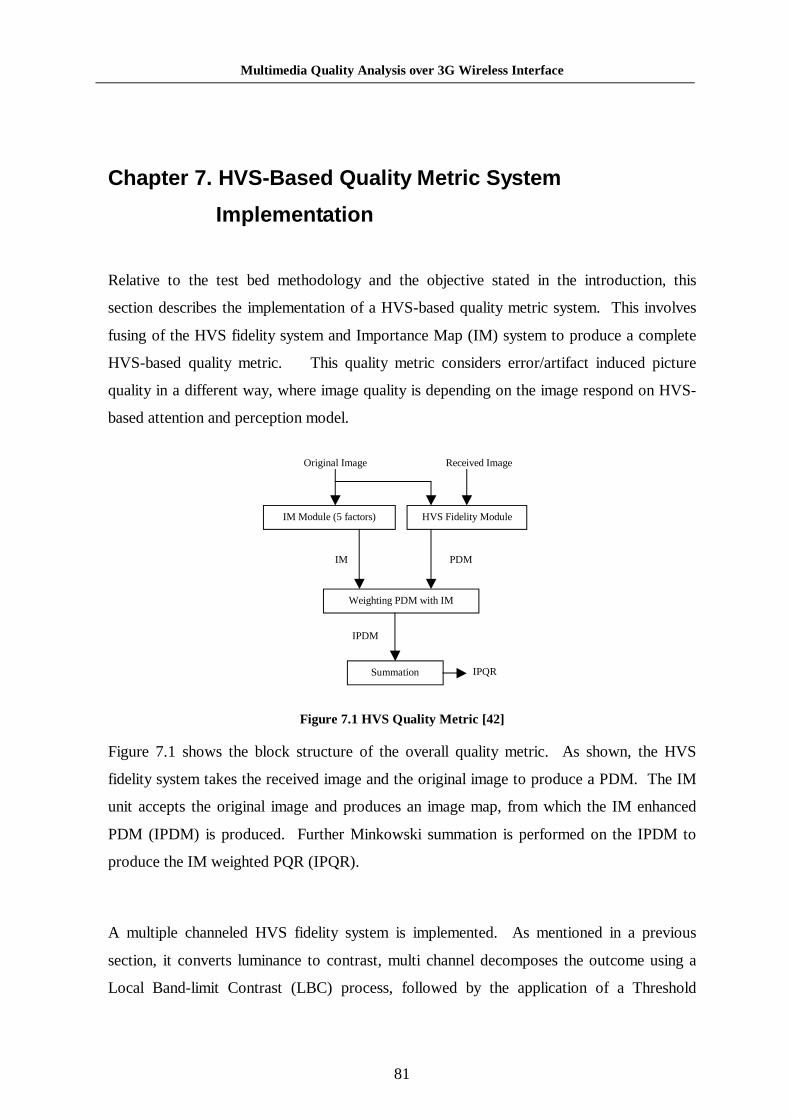
Multimedia Quality Analysis over 3G Wireless Inter face
81
Chapter 7. HVS-Based Quality Metric System
Implementation
Relative to the test bed methodology and the objective stated in the introduction, this
section describes the implementation of a HVS-based quality metric system. This involves
fusing of the HVS fidelity system and Importance Map (IM) system to produce a complete
HVS-based quality metric. This quality metric considers error/artifact induced picture
quality in a different way, where image quality is depending on the image respond on HVS-
based attention and perception model.
Figure 7.1 HVS Quality Metr ic [42]
Figure 7.1 shows the block structure of the overall quality metric. As shown, the HVS
fidelity system takes the received image and the original image to produce a PDM. The IM
unit accepts the original image and produces an image map, from which the IM enhanced
PDM (IPDM) is produced. Further Minkowski summation is performed on the IPDM to
produce the IM weighted PQR (IPQR).
A multiple channeled HVS fidelity system is implemented. As mentioned in a previous
section, it converts luminance to contrast, multi channel decomposes the outcome using a
Local Band-limit Contrast (LBC) process, followed by the application of a Threshold
PDM IM
Original Image Received Image
IPDM
IM Module (5 factors) HVS Fidelity Module
Weighting PDM with IM
Summation IPQR

Multimedia Quality Analysis over 3G Wireless Inter face
82
Enhanced (ThE) Contrast Sensitivity Function (CSF) to determine the Just Noticeable
Difference (JND) fidelity measurement; application of visibility threshold is followed by
Minkowski summation to produce the output PDM. Note that the PDM is a fidelity map
that indicates visible distortion between received and original picture.
Furthermore, IM is used to identify the Region of Interest (ROI), grading the regions from
0.0-1.0 with 1.0 given to area of most importance in the image. Therefore, IM grading is
relative within individual images. PDM is weighted with IM, weighting the quantifying
fidelity measure relative to its location and scaling the PDM accordingly with the IM
grading. A simple approach for weighting is adopted from [64]:
(7.1)
The IPDM map illustrates the distortion between the images relative to human perception.
Where IPDM (x,y) is the IPDM value for pixel (x,y), respectively for PDM and IM. γ is a
compensating index, where experiments shows the best value to be 0.5 [42]. In the final
rating, the Importance weighted PQR (IPQR) is produced from the new PDM. IPQR is a
number ranging from 1 to 5 which grades the distortion, where 5 is the highest (no
distortion) and 1 is the lowest. The equation for producing both IPQR and IPQR range 1-5
is listed below [64]:
(7.2)
(7.3)
Note that p is a scaling constant, β is used for output control, while low value gives
correlation upon average pixel error and high value gives a correlation upon maximum
IPDM value. β = 3.0 is usually used to get an accurate result.
It is important to note that different images produce different IM maps. Therefore, even if
given two different images with very similar distortion, the IPQR produced is very likely to
be diverse. This is because distortion has different impacts on image quality, depending on
the location it situates, as different areas have different importance ratings.
ββ /11 )),(( �=N
N yxIPDMIPQR
IPQRpIPQR
⋅+=− 1
551
γ),(),(),( yxIMyxPDMyxIPDM ⋅=

Multimedia Quality Analysis over 3G Wireless Inter face
83
Furthermore, IPQR is produced based on IM, which works well on natural images
generally. In the case of artificial and specific images (e.g. medical images), the user may
choose to use PQR over IPQR as IM is tuned for the natural image and may not be suitable
for the images in question.
HVS image analysis is implemented using Matlab while the IM analysis is implemented
using C, to improve the efficiency of the split and merge algorithm. Both currently process
only gray scale images and accept the Portable Grey Map (PGM) format. The following
describes the conceptual details of the implementation.
7.1 HVS Fidelity Module Implementation
The main structure of the fidelity system is based on a log cosine function with texture
masking enhancement. The texture masking enhancement raises the threshold in textures
sharply while along edges only moderately. The difference between the original and the
received image is taken at each band and compared to the masking threshold, determining
its visibility. The image is first read in and converts from gray level to luminance,
depending on monitor characteristics. Matlab fft2 function is used for the Fourier
transform needed, as mention in an earlier section. The radial frequency at each location is
obtained and scaled to its maximum value. The log cosine filters are then configured and
applied to each of these filters in term of the image matrix.
Matlab ifft function is used as an inverse Fourier transform to convert the visual frequency
back to the luminance domain for further processing. Local point contrast is calculated
next, using the equation listed in the previous section. Texture masking is done next, by
classifying the image locality into flat, edge or textured regions. This is done as explained
in the previous section, calculating mean absolute difference in blocks surrounding each
pixel, reflecting activities in the local region. The threshold in various regions, band and
channels for Contrast Sensitivity Function (CSF) is adjusted from spatial masking, prior to
the application of CSF. Summation is done over channels, then over a small region of
space, as specified in the previous section, producing the PDM.

Multimedia Quality Analysis over 3G Wireless Inter face
84
The author would like to note that the implementation of this module is based largely on the
codes provided by Osberger, the author of [42], with minor modification. The majority of
the base functions written by Osberger are used with minimal modification, while the
author writes the main program. It can be said that the author uses Osberger’s code as a
HVS fidelity module library. This concludes the section on the HVS-based fidelity system.
The next section will be on IM implementation in C.
7.2 Importance Map Implementation
IM C code implementation starts by reading in the image, handling it differently depending
on whether it is an ASCII or binary coded image file. Image data are held as individual
pixels in a two dimension array (e.g. Image). Splitting is then done in a recursive
procedure, where upon each recursion, the variance of the region is first calculated. Upon
dissatisfaction of a condition, the process splits the image into four equal sections and
invokes a splitting procedure for each. As mentioned in a previous section, the condition
requires the variance of the region in processing to be lower or equal to the set threshold.
Within the split algorithm, the merging process is done after the recursive splitting of the
four divided blocks of the immediate region, then merging is done for all the pixels in the
immediate region. Merging is done via comparing two neighboring pixels, and both
regions are merged if the two regions are different and the combined variance is less than
merging threshold.
During the operation, another array of equal size to the Image array, the
Array_Image_Region, keeps track of the region a pixel belongs to. This record of region
assignment is finalized upon the end of running each recursive thread of the split procedure.
This gives an immediate region number to the newly formed region, after which a merge
operation will occur as mentioned before. While at the end of the entire recursive split-
merge run, individual pixels of the image are indexed with a region. Upon the finalization
of each immediate region, the pixel count, sum of value of the region and summed squared
value of the region is recorded individually into separate areas, termed
Array_Region_Total, Array_Region_Count and Array_Region_Count2 for easing of the
importance factor calculation later on. This will also be updated in the merge algorithm
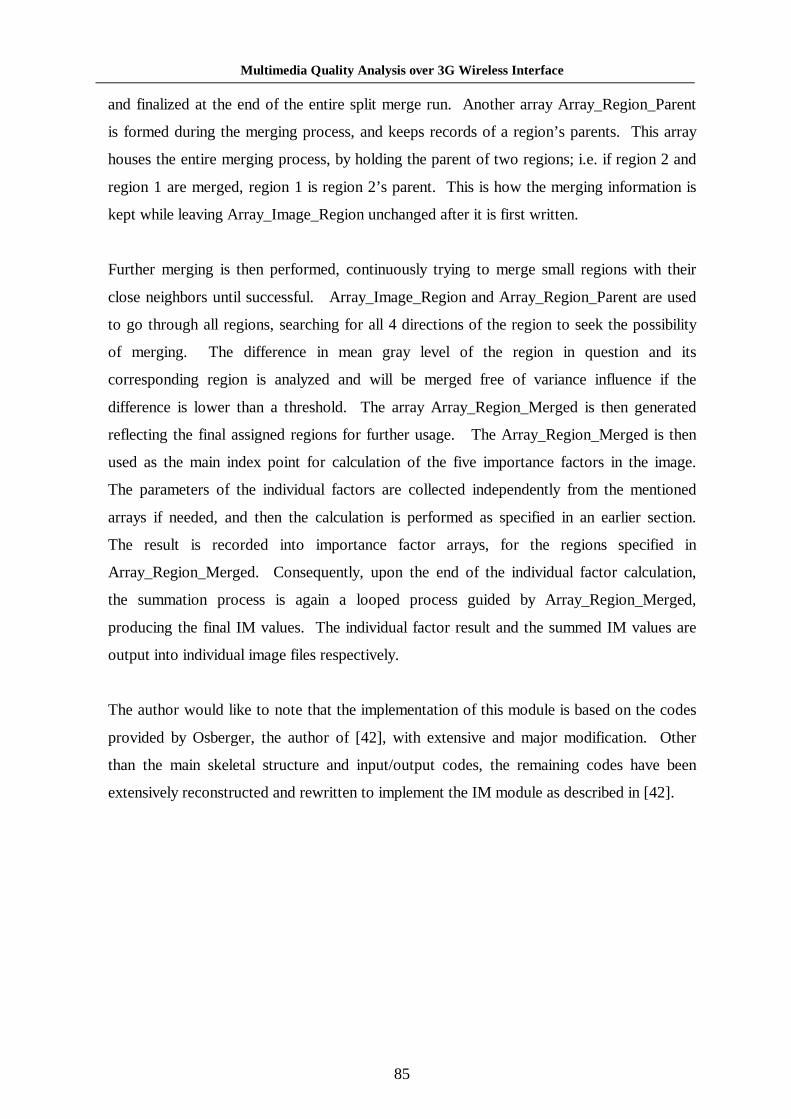
Multimedia Quality Analysis over 3G Wireless Inter face
85
and finalized at the end of the entire split merge run. Another array Array_Region_Parent
is formed during the merging process, and keeps records of a region’s parents. This array
houses the entire merging process, by holding the parent of two regions; i.e. if region 2 and
region 1 are merged, region 1 is region 2’s parent. This is how the merging information is
kept while leaving Array_Image_Region unchanged after it is first written.
Further merging is then performed, continuously trying to merge small regions with their
close neighbors until successful. Array_Image_Region and Array_Region_Parent are used
to go through all regions, searching for all 4 directions of the region to seek the possibility
of merging. The difference in mean gray level of the region in question and its
corresponding region is analyzed and will be merged free of variance influence if the
difference is lower than a threshold. The array Array_Region_Merged is then generated
reflecting the final assigned regions for further usage. The Array_Region_Merged is then
used as the main index point for calculation of the five importance factors in the image.
The parameters of the individual factors are collected independently from the mentioned
arrays if needed, and then the calculation is performed as specified in an earlier section.
The result is recorded into importance factor arrays, for the regions specified in
Array_Region_Merged. Consequently, upon the end of the individual factor calculation,
the summation process is again a looped process guided by Array_Region_Merged,
producing the final IM values. The individual factor result and the summed IM values are
output into individual image files respectively.
The author would like to note that the implementation of this module is based on the codes
provided by Osberger, the author of [42], with extensive and major modification. Other
than the main skeletal structure and input/output codes, the remaining codes have been
extensively reconstructed and rewritten to implement the IM module as described in [42].

Multimedia Quality Analysis over 3G Wireless Inter face
86
7.3 Combination of HVS-Based Fidelity and IM Results
With the results gathered from 7.1 and 7.2, the remaining system is implemented using
Matlab. The PDM matrix from 7.1 is conserved while reading the IM map from 7.2 and
processing it into a scale from 0.0-1.0. The remaining process is performed mathematically
as specified in Chapter 7 without much complication.
The description of the implementation of the HVS-based quality metric is concluded. A
general description of the infrastructure designs and innovative areas have been provided
while many technical details have been omitted. The next section presents the results and
analysis of the two main modules implemented.

Multimedia Quality Analysis over 3G Wireless Inter face
87
Chapter 8. Individual System Testing
This section presents the results and corresponding analysis of the three most important
areas of the overall test bed. These are the UTRA/3G test bed module; the HVS-based
fidelity system and the Importance Map system. The results are presented to illustrate the
working and behavior of the individual systems. The input data from processing are raw
PGM files, as the aim of this thesis is to present the workings of the test bed implemented
with minimal complication of the communication protocols or image compression
technologies. The test images used in Chapters 8 and 9 are common testing images used by
image processing application.
8.1 UTRA/3G Test Bed Module System Testing
Results presented here are divided into three sections: general image testing, images subject
to variable environmental parameters and velocity and image subject to varying arrival
angle. The aim of this section is to show that the UTRA/3G test bed module is working and
is generally consistent with expected outcomes.
8.1.1 General Image Testing
This section shows results of sending various different images through the UTRA/3G test
bed module. A different range of images is tested while the environment parameters are
fixed to Vehicular A. Six separate group of images are shown with each subjected to
channel conditions under velocities of 20 km/h, 50 km/h and 80 km/h. The new
terminology used in this section is listed below [42]:
(8.1)
(8.2)
where:
• MSE is Mean Square Error;
• PSNR is Perceptual Signal to Noise Ratio;
��−
=
−
=
−=1
0
1
0
2)ˆ(1 M
i
N
jijij xx
MNMSE
dBMSE
PSNRn 2)12(
log10−=

Multimedia Quality Analysis over 3G Wireless Inter face
88
Figure 8.1 (a) Figure 8.1 (b)
Figure 8.1 (c) Figure 8.1 (d)
• ijx is the original pixel value at position (i,j);
• ijx̂ value of distorted pixel at position (i,j);
• M is number of horizontal pixels;
• N is the number of vertical pixels; and
• n is the number of pixels.
MSE and PSNR are used to illustrate the pixel level measurement of errors and signal to
error ratio for an image. Figures 8.1 to 8.6 illustrate the results for a range of images
subjected to channel motion of 20, 50 and 80 km respectively.
Figure 8.1 Image “ Baboon” Subjected to Channel of Three Different Velocities (a) Or iginal (b) 20 km/h (c) 50 km/h (d) 80km/h

Multimedia Quality Analysis over 3G Wireless Inter face
89
Figure 8.2 (a) Figure 8.2 (b)
Figure 8.2 (c) Figure 8.2 (d)
Figure 8. 2 Image “ Football” Subjected to Channel of Three Different Velocities
(a) Or iginal (b) 20 km/h (c) 50 km/h (d) 80km/h

Multimedia Quality Analysis over 3G Wireless Inter face
90
Figure 8.3 Image “ Lena” Subjected to Channel of Three Different Velocities
(a) Or iginal (b) 20 km/h (c) 50 km/h (d) 80km/h
Figure 8.3 (c) Figure 8.3 (d)
Figure 8.3 (a) Figure 8.3 (b)
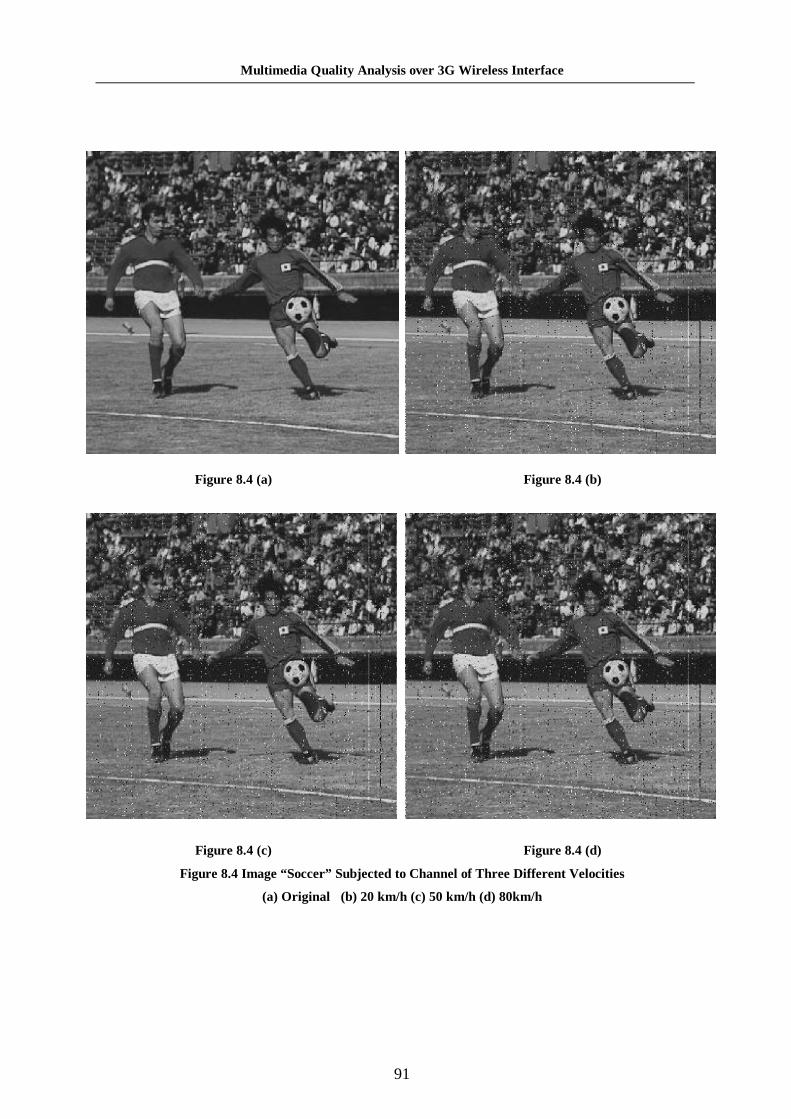
Multimedia Quality Analysis over 3G Wireless Inter face
91
Figure 8.4 (a) Figure 8.4 (b)
Figure 8.4 (c) Figure 8.4 (d)
Figure 8.4 Image “ Soccer ” Subjected to Channel of Three Different Velocities
(a) Or iginal (b) 20 km/h (c) 50 km/h (d) 80km/h
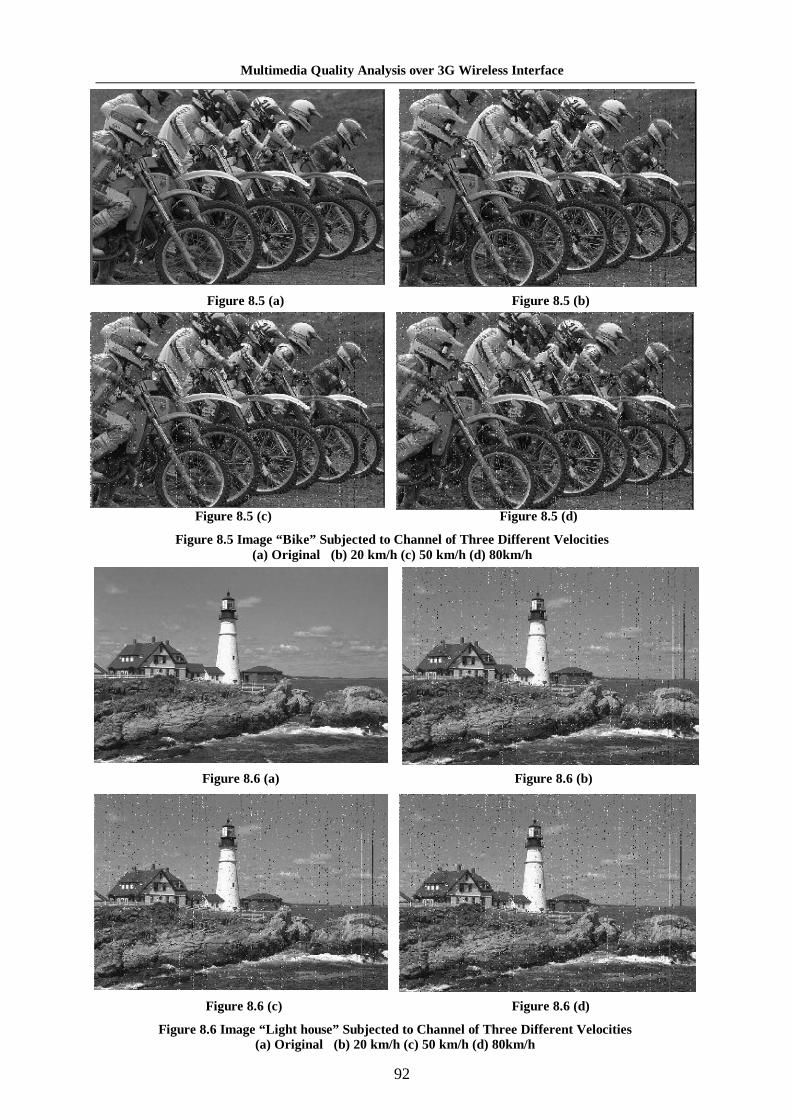
Multimedia Quality Analysis over 3G Wireless Inter face
92
Figure 8.5 Image “Bike” Subjected to Channel of Three Different Velocities Figure 8.6 Image “Light house” Subjected to Channel of Three Different Velocities
Figure 8.5 Image “ Bike” Subjected to Channel of Three Different Velocities (a) Or iginal (b) 20 km/h (c) 50 km/h (d) 80km/h
Figure 8.5 (c) Figure 8.5 (d)
Figure 8.5 (a) Figure 8.5 (b)
Figure 8.6 Image “ L ight house” Subjected to Channel of Three Different Velocities (a) Or iginal (b) 20 km/h (c) 50 km/h (d) 80km/h
Figure 8.6 (c) Figure 8.6 (d)
Figure 8.6 (a) Figure 8.6 (b)
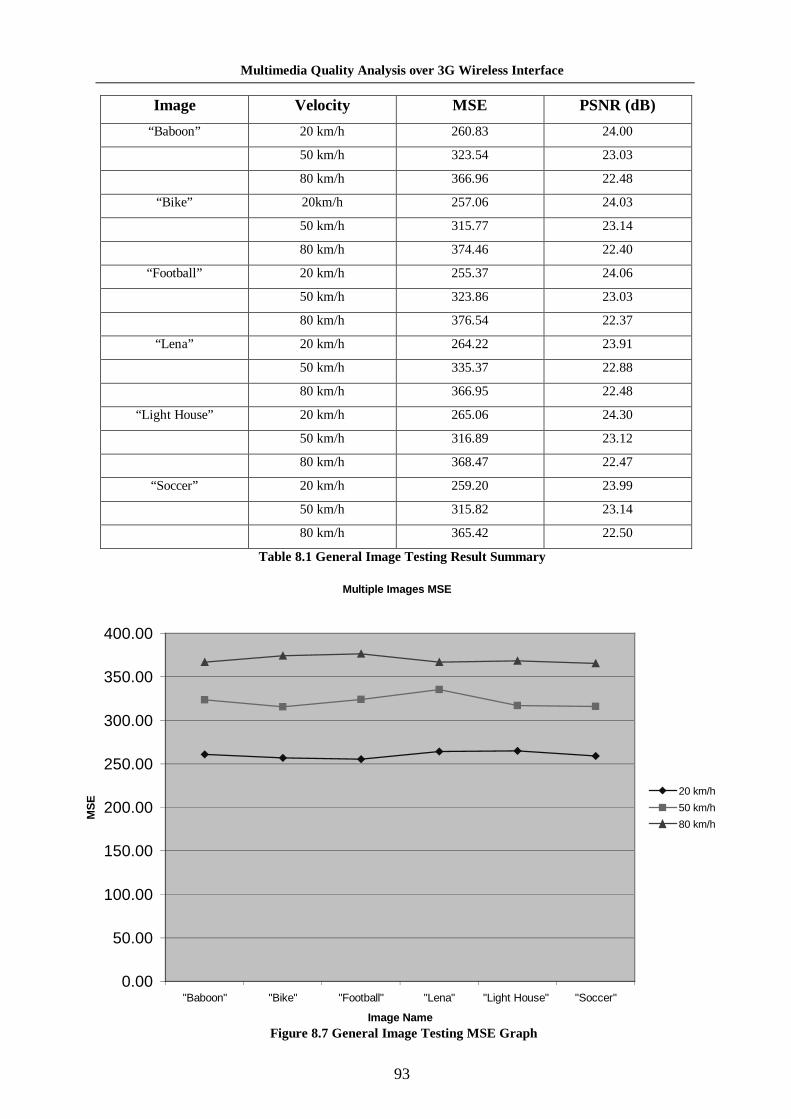
Multimedia Quality Analysis over 3G Wireless Inter face
93
Image Velocity M SE PSNR (dB)
“Baboon” 20 km/h 260.83 24.00
50 km/h 323.54 23.03
80 km/h 366.96 22.48
“Bike” 20km/h 257.06 24.03
50 km/h 315.77 23.14
80 km/h 374.46 22.40
“Football” 20 km/h 255.37 24.06
50 km/h 323.86 23.03
80 km/h 376.54 22.37
“Lena” 20 km/h 264.22 23.91
50 km/h 335.37 22.88
80 km/h 366.95 22.48
“Light House” 20 km/h 265.06 24.30
50 km/h 316.89 23.12
80 km/h 368.47 22.47
“Soccer” 20 km/h 259.20 23.99
50 km/h 315.82 23.14
80 km/h 365.42 22.50
Table 8.1 General Image Testing Result Summary
Figure 8.7 General Image Testing MSE Graph
Multiple Images MSE
0.00
50.00
100.00
150.00
200.00
250.00
300.00
350.00
400.00
"Baboon" "Bike" "Football" "Lena" "Light House" "Soccer"
Image Name
MS
E
20 km/h
50 km/h
80 km/h
Figure 8.7 General Image Testing MSE Graph
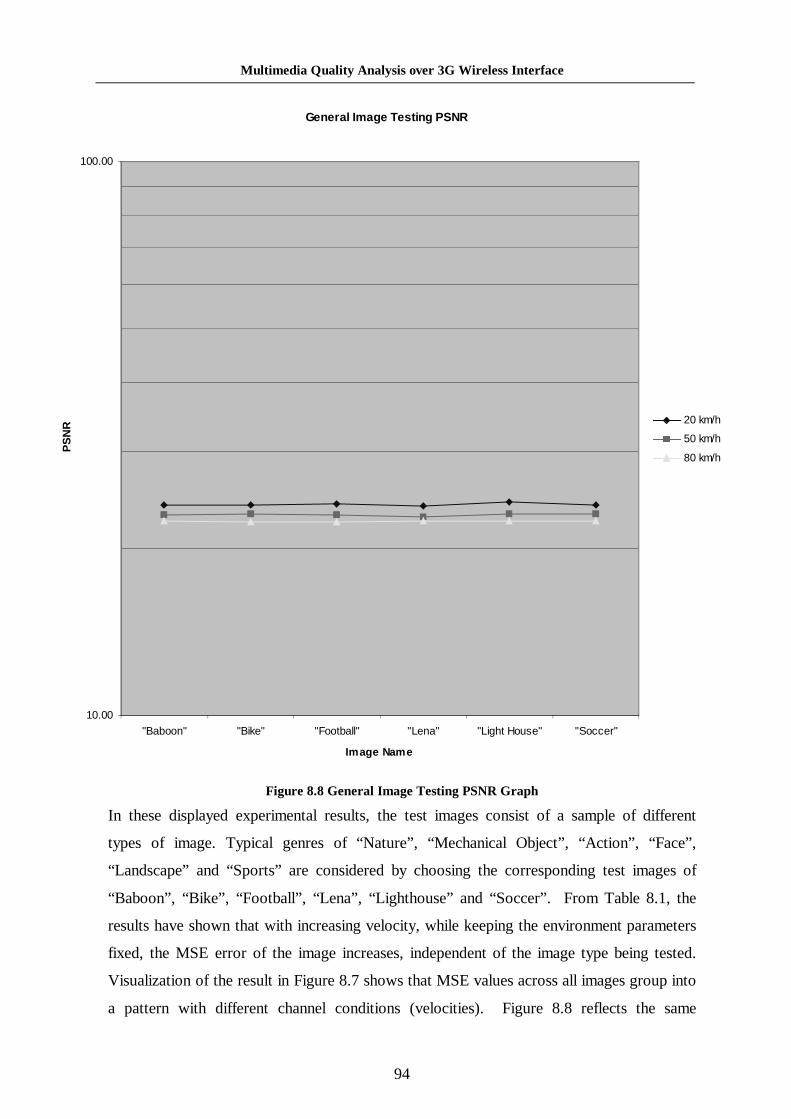
Multimedia Quality Analysis over 3G Wireless Inter face
94
Figure 8.8 General Image Testing PSNR Graph
In these displayed experimental results, the test images consist of a sample of different
types of image. Typical genres of “Nature” , “Mechanical Object” , “Action” , “Face”,
“Landscape” and “Sports” are considered by choosing the corresponding test images of
“Baboon”, “Bike” , “Football” , “Lena”, “Lighthouse” and “Soccer” . From Table 8.1, the
results have shown that with increasing velocity, while keeping the environment parameters
fixed, the MSE error of the image increases, independent of the image type being tested.
Visualization of the result in Figure 8.7 shows that MSE values across all images group into
a pattern with different channel conditions (velocities). Figure 8.8 reflects the same
General Image Testing PSNR
10.00
100.00
"Baboon" "Bike" "Football" "Lena" "Light House" "Soccer"
Im age Nam e
PS
NR 20 km/h
50 km/h
80 km/h
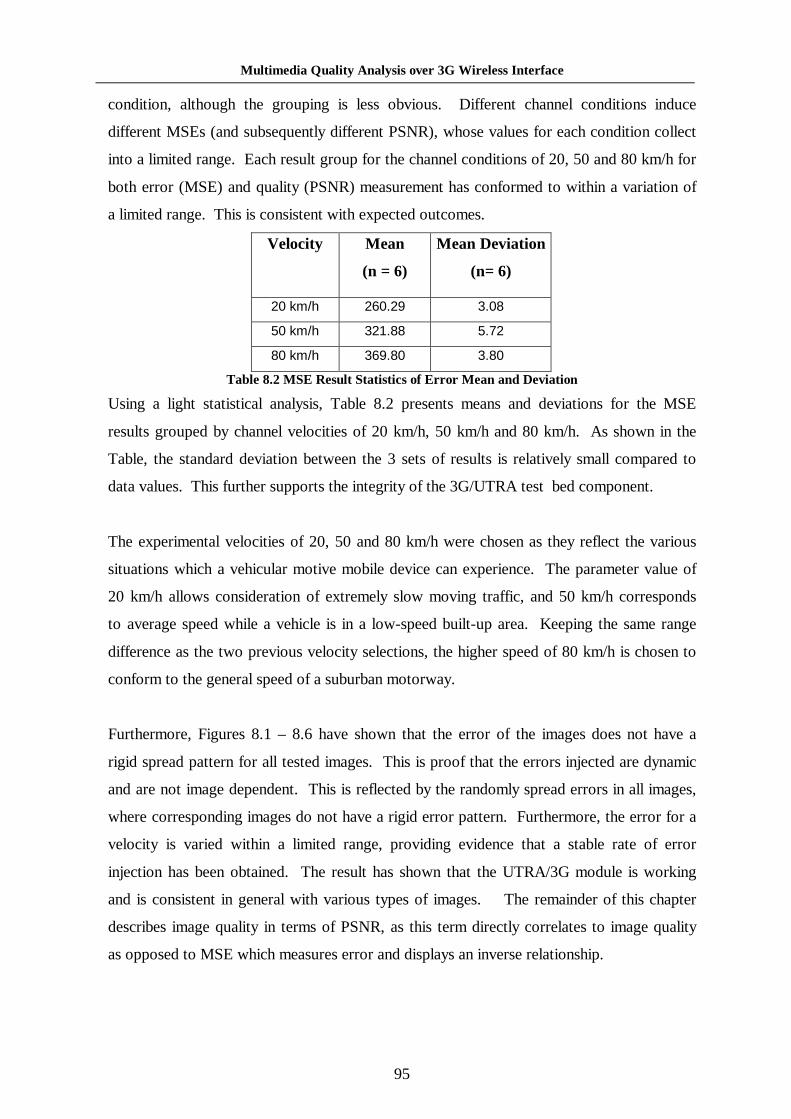
Multimedia Quality Analysis over 3G Wireless Inter face
95
condition, although the grouping is less obvious. Different channel conditions induce
different MSEs (and subsequently different PSNR), whose values for each condition collect
into a limited range. Each result group for the channel conditions of 20, 50 and 80 km/h for
both error (MSE) and quality (PSNR) measurement has conformed to within a variation of
a limited range. This is consistent with expected outcomes.
Velocity M ean
(n = 6)
M ean Deviation
(n= 6)
20 km/h 260.29 3.08
50 km/h 321.88 5.72
80 km/h 369.80 3.80
Table 8.2 MSE Result Statistics of Er ror Mean and Deviation
Using a light statistical analysis, Table 8.2 presents means and deviations for the MSE
results grouped by channel velocities of 20 km/h, 50 km/h and 80 km/h. As shown in the
Table, the standard deviation between the 3 sets of results is relatively small compared to
data values. This further supports the integrity of the 3G/UTRA test bed component.
The experimental velocities of 20, 50 and 80 km/h were chosen as they reflect the various
situations which a vehicular motive mobile device can experience. The parameter value of
20 km/h allows consideration of extremely slow moving traffic, and 50 km/h corresponds
to average speed while a vehicle is in a low-speed built-up area. Keeping the same range
difference as the two previous velocity selections, the higher speed of 80 km/h is chosen to
conform to the general speed of a suburban motorway.
Furthermore, Figures 8.1 – 8.6 have shown that the error of the images does not have a
rigid spread pattern for all tested images. This is proof that the errors injected are dynamic
and are not image dependent. This is reflected by the randomly spread errors in all images,
where corresponding images do not have a rigid error pattern. Furthermore, the error for a
velocity is varied within a limited range, providing evidence that a stable rate of error
injection has been obtained. The result has shown that the UTRA/3G module is working
and is consistent in general with various types of images. The remainder of this chapter
describes image quality in terms of PSNR, as this term directly correlates to image quality
as opposed to MSE which measures error and displays an inverse relationship.

Multimedia Quality Analysis over 3G Wireless Inter face
96
8.1.2 Image Subjected to Variable Environment Parameters and Velocity
This section exposes a fixed image to the six different available environment parameters at
a selected velocity. The chosen test images are “Announcer” and “Football” , as these
images reflect the “News” and “Action” formats respectively. These formats are common
image types in services rendered for UEs. Testing channel condition is fixed with arriving
angle of “75.0 45.0 15.0 –15.0 –45.0 –75.0” , Chip Rate = 3840000, Antenna number = 1,
Antenna Spacing = 0.075 and frame number of 3160. Figure 8.9 (a) shows the original
images while Figures 8.9 (b) to 8.13 illustrate the results. Comparison is done using PSNR
so as to reflect the image quality instead of the error rate.
Figure 8.9 Image “ Announcer ” subjected to Indoor Environment Parameter
(a) Or iginal (b) 0 km/h at Indoor A (c) 0 km/h at Indoor B
Figure 8.9 (b)
PSNR = 40.0 dB
Figure 8.9 (c)
PSNR = 24.72 dB
Figure 8.9 (a)
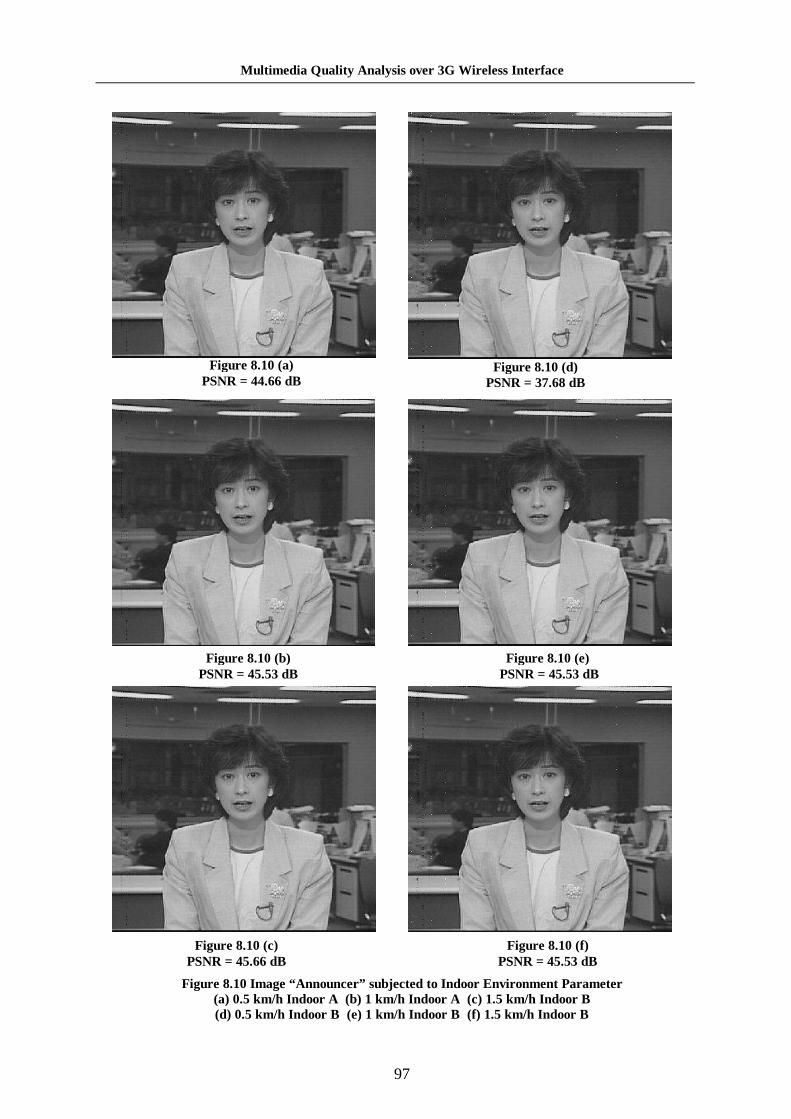
Multimedia Quality Analysis over 3G Wireless Inter face
97
Figure 8.10 (a)
PSNR = 44.66 dB
Figure 8.10 (b) PSNR = 45.53 dB
Figure 8.10 (c) PSNR = 45.66 dB
Figure 8.10 (d) PSNR = 37.68 dB
Figure 8.10 (e) PSNR = 45.53 dB
Figure 8.10 (f) PSNR = 45.53 dB
Figure 8.10 Image “ Announcer ” subjected to Indoor Environment Parameter (a) 0.5 km/h Indoor A (b) 1 km/h Indoor A (c) 1.5 km/h Indoor B (d) 0.5 km/h Indoor B (e) 1 km/h Indoor B (f) 1.5 km/h Indoor B

Multimedia Quality Analysis over 3G Wireless Inter face
98
Figure 8.11 (b) PSNR = 46.08 dB
Figure 8.11 (c) PSNR = 32.14 dB
Figure 8.11 (f) PSNR = 23.34 dB
Figure 8.11 (g) PSNR = 22.89 dB
Figure 8.11 (a)
PSNR = 46.97dB Figure 8.11 (e)
PSNR = 23.26 dB
Multimedia Quality Analysis over 3G Wireless Inter face
99
Figure 8.11 (d)
PSNR = 29.85 dB Figure 8.11 (h)
PSNR =22.51 dB
Figure 8.11 Image “ Announcer ” subjected to Pedestr ian Environment Parameter
(a) 1.5 km/h Pedestr ian A (b) 3 km/h Pedestr ian A (c) 10 km/h Pedestr ian A (d) 20 km/h Pedestr ian A (e) 1.5 km/h Pedestr ian B (f) 3 km/h Pedestr ian B (g) 10 km/h Pedestr ian B (h) 20 km/h Pedestr ian B
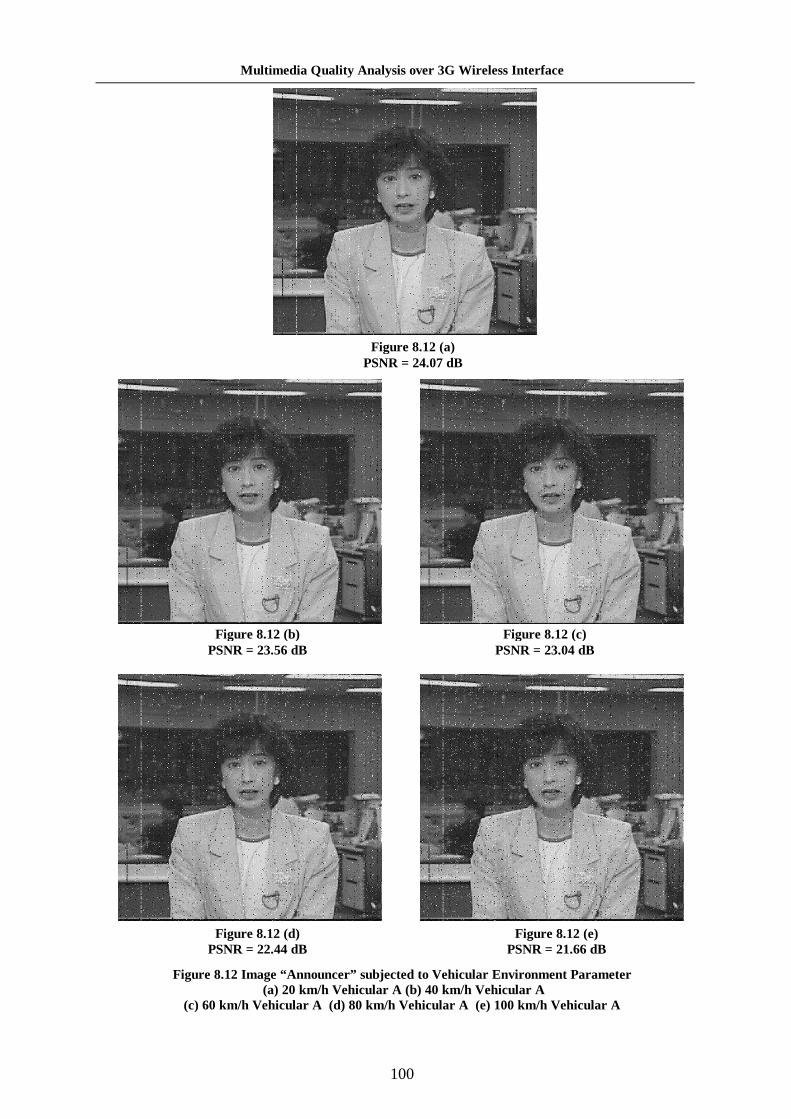
Multimedia Quality Analysis over 3G Wireless Inter face
100
Figure 8.12 (a) PSNR = 24.07 dB
Figure 8.12 (b) PSNR = 23.56 dB
Figure 8.12 (c) PSNR = 23.04 dB
Figure 8.12 (d) PSNR = 22.44 dB
Figure 8.12 (e) PSNR = 21.66 dB
Figure 8.12 Image “ Announcer ” subjected to Vehicular Environment Parameter (a) 20 km/h Vehicular A (b) 40 km/h Vehicular A
(c) 60 km/h Vehicular A (d) 80 km/h Vehicular A (e) 100 km/h Vehicular A

Multimedia Quality Analysis over 3G Wireless Inter face
101
Figure 8.13 (a) PSNR = 27.52 dB
Figure 8.13 (b) PSNR = 26.69 dB
Figure 8.13 (c) PSNR = 25.71 dB
Figure 8.13 (d) PSNR = 24.87 dB
Figure 8.13 (e) PSNR = 23.62 dB
Figure 8.13 Image “ Announcer ” subjected to Vehicular Environment Parameter (a) 20 km/h Vehicular B (b) 40 km/h Vehicular B
(c) 60 km/h Vehicular B (d) 80 km/h Vehicular B (e) 100 km/h Vehicular B
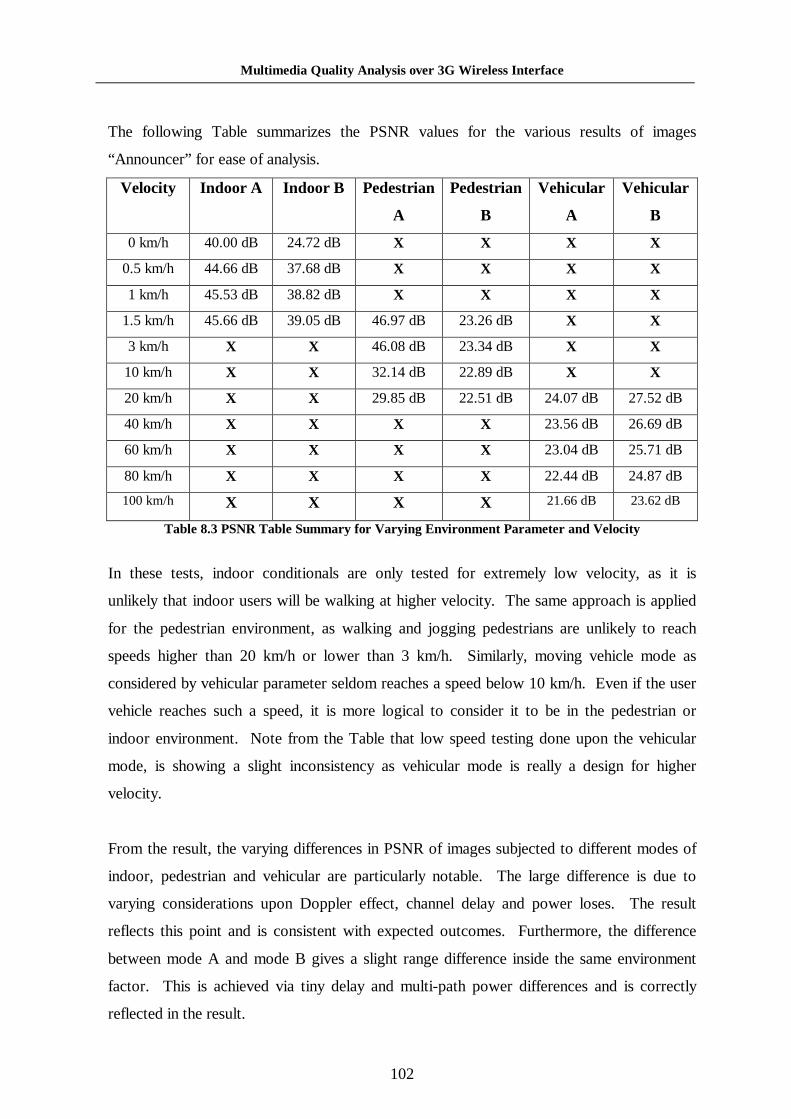
Multimedia Quality Analysis over 3G Wireless Inter face
102
The following Table summarizes the PSNR values for the various results of images
“Announcer” for ease of analysis.
Velocity Indoor A Indoor B Pedestrian
A
Pedestrian
B
Vehicular
A
Vehicular
B
0 km/h 40.00 dB 24.72 dB X X X X
0.5 km/h 44.66 dB 37.68 dB X X X X
1 km/h 45.53 dB 38.82 dB X X X X
1.5 km/h 45.66 dB 39.05 dB 46.97 dB 23.26 dB X X
3 km/h X X 46.08 dB 23.34 dB X X
10 km/h X X 32.14 dB 22.89 dB X X
20 km/h X X 29.85 dB 22.51 dB 24.07 dB 27.52 dB
40 km/h X X X X 23.56 dB 26.69 dB
60 km/h X X X X 23.04 dB 25.71 dB
80 km/h X X X X 22.44 dB 24.87 dB
100 km/h X X X X 21.66 dB 23.62 dB
Table 8.3 PSNR Table Summary for Varying Environment Parameter and Velocity
In these tests, indoor conditionals are only tested for extremely low velocity, as it is
unlikely that indoor users will be walking at higher velocity. The same approach is applied
for the pedestrian environment, as walking and jogging pedestrians are unlikely to reach
speeds higher than 20 km/h or lower than 3 km/h. Similarly, moving vehicle mode as
considered by vehicular parameter seldom reaches a speed below 10 km/h. Even if the user
vehicle reaches such a speed, it is more logical to consider it to be in the pedestrian or
indoor environment. Note from the Table that low speed testing done upon the vehicular
mode, is showing a slight inconsistency as vehicular mode is really a design for higher
velocity.
From the result, the varying differences in PSNR of images subjected to different modes of
indoor, pedestrian and vehicular are particularly notable. The large difference is due to
varying considerations upon Doppler effect, channel delay and power loses. The result
reflects this point and is consistent with expected outcomes. Furthermore, the difference
between mode A and mode B gives a slight range difference inside the same environment
factor. This is achieved via tiny delay and multi-path power differences and is correctly
reflected in the result.

Multimedia Quality Analysis over 3G Wireless Inter face
103
Figure 8.14 (c) PSNR = 24.43 dB
Figure 8.14 (b) PSNR = 39.84 dB
Figure 8.14 (a)
In the suitable range, pedestrian and vehicular modes show degrading quality relative to
increasing velocity. The indoor mode appears inconsistent in this aspect, as higher velocity
yields lower drop in image quality. This phenomenon is explainable as the indoor
environment uses a flat Doppler spectrum and is therefore not as reflective of velocity
changes. Furthermore, the change in velocity is small compared to the range tested upon
other environment parameters. Given that the change in quality is also small, this can be
further explained by changes applied by the dynamic error injection. As shown, although
the indoor environment is not effective to be used for testing of changing velocity, it is still
consistent in reflecting the indoor environment.
The next sets of results shown are for another test image “Football” .
Figure 8.14 Image “ Football” subjected to Indoor Environment Parameter (a) Or iginal (b) 0 km/h Indoor A (c) 0.5 km/h Indoor A

Multimedia Quality Analysis over 3G Wireless Inter face
104
Figure 8.15 (b) PSNR = 42.73 dB
Figure 8.15 (c) PSNR = 43.78 dB
Figure 8.15 (d) PSNR = 36.56 dB
Figure 8.15 (e) PSNR = 37.22 dB
Figure 8.15 (f) PSNR = 37.78 dB
Figure 8.15 (a) PSNR = 43.52 dB
Figure 8.15 Image “ Football” subjected to Indoor Environment Parameter (a) 1 km/h Indoor A (b) 1.5 km/h Indoor A
(c) 0 km/h Indoor B (d) 0.5 km/h Indoor B (e) 1 km/h Indoor B (f) 1.5 km/h Indoor B

Multimedia Quality Analysis over 3G Wireless Inter face
105
Figure 8.16 (b) PSNR = 44.57 dB
Figure 8.16 (c) PSNR = 32.54 dB
Figure 8.16 (f) PSNR = 22.96 dB
Figure 8.16 (g) PSNR = 22.54 dB
Figure 8.16 (a) PSNR = 45.15 dB
Figure 8.16 (e) PSNR = 22.88 dB

Multimedia Quality Analysis over 3G Wireless Inter face
106
Figure 8.16 (d) PSNR = 29.96 dB
Figure 8.16 (h) PSNR = 22.13 dB
Figure 8.16 Image “ Football” subjected to Pedestr ian Environment Parameter
(a) 1.5 km/h Pedestr ian A (b) 3 km/h Pedestr ian A (c) 10 km/h Pedestr ian A (d) 20 km/h Pedestr ian A (e) 1.5 km/h Pedestr ian B (f) 3 km/h Pedestr ian B
(g) 10 km/h Pedestr ian B (h) 20 km/h Pedestr ian B

Multimedia Quality Analysis over 3G Wireless Inter face
107
Figure 8.17 (a) PSNR = 23.85 dB
Figure 8.17 (b) PSNR = 23.33 dB
Figure 8.17 (c) PSNR = 23.03 dB
Figure 8.17 (d) PSNR = 22.41 dB
Figure 8.17 (e) PSNR = 21.55 dB
Figure 8.17 Image “ Football” subjected to Vehicular Environment Parameter
(a) 20 km/h Vehicular A (b) 40 km/h Vehicular A (c) 60 km/h Vehicular A (d) 80 km/h Vehicular A (e) 100 km/h Vehicular A

Multimedia Quality Analysis over 3G Wireless Inter face
108
Figure 8.18 (a) PSNR = 27.48 dB
Figure 8.18 (b) PSNR = 26.50 dB
Figure 8.18 (c) PSNR = 25.04 dB
Figure 8.18 (d) PSNR = 24.97 dB
Figure 8.18 (e) PSNR = 23.57 dB
Figure 8.18 Image “ Football” subjected to Vehicular Environment Parameter (a) 20 km/h Vehicular B (b) 40 km/h Vehicular B
(c) 60 km/h Vehicular B (d) 80 km/h Vehicular B (e) 100 km/h Vehicular B
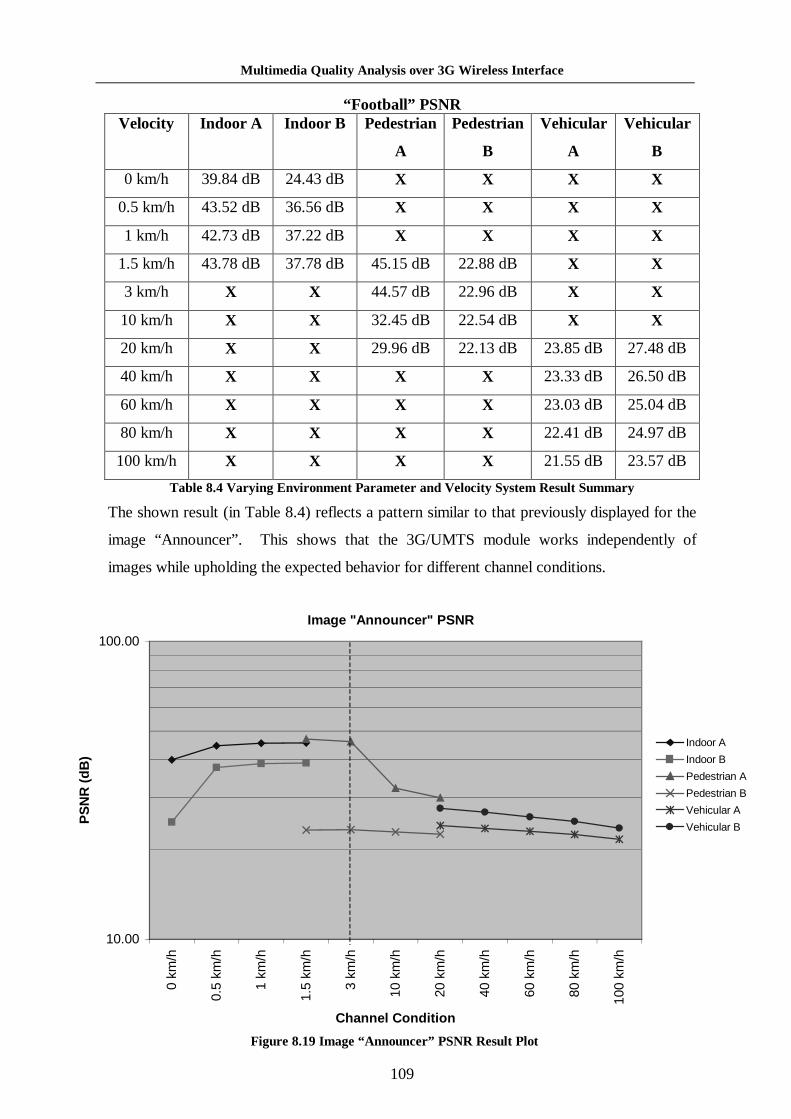
Multimedia Quality Analysis over 3G Wireless Inter face
109
“ Football” PSNR Velocity Indoor A Indoor B Pedestrian
A
Pedestrian
B
Vehicular
A
Vehicular
B
0 km/h 39.84 dB 24.43 dB X X X X
0.5 km/h 43.52 dB 36.56 dB X X X X
1 km/h 42.73 dB 37.22 dB X X X X
1.5 km/h 43.78 dB 37.78 dB 45.15 dB 22.88 dB X X
3 km/h X X 44.57 dB 22.96 dB X X
10 km/h X X 32.45 dB 22.54 dB X X
20 km/h X X 29.96 dB 22.13 dB 23.85 dB 27.48 dB
40 km/h X X X X 23.33 dB 26.50 dB
60 km/h X X X X 23.03 dB 25.04 dB
80 km/h X X X X 22.41 dB 24.97 dB
100 km/h X X X X 21.55 dB 23.57 dB
Table 8.4 Varying Environment Parameter and Velocity System Result Summary
The shown result (in Table 8.4) reflects a pattern similar to that previously displayed for the
image “Announcer” . This shows that the 3G/UMTS module works independently of
images while upholding the expected behavior for different channel conditions.
Figure 8.19 Image “announcer” PSNR Result Plot
Image "Announcer" PSNR
10.00
100.00
0 km
/h
0.5
km/h
1 km
/h
1.5
km/h
3 km
/h
10 k
m/h
20 k
m/h
40 k
m/h
60 k
m/h
80 k
m/h
100
km/h
Channel Condition
PS
NR
(d
B)
Indoor A
Indoor B
Pedestrian A
Pedestrian B
Vehicular A
Vehicular B
Figure 8.19 Image “ Announcer ” PSNR Result Plot

Multimedia Quality Analysis over 3G Wireless Inter face
110
Image "Football" PSNR
10.00
100.00
0 km
/h
0.5
km/h
1 km
/h
1.5
km/h
3 km
/h
10 k
m/h
20 k
m/h
40 k
m/h
60 k
m/h
80 k
m/h
100
km/h
Channel Condition
PS
NR
(d
B)
Indoor A
Indoor B
Pedestrian A
Pedestrian B
Vehicular A
Vehicular B
Figure 8.20 Image “ Football” PSNR Result Plot
Figures 8.19 and 8.20 show the PSNR measurement graphically for the two sets of results.
From the pattern displayed, one can see that channel conditions A and B cause different
data loss. This is due to the designed small variation inside a major channel condition to
allow simulation of a slightly different case of the same class of channel condition (the
major channel condition parameters are described in Chapter 6). Note that the horizontal
axis of the plot shown is not displayed in a linear manner, and shows the result in a clearer
manner. A dashed line is placed in all velocity-associated graphs to visually disassociate
the two horizontal linear scales.
Note that Pedestrian A quality drops sharply after 3 km/h due to its design having a
stronger Doppler effect which experiences large loss at low speeds. Another anomaly lies
in the result for 0 km/h as it yields a somewhat higher error than expected. This is because
the system is not designed for simulating stationary conditions, and the channel condition
simulator injects more errors than is intended for conditions lower than about 0.03 km/h.

Multimedia Quality Analysis over 3G Wireless Inter face
111
This phenomenon is cause by the channel simulator (Figure 6.5) component, which was
provided by ADS “as is” and cannot be modified by the user.
The remainder of results have a flat role off relative to the higher velocity, which is within
expectation. Note also that in parameter A of both sets of results, the three major channel
groups form an almost seamless display, showing the gradual reduction of image data
quality with increasing velocity. However, this is not reflected in parameter B. This
behavior can be explained by Pedestrian B channel condition taking into account more
extreme environment loss factors that are not in universal conformance with parameter B of
the other two groups. Furthermore, velocity 1.5 km/h shows that the Pedestrian model
starts to loose convergence. This is expected as the model starts to input velocity that is
lightly outside its normal lower boundary.
Selection of only 2 images for testing in the general velocity/environmental parameter
section is due to the large amount of processing needed and is not within the time limit of
the author. Furthermore, the two images have extremely different properties that provide a
large range visual diversity for this test and in further testing later.
This section demonstrates that the 3G test bed module is able to dynamically induce a
controlled level of noise onto the input image media. Subsequently, the images are exposed
to channel conditioned controlled error that increases with increasing velocity and different
environment parameters. Figures 8.18 and 8.19 have demonstrated that a consistent pattern
of error rate is achieved with different images and different runs of the images. The range
of image result has verified that the error patterns do not fixate at the same pixels, providing
a rate-controlled spreading error with randomized error placing. A and B sets of parameters
provide a different rate of error conditions for different considerations of channel condition.
Overall, individual environmental parameters effectively reflect the environment condition
it emulates. When used in the proper range, the changing velocity yielded expected drop in
quality correctly. The UTRA/3G module environment and velocity variable is working and
is consistent with expected outcomes.

Multimedia Quality Analysis over 3G Wireless Inter face
112
8.1.3 Image Subjected to Variable Arriving Angle This section presents the result of varying channel path arriving angle. The environmen-tal
parameters are fixed at 3 km/h at Pedestrian A. The results are presented below.
Figure 8.21 Image “ Announcer ” Subjected to Different Ar r iving Angle
Figure 8.21 (a) Figure 8.21 (b)
Figure 8.21 (c) Figure 8.21 (d)
Figure 8.21 (e)
Figure 8.21 (a) Figure 8.21 (b)
Figure 8.21 (c) Figure 8.21 (d)
Figure 8.21 (e)
(a) “ 75.0 45.0 15.0 –15.0 –45.0 –75.0” (b) “ 75.0 30.0 15.0 –15.0 –30.0 –75.0” (c) “ 60.0 30.0 15.0 –15.0 –30.0 –60.0” (d) “ 50.0, 30.0, 10.0, -10.0, -30.0, -50.0” (e) “ 80.0, 40.0, 20.0, -20.0, -40.0, -80.0”
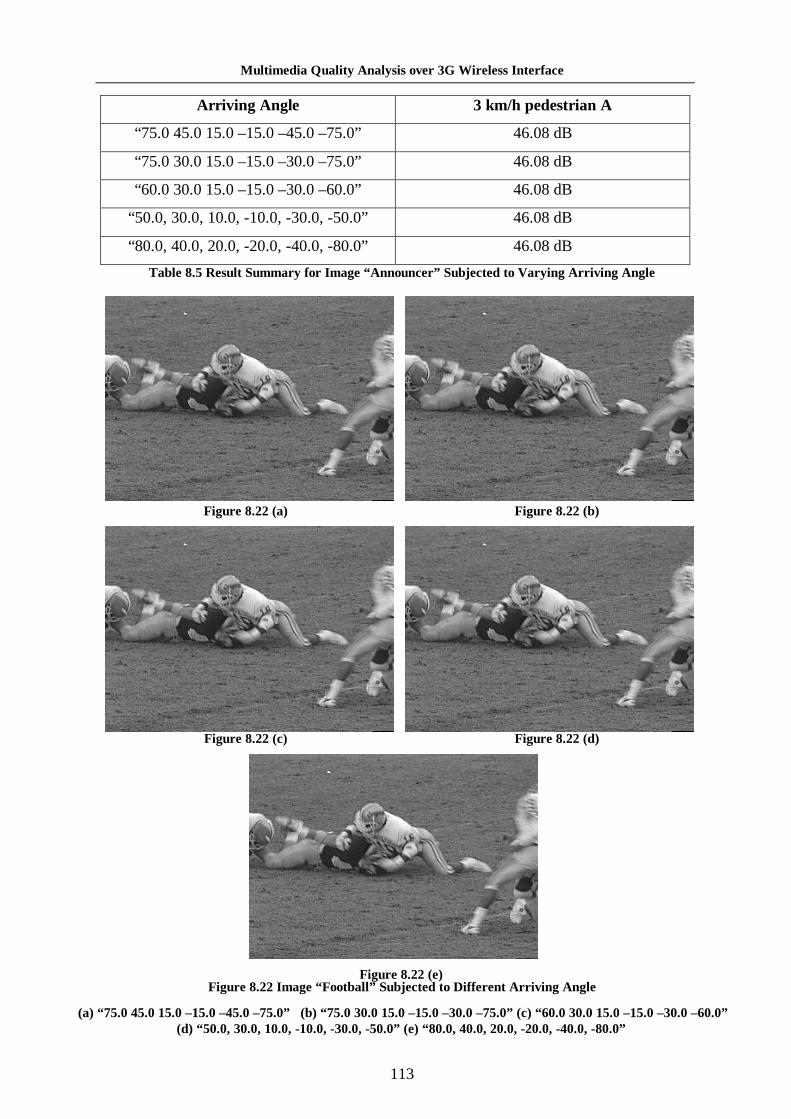
Multimedia Quality Analysis over 3G Wireless Inter face
113
Arriving Angle 3 km/h pedestrian A
“75.0 45.0 15.0 –15.0 –45.0 –75.0” 46.08 dB
“75.0 30.0 15.0 –15.0 –30.0 –75.0” 46.08 dB
“60.0 30.0 15.0 –15.0 –30.0 –60.0” 46.08 dB
“50.0, 30.0, 10.0, -10.0, -30.0, -50.0” 46.08 dB
“80.0, 40.0, 20.0, -20.0, -40.0, -80.0” 46.08 dB
Table 8.5 Result Summary for Image “ Announcer ” Subjected to Varying Ar r iving Angle
Figure 8.22 Image “ Football” Subjected to Different Ar r iving Angle
Figure 8.22 (a) Figure 8.22 (b)
Figure 8.22 (c) Figure 8.22 (d)
Figure 8.22 (e)
(a) “ 75.0 45.0 15.0 –15.0 –45.0 –75.0” (b) “ 75.0 30.0 15.0 –15.0 –30.0 –75.0” (c) “ 60.0 30.0 15.0 –15.0 –30.0 –60.0”
(d) “ 50.0, 30.0, 10.0, -10.0, -30.0, -50.0” (e) “ 80.0, 40.0, 20.0, -20.0, -40.0, -80.0”

Multimedia Quality Analysis over 3G Wireless Inter face
114
Arriving Angle 3 km/h pedestrian A
“75.0 45.0 15.0 –15.0 –45.0 –75.0” 44.57 dB
“75.0 30.0 15.0 –15.0 –30.0 –75.0” 44.57 dB
“60.0 30.0 15.0 –15.0 –30.0 –60.0” 44.57 dB
“50.0, 30.0, 10.0, -10.0, -30.0, -50.0” 44.57 dB
“80.0, 40.0, 20.0, -20.0, -40.0, -80.0” 44.57 dB
Table 8.6 Result Summary for Image “ Football” Subjected to Varying Ar r iving Angle
The result shows a minimal change in image quality yield by changes in the arriving angle.
This is within expectations, as the internal Rake receiver in UE compensates for distortion
brought about by the change in arriving angles. The varied error rate in the image
“Announcer” is accountable by the dynamic variation of the losses in the component that
simulates the physical channel condition. Note that although subjected to the same
condition, both images show slightly different PSNR results. This is expected, as dynamic
error rate conditioning is applied. Arriving angles (e.g. “75.0 45.0 15.0 –15.0 –45.0 –75.0”)
described here are elevation and azimuth angles of multi-path echo, for calculating directive
gain of receiving linear antenna array. This is the ADS approach to simulate an antenna
array of a receiving device [74]. The channel simulator produces variation in results
relative to changes in the parameters. However the difference is too small to be reflected in
the result pictures and quality measurements shown. These results are directly influenced
by the method of calculating antenna directive gain in the channel simulator, which is rigid
and unchangeable by the user as mentioned previously.
This ends the section on varying arriving angle testing and also ends the section on
individual testing of the UTRA/3G test bed module. In summary, the UTRA/3G test bed is
shown to be working and produces results that are logically consistent with usage within
the proper parameter range. Testing presented has affirmed the nature of this module to
simulate 3G channel condition multiple environmental parameter changes, with the
important control over velocity and physical environment selection of Indoor, Pedestrian
and Outdoor. Various images being tested show no evidence of repeated error spread
pattern, suggesting that this module treats input media as a data stream and this makes the
module versatile for any media. A controlled error rate pattern has been obtained, where
stable behavior has been observed.

Multimedia Quality Analysis over 3G Wireless Inter face
115
With the working UTRa/3G test bed module, systematic degradation of input media is
assured and an important part of the objective has been achieved. The next two sections
concentrate on testing of the image quality metrics.
8.2 Image Quality Metric: HVS-Based Fidelity Test Bed Module System Testing This section presents testing of the HVS-based image fidelity system. Various images are
presented with its quality degraded pair to produce PDM which is comparable with the
actual pixel errors. Image impairment is produced by compression using JPEG in Adobe
Photoshop 5.5 at level 5 (medium) quality. Figure 8.23 to 8.29 present the results with the
figure divided into four parts, original, coded, PDM and square error. The original is the
original picture while the coded is the JPEG impaired picture. The PDM is the Perceptual
Distortion Map showing the distribution of perceptual error and the square error is the
squared value of the actual physical error.
Figure 8.23 Image “ Airplane” (a) Or iginal (b) Coded (c) PDM (d) Square Er ror
Figure 8.23 (a)
Figure 8.23 (d)
Figure 8.23 (c)
Figure 8.23 (b)
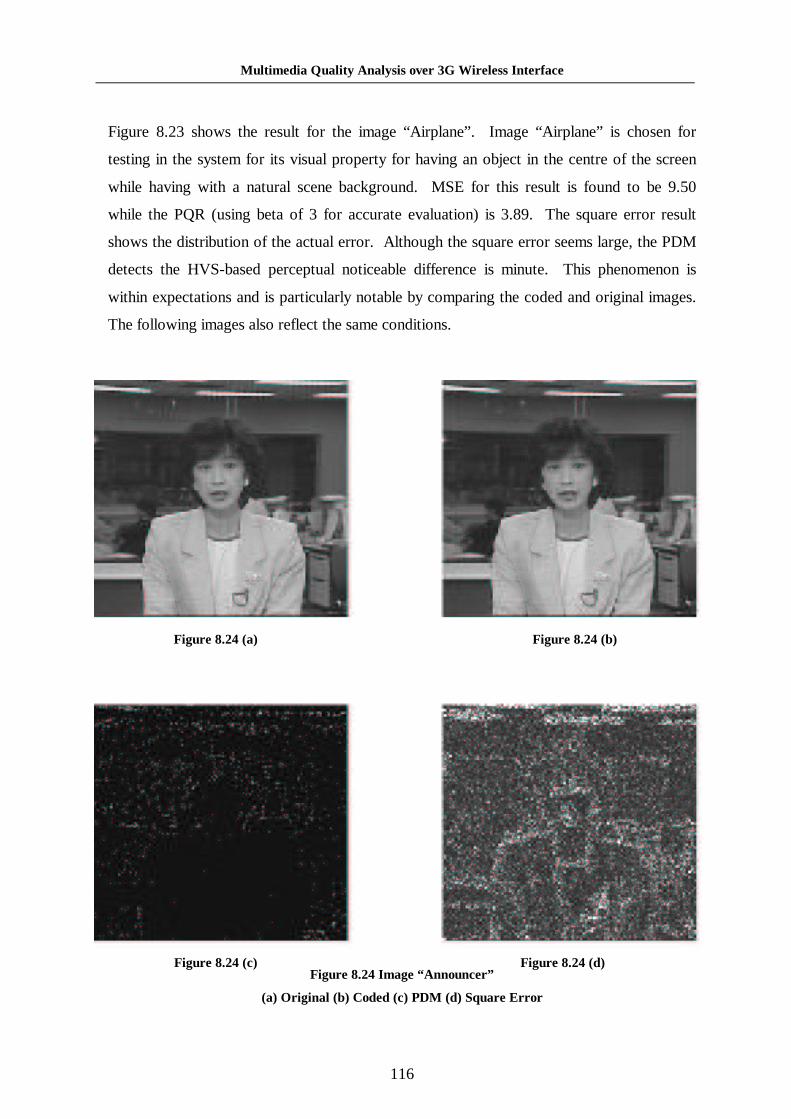
Multimedia Quality Analysis over 3G Wireless Inter face
116
Figure 8.23 shows the result for the image “Airplane”. Image “Airplane” is chosen for
testing in the system for its visual property for having an object in the centre of the screen
while having with a natural scene background. MSE for this result is found to be 9.50
while the PQR (using beta of 3 for accurate evaluation) is 3.89. The square error result
shows the distribution of the actual error. Although the square error seems large, the PDM
detects the HVS-based perceptual noticeable difference is minute. This phenomenon is
within expectations and is particularly notable by comparing the coded and original images.
The following images also reflect the same conditions.
Figure 8.24 Image “ Announcer ”
(a) Or iginal (b) Coded (c) PDM (d) Square Er ror
Figure 8.24 (a)
Figure 8.24 (d)
Figure 8.24 (c)
Figure 8.24 (b)

Multimedia Quality Analysis over 3G Wireless Inter face
117
Figure 8.25 (a)
Figure 8.25 (d)
Figure 8.25 (c)
Figure 8.25 (b)
Figure 8.24 shows the result for the image “Announcer” image. “Announcer” is chosen for
testing in the system for its visual property of reflecting the common media of “news”,
having a human subject as the main visual attractor. MSE for this result is found to be 8.32
while the PQR is 3.48.
Figure 8.25 Image “ Baboon”
(a) Or iginal (b) Coded (c) PDM (d) Square Er ror
Figure 8.25 shows the result for the image “Baboon”. Image “Baboon” is chosen for its
visual property of having both a uniform texture (nose) as well as non-texture (fur) surface
in the same image. Note that the PDM reflects the error in the nose error but has less error
within the fur area, which is consistent with the design. MSE for this result is found to be
42.65 while the PQR is 3.89. Note that the MSE is much higher than the corresponding
value in “announcer” , but both results have the same PQR value. This confirms the
expected condition that MSE does not directly correspond to the PQR value.
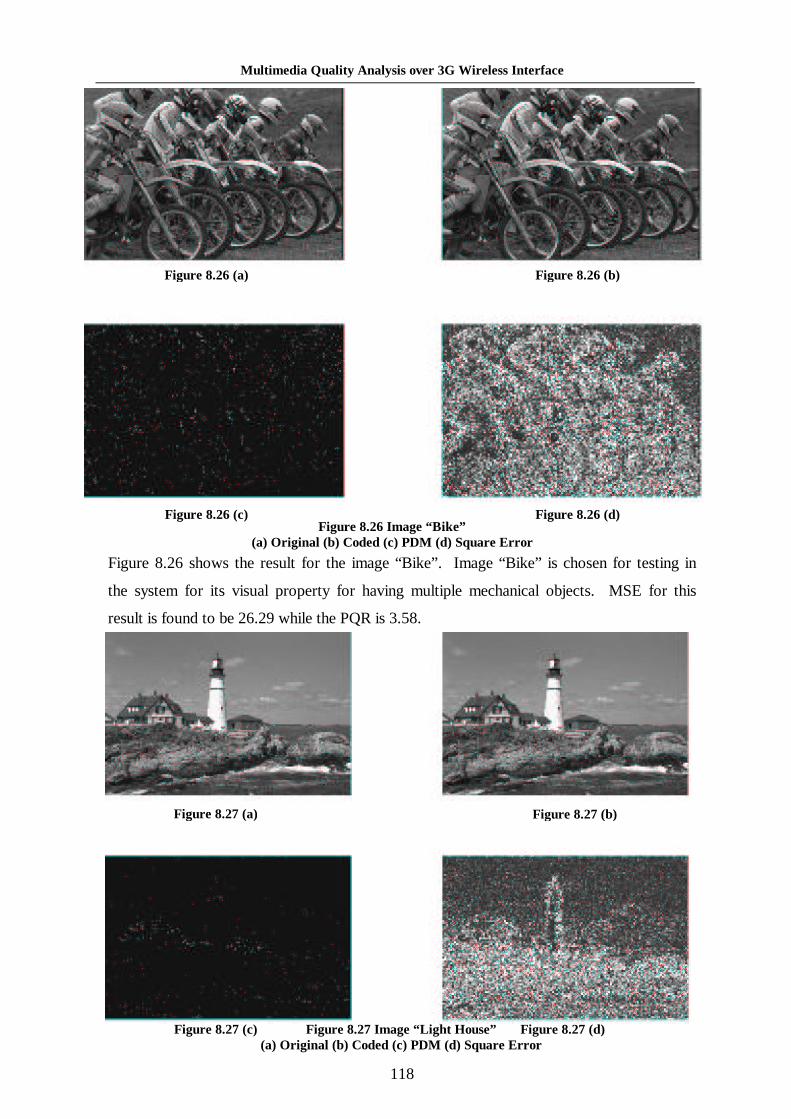
Multimedia Quality Analysis over 3G Wireless Inter face
118
Figure 8.26 Image “Bike”
Figure 8.26 shows the result for the image “Bike” . Image “Bike” is chosen for testing in
the system for its visual property for having multiple mechanical objects. MSE for this
result is found to be 26.29 while the PQR is 3.58.
Figure 8.27 Image “Light House”
Figure 8.26 (a)
Figure 8.26 (d)
Figure 8.26 (c)
Figure 8.26 (b)
Figure 8.26 Image “ Bike” (a) Or iginal (b) Coded (c) PDM (d) Square Er ror
Figure 8.27 (a)
Figure 8.27 (d)
Figure 8.27 (c)
Figure 8.27 (b)
Figure 8.27 Image “ L ight House” (a) Or iginal (b) Coded (c) PDM (d) Square Er ror
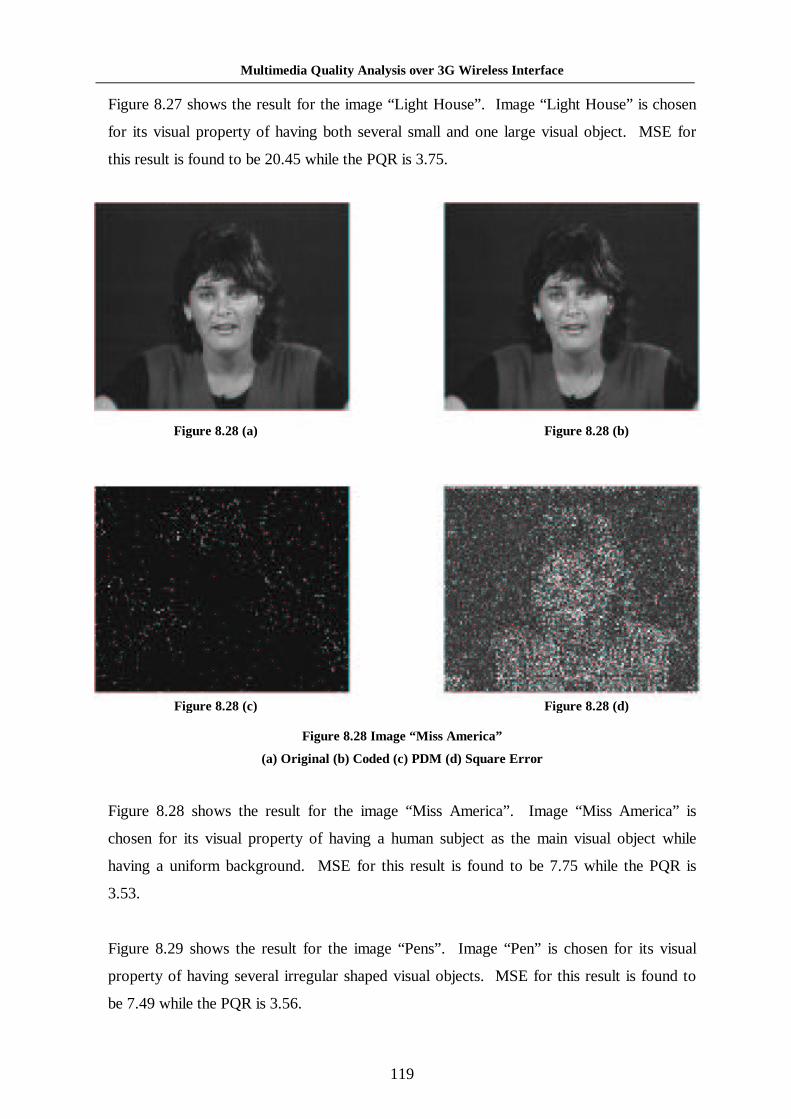
Multimedia Quality Analysis over 3G Wireless Inter face
119
Figure 8.28 (a)
Figure 8.28 (d)
Figure 8.28 (c)
Figure 8.28 (b)
Figure 8.27 shows the result for the image “Light House”. Image “Light House” is chosen
for its visual property of having both several small and one large visual object. MSE for
this result is found to be 20.45 while the PQR is 3.75.
Figure 8.28 Image “ Miss Amer ica”
(a) Or iginal (b) Coded (c) PDM (d) Square Er ror
Figure 8.28 shows the result for the image “Miss America” . Image “Miss America” is
chosen for its visual property of having a human subject as the main visual object while
having a uniform background. MSE for this result is found to be 7.75 while the PQR is
3.53.
Figure 8.29 shows the result for the image “Pens”. Image “Pen” is chosen for its visual
property of having several irregular shaped visual objects. MSE for this result is found to
be 7.49 while the PQR is 3.56.
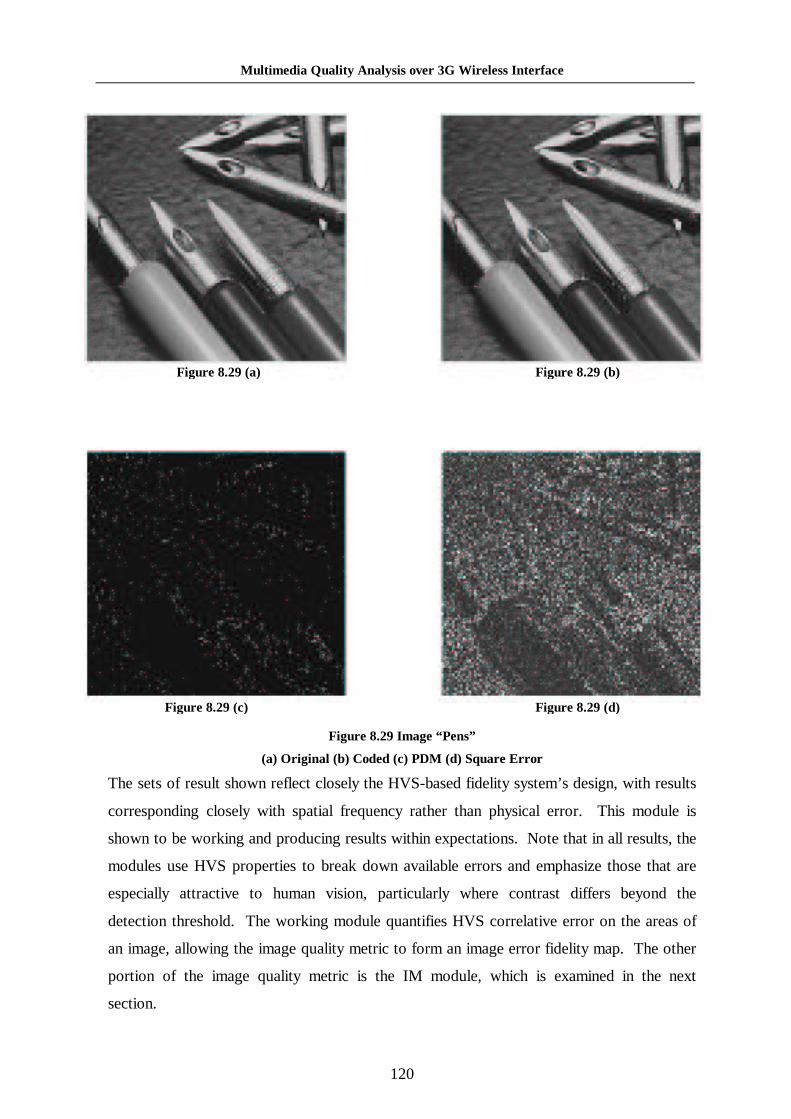
Multimedia Quality Analysis over 3G Wireless Inter face
120
Figure 8.29 (a)
Figure 8.29 (d)
Figure 8.29 (c)
Figure 8.29 (b)
Figure 8.29 Image “ Pens” (a) Or iginal (b) Coded (c) PDM (d) Square Er ror
The sets of result shown reflect closely the HVS-based fidelity system’s design, with results
corresponding closely with spatial frequency rather than physical error. This module is
shown to be working and producing results within expectations. Note that in all results, the
modules use HVS properties to break down available errors and emphasize those that are
especially attractive to human vision, particularly where contrast differs beyond the
detection threshold. The working module quantifies HVS correlative error on the areas of
an image, allowing the image quality metric to form an image error fidelity map. The other
portion of the image quality metric is the IM module, which is examined in the next
section.

Multimedia Quality Analysis over 3G Wireless Inter face
121
8.3 Image Quality Metric: Importance Map Test Bed Module System Testing
This section presents the importance map results for the same set of images as in the
previous section. Note that 7 images are presented for each set of results including the
original. The others are background/foreground (border) importance; centre importance;
contrast importance, shape importance, size importance and the final importance map.
Note that lighter/brighter areas imply higher importance.
Figure 8.30 Or iginal Images Par t I
Figure 8.30 (a) “ Airplane” Figure 8.30 (b) “ Announcer ”
Figure 8.30 (c) “ Baboon”

Multimedia Quality Analysis over 3G Wireless Inter face
122
Figure 8.31 Or iginal Images Par t I I
Figure 8.31 (a) “ Bike”
Figure 8.31 (b) “ L ight House”
Figure 8.31 (c) “ Miss Amer ica” Figure 8.31 (d) “ Pens”

Multimedia Quality Analysis over 3G Wireless Inter face
123
Figure 8.32 Image “ Airplane” (a) Border (b) Centre (c) Contrast (d) Shape (e) Size (f) Summation IM
Figure 8.32 (a) Figure 8.32 (b)
Figure 8.32 (c)
Figure 8.32 (e)
Figure 8.32 (d)
Figure 8.32 (f)

Multimedia Quality Analysis over 3G Wireless Inter face
124
Figure 8.33 (a) Figure 8.33 (b)
Figure 8.33 (c) Figure 8.33 (d)
Figure 8.33 (e) Figure 8.33 (f)
Figure 8.33 Image “ Announcer ” (a) Border (b) Centre (c) Contrast (d) Shape (e) Size (f) Impor tance Map
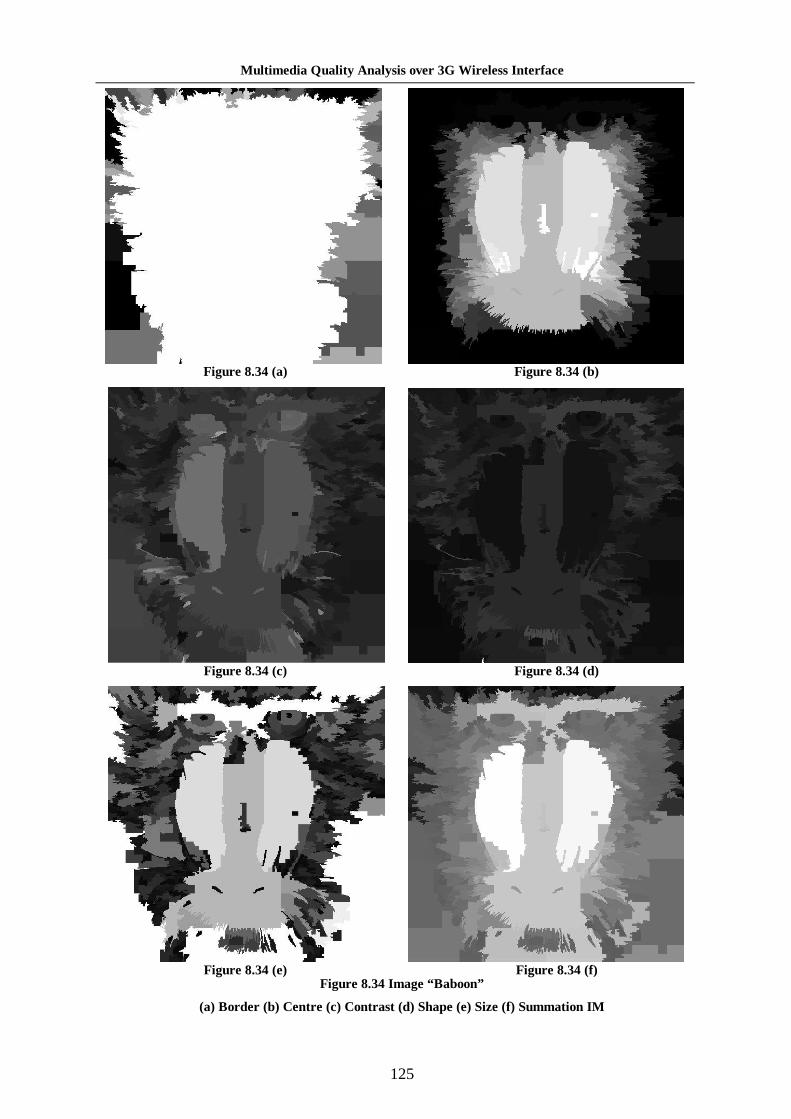
Multimedia Quality Analysis over 3G Wireless Inter face
125
Figure 8.34 (a) Figure 8.34 (b)
Figure 8.34 (c) Figure 8.34 (d)
Figure 8.34 (e) Figure 8.34 (f)
Figure 8.34 Image “ Baboon” (a) Border (b) Centre (c) Contrast (d) Shape (e) Size (f) Summation IM
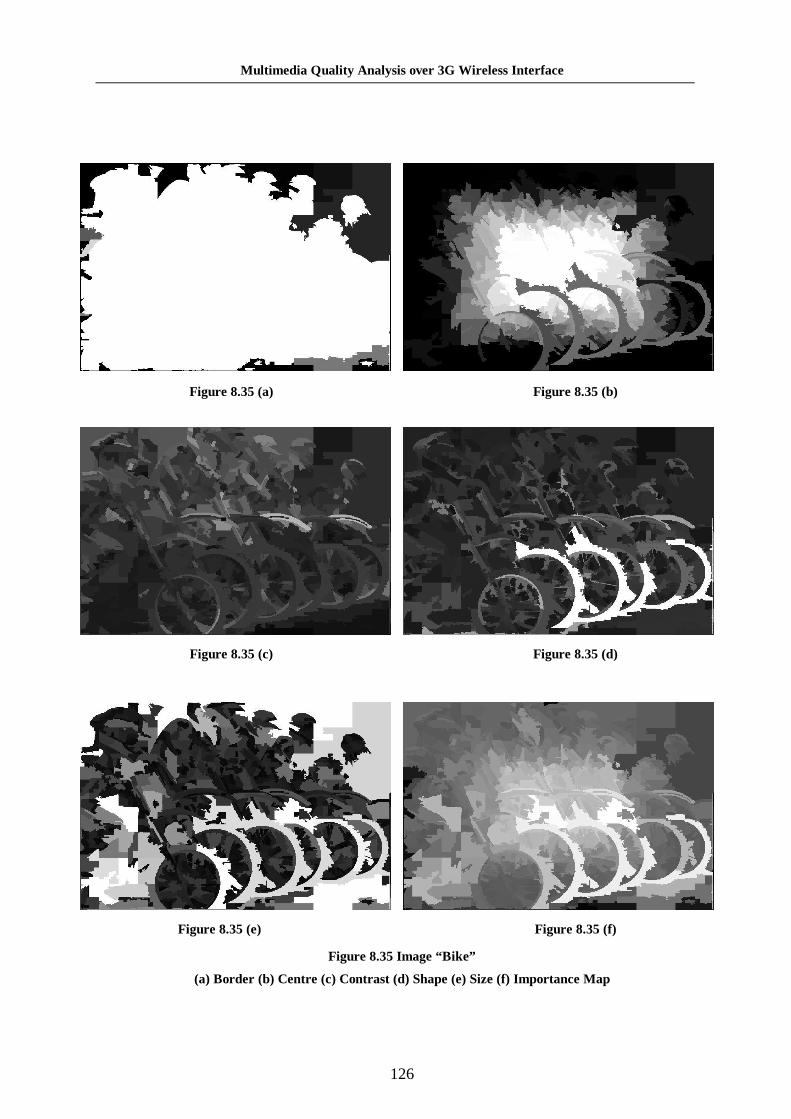
Multimedia Quality Analysis over 3G Wireless Inter face
126
Figure 8.35 (a)
Figure 8.35 (f) Figure 8.35 (e)
Figure 8.35 (d)
Figure 8.35 (b)
Figure 8.35 (c)
Figure 8.35 Image “ Bike” (a) Border (b) Centre (c) Contrast (d) Shape (e) Size (f) Impor tance Map

Multimedia Quality Analysis over 3G Wireless Inter face
127
Figure 8.36 (a) Figure 8.36 (b)
Figure 8.36 (c) Figure 8.36 (d)
Figure 8.36 (e) Figure 8.36 (f)
Figure 8.36 Image “ L ight House” (a) Border (b) Centre (c) Contrast (d) Shape (e) Size (f) Summation IM
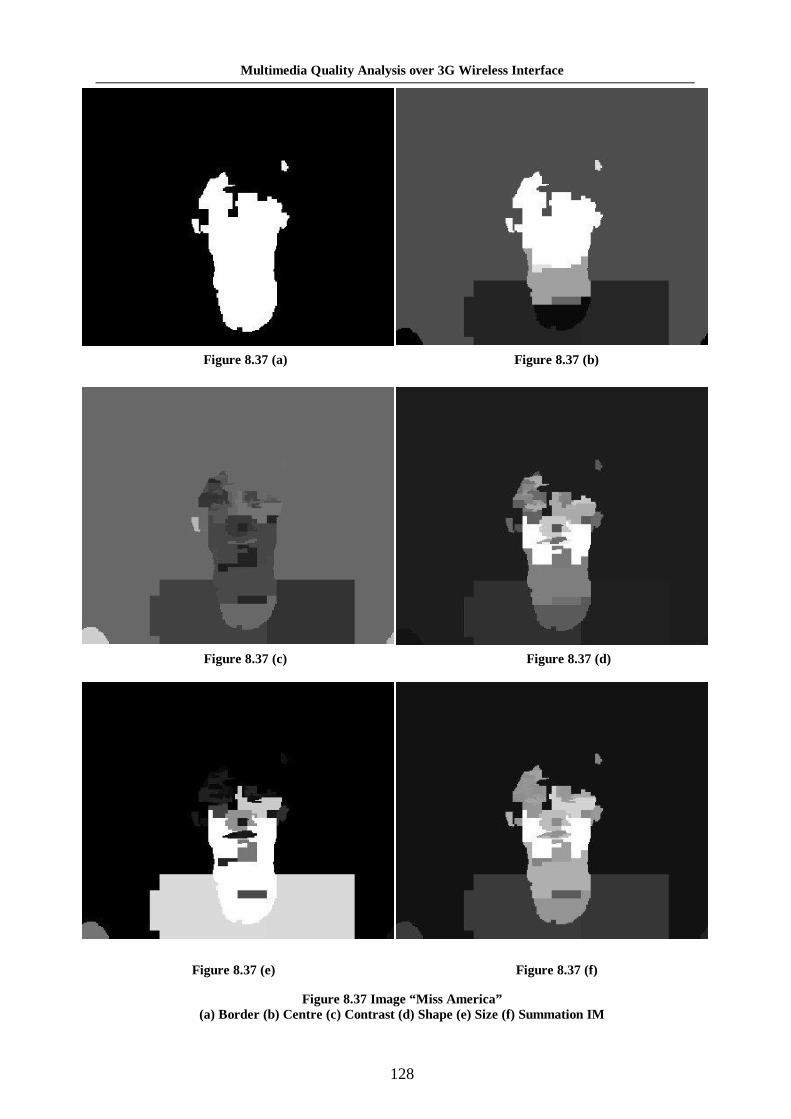
Multimedia Quality Analysis over 3G Wireless Inter face
128
Figure 8.37 (a) Figure 8.37 (b)
Figure 8.37 (c) Figure 8.37 (d)
Figure 8.37 (e) Figure 8.37 (f)
Figure 8.37 Image “ Miss Amer ica”
(a) Border (b) Centre (c) Contrast (d) Shape (e) Size (f) Summation IM

Multimedia Quality Analysis over 3G Wireless Inter face
129
Figure 8.38 Image “Pens”
Figure 8.38 Image “ Pens” (a) Or iginal (b) Border (c) Centre (d) Contrast (e) Shape (f) Size (g) Impor tance Map
Figure 8.38 (e) Figure 8.38 (f)
Figure 8.38 (a) Figure 8.38 (b)
Figure 8.38 (c) Figure 8.38 (d)

Multimedia Quality Analysis over 3G Wireless Inter face
130
This ends the section on the individual testing system of the importance map. As shown,
the system is working and the result is consistent with system design. Individual results are
in direct correspondence to the importance factors of border, centre, contrast, shape and
size as tested by visual inspection. All importance maps correspond reasonably well with
theories outlined in Chapter 4.
Special note is taken here with the IM for contrast and shape factors, where its
correspondence to the stated factors is not as clearly visible as the other 3 factors. Note
from the contrast IM that the spread of the importance representation is relatively low, as
the majority of the image is in dark gray scale. Note that contrast is an important
calculation, for a region is based on the difference in average contrast of a region to its
neighboring region, then this is relatively scaled to form the IM. Hence, in each contrast of
the IMs shown, the lightest color patch represents the region with the highest contrast
importance, and this is followed through to the darkest color which represents the lowest
relative importance. The contrast IMs have relatively lower importance distributions, this
phenomenon is caused by the few high contrast areas with values that are higher than the
rest. This explanation is also applicable to shape importance, where the majority of an
image region’s shape importance rating is lower than average as brought down by the
region with a high peak importance.
Illustrated here is a diversity of image importance maps, where different factors in different
images construct a range of very different IMs. The influencing factors are illustrated
individually with summation into the final IM for usage in the final system. This module
has shown efficient properties of identifying and ranking areas of visual importance, giving
identification of different rate of importance attraction across an image. This will combine
with the HVS fidelity module in the next chapter to form a unison image quality metric.
This ends the chapter on individual system testing. Both modules are working within
design specifications, as shown by the results. Furthermore, the testing of individual
modules has now finished and each of the modules are in working order. The next Chapter
enforces verification testing of the overall system, together with visual media quality
analysis over the 3G radio interface.

Multimedia Quality Analysis over 3G Wireless Inter face
131
Chapter 9. Integrated system testing
This section aims to test the overall system. The system is divided into two sections, with
the system result section illustrating six sets of overall results for the entire test bed, and the
second section listing the result summary for various system results to provide analysis. As
with before, PGM file format is used.
9.1 System Result Five images are presented per set of results in section 9.1, which is original; Received
image from UTRA/3G test bed; the IM of the original image; the PDM and the IPDM of
the received image. All images are subjected to Vehicular A environment parameter with 2
varying speeds of 20 and 50 km/h. Figures 9.1 to 9.7 illustrate the results.
Figure 9.1 (a)
Figure 9.1 (d) Figure 9.1 (c)
Figure 9.1 (b)

Multimedia Quality Analysis over 3G Wireless Inter face
132
Figure 9.1 (e)
Figure 9.1 Image “ Announcer ” (a) Or iginal (b) Received (c) Impor tance Map (d) PDM (e) IPDM
Figure 9.1 illustrates the image “Announcer” which has been analyzed before in this thesis.
This time, the image is subjected to a 50 km/h physical channel. The overall system is used
to process the original, producing the received image, which is then analyzed to produce the
PDM and IPDM. Note that corresponding to the IM, PDM error spread is significantly
reduced to produce IPDM. IPQR is then produced and is presented in the next section. The
following results follow the same presentation format.
Figure 9.2 (b) Figure 9.2 (a)

Multimedia Quality Analysis over 3G Wireless Inter face
133
Figure 9.2 (c) Figure 9.2 (d)
Figure 9.2 (e)
Figure 9.2 Image “ Baboon” (a) Or iginal (b) Received (c) Impor tance Map (d) PDM (e) IPDM
Figure 9.2 presents the result for the image “Baboon”, which is subjected to the physical
channel of 20 km/h.
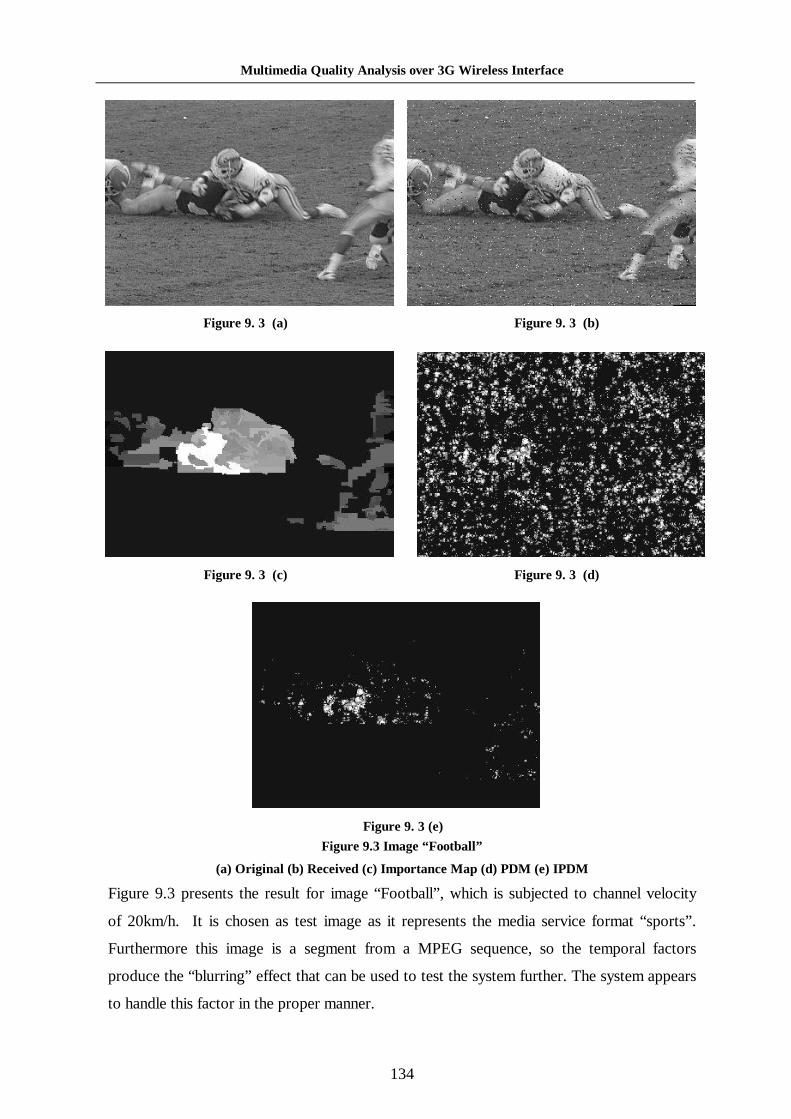
Multimedia Quality Analysis over 3G Wireless Inter face
134
Figure 9. 3 (a) Figure 9. 3 (b)
Figure 9. 3 (c)
Figure 9. 3 (e)
Figure 9. 3 (d)
Figure 9.3 Image “ Football” (a) Or iginal (b) Received (c) Impor tance Map (d) PDM (e) IPDM
Figure 9.3 presents the result for image “Football” , which is subjected to channel velocity
of 20km/h. It is chosen as test image as it represents the media service format “sports” .
Furthermore this image is a segment from a MPEG sequence, so the temporal factors
produce the “blurring” effect that can be used to test the system further. The system appears
to handle this factor in the proper manner.

Multimedia Quality Analysis over 3G Wireless Inter face
135
Figure 9. 4 (b)
Figure 9. 4 (c) Figure 9. 4 (d)
Figure 9. 4 (e)
Figure 9. 4 (a)
Figure 9.4 Image “ Lena” (a) Or iginal (b) Received (c) Impor tance Map (d) PDM (e) IPDM
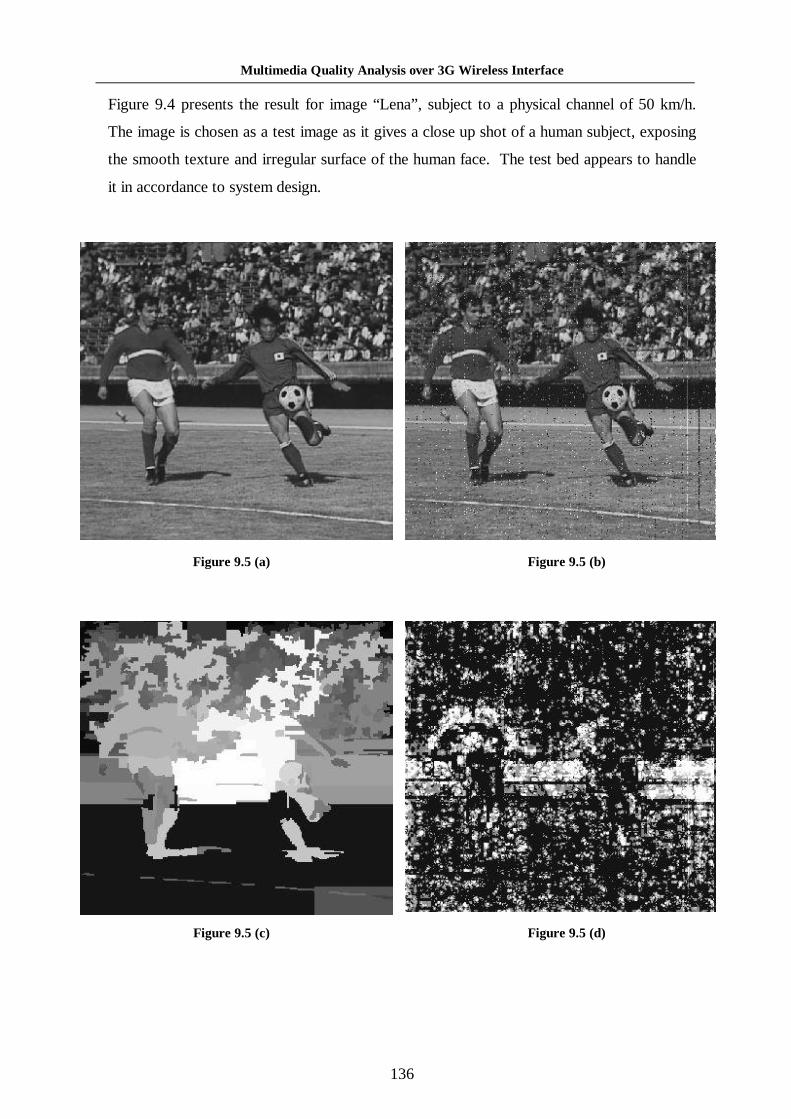
Multimedia Quality Analysis over 3G Wireless Inter face
136
Figure 9.4 presents the result for image “Lena”, subject to a physical channel of 50 km/h.
The image is chosen as a test image as it gives a close up shot of a human subject, exposing
the smooth texture and irregular surface of the human face. The test bed appears to handle
it in accordance to system design.
Figure 9.5 (a) Figure 9.5 (b)
Figure 9.5 (c) Figure 9.5 (d)
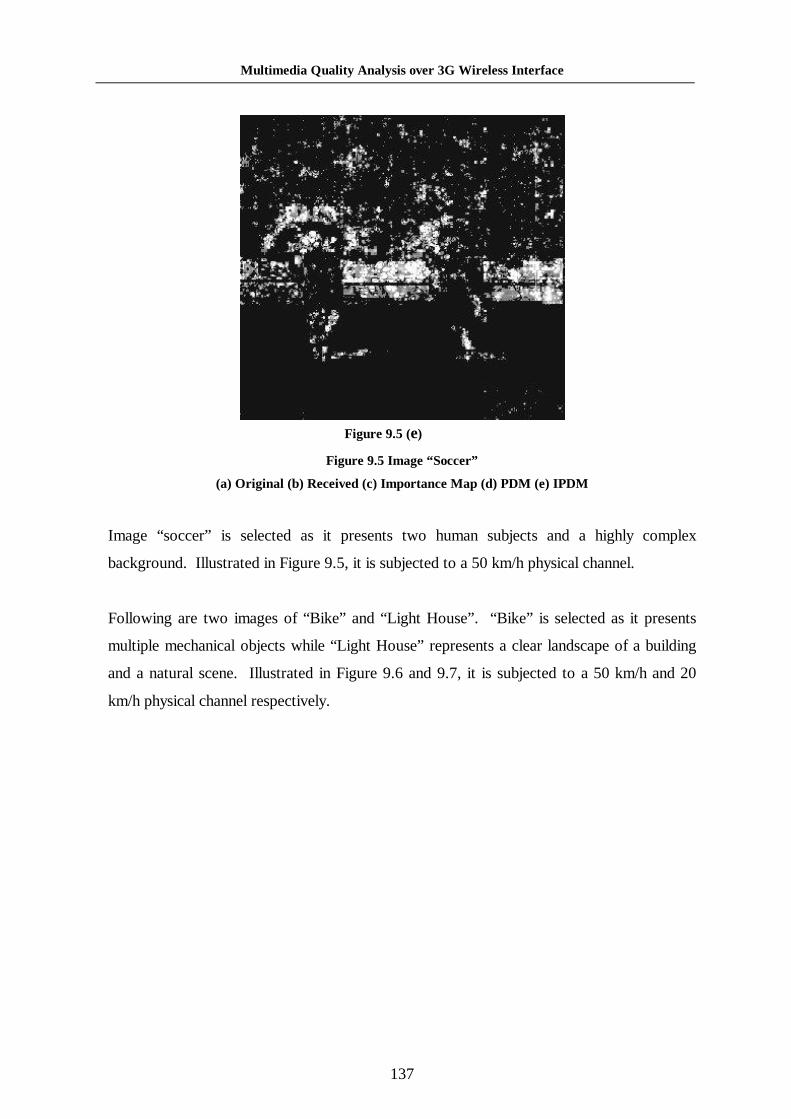
Multimedia Quality Analysis over 3G Wireless Inter face
137
Figure 9.5 (e)
Figure 9.5 Image “ Soccer ” (a) Or iginal (b) Received (c) Impor tance Map (d) PDM (e) IPDM
Image “soccer” is selected as it presents two human subjects and a highly complex
background. Illustrated in Figure 9.5, it is subjected to a 50 km/h physical channel.
Following are two images of “Bike” and “Light House”. “Bike” is selected as it presents
multiple mechanical objects while “Light House” represents a clear landscape of a building
and a natural scene. Illustrated in Figure 9.6 and 9.7, it is subjected to a 50 km/h and 20
km/h physical channel respectively.

Multimedia Quality Analysis over 3G Wireless Inter face
138
Figure 9.6 Image “ Bike”
(a) Or iginal (b) Received (c) Impor tance Map (d) PDM (e) IPDM
Figure 9.6 (c) Figure 9.6 (d)
Figure 9.6 (e)
Figure 9.6 (a) Figure 9.6 (b)

Multimedia Quality Analysis over 3G Wireless Inter face
139
Figure 9.7 Image “ L ight House”
(a) Or iginal (b) Received (c) Impor tance Map (d) PDM (e) IPDM
Figure 9.7 (c) Figure 9.7 (d)
Figure 9.7 (e)
Figure 9.7 (a) Figure 9.7 (b)

Multimedia Quality Analysis over 3G Wireless Inter face
140
The PDM here is produced from the HVS fidelity module while the IM is from the IM
module. As shown, combination of both to form a seamless image quality metric, where
HVS perceptible fidelity error is subject to importance scaling to produce the IPDM. This
gives a more accurate plot of the error as HVS perceptible fidelity is not area
discriminatory, while different areas of images may give rise to a very different attention,
thus a different rate of importance. Note from all results that the IPDM is significantly
different from the PDM, which explains that the enforcement of IM is in order. By fusing
both modules into the final system, an efficient error map can be generated, producing
better quantification of HVS perceptible error in received images. The results further show
that the overall system integrated seamlessly with individual areas and the salt and pepper
noise presented by the 3G/UTRA module is within detectable capability of the HVS image
quality metric. The system is tested to be seamless and in working order. The next section
will analyze various results in IPQR.
9.2 System Result Summary
This section summarizes the system test results from section 9.1 and also the final system
results from section 8.1. The result from section 8.1 is further processed to produce the
overall system result. Table 9.1 illustrates the result details from section 9.1 where IPDM
is summed to produce IPQR. Note that all Environment parameters here are all set to
vehicular A.
“Announcer ” “Baboon”
“ Football” “ Lena” “ Soccer” “ Bike” “ L ight
House”
Vehicular velocity
50 km/h 20 km/h 20km/h 50km/h 50 km/h 50km/h 20km/h
Mean Square Error (MSE)
312.58 260.83 267.97 336.56 315.82 315.77 265.06
Perceptual Signal-to-
Noise Ratio
(PSNR)
23.18 dB 24.00 dB 23.85 dB 22.86 dB 23.14 dB 23.14 dB 23.90
PQR (1-5)
1.16 2.30 2.09 1.70 1.61 1.86 1.69
IPQR (1-5)
2.24 2.69 3.09 2.39 1.93 2.44 2.97
Table 9.1 System Result Summary

Multimedia Quality Analysis over 3G Wireless Inter face
141
The MSE range is consistent with the velocity of the physical channel that the images are
subjected to. Alternately the PQR value also reflects this, although there is a notable
difference between the PQR values of images within the same velocity range, even if the
MSE and PSNR values are relatively similar. This phenomenon is expected as the HVS-
based perceptual differences takes in error differently in accordance to image properties.
IM enhanced PQR processed into IPQR reflects the designated property of refining
perceptual damages in accordance to image area importance. This is clearly shown by
comparing PQR with IPQR and PDM with IPDM from the listed results. Overall, the
results show that the test bed is working and the result is consistent with intended
outcomes.
Tables 9.2 and 9.3 show the IPQR (total system output) of the testing done in section 8.1
for image “Announcer” and Table 9.4 and 9.5 for image “Football” to further illustrate the
workings of the total test bed system. These results are visualized in Figures 9.7 and 9.8
respectively. As expected, the change in IPQR values corresponds with the pattern with
PQR values shown in section 8.1, with increasing velocity resulting in higher quality loses.
Image “ Announcer” IPQR Values
Indoor A Indoor B Pedestrian
A
Pedestrian
B
Vehicular
A
Vehicular
B
0 km/h 3.90 2.46 X X X X
0.5 km/h 4.32 3.78 X X X X
1 km/h 4.33 3.82 X X X X
1.5 km/h 4.38 3.81 4.42 2.21 X X
3 km/h X X 4.43 2.21 X X
10 km/h X X 3.29 2.19 X X
20 km/h X X 3.03 2.16 2.33 2.63
40 km/h X X X X 2.30 2.57
60 km/h X X X X 2.23 2.46
80 km/h X X X X 2.17 2.41
100 km/h X X X X 2.13 2.30
Table 9.2 Image “ Announcer ” Varying Environment Parameter and
Velocity System Result Summary
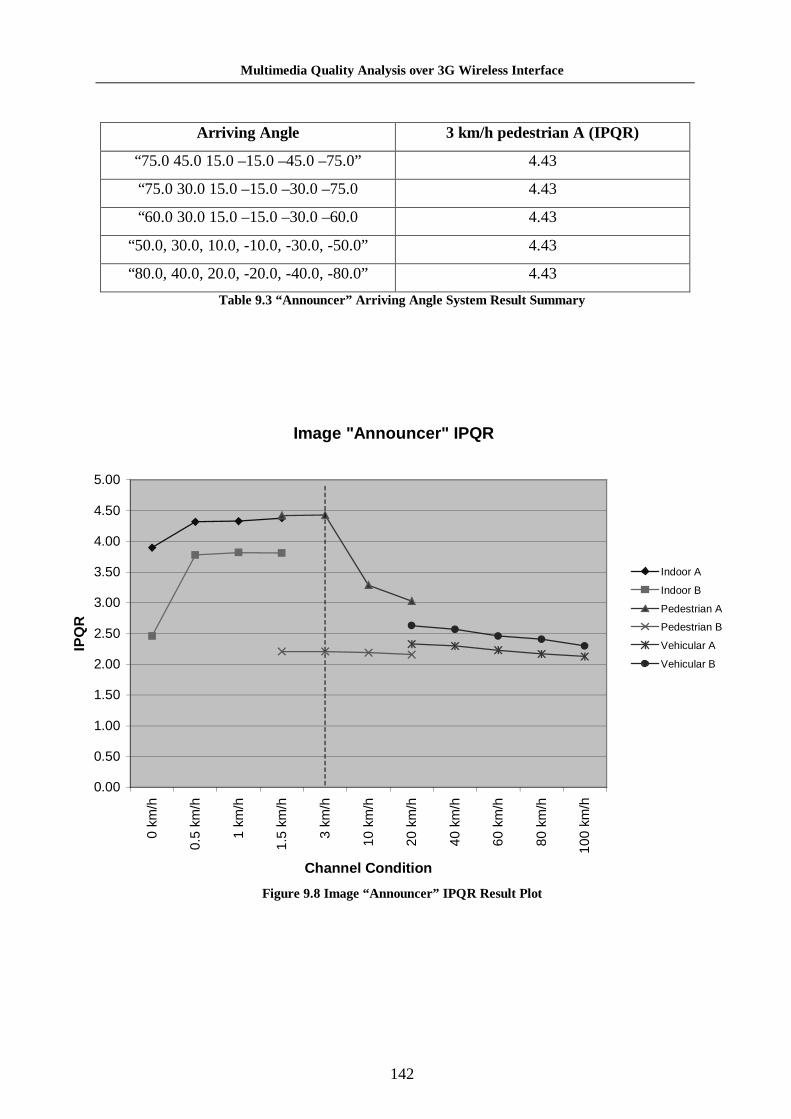
Multimedia Quality Analysis over 3G Wireless Inter face
142
Image "Announcer" IPQR
0.00
0.50
1.00
1.50
2.00
2.50
3.00
3.50
4.00
4.50
5.00
0 km
/h
0.5
km/h
1 km
/h
1.5
km/h
3 km
/h
10 k
m/h
20 k
m/h
40 k
m/h
60 k
m/h
80 k
m/h
100
km/h
Channel Condition
IPQ
R
Indoor A
Indoor B
Pedestrian A
Pedestrian B
Vehicular A
Vehicular B
Arriving Angle 3 km/h pedestrian A (IPQR)
“75.0 45.0 15.0 –15.0 –45.0 –75.0” 4.43
“75.0 30.0 15.0 –15.0 –30.0 –75.0 4.43
“60.0 30.0 15.0 –15.0 –30.0 –60.0 4.43
“50.0, 30.0, 10.0, -10.0, -30.0, -50.0” 4.43
“80.0, 40.0, 20.0, -20.0, -40.0, -80.0” 4.43
Table 9.3 “ Announcer ” Ar r iving Angle System Result Summary
Figure 9.8 Image “ Announcer ” IPQR Result Plot

Multimedia Quality Analysis over 3G Wireless Inter face
143
Image “ Football” IPQR Values
Indoor A Indoor B Pedestrian
A
Pedestrian
B
Vehicular
A
Vehicular
B
0 km/h 4.27 2.74 X X X X
0.5 km/h 4.78 4.53 X X X X
1 km/h 4.79 4.53 X X X X
1.5 km/h 4.78 4.53 4.79 2.67 X X
3 km/h X X 4.80 2.68 X X
10 km/h X X 3.36 2.66 X X
20 km/h X X 3.55 2.62 3.09 3.29
40 km/h X X X X 2.84 3.18
60 km/h X X X X 2.75 3.01
80 km/h X X X X 2.78 2.88
100 km/h X X X X 2.47 2.86
Table 9.4 Image “ Football” Varying Environment Parameter and
Velocity System Result Summary
Arriving Angle 3 km/h pedestrian A (IPQR)
“75.0 45.0 15.0 –15.0 –45.0 –75.0” 4.80
“75.0 30.0 15.0 –15.0 –30.0 –75.0 4.80
“60.0 30.0 15.0 –15.0 –30.0 –60.0 4.80
“50.0, 30.0, 10.0, -10.0, -30.0, -50.0” 4.80
“80.0, 40.0, 20.0, -20.0, -40.0, -80.0” 4.80
Table 9.5 “ Football” Ar r iving Angle System Result Summary
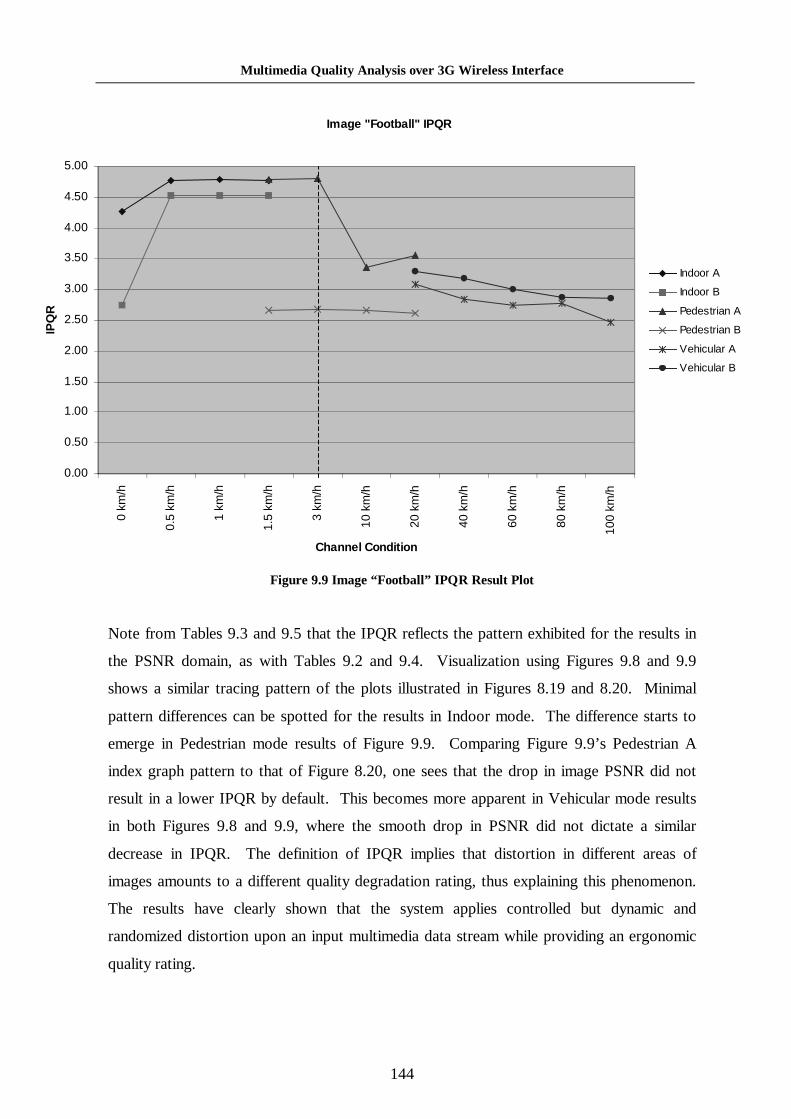
Multimedia Quality Analysis over 3G Wireless Inter face
144
Figure 9.9 Image “ Football” IPQR Result Plot Note from Tables 9.3 and 9.5 that the IPQR reflects the pattern exhibited for the results in
the PSNR domain, as with Tables 9.2 and 9.4. Visualization using Figures 9.8 and 9.9
shows a similar tracing pattern of the plots illustrated in Figures 8.19 and 8.20. Minimal
pattern differences can be spotted for the results in Indoor mode. The difference starts to
emerge in Pedestrian mode results of Figure 9.9. Comparing Figure 9.9’s Pedestrian A
index graph pattern to that of Figure 8.20, one sees that the drop in image PSNR did not
result in a lower IPQR by default. This becomes more apparent in Vehicular mode results
in both Figures 9.8 and 9.9, where the smooth drop in PSNR did not dictate a similar
decrease in IPQR. The definition of IPQR implies that distortion in different areas of
images amounts to a different quality degradation rating, thus explaining this phenomenon.
The results have clearly shown that the system applies controlled but dynamic and
randomized distortion upon an input multimedia data stream while providing an ergonomic
quality rating.
Image "Football" IPQR
0.00
0.50
1.00
1.50
2.00
2.50
3.00
3.50
4.00
4.50
5.00
0 km
/h
0.5
km/h
1 km
/h
1.5
km/h
3 km
/h
10 k
m/h
20 k
m/h
40 k
m/h
60 k
m/h
80 k
m/h
100
km/h
Channel Condition
IPQ
R
Indoor A
Indoor B
Pedestrian A
Pedestrian B
Vehicular A
Vehicular B

Multimedia Quality Analysis over 3G Wireless Inter face
145
The rating weights induced error is dependent on the area of image being distorted instead
of purely measuring the physical error. Although patterns between the two graphs can be
visually observed, the IPQR values between the two sets of results are quite different. This
is because both test images have a very different Importance Map and also different HVS
fidelity errors, which derive a very different IPQR although the average difference of their
physical errors is relatively small. The following presents results across different images
subjected to 3 different velocities as in IPQR, continuing the results in Table 8.1 and Figure
8.7.
Image Velocity IPQR
“Baboon” 20 km/h 2.69
50 km/h 2.63
80 km/h 2.57
“Bike” 20km/h 2.60
50 km/h 2.44
80 km/h 2.39
“Football” 20 km/h 2.96
50 km/h 2.73
80 km/h 2.78
“Lena” 20 km/h 2.53
50 km/h 2.39
80 km/h 2.36
“Light House” 20 km/h 2.98
50 km/h 2.87
80 km/h 2.82
“Soccer” 20 km/h 1.96
50 km/h 1.93
80 km/h 1.83
Table 9.6 Multiple images with Varying Velocity System Result Summary
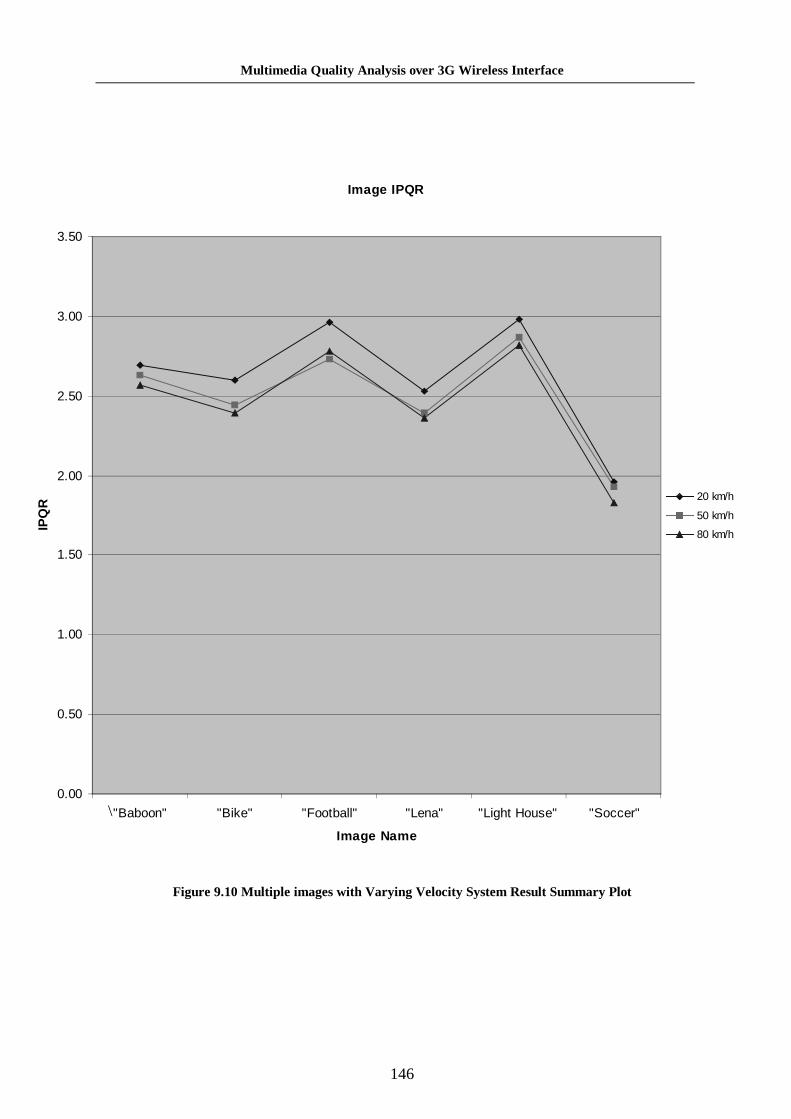
Multimedia Quality Analysis over 3G Wireless Inter face
146
Image IPQR
0.00
0.50
1.00
1.50
2.00
2.50
3.00
3.50
"Baboon" "Bike" "Football" "Lena" "Light House" "Soccer"
Image Name
IPQ
R
20 km/h
50 km/h
80 km/h
\
Figure 9.10 Multiple images with Varying Velocity System Result Summary Plot

Multimedia Quality Analysis over 3G Wireless Inter face
147
Figure 9.10 shows results of six images in terms of IPQR, further extending those presented
in Figure 8.7 where results are presented in MSE. Note that the smooth pattern as
presented in Figure 8.7 is not reflected in Figure 9.10. In the distinct case of the image
“Football” , the image subjected to 50 km/h attracts higher damage than 80 km/h while MSE
results show otherwise. In the case of image “Soccer” , the quality gets a much lower rating
overall in IPQR, where the MSE results shows near uniform pattern with the rest of the
images. Across the different images, IPQR diversifies greatly although most results have
higher velocities reflecting lower IPQR. This contradicts the much smoother pattern
appearing in Figure 8.7. Note also that IPQR is in linear scale while PSNR is in
logarithmic scale. That is why only relative visual reference is used. This further illustrates
the earlier analysis by which the system effectively rates the distortion of the images using
HVS properties.
IPQR takes IPDM and summarizes the error map into a single number ranged from 1.0 to
5.0 for ease of reference. Close comparison of Figure 8.7 and Figure 9.10 shows that a
image of the same error rate produces a significantly different pattern of quality
quantification. This shows the unique properties of the HVS image quality metric, where
physical image errors are translated into the HVS domain, then further applied onto a visual
attention model. Across the images subjected to the same velocity and having very similar
PSNR, diverse IPQR has been produced due to the impact area of the errors on the images.
This is very obverse in image “Lena” and “Football” , where one has very close IPQR
between images with very different PSNR while the other has a higher IPQR where lower
PSNR is presented. From this phenomenon produced by the system, images subjected to
the same channel data error can show significantly different human perceptual qualities.
Now, one can see that this system produces a different yet efficient image quality testing
and measurements that have impact on content-based multimedia delivery.
This ends the section on system result summary and also on system testing. In summary,
the total system has integrated the individual system with minimal problems and has
demonstrated its proper workings. All illustrated, behavior is within expectations in
accordance to the design prospect, and the test bed methodology has been accurately
implemented. The next chapter continues the discussion on the presented results and brings
conclusion to the entire work.
Multimedia Quality Analysis over 3G Wireless Inter face
148
Chapter 10. Discussion and Conclusion
In the preceding chapters, this thesis has presented an implementation of a 3G software test
bed with the capability to analyze quality degradation of images in multimedia data
transmitted over the 3G radio/wireless interface. This test bed consists of two major
modules, the UTRA/3G test bed module and the HVS-based image quality metric. The
UTRA/3G test bed module emulates the operation of processing UMTS transport layer
channel DCH into a physical signal and subjects it to a 3G physical channel model followed
by receiving and reverse processing to produce the received DCH on the receiver side.
Upon recovering the images from the received channel, the HVS-based image quality
metric compares it with the original to provide a quality rating, based on human vision
perception. This system illustrates a new yet different approach to quality measurement for
a multimedia stream over the mobile wireless interface. Therefore, it is useful in providing
a versatile platform for performing media protection research and analysis. For example,
using the system to test the effectiveness of a protective protocol for the physical structure
of the data, the image quality metric provides an efficient way of representing the
effectiveness of the protocol to protect image quality.
This work concentrates on system development. Both the UTRA/3G test bed module and
the HVS-based image quality metric have been built and tested extensively. Various
calibration tests that have been done are not included in this thesis as they are of little
relation to the actual methodology of the test bed. The result presented in Chapters 8 and 9
has effectively verified the various system functionalities by illustrating working results of
multiple varied parameters of the UTRA/3G test bed module and the various functionalities
of the image quality metric.
In Chapter 8, the system has successfully shown the emulated 3G condition is free of image
dependency and is able to process any type of image. Together with this, the results of the
image quality metric clearly illustrate HVS-based quality analysis is in working order. It
effectively analyzes image fidelity and weighted error depending on attention importance of
the image area. The integration of both modules enabled strong coupling where the inter-
Multimedia Quality Analysis over 3G Wireless Inter face
149
processing of the 3G data and image quality are carried out seamlessly to give an overall
system for media analysis, as tested and presented in Chapter 9. A seamless 3G multimedia
quality analysis testing platform is constructed and analysis of degradation of visual
multimedia content in terms of human oriented perception has been performed. Presented
in this thesis is an ergonomic method using the human visual properties, with favorable
results as backing. The novelty of this work builds on the successfully showing of another
method of analyzing visual multimedia degradation over high bandwidth mobile interface
of 3G/UMTS, as against QoS, physical data measurements or even image level physical
data measurements. As shown in Chapter 9, image difference rates of environmental
parameter controlled error are being tested to produce HVS domain quantity quantification
results. The results deliver a non-linear correlation with image level physical data
measurement as obtained in Chapter 8. While producing a significantly different outcome,
the IPQR results demonstrate consistency with background theory and deliver a consistent
system of quality measurement. The novelty of this work is fulfilled.
Using this 3G test bed that incorporates HVS correlative error measuring technique, a much
more accurate and effective quantification of error impact on the visual properties in
multimedia contents are produced. It will prove extremely useful by applying the concept
developed in this work to other related topics, for example, development of dynamic
multimedia protection techniques where protection of visual contents is of prime
importance. This is apparent, when considering that the purpose of multimedia protection
is to minimize user perception of quality losses.
While verification is shown by logically compare system results with expected outcome
from the design, validation is the other process of most system development projects. The
author has to report that proper validation has not been fully and extensively done, due to
limited time and the absence of resources. The UTRA/3G test bed can be validated in
accordance to 3G standards by comparing it to a known test bed or subject it to a
specifically designed test that is approved by 3G or a related telecommunication body. The
image quality metric can be properly validated by either comparing it to the system
documented by [62] or evaluating it with a subjective human observation test as described
in [42]. This process produces objective data for close analysis as compared to subjective
analysis provided in this thesis. Unfortunately, both of these options are not within the
resource boundaries of the author.

Multimedia Quality Analysis over 3G Wireless Inter face
150
Although useful on its own, this test bed is built as the foundation of an extendable system.
Three main areas exist for extending the test bed, as described below.
• Extension to channel condition simulator. The ADS channel condition simulator
component used in the test bed can be replaced with a custom Matlab module. This
extension should provide a more controllable channel condition simulator, relative
to the rigid environment of ADS. Two shortcomings of the ADS component, as
mentioned in section 8.1.2 and 8.1.3, should also be addressed in this new
development. Addition of advance radio channel analytical models should also be
considered, to more accurately model behaviors of 3G physical channels. An
example architecture for this custom component is presented in the hardware
experiment of [75].
• Extension to traffic modeling. This option extends the test bed to cover network and
data link levels of 3G/UMTS, by incorporating the present system with the
modeling of UMTS network behavior. The progress to date has been on the
physical layer infrastructure, where the next step is to consider the likely network
condition to which the data stream is subjected. Two modeling scenarios within
immediate consideration are the UMTS network level services traffic and the inter-
network traffic volume which arise from connection with HiperLAN2. The OPNET
package is a favorable implementation tool, where mock traffic sources are
introduced with the primary source at the network level.
• Extension to the HVS based quality metric. This extension requires inclusion of
temporal consideration between images together with spatial channels. The image
importance area can be better determined by considering the temporal changes
between two images. By taking into account motion factors between images, this
extension feature enables the test bed to better measure quality of video sequences
as a series of images.
The potential application of the final system is for it to be used as a base system and further
developed into a dynamic media quality adaptation protocol and deployment system. This
system can also be used for routing multi-media service components over rapidly changing

Multimedia Quality Analysis over 3G Wireless Inter face
151
wireless channel conditions that greatly impair available channel traffic capacity. Designed
to be versatile and having a different approach to quality quantification, the system is
useable in many situations.
Overall, the implemented test bed is working and the result provided is within expectations.
Reflecting on the objectives defined in the introduction, the conclusion can be drawn that
the aims of the work have been achieved and the objective of the work has been
satisfactorily completed.

Multimedia Quality Analysis over 3G Wireless Inter face
152
Bibliography
[1] G. Eneroth, G. Fodor, G. Leijonhufvud, A. Racz, and I. Szabo, "Applying
ATM/AAL2 as a Switching Technology in Third-Generation Mobile Access
Networks," in IEEE Communmications Magazine, vol. 37, 1999, pp. 112-123.
[2] M. Zeng, A. Annamalai, and V. K. Bhargava, "Recent Advances in Cellular
Wireless Communications," in IEEE Communications Magazine, vol. 37, 1999, pp.
128-138.
[3] J. F. Huber, D. Weiler, and H. Brand, "UMTS, the Mobile Multimedia Vision for
IMT-2000: A Focus on Standardization," in IEEE Communications Magazine, vol.
38, 2000, pp. 129-136.
[4] V. Sundaramurthy and J. Cavallaro, "A Software Simulation Testbed for Third
Generation CDMA Wireless Systems," presented at IEEE Conference on Signals,
Systems and Computers, 2, pp. 1680-1684, 1999.
[5] Y. Mohasseb and M. P. Fitz, "A 3D Spatio-Temporal Simulation Model for
Wireless Channels," presented at IEEE International Conference on
Communications, 2001., 6, pp. 1711-1717, 2001.
[6] Q. Zhang, W. Zhu, and Y. Zhang, "Network-adaptive Scalable Video Streaming
Over 3G Wireless Network," Proceedings of the International conference on Image
Processing 2001, vol. 3, pp. 579-582, 2001.
[7] M. Patzold, U. Killat, Y. Li, and F. Laue, "Modeling, Analysis, and simulation of
Nonfrequency-Selective Mobile Radio Channels with Asymmetrical Doppler Power
Spectral Density Shapes," IEEE Transactions on Vehicular Technology, vol. 46, pp.
494-507, 1997.

Multimedia Quality Analysis over 3G Wireless Inter face
153
[8] K. Tan and T. Wysocki, "A 7 rays Empirical-based Model of an indoor Microwave
Wirelss Mobile Channel with Randomized Distortions," presented at IEEE 47th
Vehicular Technology Conference, 2, pp. 1128-1132, 1997.
[9] G. Boggia and P. Camarda, "Modeling Dynamic Channel Allocation in
Multicellular Communication Networks," IEEE Journal on Selected Areas in
Communications, vol. 19, pp. 2233-2242, 2001.
[10] D. Grace, T. C. Tozer, and G. Burr, "Simulation of a Wireless Communications
Network which Employs Distributed Dynamic Channel Assignment," presented at
International Conference on SIMULATION, Conf. Publ. No. 457., pp. 432-437,
1998.
[11] 3GPP, "Spreading and modulation (FDD)," 3GPP, Volbonne, Technical
Specification TS 25.213 v4.2.0, 2001.
[12] 3GPP, "Physical layer - General description," 3GPP, Volbonne, Technical
Specification TS 25.201 v4.1.0, 2001.
[13] R. Koodli and M. Puuskari, "Supporting Packet-Data QoS in Next-Generation
Cellular Networks," in IEEE Communications Magazine, vol. 39, 2001, pp. 180-
188.
[14] T. Warabino, S. Ota, D. Morikawa, and M. Ohshi, "Video Transcoding Proxy for
3Gwireless Mobile Internet Access," in IEEE Communications Magazine, vol. 38,
2000, pp. 66-71.
[15] ITU-T, "Framework Recommendation for Multimedia Services," Audiovisual
Services 2001.
[16] 3GPP, "QoS Concept and Architecture," Volbonne, Technical Specification TS
23.107 V5.0.0, 2001.

Multimedia Quality Analysis over 3G Wireless Inter face
154
[17] Nortel Networks., "QoS Performance Requirements for UMTS," 3GPP,
Copenhagen 1999.
[18] S. Worrall, A. H. Sadka, P. Seeney, and A. M. Kondoz, "Prioritisation of Data
Partitioned MPEG-4 Video Over Mobile Networks," ETT-European Transactions
on Telecommunications, vol. 12, 2001.
[19] W. Schonfeld, R. Steinmetz, N. Berier, and L. Wolf, "QoS in Mobile Multimedia
Networks," presented at Proceedings of International Conference on
Communication 2000, 1, pp. 791-796, 2000.
[20] R. Fantacci and S. Nannicini, "Multiple Access Protocol for Integration of Variable
Bit Rate Multimedia Traffic in UMTS/IMT-2000 Based on Wideband CDMA,"
IEEE Journal on Selected Areas in Communications, vol. 18, pp. 1441-1454, 2000.
[21] Q. Zhang, W. Zhu, and Y. Zhang, "QoS-Adaptive Multimedia Streaming over 3G
Wireless Channels," presented at Second International Symposium on Mobile
Multimedia Systems & Applications (MMSIA), Delft, Netherlands., 2000.
[22] L. Hanzo, C. H. Wong, and P. Cherriman, "Channel-Adaptive Wideband Wireless
Video Telephony," in IEEE Signal Processing Magazine, vol. 17, 2000, pp. 10-30.
[23] D. Wu, Y. T. Hou, and Y. Zhang, "Scalable Video Coding and Transport over
Broad-Band Wireless Networks," Proceedings of The IEEE, vol. 89, pp. 6-20, 2001.
[24] ETSI, "Broadband Radio Access Networks (BRAN); HIPERLAN Type 2; TS 101
493-1,", 2000.
[25] M. Johnsson, "HiperLAN/2 - The Broadband Radio Transmission Technology
Operating in the 5GHz Frequency Band," HiperLAN/2 Global Forum 1999.
[26] P. Chaudhury, W. Mohr, and S. Onoe, "The 3GPP Proposal for IMT-2000," IEEE
Communications Magazine, pp. 72-81, 1999.
Multimedia Quality Analysis over 3G Wireless Inter face
155
[27] K. Yen and K. Hanzo, "Third-Generation Wireless Systems," in Mobile Radio
Communications 2nd edition, R. H. Steele, Lajos., Ed.: John Wiley & Son LTD,
1999, pp. 897-963.
[28] W. Stalling, Data & Computer Communications, 6th ed. New Jersey: Prentice Hall,
2000.
[29] V. K. Garg and O. T. W. Yu, "Integrated QoS Support in 3G UMTS Networks,"
presented at Wireless Communications and Networking Conference 2002, 3, pp.
1187-1192, 2000.
[30] 3GPP, "Network Architecture," 3GPP, Volbonne, Technical Specification TS
25.212 v4.2.0, 2001.
[31] M. Zeng, A. Annamalai, and V. K. Bhargava, "Harmonization of Global Third-
Generation Mobile Systems," in IEEE Communications Magazine, vol. 38, 2000,
pp. 94-104.
[32] T. Ojanpera, "WCDMA," in Third Generation Mobile Communication Systems, R.
Prasad, W. Mohr, and W. Konhauser, Eds. Boston: Artech House, 2000, pp. 73-90.
[33] 3GPP, "Spreading and modulation (TDD)," 3GPP, Volbonne, Technical
Specification TS 25.223 v4.3.0, 2001.
[34] R. N. Williams, "A Painless Guide to CRC Error Detection Algorithms," vol. 2002:
University of Adelaide, 1993.
[35] 3GPP, "Multiplexing and channel coding (FDD)," 3GPP, Volbonne, Technical
Specification TS 25.212 v4.2.0, 2001.
[36] J. G. Proakis, Digital Communications, 4th ed. Boston: McGraw-Hill, 2001.

Multimedia Quality Analysis over 3G Wireless Inter face
156
[37] A. Burr, Modulation and Coding: for Wireless Communications. Harlow: Prentice
Hall, 2001.
[38] G. L. Stuber, "Modulation Methods," in Mobile Communications Handbook, J. D.
Gibson, Ed., 2nd ed: CRC Press, 1999, pp. 16-1:16-14.
[39] D. K. Imbeni, Magnus., "Quality of Service Management of Mixed Services in
WCDMA," presented at IEEE VTS-Fall VTC 2000 52nd, 2, pp. 565-572, 2000.
[40] S. Winkler, A. Charma, and D. McNally, "perceptual Video Quality and Blockiness
Metrics for Multimedia Streaming Applications," presented at Procedings of the 4th
International Symposium on Wireless Personal Multimedia communications,
Aalborg, Denmark, pp. 553-556, 2001.
[41] "Methodology for the subjective assessment of the quality of television pictures.," in
ITU-R Recommendation 500-6, 1994.
[42] W. Osberger, "Perceptual Vision Models for Picture Quality Assessment and
Compression Applications," PHD Dissertation. Brisbane: Queensland University of
Technology, 1999.
[43] E. Peli, "Contrast of Slightly Complex Patterns: Computing the Perceived Contrast
of Gabor Patches," presented at Proceedings of the SPIE: Human Vision and
Electronic Imaging, San Jose, USA, 2657, pp. 166-174, 1996.
[44] A. B. Watson, "The Cortex Transform: Rapid Computation of Simulated Neural
Images," Computer Vision, Graphics and Image Processing, vol. 39, pp. 311-327,
1987.
[45] A. B. Watson and J. A. Solomon, "A Model of Visual Contrast Gain Control and
Pattern Masking," Journal of the Optical Society of America A, vol. 14, pp. 2379-
2391, 1997.

Multimedia Quality Analysis over 3G Wireless Inter face
157
[46] A. B. Watson, "Toward a Perceptual Video Quality Metric," presented at SPIE
Conference on Human Vision and Electronic Imaging III, San Jose, 3299, pp. 139-
147, 1998.
[47] R. C. Gonzalez and R. E. Woods, Digital Image Processing. Reading: Addison-
Wesley, 1992.
[48] E. Peli, "Contrast in complex images," Journal of the Optical Society of America A,
vol. 7, pp. 2032-2040, 1990.
[49] J. M. Foley and G. M. Boynton, "A New Model of Human Luminance Pattern
Vision Mechanisms: analysis of the effects of pattern orientation, spatial phase and
temporal frequency.," presented at Proceedings of the SPIE - Computational Vision
Based on Neurobiology, 2054, pp. 32-42, 1994.
[50] S. Daly, "The Visible Difference Predictor: An Algorithm for the Assessment of
Image Fidelity," in Digital Images and Huma Vision, A. B. Watson, Ed. Cambridge:
MIT Press, 1993, pp. 179-206.
[51] S. A. Karunasekera and N. G. Kingsbury, "Perceptual characterisation of Images
Degraded by Blur and Noise: experiments.," Journal of the Optical Society of
America A, vol. 13, pp. 1166-1177, 1996.
[52] J. Lubin, "The Use of Psychophysical Data and Models in the Analysis of Display
System Performance," in Digital Images and Human Vision, A. B. Watson, Ed.
Cambridge,: MIT Press, 1993, pp. 163-178.
[53] P. C. Teo and D. J. Heeger, "Perceptual Image Distortion," Proceedings of the SPIE
- Human Vision, Visual Processing and Digital Disply V,, vol. 2179, pp. 127-141,
1994.

Multimedia Quality Analysis over 3G Wireless Inter face
158
[54] W. Osberger and A. Maeder, "Automatic Identification of Perceptually Important
Regions in an Image," presented at 14th International Conference on Pattern
Recognition, Brisbane, Australia., pp. 701-704, 1998.
[55] V. I. S. R. Group., "Sarnoff JND Vision Model Algorithm Description and Testing,"
Sarnoff Corporation, Princeton 1997.
[56] A. B. Watson and L. Kreslake, "Measurement of Visual Impairment Scales for
Digital Video," presented at Human Vision and Electronic IMaging VI, San Jose, 2,
2001.
[57] E. Peli, L. E. Arend, and G. M. Young, "Contrast Sensitivity to Patch Stimuli:
Effects of Spatial Bandwidth and Temporal Presentation.," Spatial Vision, vol. 7,
pp. 1-14, 1993.
[58] O. Luntinen, J. Rovamo, and R. Nasanen, "Modelling the increase of Contrast
Sensitivity with Granting Area and Exposure Time.," Vision Research, vol. 35, pp.
2339-2346, 1995.
[59] O. Luntinen, J. Rovamo, and R. Nasanen, "The Effects of Granting Area and Spatial
Frequency on Contrast Sensitivity as a Function of LIght Level," Vision Research,
vol. 33, pp. 2065-2072, 1993.
[60] O. Luntinen, J. Rovamo, and R. Nasanen, "Modelling the Dependence of Contrast
Sensitivity on Grating Area and Spatial Frequency," Vision Research, vol. 33, pp.
2773-2788, 1993.
[61] O. Luntinen, J. Rovamo, and R. Nasanen, "Modelling Contrast Sensitivity as a
Function of Retinal Illuminance and Grating Area," Vision Research, vol. 34, pp.
1301-1314, 1994.

Multimedia Quality Analysis over 3G Wireless Inter face
159
[62] W. Osberger, "Automatic detection of regions of interest in complex video
sequences," presented at Human Vision and Electronic Imaging VI, 4299, pp. 261-
372, 2001.
[63] A. Maeder, "Human Understanding Limits in Visualization," in Spatial Computing:
Issues in Vision, Multimedia and Visualization Technologies, T. Caelli, P. Lam, and
H. Bunke, Eds., 1997, pp. 229-238.
[64] W. Osberger, "Assessing the quality of compressed pictures using a perceptual
model," presented at 14th SMPTE Techincal Conference, Pasadena, pp. 495-508,
1998.
[65] I. Sommerville, Software Engineering, 5th ed: Addison-Wesley Publishing
Company, 1996.
[66] 3GPP, "Radio Link control (RLC) Protocol Specification," 3GPP, Volbonne,
Technical Specification TS 25.322 v5.0.0, 2001.
[67] 3GPP, "Packet Data Convergence Protocol (PDCP) Specification," 3GPP,
Volbonne, Technical Specification TS 25.323 v5.0.0, 2001.
[68] J. Lundsjo and M. Rinne, "UTRA Trnasport Control Function," in Third Generation
Mobile Communication Systems, R. Prasad, W. Mohr, and W. Konhauser, Eds.
Boston: Artech House, 2000, pp. 73-90.
[69] T. Rappaport, Wireless Communication Principles & Practice, 2nd ed. London:
Prentice Hall, 2002.
[70] J. G. Proakis and M. Salehi, Communication Systems Engineering. Englewood
Cliffs: Prentice Hall, 1994.
Multimedia Quality Analysis over 3G Wireless Inter face
160
[71] I. Burlin, M. Fellbrink, S. Forsgren, J. Mannby, and M. Sundstrom, "Evaluation of
CRTP and ROCCO," Department of Computer Science and Electrical Engineering,
Lulea University of Technology 2000.
[72] The Math Works Inc., "MATLAB," 6.1.0.450 ed: The Math Works Inc., 2001.
[73] OPNET Technologies Inc., "OPNET Network Modeler," 2001 ed. Bethesda:
OPNET Technologies Inc., 2001.
[74] Agilent Technologies., "Advanced Design System 2001." Palo Alto: Agilent
Technologies, 2001.
[75] J. Arponen, J. Eldstahl, and A. Nasman, "FDD Demonstrator," in Third Generation
Mobile Communication Systems, R. Prasad, W. Mohr, and W. Konhauser, Eds.
Boston: Artech House, 2000, pp. 73-90.
Related Documents