MULTILINE SPECTROPOLARIMETRY OF THE QUIET SUN AT 5250 AND 6302 8 H. Socas-Navarro and J. M. Borrero High Altitude Observatory, NCAR, 1 3080 Center Green Drive, Boulder, CO 80301; [email protected] and A. Asensio Ramos, M. Collados, I. DomI ´ nguez Cerden ˜a, E. V. Khomenko, M. J. MartI ´ nez Gonza ´lez, V. MartI ´ nez Pillet, B. Ruiz Cobo, and J. Sa ´nchez Almeida Instituto de Astrofı ´sica de Canarias, Avenida Vı ´a La ´ctea S/ N, La Laguna 38205, Tenerife, Spain Received 2006 September 14; accepted 2007 July 5 ABSTRACT The reliability of quiet-Sun magnetic field diagnostics based on the Fe i lines at 6302 8 has been questioned by re- cent work. Here we present the results of a thorough study of high-resolution multiline observations taken with the new spectropolarimeter SPINOR, comprising the 5250 and 6302 8 spectral domains. The observations were analyzed using several inversion algorithms, including Milne-Eddington, LTE with 1 and 2 components, and MISMA codes. We find that the line-ratio technique applied to the 5250 8 lines is not sufficiently reliable to provide a direct magnetic diagnostic in the presence of thermal fluctuations and variable line broadening. In general, one needs to resort to inversion algo- rithms, ideally with realistic magnetohydrodynamic constrains. When this is done, the 5250 8 lines do not seem to pro- vide any significant advantage over those at 6302 8. In fact, our results point toward a better performance with the latter (in the presence of turbulent line broadening). In any case, for very weak flux concentrations, neither spectral region alone provides sufficient constraints to fully disentangle the intrinsic field strengths. Instead, we advocate for a com- bined analysis of both spectral ranges, which yields a better determination of the quiet-Sun magnetic properties. Fi- nally, we propose the use of two other Fe i lines (at 4122 and 9000 8) with identical line opacities that seem to work much better than the others. Subject headin gg s: line: profiles — Sun: atmosphere — Sun: magnetic fields — Sun: photosphere 1. INTRODUCTION The empirical investigation of quiet-Sun 2 magnetism is a very important but extremely challenging problem. A large ( probably dominant) fraction of the solar magnetic flux resides in magnetic accumulations outside active regions, forming network and inter- network patches (e.g., Socas-Navarro & Sa ´nchez Almeida 2002). It is difficult to obtain conclusive observations of these structures, for two main reasons. First, the size of the magnetic concentra- tions is much smaller than the spatial resolution of modern spec- tropolarimetric instrumentation. Estimates obtained with inversion codes yield typical values for the filling factor of the resolution el- ement of between 1% and 30%. The interpretation of the polari- zation signal becomes nontrivial in these conditions, and one needs to make use of detailed inversion codes to infer the magnetic field in the atmosphere. Second, the observed signals are extremely weak (typically below 1% of the average continuum intensity), demanding both high sensitivity and high resolution. Linear polar- ization is rarely observed in visible lines, so one is usually left with Stokes I and V alone. Stenflo (1973) proposed using the pair of Fe i lines at 5247 and 5250 8, which have very similar excitation potentials and oscilla- tor strengths (and therefore very similar opacities), but different Lande ´ factors, to determine the intrinsic field strength directly from the Stokes V line ratio. That work led to the subsequent populariza- tion of this spectral region for further studies of unresolved solar magnetic structures. Later, the pair of Fe i lines at 6302 8 became the primary target of the Advanced Stokes Polarimeter (ASP; Elmore et al. 1992), mainly due to their lower sensitivity to temper- ature fluctuations. The success of the ASP has contributed largely to the currently widespread use of the 6302 8 lines by the solar community. Recent advances in infrared spectropolarimetric instrumentation now permit the routine observation of another very interesting pair of Fe i lines, namely, those at 15648 and 15653 8 (hereafter, the 1.56 m lines). Examples are the works of Lin & Rimmele (1999) and Khomenko et al. (2003). The large Lande ´ factors of these lines, combined with their very long wavelengths, result in an ex- traordinary Zeeman sensitivity. Their Stokes V profiles exhibit patterns in which the -components are completely split for fields stronger than 400 G at typical photospheric conditions. They also produce stronger linear polarization. On the downside, this spectral range is accessible to very few polarimeters. Furthermore, the 1.56 m lines are rather weak in comparison with the above- mentioned visible lines. Unfortunately, the picture revealed by the new infrared data often differs drastically from that previously inferred from the 6302 8 observations (e.g., Lin & Rimmele 1999; Khomenko et al. 2003; Socas-Navarro & Sa ´nchez Almeida 2002; Socas-Navarro & Lites 2004; Domı ´nguez Cerden ˜a et al. 2003), particularly in the internetwork. Socas-Navarro & Sa ´nchez Almeida (2003) proposed that the discrepancy in the field strengths inferred from the visible and infrared lines may be explained by magnetic inhomogenei- ties within the resolution element (typically 1 00 ). If multiple field strengths coexist in the observed pixel, then the infrared lines will be more sensitive to the weaker fields of the distribution, whereas the visible lines will provide information on the stronger fields (see also the discussion of polarimetric signal increase in the 1.56 m 1 The National Center for Atmospheric Research ( NCAR) is sponsored by the National Science Foundation. 2 In this work, we use the term ‘‘quiet Sun’’ to refer to the solar surface away from sunspots and active regions. 596 The Astrophysical Journal, 674:596Y606, 2008 February 10 # 2008. The American Astronomical Society. All rights reserved. Printed in U.S.A.

Welcome message from author
This document is posted to help you gain knowledge. Please leave a comment to let me know what you think about it! Share it to your friends and learn new things together.
Transcript
MULTILINE SPECTROPOLARIMETRY OF THE QUIET SUN AT 5250 AND 6302 8
H. Socas-Navarro and J. M. Borrero
High Altitude Observatory, NCAR,1 3080 Center Green Drive, Boulder, CO 80301; [email protected]
and
A. Asensio Ramos, M. Collados, I. DomI´nguez Cerdena, E. V. Khomenko, M. J. MartI´nez Gonzalez,
V. MartI´nez Pillet, B. Ruiz Cobo, and J. Sanchez Almeida
Instituto de Astrof ısica de Canarias, Avenida Vıa Lactea S/N, La Laguna 38205, Tenerife, Spain
Received 2006 September 14; accepted 2007 July 5
ABSTRACT
The reliability of quiet-Sun magnetic field diagnostics based on the Fe i lines at 63028 has been questioned by re-cent work. Here we present the results of a thorough study of high-resolutionmultiline observations taken with the newspectropolarimeter SPINOR, comprising the 5250 and 63028 spectral domains. The observations were analyzed usingseveral inversion algorithms, including Milne-Eddington, LTE with 1 and 2 components, and MISMA codes. We findthat the line-ratio technique applied to the 52508 lines is not sufficiently reliable to provide a direct magnetic diagnosticin the presence of thermal fluctuations and variable line broadening. In general, one needs to resort to inversion algo-rithms, ideally with realistic magnetohydrodynamic constrains. When this is done, the 52508 lines do not seem to pro-vide any significant advantage over those at 63028. In fact, our results point toward a better performance with the latter(in the presence of turbulent line broadening). In any case, for very weak flux concentrations, neither spectral regionalone provides sufficient constraints to fully disentangle the intrinsic field strengths. Instead, we advocate for a com-bined analysis of both spectral ranges, which yields a better determination of the quiet-Sun magnetic properties. Fi-nally, we propose the use of two other Fe i lines (at 4122 and 9000 8) with identical line opacities that seem to workmuch better than the others.
Subject headinggs: line: profiles — Sun: atmosphere — Sun: magnetic fields — Sun: photosphere
1. INTRODUCTION
The empirical investigation of quiet-Sun2magnetism is a veryimportant but extremely challenging problem. A large (probablydominant) fraction of the solar magnetic flux resides in magneticaccumulations outside active regions, forming network and inter-network patches (e.g., Socas-Navarro & Sanchez Almeida 2002).It is difficult to obtain conclusive observations of these structures,for two main reasons. First, the size of the magnetic concentra-tions is much smaller than the spatial resolution of modern spec-tropolarimetric instrumentation. Estimates obtained with inversioncodes yield typical values for the filling factor of the resolution el-ement of between�1% and 30%. The interpretation of the polari-zation signal becomes nontrivial in these conditions, and one needsto make use of detailed inversion codes to infer the magnetic fieldin the atmosphere. Second, the observed signals are extremelyweak (typically below �1% of the average continuum intensity),demanding both high sensitivity and high resolution. Linear polar-ization is rarely observed in visible lines, so one is usually left withStokes I and V alone.
Stenflo (1973) proposed using the pair of Fe i lines at 5247 and52508, which have very similar excitation potentials and oscilla-tor strengths (and therefore very similar opacities), but differentLande factors, to determine the intrinsic field strength directly fromthe StokesV line ratio. That work led to the subsequent populariza-tion of this spectral region for further studies of unresolved solarmagnetic structures. Later, the pair of Fe i lines at 63028 became
the primary target of the Advanced Stokes Polarimeter (ASP;Elmore et al. 1992), mainly due to their lower sensitivity to temper-ature fluctuations. The success of the ASP has contributed largelyto the currently widespread use of the 6302 8 lines by the solarcommunity.Recent advances in infrared spectropolarimetric instrumentation
now permit the routine observation of another very interesting pairof Fe i lines, namely, those at 15648 and 15653 8 (hereafter, the1.56 �m lines). Examples are the works of Lin & Rimmele (1999)and Khomenko et al. (2003). The large Lande factors of theselines, combinedwith their very longwavelengths, result in an ex-traordinary Zeeman sensitivity. Their Stokes V profiles exhibitpatterns in which the �-components are completely split for fieldsstronger than �400 G at typical photospheric conditions. Theyalso produce stronger linear polarization. On the downside, thisspectral range is accessible to very few polarimeters. Furthermore,the 1.56 �m lines are rather weak in comparison with the above-mentioned visible lines.Unfortunately, the picture revealed by the new infrared data
often differs drastically from that previously inferred from the63028 observations (e.g., Lin&Rimmele 1999; Khomenko et al.2003; Socas-Navarro & Sanchez Almeida 2002; Socas-Navarro& Lites 2004; Domınguez Cerdena et al. 2003), particularly in theinternetwork. Socas-Navarro&SanchezAlmeida (2003) proposedthat the discrepancy in the field strengths inferred from the visibleand infrared lines may be explained by magnetic inhomogenei-ties within the resolution element (typically 100). If multiple fieldstrengths coexist in the observed pixel, then the infrared lines willbe more sensitive to the weaker fields of the distribution, whereasthe visible lines will provide information on the stronger fields (seealso the discussion of polarimetric signal increase in the 1.56 �m
1 The National Center for Atmospheric Research (NCAR) is sponsored bythe National Science Foundation.
2 In this work, we use the term ‘‘quiet Sun’’ to refer to the solar surface awayfrom sunspots and active regions.
596
The Astrophysical Journal, 674:596Y606, 2008 February 10
# 2008. The American Astronomical Society. All rights reserved. Printed in U.S.A.
lines with weakening fields in Sanchez Almeida & Lites 2000).This conjecture has been tested recently by Domınguez Cerdenaet al. (2006), who modeled simultaneous observations of visibleand infrared lines using unresolved magnetic inhomogeneities.
A recent paper describing numerical simulations by MartınezGonzalez et al. (2006) casts some doubts on the results obtainedusing the 6302 8 lines. Our motivation for the present work isto resolve this issue by observing the quiet Sun simultaneously at5250 and 6302 8. We know that unresolved magnetic structuremight result in different field determinations in the visible and theinfrared, but the lines analyzed in this work are close enough inwavelengths and Zeeman sensitivities that one would expect toobtain the same results for both spectral regions.
2. METHODOLOGY
Initially, our goal was to observe simultaneously at 5250 and63028, because we expected the 52508 lines to be a very robustindicator of intrinsic field strength, which we could then use to testunder what conditions the 6302 8 lines are also robust. Unfortu-nately, as we show below, it turns out that in most practical situa-tions the 5250 8 lines are not more robust than the 6302 8 pair.This left us without a generally valid reference frame againstwhich to test the 63028 lines.We then decided to employ a differ-ent approach for our study, namely to analyze the uniqueness ofthe solution obtained when we invert the lines and how the solu-tions derived for the two pairs of lines compare to each other.In doing so, there are some subtleties that need to be taken intoconsideration.
An inversion technique necessarily resorts to a number of phys-ical assumptions about the solar atmosphere in which the lines areformed and the (in general polarized) radiative transfer. This im-plies that the conclusions obtained from applying a particular in-version code to our data may be biased by the modeling implicitin the inversion. Therefore, a rigorous study requires the analysisof solutions from a wide variety of inversion procedures. Ideally,one would like to cover at least the most frequently employed al-gorithms. For our purposes here we have chosen four of the mostpopular codes, spanning a wide range of model complexity. Theyare described in some detail in x 3 below.
When dealing with Stokes inversion codes, there are two dis-tinct problems that the user needs to be aware of. First, it may hap-pen that multiple different solutions provide satisfactory fits to ourobservations. This problem is of a very fundamental nature. It isnot a problem with the inversion algorithm but with the observ-ables themselves. Simply put, they do not carry sufficient infor-mation to discriminate among those particular solutions. The onlyway around this problem is to either supply additional observables(e.g., more spectral lines) or to restrict the allowed range of solu-tions by incorporating sensible constraints in the physical modelemployed by the inversion. A second problem arises when thesolution obtained does not fit the observed profiles satisfactorily.This can happen because the physical constraints in the inversion
code are too stringent (and thus no good solution exists withinthe allowed range of parameters), or simply because the algorithmhappened to stop at a secondary minimum. This latter problem isnot essential because one can always discard ‘‘bad’’ solutions (i.e.,those that result in a bad fit to the data) and simply try again with adifferent initialization. In this work we are interested in exploringthe robustness of the observables in as much as they relate to theformer problem, i.e., the underlying uniqueness of the solution.We do this by performing a large number of inversions with ran-dom initializations and analyzing the dependence of the solutionswith the merit function �2 (defined below).
Ideally, one would like to see that for small values of �2, all thesolutions are clustered around a central value with a small spread(the behavior for large �2 is not very relevant for our purposeshere). This should happen regardless of the inversion code em-ployed and the pair of lines analyzed. If that were the case, wecould conclude that our observables are truly robust. Otherwise,one needs to be careful when analyzing data corresponding to thatparticular scenario.
3. OBSERVATIONS AND DATA REDUCTION
The observations used in this workwere obtained during an ob-serving run in March 2006 with the Spectropolarimeter for Infra-red andOptical Regions (SPINOR; see Socas-Navarro et al. 2006),attached to the Dunn Solar Telescope (DST) at the SacramentoPeak Observatory (Sunspot, New Mexico; operated by the Na-tional Solar Observatory). SPINOR allows for the simultaneousobservation of multiple spectral domains with nearly optimal po-larimetric efficiency over a broad range of wavelengths.
The high-order adaptive optics system of the DST (Ren et al.2003) was employed for image stabilization and to correct foratmospheric turbulence. This allowed us to attain subarcsecondspatial resolution during some periods of good seeing.
The observing campaign was originally devised to obtain asmuch information as possible about the unresolved properties ofthe quiet-Sun magnetic fields. In addition to the 5250 and 63028domains discussed here, we also observed the Mn i line, sensitiveto hyperfine structure effects (LopezAriste et al. 2002), at 55378,and the Fe i line pair at 1.56 �m.
SPINOR was operated in a configuration with four differentdetectors that were available at the time of observations (seeTable 1). The Rockwell TCM 8600 infrared camera, with a for-mat of 1024 ; 1024 pixels, observed the 1.56 �m region. TheSARNOFFCAM1M100of 1024 ; 512 pixelswas used at 52508.Finally, the two dual TI TC245 cameras of 256 ; 256 pixels (theoriginal detectors of the Advanced Stokes Polarimeter) were
TABLE 1
SPINOR Detector Configuration
Camera
Wavelength
(8)
Spectral
Resolution
(m8)
Spectral
Sampling
(m8)
Usable
Range
(8)
Field of View
along the Slit
(arcsec)
ROCKWELL ...... 15650 190 150 150 187
SARNOFF........... 5250 53 31 15 145
TI TC245 ............ 5537 40 29 5 95
TI TC245 ............ 6302 47 24 6 95
TABLE 2
Atomic Line Data
Ion
Wavelength
(8)
Excitation
Potential
(eV) log (g f )
Lower Level
Configuration
Upper Level
Configuration
Fe i ...... 4121.8020 2.832 �1.300 3P23F3
Cr ii ..... 5246.7680 3.714 �2.630 4P1/24P3/2
Fe i ...... 5247.0504 0.087 �4.946 5D27D3
Ti i ....... 5247.2870 2.103 �0.927 5F35F2
Cr i ...... 5247.5660 0.961 �1.640 5D05P1
Fe i ...... 5250.2089 0.121 �4.938 5D07D1
Fe i ...... 5250.6460 2.198 �2.181 5P25P3
Fe i ...... 6301.5012 3.654 �0.718 5P25D2
Fe i ...... 6302.4916 3.686 �1.235 5P15D0
Fe i ...... 8999.5600 2.832 �1.300 3P23P2
MULTILINE QUIET-SUN SPECTROPOLARIMETRY 597
set to observe at 5537 and 6302 8. Unfortunately, we encoun-tered some issues during the reduction of the 55378 and 1.56�mdata, and it is unclear at this point whether or very not they areusable. Therefore, in the remainder of this paper we shall focuson the analysis of the data taken at 5250 and 63028. The spec-tral resolutions quoted in the table are estimated as the qua-dratic sum of the spectrograph slit size, diffraction limit, and pixelsampling.
In order to have good spectrograph efficiency at all four wave-lengths simultaneously, we employed the 308.57 line mm�1 grat-ing (blaze angle 52
�), at the expense of obtaining a relatively low
dispersion and spectral resolution (see Table 1 for details).In this paper we focus on two scan operations near disk center,
one over a relatively large pore (at solar heliocentric coordinateslongitude �25.40�, latitude �3.68�) and the other of a quiet re-gion (coordinates longitude 0.01�, latitude�7.14�). The poremapwas takenwith rather low spatial resolution (�1.500), but exhibits alarge range of polarization signal amplitudes. The quiet map, onthe other hand, has very good spatial resolution (�0.600), but thepolarization signals are much weaker. The noise level, measuredas the standard deviation of the polarization signal in contin-uum regions, is approximately 7 ; 10�4 and 5 ; 10�4 times theaverage quiet-Sun continuum intensity at 5250 and 6302 8,respectively.
We used several different inversion codes for the various testspresented here, namely, SIR (Stokes Inversion based onResponsefunctions; Ruiz Cobo & del Toro Iniesta 1992), MELANIE(Milne-Eddington Line Analysis using a Numerical InversionEngine), LILIA (LTE Inversion based on the Lorien Iterative Al-gorithm; Socas-Navarro 2001), and MISMA (Micro-StructuredMagnetic Atmosphere; Sanchez Almeida 1997). The simplestof these algorithms is MELANIE, which implements a Milne-
Eddington type of inversion similar to that of Skumanich & Lites(1987). The free parameters considered include a constant alongthe line-of-sight magnetic field vector, magnetic filling factor, line-of-sight velocity, and several spectral line parameters that representthe thermal properties of the atmosphere (Dopplerwidth�kD, line-to-continuum opacity ratio �0, source function S, and damping a).
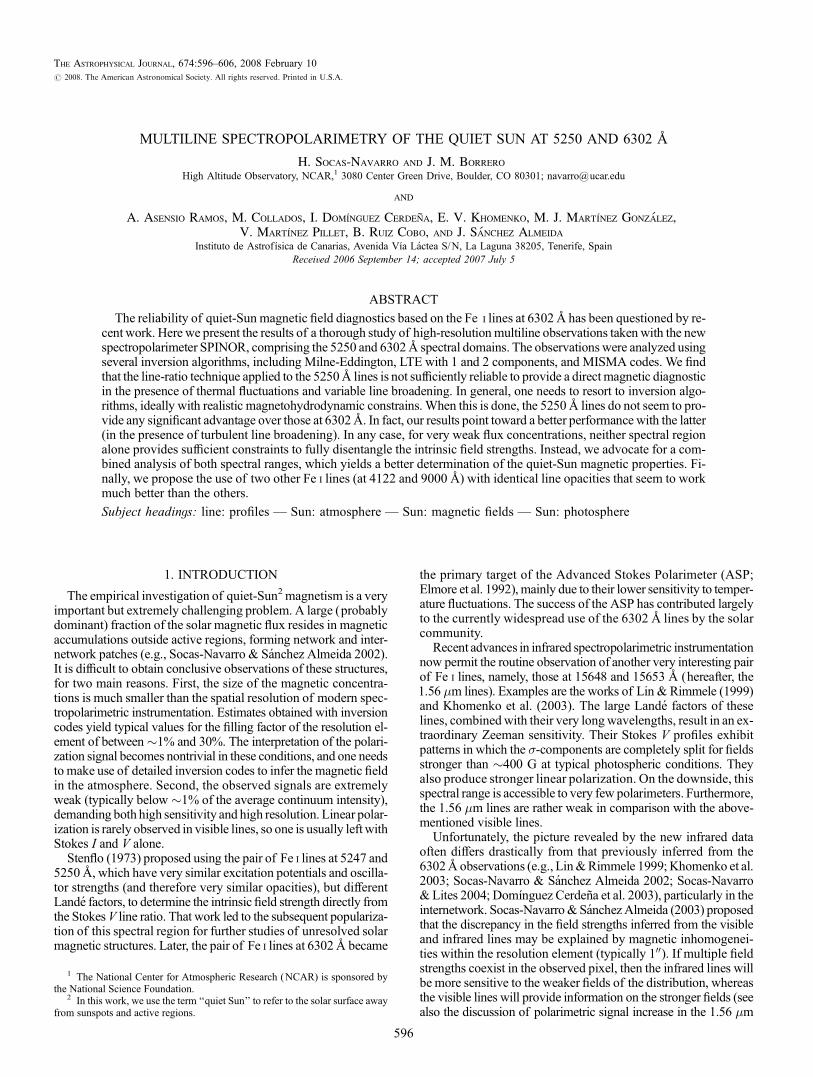
Fig. 1.—Continuum intensity map (left ) and reconstructed magnetogram (right) of the quiet-Sun scan near 5250 8. The magnetogram shows the integrated StokesV signal over a narrow bandwidth on the red lobe of the Fe i 5250.28 line. In both panels, values are referred to the average quiet-Sun intensity. The angular scale on thevertical axis measures the distance from the upper hairline.
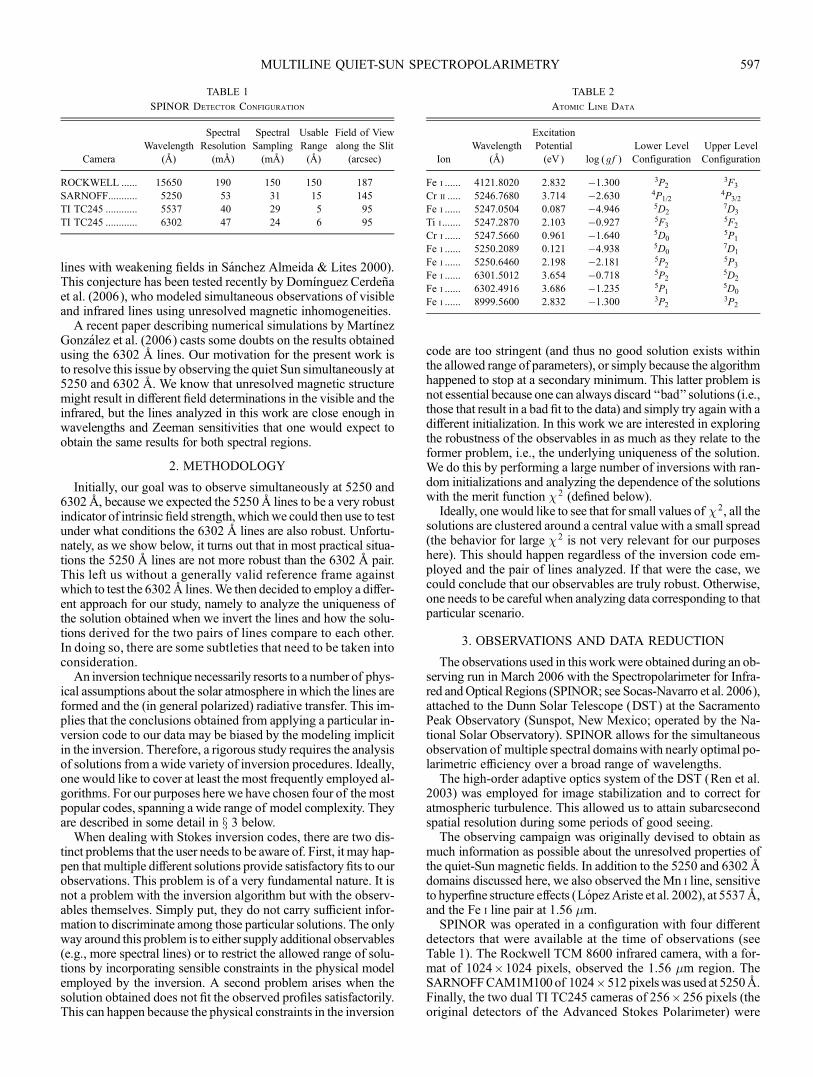
Fig. 2.—Continuum intensitymap (left) and reconstructedmagnetogram (right)of the pore scan near 5250 8. The magnetogram shows the integrated StokesV signal over a narrow bandwidth on the red lobe of the Fe i 5250.2 8 line. Inboth panels, values are referred to the average quiet-Sun intensity. The angularscale on the vertical axis measures the distance from the upper hairline.
SOCAS-NAVARRO ET AL.598 Vol. 674
The Fe i lines at 6302 8 belong to the same multiplet, and their �0are related by a constant factor. Assuming that the formation heightis similar enough for both lines, we can also consider that they havethe same �kD, S, and a. In this manner the same set of free pa-rameters can be used to fit both lines. In the case of the 5250 8lines, we only invert the Fe i pair and assume that both lines haveidentical opacities, �0.
SIR considers a model atmosphere defined by the depth strati-fication of variables such as temperature, pressure, magnetic fieldvector, line-of-sight velocity, and microturbulence. Atomic popu-lations are computed assumingLTE for the various lines involved,making it possible to fit observations of lines frommultiple chem-ical elements with a single model atmosphere that is common to
all of them. UnlikeMELANIE, one can produce line asymmetriesby incorporating gradients with height of the velocity and otherparameters. LILIA is a different implementation of the SIR algo-rithm. It works very similarly, with some practical differences thatare not necessary to discuss here.
MISMA is another LTE code, but has the capability to con-sider three atmospheric components (two magnetic and one non-magnetic) that are interlaced on spatial scales smaller than thephoton mean free path. Perhaps the most interesting feature ofthis code for our purposes here is that it implements a number ofmagnetohydrodynamic (MHD) constrains, such as momentum,as well as mass and magnetic flux conservation. In this manner itis possible to derive the full vertical stratification of the model
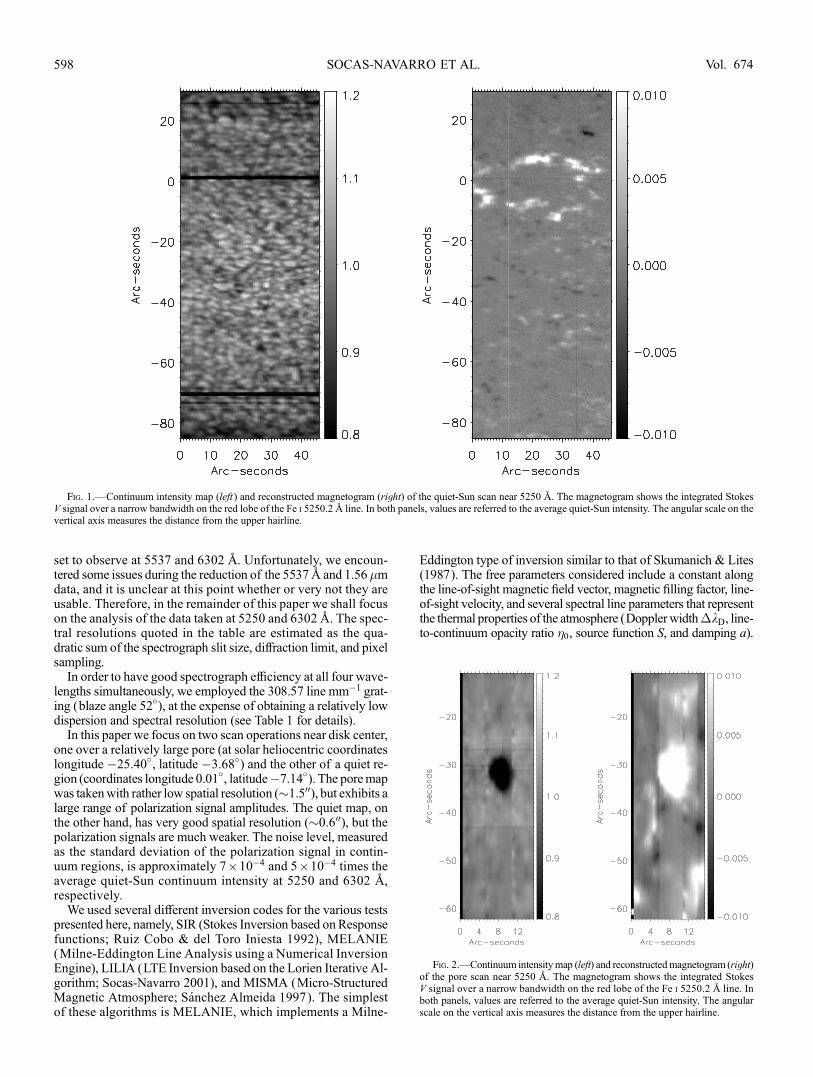
Fig. 3.—Line ratio calibration using synthetic Stokes profiles of Fe i 5250 8 emergent from the HSRA model atmosphere after adding random temperature pertur-bations and magnetic fields. Left: Macroturbulence was kept fixed at 3 km s�1. Right: Random macroturbulence varies between 0 and 1 km s�1.
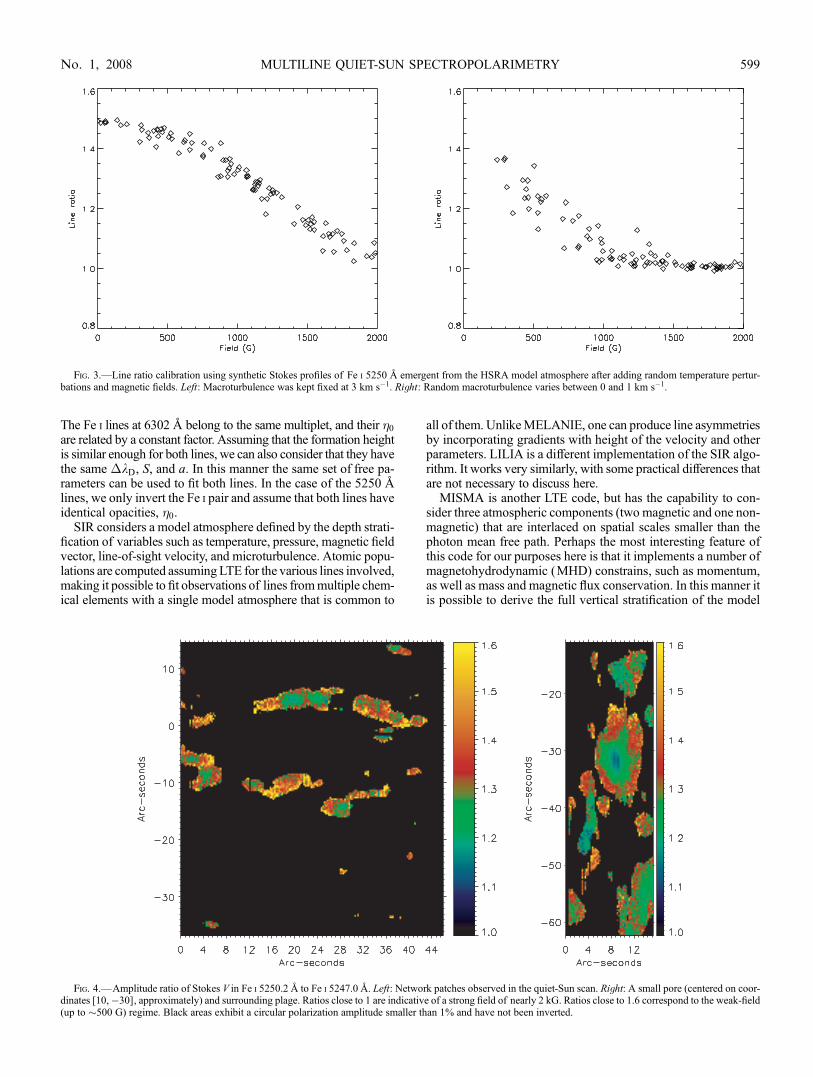
Fig. 4.—Amplitude ratio of Stokes V in Fe i 5250.2 8 to Fe i 5247.0 8. Left: Network patches observed in the quiet-Sun scan. Right: A small pore (centered on coor-dinates [10,�30], approximately) and surrounding plage. Ratios close to 1 are indicative of a strong field of nearly 2 kG. Ratios close to 1.6 correspond to the weak-field(up to �500 G) regime. Black areas exhibit a circular polarization amplitude smaller than 1% and have not been inverted.
MULTILINE QUIET-SUN SPECTROPOLARIMETRY 599No. 1, 2008
atmosphere from a limited number of free parameters (e.g., themagnetic field and the velocity at the base of the atmosphere).
In all of the inversions presented here we employed the sameset of atomic line parameters, which are listed in Table 2.
4. RESULTS
Figures 1 and 2 show continuum maps and reconstructed mag-netograms of the pore and quiet-Sun scans in the 5250 8 region.Note the much higher spatial resolution in the quiet-Sun observa-tion (Fig. 1). Similar maps, but with a somewhat smaller field ofviews, can be produced at 6302 8.
The first natural step in the analysis of these observations, be-fore even considering any inversions, is to calculate the Stokes Vamplitude ratio of the Fe i line 5250.2 to 5247.0 8 (hereafterreferred to simply as the line ratio). One would expect to obtain arough idea of the intrinsic magnetic field strength from this valuealone. A simple calibrationwas derived by taking the thermal strat-ification of the Harvard-Smithsonian Reference Atmosphere(HSRA; see Gingerich et al. 1971) and adding random (depth-independent) Gaussian temperature perturbations with an ampli-tude (standard deviation) of �300 K, different magnetic fieldstrengths, and a fixedmacroturbulence of 3 km s�1 (this value cor-responds roughly to our spectral resolution). Line-of-sight gra-dients of temperature, field strength, and velocity are also included.
Figure 3 shows the line ratio obtained from the synthetic profiles asa function of the magnetic field employed to synthesize them. Theline ratio is computed simply as the peak-to-peak amplitude ratio ofthe Stokes V profiles. Note that when the same experiment is car-ried outwith a variablemacroturbulent velocity, the scatter increasesconsiderably, even for relatively small values of up to 1 km s�1
(right panel ). The syntheses of Figure 3 consider the partialblends of all six lines in the 5250 8 spectral range.Figure 4 shows the observed line ratios for both scans. Accord-
ing to our calibration (see above), ratios close to 1 indicate strongfields of nearly (at least)�2 kG, whereas larger valueswould sug-gest the presence of weaker fields, down to the weak-field satura-tion regime at (at most) �500 G, corresponding to a ratio of 1.5.Figure 4 is somewhat disconcerting at first sight. The pore exhibitsthe expected behavior, with strong�2 kG fields at the center thatdecrease gradually toward the outer boundaries until they becomeweak. The network and plage patches, on the other hand, containrelatively large areas with high ratios of 1.4 and even 1.6 at somelocations. This is in sharp contrast with the strong fields (�1.5 kG)that one would expect in network and plage regions (e.g., Stenfloet al. 1984; Sanchez Almeida & Lites 2000; Bellot Rubio et al.2000).In viewof these results, we carried out inversions of the Stokes I
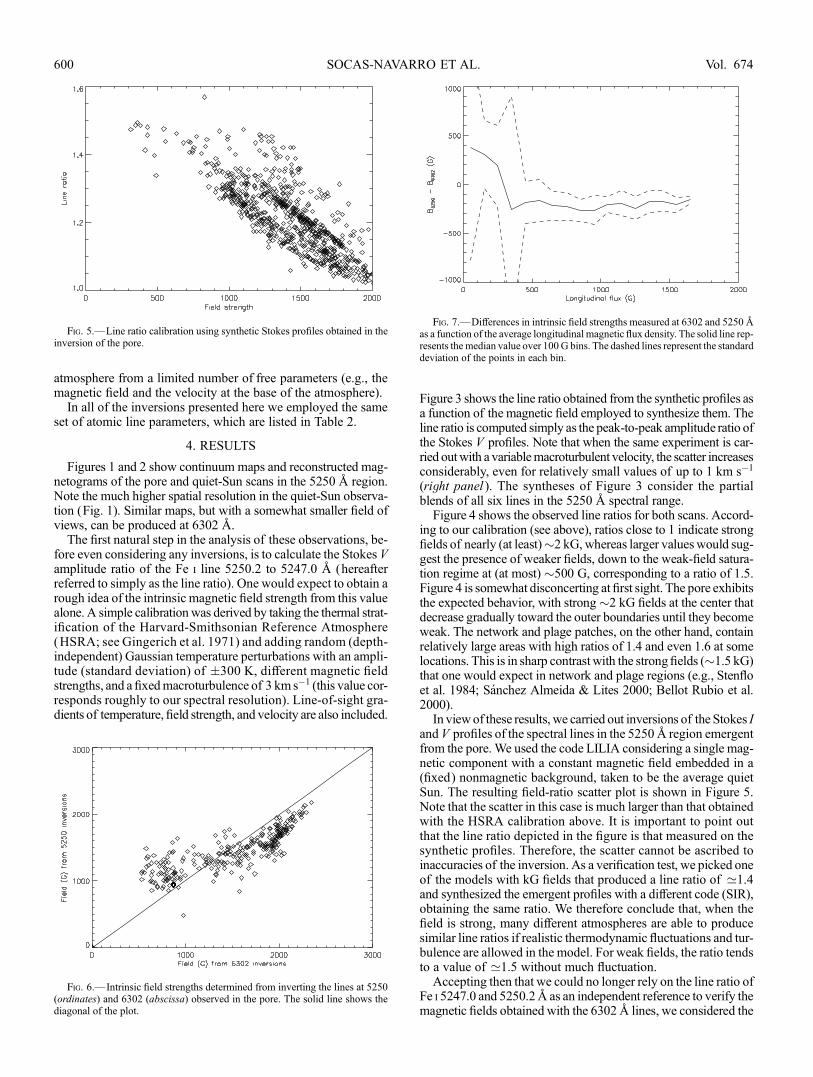
and V profiles of the spectral lines in the 52508 region emergentfrom the pore. We used the code LILIA considering a single mag-netic component with a constant magnetic field embedded in a(fixed) nonmagnetic background, taken to be the average quietSun. The resulting field-ratio scatter plot is shown in Figure 5.Note that the scatter in this case is much larger than that obtainedwith the HSRA calibration above. It is important to point outthat the line ratio depicted in the figure is that measured on thesynthetic profiles. Therefore, the scatter cannot be ascribed toinaccuracies of the inversion. As a verification test, we picked oneof the models with kG fields that produced a line ratio of ’1.4and synthesized the emergent profiles with a different code (SIR),obtaining the same ratio. We therefore conclude that, when thefield is strong, many different atmospheres are able to producesimilar line ratios if realistic thermodynamic fluctuations and tur-bulence are allowed in the model. For weak fields, the ratio tendsto a value of ’1.5 without much fluctuation.Accepting then that we could no longer rely on the line ratio of
Fe i 5247.0 and 5250.28 as an independent reference to verify themagnetic fields obtained with the 63028 lines, we considered the
Fig. 5.—Line ratio calibration using synthetic Stokes profiles obtained in theinversion of the pore.
Fig. 6.—Intrinsic field strengths determined from inverting the lines at 5250(ordinates) and 6302 (abscissa) observed in the pore. The solid line shows thediagonal of the plot.
Fig. 7.—Differences in intrinsic field strengths measured at 6302 and 52508as a function of the average longitudinal magnetic flux density. The solid line rep-resents the median value over 100G bins. The dashed lines represent the standarddeviation of the points in each bin.
SOCAS-NAVARRO ET AL.600 Vol. 674
result of inverting each spectral region separately. Figure 6 depictsthe scatter plot obtained. At the center of the pore, where we havethe strongest fields (right-hand side of the figure), there is a verygood correlation between the results of bothmeasurements. How-ever, those points lay systematically below the diagonal of theplot. This may be explained by the different ‘‘formation heights’’of the lines. The Fe i lines at 5250 8 generally form somewhathigher than those at 6302 8. If the field strength decreases withheight, one would expect to retrieve a slightly lower field strengthwhen using 5250 8. Unfortunately, the correlation breaks downfor the weaker fields. In Figure 7 we can see that both sets of linesyield approximately the same field strengths (with a slightly lowervalues for the 5250 inversions, as discussed above) for longitu-dinal fluxes above�500G.Below this limit our diagnosis is prob-ably not sufficiently robust.
If instead of the intrinsic fieldwe consider the longitudinalmag-netic flux, we obtain a fairly good agreement between the twospectral regions. TheMilne-Eddington inversions withMELANIEyield a Pearsons correlation coefficient of 0.89. In principle, theagreement is somewhat worse for the LILIA inversions, with acorrelation coefficient of 0.60. However, we have found that thisis due to a few outlier points. Removing them results in a correla-tion coefficient of 0.82.
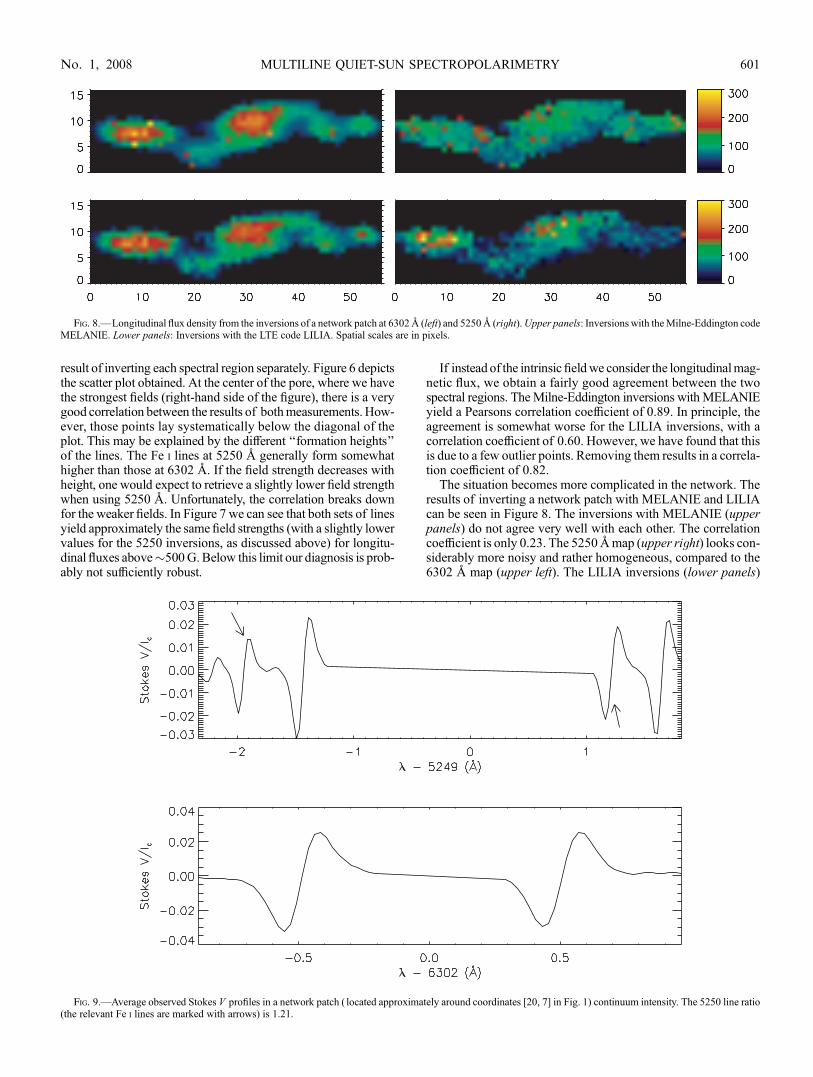
The situation becomes more complicated in the network. Theresults of inverting a network patch with MELANIE and LILIAcan be seen in Figure 8. The inversions with MELANIE (upperpanels) do not agree very well with each other. The correlationcoefficient is only 0.23. The 52508map (upper right) looks con-siderably more noisy and rather homogeneous, compared to the6302 8 map (upper left). The LILIA inversions (lower panels)
Fig. 8.—Longitudinal flux density from the inversions of a network patch at 63028 (left) and 52508 (right).Upper panels: Inversions with theMilne-Eddington codeMELANIE. Lower panels: Inversions with the LTE code LILIA. Spatial scales are in pixels.
Fig. 9.—Average observed Stokes V profiles in a network patch ( located approximately around coordinates [20, 7] in Fig. 1) continuum intensity. The 5250 line ratio(the relevant Fe i lines are marked with arrows) is 1.21.
MULTILINE QUIET-SUN SPECTROPOLARIMETRY 601No. 1, 2008
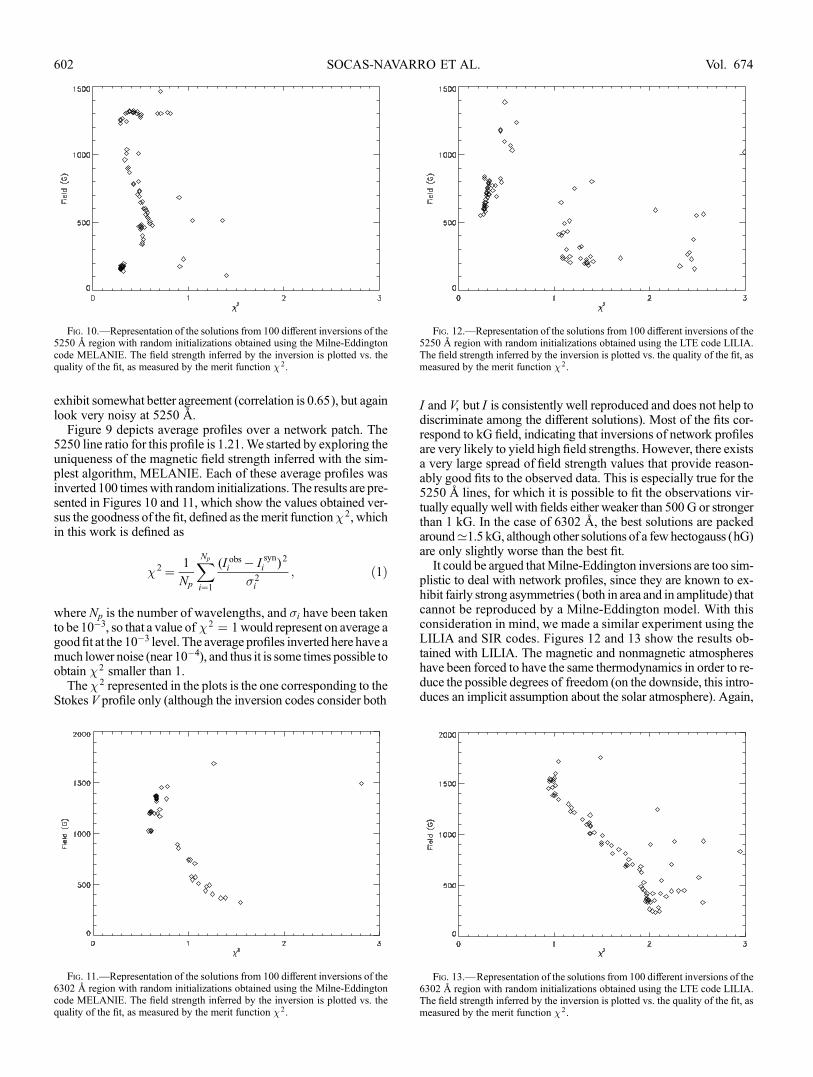
exhibit somewhat better agreement (correlation is 0.65), but againlook very noisy at 5250 8.
Figure 9 depicts average profiles over a network patch. The5250 line ratio for this profile is 1.21.We started by exploring theuniqueness of the magnetic field strength inferred with the sim-plest algorithm, MELANIE. Each of these average profiles wasinverted 100 timeswith random initializations. The results are pre-sented in Figures 10 and 11, which show the values obtained ver-sus the goodness of the fit, defined as themerit function�2, whichin this work is defined as
�2 ¼ 1
Np
XNp
i¼1
(I obsi � Isyni )2
�2i
; ð1Þ
where Np is the number of wavelengths, and �i have been takento be 10�3, so that a value of �2 ¼ 1would represent on average agoodfit at the 10�3 level. The average profiles inverted here have amuch lower noise (near 10�4), and thus it is some times possible toobtain �2 smaller than 1.
The �2 represented in the plots is the one corresponding to theStokes V profile only (although the inversion codes consider both
I and V, but I is consistently well reproduced and does not help todiscriminate among the different solutions). Most of the fits cor-respond to kG field, indicating that inversions of network profilesare very likely to yield high field strengths. However, there existsa very large spread of field strength values that provide reason-ably good fits to the observed data. This is especially true for the5250 8 lines, for which it is possible to fit the observations vir-tually equally well with fields either weaker than 500 G or strongerthan 1 kG. In the case of 6302 8, the best solutions are packedaround’1.5 kG, although other solutions of a fewhectogauss (hG)are only slightly worse than the best fit.It could be argued thatMilne-Eddington inversions are too sim-
plistic to deal with network profiles, since they are known to ex-hibit fairly strong asymmetries (both in area and in amplitude) thatcannot be reproduced by a Milne-Eddington model. With thisconsideration in mind, we made a similar experiment using theLILIA and SIR codes. Figures 12 and 13 show the results ob-tained with LILIA. The magnetic and nonmagnetic atmosphereshave been forced to have the same thermodynamics in order to re-duce the possible degrees of freedom (on the downside, this intro-duces an implicit assumption about the solar atmosphere). Again,
Fig. 10.—Representation of the solutions from 100 different inversions of the5250 8 region with random initializations obtained using the Milne-Eddingtoncode MELANIE. The field strength inferred by the inversion is plotted vs. thequality of the fit, as measured by the merit function �2.
Fig. 11.—Representation of the solutions from 100 different inversions of the6302 8 region with random initializations obtained using the Milne-Eddingtoncode MELANIE. The field strength inferred by the inversion is plotted vs. thequality of the fit, as measured by the merit function �2.
Fig. 12.—Representation of the solutions from 100 different inversions of the5250 8 region with random initializations obtained using the LTE code LILIA.The field strength inferred by the inversion is plotted vs. the quality of the fit, asmeasured by the merit function �2.
Fig. 13.—Representation of the solutions from 100 different inversions of the6302 8 region with random initializations obtained using the LTE code LILIA.The field strength inferred by the inversion is plotted vs. the quality of the fit, asmeasured by the merit function �2.
SOCAS-NAVARRO ET AL.602 Vol. 674
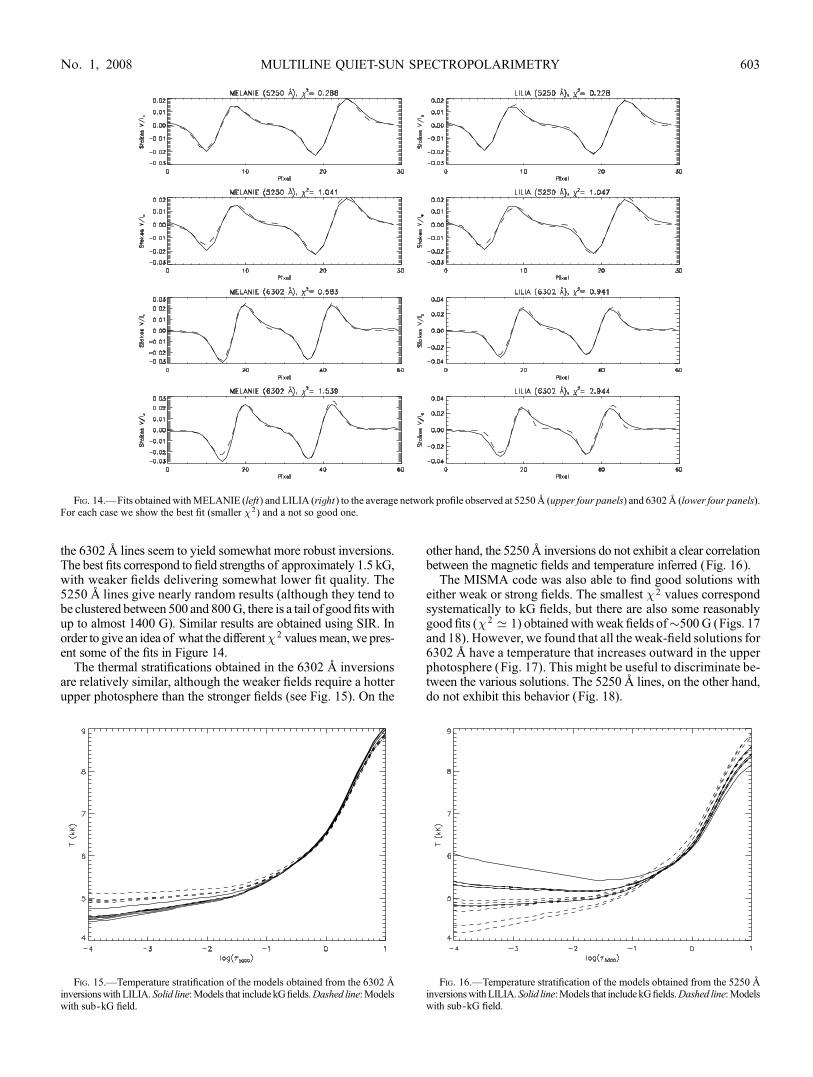
the 63028 lines seem to yield somewhat more robust inversions.The best fits correspond to field strengths of approximately 1.5 kG,with weaker fields delivering somewhat lower fit quality. The5250 8 lines give nearly random results (although they tend tobe clustered between 500 and 800G, there is a tail of goodfitswithup to almost 1400 G). Similar results are obtained using SIR. Inorder to give an idea of what the different�2 valuesmean,we pres-ent some of the fits in Figure 14.
The thermal stratifications obtained in the 6302 8 inversionsare relatively similar, although the weaker fields require a hotterupper photosphere than the stronger fields (see Fig. 15). On the
other hand, the 52508 inversions do not exhibit a clear correlationbetween the magnetic fields and temperature inferred (Fig. 16).
The MISMA code was also able to find good solutions witheither weak or strong fields. The smallest �2 values correspondsystematically to kG fields, but there are also some reasonablygood fits (�2 ’ 1) obtained with weak fields of�500G (Figs. 17and 18). However, we found that all the weak-field solutions for6302 A have a temperature that increases outward in the upperphotosphere (Fig. 17). This might be useful to discriminate be-tween the various solutions. The 5250 8 lines, on the other hand,do not exhibit this behavior (Fig. 18).
Fig. 14.—Fits obtainedwithMELANIE (left) and LILIA (right ) to the average network profile observed at 52508 (upper four panels) and 63028 (lower four panels).For each case we show the best fit (smaller �2) and a not so good one.
Fig. 15.—Temperature stratification of the models obtained from the 6302 8inversionswithLILIA.Solid line:Models that include kGfields.Dashed line:Modelswith sub-kG field.
Fig. 16.—Temperature stratification of the models obtained from the 5250 8inversionswithLILIA.Solid line:Models that include kGfields.Dashed line:Modelswith sub-kG field.
MULTILINE QUIET-SUN SPECTROPOLARIMETRY 603No. 1, 2008
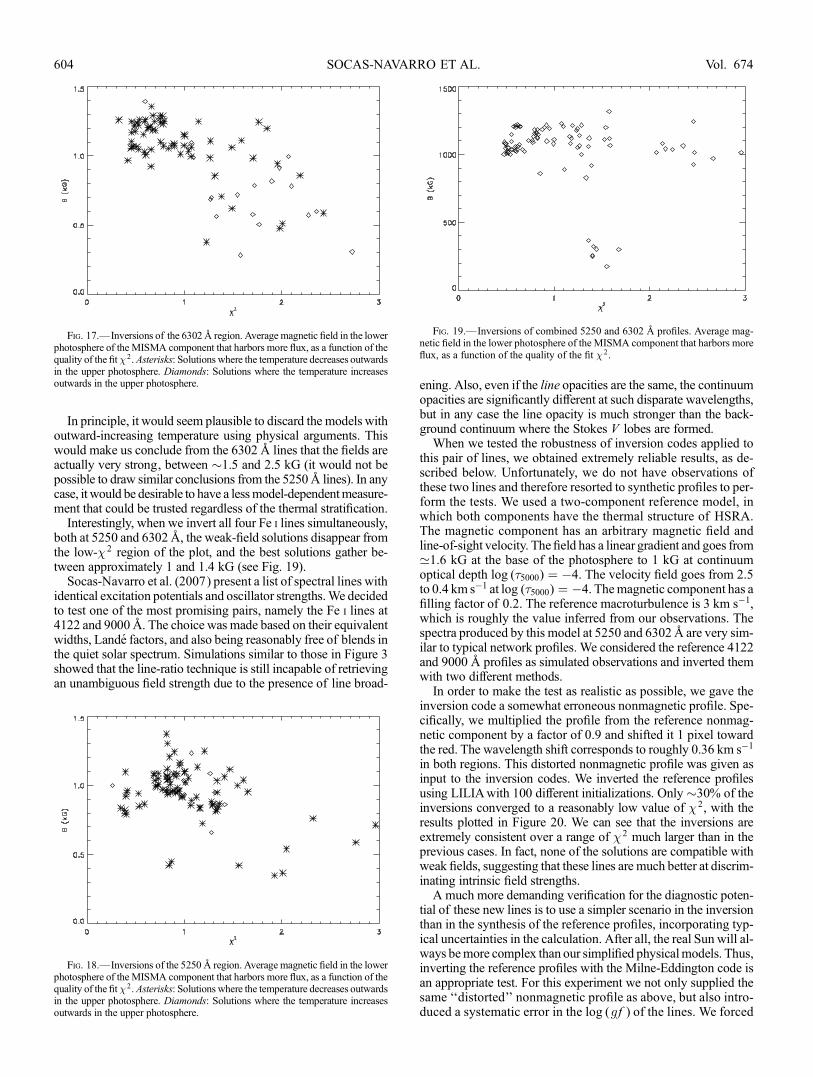
In principle, it would seem plausible to discard the models withoutward-increasing temperature using physical arguments. Thiswould make us conclude from the 63028 lines that the fields areactually very strong, between �1.5 and 2.5 kG (it would not bepossible to draw similar conclusions from the 52508 lines). In anycase, it would be desirable to have a lessmodel-dependentmeasure-ment that could be trusted regardless of the thermal stratification.
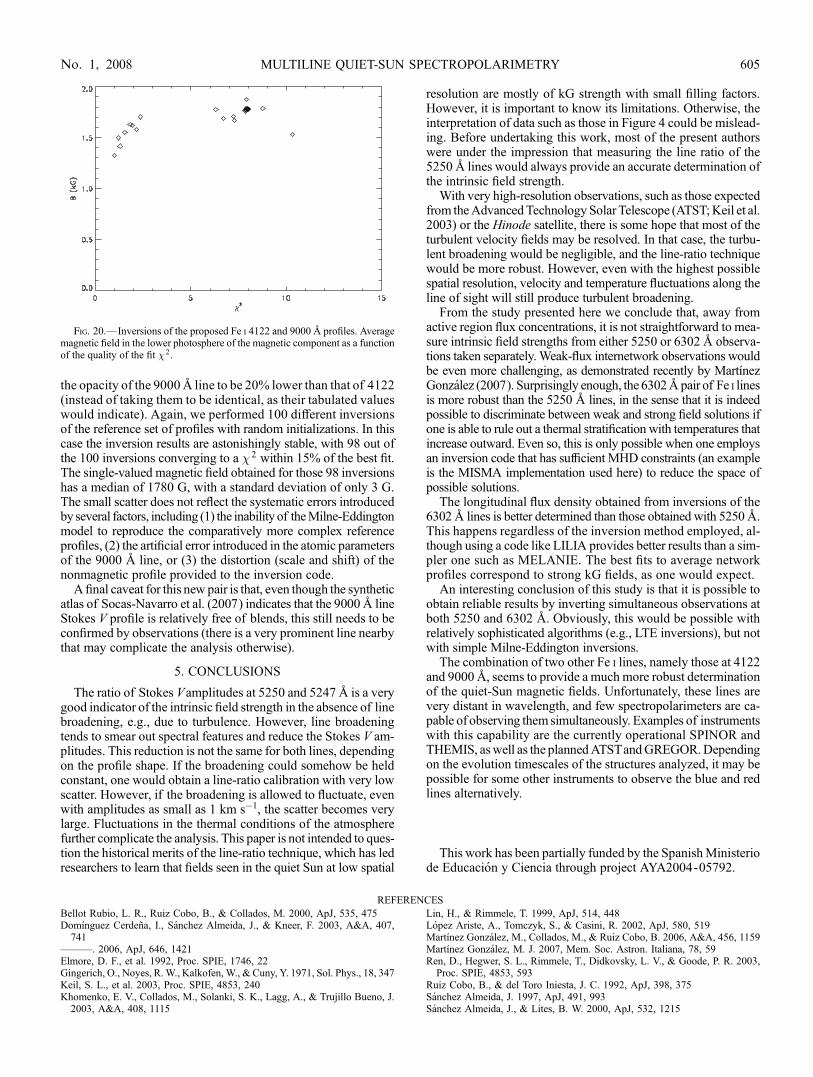
Interestingly, when we invert all four Fe i lines simultaneously,both at 5250 and 63028, the weak-field solutions disappear fromthe low-�2 region of the plot, and the best solutions gather be-tween approximately 1 and 1.4 kG (see Fig. 19).
Socas-Navarro et al. (2007) present a list of spectral lines withidentical excitation potentials and oscillator strengths.We decidedto test one of the most promising pairs, namely the Fe i lines at4122 and 90008. The choice was made based on their equivalentwidths, Lande factors, and also being reasonably free of blends inthe quiet solar spectrum. Simulations similar to those in Figure 3showed that the line-ratio technique is still incapable of retrievingan unambiguous field strength due to the presence of line broad-
ening. Also, even if the line opacities are the same, the continuumopacities are significantly different at such disparate wavelengths,but in any case the line opacity is much stronger than the back-ground continuum where the Stokes V lobes are formed.When we tested the robustness of inversion codes applied to
this pair of lines, we obtained extremely reliable results, as de-scribed below. Unfortunately, we do not have observations ofthese two lines and therefore resorted to synthetic profiles to per-form the tests. We used a two-component reference model, inwhich both components have the thermal structure of HSRA.The magnetic component has an arbitrary magnetic field andline-of-sight velocity. The field has a linear gradient and goes from’1.6 kG at the base of the photosphere to 1 kG at continuumoptical depth log (�5000) ¼ �4. The velocity field goes from 2.5to 0.4 km s�1 at log (�5000) ¼ �4. Themagnetic component has afilling factor of 0.2. The reference macroturbulence is 3 km s�1,which is roughly the value inferred from our observations. Thespectra produced by this model at 5250 and 63028 are very sim-ilar to typical network profiles. We considered the reference 4122and 9000 8 profiles as simulated observations and inverted themwith two different methods.In order to make the test as realistic as possible, we gave the
inversion code a somewhat erroneous nonmagnetic profile. Spe-cifically, we multiplied the profile from the reference nonmag-netic component by a factor of 0.9 and shifted it 1 pixel towardthe red. The wavelength shift corresponds to roughly 0.36 km s�1
in both regions. This distorted nonmagnetic profile was given asinput to the inversion codes. We inverted the reference profilesusing LILIAwith 100 different initializations. Only �30% of theinversions converged to a reasonably low value of �2, with theresults plotted in Figure 20. We can see that the inversions areextremely consistent over a range of �2 much larger than in theprevious cases. In fact, none of the solutions are compatible withweak fields, suggesting that these lines are much better at discrim-inating intrinsic field strengths.A much more demanding verification for the diagnostic poten-
tial of these new lines is to use a simpler scenario in the inversionthan in the synthesis of the reference profiles, incorporating typ-ical uncertainties in the calculation. After all, the real Sun will al-ways bemore complex than our simplified physicalmodels. Thus,inverting the reference profiles with the Milne-Eddington code isan appropriate test. For this experiment we not only supplied thesame ‘‘distorted’’ nonmagnetic profile as above, but also intro-duced a systematic error in the log (g f ) of the lines. We forced
Fig. 17.—Inversions of the 63028 region. Average magnetic field in the lowerphotosphere of the MISMA component that harbors more flux, as a function of thequality of the fit�2. Asterisks: Solutions where the temperature decreases outwardsin the upper photosphere. Diamonds: Solutions where the temperature increasesoutwards in the upper photosphere.
Fig. 18.—Inversions of the 52508 region. Average magnetic field in the lowerphotosphere of the MISMA component that harbors more flux, as a function of thequality of the fit�2. Asterisks: Solutions where the temperature decreases outwardsin the upper photosphere. Diamonds: Solutions where the temperature increasesoutwards in the upper photosphere.
Fig. 19.—Inversions of combined 5250 and 6302 8 profiles. Average mag-netic field in the lower photosphere of the MISMA component that harbors moreflux, as a function of the quality of the fit �2.
SOCAS-NAVARRO ET AL.604 Vol. 674
the opacity of the 90008 line to be 20% lower than that of 4122(instead of taking them to be identical, as their tabulated valueswould indicate). Again, we performed 100 different inversionsof the reference set of profiles with random initializations. In thiscase the inversion results are astonishingly stable, with 98 out ofthe 100 inversions converging to a �2 within 15% of the best fit.The single-valued magnetic field obtained for those 98 inversionshas a median of 1780 G, with a standard deviation of only 3 G.The small scatter does not reflect the systematic errors introducedby several factors, including (1) the inability of theMilne-Eddingtonmodel to reproduce the comparatively more complex referenceprofiles, (2) the artificial error introduced in the atomic parametersof the 9000 8 line, or (3) the distortion (scale and shift) of thenonmagnetic profile provided to the inversion code.
A final caveat for this new pair is that, even though the syntheticatlas of Socas-Navarro et al. (2007) indicates that the 90008 lineStokes V profile is relatively free of blends, this still needs to beconfirmed by observations (there is a very prominent line nearbythat may complicate the analysis otherwise).
5. CONCLUSIONS
The ratio of Stokes Vamplitudes at 5250 and 52478 is a verygood indicator of the intrinsic field strength in the absence of linebroadening, e.g., due to turbulence. However, line broadeningtends to smear out spectral features and reduce the Stokes V am-plitudes. This reduction is not the same for both lines, dependingon the profile shape. If the broadening could somehow be heldconstant, one would obtain a line-ratio calibration with very lowscatter. However, if the broadening is allowed to fluctuate, evenwith amplitudes as small as 1 km s�1, the scatter becomes verylarge. Fluctuations in the thermal conditions of the atmospherefurther complicate the analysis. This paper is not intended to ques-tion the historical merits of the line-ratio technique, which has ledresearchers to learn that fields seen in the quiet Sun at low spatial
resolution are mostly of kG strength with small filling factors.However, it is important to know its limitations. Otherwise, theinterpretation of data such as those in Figure 4 could be mislead-ing. Before undertaking this work, most of the present authorswere under the impression that measuring the line ratio of the52508 lines would always provide an accurate determination ofthe intrinsic field strength.
With very high-resolution observations, such as those expectedfrom theAdvancedTechnology Solar Telescope (ATST;Keil et al.2003) or the Hinode satellite, there is some hope that most of theturbulent velocity fields may be resolved. In that case, the turbu-lent broadening would be negligible, and the line-ratio techniquewould be more robust. However, even with the highest possiblespatial resolution, velocity and temperature fluctuations along theline of sight will still produce turbulent broadening.
From the study presented here we conclude that, away fromactive region flux concentrations, it is not straightforward to mea-sure intrinsic field strengths from either 5250 or 6302 8 observa-tions taken separately.Weak-flux internetwork observations wouldbe even more challenging, as demonstrated recently by MartınezGonzalez (2007). Surprisingly enough, the 63028 pair of Fe i linesis more robust than the 5250 8 lines, in the sense that it is indeedpossible to discriminate between weak and strong field solutions ifone is able to rule out a thermal stratification with temperatures thatincrease outward. Even so, this is only possible when one employsan inversion code that has sufficient MHD constraints (an exampleis the MISMA implementation used here) to reduce the space ofpossible solutions.
The longitudinal flux density obtained from inversions of the63028 lines is better determined than those obtained with 52508.This happens regardless of the inversion method employed, al-though using a code like LILIA provides better results than a sim-pler one such as MELANIE. The best fits to average networkprofiles correspond to strong kG fields, as one would expect.
An interesting conclusion of this study is that it is possible toobtain reliable results by inverting simultaneous observations atboth 5250 and 6302 8. Obviously, this would be possible withrelatively sophisticated algorithms (e.g., LTE inversions), but notwith simple Milne-Eddington inversions.
The combination of two other Fe i lines, namely those at 4122and 90008, seems to provide a much more robust determinationof the quiet-Sun magnetic fields. Unfortunately, these lines arevery distant in wavelength, and few spectropolarimeters are ca-pable of observing them simultaneously. Examples of instrumentswith this capability are the currently operational SPINOR andTHEMIS, aswell as the plannedATSTandGREGOR.Dependingon the evolution timescales of the structures analyzed, it may bepossible for some other instruments to observe the blue and redlines alternatively.
This work has been partially funded by the SpanishMinisteriode Educacion y Ciencia through project AYA2004-05792.
REFERENCES
Bellot Rubio, L. R., Ruiz Cobo, B., & Collados, M. 2000, ApJ, 535, 475Domınguez Cerdena, I., Sanchez Almeida, J., & Kneer, F. 2003, A&A, 407,741
———. 2006, ApJ, 646, 1421Elmore, D. F., et al. 1992, Proc. SPIE, 1746, 22Gingerich, O., Noyes, R. W., Kalkofen, W., & Cuny, Y. 1971, Sol. Phys., 18, 347Keil, S. L., et al. 2003, Proc. SPIE, 4853, 240Khomenko, E. V., Collados, M., Solanki, S. K., Lagg, A., & Trujillo Bueno, J.2003, A&A, 408, 1115
Lin, H., & Rimmele, T. 1999, ApJ, 514, 448Lopez Ariste, A., Tomczyk, S., & Casini, R. 2002, ApJ, 580, 519Martınez Gonzalez, M., Collados, M., & Ruiz Cobo, B. 2006, A&A, 456, 1159Martınez Gonzalez, M. J. 2007, Mem. Soc. Astron. Italiana, 78, 59Ren, D., Hegwer, S. L., Rimmele, T., Didkovsky, L. V., & Goode, P. R. 2003,Proc. SPIE, 4853, 593
Ruiz Cobo, B., & del Toro Iniesta, J. C. 1992, ApJ, 398, 375Sanchez Almeida, J. 1997, ApJ, 491, 993Sanchez Almeida, J., & Lites, B. W. 2000, ApJ, 532, 1215
Fig. 20.—Inversions of the proposed Fe i 4122 and 9000 8 profiles. Averagemagnetic field in the lower photosphere of the magnetic component as a functionof the quality of the fit �2.
MULTILINE QUIET-SUN SPECTROPOLARIMETRY 605No. 1, 2008

Skumanich, A., & Lites, B. W. 1987, ApJ, 322, 473Socas-Navarro, H. 2001, in ASP Conf. Ser. 236, Advanced Solar Polarimetry—Theory, Observation, and Instrumentation, ed. M. Sigwarth (San Francisco:ASP), 487
Socas-Navarro, H., Asensio Ramos, A., &Manso Sainz, R. 2007,A&A, 465, 339Socas-Navarro, H., Elmore, D., Pietarila, A., Darnell, A., Lites, B., & Tomczyk, S.2006, Sol. Phys., 235, 55
Socas-Navarro, H., & Lites, B. W. 2004, ApJ, 616, 587Socas-Navarro, H., & Sanchez Almeida, J. 2002, ApJ, 565, 1323———. 2003, ApJ, 593, 581Stenflo, J. O. 1973, Sol. Phys., 32, 41Stenflo, J. O., Solanki, S., Harvey, J. W., & Brault, J. W. 1984, A&A, 131, 333
SOCAS-NAVARRO ET AL.606
Related Documents