JOURNALO[ GEOCHEMICAL EXPLORATION ELSEVIER Journal of GeochemicalExploration51 (1994) 11-35 Multi-element relationships and spatial structures of regional geochemical data from stream sediments, southwestern Quebec, Canada Claude Bellehumeul ~, Denis Marcotte b, Michel J6brak a aD~partement des Sciences de la Terre, Universitd du Quebec &Montrdal, C.P. 8888, Succ. A, Montrdal, Que H3C 3P8, Canada bDdpartement de G~nie Mineral, Ecole Polytechnique de Montrdal, C.P. 6079, Succ. A, Montrdal, Que. H3C 3A7, Canada (Received 5 January 1993; accepted after revision9 December 1993) Abstract A regional geochemical survey, covering an area of 10000 km: in the Grenville Province of southwestern Quebec, was carried out by the Quebec Department of Energy and Resources. The fine ( < 177 /zm) and heavy fraction of stream sediments were analyzed for more than 25 chemical elements by ICPES and by INAA. This study aims to identify the main geological processes affecting the geochemical data of both media, by considering the multi-element relationships and spatial structures of the geochemical data. Fine fraction and heavy mineral concentrates were subjected to: ( 1) principal component analysis (PCA) to determine the inter-element relationships controlling the background variations; and (2) variogram analysis to establish the spatial continuity of geological phenomena associated with the factors of the PCA. The stability of PCA results was tested by using a bootstrap replication technique. Detailed geochemical and mineralogical studies were conducted on different densimetric and granu- lometric fractions in order to characterize the geochemical behavior of each fraction, and to relate the inter-element associations to a specific mineralogy. Our study shows that the fine and heavy fractions indicate different geochemical information. The background levels and the multi-element associations differ between both media. A principal com- ponent model shows that the fine fraction is strongly influenced by surficial processes, explaining approximately 55% of the data variability. Two factors accounting for only 23 % of the data variability in the fine fraction are related to lithologies. The heavy fraction reflects lithological characteristics. Three factors, accounting for 51% of the variation in the data, represent mineralogical features of the principal lithologic units. Two other factors reflect geochemical components that could be related to mineralizationor lithologies of interest for prospecting. The variograms reveal the different spatial variation components of the geochemical signals. They show high nugget effect (more than 40%), indicating the erratic occurrence of phases hosting 0375-6742/94/$07.00 © 1994 ElsevierScienceB.V. All rights reserved SSD10375-6742(93) E0060-A

Welcome message from author
This document is posted to help you gain knowledge. Please leave a comment to let me know what you think about it! Share it to your friends and learn new things together.
Transcript
JOURNAL O[ GEOCHEMICAL EXPLORATION
ELSEVIER Journal of Geochemical Exploration 51 (1994) 11-35
Multi-element relationships and spatial structures of regional geochemical data from stream sediments,
southwestern Quebec, Canada
Claude Be l lehumeul ~, Denis Marcotte b, Michel J6brak a aD~partement des Sciences de la Terre, Universitd du Quebec & Montrdal, C.P. 8888, Succ. A,
Montrdal, Que H3C 3P8, Canada bDdpartement de G~nie Mineral, Ecole Polytechnique de Montrdal, C.P. 6079, Succ. A,
Montrdal, Que. H3C 3A7, Canada
(Received 5 January 1993; accepted after revision 9 December 1993)
Abstract
A regional geochemical survey, covering an area of 10000 km: in the Grenville Province of southwestern Quebec, was carried out by the Quebec Department of Energy and Resources. The fine ( < 177 /zm) and heavy fraction of stream sediments were analyzed for more than 25 chemical elements by ICPES and by INAA. This study aims to identify the main geological processes affecting the geochemical data of both media, by considering the multi-element relationships and spatial structures of the geochemical data.
Fine fraction and heavy mineral concentrates were subjected to: ( 1 ) principal component analysis (PCA) to determine the inter-element relationships controlling the background variations; and (2) variogram analysis to establish the spatial continuity of geological phenomena associated with the factors of the PCA. The stability of PCA results was tested by using a bootstrap replication technique. Detailed geochemical and mineralogical studies were conducted on different densimetric and granu- lometric fractions in order to characterize the geochemical behavior of each fraction, and to relate the inter-element associations to a specific mineralogy.
Our study shows that the fine and heavy fractions indicate different geochemical information. The background levels and the multi-element associations differ between both media. A principal com- ponent model shows that the fine fraction is strongly influenced by surficial processes, explaining approximately 55% of the data variability. Two factors accounting for only 23 % of the data variability in the fine fraction are related to lithologies.
The heavy fraction reflects lithological characteristics. Three factors, accounting for 51% of the variation in the data, represent mineralogical features of the principal lithologic units. Two other factors reflect geochemical components that could be related to mineralization or lithologies of interest for prospecting.
The variograms reveal the different spatial variation components of the geochemical signals. They show high nugget effect (more than 40%), indicating the erratic occurrence of phases hosting
0375-6742/94/$07.00 © 1994 Elsevier Science B.V. All rights reserved SSD10375-6742(93) E0060-A
12 C. B e l l e h u m e u r et a l. / J o u r n a l ~[' G e o c h e m i c a l E~tploration 51 ~ 1994) I 1 35
geochemical signals in the sampled media. They allow the spatial scales of geochemical components to be recognized, and the geological phenomena associated with regional trends to be differentiated from those acting at local scales. Knowledge of spatial variation components provides useful infor- mation for estimating suitable sampling intervals with regards to geochemical surveys, and aids in proposing solutions for reducing the nugget effect.
1. Introduction
Geochemical data collected in the surficial environment reflect the influence of several sources. Chemical elements in stream sediments may be found: (1) as constituents of primary rock-forming minerals, (2) as minerals formed during weathering, ( 3 ) as minerals typical of mineralization, (4) as ions adsorbed onto colloidal particles and clays, and (5) in combination with organic matter (Rose, 1975). The characterization of these sources is dependent on the material collected and analyzed. For example, when comparing the geo- chemical data from the minus 180/xm fraction of stream sediments and lake sediments, Davenport (1990) observed that these media exhibit important differences in both median and range, and show little or no spatial correlation. These media are subject to different influences, and underline different geological features. In order to perform geologic and metallogenic interpretations or to isolate the influence of mineralization, it is important to know what type of geochemical information is carried by the sampled media, and to characterize the factors controlling the dispersion of geochemical signals.
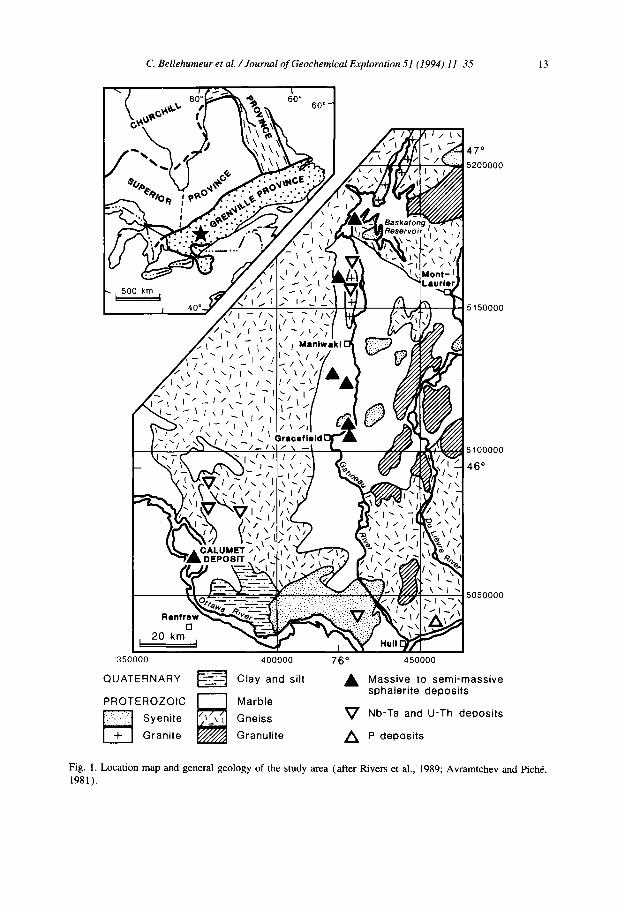
The Quebec Department of Energy and Resources has undertaken a geochemical mapping program of the southern part of the Grenville Province that uses the heavy mineral concen- trates and the fine fraction of stream sediments. Several large anomalous zones have been discovered, however, it is difficult to evaluate their usefulness for prospecting due to the inability to identify the sources of the geochemical signals. In this paper, the geochemical information carried by the fine fraction and heavy mineral concentrates of stream sediments is studied over an area of 10000 km 2 along the Gatineau River in southwestern Quebec (Fig. 1 ) (Choini6re, 1988, 1989). The intent of this study is to identify the characteristics of the geochemical sources by considering the multi-element relationships and the spatial structures of the geochemical data for both media.
The first part of the study aims at identifying the mineralogical phases hosting the geochemical signals. The principal geological phenomena influencing the geochemical data of both media were modelled by using principal component analysis (PCA) to reveal the multi-element relationships in the whole data set of 1069 samples. The stability of the PCA results was studied using a random sampling procedure of the data matrices by the bootstrap method. Detailed geochemical and mineralogical studies were conducted on different den- simetric and granulometric fractions of seven samples. These studies characterize the geo- chemical behavior of each fraction, and relate the multi-element associations revealed by PCA to a specific mineralogy.
The second part of the study aims at characterizing the spatial structures of geochemical signals. The principal components scores were subjected to a variogram analysis in order to establish the spatial variability of geochemical signals. Spatial variability is a property
C. Bellehumeur et al. / Journal of Geochemical Exploration 51 (1994) 11-35 13
47* 5200000
5150000
5100000 46 o
5050000
350000 400000 76 ° 450000
QUATERNARY ~ Clay and silt • Massive to semi-massive sphalerite deposits
PROTEROZOIC ~ Marble Syenite Gneiss ~ ' Nb-Ta and U-Th deposits
Granite Granulite ,/~ P deposits
Fig. 1. Location map and general geology of the study area (after Rivers et al., 1989; Avramtchev and Pich6, 1981).
14 C. Bellehumeur et al. / Journal ~/' Geochemical Exploration 51 (1994) 11-35
inherent to the geochemical landscape which was not considered important in the interpre- tation of regional geochemical surveys. Spatial variability may provide information about the extent of geochemical sources and dispersion processes, and reveals how sample spacing is appropriate to characterize geological phenomena acting at different spatial scales.
2. Geological setting and mineralization
The geochemical survey lies within the western part of the Mont-Laurier Terrane (MLT) which constitutes a portion of the Allochthonous Monocyclic Belt of the Grenville Structural Province in southwestern Quebec (Rivers et al., 1989) (Fig. 1 ). The MLT is composed of Middle Proterozoic supracrustal rocks (1300-1200 Ma) that have been thrust onto Early Proterozoic terranes. Marbles are abundant in the northwest part of the MLT; metapelites, quartzites, amphibolites and granulitic gneisses predominate elsewhere. These lithologies were affected by the Grenvillian orogenic cycle ( 1250-1050 Ma; Moore and Thompson, 1980). The degree of metamorphism varies from upper amphibolite to granulite facies. A large number of igneous bodies have intruded the Monocyclic Belt in the Gatineau River area. Avramtchev and Pich6 ( 1981 ) mention several types of plutonic rocks that are appar- ently concordant with regional structures; however, some syenite plutons which may have been generated during the late stages of Grenvillian deformation are discordant ( Corriveau, 1989).
Most metallic mineralization in the Grenville Province is hosted by Middle Proterozoic supracrustal rocks (Sangster et al., 1992). Stratiform zinc deposits are the most important type of base metal mineralization in the study area. They are concentrated in the Maniwaki- Gracefield district ( Gauthier and Brown, 1986). The Monocyclic Belt also hosts stratabound polymetallic deposits (Zn, Pb, Cu, Ag, Au), such as the Calumet, Montauban and Simon mines, which are associated with gneisses containing bands of biotite, cordierite and antho- phyllite (Bishop and Jourdain, 1987). Non-economic mineralization of rare earth elements (REE), Nb-Ta, U and Th characterize the pegmatites of the Gatineau and Mont-Laurier area (Ayres and Cerny, 1982). Pegmatites and contact-skarns interstratified with marbles host several small phosphate deposits.
The dominant ice flow direction during the Upper Wisconsinan Stage of Pleistocene glaciation ( 10000 a) was southerly (Kettles and Shilts, 1989). Till is the most widespread deposit, forming a thin cover over Precambrian bedrock. Along the Ottawa and Gatineau Valleys, glacio-marine and glacio-lacustrine sediments predominate.
3. Sampling and analytical method
Stream sediment samples were collected from 1069 sites covering an area of 10000 km 2 ( 1 / 10 km 2) for a general mineral resource assessment. Two samples were collected at each site. The first was sieved to < 177 /~m ( - 8 0 mesh). The second sample was sieved to < 850/~m ( - 20 mesh), and the heavy mineral concentrate was prepared with a gravity table. The magnetic fraction was removed with a hand magnet. The samples contained 15%
C. Bellehumeur et al. / Journal of Geochemical Exploration 51 (1994) 11-35 15
to 30% of light minerals (sg < 3.3) after this treatment. The concentration factor (Initial Weight /Heavy Concentrate Weight) varies from 40 to 100 (Choini6re, 1988).
The heavy non-magnetic material was pulverized to < 177/xm. The fine fraction and the heavy concentrate were dissolved in hot HNO3, and Ag, A1, B, Be, Ca, Cd, Ce, Co, Cr, Cu, Eu, Fe, K, La, Li, Mg, Mn, Mo, Na, P, Pb, Sm, Sr, Th, Ti, V, Y and Zn were determined by inductively coupled plasma emission spectrometry (ICPES); Hg was determined by
atomic absorption spectrometry. One gram of material was analyzed for As, Au, Br, Cs, Sb, Se, Tm, U, and W by instrumental neutron activation. Organic matter was not analyzed, however, loss-on-ignition (LOI) is reported.
4. Detailed mineralogical and geochemical studies of stream sediments
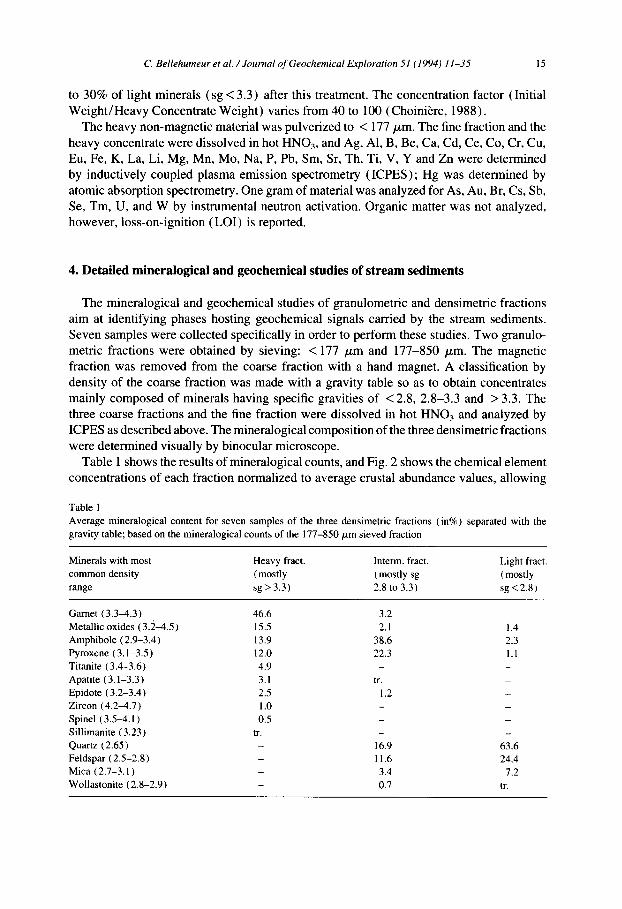
The mineralogical and geochemical studies of granulometric and densimetric fractions aim at identifying phases hosting geochemical signals carried by the stream sediments. Seven samples were collected specifically in order to perform these studies. Two granulo- metric fractions were obtained by sieving: < 177 ~ m and 177-850 /xm. The magnetic fraction was removed from the coarse fraction with a hand magnet. A classification by density of the coarse fraction was made with a gravity table so as to obtain concentrates mainly composed of minerals having specific gravities of < 2.8, 2.8-3.3 and > 3.3. The three coarse fractions and the fine fraction were dissolved in hot HNO3 and analyzed by ICPES as described above. The mineralogical composition of the three densimetric fractions were determined visually by binocular microscope.
Table I shows the results of mineralogical counts, and Fig. 2 shows the chemical element concentrations of each fraction normalized to average crustal abundance values, allowing
Table 1 Average mineralogical content for seven samples of the three densimetric fractions (in%) separated with the gravity table; based on the mineralogical counts of the 177-850/zm sieved fraction
Minerals with most Heavy fract. Interm. fract. Light fract. common density (mostly (mostly sg ( mostly range sg > 3.3) 2.8 to 3.3) sg < 2.8)
Garnet (3.3-4.3) 46.6 3.2 - Metallic oxides ( 3.:~-4.5 ) 15.5 2.1 1.4 Amphibole ( 2.9-3.4 ) 13.9 38.6 2.3 Pyroxene ( 3.1-3.5 ) 12.0 22.3 1.1 Titanite (3.4-3.6) 4.9 - - Apatite (3.1-3.3) 3.1 tr. - Epidote (3.2-3.4) 2.5 1.2 - Zircon (4.2-4.7) 1.0 - - Spinel ( 3.54.1 ) 0.5 - - Sillimanite (3.23) tr. - - Quartz (2.65) - 16.9 63.6 Feldspar (2.5-2.8) - 11.6 24.4 Mica (2.7-3.1) - 3.4 7.2 Wollastonite (2.8-2.9) - 0.7 tr.
16 C. Bellehumeur et al. / Journal of Geochemical Exploration 51 (1994) I 1-35
°° 01
g g
,3
g
Ti Fe Mn Co Mg Ca AI Li Na K Sr Ba La Y Zr
E l e m e n t s
i - - . - - 1 > 3.3 g/cm 3
1 7 7 - 8 5 5 pm F r a c t i o n • . . . . • 2.8-3.3 g/cm 3
= : < 2.8 g/cm 3
< 1 7 7 ~m F r a c t i o n t - - - - ,
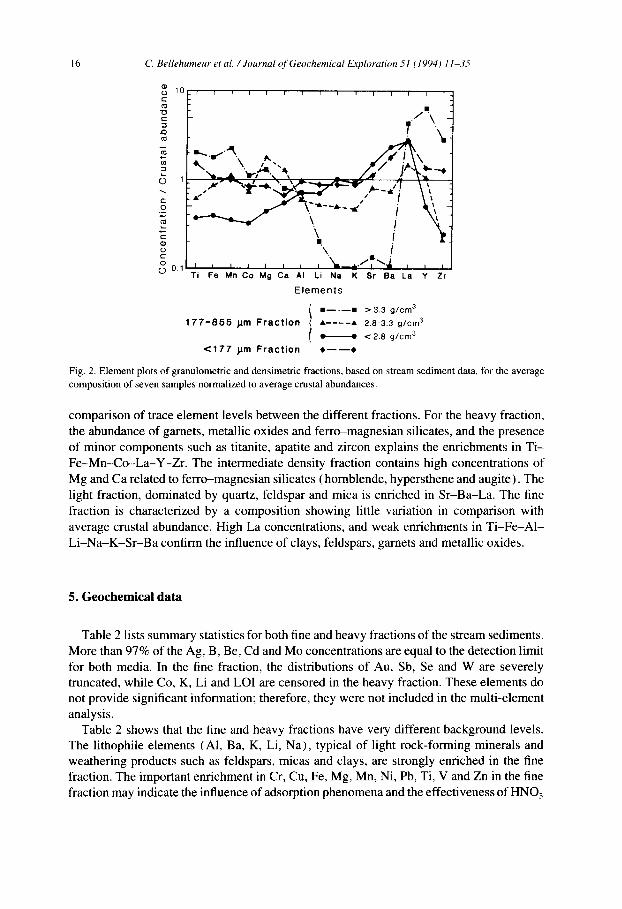
Fig. 2. Element plots of granulometric and densimetric fractions, based on stream sediment data, for the average composition of seven samples normalized to average crustal abundances.
comparison of trace element levels between the different fractions. For the heavy fraction, the abundance of garnets, metallic oxides and ferro-magnesian silicates, and the presence of minor components such as titanite, apatite and zircon explains the enrichments in Ti- Fe-Mn-Co-La-Y-Zr . The intermediate density fraction contains high concentrations of Mg and Ca related to ferro-magnesian silicates (homblende, hypersthene and augite). The light fraction, dominated by quartz, feldspar and mica is enriched in Sr-Ba-La. The fine fraction is characterized by a composition showing little variation in comparison with average crustal abundance. High La concentrations, and weak enrichments in Ti-Fe-A1- L i -Na-K-Sr -Ba confirm the influence of clays, feldspars, garnets and metallic oxides.
5. Geochemical data
Table 2 lists summary statistics for both fine and heavy fractions of the stream sediments. More than 97% of the Ag, B, Be, Cd and Mo concentrations are equal to the detection limit for both media. In the fine fraction, the distributions of Au, Sb, Se and W are severely truncated, while Co, K, Li and LOI are censored in the heavy fraction. These elements do not provide significant information; therefore, they were not included in the multi-element analysis.
Table 2 shows that the fine and heavy fractions have very different background levels. The lithophile elements (At, Ba, K, Li, Na), typical of light rock-forming minerals and weathering products such as feldspars, micas and clays, are strongly enriched in the fine fraction. The important enrichment in Cr, Cu, Fe, Mg, Mn, Ni, Pb, Ti, V and Zn in the fine fraction may indicate the influence of adsorption phenomena and the effectiveness of HNO3
C. Bellehumeur et al. /Journal of Geochemical Exploration 51 (1994) 11-35 17
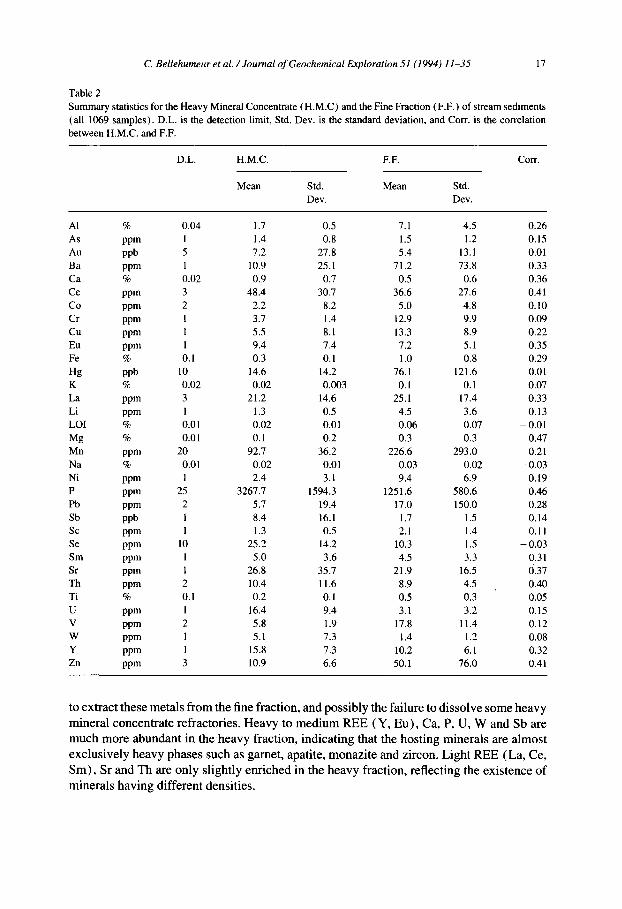
Table 2 Summary statistics for the Heavy Mineral Concentrate ( H.M.C ) and the Fine Fraction (F.F.) of stream sediments (all 1069 samples). D.L. is the detection limit, Std. Dev. is the standard deviation, and Corr. is the correlation between H.M.C. and F.F.
D.L. H.M.C. F.F. Corr.
Mean Std. Mean Std. Dev. Dev.
A1 % 0.04 1.7 0.5 7.1 4.5 0.26 As ppm 1 1.4 0.8 1.5 1.2 0.15 Au ppb 5 7.2 27.8 5.4 13.1 0.01 Ba ppm 1 10.9 25.1 71.2 73.8 0.33 Ca % 0.02 0.9 0.7 0.5 0.6 0.36 Ce ppm 3 48.4 30.7 36.6 27.6 0.41 Co ppm 2 2.2 8.2 5.0 4.8 0.10 Cr ppm 1 3.7 1.4 12.9 9.9 0.09 Cu ppm 1 5.5 8.1 13.3 8.9 0.22 Eu ppm I 9.4 7.4 7.2 5.1 0.35 Fe % 0.1 0.3 0.1 1.0 0.8 0.29 Hg ppb 10 14.6 14.2 76.1 121.6 0.01 K % 0.02 0.02 0.003 0.1 0.1 0.07 La ppm 3 21.2 14.6 25.1 17.4 0.33 Li ppm 1 1.3 0.5 4.5 3.6 0.13 LOI % 0.01 0.02 0.01 0.06 0.07 - 0.01 Mg % 0.01 0.1 0.2 0.3 0.3 0.47 Mn ppm 20 92.7 36.2 226.6 293.0 0.21 Na % 0.01 0.02 0.01 0.03 0.02 - 0.03 Ni ppm 1 2.4 3.1 9.4 6.9 0.19 P ppm 25 3267.7 1594.3 1251.6 580.6 0.46 Pb ppm 2 5.7 19.4 17.0 150.0 0.28 Sb ppb 1 8.4 16.1 1.7 1.5 0.14 Sc ppm 1 1.3 0.5 2.1 1.4 0.11 Se ppm 10 25.2 14.2 10.3 1.5 -0 .03 Sm ppm 1 5.0 3.6 4.5 3.3 0.31 Sr ppm 1 26.8 35.7 21.9 16.5 0.37 Th ppm 2 10.4 11.6 8.9 4.5 0.40 Ti % 0.1 0.2 0.1 0.5 0.3 0.05 U ppm 1 16.4 9.4 3.1 3.2 0.15 V ppm 2 5.8 1.9 17.8 11.4 0.12 W ppm 1 5.1 7.3 1.4 1.2 0.08 Y ppm 1 15.8 7.3 10.2 6.1 0.32 Zn ppm 3 10.9 6.6 50.1 76.0 0.41
to extract these metals from the fine fraction, and possibly the failure to dissolve some heavy mineral concentrate refractories. Heavy to medium REE (Y, Eu), Ca, P, U, W and Sb are much more abundant in the heavy fraction, indicating that the hosting minerals are almost exclusively heavy phases such as garnet, apatite, monazite and zircon. Light REE (La, Ce, Sm), Sr and Th are only slightly enriched in the heavy fraction, reflecting the existence of minerals having different densities.
18 C Bellehumeur et al. / Journal ~?f Geochemical Exploration 51 (1994) I I--3 5
Most elements show strong asymmetrical unimodal distributions with few outliers. There- fore, before performing statistical calculations, these element concentrations were trans- formed to their natural logarithms. This transformation reduces the effect of high values which may strongly influence the calculation of principal components and variograms.
Correlations between the natural logarithm values of the fine and heavy fractions are quite low (Table 2). This lack of correlation indicates that both fractions carry different geochemical information. Calcium, P, La, Ce, Eu, Sm, Sr, Th and Y show moderate correlation coefficients (0.31 to 0.46) and their specific host phases occur in both fractions. Zinc and Mg also display appreciable correlations. Their common host minerals, present in both the heavy and fine fractions, are probably pyroxene, amphibole and metallic oxides.
6. Multi-element relationships
Principal component analysis (PCA) attempts to reveal the correlation structure of the variables, allowing interpretation of geological processes affecting the geochemical data. It was performed on the fine and heavy fractions using only those chemical elements whose distribution is not censored by the detection limit (Tables 3 and 4). The principal compo- nents were rotated to orthogonal simple structures using the varimax criterion. Two five- component models were retained, explaining 63% and 79% of the total data variability of the heavy and fine fractions respectively. The interpretation of principal components is partly based on the mineralogical and chemical studies of granulometric and densimetric fractions. We have also dealt with the stability of PCA results and their ability to reflect real features occurring in the data. PCA was used previously by Roquin and Zeegers (1987) and Lindqvist et al. (1987) to model the multi-element signature of background variation factors (lithologies and environment) which strongly controlled the variations of elements of economic interest.
6.1. H e a v y m i n e r a l c o n c e n t r a t e s
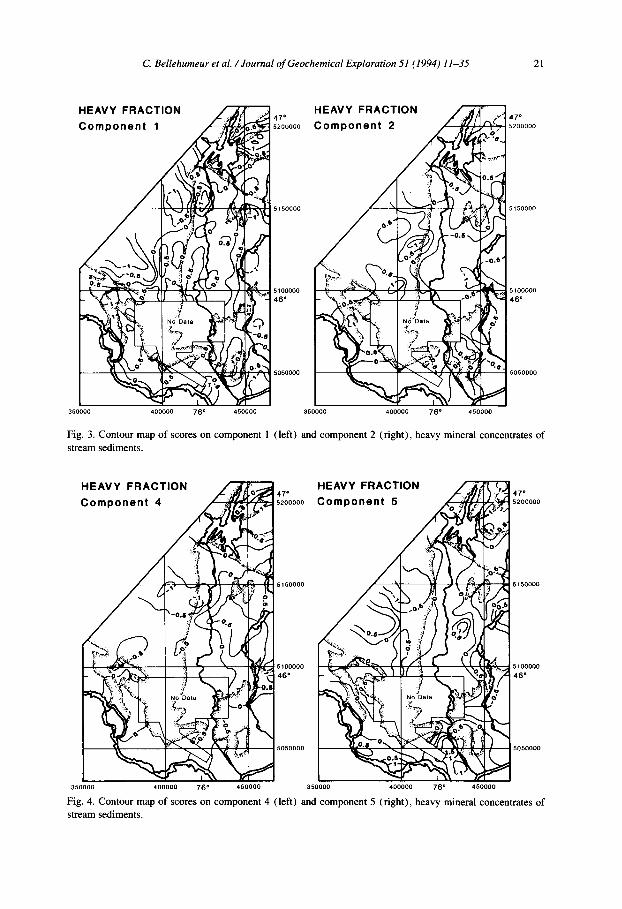
For the heavy fraction, the first component explains the dispersion of La-Ce-Y-Sr -Th and their association with apatite and/or monazite (P and Ca). The pattern iia Fig. 3 reflects the distribution of major granitic units hosting U-Th-Nb-Ta-REE prospects and the outline of the MLT. The group of phosphate deposits located in the southeast part of the sample area also appears as a positive anomaly.
The second component corresponds to the occurrence of garnets with high loadings in AI-Fe-Mn-Ti-V. The spatial pattern of this component reflects the distribution of different rock types (Fig. 3). The gneisses located in the northeast and southwest parts of the sample area are characterized by positive values, and the carbonate- and calc-silicate-rich areas of the MLT appear as negative values.
The third component is ascribed to mafic minerals with high contributions by Mg-Ni - Fe-Cr~2u-Zn. Areas with positive values are found over gneiss and rocks of granulite metamorphic facies containing orthopyroxene in the southeastern part of the area (map not shown).
Interpretation of components 4 and 5 is more complex. The multi-element associations
C. Bellehumeur et al. / Journal of Geochemical Exploration 51 (1994) 11-35 19
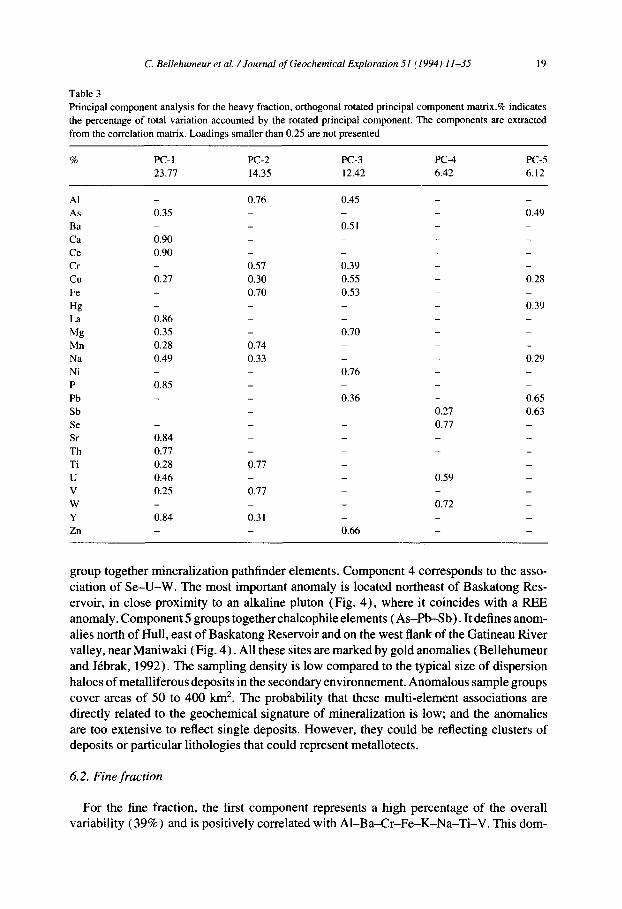
Table 3 Principal component analysis for the heavy fraction, orthogonal rotated principal component matrix.% indicates the percentage of total variation accounted by the rotated principal component. The components are extracted from the correlation matrix. Loadings smaller than 0.25 are not presented
% PC-I PC-2 PC-3 PC-4 PC-5 23.77 14.35 12.42 6.42 6.12
AI - 0.76 0.45 - - As 0.35 - - 0.49 Ba - 0.51 - Ca 0.90 - - Ce 0.90 - - Cr - 0.57 0.39 - - Cu 0.27 0.30 0.55 - 0.28 Fe - 0.70 0.53 - - Hg . . . . 0.39 La 0.86 . . . . Mg 0.35 - 0.70 - - Mn 0.28 0.74 - - - Na 0.49 0.33 - - 0.29 Ni - - 0.76 - - P 0.85 . . . . Pb - - 0.36 - 0.65 Sb - - - 0.27 0.63 Se - - - 0.77 - Sr 0.84 . . . . Th 0.77 . . . . Ti 0.28 0.77 - - - U 0.46 - - 0.59 - V 0.25 0.77 - - - W - - - 0.72 - Y 0.84 0.31 - - - Zn - - 0.66 - -
g r o u p t o g e t h e r m i n e r a l i z a t i o n p a t h f i n d e r e l e m e n t s . C o m p o n e n t 4 c o r r e s p o n d s to the a s so -
c i a t ion o f S e - U - W . T h e m o s t i m p o r t a n t a n o m a l y is l oca t ed n o r t h e a s t o f B a s k a t o n g Res -
e rvo i r , in c lo se p r o x i m i t y to an a lka l ine p l u t o n (F ig . 4 ) , w h e r e it c o i n c i d e s w i t h a R E E
a n o m a l y . C o m p o n e n t 5 g r o u p s t o g e t h e r c h a l c o p h i l e e l e m e n t s ( A s - P b - S b ) . I t de f ines a n o m -
al ies n o r t h o f Hul l , e a s t o f B a s k a t o n g R e s e r v o i r and o n the w e s t f lank o f the G a t i n e a u R i v e r
va l ley , n e a r M a n i w a k i (F ig . 4 ) . Al l t he se s i tes are m a r k e d b y g o l d a n o m a l i e s ( B e l l e h u m e u r
a n d J6brak , 1992 ) . T h e s a m p l i n g d e n s i t y is l o w c o m p a r e d to the typ ica l s ize o f d i s p e r s i o n
h a l o e s o f m e t a l l i f e r o u s d e p o s i t s in the s e c o n d a r y e n v i r o n n e m e n t . A n o m a l o u s s a m p l e g r o u p s
c o v e r a reas o f 50 to 4 0 0 k m 2. T h e p r o b a b i l i t y that t he se m u l t i - e l e m e n t a s s o c i a t i o n s are
d i rec t ly re la ted to the g e o c h e m i c a l s i g n a t u r e o f m i n e r a l i z a t i o n is l ow; a n d the a n o m a l i e s
are too e x t e n s i v e to ref lec t s ing le depos i t s . H o w e v e r , t hey c o u l d be re f lec t ing c lus t e r s o f
d e p o s i t s o r p a r t i c u l a r l i t ho log ie s that c o u l d r e p r e s e n t me ta l lo t ec t s .
6.2. F ine f r a c t i o n
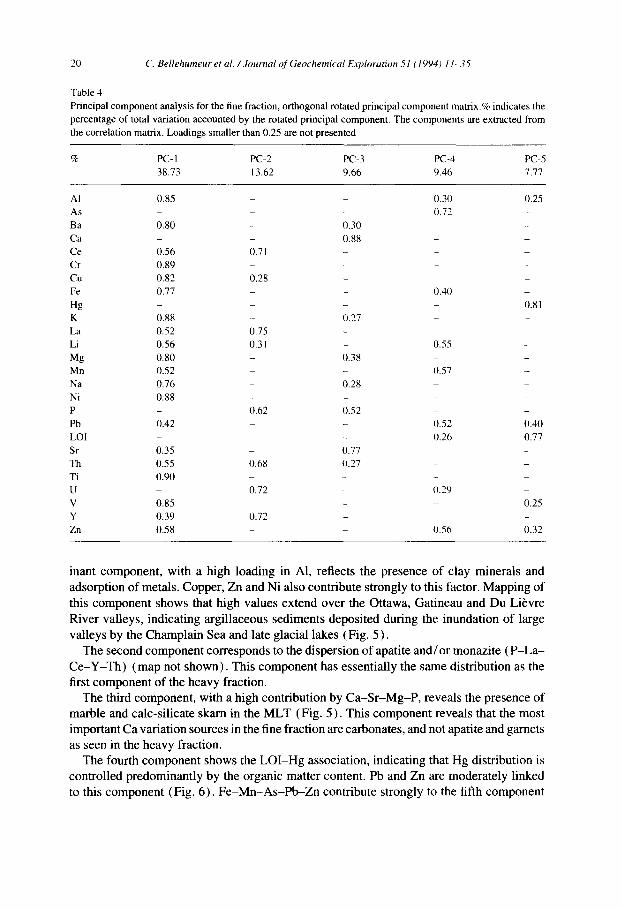
F o r the fine f rac t ion , the first c o m p o n e n t r e p r e s e n t s a h i g h p e r c e n t a g e o f the ove ra l l
va r i ab i l i ty ( 3 9 % ) and is p o s i t i v e l y co r r e l a t ed w i t h A 1 - B a - C r - F e - K - N a - T i - V . T h i s d o m -
2 0 C. Bellehumeur et al. / Journal of Geochemical Exploration 51 (1994) 11-35
Table 4
Principal component analysis for the fine fraction, orthogonal rotated principal component matrix.% indicates the
percentage o f total variation accounted by the rotated principal component. The components are extracted from
the correlation matrix. Loadings smaller than 0.25 are not presented
% P C - 1 P C - 2 P C - 3 P C - 4 P C - 5
3 8 . 7 3 1 3 . 6 2 9 . 6 6 9 . 4 6 7 . 7 7
A1 0 . 8 5 - 0 . 3 0 0 . 2 5
A s - - 0 . 7 2 -
B a 0 . 8 0 - 0 . 3 0 -
Ca - - 0.88 -
Ce 0 . 5 6 0 . 7 1 --
C r 0 . 8 9 - -
C u 0 . 8 2 0 . 2 8 -
F e 0 . 7 7 - - 0 . 4 0 -
Hg - - - 0.81
K 0 . 8 8 - 0 . 2 7 -
L a 0 . 5 2 0 . 7 5 -
L i 0 . 5 6 0 . 3 1 - 0 . 5 5 -
M g 0 . 8 0 - 0 . 3 8 - -
M n 0 . 5 2 - - 0 . 5 7 -
N a 0 . 7 6 - 0 . 2 8 -
N i 0 . 8 8 . . . . .
P - 0 . 6 2 0 . 5 2 -
P b 0 . 4 2 - - 0 . 5 2 0 . 4 0
LOI - - 0 , 2 6 0 . 7 7
S r 0 . 3 5 - 0 . 7 7 -
T h 0 . 5 5 0 . 6 8 0 . 2 7 - -
T i 0 . 9 0 . . . .
U - 0 . 7 2 - 0 . 2 9 -
V 0 . 8 5 - - 0 . 2 5
Y 0 . 3 9 0 . 7 2 -
Z n 0 . 5 8 - 0 . 5 6 0 . 3 2
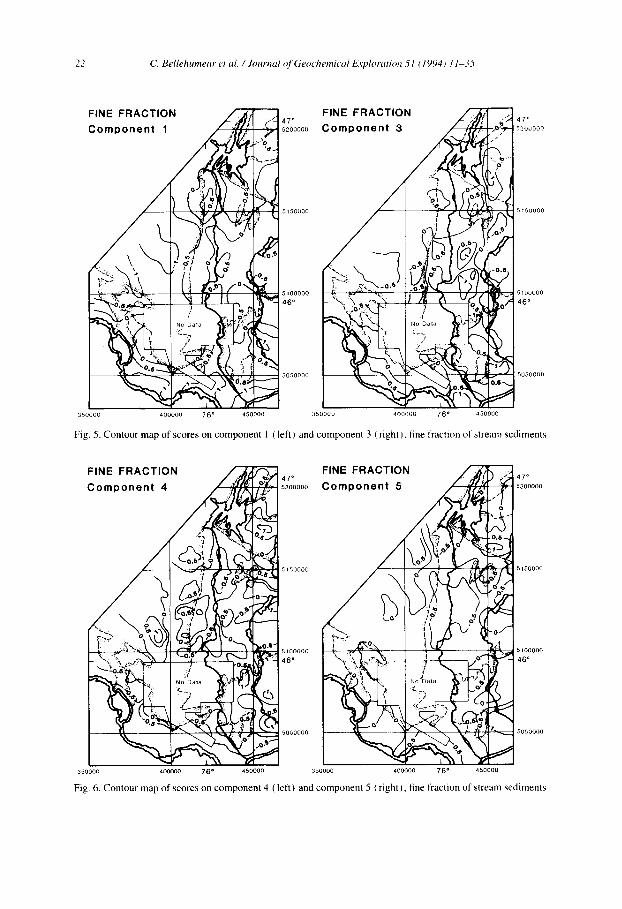
inant component, with a high loading in A1, reflects the presence of clay minerals and adsorption of metals. Copper, Zn and Ni also contribute strongly to this factor. Mapping of this component shows that high values extend over the Ottawa, Gatineau and Du Li~vre River valleys, indicating argillaceous sediments deposited during the inundation of large valleys by the Champlain Sea and late glacial lakes (Fig. 5).
The second component corresponds to the dispersion of apatite and/or monazite (P-La- Ce-Y-Th) (map not shown). This component has essentially the same distribution as the first component of the heavy fraction.
The third component, with a high contribution by Ca-Sr-Mg-P, reveals the presence of marble and calc-silicate skarn in the MLT (Fig. 5). This component reveals that the most important Ca variation sources in the fine fraction are carbonates, and not apatite and garnets as seen in the heavy fraction.
The fourth component shows the LOI-Hg association, indicating that Hg distribution is controlled predominantly by the organic matter content. Pb and Zn are moderately linked to this component (Fig. 6). Fe-Mn-As-Pb-Zn contribute strongly to the fifth component
C. Bellehumeur et al. / Journal of Geochemical Exploration 51 (1994) 11-35 21
350000 400000 7 6 o 450000 350000
H E A V Y F R A C T I O N 4 7 °
Com.on,nt 2
, - 0 . 6 "
"v.j: ,,%~,,. :~,'~ .
400000 7 6 " 450000
Fig. 3. Contour map of scores on component 1 (left) and component 2 (right), heavy mineral concentrates of stream sediments.
H E A V Y F R A C T I O N
C o m v o n e n t 4 ...;~ ~2 ~,~p.
%-0.
350000 400000 7 6 ° 450000
Fig. 4. Contour map of scores on component 4 stream sediments.
H E A V Y F R A C T I O N 4 7 * 4 7 °
Component 5 .
. o~
_ :-, :. ~ N~ I/ i:I ~ ,,.. 5100000
350000 400000 7 6 * 450000
(left) and component 5 (right), heavy mineral concentrates of
22 C. Bellehumeur et al. / Journal q[ Geochemical Exl?loration 51 (1994) I 1-35
FINE F R A C T I O N
C o m ~ , o n e n t 1 ~ /
, 0 ~
400000 76 ° 450000
47 ° FINE F R A C T I O N
47 °
C o m p o n e n t 3 • ;, ~ , . , :5~ooooo
i
/ . ~,~ = :ot ,6"
No Daia b !'~
35000O 400000 7 6 o 450000
Fig. 5. Contour map of scores on component l (left) and component 3 ( right ), fine traction of stream sediments
FINE F R A C T I O N FINE F R A C T I O N 47 ° i 47 °
% . /u i i i [i.J u i i i~ i i i *,1. 5200000 ,ri~ u i i i [ , j 4 , / i I u i i L . . i " )~ ~1 ~ ~
,,,11,.:
'-°;F 2 " £"d ~ : ~ ; " - 46, ;I I
350000 400000 76 o 450000 350000 400000 76 ° 450000
Fig. 6. Contour map o f scores on component 4 ( left ) and component 5 ( right ), fine fraction o f stream sediments
C. Bellehumeur et al. / Journal of Geochemical Exploration 51 (1994) 11-35 23
which would seem to represent co-precipitation and/or adsorption of trace elements on Fe- Mn oxide minerals (Fig. 6). The high scores of these two factors are found around lakes and along major valleys, however there are also many anomalous isolated points.
6.3. Stability of principal components
Given that the PCA is an exploratory technique to reveal the correlation structure of the data, we must face the question whether the results are stable and reflect real features occuring in the data. We have used the bootstrap method, proposed by Efron (1979), and previously used by Daudin et al. (1988), in order to study the stability of PCA results. The bootstrap method consists of resampling with replacement, n-rows in the n-original rows of the data matrix. Because the bootstrap sample is the same size as the original sample, it contains certain rows more than once, others not at all. Daudin et al. (1988) show that the probability for the ith row to be suppressed is equal to 0.37 if n is large, and the probability that it appears twice or more is equal to 0.26. This shows that for each draw, the data are quite modified.
We have considered the stability of the representation of variables on eigenvectors. The p variable points are projected on the principal components. Lebart et al. (1984) describe the relationship between the analysis in the space of variables R p and the space of samples R n. The principal components of the set of n standardized points in R p, expressed by the unit vectors Ua, are the eigenvectors of 1/n X'X corresponding to eigenvalues Aa. X is the matrix of standardized data, X' represents the transposed matrix, and 1/n X'X is the corre- lation matrix R. The unit vectors Ca, corresponding to the set of p variable points in the space R n, are the eigenvectors of 1/n XX'.
The analyses in R p and R n are linked by:
U a = X U a ( 1 / ~ r ~ ) (1)
U a = X ' u a ( 1 / ~ n ~ ) (2)
In R", the coordinates of the p variable points Ca on the unit vectors Va are given by:
Ca =X' b'a(1/g/~n) (3)
From Eqs. ( 1 ) and (3)
C a = ( 1 /n )X 'Xua( 1/gl~)
Ca=Rua(1/V/A)
The bootstrap method allows replications of the correlation matrix. We performed 25 bootstrap replications of the correlation matrix. The coordinates o fp variable points related to the principal components are calculated by multiplying the correlation matrices by the original eigenvectors and the rotation matrix used by the varimax procedure. The dispersion of the p variable point groups on the PCA axis allows the stability of the PCA models to be appreciated. A similar technique was proposed by Greenacre (1984) to evaluate corres- pondance analysis models.
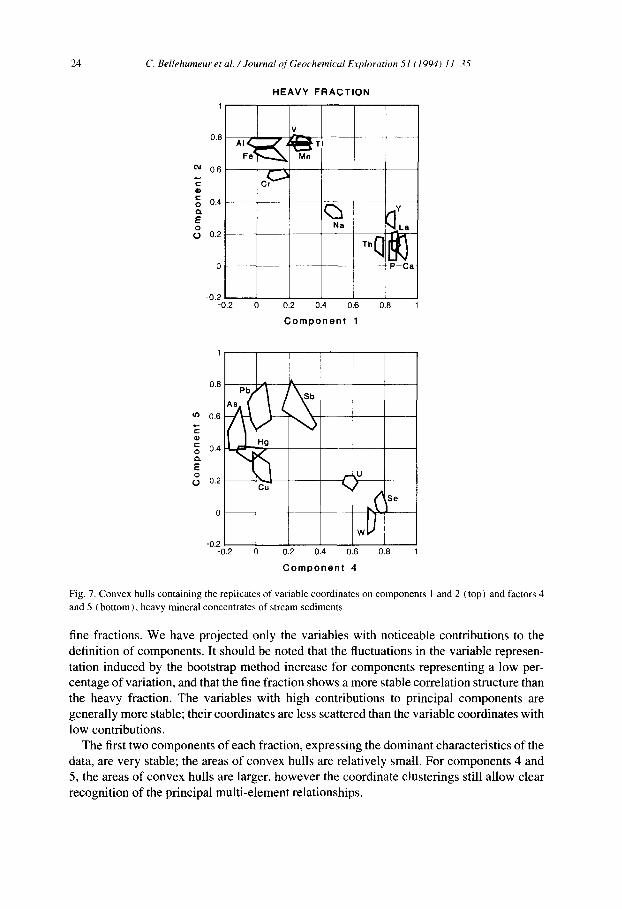
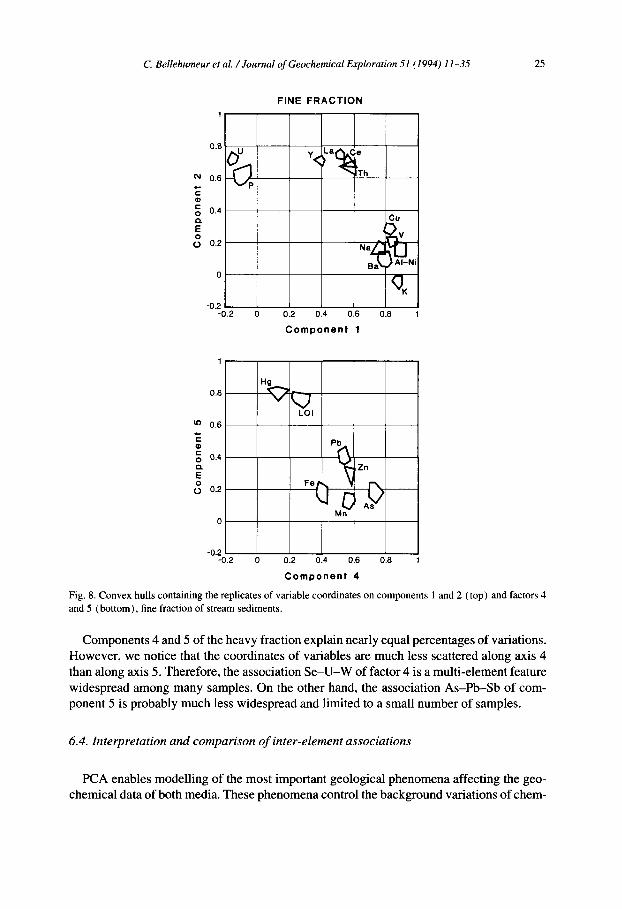
Figs. 7 and 8 show the convex hulls containing the replicates of variable coordinates on the planes formed by components 1 and 2, and by components 4 and 5 of the heavy and
24 C. Bellehumeur et al. / Journal of Geochemical Exploration 51 (1994) 11-35
0.8
~ 0.6
c
c o 0.4 o. E o O 0.2
HEAVY FRACTION
V
AIFe~4 ~ M~n Tii
-0.2 -0.2 0 0.2 0.4
<b N a
Y t.q i P-Ca i i I
0.6 0.8 1 Component 1
1
0.8
¢o 0.6 P~-~ ~---~
E
o E '~ g o.4L~ tO 0.2 Cu
i J
o2 l -0.2 0 0.2 0.4 0.6 0.8 1
Component 4
Fig. 7. Convex hulls containing the replicates of variable coordinates on components 1 and 2 (top) and factors 4
and 5 (bot tom), heavy mineral concentrates of stream sediments.
fine fractions. We have projected only the variables with noticeable contributions to the definition of components. It should be noted that the fluctuations in the variable represen- tation induced by the bootstrap method increase for components representing a low per- centage of variation, and that the fine fraction shows a more stable correlation structure than the heavy fraction. The variables with high contributions to principal components are generally more stable; their coordinates are less scattered than the variable coordinates with low contributions.
The first two components of each fraction, expressing the dominant characteristics of the data, are very stable; the areas of convex hulls are relatively small. For components 4 and 5, the areas of convex hulls are larger, however the coordinate clusterings still allow clear recognition of the principal multi-element relationships.
C. Bellehumeur et al. / Journal of Geochemical Exploration 51 (1994) 11-35 25
t~ 0.6
c G)
0.4
E o O 0.2
FINE FRACTION
0: I
0
-0.2i -0.2 0
cu
BS~, .~ AI-Ni
q 0.2 0.4 0.6 0.8 1
C o m p o n e n t 1
1
0.8
to 0.6
c ® 0.4
Q. E 0 O 0.2
LOI
P ~ Zn
-0.2 -0.2 0 0.2 0.4 0.6 0.8 1
C o m p o n e n t 4
Fig. 8. Convex hulls conta in ing the replicates of variable coordinates on components 1 and 2 ( top) and factors 4
and 5 (bo t tom) , fine fraction o f stream sediments.
Components 4 and 5 of the heavy fraction explain nearly equal percentages of variations. However, we notice that the coordinates of variables are much less scattered along axis 4 than along axis 5. Therefore, the association Se -U-W of factor 4 is a multi-element feature widespread among many samples. On the other hand, the association As-Pb--Sb of com- ponent 5 is probably much less widespread and limited to a small number of samples.
6.4. Interpretation and comparison of inter-element associations
PCA enables modelling of the most important geological phenomena affecting the geo- chemical data of both media. These phenomena control the background variations of chem-
26 C. Bellehumeur et al. / Journal of Geochemical Exploration 51 (1994) 1 I-.45
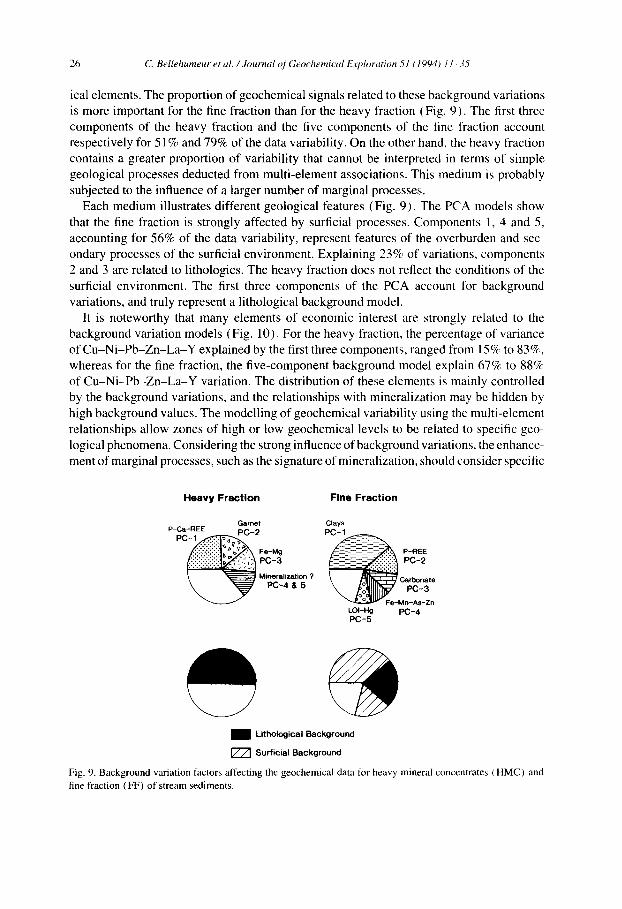
ical elements. The proportion of geochemical signals related to these background variations is more important for the fine fraction than for the heavy fraction (Fig. 9). The first three components of the heavy fraction and the five components of the fine traction account respectively for 51% and 79% of the data variability. On the other hand, the heavy fraction contains a greater proportion of variability that cannot be interpreted in terms of simple geological processes deducted from multi-element associations. This medium is probably subjected to the influence of a larger number of marginal processes.
Each medium illustrates different geological features (Fig. 9). The PeA models show that the fine fraction is strongly affected by surficial processes. Components 1, 4 and 5, accounting for 56% of the data variability, represent features of the overburden and sec- ondary processes of the surficial environment. Explaining 23% of variations, components 2 and 3 are related to lithologies. The heavy fraction does not reflect the conditions of the surficial environment. The first three components of the PeA account for background variations, and truly represent a lithological background model.
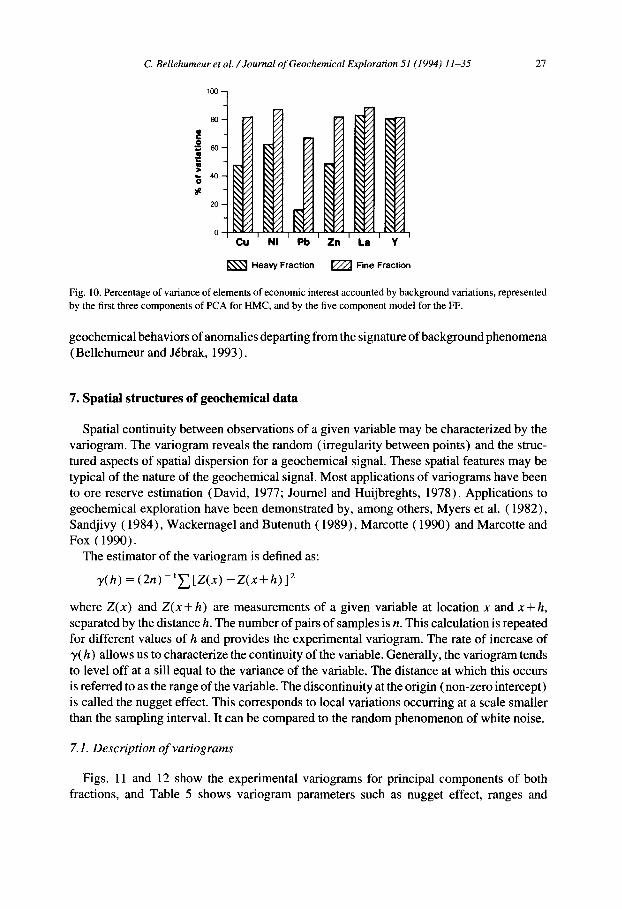
It is noteworthy that many elements of economic interest are strongly related to the background variation models (Fig. 10). For the heavy traction, the percentage of variance of Cu-Ni -Pb-Zn-La-Y explained by the first three components, ranged from 15% to 83%, whereas for the fine traction, the five-component background model explain 67% to 88% of Cu-Ni -Pb-Zn-La-Y variation. The distribution of these elements is mainly controlled by the background variations, and the relationships with mineralization may be hidden by high background values. The modelling of geochemical variability using the multi-element relationships allow zones of high or low geochemical levels to be related to specific geo- logical phenomena. Considering the strong influence of background variations, the enhance- ment of marginal processes, such as the signature of mineralization, should consider specific
Heavy Fraction Fine Fraction
Garnet Clays P-Ca-REE PC-2 PC- 1
~ Mineralization ? \ ~ Carbonate
LOI-Hg PC-4 PC-5
i Lithological Background
Surfieial Background
Fig. 9. Background variation factors affecting the geochemical data for heavy mineral concentrates (HMC) and fine fraction (FF) of stream sediments.
C. Bellehumeur et al. / Journal of Geochemical Exploration 51 (1994) 11-35 2 7
1 0 0 -
8 0 - i
6 0 -
40- 1 2 0 '
0
Cu
v~ vA v~ vA v A v A v ~ v ~
1 NI Pb
Heavy Fraction
Z ~xZ
Z ,,'/,
I I I I
Zn La Y
Fine Fraction
Fig. 10. Percentage of variance of elements of economic interest accounted by background variations, represented by the first three components of PCA for HMC, and by the five component model for the FF.
geochemical behaviors of anomalies departing from the signature of background phenomena (Bellehumeur and J6brak, 1993).
7. Spatial structures of geochemical data
Spatial continuity between observations of a given variable may be characterized by the variogram. The variogram reveals the random (irregularity between points) and the struc- tured aspects of spatial dispersion for a geochemical signal. These spatial features may be typical of the nature of the geochemical signal. Most applications of variograms have been to ore reserve estimation (David, 1977; Journel and Huijbreghts, 1978). Applications to geochemical exploration have been demonstrated by, among others, Myers et al. (1982), Sandjivy (1984), Wackernagel and Butenuth (1989), Marcotte (1990) and Marcotte and Fox (1990).
The estimator of the variogram is defined as:
y(h) --- (2n) - ' y " [Z(x) - Z ( x + h) ]2
where Z(x) and Z(x+h) are measurements of a given variable at location x and x+h, separated by the distance h. The number of pairs of samples is n. This calculation is repeated for different values of h and provides the experimental variogram. The rate of increase of y(h) allows us to characterize the continuity of the variable. Generally, the variogram tends to level off at a sill equal to the variance of the variable. The distance at which this occurs is referred to as the range of the variable. The discontinuity at the origin (non-zero intercept) is called the nugget effect. This corresponds to local variations occurring at a scale smaller than the sampling interval. It can be compared to the random phenomenon of white noise.
7.1. Description of variograms
Figs. 11 and 12 show the experimental variograms for principal components of both fractions, and Table 5 shows variogram parameters such as nugget effect, ranges and
28 C. Bellehumeur et al. / Journal of Geochemical Exploration 51 (1994) 11-35
0 70 0 70 1.2 1,2
~" 0.8
0,6 E (.3 0.4
0.2
0 1.2
1
~" 0.8
0.6 E (3 0,4
0.2
0 1.2
I
0.8
0.6 E t~ (3 0.4
0.2
0 0
Dis tance h (km) Distance h (km) 10 20 30 40 50 60 10 20 30 40 50 60
I I ~ I I I I I I I I I
C o m p o n e n t 1
] 1 I l I I
C o m p o n e n t 3
, , I ] I I I r
C o m p o n e n t 5
1() 2'0 3~0 4~0 5'0 610
Dis tance h (km)
q 0 10
C o m p o n e n t 2
] I ] ] I J
C o m p o n e n t 4
2=0 310 4E0 5~0 610
D is tance h (km)
o.8
0.6 E
0.4 (.3
0,2
io 11.2
0.8 ~'
0.6 E
0.4 (3
0.2
0 70
V A R I O G R A M 8
H E A V Y F R A C T I O N o---o N-S
• • E -W
70
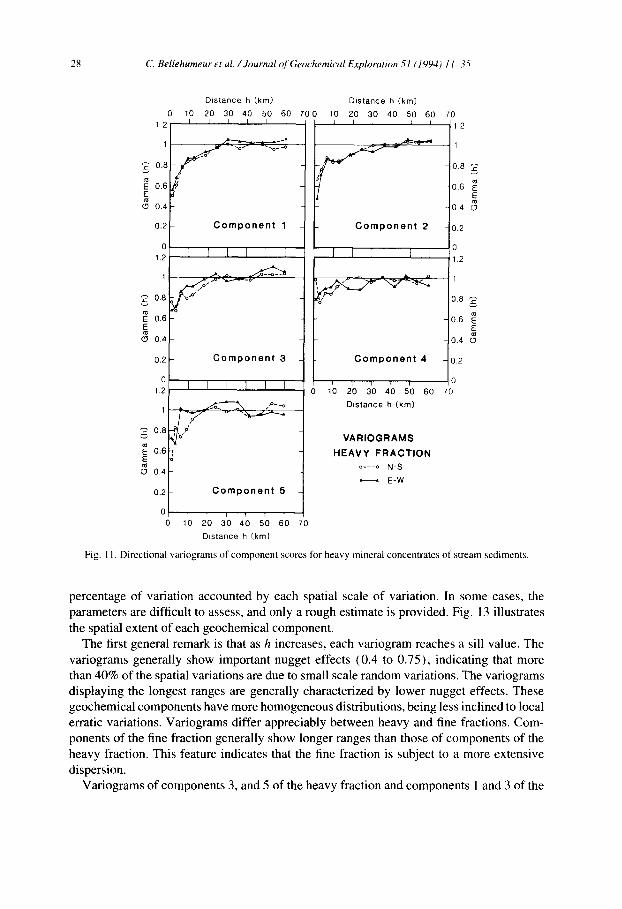
Fig. l I. Directional variograms of component scores for heavy mineral concentrates of stream sediments.
percentage of variation accounted by each spatial scale of variation. In some cases, the parameters are difficult to assess, and only a rough estimate is provided. Fig. 13 illustrates the spatial extent of each geochemical component.
The first general remark is that as h increases, each variogram reaches a sill value. The variograms generally show important nugget effects (0.4 to 0.75), indicating that more than 40% of the spatial variations are due to small scale random variations. The variograms displaying the longest ranges are generally characterized by lower nugget effects. These geochemical components have more homogeneous distributions, being less inclined to local erratic variations. Variograms differ appreciably between heavy and fine fractions. Com- ponents of the fine fraction generally show longer ranges than those of components of the heavy fraction. This feature indicates that the fine fraction is subject to a more extensive dispersion.
Variograms of components 3, and 5 of the heavy fraction and components 1 and 3 of the
C. Bellehumeur et a l . / Journal of Geochemical Exploration 51 (1994) 11-35 29
1.2
1
0.8 .c
0.6
~ 0.4
0.2
0 1.2
1
~ 0.8 x:
~ 0.6
~ 0.4
0.2
0 1.2
1
~ 0.8
~ 0.6 E
0.4
0.2
0 0
D i s t a n c e h (km) Distance h (krn)
10 20 30 40 50 60 700 10 20 30 40 50 60 I I I I I I I I I I I I
C o m p o n e n t 1
I I I I I I
/% .~ . , . o - - - o
C o m p o n e n t 3
I I I I I
. = /~ ° " " °~ - o - .R - - o ' - °
C o m p o n e n t 5
,'0
I 0
210 310 4'0 5P0 6=0 70
Distance h (km}
C o m p o n e n t 2
] I I I I ]
I
10
C o m p o n e n t 4
210 3~0 4~0 5~0
Distance h (kin)
70 1.2
t
0.8
0.6 E
0.4 ~
0.2
0 1.2
I
0.8
0.6
0.4 (9
0.2
0 6~0 70
V A R I O G R A M S
FINE F R A C T I O N o---o N-S
E-W
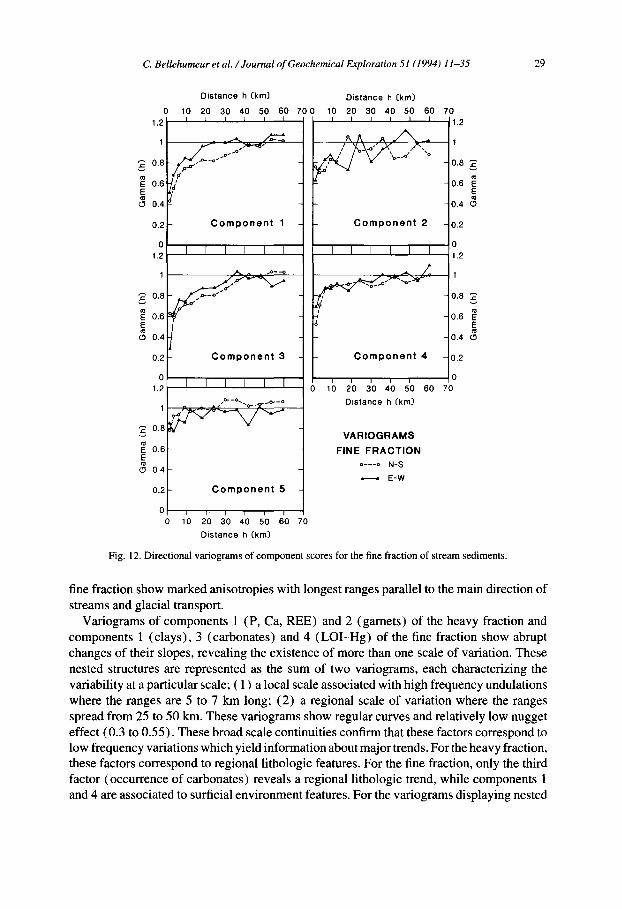
Fig. 12. Direct ional va r iograms of componen t scores for the fine fract ion o f s t ream sediments.
fine fraction show marked anisotropies with longest ranges parallel to the main direction of streams and glacial transport.
Variograms of components 1 (P, Ca, REE) and 2 (garnets) of the heavy fraction and components 1 (clays), 3 (carbonates) and 4 (LOI-Hg) of the fine fraction show abrupt changes of their slopes, revealing the existence of more than one scale of variation. These nested structures are represented as the sum of two variograms, each characterizing the variability at a particular scale; ( 1 ) a local scale associated with high frequency undulations where the ranges are 5 to 7 km long; (2) a regional scale of variation where the ranges spread from 25 to 50 km. These variograms show regular curves and relatively low nugget effect (0.3 to 0.55). These broad scale continuities confirm that these factors correspond to low frequency variations which yield information about major trends. For the heavy fraction, these factors correspond to regional lithologic features. For the fine fraction, only the third factor (occurrence of carbonates) reveals a regional lithologic trend, while components 1 and 4 are associated to surficial environment features. For the variograms displaying nested
30 C. Bellehumeur et al. / Jounzal of Geochemical Exploration 51 (1994) 11-35
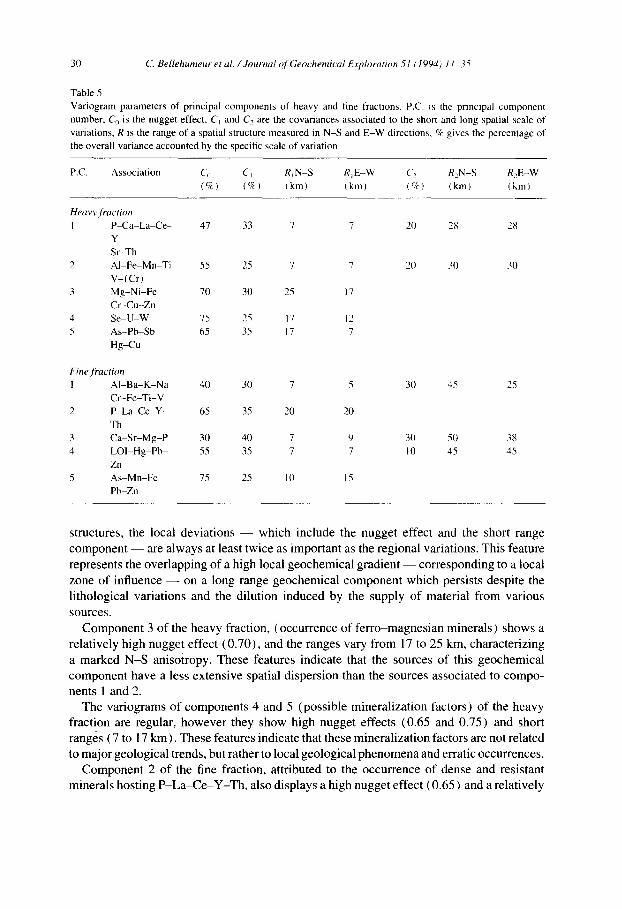
Table 5 Variogram parameters of principal components of heavy and fine tractions. P.C. is the principal component number, Co is the nugget effect, Ct and C2 are the covariances associated to the short and long spatial scale of variations, R is the range of a spatial structure measured in N-S and E-W directions, % gives the percentage of the overall variance accounted by the specific scale of variation
P.C. Association C, Ci RIN-S RIE-W C, R2N-S R,E-W (%) (~) (km) (kin) (%) (km) (km)
Hea~3, fraction I P-Ca-La-Ce- 47 33 7 7
Y Sr-Th
2 AI-Fe-Mn-Ti 55 25 7 7 V-(Cr)
3 Mg-Ni-Fe 70 30 25 17 Cr-Cu-Zn
4 Se-U-W 75 25 17 12 5 As-Pb-Sb 65 35 17 7
Hg~Cu
20 28 28
20 31) 30
Fine fraction I AI-Ba-K-Na 40 30 7 5 30 45 25
Cr-Fe-Ti-V 2 P-La~Ce-Y - 65 35 20 20
Th 3 Ca-Sr-Mg-P 30 40 7 9 30 50 38 4 LOI-Hg-Pb- 55 35 7 7 I 0 45 45
Zn 5 As-Mn-Fe 75 25 I 0 15
Pb-Zn
structures, the local deviat ions - - which include the nugget effect and the short range
component - - are always at least twice as important as the regional variations. This feature
represents the over lapping of a high local geochemica l gradient - - corresponding to a local
zone of influence - - on a long range geochemica l component which persists despite the
l i thological variat ions and the dilution induced by the supply o f material f rom various
sources.
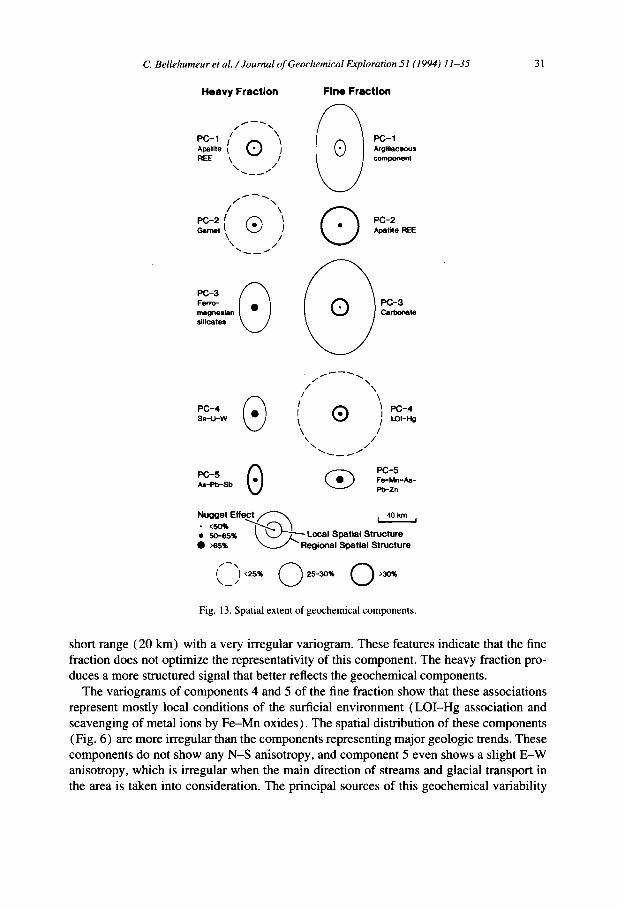
Componen t 3 o f the heavy fraction, (occurrence of f e r ro -magnes ian minerals) shows a
relat ively high nugget effect (0 .70) , and the ranges vary from 17 to 25 km, character izing
a marked N - S anisotropy. These features indicate that the sources of this geochemica l
component have a less extens ive spatial dispersion than the sources associated to compo-
nents l and 2. The var iograms of components 4 and 5 (possible mineral izat ion factors) o f the heavy
fraction are regular, howeve r they show high nugget effects (0.65 and 0.75) and short
ranges ( 7 to 17 km) . These features indicate that these mineral izat ion factors are not related
to major geological trends, but rather to local geologica l phenomena and erratic occurrences.
Componen t 2 o f the fine fraction, attributed to the occurrence of dense and resistant
minerals hosting P - L a ~ e - Y - T h , also displays a high nugget effect (0 .65) and a relat ively
C. Bellehumeur et al. / Journal of Geochemical Exploration 51 (1994) 11-35 31
Heavy Fraction Fine Fraction
PC- 1 i / PC-1 Apatite | Q ~j Argillaceous REE \ / / component
/ \
, , @ PC-2 / I Apatite REE C~rne' k ( ~ ' PC-2
/ \ /
gerro- PC-3 magnesian Carbonate silicates
PC-4 Se-U-W
\ / \
/ \ / , ® / LO4-Hg \ /
\ / \ /
Fe-Mn-As- As-Pb-Sb Pt)-Zn
Nugget Effect ~ I 40 km • <50% ~ I • 5o-65% ~ ' ' C ~ - ~ Local Spatial St ruct ure • >65% ~ "Regional Spatial Structure
- Q O ( ) <25% 25-30% >30%
Fig. 13. Spatial extent of geochemical components.
short range (20 km) with a very irregular variogram. These features indicate that the fine fraction does not optimize the representativity of this component. The heavy fraction pro- duces a more structured signal that better reflects the geochemical components.
The variograms of components 4 and 5 of the fine fraction show that these associations represent mostly local conditions of the surficial environment (LOI-Hg association and scavenging of metal ions by Fe-Mn oxides). The spatial distribution of these components (Fig. 6) are more irregular than the components representing major geologic trends. These components do not show any N-S anisotropy, and component 5 even shows a slight E-W anisotropy, which is irregular when the main direction of streams and glacial transport in the area is taken into consideration. The principal sources of this geochemical variability
32 C. Bellehumeur et al. / Journal of Geochemical Exploration 51 (1994) l I 35
are the organic-rich environments where reducing conditions prevailed. These environments are located in poorly drained plateaus covering small areas, where stream networks are not well structured. Therefore, these geochemical environments are not very widespread, and their dispersion does not necessarily follow the regional pattern.
7.2. Application of variogram analysis
The variogram provides useful methodological information that may be used at an early stage in an exploration program. It enables the estimation of a suitable sampling interval for detecting a specific geochemical component with a particular spatial continuity. For example, a sampling interval of some 8 to 15 km (1 sample/64 to 225 km 2) allows identification of major trends of geochemical components represented by phenomena dis- playing ranges of 25 to 50 km. The variograms also enable the proportion of structured spatial variance resulting from a specific sampling interval to be considered. The variogram parameters show that for the media used in the Gatineau geochemical survey, a sampling interval of 8 to 15 km would introduce a high proportion of random variations in the geochemical signals. The short spatial scales would appear as a nugget effect.
The nugget effect represents the variations occurring at scales smaller than the sampling interval. Using the terminology of Nichol (1985), the nugget effect includes the variance due to analysis and sample processing, and the variance due to sampling, which represents local heterogeneity around the sampling station. Moreover, the nugget effect includes the variations due to high frequencies which cannot be detected from the sampling interval.
The nugget effect may possibly be reduced in two ways: ( 1 ) by increasing the sampling density in order to detect a wider spectrum of frequencies; or (2) by revising the sampling technique in order to collect samples more representative of the sampling station. The first method will be effective if a part of the random component is due to geological phenomena of short spatial structures which will be detected by a denser sampling grid. Taking replicate samples may aid in determining the more useful approach. The combined sampling and analytical variance is calculated as follows (Garrett, 1973 ):
N II 2 o-~ = ( l / N ) y" [( l / ( n - 1)) ~ (x u -xA 2]
i - - I j - - I
where N is the number of sites where replicates were collected, n the number of replicates at each site, xj the average value of replicates at site i, and x u the value of a replicate at site i.
Obtaining a value of O-~a significantly smaller than the nugget effect allows the detection of geological phenomena whose extent is smaller than the sampling interval. On the other hand, the equality of these variances signifies that taking additional samples on a denser grid will not allow new high frequency variations to be detected; the variations due to analysis and sampling mask these frequencies. Thus, it is preferable to improve the sampling, processing or analytical techniques rather than collect additional samples on a smaller grids.
Variograms characterize spatial features of geochemical data. They reflect the variance components acting at different scales, enabling the extent of the zone of influence of geological phenomena to be characterized and, therefore, provide useful information about
c. Bellehumeur et al. /Journal of Geochemical Exploration 51 (1994) 11-35 33
the nature of geochemical sources. The recognition of scales of variations may have an impact on the sampling methodology of geochemical surveys, suggesting that sample spacing should be chosen according to the extent of the geochemical component of interest.
8. Conclusions
The regional geochemical survey of the Gatineau area shows that the fine fraction ( < 177 /xm) and the heavy mineral concentrates of stream sediments carry very different geochem- ical information. The background levels and the multi-element associations differ between both media. Each medium records and underlines different geological processes. The multi- element geochemical information permits the effective detection and modelling of the most important geological phenomena affecting the geochemical data. A principal component model reveals that the fine fraction is strongly subjected to the influence of surficial proc- esses, while the heavy fraction, which may be directly interpreted in terms of a clastic dispersion of minerals, mainly reflects the mineralogical characteristics of lithologies. The stability of PCA models was evaluated using the bootstrap method in order to verify that the PCA results were valid for interpretation.
It appears that an important part of variations in most of the elements of economic interest are strongly related to background variation factors. It becomes evident that an interpretation of anomalies in terms of metallogenic zones should consider the geochemical environment specified by multi-element associations.
In this study, the role of variogram analysis is to characterize the spatial structure of the principal geochemical sources. This tool is useful in quantifying the extent of influence of the geochemical sources, and in establishing the relationships with the proportion of vari- ability associated to specific spatial scales. The variograms generally show high nugget effect where more than 40% of the variability is considered as random, indicating the erratic occurrence of phases hosting geochemical signals in the sampled media. The random effect should be modelled at a smaller scale. The variograms enable the recognition of the spatial scales of geochemical components and the differentiation of the geological phenomena associated with.regional trends from those acting at local scales. Spatial variation compo- nents provide useful information for estimating a suitable sampling interval for geochemical surveys, and aid in finding solutions for reducing the nugget effect.
These results must be used in order to obtain a better knowledge of the geochemical signals resulting from the most common generating processes. Geochemical sources such as mineralization occurrences which have short dispersion trains are not as broad as regional geochemical patterns. However, the two components interfere with each other. Therefore, exploration strategies will be more effective if regional geochemical surveys can effectively characterize the background phenomena and reduce as much as possible the random vari- ations of the geochemical signals. Then, it is possible to identify with much more certainty the true anomalies departing from the background variations.
34 C. Bellehumeur et al . / Journal ~f Geochemical [:kploration 51 (1994) 11-35
Acknowledgements
This study was funded by grants to M. Jrbrak from the Quebec Department of Energy and Resources. C. Bellehumeur received financial assistance from UQAM and a Natural Sciences and Engineering Research Council of Canada Postgraduate Scholarship. Professor Michel Gauthier, Ph.D. candidate Cecilia Jenkins and two anonymous reviewers are thanked for there numerous valuable comments which led to the improvement of this paper.
References
Avramtchev, L. and Pichr, G., 1981. Carte des gRes minrraux du Qurbec, rrgion de Laurentie-Saguenay. Minist~re de l'Energie et des Ressources du Qurbec, DPV 809.
Ayres, L.D. and Cemy, P., 1982. Metallogeny of granitoid rocks in the Canadian Shield. Can. Miner., 20: 439- 535.
Bellehumeur, C. and JEbrak, M., 1992. Analyse multidimensionnelle des donnres grochimiques appliqures ~ la prospection dans la rrgion de la Gatineau. Minist~re de l'Energie et des Ressources du Qurbec, MB 92-05, 45 pp.
Bellehumeur, C. and Jrbrak, M., 1993. Filtering of background variation factors in stream sediment geochemical surveys --Application to Zn Sedex deposits in the Gatinean area, southwestern Quebec, Canada. Explor. Min. Geol., 2: 63-72.
Bishop, C. and Jourdain, V., 1987. Grenville polymetallics; the Montauban and Grand Calumet deposits. Northern Min. Mag., (December): 15-17.
Choini~re, J., 1988. Grochimie des minrraux Iourds - - rrgion de la Gatineau. Minist~re de l'Energie et des Ressources du Qurbec, MB 88-35, 38 pp.
Choini~re, J., 1989. Grochimie de la fraction fine des srdiments de ruisseaux de la rrgion de la Gatineau. Ministbre de I'Energie et des Ressources du Qurbec, MB 89-08.
Corriveau, L., 1989. The ultrapotassic Kensington pluton, SW Grenville Province. In: L. Corriveau, D. Gold, J. Brdard and J. Bourne (Editors), Alkaline and Calc-alkaline Complexes of Southern Quebec - - Field Trip B3. Geol. Assoc. Can./Miner. Assoc. Can., Montrral, pp. 1-22.
Daudin, J.J., Duby, C., and Trecourt, P., 1988. Stability of principal component analysis studied by the bootstrap method. Statistics, 19: 241-258.
Davenport, P.H., 1990. A comparison of regional geochemical data from lakes and streams in northern Labrador; implications for mixed-media geochemical mapping. J. Geochem. Explor., 39:117-151.
David, M., 1977. Geostatistical Ore Reserve Estimation. Elsevier, Amsterdam, 364 pp. Efron, B., 1979. Bootstrap methods: another look at the jacknife. Ann. Statist., 7: 1-26. Garrett, R.G., 1973. The determination of sampling and analytical errors in exploration geochemistry - - a reply.
Econ. Geol., 68: 282-283. Gauthier, M. and Brown, A.C., 1986. Zinc and iron metallogeny in the Maniwaki-Gracefield district, southwestern
Quebec. Econ. Geol., 81:89-112. Greenacre, M.J., 1984. Theory and Applications of Correspondence Analysis. Academic Press, London, 339 pp. Journel, A.G. and Huijbregts, Ch.J., 1978. Mining Geostatistics. Academic Press, London, 600 pp. Kettles, I.M. and Shilts, W.W., 1989. Geochemistry of drift over the Precambrian Grenville Province, southeastern
Ontario and southwestern Quebec. In: R.N.W. DiLabio and W.B. Coker (Editors), Drift Prospecting. Geol. Surv. of Canada, Paper 89-20, pp. 97-112.
Lebart, L., Morineau, A., and Warwick, K.M., 1984. Multivariate Descriptive Statistical Analysis. Wiley, New York, NY, 231 pp.
Lindqvist, L., Lundholm, 1., Nisca, D., Esbensen K. and Wold, S., 1987. Multivariate geochemical modelling and integration with petrophysical data. J. Geochem. Explor., 29: 279-294.
Marcotte, D., 1990. Multivariate analysis and variography used to enhance anomalous response for lake sediments in the Manicouagan area, Quebec. In: F.P. Agterberg and G.F. Bonham-Carter (Editors), Statistical Appli- cations in the Earth Sciences. Geol. Surv. Can., Paper 89-9, pp. 349-355.
C. Bellehumeur et al. / Journal of Geochemical Exploration 51 (1994) 11-35 35
Marcotte, D. and Fox, J.S., 1990. The Shefferville area: multivariate analysis and variography used to enhance interpretation of lake sediment geochemical data. J. Geochem. Explor., 38: 247-263.
Myers, D.E., Begovich, C.L., Butz, T.R. and Kane, V.E., 1982. Variogram models for regional groundwater geochemical data. Math. Geol., 14: 629-644.
Moore, J.M. and Thompson, P.H., 1980. The Flinton Group: a late Precambrian metasedimentary succession in the Grenville Province of eastern Ontario. Can. J. Earth Sci., 17: 1685-1707.
Nichol, I., 1985. Geochemical exploration for gold: a special problem. In: I. Thornton and R.J. Howarth (Editors), Applied Geochemistry in the 1980's. Graham and Trotman, London, pp. 60-85.
Rivers, T., Martignole, J., Gower, C.F. and Davidson, A., 1989. New tectonic divisions of the Grenville Province, southeast Canadian Shield. Tectonics, 8: 63-84.
Roquin, C. and Zeegers, H., 1987. Improving anomaly selection by statistical estimation of background variations in regional geochemical prospecting. J. Geochem. Explor., 29:295-316.
Rose, A.W., 1975. The mode of occurrence of trace elements in soils and stream sediments applied to geochemical exploration. In: I.L. Elliott and W.K. Fletcher (Editors), Geochemical Exploration 1974. Elsevier, Amsterdam, pp. 691-705.
Sandjivy, L., 1984. The factorial kriging analysis of regionalized data. Its application to geochemical prospecting. In: G., Verly, M. David, A.G. Journel and A. Marechal (Editors), Geostatistics for Natural Resources Char- acterization, Part 1. Reidel, Dordrecht, pp. 559-571.
Sangster, A.L., Gauthier, M. and Gower, C.F., 1992. Metallogeny of structural zones, Grenville Province, north- eastern North America. Precambrian Res., 58: 401-426.
Wackernagel, H. and Butenuth, C., 1989. Caracttrisation d'anomalies g6ochimiques par la gtostatistique multi- variable. J. Geochem. Explor., 32:437 444.
Related Documents