Running head: EQUIVALENT MEASUREMENT MODELS Multidimensional Ability Tests and Culturally and Linguistically Diverse Students: Evidence of Measurement Invariance Joni M. Lakin Auburn University Draft of November 29, 2011 The final version of this manuscript was published in Learning and Individual Differences. Author Note Joni M. Lakin, Department of Educational Foundations, Leadership, and Technology, Auburn University. The data analyzed in this paper were collected as part of the Project Bright Horizons project, which was sponsored by a Jacob K. Javits Gifted and Talented Education grant to the Project Bright Horizon Research Team: Peter Laing, Project Director/Co–Principal Investigator,Washington Elementary School District, Phoenix, AZ; Dr. Jaime Castellano, Project Consultant; and Dr. Ray Buss, Arizona State University at the West Campus, Principal Investigator. The views and opinions expressed in this article are those of the author and should not be ascribed to any members of the Project Bright Horizon staff or its consulting partners. The author gratefully acknowledges the helpful comments of David Lohman, John Young, and Dan Eignor on earlier drafts of this article. Correspondence concerning this article should be addressed to Joni Lakin, Department of Educational Foundations, Leadership, and Technology, Auburn University, Auburn, AL 36831. Email: [email protected]

Welcome message from author
This document is posted to help you gain knowledge. Please leave a comment to let me know what you think about it! Share it to your friends and learn new things together.
Transcript
Running head: EQUIVALENT MEASUREMENT MODELS
Multidimensional Ability Tests and Culturally and Linguistically Diverse Students:
Evidence of Measurement Invariance
Joni M. Lakin
Auburn University
Draft of November 29, 2011
The final version of this manuscript was published in Learning and Individual Differences.
Author Note
Joni M. Lakin, Department of Educational Foundations, Leadership, and Technology, Auburn University.
The data analyzed in this paper were collected as part of the Project Bright Horizons project, which was sponsored by a Jacob K. Javits Gifted and Talented Education grant to the Project Bright Horizon Research Team: Peter Laing, Project Director/Co–Principal Investigator,Washington Elementary School District, Phoenix, AZ; Dr. Jaime Castellano, Project Consultant; and Dr. Ray Buss, Arizona State University at the West Campus, Principal Investigator. The views and opinions expressed in this article are those of the author and should not be ascribed to any members of the Project Bright Horizon staff or its consulting partners. The author gratefully acknowledges the helpful comments of David Lohman, John Young, and Dan Eignor on earlier drafts of this article.
Correspondence concerning this article should be addressed to Joni Lakin, Department of Educational Foundations, Leadership, and Technology, Auburn University, Auburn, AL 36831. Email: [email protected]
Running head: EQUIVALENT MEASUREMENT MODELS 2
Abstract
Ability tests are used by teachers to provide additional context for interpreting student
achievement and as a tool for differentiating instruction to the cognitive strengths and
weaknesses of students. Tests that provide the most useful information for this purpose measure
school-related content domains including verbal and quantitative reasoning. However, there is
concern that verbal content affects validity for culturally and linguistically diverse students. In
this study, the structure of a multidimensional ability test of verbal, quantitative, and nonverbal
reasoning skills was explored in three groups of students who varied in language and cultural
background. Configural invariance and invariant factor loadings were supported, but the verbal
battery showed weaker relationships to the other batteries and reduced variability for English
learners. Results indicate that battery-level scores are appropriate for all students, but that
accounting for educational opportunity may be required for interpreting scores.
Key Words: English-language learners, cognitive ability, measurement bias
Running head: EQUIVALENT MEASUREMENT MODELS 3
Multidimensional Ability Tests and Culturally and Linguistically Diverse Students:
Evidence of Measurement Invariance
1. Introduction
Ability tests play an important role in the assessment programs of many schools.
Common uses of ability tests include contrasting ability and achievement scores to flag students
who show stark differences in their performance, identifying students for gifted and talented
programs, and, less commonly but perhaps most intriguingly, differentiating instruction to the
cognitive strengths and weaknesses of students (Gregory, 2004). Rather than providing
qualitatively distinct information from achievement tests, ability and achievement tests differ in
the degree to which they tap into recent and specific learning accomplishments versus general
and long-term acquisitions (Anastasi, 1980; Lohman, 2006). Thus, ability tests offer a different
perspective on developed knowledge and skills that can be useful to teachers for interpreting
student achievement and for adapting their instruction to better accommodate the needs of
students who differ widely in the readiness with which they learn in various domains (Anastasi,
1980; Lohman & Hagen, 2002).
For teachers seeking to differentiate instruction, the most useful tests measure abilities in
multiple content domains, such as verbal and quantitative reasoning, because the multiple scores
reported provide a richer description of the cognitive strengths and weaknesses that can function
as aptitudes for learning in the classroom (Snow, 1992).
Researchers of cognitive abilities have long recognized the importance of sampling
multiple domains in a measure of general cognitive ability (Carroll, 1993; Stern, 1914;
Thorndike, 1983). One important benefit of a multidimensional test is that multiple content
domains allow the measurement of broad abilities (particularly language and mathematics) that
Running head: EQUIVALENT MEASUREMENT MODELS 4
independently contribute to the prediction of academic achievement (Gustafsson & Balke, 1993;
Keith, 1999; Vanderwood, McGrew, Flanagan, & Keith, 2001). Because the ability to reason
depends on task content (Evans & Feeney, 2004), having measures of reasoning skills in the
symbol systems of interest can increase the relevance of test scores to the criterion of interest—
academic success.
The profiles of scores on multidimensional tests provide several useful pieces of
information. One is the level of ability (or elevation) the student demonstrates across batteries,
which is typically summarized in an overall composite score. Because it estimates g, the measure
of profile level can guide teachers in selecting the appropriate pace and level of complexity for
students (Corno, 1995; Cronbach & Snow, 1977). Another feature is the shape of the profile of
reasoning scores, which reveals relative strengths and weaknesses for each student. A teacher
can use the shape of profiles to adapt instruction through mixed or homogeneous ability
grouping, mode of presentation, or selection of learning supports (Corno, 1995; Lohman &
Hagen, 2001b).
1.1 Use of Ability Tests with English-Language Learners
Rapidly increasing numbers of English-language learner (ELL) students in the U.S.
(Federal Interagency Forum on Child and Family Statistics, 2011) has led to concern that the
cognitive ability tests used by many schools are too sensitive to language proficiency and
educational background to be valid in diverse classrooms (Ford, Grantham, & Whiting, 2008;
Harris, Rapp, Martinez, & Plucker, 2007; Ortiz & Dynda, 2005). In particular, there is concern
that using language-based assessments of reasoning abilities leads to bias and underestimation of
the aptitudes of ELL students (Lewis, 2001). On the other hand, suggestions to rely entirely on
nonverbal tests for ELL students have also been rejected by some researchers because such tests
Running head: EQUIVALENT MEASUREMENT MODELS 5
significantly underrepresent the domain of reasoning (Braden, 2000; Ortiz & Ochoa, 2005). In
fact, the ability to reason verbally is critical for the academic success of ELL students because
they are constantly drawing on these skills not only to acquire language but also to make sense of
incomplete verbal information in other content domains. Therefore, knowledge about the verbal
reasoning skills of these students could be especially helpful for teachers, if they are able to
make valid and useful inferences from the test scores available.
Making valid and useful inferences about ability test scores requires comparing student
performance to relevant norm groups. This is more difficult for groups such as ELL students
whose opportunities to learn the knowledge and skills required by the test differ substantially
from their age- or grade-peers in the norming sample. To adjust for the influence of educational
opportunity on inferences about aptitude, some test developers have begun to offer multiple
norm-comparison groups for interpreting student scores (Lohman, in press; Weiss, Saklofske,
Prifitera, & Holdnack, 2006). These comparison groups can include local norms, which
publishers of some group-administered ability tests will report at the request of the school or
district. In other cases, supplementary normative scores based on national samples are sometimes
provided by test publishers that attempt to control for background variables that influence
cognitive development such as home language and how much of a child’s schooling was
completed in U.S. schools. The use of multiple norm groups to provide perspective on student
scores assumes that, fundamentally, something useful and valid is being measured for students of
all backgrounds. For example, it assumes that verbal test items tap into verbal reasoning for all
students even though the items also tap into ELL students’ current language proficiency. One
type of validity evidence to support this argument is the establishment of equivalent
measurement models for ELL and non-ELL examinee groups. Measurement equivalence
Running head: EQUIVALENT MEASUREMENT MODELS 6
provides the foundation for making defensible test score interpretations within each group (van
de Vijver & Poortinga, 2005).
1.2 Current Study
The purpose of this study was to explore the internal structure of the Cognitive Abilities
Test (CogAT, Form 6; Lohman & Hagen, 2001a), which is a multidimensional (and multi-level)
ability test developed for grades K-12. The CogAT, originally named the Lorge-Thorndike
Intelligence Test (original form published in 1964), has a long history of use in schools and well-
regarded psychometric properties (DiPerna, 2005; Gregory, 2004). CogAT is also one of the
most widely used group ability tests in both the United States and the United Kingdom (where a
parallel form of CogAT, abbreviated CAT, is used as a nationwide exam).
CogAT provides detailed score profiles that summarize three battery-level scores in
verbal, quantitative, and nonverbal reasoning domains. Profiles are linked to suggestions for
teaching that are based on research on adapting instruction to individual differences (Corno et al.,
2002). The CogAT is intended to provide teachers with valuable information about students’
cognitive strengths and weaknesses by providing three battery scores (Lohman, Gambrell, &
Lakin, 2008). To support the intended purposes of the test when used with culturally and
linguistically diverse students, the research questions of interest were:
1. Is a common measurement model appropriate for all three groups?
2. Are the variances of the battery-level factors the same across groups?
3. Are the covariances between the battery-level factors the same across groups?
2. Methods
The CogAT was administered to a sample of 167 Hispanic ELL students, 156 Hispanic
non-ELL students, and 143 non-Hispanic non-ELL students in third and fourth grade. ELL status
Running head: EQUIVALENT MEASUREMENT MODELS 7
was based on district classifications, which was determined on the basis of number of years in
the school and performance on an English proficiency test. Most of the ELL students (85%) were
classified as continuing ELLs, while another 15% were classified as new ELLs.
The data for this study were collected as part of Project Bright Horizons, a study
developed by a team of researchers and school administrators from a school district in Arizona.
Two schools participated in the study in late spring during the school year (see Lohman, Korb, &
Lakin, 2008, for additional details). The district had a large population of Hispanic students: 50%
of the non-ELL students and 95% of the ELL students. The district also had a large proportion of
students receiving free or reduced-price lunch: 95% of the Hispanic students; 91% of students
from other minority groups; and 53% of the White students.
In this sample, 49% of the students were in grade 3. Of the non-Hispanic, non-ELL
students, 60% were White, 17% were African American, 8% were Asian, and 15% were
American Indian. All ELL students in the analyses were Hispanic.
2.1 Measure Used
The CogAT (Form 6) is a measure of cognitive abilities comprised of a Verbal, a
Quantitative, and a Nonverbal Battery. The three batteries correspond to the three subfactors that
define general fluid reasoning (Gf): sequential reasoning (best exemplified by verbal tasks),
inductive reasoning (best exemplified by figural tasks), and quantitative reasoning (Carroll,
1993). Each battery consists of three subtests using different item formats. The CogAT shows
strong convergent and discriminant validity with other measures of cognitive ability (Lohman &
Hagen, 2002; Lohman, 2003a; Lohman, 2003b). CogAT also shows strong reliability with test-
retest coefficients ranging from .82-.90 for grade 3 and 4 (Lohman & Hagen, 2002). For
differentiating instruction, users are encouraged to use the detailed profiles of battery scores
Running head: EQUIVALENT MEASUREMENT MODELS 8
provided for students—specifying level, shape, and scatter of scores across batteries—as these
profiles align with specific instructional recommendations (Lohman & Hagen, 2001b).
All tests on the CogAT begin with directions that are read aloud by the teacher. In this
study, directions were read in Spanish when trained test administrators found it appropriate for
their students.1 However, all three subtests of the Verbal Battery and one subtest of the
Quantitative Battery require some reading in English (either single words or short sentences). All
other subtests do not require reading. All subtests are timed by the teacher, but the time limits are
intended to be generous.
CogAT tests have substantial overlap (around 80%) across adjacent grade levels. The
overlap is systematic: at each level, the easiest 3 to 5 items are dropped from the beginning of
each subtest and an equal number of new, more difficult items are added at the end. As a result,
the third- and fourth-grade students in this study took 152 common test items across the three
batteries. To simplify the model in this study, only these overlapping items were used in the
analyses. At the battery level, the common items included 52 verbal items, 48 quantitative items,
and 52 nonverbal items. The data for the other 38 non-overlapping items at each level were
discarded. Discarding non-overlapping items omits the easiest 3-5 items from grade 3 and the
most difficult 3-5 items for grade 4. This was not found to greatly affect the shape of the score
distributions and was not expected to impact test structure for the analyses in this study.
2.2 Item Bundles
Item bundles were used because psychometric and practical considerations (e.g., sample
size) made item-level analyses impractical and because the unidimensional nature of items in
1 Translations of the directions were developed by bilingual teachers with the supervision of the test publisher. Test
items were not translated.
Running head: EQUIVALENT MEASUREMENT MODELS 9
each subtest made bundles appropriate (Little, Cunningham, Shahar, & Widaman, 2002). Item
bundles for each subtest were created using a procedure suggested by Little et al. (2002) which
balances the discrimination of items across bundles. Each subtest yielded three to five item
bundles each consisting of four items.
2.3 Multi-Group Confirmatory Factor Analysis
An iterative multi-group comparison of measurement models was implemented to
compare models that are increasingly constrained across the three groups (Bollen, 1989; Byrne &
Stewart, 2006; Chen, Sousa, & West, 2005). The steps of the procedure were (1) Fit a common
model in each group separately; (2) Fit a common model to all groups simultaneously with all
parameters freely estimated; (3) Constrain factor loadings of first-order factors on second-order
factors; (4) Constrain error variances at bundle level; (5) Constrain first-order factor disturbances
(residual variance); (6) Constrain second-order factor variances; (7) Constrain second-order
factor covariances. At each step, adequate model fit was a prerequisite for constraining
additional parameters in later steps.
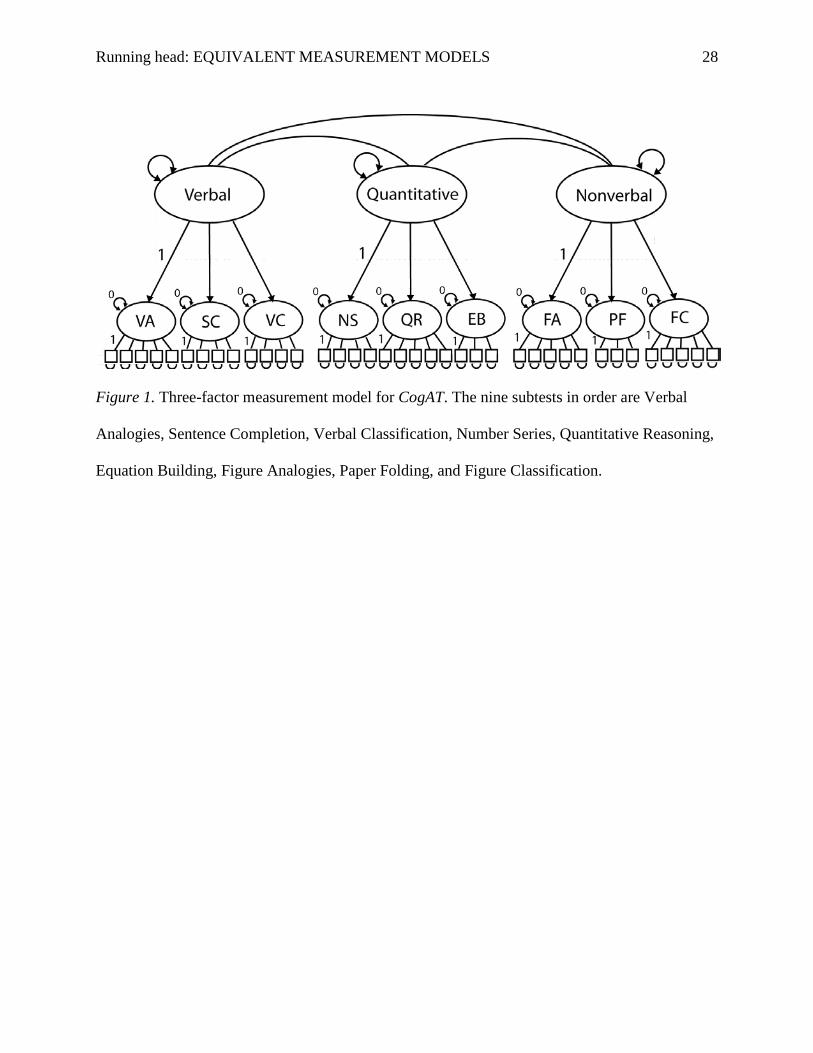
The factor model was based on the structure outlined in the CogAT research handbook
(Lohman & Hagen, 2002), which includes nine test factors subsumed under three correlated
battery factors. See Figure 1.
[Figure 1]
The analyses were conducted using MPlus (Muthén & Muthén, 1998-2009). To identify
the model, the loading of the item bundles on first-order factors were constrained to be identical
Running head: EQUIVALENT MEASUREMENT MODELS 10
across groups (Muthén & Muthén, 1998-2009).2 Unit-loading identification was also necessary
to define the second-order factors.
The fit of individual models were assessed using the Comparative Fit Index (CFI), Root
Mean Square Error of Approximation (RMSEA), and the Standardized Root Mean Square
Residual (SRMR). Improvements in fit for nested models were tested using a change in χ2 test
and the Akaike Information Criterion (AIC) index.
3. Results
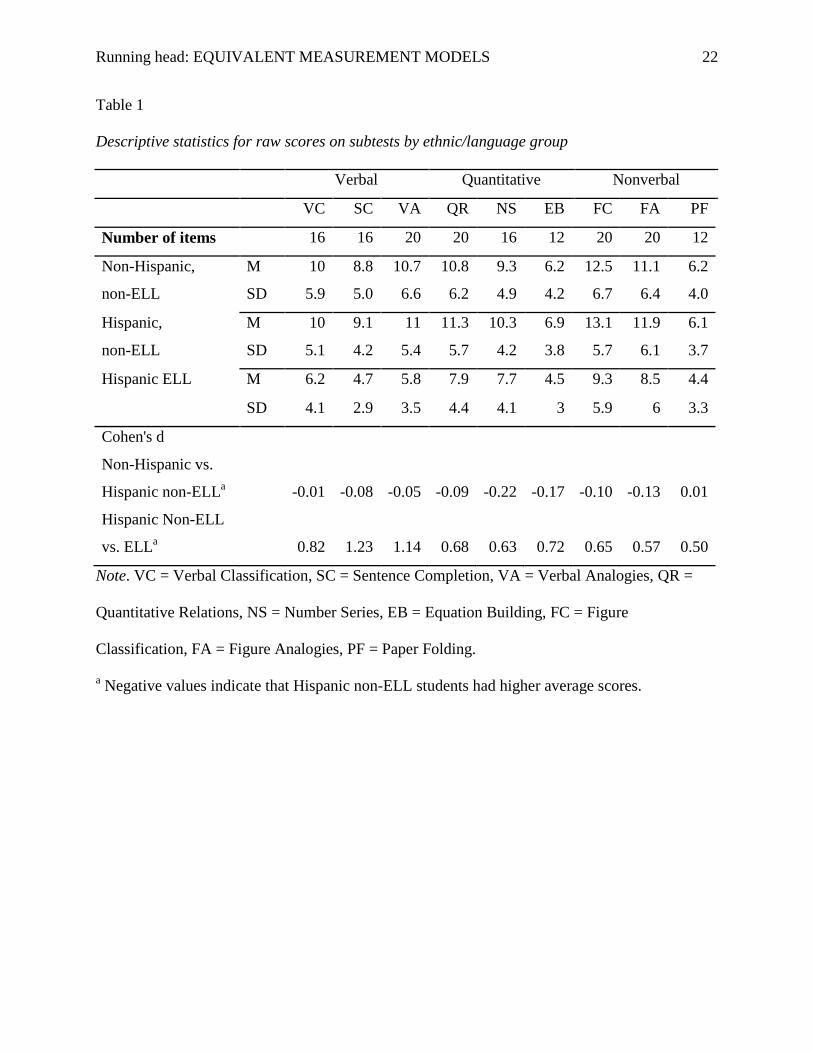
Descriptive statistics for the three samples are provided in Table 1. Importantly, the mean
scores for ELL students are lower across the subtests whereas the two non-ELL groups have
similar average scores. In addition, the standard deviations for ELL students are much lower,
especially for two of the verbal subtests.
[Table 1]
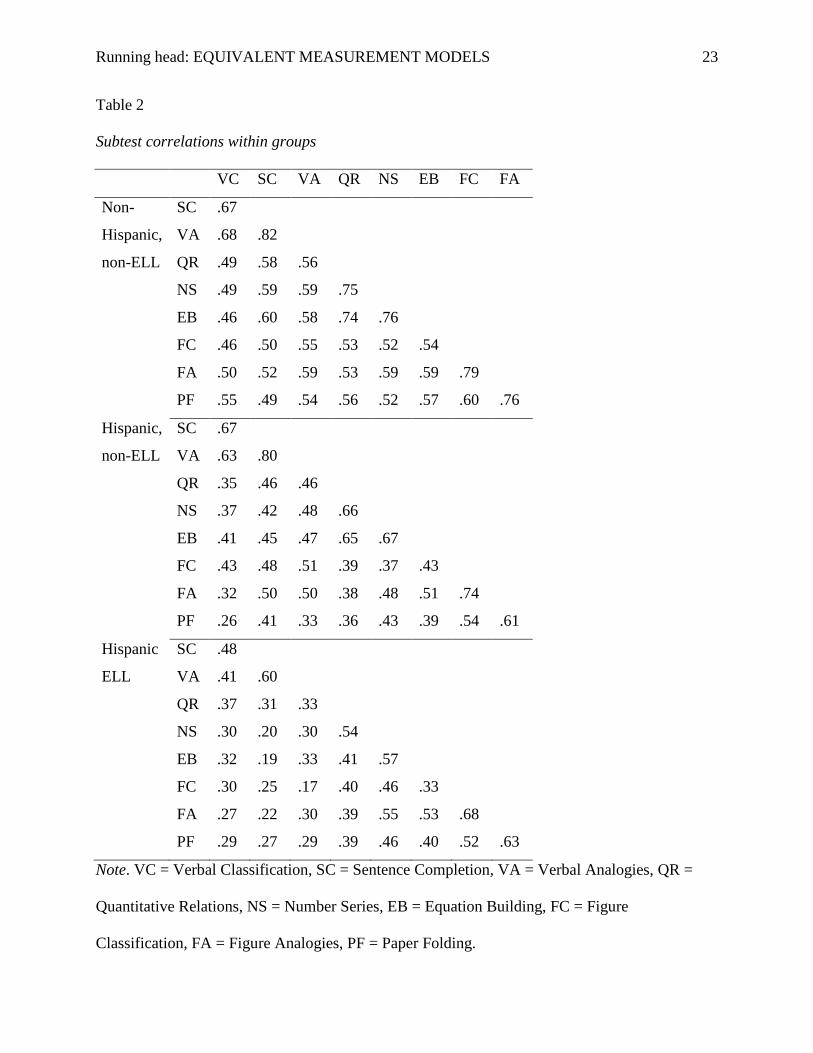
Correlations of the subtest raw scores are presented in Table 2. The correlations were
universally lower for ELL students. The average correlations for subtests were .59, .48, and .38
for non-Hispanic non-ELLs, Hispanic non-ELLs, and Hispanic ELLs, respectively. Item bundle
correlations met expectations, with a .44 average correlation between bundles. Within batteries,
the average item bundle correlations ranged from .55 to .60. Within subtests, the average was
.69. Cronbach’s alpha estimates indicated that the internal consistency of the bundles was
acceptable: the average alpha was .66 with a range of .58 to .75.
[Table 2]
2 These constraints were acceptable because variations in first-order factor loadings were not theoretically
meaningful.
Running head: EQUIVALENT MEASUREMENT MODELS 11
3.1 Multi-group Confirmatory Factor Analysis
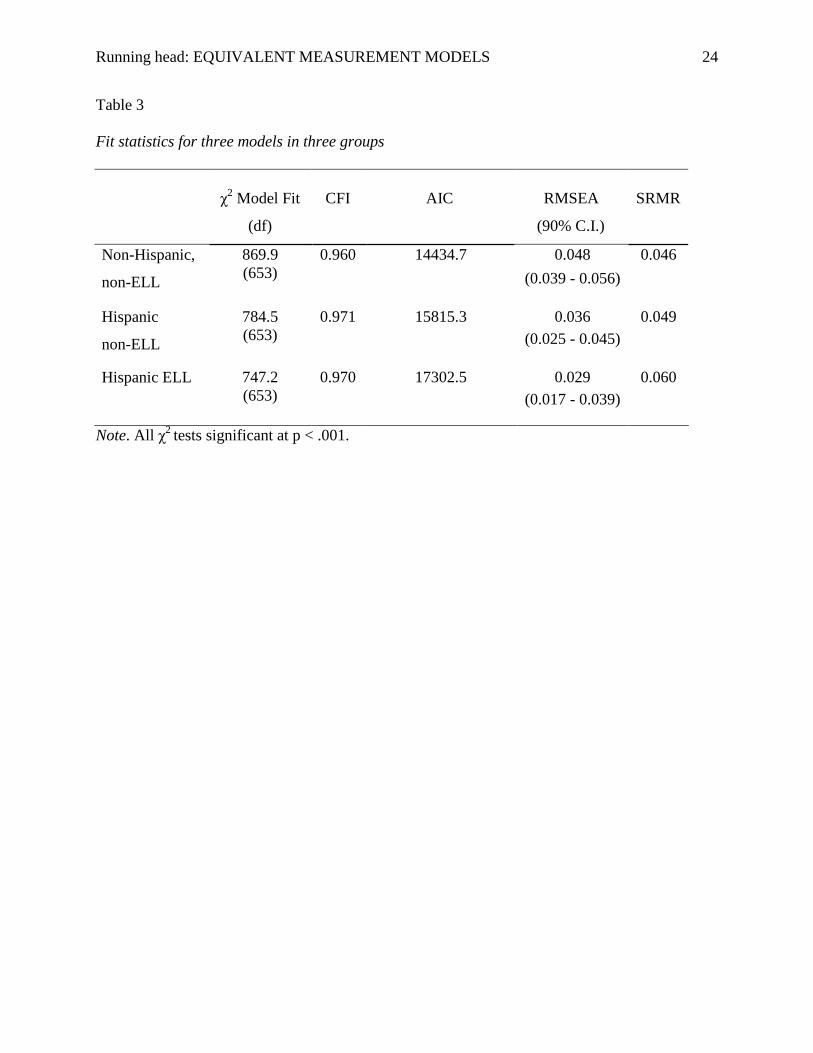
The first step of the multi-group analysis was to determine whether a common
measurement model was plausible in the three focus groups considered separately. The fit for the
three-factor model was strong in all three groups. See Table 3.
[Table 3]
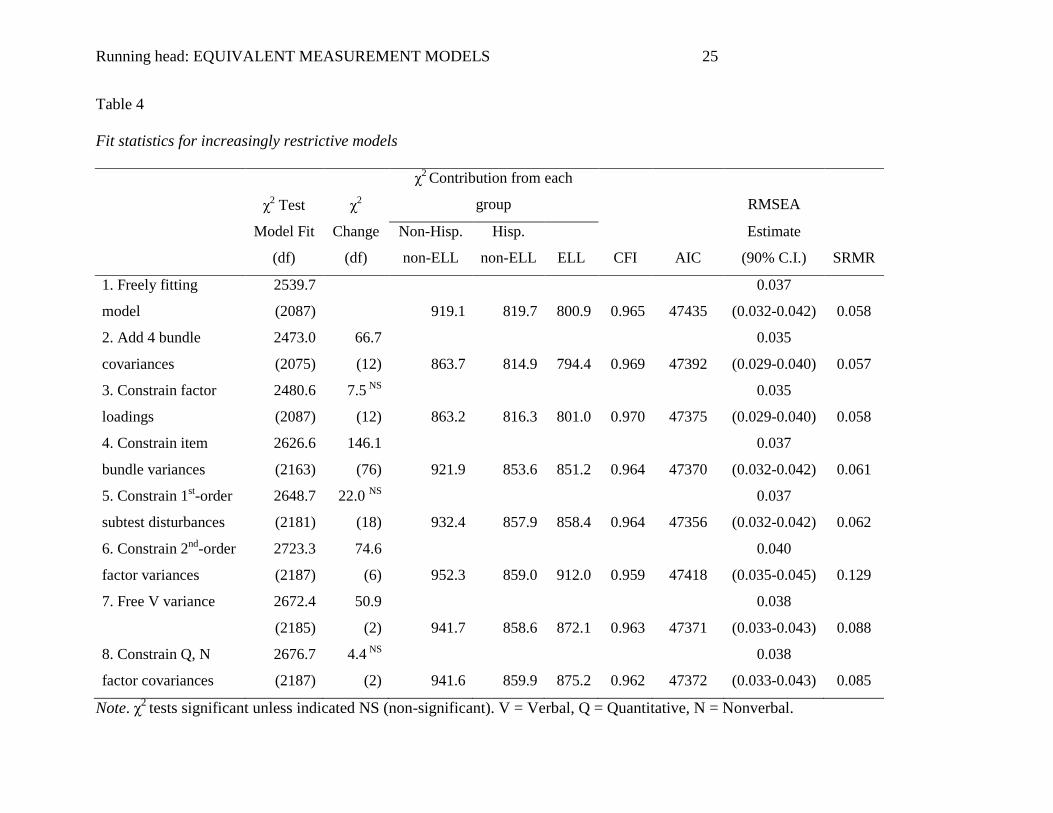
The next step of the multi-group analysis was to fit the common model to all three groups
simultaneously with the parameters freely estimated for each group except those fixed for
identification (see section 2.3). With all parameters freed, the fit was good. See Table 4.
Inspection of the modification indices indicated that fit could be improved significantly by
allowing correlations between some item bundles (five quantitative bundles and two nonverbal).
Inclusion of these covariances improved fit, but did not change the substantive interpretations of
later models and conclusions.
The first theoretical constraints (step 3 in Table 4) added to the models constrained the
factor loadings of the first-order subtest factors onto the second-order battery factors across all
three groups.3 Constraining the factor loadings caused non-significant changes in fit. Thus, the
relationship between the subtests and the batteries appeared to be consistent across groups.
[Table 4]
The second and third theoretical constraints (step 4 and 5 in Table 4) constrained the
bundle error variances and first-order factor disturbances, respectively. These constraints caused
no appreciable change in the fit of the model, although step 4 and 5 provided the best fit of any
of the models tested based on the AIC and SRMR values.
3 Recall that the loadings of the item bundles onto the first-order subtest factors were already constrained to identify
the model (section 2.3).
Running head: EQUIVALENT MEASUREMENT MODELS 12
In step 6 of the model fitting, the variances of the second-order factors reflecting the three
batteries were constrained to be equal across all three groups. These constraints caused a modest
but significant decrease on all fit indices. The change in fit was pronounced for the ELL group in
which the χ2 contribution increased from 858.4 to 912.0. Freeing the constraint on the variance of
the verbal factor significantly improved fit.
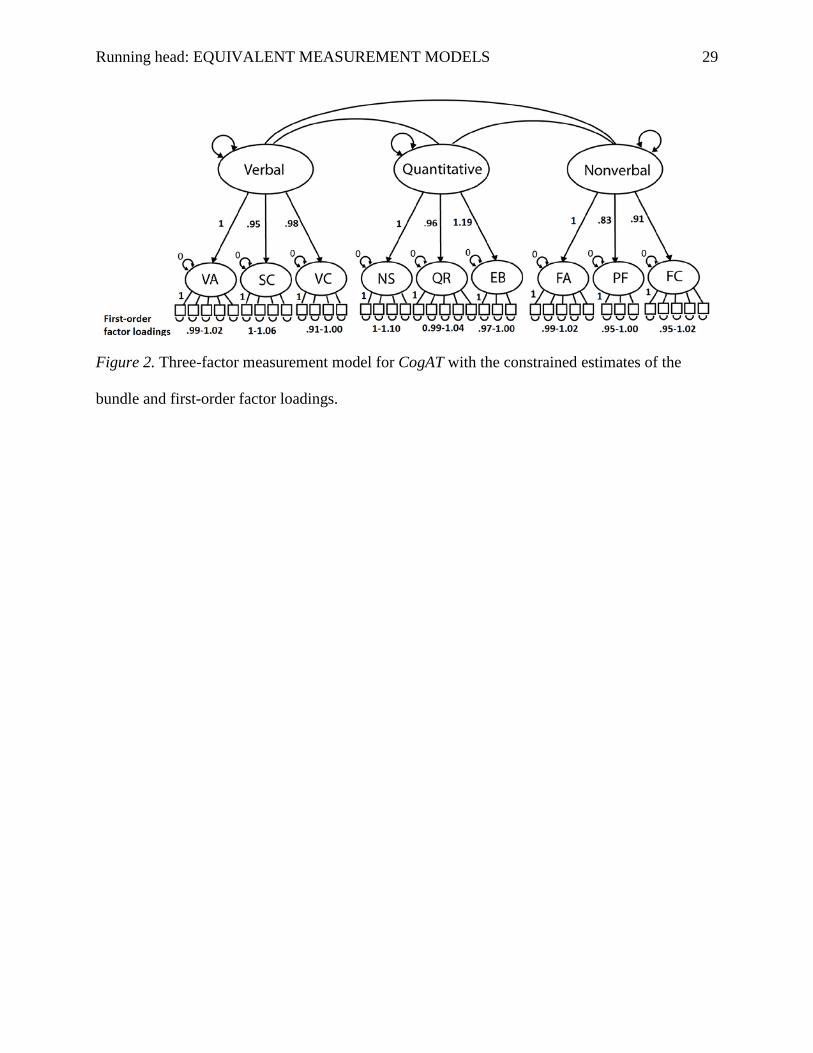
The final step in model building was to constrain the factor covariances. Because the
verbal factor variance was found to vary by group, only the quantitative and nonverbal factor
covariance was tested for invariance. The results indicated that the addition of that constraint did
not significantly impact fit. Figure 2 provides the constrained estimates of the bundle and first-
order factor loadings.
[Figure 2]
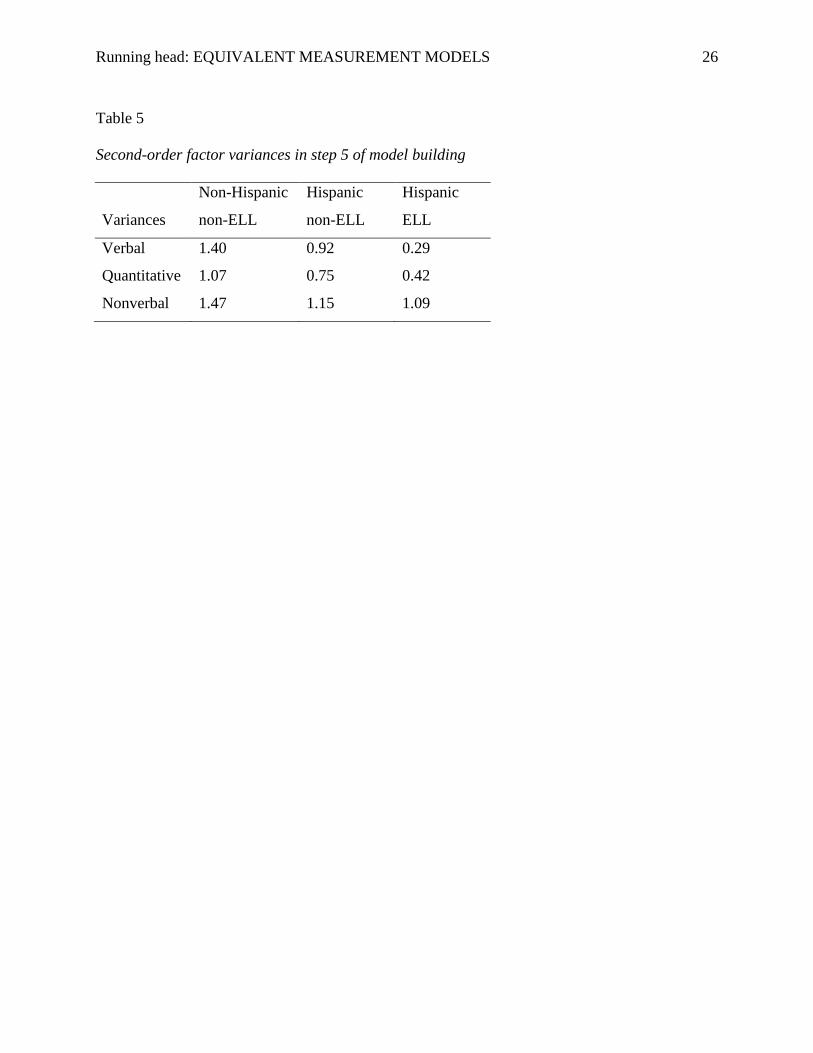
3.2 Verbal Factor Variance
Model fit indicated that the verbal factor variance varied by group, especially the
Hispanic ELL group. Estimates of the factor variances at step 5 (prior to constraining the factor
variance parameters) are presented in Table 5. The differences in variance for the verbal factor
were large (1.4 for non-Hispanic, non-ELL vs. 0.29 for Hispanic ELL). Although differences
were smaller, both the quantitative and nonverbal factors showed similar trends of decreasing
variance across groups. For each broad factor, the Hispanic ELL group showed less variability
compared to the Hispanic non-ELL group and especially compared to the non-Hispanic, non-
ELL group.
[Table 5]
Running head: EQUIVALENT MEASUREMENT MODELS 13
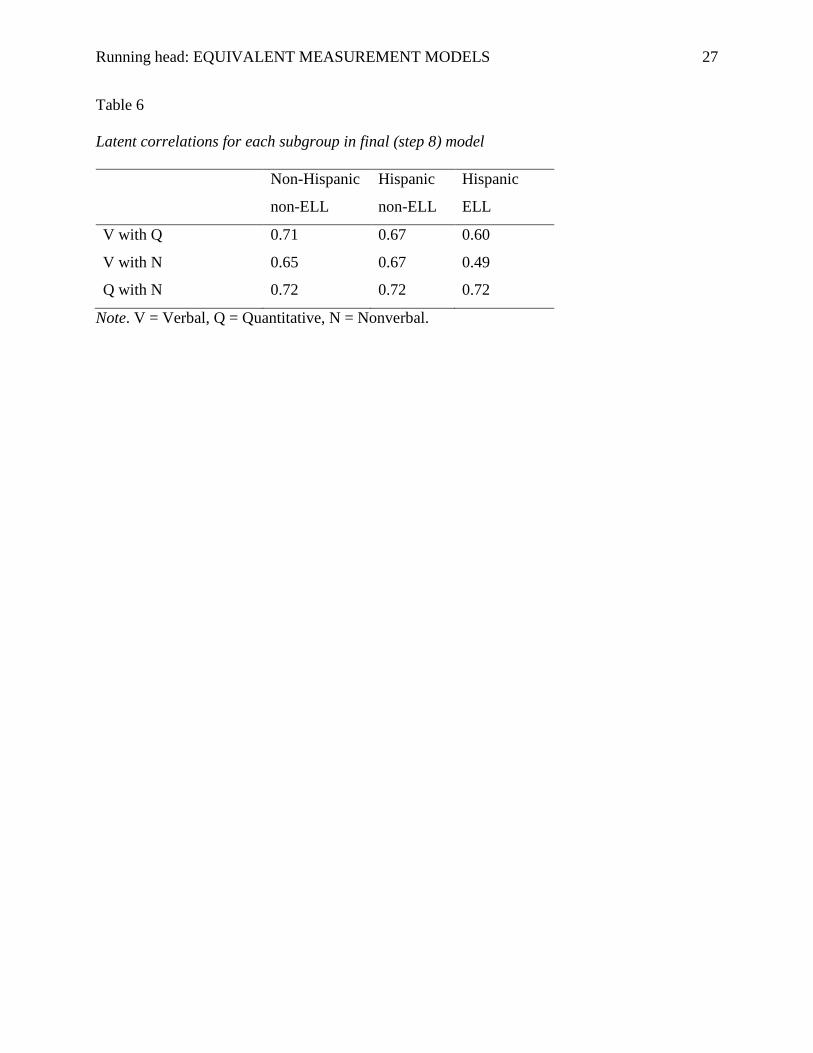
3.3 Factor Covariance
Differences in variability impacted the relationships between the batteries. The strength
of the relationships between the batteries was important, because, if the tests measure reasoning
abilities equally well in all three groups, the battery factors should be strongly correlated. These
correlations would be consistent with the measurement of a general fluid reasoning ability factor
(Gf), which the CogAT is intended to measure in addition to domain-specific reasoning abilities
(Lohman & Hagen, 2002). In the final model, the covariance between quantitative and nonverbal
factors was constrained, and showed a relatively strong relationship. See Table 6. The
unconstrained covariances of the verbal with quantitative factor were also quite similar across
the three groups, though somewhat lower for the Hispanic ELL group. The greatest discrepancy
was in the relationship between the verbal and nonverbal factor, for which the covariance was
much lower for the Hispanic ELL group. The constructs measured by these two factors are less
strongly related in this sample, indicating that there may be less construct-relevant variance (with
respect to measuring general reasoning) measured by the verbal factor.
[Table 6]
4. Discussion
The results of this study indicated that the factorial structure of the tests is consistent
across ELL and non-ELL samples. Fitting a three-factor model to the three groups individually
yielded strong fit estimates. Thus, use of battery-level scores for verbal, quantitative, and
nonverbal reasoning, rather than a single composite, appeared warranted for both ELL and non-
ELL students as well as both Hispanic and non-Hispanic students. The invariance of the factor
loadings of subtests on the broad battery factors also supported the battery-level scoring system
for the three groups. This indicated that the relationship between the subtests and batteries are
Running head: EQUIVALENT MEASUREMENT MODELS 14
consistent across groups, and there was no bias in the contributions of subtests to factors (an
interpretation suggested by Brown, 2006). Overall, it was clear that distinct constructs are tapped
by the three batteries, though additional research is needed to determine if the constructs
measured are the same reasoning abilities for all students and have the same instructional
implications.
For the second research question regarding the variances of the battery-level factors, the
model indicated that the groups differed substantially in their variability on the latent verbal
factor and somewhat on the latent quantitative factor. Additional research is needed to determine
whether this reflects amenable issues with the design of the tests or if this reflects true
differences in variability on verbal reasoning.
In response to the third research question regarding covariances between factors, the
results again indicate partial invariance across groups. The covariance of the verbal factor with
the other two factors varied substantially by group, particularly for ELL students. This indicated
that the verbal battery may not load as strongly on a general factor for ELL students and
measures a more distinct factor. In contrast, the covariance between quantitative and nonverbal
factors was invariant and strong across the three groups. This indicates that the quantitative and
nonverbal batteries measure general reasoning ability well in all three groups, but also measure
distinct skills that may provide discriminant validity for specific achievement criteria.
4.1 Subgroup norms
Invariant factor loadings (research question 1) support the conclusion of metric
invariance by Horn and McArdle’s (1992) definition and measurement unit equivalence by van
de Vijver and Poortinga’s definition (2005). However, due to the differences in variance
identified (research question 2), full score equivalence (van de Vijver & Poortinga), was not met.
Running head: EQUIVALENT MEASUREMENT MODELS 15
The implication is that CogAT scores are appropriate for interpreting individual differences
within groups, but have limitations for making substantive inferences about the cause of mean
differences between groups. Thus, to make appropriate inferences about the reasoning abilities
of ELL students, multiple norm groups that allow comparisons of ELL students’ scores to other
ELL students are needed. This is true for any of the three most common uses of ability tests:
contrasting achievement-ability scores, gifted and talented placement, and differentiating
instruction.
Norms based on relevant comparison groups can support appropriate inferences about the
reasoning skills of students by comparing them to students with similar educational
opportunities. One example of these norms comes from the WISC-IV Spanish, which offers both
full-scale and index scores based on a national sample of Spanish-language dominant children
and percentile ranks based on parental education and proportion of schooling completed in U.S.
schools (Weiss et al., 2006). Weiss et al. (2006) argued that parental education and time in U.S.
schools act as proxies for acculturation that led to more valid interpretations about student
performance on the WISC-IV.
Subgroup norms offer advantages in making appropriate inferences about students’
abilities, but they also have a number of psychometric and practical challenges. First, developing
adequate norms becomes challenging when many norm groups are needed. Fortunately, it is not
necessary to create finely grained norms to reap the benefits of multiple norm comparisons
(Lohman, in press). The two subgroup norms the WISC-IV offers go a long way towards
contextualizing students’ performance and helping test users evaluate the quality of students’
cognitive skills when compared to students with similar backgrounds. Second, high quality
national norms are expensive to develop. Thus most ability tests do not offer multiple norm
Running head: EQUIVALENT MEASUREMENT MODELS 16
groups. In response, Lohman (in press) developed a straightforward approach to developing local
comparison groups that are especially helpful for group-administered tests that are administered
to all children in particular grade in a school or school district. Although these local norms will
not have the same psychometric quality that published tests offer, the norms are still valuable in
understanding student performance and are useful in making low-stakes decisions. As with the
WISC-IV Spanish, the primary advantage is the provision of multiple normative perspectives for
interpreting a child’s performance on each of the test batteries: national index and percentile
ranks, local percentile ranks, and rank within OTL group.
5. Conclusion
Because the U.S. school system consists of a large and increasing population of students
who are ELLs, innovations like subgroup norms may be necessary to support the use of ability
tests with culturally and linguistically diverse students. The current study is a first step to better
understanding how an existing multidimensional ability test can be used to make fair and valid
inferences about the ability of ELL students. Given the potential benefits of using
multidimensional ability tests for making instructional decisions and differentiating instruction, it
is important that researchers explore the appropriateness of such inferences for ELL students.
The observation of partial measurement invariance for ELL and non-ELL groups in this study is
necessary but not sufficient support for a validity argument for the use of the CogAT for making
important educational decisions for ELL students. Further research is needed to determine how
teachers should use information about student abilities to differentiate instruction appropriately
for all students regardless of cultural or linguistic background.
Running head: EQUIVALENT MEASUREMENT MODELS 17
References
Anastasi, A. (1980). Abilities and the measurement of achievement. New Directions for Testing
and Measurement, 5, 1-10.
Bollen, K. A. (1989). Structural Equations with Latent Variables. New York, NY: John Wiley &
Sons.
Braden, J.P. (2000). Editor’s introduction: Perspectives on the nonverbal assessment of
intelligence. Journal of Psychoeducational Assessment, 18, 204-210.
Brown, T.A. (2006). Confirmatory Factor Analysis for Applied Research. New York, NY: The
Guilford Press.
Byrne, B. M., & Stewart, S.M. (2006). Teacher’s corner: The MACS approach to testing for
multigroup invariance of a second-order structure: A Walk Through the Process.
Structural Equation Modeling: A Multidisciplinary Journal, 13, 287- 321.
Carroll, J. B. (1993). Human Cognitive Abilities: A Survey of the Factor-Analytic Studies. New
York: Cambridge University Press.
Chen, F. F., Sousa, K. H., & West, S. G. (2005). Teacher's corner: Testing measurement
invariance of second-order factor models. Structural Equation Modeling: A
Multidisciplinary Journal, 12, 471-492.
Corno, L. (1995). The principles of adaptive teaching. In A.C. Ornstein (Ed.), Teaching: Theory
into practice (pp. 98-115). Boston, MA: Allyn & Bacon.
Corno, L., Cronbach, L. J., Kupermintz, H., Lohman, D. F., Mandinach, E. B., Porteus, A.W., &
Talbert, J. E. (2002). Remaking the concept of aptitude: Extending the legacy of Richard
E. Snow. Hillsdale, NJ: Lawrence Erlbaum.
Running head: EQUIVALENT MEASUREMENT MODELS 18
Cronbach, L. J., & Snow, R. E. (1977). Aptitudes and instructional methods: A handbook for
research on aptitude-treatment interactions. New York, NY: Irvington.
DiPerna, J.C. (2005). [Review of the Cognitive Abilities Test Form 6]. In The sixteenth mental
measurements yearbook. Retrieved from http://www.unl.edu/buros/
Evans, J. St. B. T., & Feeney, A. (2004). The role of prior belief in reasoning. In R. J. Sternberg,
& J. P. Leighton (Eds.), The nature of reasoning (pp. 78-102). Cambridge, UK:
Cambridge University Press.
Federal Interagency Forum on Child and Family Statistics. (2011). America’s children: Key
national indicators of well-being. Washington, DC: U.S. Government Printing Office.
Ford, D.Y., Grantham, T.C., & Whiting, G.W. (2008). Culturally and linguistically diverse
students in gifted education: Recruitment and retention issues. Exceptional Children,
74(3), 289-306.
Gregory, R.J. (2004). Psychological testing: History, principles, and applications (4th ed.).
Boston: Allyn & Bacon.
Gustafsson, J.-E., & Balke, G. (1993). General and specific abilities as predictors of school
achievement. Multivariate Behavioral Research, 28, 407-434.
Harris, B., Rapp, K. E., Martinez, R. S., & Plucker, J. A. (2007). Identifying English language
learners for gifted and talented programs: Current practices and recommendations for
improvement. Roeper Review, 29, 26-29.
Horn, J. L., & McArdle, J. J. (1992). A practical and theoretical guide to measurement invariance
in aging research. Experimental Aging Research, 18, 117-144.
Keith, T. Z. (1999). Effects of general and specific abilities on student achievement: Similarities
and differences across ethnic groups. School Psychology Quarterly, 14(3), 239-262.
Running head: EQUIVALENT MEASUREMENT MODELS 19
Lewis, J. D. (2001). Language isn't needed: Nonverbal assessments and gifted learners. Growing
Partnerships for Rural Special Education, San Diego, CA.
Little, T.D., Cunningham, W.A., Shahar, G., & Widaman, K.F. (2002). To parcel or not to
parcel: Exploring the question, weighing the merits. Structural Equation Modeling, 9(2),
151-173.
Lohman, D. F. (2000). Complex information processing and intelligence. In R.J. Sternberg (Ed.)
Handbook of human intelligence (2nd ed.) (pp. 285-340). Cambridge, MA: Cambridge
University Press.
Lohman, D. F. (2003a). The Wechsler Intelligence Scale for Children III and the Cognitive
Abilities Test (Form 6): Are the general factors the same? Retrieved from
http://faculty.education.uiowa.edu/dlohman/
Lohman, D. F. (2003b). The Woodcock-Johnson III and the Cognitive Abilities Test (Form 6): A
concurrent validity study. Retrieved from http://faculty.education.uiowa.edu/dlohman/
Lohman, D. F. (2006). Beliefs about differences between ability and accomplishment: From folk
theories to cognitive science. Roeper Review, 29, 32-40
Lohman, D. F. (in press). Nontraditional uses of traditional measures. To appear in C. M.
Callahan & H. Hertberg-Davis (Eds.) Fundamentals of gifted education. New York, NY:
Routledge.
Lohman, D.F., Gambrell, J., & Lakin, J.M. (2008). The commonality of extreme discrepancies in
the ability profiles of academically gifted students. Psychology Science Quarterly,50,
269-282.
Lohman, D. F., & Hagen, E. P. (2001a). Cognitive Abilities Test (Form 6). Itasca, IL: Riverside.
Running head: EQUIVALENT MEASUREMENT MODELS 20
Lohman, D. F., & Hagen, E. P. (2001b). CogAT Form 6 Interpretive Guide for Teachers and
Counselors. Itasca, IL: Riverside.
Lohman, D. F., & Hagen, E. P. (2002). Cognitive Abilities Test (Form 6): Research handbook.
Itasca, IL: Riverside.
Lohman, D. F., Korb, K. A., & Lakin, J. M. (2008). Identifying academically gifted English-
language learners using nonverbal tests: A comparison of the raven, NNAT, and CogAT.
Gifted Child Quarterly, 52(4), 275-296.
Muthén, L.K., & Muthén, B.O. (1998-2009). Mplus User’s Guide (5th edition). Los Angeles, CA:
Muthén & Muthén.
Ortiz, S. O., & Dynda, A. M. (2005). Use of intelligence tests with culturally and linguistically
diverse populations. In D. P. Flanagan, & P. L. Harrison (Eds.), Contemporary
intellectual assessment: Theories, tests, and issues (2nd ed., pp. 545-556). New York:
Guilford Press.
Ortiz, S. O., & Ochoa, S. H. (2005). Advances in cognitive assessment of culturally and
linguistically diverse individuals. In D. P. Flanagan, & P. L. Harrison (Eds.),
Contemporary Intellectual Assessment: Theories, Tests, and Issues (2nd ed., pp. 234-
250). New York: Guilford Press.
Snow, R.E. (1992). Aptitude theory: Yesterday, today, and tomorrow. Educational Psychologist,
27, 1-5.
Stern, W. (1914). The psychological methods of testing intelligence. In G.M. Whipple (Ed. &
Trans.), Educational psychology monographs (No. 13). Baltimore: Warwick & York.
Retrieved from http://hdl.handle.net/2027/mdp.39015014498391
Thorndike, R. L. (1983). Applied Psychometrics. Boston, MA: Houghton Mifflin.
Running head: EQUIVALENT MEASUREMENT MODELS 21
van de Vijver, F.J.R., & Poortinga, Y.H. (2005). Conceptual and methodological issues in
adapting tests. In R.K. Hambleton, P.F. Merenda, & C.D. Spielberger (Eds.), Adapting
Educational and Psychological Tests for Cross-Cultural Assessment (pp. 39-63).
Mahwah, NJ: Lawrence Erlbaum Associates.
Vanderwood, M.L., McGrew, K.S., Flanagan, D.P., & Keith, T.Z. (2001). The contribution of
general and specific cognitive abilities to reading achievement. Learning and Individual
Differences, 13, 159-188.
Weiss, L. G., Saklofske, D.H., Prifitera, A., & Holdnack, J. A. (2006). WISC-IV Advanced
Clinical Interpretation. Burlington, MA: Elsevier.
Running head: EQUIVALENT MEASUREMENT MODELS 22
Table 1
Descriptive statistics for raw scores on subtests by ethnic/language group
Verbal Quantitative Nonverbal
VC SC VA QR NS EB FC FA PF
Number of items 16 16 20 20 16 12 20 20 12
Non-Hispanic,
non-ELL
M 10 8.8 10.7 10.8 9.3 6.2 12.5 11.1 6.2
SD 5.9 5.0 6.6 6.2 4.9 4.2 6.7 6.4 4.0
Hispanic,
non-ELL
M 10 9.1 11 11.3 10.3 6.9 13.1 11.9 6.1
SD 5.1 4.2 5.4 5.7 4.2 3.8 5.7 6.1 3.7
Hispanic ELL M 6.2 4.7 5.8 7.9 7.7 4.5 9.3 8.5 4.4
SD 4.1 2.9 3.5 4.4 4.1 3 5.9 6 3.3
Cohen's d
Non-Hispanic vs.
Hispanic non-ELLa
-0.01 -0.08 -0.05 -0.09 -0.22 -0.17 -0.10 -0.13 0.01
Hispanic Non-ELL
vs. ELLa 0.82 1.23 1.14 0.68 0.63 0.72 0.65 0.57 0.50
Note. VC = Verbal Classification, SC = Sentence Completion, VA = Verbal Analogies, QR =
Quantitative Relations, NS = Number Series, EB = Equation Building, FC = Figure
Classification, FA = Figure Analogies, PF = Paper Folding.
a Negative values indicate that Hispanic non-ELL students had higher average scores.
Running head: EQUIVALENT MEASUREMENT MODELS 23
Table 2
Subtest correlations within groups
VC SC VA QR NS EB FC FA
Non-
Hispanic,
non-ELL
SC .67
VA .68 .82
QR .49 .58 .56
NS .49 .59 .59 .75
EB .46 .60 .58 .74 .76
FC .46 .50 .55 .53 .52 .54
FA .50 .52 .59 .53 .59 .59 .79
PF .55 .49 .54 .56 .52 .57 .60 .76
Hispanic,
non-ELL
SC .67
VA .63 .80
QR .35 .46 .46
NS .37 .42 .48 .66
EB .41 .45 .47 .65 .67
FC .43 .48 .51 .39 .37 .43
FA .32 .50 .50 .38 .48 .51 .74
PF .26 .41 .33 .36 .43 .39 .54 .61
Hispanic
ELL
SC .48
VA .41 .60
QR .37 .31 .33
NS .30 .20 .30 .54
EB .32 .19 .33 .41 .57
FC .30 .25 .17 .40 .46 .33
FA .27 .22 .30 .39 .55 .53 .68
PF .29 .27 .29 .39 .46 .40 .52 .63
Note. VC = Verbal Classification, SC = Sentence Completion, VA = Verbal Analogies, QR =
Quantitative Relations, NS = Number Series, EB = Equation Building, FC = Figure
Classification, FA = Figure Analogies, PF = Paper Folding.
Running head: EQUIVALENT MEASUREMENT MODELS 24
Table 3
Fit statistics for three models in three groups
χ2 Model Fit CFI AIC RMSEA SRMR
(df)
(90% C.I.)
Non-Hispanic,
non-ELL
869.9 (653)
0.960 14434.7 0.048 0.046 (0.039 - 0.056)
Hispanic
non-ELL
784.5 (653)
0.971 15815.3 0.036 0.049 (0.025 - 0.045)
Hispanic ELL 747.2 (653)
0.970 17302.5 0.029 0.060 (0.017 - 0.039)
Note. All χ2 tests significant at p < .001.
Running head: EQUIVALENT MEASUREMENT MODELS 25
Table 4
Fit statistics for increasingly restrictive models
χ2 Test
Model Fit
(df)
χ2
Change
(df)
χ2 Contribution from each
group
CFI AIC
RMSEA
SRMR
Non-Hisp.
non-ELL
Hisp.
non-ELL ELL
Estimate
(90% C.I.)
1. Freely fitting
model
2539.7
(2087)
919.1 819.7 800.9 0.965 47435
0.037
(0.032-0.042) 0.058
2. Add 4 bundle
covariances
2473.0
(2075)
66.7
(12) 863.7 814.9 794.4 0.969 47392
0.035
(0.029-0.040) 0.057
3. Constrain factor
loadings
2480.6
(2087)
7.5 NS
(12) 863.2 816.3 801.0 0.970 47375
0.035
(0.029-0.040) 0.058
4. Constrain item
bundle variances
2626.6
(2163)
146.1
(76) 921.9 853.6 851.2 0.964 47370
0.037
(0.032-0.042) 0.061
5. Constrain 1st-order
subtest disturbances
2648.7
(2181)
22.0 NS
(18) 932.4 857.9 858.4 0.964 47356
0.037
(0.032-0.042) 0.062
6. Constrain 2nd-order
factor variances
2723.3
(2187)
74.6
(6) 952.3 859.0 912.0 0.959 47418
0.040
(0.035-0.045) 0.129
7. Free V variance 2672.4
(2185)
50.9
(2) 941.7 858.6 872.1 0.963 47371
0.038
(0.033-0.043) 0.088
8. Constrain Q, N
factor covariances
2676.7
(2187)
4.4 NS
(2) 941.6 859.9 875.2 0.962 47372
0.038
(0.033-0.043) 0.085
Note. χ2 tests significant unless indicated NS (non-significant). V = Verbal, Q = Quantitative, N = Nonverbal.
Running head: EQUIVALENT MEASUREMENT MODELS 26
Table 5
Second-order factor variances in step 5 of model building
Variances
Non-Hispanic
non-ELL
Hispanic
non-ELL
Hispanic
ELL
Verbal 1.40 0.92 0.29
Quantitative 1.07 0.75 0.42
Nonverbal 1.47 1.15 1.09
Running head: EQUIVALENT MEASUREMENT MODELS 27
Table 6
Latent correlations for each subgroup in final (step 8) model
Non-Hispanic
non-ELL
Hispanic
non-ELL
Hispanic
ELL
V with Q 0.71 0.67 0.60
V with N 0.65 0.67 0.49
Q with N 0.72 0.72 0.72
Note. V = Verbal, Q = Quantitative, N = Nonverbal.
Running head: EQUIVALENT MEASUREMENT MODELS 28
Figure 1. Three-factor measurement model for CogAT. The nine subtests in order are Verbal
Analogies, Sentence Completion, Verbal Classification, Number Series, Quantitative Reasoning,
Equation Building, Figure Analogies, Paper Folding, and Figure Classification.
Running head: EQUIVALENT MEASUREMENT MODELS 29
Figure 2. Three-factor measurement model for CogAT with the constrained estimates of the
bundle and first-order factor loadings.
Related Documents