The Astrophysical Journal, 726:43 (14pp), 2011 January 1 doi:10.1088/0004-637X/726/1/43 C 2011. The American Astronomical Society. All rights reserved. Printed in the U.S.A. MULTI-WAVELENGTH OBSERVATIONS OFTHE FLARING GAMMA-RAY BLAZAR 3C 66A IN 2008 OCTOBER A. A. Abdo 1 ,2 , M. Ackermann 3 , M. Ajello 3 , L. Baldini 4 , J. Ballet 5 , G. Barbiellini 6 ,7 , D. Bastieri 8 ,9 , K. Bechtol 3 , R. Bellazzini 4 , B. Berenji 3 , R. D. Blandford 3 , E. Bonamente 10 ,11 , A. W. Borgland 3 , A. Bouvier 3 , J. Bregeon 4 , A. Brez 4 , M. Brigida 12 ,13 , P. Bruel 14 , R. Buehler 3 , S. Buson 8,9 , G. A. Caliandro 15 , R. A. Cameron 3 , P. A. Caraveo 16 , S. Carrigan 9 , J. M. Casandjian 5 , E. Cavazzuti 17 , C. Cecchi 10,11 , ¨ O. ¸ Celik 18 ,19 ,20 , E. Charles 3 , A. Chekhtman 1 ,21 , C. C. Cheung 1,2 , J. Chiang 3 , S. Ciprini 11 , R. Claus 3 , J. Cohen-Tanugi 22 , J. Conrad 23 ,24 ,118 , L. Costamante 3 , S. Cutini 17 , D. S. Davis 18 ,20 , C. D. Dermer 1 , F. de Palma 12,13 , S. W. Digel 3 , E. do Couto e Silva 3 , P. S. Drell 3 , R. Dubois 3 , D. Dumora 25 ,26 , C. Favuzzi 12 ,13 , S. J. Fegan 14 , P. Fortin 14 , M. Frailis 27 ,28 , L. Fuhrmann 29 , Y. Fukazawa 30 , S. Funk 3 , P. Fusco 12,13 , F. Gargano 13 , D. Gasparrini 17 , N. Gehrels 18 , S. Germani 10 ,11 , N. Giglietto 12 ,13 , P. Giommi 17 , F. Giordano 12,13 , M. Giroletti 31 , T. Glanzman 3 , G. Godfrey 3 , I. A. Grenier 5 , J. E. Grove 1 , L. Guillemot 25 ,26,29 , S. Guiriec 32 , D. Hadasch 15 , M. Hayashida 3 , E. Hays 18 , D. Horan 14 , R. E. Hughes 33 , R. Itoh 30 , G. J ´ ohannesson 3 , A. S. Johnson 3 , T. J. Johnson 18 ,34 , W. N. Johnson 1 , T. Kamae 3 , H. Katagiri 30 , J. Kataoka 35 , J. Kn ¨ odlseder 36 , M. Kuss 4 , J. Lande 3 , L. Latronico 4 , S.-H. Lee 3 , F. Longo 6,7 , F. Loparco 12 ,13 , B. Lott 25,26 , M. N. Lovellette 1 , P. Lubrano 10,11 , A. Makeev 1,21 , M. N. Mazziotta 13 , J. E. McEnery 18,34 , J. Mehault 22 , P. F. Michelson 3 , T. Mizuno 30 , A. A. Moiseev 19 ,34 , C. Monte 12,13 , M. E. Monzani 3 , A. Morselli 37 , I. V. Moskalenko 3 , S. Murgia 3 , T. Nakamori 35 , M. Naumann-Godo 5 , I. Nestoras 29 , P. L. Nolan 3 , J. P. Norris 38 , E. Nuss 22 , T. Ohsugi 39 , A. Okumura 40 , N. Omodei 3 , E. Orlando 41 , J. F. Ormes 38 , M. Ozaki 40 , D. Paneque 3 , J. H. Panetta 3 , D. Parent 1 ,21 , V. Pelassa 22 , M. Pepe 10 ,11 , M. Pesce-Rollins 4 , F. Piron 22 , T. A. Porter 3 , S. Rain ` o 12 ,13 , R. Rando 8 ,9 , M. Razzano 4 , A. Reimer 42 ,3 , O. Reimer 42,3 , L. C. Reyes 43 , J. Ripken 23 ,24 , S. Ritz 44 , R. W. Romani 3 , M. Roth 45 , H. F.-W. Sadrozinski 44 , D. Sanchez 14 , A. Sander 33 , J. D. Scargle 46 , C. Sgr ` o 4 , M. S. Shaw 3 , P. D. Smith 33 , G. Spandre 4 , P. Spinelli 12,13 , M. S. Strickman 1 , D. J. Suson 47 , H. Takahashi 39 , T. Tanaka 3 , J. B. Thayer 3 , J. G. Thayer 3 , D. J. Thompson 18 , L. Tibaldo 5 ,8 ,9 ,119 , D. F. Torres 15 ,48 , G. Tosti 10,11 , A. Tramacere 3 ,49,50 , T. L. Usher 3 , J. Vandenbroucke 3 , V. Vasileiou 19 ,20 , N. Vilchez 36 , V. Vitale 37 ,51 , A. P. Waite 3 , P. Wang 3 , B. L. Winer 33 , K. S. Wood 1 , Z. Yang 23,24 , T. Ylinen 24 ,52 ,53 , M. Ziegler 44 (The Fermi-LAT Collaboration) V. A. Acciari 54 , E. Aliu 55 , T. Arlen 56 , T. Aune 57 , M. Beilicke 58 , W. Benbow 54 , M. B ¨ ottcher 59 , D. Boltuch 60 , S. M. Bradbury 61 , J. H. Buckley 58 , V. Bugaev 58 , K. Byrum 62 , A. Cannon 63 , A. Cesarini 64 , J. L. Christiansen 65 , L. Ciupik 66 , W. Cui 67 , I. de la Calle Perez 68 , R. Dickherber 58 , M. Errando 55 , A. Falcone 69 , J. P. Finley 67 , G. Finnegan 70 , L. Fortson 66 , A. Furniss 57 , N. Galante 54 , D. Gall 67 , G. H. Gillanders 64 , S. Godambe 70 , J. Grube 66 , R. Guenette 71 , G. Gyuk 66 , D. Hanna 71 , J. Holder 60 , C. M. Hui 70 , T. B. Humensky 72 , A. Imran 73 , P. Kaaret 74 , N. Karlsson 66 , M. Kertzman 75 , D. Kieda 70 , A. Konopelko 76 , H. Krawczynski 58 , F. Krennrich 73 , M. J. Lang 64 , S. LeBohec 70 , G. Maier 71 ,120 , S. McArthur 58 , A. McCann 71 , M. McCutcheon 71 , P. Moriarty 77 , R. Mukherjee 55 , R. A. Ong 56 , A. N. Otte 57 , D. Pandel 74 , J. S. Perkins 54 , A. Pichel 78 , M. Pohl 73 ,121 , J. Quinn 63 , K. Ragan 71 , P. T. Reynolds 79 , E. Roache 54 , H. J. Rose 61 , M. Schroedter 73 , G. H. Sembroski 67 , G. Demet Senturk 80 , A. W. Smith 62 , D. Steele 66 ,122 , S. P. Swordy 72 , G. Teˇ si´ c 71 , M. Theiling 54 , S. Thibadeau 58 , A. Varlotta 67 , V. V. Vassiliev 56 , S. Vincent 70 , S. P. Wakely 72 , J. E. Ward 63 , T. C. Weekes 54 , A. Weinstein 56 , T. Weisgarber 72 , D. A. Williams 57 , S. Wissel 72 , M. Wood 56 (The VERITAS Collaboration) M. Villata 81 , C. M. Raiteri 81 , M. A. Gurwell 82 , V. M. Larionov 83 ,84,85 , O. M. Kurtanidze 86 , M. F. Aller 87 , A. L ¨ ahteenm ¨ aki 88 , W. P. Chen 89 , A. Berduygin 90 , I. Agudo 91 , H. D. Aller 87 , A. A. Arkharov 84 , U. Bach 92 , R. Bachev 93 , P. Beltrame 94 , E. Ben´ ıtez 95 , C. S. Buemi 96 , J. Dashti 97 , P. Calcidese 98 , D. Capezzali 99 , D. Carosati 99 , D. Da Rio 94 , A. Di Paola 100 , C. Diltz 97 , M. Dolci 101 , D. Dultzin 95 , E. Forn ´ e 102 , J. L. G ´ omez 91 , V. A. Hagen-Thorn 83 ,85 , A. Halkola 90 , J. Heidt 103 , D. Hiriart 104 , T. Hovatta 88 , H.-Y. Hsiao 89 , S. G. Jorstad 105 , G. N. Kimeridze 86 , T. S. Konstantinova 83 , E. N. Kopatskaya 83 , E. Koptelova 89 , P. Leto 96 , R. Ligustri 94 , E. Lindfors 90 , J. M. Lopez 104 , A. P. Marscher 105 , M. Mommert 103 ,106 , R. Mujica 107 , M. G. Nikolashvili 86 , K. Nilsson 108 , N. Palma 97 , M. Pasanen 90 , M. Roca-Sogorb 91 , J. A. Ros 102 , P. Roustazadeh 97 , A. C. Sadun 109 , J. Saino 90 , L. A. Sigua 86 , A. Sillan ¨ a¨ a 90 , M. Sorcia 95 , L. O. Takalo 90 , M. Tornikoski 88 , C. Trigilio 96 , R. Turchetti 94 , G. Umana 96 (The GASP-WEBT Consortium) and T. Belloni 110 , C. H. Blake 111 , J. S. Bloom 112 , E. Angelakis 113 , M. Fumagalli 114 , M. Hauser 115 , J. X. Prochaska 114 ,116 , D. Riquelme 117 , A. Sievers 117 , D. L. Starr 112 , G. Tagliaferri 110 , H. Ungerechts 117 , S. Wagner 115 , J. A. Zensus 113 1 Space Science Division, Naval Research Laboratory, Washington, DC 20375, USA 2 National Research Council Research Associate, National Academy of Sciences, Washington, DC 20001, USA 3 W. W. Hansen Experimental Physics Laboratory, Kavli Institute for Particle Astrophysics and Cosmology, Department of Physics and SLAC National Accelerator Laboratory, Stanford University, Stanford, CA 94305, USA 4 Istituto Nazionale di Fisica Nucleare, Sezione di Pisa, I-56127 Pisa, Italy 5 Laboratoire AIM, CEA-IRFU/CNRS/Universit´ e Paris Diderot, Service d’Astrophysique, CEA Saclay, F-91191 Gif sur Yvette, France 1

Welcome message from author
This document is posted to help you gain knowledge. Please leave a comment to let me know what you think about it! Share it to your friends and learn new things together.
Transcript

The Astrophysical Journal 72643 (14pp) 2011 January 1 doi1010880004-637X726143Ccopy 2011 The American Astronomical Society All rights reserved Printed in the USA
MULTI-WAVELENGTH OBSERVATIONS OF THE FLARING GAMMA-RAY BLAZAR3C 66A IN 2008 OCTOBER
A A Abdo12
M Ackermann3 M Ajello
3 L Baldini
4 J Ballet
5 G Barbiellini
67 D Bastieri
89 K Bechtol
3
R Bellazzini4 B Berenji
3 R D Blandford
3 E Bonamente
1011 A W Borgland
3 A Bouvier
3 J Bregeon
4 A Brez
4
M Brigida1213
P Bruel14
R Buehler3 S Buson
89 G A Caliandro
15 R A Cameron
3 P A Caraveo
16 S Carrigan
9
J M Casandjian5 E Cavazzuti
17 C Cecchi
1011 O Celik
181920 E Charles
3 A Chekhtman
121 C C Cheung
12
J Chiang3 S Ciprini
11 R Claus
3 J Cohen-Tanugi
22 J Conrad
2324118 L Costamante
3 S Cutini
17 D S Davis
1820
C D Dermer1 F de Palma
1213 S W Digel
3 E do Couto e Silva
3 P S Drell
3 R Dubois
3 D Dumora
2526
C Favuzzi1213
S J Fegan14
P Fortin14
M Frailis2728
L Fuhrmann29
Y Fukazawa30
S Funk3 P Fusco
1213
F Gargano13
D Gasparrini17
N Gehrels18
S Germani1011
N Giglietto1213
P Giommi17
F Giordano1213
M Giroletti31
T Glanzman3 G Godfrey
3 I A Grenier
5 J E Grove
1 L Guillemot
252629 S Guiriec
32 D Hadasch
15
M Hayashida3 E Hays
18 D Horan
14 R E Hughes
33 R Itoh
30 G Johannesson
3 A S Johnson
3 T J Johnson
1834
W N Johnson1 T Kamae
3 H Katagiri
30 J Kataoka
35 J Knodlseder
36 M Kuss
4 J Lande
3 L Latronico
4 S-H Lee
3
F Longo67
F Loparco1213
B Lott2526
M N Lovellette1 P Lubrano
1011 A Makeev
121 M N Mazziotta
13
J E McEnery1834
J Mehault22
P F Michelson3 T Mizuno
30 A A Moiseev
1934 C Monte
1213 M E Monzani
3
A Morselli37
I V Moskalenko3 S Murgia
3 T Nakamori
35 M Naumann-Godo
5 I Nestoras
29 P L Nolan
3
J P Norris38
E Nuss22
T Ohsugi39
A Okumura40
N Omodei3 E Orlando
41 J F Ormes
38 M Ozaki
40 D Paneque
3
J H Panetta3 D Parent
121 V Pelassa
22 M Pepe
1011 M Pesce-Rollins
4 F Piron
22 T A Porter
3 S Raino
1213
R Rando89
M Razzano4 A Reimer
423 O Reimer
423 L C Reyes
43 J Ripken
2324 S Ritz
44 R W Romani
3 M Roth
45
H F-W Sadrozinski44
D Sanchez14
A Sander33
J D Scargle46
C Sgro4 M S Shaw
3 P D Smith
33 G Spandre
4
P Spinelli1213
M S Strickman1 D J Suson
47 H Takahashi
39 T Tanaka
3 J B Thayer
3 J G Thayer
3
D J Thompson18
L Tibaldo589119
D F Torres1548
G Tosti1011
A Tramacere34950
T L Usher3 J Vandenbroucke
3
V Vasileiou1920
N Vilchez36
V Vitale3751
A P Waite3 P Wang
3 B L Winer
33 K S Wood
1 Z Yang
2324
T Ylinen245253
M Ziegler44
(The Fermi-LAT Collaboration)
V A Acciari54
E Aliu55
T Arlen56
T Aune57
M Beilicke58
W Benbow54
M Bottcher59
D Boltuch60
S
M Bradbury61
J H Buckley58
V Bugaev58
K Byrum62
A Cannon63
A Cesarini64
J L Christiansen65
L Ciupik66
W Cui67
I de la Calle Perez68
R Dickherber58
M Errando55
A Falcone69
J P Finley67
G Finnegan70
L Fortson66
A Furniss57
N Galante54
D Gall67
G H Gillanders64
S Godambe70
J Grube66
R Guenette71
G Gyuk66
D Hanna71
J Holder60
C M Hui70
T B Humensky72
A Imran73
P Kaaret74
N Karlsson66
M Kertzman75
D Kieda70
A Konopelko76
H Krawczynski58
F Krennrich73
M J Lang64
S LeBohec70
G Maier71120
S McArthur58
A McCann71
M McCutcheon71
P Moriarty77
R Mukherjee55
R A Ong56
A N Otte57
D Pandel74
J S Perkins54
A Pichel78
M Pohl73121
J Quinn63
K Ragan71
P T Reynolds79
E Roache54
H J Rose61
M Schroedter73
G H Sembroski67
G Demet Senturk80
A W Smith62
D Steele66122
S P Swordy72
G Tesic71
M Theiling54
S Thibadeau58
A Varlotta67
V V Vassiliev56
S Vincent70
S P Wakely72
J E Ward63
T C Weekes54
A Weinstein56
T Weisgarber72
D A Williams57
S Wissel72
M Wood56
(The VERITAS Collaboration)
M Villata81
C M Raiteri81
M A Gurwell82
V M Larionov838485
O M Kurtanidze86
M F Aller87
A Lahteenmaki88
W P Chen89
A Berduygin90
I Agudo91
H D Aller87
A A Arkharov84
U Bach92
R Bachev93
P Beltrame94
E Benıtez95
C S Buemi96
J Dashti97
P Calcidese98
D Capezzali99
D Carosati99
D Da Rio94
A Di Paola100
C Diltz97
M Dolci101
D Dultzin95
E Forne102
J L Gomez91
V A Hagen-Thorn8385
A Halkola90
J Heidt103
D Hiriart104
T Hovatta88
H-Y Hsiao89
S G Jorstad105
G N Kimeridze86
T S Konstantinova83
E N Kopatskaya83
E Koptelova89
P Leto96
R Ligustri94
E Lindfors90
J M Lopez104
A P Marscher105
M Mommert103106
R Mujica107
M G Nikolashvili86
K Nilsson108
N Palma97
M Pasanen90
M Roca-Sogorb91
J A Ros102
P Roustazadeh97
A C Sadun109
J Saino90
L A Sigua86
A Sillanaa90
M Sorcia95
L O Takalo90
M Tornikoski88
C Trigilio96
R Turchetti94
G Umana96
(The GASP-WEBT Consortium)
and
T Belloni110
C H Blake111
J S Bloom112
E Angelakis113
M Fumagalli114
M Hauser115
J X Prochaska114116
D Riquelme117
A Sievers117
D L Starr112
G Tagliaferri110
H Ungerechts117
S Wagner115
J A Zensus113
1 Space Science Division Naval Research Laboratory Washington DC 20375 USA2 National Research Council Research Associate National Academy of Sciences Washington DC 20001 USA
3 W W Hansen Experimental Physics Laboratory Kavli Institute for Particle Astrophysics and Cosmology Department of Physics and SLAC National AcceleratorLaboratory Stanford University Stanford CA 94305 USA
4 Istituto Nazionale di Fisica Nucleare Sezione di Pisa I-56127 Pisa Italy5 Laboratoire AIM CEA-IRFUCNRSUniversite Paris Diderot Service drsquoAstrophysique CEA Saclay F-91191 Gif sur Yvette France
1
The Astrophysical Journal 72643 (14pp) 2011 January 1 Abdo et al
6 Istituto Nazionale di Fisica Nucleare Sezione di Trieste I-34127 Trieste Italy7 Dipartimento di Fisica Universita di Trieste I-34127 Trieste Italy
8 Istituto Nazionale di Fisica Nucleare Sezione di Padova I-35131 Padova Italy9 Dipartimento di Fisica ldquoG Galileirdquo Universita di Padova I-35131 Padova Italy
10 Istituto Nazionale di Fisica Nucleare Sezione di Perugia I-06123 Perugia Italy11 Dipartimento di Fisica Universita degli Studi di Perugia I-06123 Perugia Italy
12 Dipartimento di Fisica ldquoM Merlinrdquo dellrsquoUniversita e del Politecnico di Bari I-70126 Bari Italy13 Istituto Nazionale di Fisica Nucleare Sezione di Bari I-70126 Bari Italy
14 Laboratoire Leprince-Ringuet Ecole polytechnique CNRSIN2P3 Palaiseau France15 Institut de Ciencies de lrsquoEspai (IEEC-CSIC) Campus UAB E-08193 Barcelona Spain
16 INAF-Istituto di Astrofisica Spaziale e Fisica Cosmica I-20133 Milano Italy17 Agenzia Spaziale Italiana (ASI) Science Data Center I-00044 Frascati (Roma) Italy
18 NASA Goddard Space Flight Center Greenbelt MD 20771 USA19 Center for Research and Exploration in Space Science and Technology (CRESST) and NASA Goddard Space Flight Center Greenbelt MD 20771 USA
20 Department of Physics and Center for Space Sciences and Technology University of Maryland Baltimore County Baltimore MD 21250 USA21 George Mason University Fairfax VA 22030 USA
22 Laboratoire de Physique Theorique et Astroparticules Universite Montpellier 2 CNRSIN2P3 Montpellier France23 Department of Physics Stockholm University AlbaNova SE-106 91 Stockholm Sweden
24 The Oskar Klein Centre for Cosmoparticle Physics AlbaNova SE-106 91 Stockholm Sweden25 CNRSIN2P3 Centre drsquoEtudes Nucleaires Bordeaux Gradignan UMR 5797 F-33175 Gradignan France
26 Universite de Bordeaux Centre drsquoEtudes Nucleaires Bordeaux Gradignan UMR 5797 F-33175 Gradignan France27 Dipartimento di Fisica Universita di Udine and Istituto Nazionale di Fisica Nucleare Sezione di Trieste Gruppo Collegato di Udine I-33100 Udine Italy
28 Osservatorio Astronomico di Trieste Istituto Nazionale di Astrofisica I-34143 Trieste Italy29 Max-Planck-Institut fur Radioastronomie Auf dem Hugel 69 D-53121 Bonn Germany
30 Department of Physical Sciences Hiroshima University Higashi-Hiroshima Hiroshima 739-8526 Japan31 INAF Istituto di Radioastronomia I-40129 Bologna Italy
32 Center for Space Plasma and Aeronomic Research (CSPAR) University of Alabama in Huntsville Huntsville AL 35899 USA33 Department of Physics Center for Cosmology and Astro-Particle Physics The Ohio State University Columbus OH 43210 USA
34 Department of Physics and Department of Astronomy University of Maryland College Park MD 20742 USA35 Research Institute for Science and Engineering Waseda University 3-4-1 Okubo Shinjuku Tokyo 169-8555 Japan
36 Centre drsquoEtude Spatiale des Rayonnements CNRSUPS BP 44346 F-30128 Toulouse Cedex 4 France37 Istituto Nazionale di Fisica Nucleare Sezione di Roma ldquoTor Vergatardquo I-00133 Roma Italy
38 Department of Physics and Astronomy University of Denver Denver CO 80208 USA39 Hiroshima Astrophysical Science Center Hiroshima University Higashi-Hiroshima Hiroshima 739-8526 Japan40 Institute of Space and Astronautical Science JAXA 3-1-1 Yoshinodai Sagamihara Kanagawa 229-8510 Japan
41 Max-Planck Institut fur extraterrestrische Physik D-85748 Garching Germany42 Institut fur Astro- und Teilchenphysik and Institut fur Theoretische Physik Leopold-Franzens-Universitat Innsbruck A-6020 Innsbruck Austria
43 Kavli Institute for Cosmological Physics University of Chicago Chicago IL 60637 USA lreyeskicpuchicagoedu44 Santa Cruz Institute for Particle Physics Department of Physics and Department of Astronomy and Astrophysics
University of California at Santa Cruz Santa Cruz CA 95064 USA45 Department of Physics University of Washington Seattle WA 98195-1560 USA
46 Space Sciences Division NASA Ames Research Center Moffett Field CA 94035-1000 USA47 Department of Chemistry and Physics Purdue University Calumet Hammond IN 46323-2094 USA
48 Institucio Catalana de Recerca i Estudis Avancats (ICREA) Barcelona Spain49 Consorzio Interuniversitario per la Fisica Spaziale (CIFS) I-10133 Torino Italy
50 INTEGRAL Science Data Centre CH-1290 Versoix Switzerland51 Dipartimento di Fisica Universita di Roma ldquoTor Vergatardquo I-00133 Roma Italy
52 Department of Physics Royal Institute of Technology (KTH) AlbaNova SE-106 91 Stockholm Sweden53 School of Pure and Applied Natural Sciences University of Kalmar SE-391 82 Kalmar Sweden
54 Fred Lawrence Whipple Observatory Harvard-Smithsonian Center for Astrophysics Amado AZ 85645 USA55 Department of Physics and Astronomy Barnard College Columbia University NY 10027 USA56 Department of Physics and Astronomy University of California Los Angeles CA 90095 USA
57 Santa Cruz Institute for Particle Physics and Department of Physics University of California Santa Cruz CA 95064 USA58 Department of Physics Washington University St Louis MO 63130 USA
59 Astrophysical Institute Department of Physics and Astronomy Ohio University Athens OH 45701 USA60 Department of Physics and Astronomy and the Bartol Research Institute University of Delaware Newark DE 19716 USA
61 School of Physics and Astronomy University of Leeds Leeds LS2 9JT UK62 Argonne National Laboratory 9700 S Cass Avenue Argonne IL 60439 USA
63 School of Physics University College Dublin Belfield Dublin 4 Ireland64 School of Physics National University of Ireland Galway University Road Galway Ireland
65 Physics Department California Polytechnic State University San Luis Obispo CA 94307 USA66 Astronomy Department Adler Planetarium and Astronomy Museum Chicago IL 60605 USA
67 Department of Physics Purdue University West Lafayette IN 47907 USA68 European Space Astronomy Centre (INSA-ESAC) European Space Agency (ESA) Satellite Tracking Station PO Box Apdo 50727
E-28080 Villafranca del Castillo Madrid Spain69 Department of Astronomy and Astrophysics 525 Davey Lab Pennsylvania State University University Park PA 16802 USA
70 Department of Physics and Astronomy University of Utah Salt Lake City UT 84112 USA71 Physics Department McGill University Montreal QC H3A 2T8 Canada72 Enrico Fermi Institute University of Chicago Chicago IL 60637 USA
73 Department of Physics and Astronomy Iowa State University Ames IA 50011 USA74 Department of Physics and Astronomy University of Iowa Van Allen Hall Iowa City IA 52242 USA
75 Department of Physics and Astronomy DePauw University Greencastle IN 46135-0037 USA76 Department of Physics Pittsburg State University 1701 South Broadway Pittsburg KS 66762 USA
77 Department of Life and Physical Sciences Galway-Mayo Institute of Technology Dublin Road Galway Ireland78 Instituto de Astronomia y Fisica del Espacio Casilla de Correo 67 Sucursal 28 (C1428ZAA) Ciudad Autnoma de Buenos Aires Argentina
79 Department of Applied Physics and Instrumentation Cork Institute of Technology Bishopstown Cork Ireland
2
The Astrophysical Journal 72643 (14pp) 2011 January 1 Abdo et al
80 Columbia Astrophysics Laboratory Columbia University New York NY 10027 USA81 INAF Osservatorio Astronomico di Torino Italy
82 Harvard-Smithsonian Center for Astrophysics MA USA83 Astronomical Institute St Petersburg State University Russia
84 Pulkovo Observatory Russia85 Isaac Newton Institute of Chile St Petersburg Branch Russia
86 Abastumani Observatory Mt Kanobili 0301 Abastumani Georgia87 Department of Astronomy University of Michigan MI USA
88 Metsahovi Radio Observatory Helsinki University of Technology TKK Finland89 Institute of Astronomy National Central University Taiwan
90 Tuorla Observatory Department of Physics and Astronomy University of Turku Finland91 Instituto de Astrofısica de Andalucıa CSIC Spain
92 Max-Planck-Institut fur Radioastronomie Germany93 Institute of Astronomy Bulgarian Academy of Sciences Bulgaria
94 Circolo Astrofili Talmassons Italy95 Instituto de Astronomıa Universidad Nacional Autonoma de Mexico Apdo Postal 70-265 CP 04510 Mexico DF Mexico
96 INAF Osservatorio Astrofisico di Catania Italy97 Astrophysical Institute Department of Physics and Astronomy Ohio University OH USA
98 Osservatorio Astronomico della Regione Autonoma Valle drsquoAosta Italy99 Armenzano Astronomical Observatory Italy
100 INAF Osservatorio Astronomico di Roma Italy101 INAF Osservatorio Astronomico di Collurania Teramo Italy
102 Agrupacio Astronomica de Sabadell Spain103 ZAH Landessternwarte Heidelberg Konigstuhl D-69117 Heidelberg Germany
104 Instituto de Astronomıa Universidad Nacional Autonoma deMexico Apdo Postal 877 CP 22800 Ensenada B C Mexico105 Institute for Astrophysical Research Boston University MA USA
106 DLR Institute of Planetary Research Rutherfordstr 2 D-12489 Berlin Germany107 INAOE Apdo Postal 51 amp 216 72000 Tonantzintla Puebla Mexico
108 Finnish Centre for Astronomy with ESO (FINCA) University of TurkuVaisalantie 20 FI-21500 Piikkio Finland109 Department of Physics University of Colorado Denver CO USA
110 INAF-Osservatorio Astronomico di Brera via E Bianchi 46 I-23807 Merate Italy111 Department of Astrophysical Sciences Princeton University Princeton NJ 08544 USA
112 Department of Astronomy University of California Berkeley CA 94720-3411 USA113 Max-Planck-Institut fur Radioastronomie Auf dem Hugel 69 D-53121 Bonn Germany
114 Department of Astronomy and Astrophysics University of California 1156 High Street Santa Cruz CA 95064 USA115 Landessternwarte Universitat HeidelbergKonigstuhl 12 D-69117 Heidelberg Germany
116 UCOLick Observatory University of California 1156 High Street Santa Cruz CA 95064 USA117 Institut de Radio Astronomie Millimetrique Avenida Divina Pastora 7 Local 20 E-18012 Granada Spain
Received 2010 June 17 accepted 2010 October 29 published 2010 December 14
ABSTRACT
The BL Lacertae object 3C 66A was detected in a flaring state by the Fermi Large Area Telescope (LAT) andVERITAS in 2008 October In addition to these gamma-ray observations F-GAMMA GASP-WEBT PAIRITELMDM ATOM Swift and Chandra provided radio to X-ray coverage The available light curves show variabilityand in particular correlated flares are observed in the optical and Fermi-LAT gamma-ray band The resultingspectral energy distribution can be well fitted using standard leptonic models with and without an external radiationfield for inverse Compton scattering It is found however that only the model with an external radiation field canaccommodate the intra-night variability observed at optical wavelengths
Key words BL Lacertae objects individual (3C 66A) ndash galaxies active ndash gamma rays galaxies
1 INTRODUCTION
The radio source 3C 66 (Bennett 1962) was shown by Mackay(1971) and Northover (1973) to actually consist of two unrelatedradio sources separated by 011 a compact source (3C 66A)and a resolved galaxy (3C 66B) 3C 66A was subsequentlyidentified as a quasi-stellar object by Wills amp Wills (1974) andas a BL Lacertae object by Smith et al (1976) based on its opticalspectrum 3C 66A is now a well-known blazar which like otheractive galactic nuclei (AGNs) is thought to be powered by
118 Royal Swedish Academy of Sciences Research Fellow funded by a grantfrom the K A Wallenberg Foundation119 Partially supported by the International Doctorate on Astroparticle Physics(IDAPP) program120 Now at DESY Platanenallee 6 D-15738 Zeuthen Germany121 Now at Institut fur Physik und Astronomie Universitat Potsdam D-14476Potsdam-GolmGermany DESY Platanenallee 6 D-15738 Zeuthen Germany122 Now at Los Alamos National Laboratory MS H803 Los Alamos NM87545 USA
accretion of material onto a supermassive black hole located inthe central region of the host galaxy (Urry amp Padovani 1995)Some AGNs present strong relativistic outflows in the formof jets where particles are believed to be accelerated to ultra-relativistic energies and gamma rays are subsequently producedBlazars are the particular subset of AGNs with jets aligned tothe observerrsquos line of sight Indeed the jet of 3C 66A has beenimaged using very long baseline interferometry (VLBI Tayloret al 1996 Jorstad et al 2001 Marscher et al 2002 Britzen et al2007) and superluminal motion has been inferred (Jorstad et al2001 Britzen et al 2008) This is indicative of the relativisticLorentz factor of the jet and its small angle with respect to theline of sight
BL Lacs are known for having very weak (if any) detectableemission lines which makes determination of their redshift quitedifficult The redshift of 3C 66A was reported as z = 0444 byMiller et al (1978) and also (although tentatively) by Kinneyet al (1991) Each measurement however is based on the
3
The Astrophysical Journal 72643 (14pp) 2011 January 1 Abdo et al
measurement of a single line and is not reliable (Bramel et al2005) Recent efforts (described in Section 25) to providefurther constraints have proven unsuccessful
Similar to other blazars the spectral energy distribution(SED) of 3C 66A has two pronounced peaks which suggeststhat at least two different physical emission processes are atwork (eg Joshi amp Bottcher 2007) The first peak extendingfrom radio to soft X-ray frequencies is likely due to synchrotronemission from high-energy electrons while different emissionmodels have been proposed to explain the second peak whichextends up to gamma-ray energies Given the location of itssynchrotron peak (1015 Hz) 3C 66A is further sub-classifiedas an intermediate synchrotron peaked (ISP) blazar (Abdo et al2010c)
The models that have been proposed to explain gamma-rayemission in blazars can be roughly categorized into leptonicor hadronic depending on whether the accelerated particlesresponsible for the gamma-ray emission are primarily electronsand positrons (hereafter ldquoelectronsrdquo) or protons In leptonicmodels high-energy electrons produce gamma rays via inverseCompton (IC) scattering of low-energy photons In synchrotronself-Compton (SSC) models the same population of electronsresponsible for the observed gamma rays generates the low-energy photon field through synchrotron emission In externalCompton (EC) models the low-energy photons originate outsidethe emission volume of the gamma rays Possible sources oftarget photons include accretion-disk photons radiated directlyinto the jet (Dermer amp Schlickeiser 1993) accretion-diskphotons scattered by emission-line clouds or dust into the jet(Sikora et al 1994) synchrotron radiation re-scattered backinto the jet by broad-line emission clouds (Ghisellini amp Madau1996) jet emission from an outer slow jet sheet (Ghiselliniet al 2005) or emission from faster or slower portions of the jet(Georganopoulos amp Kazanas 2004) In hadronic models gammarays are produced by high-energy protons either via protonsynchrotron radiation (Mucke et al 2003) or via secondaryemission from photo-pion and photo-pair-production reactions(see Bottcher (2007) and references therein for a review of blazargamma-ray emission processes)
One of the main obstacles in the broadband study of gamma-ray blazars is the lack of simultaneity or at least contempo-raneousness of the data at the various wavelengths At highenergies the situation is made even more difficult due to thelack of objects that can be detected by MeVGeV and TeV ob-servatories on comparable timescales Indeed until recently theknowledge of blazars at gamma-ray energies had been obtainedfrom observations performed in two disjoint energy regimes (1)the high-energy range (20 MeVlt E lt 10 GeV) studied in the1990s by EGRET (Thompson et al 1993) and (2) the very highenergy (VHE) regime (E gt 100 GeV) observed by ground-basedinstruments such as imaging atmospheric Cherenkov telescopes(IACTs Weekes 2000) Only123 Markarian 421 was detected byboth EGRET and the first IACTs (Kerrick et al 1995) Further-more blazars detected by EGRET at MeVGeV energies arepredominantly flat-spectrum radio quasars (FSRQs) while TeVblazars are to date predominantly BL Lacs It is important tounderstand these observational differences since they are likelyrelated to the physics of the AGN (Cavaliere amp DrsquoElia 2002) orto the evolution of blazars over cosmic time (Bottcher amp Dermer2002)
123 Markarian 501 was marginally detected by EGRET only during a fewmonths in 1996 (Kataoka et al 1999)
The current generation of gamma-ray instruments (AGILEFermi HESS MAGIC and VERITAS) is closing the gapbetween the two energy regimes due to improved instrumentsensitivities leading us toward a deeper and more completecharacterization of blazars as high-energy sources and as apopulation (Abdo et al 2009b) An example of the successfulsynergy of space-borne and ground-based observatories isprovided by the joint observations of 3C 66A by the FermiLAT and the Very Energetic Radiation Imaging Telescope ArraySystem (VERITAS) during its strong flare of 2008 OctoberThe flare was originally reported by VERITAS (Swordy 2008Acciari et al 2009) and soon after contemporaneous variabilitywas also detected at optical to infrared wavelengths (Larionovet al 2008) and in the Fermi-LAT energy band (Tosti 2008)Follow-up observations were obtained at radio optical andX-ray wavelengths in order to measure the flux and spectralvariability of the source across the electromagnetic spectrumand to obtain a quasi-simultaneous SED This paper reports theresults of this campaign including the broadband spectrum anda model interpretation of this constraining SED
2 OBSERVATIONS AND DATA ANALYSIS
21 VERITAS
VERITAS is an array of four 12 m diameter imagingCherenkov telescopes in southern Arizona USA (Acciari et al2008b) 3C 66A was observed with VERITAS for 14 hr from2007 September through 2008 January and for 46 hr between2008 September and 2008 November These observations (here-after 2007 and 2008 data) add up to sim328 hr of live time afterdata quality selection The data were analyzed following theprocedure described in Acciari et al (2008b)
As reported in Acciari et al (2009) the average spectrummeasured by VERITAS is very soft yielding a photon index Γof 41 plusmn04stat plusmn 06sys when fitted to a power law dNdE propEminusΓ The average integral flux above 200 GeV measured byVERITAS is (13 plusmn 01) times 10minus11 cmminus2 sminus1 which correspondsto 6 of the Crab Nebularsquos flux above this threshold In additiona strong flare with night-by-night VHE-flux variability wasdetected in 2008 October For this analysis the VERITASspectrum is calculated for the short time interval 2008 October8ndash10 (MJD 54747ndash54749 hereafter flare period) and for alonger period corresponding to the dark run124 where most of theVHE emission from 3C 66A was detected (MJD 54734ndash54749)It should be noted that the flare and dark run intervals overlapand are therefore not independent Table 1 lists the relevantinformation from each data set
As shown in Figure 1 the flare and dark run spectra are verysoft yielding nearly identical photon indices of 41 plusmn 06stat plusmn06sys entirely consistent with that derived from the full 2007and 2008 data set The integral flux above 200 GeV for theflare period is (25 plusmn 04) times 10minus11 cmminus2 sminus1 while the averageflux for the dark run period is (14 plusmn 02) times 10minus11 cmminus2 sminus1The extragalactic background light (EBL) de-absorbed spectralpoints for the dark run calculated using the optical depth valuesof Franceschini et al (2008) and assuming a nominal redshiftof z = 0444 are also shown in Figure 1 These points are wellfitted by a power-law function with Γ = 19 plusmn 05
124 IACTs like VERITAS do not operate on nights with bright moonlight Theseries of nights between consecutive bright moonlight periods is usuallyreferred to as a dark run
4
The Astrophysical Journal 72643 (14pp) 2011 January 1 Abdo et al
Table 1Results from VERITAS Observations of 3C 66A
Interval Live Time (hr) Non Noff Alpha Excess Significance (σ )
Flare 60 1531 7072 0121 6783 180Dark run 212 3888 20452 0125 13315 2222007 and 2008 281 7257 31201 0175 1791 211
Notes Live time corresponds to the effective exposure time after accountingfor data quality selection Non (Noff ) corresponds to the number of on (off)-source events passing background-rejection cuts Alpha is the normalizationof off-source events and the excess is equal to Non minus αNoff The significanceis expressed in number of standard deviations and is calculated according toEquation (17) of Li amp Ma (1983) See Acciari et al (2009) for a completedescription of the VERITAS analysis
22 Fermi-LAT
The LAT on board the Fermi Gamma-ray Space Telescope isa pair-conversion detector sensitive to gamma rays with energiesbetween 20 MeV and several hundred GeV (Atwood et al 2009)Since launch the instrument has operated almost exclusively insky survey mode covering the whole sky every 3 hr The overallcoverage of the sky is fairly uniform with exposure variations of 15 around the mean value The LAT data are analyzed usingScienceTools v9r15p5 and instrument response functions P6V3(available via the Fermi science support center125) Only photonsin the diffuse event class are selected for this analysis because oftheir reduced charged-particle background contamination andvery good angular reconstruction A zenith angle lt105 cut ininstrument coordinates is used to avoid gamma rays from theEarth limb The diffuse emission from the Galaxy is modeledusing a spatial model (gll iem v02fit) which was refinedwith Fermi-LAT data taken during the first year of operationThe extragalactic diffuse and residual instrumental backgroundsare modeled as an isotropic component and are included inthe fit126 The data are analyzed with an unbinned maximumlikelihood technique (Mattox et al 1996) using the likelihoodanalysis software developed by the LAT team
Although 3C 66A was detected by EGRET as source 3EGJ0222+4253 (Hartman et al 1999) detailed spatial and timinganalyses by Kuiper et al (2000) showed that this EGRETsource actually consists of the superposition of 3C 66A andthe nearby millisecond pulsar PSR J0218+4232 which is 096distant from the blazar This interpretation of the EGRET datais verified by Fermi-LAT whose improved angular resolutionpermits the clear separation of the two sources as shown inFigure 2 Furthermore the known pulsar period is detectedwith high confidence in the Fermi-LAT data (Abdo et al2009a) More importantly for this analysis the clear separationbetween the pulsar and the blazar enables studies of eachsource independently in the maximum likelihood analysis andthus permits an accurate determination of the spectrum andlocalization of each source with negligible contamination
Figure 2 also shows the localization of the Fermi andVERITAS sources with respect to blazar 3C 66A and radiogalaxy 3C 66B (see caption in Figure 2 for details) It is clearfrom the map that the Fermi-LAT and VERITAS localizationsare consistent and that the gamma-ray emission is confidentlyassociated with the blazar and not with the radio galaxy Somesmall contribution in the Fermi-LAT data from radio galaxy3C 66B as suggested by Aliu et al (2009) and Tavecchio amp
125 httpfermigsfcnasagovsscdataanalysisscitoolsoverviewhtml126 httpfermigsfcnasagovsscdataaccesslatBackgroundModelshtml
Energy (MeV)
210 310 410 510 610
)minus
1 s
minus2
(M
eV
cm
νFν
minus710
minus610
minus510
minus410
minus310
)minus
1 s
minus2
(e
rgs
cm
νFν
minus1210
minus1110
minus1010
minus910
intervalflareminusLATFermi intervaldark runminusLATFermi
minusLAT 6minusmonths average spectrumFermi
intervalflareVERITAS
intervaldarkrunVERITAS
VERITAS average spectrum 2007minus2008
(z=0444) dark runDeminusabsorbed VERITAS
(z=03) dark runDeminusabsorbed VERITAS
Figure 1 Gamma-ray SED of 3C 66A including Fermi-LAT and VERITASdata for the flare (red symbols) and dark run (blue symbols) intervals TheFermi-LAT spectra are also shown here as ldquobutterflyrdquo contours (solid lines)describing the statistical error on the spectrum (Abdo et al 2009b) Thepreviously reported Fermi-LAT six-month-average spectrum (Abdo et al 2010b)is also shown here (green circles) and is lower than the spectrum obtained duringthe campaign The average 2007ndash2008 VERITAS spectrum originally reportedin Acciari et al (2009) is displayed with green triangles In all cases theupper limits are calculated at 95 confidence level The de-absorbed dark runspectra obtained using the optical depth values of Franceschini et al (2008)are also shown as open circles and open squares for redshifts of 0444 and 03respectively
Ghisellini (2009) cannot be excluded given the large spillover oflow-energy photons from 3C 66A at the location of 3C 66B Thisis due to the long tails of the Fermi-LAT point-spread function atlow energies as described in Atwood et al (2009) Neverthelessconsidering only photons with energy E gt 1 GeV the upperlimit (95 confidence level) for a source at the location of 3C66B is 29 times 10minus8 cmminus2 sminus1 for the dark run period (with a teststatistic127 (TS) = 13) For the 11 months of data correspondingto the first Fermi-LAT catalog (Abdo et al 2010a) the upperlimit is 49 times 10minus9 cmminus2 sminus1 (TS = 58)
As in the analysis of the VERITAS observations the Fermi-LAT spectrum is calculated for the flare and for the darkrun periods The Fermi flare period flux F (E gt100 MeV) =(50 plusmn 14stat plusmn 03sys) times 10minus7 cmminus2 sminus1 is consistent withinerrors with the dark run flux of (39 plusmn 05stat plusmn 03sys) times10minus7 cmminus2 sminus1 In both cases the Fermi-LAT spectrum is quitehard and can be described by a power law with a photon indexΓ of 18 plusmn 01stat plusmn 01sys and 19 plusmn 01stat plusmn 01sys in the flareperiod and dark run intervals respectively Both spectra areshown in the high-energy SED in Figure 1
23 Chandra
3C 66A was observed by the Chandra observatory on 2008October 6 for a total of 376 ks with the Advanced CCD ImagingSpectrometer (ACIS) covering the energy band between 03and 10 keV The source was observed in the continuousclocking mode to avoid pile-up effects Standard analysis tools(CIAO 41) and calibration files (CALDB v350) provided bythe Chandra X-ray center128 are used
The time-averaged spectrum is obtained and re-binned to en-sure that each spectral channel contains at least 25 background-subtracted counts This condition allows the use of the χ2
127 The test statistic (TS) value quantifies the probability of having a pointsource at the location specified It is roughly the square of the significancevalue a TS of 25 corresponds to a signal of approximately 5 standarddeviations (Abdo et al 2010a)128 httpcxcharvardeduciao
5
The Astrophysical Journal 72643 (14pp) 2011 January 1 Abdo et al
Figure 2 Smoothed count map of the 3C 66A region as seen by Fermi-LAT between 2008 September 1 and December 31 with E gt 100 MeV The color bar hasunits of counts per pixel and the pixel dimensions are 01 times 01 The contour levels have been smoothed and correspond to 28 52 and 76 counts per pixel Thelocations of 3C 66A and 3C 66B (a radio galaxy that is 011 away) are shown as a cross and as a diamond respectively The location of millisecond pulsar PSR0218+4232 is also indicated with a white cross The magenta circle represents the VERITAS localization of the VHE source (RA DEC) = (2h22m41s6 plusmn 1s7stat plusmn6s0sys 4302prime35primeprime5 plusmn 21primeprime
stat plusmn 1prime30primeprimesys) as reported in Acciari et al (2009) The blue interior circle represents the 95 error radius of the Fermi-LAT localization
(RA DEC) = (02h22m40s3 plusmn 4s5 4302prime18primeprime6 plusmn 42primeprime1) as reported in the Fermi-LAT first source catalog (Abdo et al 2010a) All positions are based on the J2000epoch
quality-of-fit estimator to find the best-fit model XSPEC v124(Arnaud 1996) is used for the spectral analysis and fitting proce-dure Two spectral models have been used to fit the data singlepower law and broken power law Each model includes galacticH i column density (NHGal = 899 times 1020 cmminus2) according toDickey amp Lockman (1990) where the photoelectric absorptionis set with the XSPEC model phabs129 An additional local H i
column density was also tried but in both cases the spectra wereconsistent with pure galactic density Consequently the columndensity has been fixed to the galactic value in each model andthe results obtained are presented in Table 2 An F-test wasperformed to demonstrate that the spectral fit improves signif-icantly when using the extra degrees of freedom of the brokenpower-law model Table 2 also contains the results of the F-test
24 Swift XRT and UVOT
Following the VERITAS detection of VHE emission from3C 66A Target of Opportunity (ToO) observations of 3C 66Awith Swift were obtained for a total duration of sim10 ks TheSwift satellite observatory comprises an UVndashOptical telescope(UVOT) an X-ray telescope (XRT) and a Burst Alert Telescope(Gehrels et al 2004) Data reduction and calibration of the XRT
129 httpheasarcgsfcnasagovdocssoftwarelheasoftxanaduxspecmanualXSmodelPhabshtml
data are performed with HEASoft v65 standard tools AllXRT data presented here are taken in photon counting modewith negligible pile-up effects The X-ray spectrum of eachobservation is fitted with an absorbed power law using a fixedGalactic column density from Dickey amp Lockman (1990)which gives good χ2 values for all observations The measuredphoton spectral index ranges between 25 and 29 with a typicalstatistical uncertainty of 01
UVOT obtained data through each of six color filters VB and U together with filters defining three ultraviolet pass-bands UVW1 UVM2 and UVW2 with central wavelengths of260 nm 220 nm and 193 nm respectively The data are cal-ibrated using standard techniques (Poole et al 2008) and cor-rected for Galactic extinction by interpolating the absorptionvalues from Schlegel et al (1998) (EBminusV = 0083 mag) withthe galactic spectral extinction model of Fitzpatrick (1999)
25 Optical to Infrared Observations
The R magnitude of the host galaxy of 3C 66A is sim 19in the optical band (Wurtz et al 1996) Its contribution isnegligible compared to the typical AGN magnitude of R 15 therefore host-galaxy correction is not necessary
GASP-WEBT 3C 66A is continuously monitored by tele-scopes affiliated to the GLAST-AGILE support program of theWhole Earth Blazar Telescope (GASP-WEBT see Villata et al
6
The Astrophysical Journal 72643 (14pp) 2011 January 1 Abdo et al
Figure 3 3C 66A light curves covering 2008 August 22 to December 31 inorder of increasing wavelength The VERITAS observations are combined toobtain nightly flux values and the dashed and dotted lines represent the averageflux measured from the 2007 and 2008 data and its standard deviation TheFermi-LAT light curves contain time bins with a width of 3 days The averageflux and average photon index measured by Fermi-LAT during the first sixmonths of science operations are shown as horizontal lines in the respectivepanels In all cases the Fermi-LAT photon index is calculated over the 100MeV to 200 GeV energy range The long-term light curves at optical andinfrared wavelengths are presented in the two bottom panels In the bottompanel GASP-WEBT and PAIRITEL observations are represented by open andsolid symbols respectively
2008 2009) These observations provide a long-term light curveof this object with complete sampling as shown in Figure 3During the time interval in consideration (MJD 54700ndash54840)several observatories (Abastumani Armenzano Crimean ElVendrell LrsquoAmpolla Lulin New Mexico Skies Roque de losMuchachos (KVA) Rozhen Sabadell San Pedro Martir St Pe-tersburg Talmassons Teide (BRT) Torino Tuorla and Valledrsquo Aosta) contributed photometric observations in the R bandData in the J H and K bands were taken at the Campo Imper-atore observatory A list of the observatories and their locationsis available in Table 3
MDM Following the discovery of VHE emission 3C 66Awas observed with the 13 m telescope of the MDM Observatoryduring the nights of 2008 October 6ndash10 A total of 290 scienceframes in U B V and R bands (58 each) were taken throughoutthe entire visibility period (approx 430 ndash 1000 UT) duringeach night The light curves which cover the time around theflare are presented in Figure 4
ATOM Optical observations for this campaign in the R bandwere also obtained with the 08 m optical telescope ATOM
Figure 4 3C 66A light curves covering the period centered on the gamma-ray flare (2008 October 1ndash10) The VERITAS and Fermi-LAT panels werealready described in the caption of Figure 3 Swift Target-of-Opportunity(ToO) observations (panels 3ndash5 from the top) were obtained following thediscovery of VHE emission by VERITAS (Swordy 2008) Swift-UVOT andMDM observations are represented by open and solid symbols respectivelyThe optical light curve in panel 6 from the top displays intra-night variabilityAn example is identified in the plot when a rapid decline of the optical flux byΔFΔt sim minus02 mJy hrminus1 is observed on MJD 54747
in Namibia which monitors this source periodically Twentyphotometric observations are available starting on MJD 54740and are shown in Figures 3 and 4
PAIRITEL Near-infrared observations in the J H and Kswere obtained following the VHE flare with the 13 m PetersAutomated Infrared Imaging Telescope (PAIRITEL see Bloomet al 2006) located at the Fred Lawrence Whipple ObservatoryThe resulting light curves using differential photometry withfour nearby calibration stars are shown in Figure 4
Keck The optical spectrum of 3C 66A was measured withthe LRIS spectrometer (Oke et al 1995) on the Keck I telescopeon the night of 2009 September 17 under good conditions Theinstrument configuration resulted in a full width half-maximumof sim250 km sminus1 over the wavelength range 3200ndash5500 Aring (blueside) and sim200 km sminus1 over the range 6350ndash9000 Aring (red side)A series of exposures totaling 110 s (blue) and 50 s (red) wereobtained yielding a signal-to-noise (SN) per resolution elementof sim250 and 230 for the blue and red cameras respectively Thedata were reduced with the LowRedux130 pipeline and calibratedusing a spectrophotometric star observed on the same night
130 httpwwwucolickorgsimxavierLowReduxindexhtml
7
The Astrophysical Journal 72643 (14pp) 2011 January 1 Abdo et al
Table 2Best-fit Model Parameters for a Fit Performed to the Chandra Data in the 1ndash7 keV Energy Range
Single Power-law Model
Γ Flux (10minus12 erg cmminus2 sminus1) χ2dof
299 plusmn 003 347 plusmn 006 121 (2326193)
Broken Power-law Model
Γ1 Γ2 Flux (10minus12 erg cmminus2 sminus1) Break (keV) χ2dof F-test Probability
308+03minus05 224+023
037 358+007minus008 33+05
minus03 097 (1852191) 347 times 10minus10
Notes The galactic NHGal value is fixed to 899 times 1020 cmminus2 the value of the galactic H i column density according toDickey amp Lockman (1990) Errors indicate the 90 confidence level
Table 3List of Ground-based Observatories that Participated in This Campaign
Observatory Location Web Page
Radio Observatories
Crimean Radio Obs Ukraine wwwcraocrimeauaEffelsberg Germany wwwmpifrdeenglishradiotelescopeIRAM Spain wwwiram-instituteorgEN30-meter-telescopephpMedicina Italy wwwmedirainafitMetsahovi Finland wwwmetsahovifienNoto Italy wwwnotoirainafitUMRAO Michigan USA wwwastrolsaumicheduobsradiotel
Infrared Observatories
Campo Imperatore Italy wwwoa-teramoinafitPAIRITEL Arizona USA wwwpairitelorgOptical ObservatoriesAbastumani Georgia wwwgenaoorgArmenzano Italy wwwwebaliceitdcarosatiATOM Namibia wwwlswuni-heidelbergdeprojectshessATOMCrimean Astr Obs Ukraine wwwcraocrimeauaEl Vendrell SpainKitt Peak (MDM) Arizona USA wwwastrolsaumicheduobsmdmLrsquoAmpolla SpainLulin Taiwan wwwlulinncuedutwenglishNew Mexico Skies Obs New Mexico USA wwwnmskiescomRoque (KVA) Canary Islands Spain wwwotriiacesenonthtmRozhen Bulgaria wwwastrobasbgrozhenhtmlSabadell Spain wwwastrosabadellorghtmlesobservatoriosabhtmSan Pedro Martir Mexico wwwastrosspunammxindexspmhtmlSt Petersburg Russia wwwgaospbruTalmassons Italy wwwcastfvgitTeide (BRT) Canary Islands Spain wwwtelescopeorgTorino Italy wwwtoastroitTuorla Finland wwwastroutufiValle drsquo Aosta Italy wwwoavdaitenglishosservatorio
Gamma-ray Observatory
VERITAS Arizona USA wwwveritassaoarizonaedu
Inspection of the 3C 66A spectrum reveals no spectral featuresaside from those imposed by Earthrsquos atmosphere and the MilkyWay (Ca H+K) Therefore these new data do not offer anyinsight on the redshift of 3C 66A and in particular are unableto confirm the previously reported value of z = 0444 (Milleret al 1978)
26 Radio Observations
Radio observations are available thanks to the F-GAMMA(Fermi-Gamma-ray Space Telescope AGN Multi-frequencyMonitoring Alliance) program which is dedicated to monthly
monitoring of selected Fermi-LAT blazars (Fuhrmann et al2007 Angelakis et al 2008) Radio flux density measurementswere conducted with the 100 m Effelsberg radio telescope at485 835 1045 and 1460 GHz on 2008 October 16 Thesedata are supplemented with an additional measurement at 86GHz conducted with the IRAM 30 m telescope (Pico VeletaSpain) on 2008 October 8 The data were reduced using stan-dard procedures described in Fuhrmann et al (2008) Additionalradio observations taken between 2008 October 5 and 15 (con-temporaneous to the flare period) are provided by the MedicinaMetsahovi Noto and UMRAO observatories all of which aremembers of the GASP-WEBT consortium
8
The Astrophysical Journal 72643 (14pp) 2011 January 1 Abdo et al
3 DISCUSSION
31 Light Curves
The resulting multi-wavelength light curves from this cam-paign are shown in Figure 3 for those bands with long-term cov-erage and in Figure 4 for those observations that were obtainedshortly before and after the gamma-ray flare The VERITASobservations are combined to obtain nightly (E gt 200 GeV)flux values since no evidence for intra-night variability is ob-served The highest flux occurred on MJD 54749 and significantvariability is observed during the whole interval (χ2 probabilityless than 10minus4 for a fit of a constant flux)
The temporal dependence of the Fermi-LAT photon index andintegral flux above 100 MeV and 1 GeV are shown with timebins with width of 3 days in Figure 3 For those time intervalswith no significant detection a 95 confidence flux upper limitis calculated The flux and photon index from the Fermi-LATfirst source catalog (Abdo et al 2010a) are shown as horizontallines for comparison These values correspond to the averageflux and photon index measured during the first 11 months ofFermi operations and thus span the time interval considered inthe figures It is evident from the plot that the VHE flare detectedby VERITAS starting on MJD 54740 is coincident with a periodof high flux in the Fermi energy band The photon index duringthis time interval is consistent within errors with the averagephoton index Γ = 195 plusmn 003 measured during the first sixmonths of the Fermi mission (Abdo et al 2010b)
Long-term and well-sampled light curves are available atoptical and near-infrared wavelengths thanks to observations byGASP-WEBT ATOM MDM and PAIRITEL Unfortunatelyradio observations were too limited to obtain a light curve andno statement about variability in this band can be made Thebest sampling is available for the R band for which variationswith a factor of 2 are observed in the long-term light curveFurthermore variability on timescales of less than a day isobserved as indicated in Figure 4 and as previously reportedby Bottcher et al (2009) following the WEBT (Whole EarthBlazar Telescope) campaign on 3C 66A in 2007 and 2008
The increase in gamma-ray flux observed in the Fermi bandseems contemporaneous with a period of increased flux in theoptical and to test this hypothesis the discrete correlationfunction (DCF) is used (Edelson amp Krolik 1988) Figure 5shows the DCF of the F(E gt 1 GeV) gamma-ray band withrespect to the R band with time-lag bins of 3 5 and 7 days Theprofile of the DCF is consistent for all time-lag bins indicatingthat the result is independent of bin size The DCF with time-lagbins of 3 days was fitted with a Gaussian function of the formDCF(τ ) = Cmax times exp (τ minus τ0)2σ 2 where Cmax is the peakvalue of the DCF τ0 is the delay timescale at which the DCFpeaks and σ parameterizes the Gaussian width of the DCF Thebest-fit function is plotted in Figure 5 and the best-fit parametersare Cmax = 11 plusmn 03 τ0 = (07 plusmn 07) days and σ = (33 plusmn07) days An identical analysis was also performed betweenthe F(E gt 100 MeV) and the R optical band with consistentresults This indicates a clear correlation between the Fermi-LAT and optical energy bands with a time lag that is consistentwith zero and not greater than sim5 days Despite the sparsity ofthe VERITAS light curve (due in part to the time periods whenthe source was not observable due to the full Moon) the DCFanalysis was also performed to search for correlations with eitherthe Fermi-LAT or optical data Apart from the overall increasein flux no significant correlations can be established The onsetof the E gt 200 GeV flare seems delayed by about sim5 days
Time lag [days]minus30 minus20 minus10 0 10 20 30
DC
F
minus1
minus05
0
05
1
15 Bin Size3 days
5 days
7 days
Figure 5 Discrete correlation function (DCF) of the F(E gt 1 GeV) gamma-raylight curve with respect to the R-band light curve A positive time lag indicatesthat the gamma-ray band leads the optical band Different symbols correspondto different bin sizes of time lag as indicated in the legend The profile of theDCF is independent of bin size and is well described by a Gaussian functionof the form DCF(τ ) = Cmax times exp (τ minus τ0)2σ 2 The fit to the 3-day bin sizedistribution is shown in the plot as a solid black line and the best-fit parametersare Cmax = 11 plusmn 03 τ0 = (07 plusmn 07) days and σ = (33 plusmn 07) days
with respect to the opticalndashGeV flare but given the coveragegaps no firm conclusion can be drawn (eg the flare could havebeen already underway when the observations took place) Nosuch lag is expected from the homogeneous model described inthe next section but could arise in models with complex energystratification and geometry in the emitting region
32 SED and Modeling
The broadband SED derived from these observations ispresented in Figure 6 and modeled using the code of Bottcher ampChiang (2002) In this model a power-law distribution of ultra-relativistic electrons andor pairs with lower and upper energycutoffs at γmin and γmax respectively and power-law index qis injected into a spherical region of comoving radius RB Theinjection rate is normalized to an injection luminosity Le whichis a free input parameter of the model The model assumesa temporary equilibrium between particle injection radiativecooling due to synchrotron and Compton losses and particleescape on a time tesc equiv ηesc RBc where ηesc is a scale parameterin the range sim250ndash500 Both the internal synchrotron photonfield (SSC) and external photon sources (EC) are considered astargets for Compton scattering The emission region is movingwith a bulk Lorentz factor Γ along the jet To reduce the numberof free parameters we assume that the jet is oriented with respectto the line of sight at the superluminal angle so that the Dopplerfactor is equal to D = (Γ [1 minus β cos θobs])
minus1 = Γ where θobs isthe angle of the jet with respect to the line of sight Given theuncertainty in the redshift determination of 3C 66A a range ofplausible redshifts namely z = 01 02 03 and the generallyused catalog value z = 0444 are considered for the modelingAll model fits include EBL absorption using the optical depthvalues from Franceschini et al (2008)
Most VHE blazars known to date are high synchrotron peaked(HSP) blazars whose SEDs can often be fitted satisfactorilywith pure SSC models Since the transition from HSP to ISP iscontinuous a pure SSC model was fitted first to the radio throughVHE gamma-ray SED Independently of the model underconsideration the low-frequency part of the SED (lt1020 Hz) iswell fitted with a synchrotron component as shown in Figure 6
9
The Astrophysical Journal 72643 (14pp) 2011 January 1 Abdo et al
Figure 6 Broadband SED of 3C 66A during the 2008 October multi-wavelength campaign The observation that corresponds to each set of data points is indicated inthe legend As an example the EBL-absorbed EC+SSC model for z = 03 is plotted here for reference A description of the model is provided in the text
For clarity only the high-frequency range is shown in Figures 7and 8 where the different models are compared As can beseen from the figures a reasonable agreement with the overallSED can be achieved for any redshift in the range exploredThe weighted sum of squared residuals has been calculatedfor the Fermi-LAT and VERITAS flare data (8 data points intotal) in order to quantify the scatter of the points with respectto the model and is shown in Table 4 The best agreement isachieved when the source is located at z sim 02ndash03 For lowerredshifts the model spectrum is systematically too hard whileat z = 0444 the model spectrum is invariably too soft as a resultof EBL absorption It should be noted that the EBL model ofFranceschini et al (2008) predicts some of the lowest opticaldepth values in comparison to other models (Finke et al 2010Gilmore et al 2009 Stecker et al 2006) Thus a model spectrumwith redshift of 03 or above would be even harder to reconcilewith the observations when using other EBL models
A major problem of the SSC models with z 01 is thatRB is of the order of 5 times 1016 cm This does not allowfor variability timescales shorter than 1 day which seemsto be in contrast with the optical variability observed on shortertimescales A smaller RB would require an increase in theelectron energy density (with no change in the magnetic fieldin order to preserve the flux level of the synchrotron peak) andwould lead to internal gammandashgamma absorption This problemcould be mitigated by choosing extremely high Doppler factorsD 100 However these are significantly larger than thevalues inferred from VLBI observations of Fermi-LAT blazars(Savolainen et al 2010)131 Moreover all SSC models requirevery low magnetic fields far below the value expected fromequipartition (εB = LBLe sim 10minus3 1) where LB is thePoynting flux derived from the magnetic energy density and Le
131 As a caveat jet models with a decelerating flow (Georganopoulos ampKazanas 2003 Piner et al 2008) or with inhomogeneous transverse structure(Ghisellini et al 2005 Henri amp Sauge 2006) can accommodate very highDoppler factors in the gamma-ray emitting region and still be consistent withthe VLBI observations of the large scale jet
is the energy flux of the electrons propagating along the jetTable 4 lists the parameters used for the SSC models displayedin Figure 7
Subsequently an external infrared radiation field with adhoc properties was included as a source of photons to beCompton scattered For all SSC+EC models shown in Figure 8the peak frequency of the external radiation field is set toνext = 14 times 1014 Hz corresponding to near-IR This adoptedvalue is high enough to produce E 100 GeV photons from ICscattering off the synchrotron electrons and at the same time isbelow the energy regime in which KleinndashNishina effects takeplace Although the weighted sums of squared residuals forEC+SSC models are generally worse than for pure SSC modelsreasonable agreement with the overall SED can still be achievedfor redshifts z 03 Furthermore all SSC+EC models areconsistent with a variability timescale of Δtvar sim 4 hr Thisis in better agreement with the observed variability at opticalwavelengths than the pure SSC interpretation Also while theSSC+EC interpretation still requires sub-equipartition magneticfields the magnetic fields are significantly closer to equipartitionthan in the pure SSC case with LBLe sim 01 The parametersof the SSC+EC models are listed in Table 5
Models with and without EC component yield the bestagreement with the SED if the source is located at a redshiftz sim 02ndash03 Of course this depends on the EBL model used inthe analysis An EBL model that predicts higher attenuation thanFranceschini et al (2008) would lead to a lower redshift rangeand make it even more difficult to have agreement betweenthe SED models and the data when the source is located atredshifts z 04 Finally it is worth mentioning that the redshiftrange z sim 02ndash03 is in agreement with previous estimates byFinke et al (2008) who estimate the redshift of 3C 66A to bez = 0321 based on the magnitude of the host galaxy and byPrandini et al (2010) who use an empirical relation betweenthe previously reported Fermi-LAT and IACTs spectral slopesof blazars and their redshifts to estimate the redshift of 3C 66Ato be below z = 034 plusmn 005
10
The Astrophysical Journal 72643 (14pp) 2011 January 1 Abdo et al
Figure 7 SSC models for redshifts z = 0444 03 02 and 01 from top to bottom The Fermi-LAT and VERITAS data points follow the same convention usedin Figures 1 and 6 to distinguish between flare (red) and dark run (blue) data points In each panel the EBL-absorbed model is shown as a solid red line and thede-absorbed model as a red dashed line De-absorbed VERITAS flare points are shown as open squares In all cases the optical depth values from Franceschini et al(2008) are used The best agreement between the model and the data is achieved when the source is located at z = 02ndash03 For lower redshifts the model spectrum issystematically too hard while at z = 0444 the model spectrum is too soft
A detailed study of hadronic versus leptonic modeling of the2008 October data will be published elsewhere but it is worthmentioning that the synchrotron proton blazar (SPB) model hasbeen used to adequately reproduce the quasi-simultaneous SEDobserved during the 2003ndash2004 multi-wavelength campaign(Reimer et al 2008) On that occasion rapid intra-day variationsdown to a 2 hr timescale were observed while during the2008 campaign presented here these variations seem less rapidQualitatively the longer timescale variations may be due toa lower Doppler beaming at the same time that a stronglyreprocessed proton synchrotron component dominates the highenergy output of this source
4 SUMMARY
Multi-wavelength observations of 3C 66A were carried outprompted by the gamma-ray outburst detected by the VERITASand Fermi observatories in 2008 October This marks the first
occasion that a gamma-ray flare is detected by GeV and TeVinstruments in comparable timescales The light curves obtainedshow strong variability at every observed wavelength and inparticular the flux increase observed by VERITAS and Fermiis coincident with an optical outburst The clear correlationbetween the Fermi-LAT and R optical light curves permits oneto go beyond the source association reported in the first Fermi-LAT source catalog (Abdo et al 2010a) and finally identify thegamma-ray source 1FGL J02226+4302 as blazar 3C 66A
For the modeling of the overall SED a reasonable agreementcan be achieved using both a pure SSC model and an SSC+ECmodel with an external near-infrared radiation field as anadditional source for Compton scattering However the pureSSC model requires (1) a large emission region which isinconsistent with the observed intra-night scale variability atoptical wavelengths and (2) low magnetic fields about afactor sim10minus3 below equipartition In contrast an SSC+ECinterpretation allows for variability on timescales of a few hours
11
The Astrophysical Journal 72643 (14pp) 2011 January 1 Abdo et al
Figure 8 EC+SSC model for redshifts z =0444 03 02 and 01 from top to bottom The individual EBL-absorbed EC and SSC components are indicated asdash-dotted and dotted lines respectively The sum is shown as a solid red line (dashed when de-absorbed) The best agreement between the model and the data isachieved when the source is located at z sim 02
Table 4Parameters Used for the SSC Models Displayed in Figure 7
Model Parameter z = 01 z = 02 z = 03 z = 0444
Low-energy cutoff γmin 18 times 104 20 times 104 22 times 104 25 times 104
High-energy cutoff γmax 30 times 105 40 times 105 40 times 105 50 times 105
Injection index q 29 29 30 30Injection luminosity Le (1045 erg sminus1) 13 33 57 128Comoving magnetic field B (G) 003 002 002 001Poynting flux LB (1042 erg sminus1) 11 49 85 137εB equiv LBLe 09 times 10minus3 15 times 10minus3 15 times 10minus3 11 times 10minus3
Doppler factor (D) 30 30 40 50Plasmoid radius RB (1016 cm) 22 60 70 11Variability timescale δtmin
var (hr) 74 221 211 294
Weighted sum of squared residuals to VERITAS flare data 71 09 07 62Weighted sum of squared residuals to Fermi-LAT flare data 16 16 13 14Total weighted sum of squared residuals 87 25 19 76
Notes All SSC models require very low magnetic fields far below the value expected from equipartition (ie εB 1) Theweighted sum of squared residuals to the VERITAS and Fermi-LAT data and the total value for the combined data set areincluded at the bottom of the table The best agreement between the model and the data is obtained when the source is at redshiftz = 02ndash03
12
The Astrophysical Journal 72643 (14pp) 2011 January 1 Abdo et al
Table 5Parameters Used for the EC+SSC Model Fits Displayed in Figure 8
Model Parameter z = 01 z = 02 z = 03 z = 0444
Low-energy cutoff γmin 55 times 103 70 times 103 65 times 103 60 times 103
High-energy cutoff γmax 12 times 105 1512 times 105 1512 times 105 1512 times 105
Injection index q 30 30 30 30Injection luminosity Le (1044 erg sminus1) 11 42 60 104Comoving magnetic field B (G) 035 022 021 023Poynting flux LB (1043 erg sminus1) 10 24 60 112εB equiv LBLe 010 006 010 011Doppler factor D 30 30 40 50Plasmoid radius RB (1016 cm) 05 12 15 15Variability timescale δtmin
var (hr) 17 44 45 40Ext radiation energy density (10minus6 erg cmminus3) 54 24 12 13
Weighted sum of squared residuals to VERITAS flare data 48 36 79 157Weighted sum of squared residuals to Fermi-LAT flare data 10 12 08 15Total weighted sum of squared residuals 58 48 87 172
Notes These model fits require magnetic fields closer to equipartition and allow for the intra-night variability observedin the optical data The weighted sum of squared residuals to the VERITAS and Fermi-LAT data and the total value forthe combined data set are included at the bottom of the table
and for magnetic fields within about an order of magnitudeof though still below equipartition It is worth noting that theresults presented here agree with the findings following the(E gt 200 GeV) flare of blazar W Comae (also an ISP) in 2008March (Acciari et al 2008a) In both cases the high opticalluminosity is expected to play a key role in providing the seedpopulation for IC scattering
Intermediate synchrotron peaked blazars like 3C 66A are wellsuited for simultaneous observations by Fermi-LAT and ground-based IACTs like VERITAS Relative to the sensitivities ofthese instruments ISPs are bright enough to allow for time-resolved spectral measurements in each band during flaringepisodes These types of observations coupled with extensivemulti-wavelength coverage at lower energies will continue toprovide key tests of blazar emission models
The Fermi-LAT Collaboration acknowledges generous ongo-ing support from a number of agencies and institutes that havesupported both the development and the operation of the LATas well as scientific data analysis These include the NationalAeronautics and Space Administration and the Department ofEnergy in the United States the Commissariat a lrsquoEnergie Atom-ique and the Centre National de la Recherche ScientifiqueInstitut National de Physique Nucleaire et de Physique desParticules in France the Agenzia Spaziale Italiana and theIstituto Nazionale di Fisica Nucleare in Italy the Ministry ofEducation Culture Sports Science and Technology (MEXT)High Energy Accelerator Research Organization (KEK) andJapan Aerospace Exploration Agency (JAXA) in Japan and theK A Wallenberg Foundation the Swedish Research Coun-cil and the Swedish National Space Board in Sweden Ad-ditional support for science analysis during the operationsphase is gratefully acknowledged from the Istituto Nazionale diAstrofisica in Italy and the Centre National drsquoEtudes Spatiales inFrance
The VERITAS collaboration acknowledges the generous sup-port from the US Department of Energy the US National Sci-ence Foundation and the Smithsonian Institution by NSERCin Canada by Science Foundation Ireland and by STFC inUK The VERITAS collaboration also acknowledges the excel-
lent work of the technical support staff at the FLWO and thecollaborating institutions in the construction and operation ofthe instrument as well as support from the NASASwift guestinvestigator program (grant NNX08AU13G) for the Swift ob-servations
PAIRITEL is operated by the Smithsonian AstrophysicalObservatory (SAO) and was made possible by a grant fromthe Harvard University Milton Fund a camera loan from theUniversity of Virginia and continued support of the SAO andUC Berkeley The PAIRITEL project is further supported byNASASwift Guest Investigator grant NNG06GH50G Thisresearch is partly based on observations with the 100 m telescopeof the MPIfR (Max-Planck-Institut fur Radioastronomie) atEffelsberg and has also made use of observations with the IRAM30 m telescope The Metsahovi team acknowledges the supportfrom the Academy of Finland The Abastumani Observatoryteam acknowledges financial support by the Georgian NationalScience Foundation through grant GNSFST084-404 The StPetersburg University team acknowledges support from RussianRFBR foundation via grant 09-02-00092 AZT-24 observationsare made within an agreement between Pulkovo Rome andTeramo observatories
L C Reyes acknowledges the support by the Kavli Institutefor Cosmological Physics at the University of Chicago throughgrants NSF PHY-0114422 and NSF PHY-0551142 and anendowment from the Kavli Foundation and its founder FredKavli M Bottcher acknowledges support from NASA throughChandra Guest Investigator Grant GO8-9100X Some of theVERITAS simulations used in this work have been performedon the joint Fermilab-KICP supercomputing cluster supportedby grants from Fermilab the Kavli Institute for CosmologicalPhysics and the University of Chicago
REFERENCES
Abdo A A et al 2009a Science 325 848Abdo A A et al 2009b ApJ 707 1310Abdo A A et al 2010a ApJS 188 405Abdo A A et al 2010b ApJ 710 1271Abdo A A et al 2010c ApJ 716 30Acciari V A et al 2008a ApJ 684 L73
13
The Astrophysical Journal 72643 (14pp) 2011 January 1 Abdo et al
Acciari V A et al 2008b ApJ 679 1427Acciari V A et al 2009 ApJ 693 L104Aliu E et al 2009 ApJ 692 L29Angelakis E Fuhrmann L Marchili N Krichbaum T P amp Zensus J A
2008 Mem Soc Astron Ital 79 1042Arnaud K A 1996 in ASP Conf Ser 101 Astronomical Data Analysis
Software and Systems V ed G H Jacoby amp J Barnes (San FranciscoCA ASP) 17
Atwood W B et al 2009 ApJ 697 1071Bennett A S 1962 Mem R Astron Soc 68 163Bloom J S Starr D L Blake C H Skrutskie M F amp Falco E E 2006
in ASP Conf Ser 351 Astronomical Data Analysis Software and SystemsXV ed C Gabriel C Arviset D Ponz amp S Enrique (San Francisco CAASP) 751
Bottcher M 2007 ApampSS 309 95Bottcher M amp Chiang J 2002 ApJ 581 127Bottcher M amp Dermer C D 2002 ApJ 564 86Bottcher M et al 2009 ApJ 694 174Bramel D A et al 2005 ApJ 629 108Britzen S et al 2007 AampA 472 763Britzen S et al 2008 AampA 484 119Cavaliere A amp DrsquoElia V 2002 ApJ 571 226Dermer C D amp Schlickeiser R 1993 ApJ 416 458Dickey J M amp Lockman F J 1990 ARAampA 28 215Edelson R A amp Krolik J H 1988 ApJ 333 646Finke J D Razzaque S amp Dermer C D 2010 ApJ 712 238Finke J D Shields J C Bottcher M amp Basu S 2008 AampA 477
513Fitzpatrick E L 1999 PASP 111 63Franceschini A Rodighiero G amp Vaccari M 2008 AampA 487 837Fuhrmann L Zensus J A Krichbaum T P Angelakis E amp Readhead A
C S 2007 in AIP Conf Proc 921 The First GLAST Symposium ed SRitz P Michelson amp C A Meegan (Melville NY AIP) 249
Fuhrmann L et al 2008 AampA 490 1019Gehrels N et al 2004 ApJ 611 1005Georganopoulos M amp Kazanas D 2003 ApJ 594 L27Georganopoulos M amp Kazanas D 2004 ApJ 604 L81Ghisellini G amp Madau P 1996 MNRAS 280 67Ghisellini G Tavecchio F amp Chiaberge M 2005 AampA 432 401Gilmore R C Madau P Primack J R Somerville R S amp Haardt F
2009 MNRAS 399 1694Hartman R C et al 1999 ApJS 123 79Henri G amp Sauge L 2006 ApJ 640 185Jorstad S G Marscher A P Mattox J R Wehrle A E Bloom S D amp
Yurchenko A V 2001 ApJS 134 181Joshi M amp Bottcher M 2007 ApJ 662 884
Kataoka J et al 1999 Astropart Phys 11 149Kerrick A D et al 1995 ApJ 452 588Kinney A L Bohlin R C Blades J C amp York D G 1991 ApJS 75
645Kuiper L Hermsen W Verbunt F Thompson D J Stairs I H Lyne A
G Strickman M S amp Cusumano G 2000 AampA 359 615Larionov V M et al 2008 ATel 1755 1Li T-P amp Ma Y-Q 1983 ApJ 272 317Mackay C D 1971 MNRAS 154 209Marscher A P Jorstad S G Mattox J R amp Wehrle A E 2002 ApJ 577
85Mattox J R et al 1996 ApJ 461 396Miller J S French H B amp Hawley S A 1978 Proc Pittsburgh Conf on
BL Lac Objects ed A M Wolfe 176Mucke A Protheroe R J Engel R Rachen J P amp Stanev T 2003
Astropart Phys 18 593Northover K J E 1973 MNRAS 165 369Oke J B et al 1995 PASP 107 375Piner B G Pant N amp Edwards P G 2008 ApJ 678 64Poole T S et al 2008 MNRAS 383 627Prandini E Bonnoli G Maraschi L Mariotti M amp Tavecchio F 2010
MNRAS 405 L76Reimer A Joshi M amp Bottcher M 2008 in AIP Conf Ser 1085 High
Energy Gamma-Ray Astronomy ed F A Aharonian W Hofmann amp FRieger (Melville NY AIP) 502
Savolainen T Homan D C Hovatta T Kadler M Kovalev Y Y ListerM L Ros E amp Zensus J A 2010 AampA 512 A24
Schlegel D J Finkbeiner D P amp Davis M 1998 ApJ 500 525Sikora M Begelman M C amp Rees M J 1994 ApJ 421 153Smith H E Smith E O amp Spinrad H 1976 PASP 88 621Stecker F W Malkan M A amp Scully S T 2006 ApJ 648 774 (erratum
658 1392 [2007])Swordy S 2008 ATel 1753 1Tavecchio F amp Ghisellini G 2009 MNRAS 394 L131Taylor G B Vermeulen R C Readhead A C S Pearson T J Henstock
D R amp Wilkinson P N 1996 ApJS 107 37Thompson D J et al 1993 ApJS 86 629Tosti G 2008 ATel 1759 1Urry C M amp Padovani P 1995 PASP 107 803Villata M et al 2008 AampA 481 L79Villata M et al 2009 AampA 504 L9Weekes T C 2000 in AIP Conf Ser 515 GeVndashTeV Gamma Ray Astrophysics
Workshop Towards a Major Atmospheric Cherenkov Detector VI ed B LDingus M H Salamon amp D B Kieda (Melville NY AIP) 3
Wills B J amp Wills D 1974 ApJ 190 L97Wurtz R Stocke J T amp Yee H K C 1996 ApJS 103 109
14
The Astrophysical Journal 72643 (14pp) 2011 January 1 Abdo et al
6 Istituto Nazionale di Fisica Nucleare Sezione di Trieste I-34127 Trieste Italy7 Dipartimento di Fisica Universita di Trieste I-34127 Trieste Italy
8 Istituto Nazionale di Fisica Nucleare Sezione di Padova I-35131 Padova Italy9 Dipartimento di Fisica ldquoG Galileirdquo Universita di Padova I-35131 Padova Italy
10 Istituto Nazionale di Fisica Nucleare Sezione di Perugia I-06123 Perugia Italy11 Dipartimento di Fisica Universita degli Studi di Perugia I-06123 Perugia Italy
12 Dipartimento di Fisica ldquoM Merlinrdquo dellrsquoUniversita e del Politecnico di Bari I-70126 Bari Italy13 Istituto Nazionale di Fisica Nucleare Sezione di Bari I-70126 Bari Italy
14 Laboratoire Leprince-Ringuet Ecole polytechnique CNRSIN2P3 Palaiseau France15 Institut de Ciencies de lrsquoEspai (IEEC-CSIC) Campus UAB E-08193 Barcelona Spain
16 INAF-Istituto di Astrofisica Spaziale e Fisica Cosmica I-20133 Milano Italy17 Agenzia Spaziale Italiana (ASI) Science Data Center I-00044 Frascati (Roma) Italy
18 NASA Goddard Space Flight Center Greenbelt MD 20771 USA19 Center for Research and Exploration in Space Science and Technology (CRESST) and NASA Goddard Space Flight Center Greenbelt MD 20771 USA
20 Department of Physics and Center for Space Sciences and Technology University of Maryland Baltimore County Baltimore MD 21250 USA21 George Mason University Fairfax VA 22030 USA
22 Laboratoire de Physique Theorique et Astroparticules Universite Montpellier 2 CNRSIN2P3 Montpellier France23 Department of Physics Stockholm University AlbaNova SE-106 91 Stockholm Sweden
24 The Oskar Klein Centre for Cosmoparticle Physics AlbaNova SE-106 91 Stockholm Sweden25 CNRSIN2P3 Centre drsquoEtudes Nucleaires Bordeaux Gradignan UMR 5797 F-33175 Gradignan France
26 Universite de Bordeaux Centre drsquoEtudes Nucleaires Bordeaux Gradignan UMR 5797 F-33175 Gradignan France27 Dipartimento di Fisica Universita di Udine and Istituto Nazionale di Fisica Nucleare Sezione di Trieste Gruppo Collegato di Udine I-33100 Udine Italy
28 Osservatorio Astronomico di Trieste Istituto Nazionale di Astrofisica I-34143 Trieste Italy29 Max-Planck-Institut fur Radioastronomie Auf dem Hugel 69 D-53121 Bonn Germany
30 Department of Physical Sciences Hiroshima University Higashi-Hiroshima Hiroshima 739-8526 Japan31 INAF Istituto di Radioastronomia I-40129 Bologna Italy
32 Center for Space Plasma and Aeronomic Research (CSPAR) University of Alabama in Huntsville Huntsville AL 35899 USA33 Department of Physics Center for Cosmology and Astro-Particle Physics The Ohio State University Columbus OH 43210 USA
34 Department of Physics and Department of Astronomy University of Maryland College Park MD 20742 USA35 Research Institute for Science and Engineering Waseda University 3-4-1 Okubo Shinjuku Tokyo 169-8555 Japan
36 Centre drsquoEtude Spatiale des Rayonnements CNRSUPS BP 44346 F-30128 Toulouse Cedex 4 France37 Istituto Nazionale di Fisica Nucleare Sezione di Roma ldquoTor Vergatardquo I-00133 Roma Italy
38 Department of Physics and Astronomy University of Denver Denver CO 80208 USA39 Hiroshima Astrophysical Science Center Hiroshima University Higashi-Hiroshima Hiroshima 739-8526 Japan40 Institute of Space and Astronautical Science JAXA 3-1-1 Yoshinodai Sagamihara Kanagawa 229-8510 Japan
41 Max-Planck Institut fur extraterrestrische Physik D-85748 Garching Germany42 Institut fur Astro- und Teilchenphysik and Institut fur Theoretische Physik Leopold-Franzens-Universitat Innsbruck A-6020 Innsbruck Austria
43 Kavli Institute for Cosmological Physics University of Chicago Chicago IL 60637 USA lreyeskicpuchicagoedu44 Santa Cruz Institute for Particle Physics Department of Physics and Department of Astronomy and Astrophysics
University of California at Santa Cruz Santa Cruz CA 95064 USA45 Department of Physics University of Washington Seattle WA 98195-1560 USA
46 Space Sciences Division NASA Ames Research Center Moffett Field CA 94035-1000 USA47 Department of Chemistry and Physics Purdue University Calumet Hammond IN 46323-2094 USA
48 Institucio Catalana de Recerca i Estudis Avancats (ICREA) Barcelona Spain49 Consorzio Interuniversitario per la Fisica Spaziale (CIFS) I-10133 Torino Italy
50 INTEGRAL Science Data Centre CH-1290 Versoix Switzerland51 Dipartimento di Fisica Universita di Roma ldquoTor Vergatardquo I-00133 Roma Italy
52 Department of Physics Royal Institute of Technology (KTH) AlbaNova SE-106 91 Stockholm Sweden53 School of Pure and Applied Natural Sciences University of Kalmar SE-391 82 Kalmar Sweden
54 Fred Lawrence Whipple Observatory Harvard-Smithsonian Center for Astrophysics Amado AZ 85645 USA55 Department of Physics and Astronomy Barnard College Columbia University NY 10027 USA56 Department of Physics and Astronomy University of California Los Angeles CA 90095 USA
57 Santa Cruz Institute for Particle Physics and Department of Physics University of California Santa Cruz CA 95064 USA58 Department of Physics Washington University St Louis MO 63130 USA
59 Astrophysical Institute Department of Physics and Astronomy Ohio University Athens OH 45701 USA60 Department of Physics and Astronomy and the Bartol Research Institute University of Delaware Newark DE 19716 USA
61 School of Physics and Astronomy University of Leeds Leeds LS2 9JT UK62 Argonne National Laboratory 9700 S Cass Avenue Argonne IL 60439 USA
63 School of Physics University College Dublin Belfield Dublin 4 Ireland64 School of Physics National University of Ireland Galway University Road Galway Ireland
65 Physics Department California Polytechnic State University San Luis Obispo CA 94307 USA66 Astronomy Department Adler Planetarium and Astronomy Museum Chicago IL 60605 USA
67 Department of Physics Purdue University West Lafayette IN 47907 USA68 European Space Astronomy Centre (INSA-ESAC) European Space Agency (ESA) Satellite Tracking Station PO Box Apdo 50727
E-28080 Villafranca del Castillo Madrid Spain69 Department of Astronomy and Astrophysics 525 Davey Lab Pennsylvania State University University Park PA 16802 USA
70 Department of Physics and Astronomy University of Utah Salt Lake City UT 84112 USA71 Physics Department McGill University Montreal QC H3A 2T8 Canada72 Enrico Fermi Institute University of Chicago Chicago IL 60637 USA
73 Department of Physics and Astronomy Iowa State University Ames IA 50011 USA74 Department of Physics and Astronomy University of Iowa Van Allen Hall Iowa City IA 52242 USA
75 Department of Physics and Astronomy DePauw University Greencastle IN 46135-0037 USA76 Department of Physics Pittsburg State University 1701 South Broadway Pittsburg KS 66762 USA
77 Department of Life and Physical Sciences Galway-Mayo Institute of Technology Dublin Road Galway Ireland78 Instituto de Astronomia y Fisica del Espacio Casilla de Correo 67 Sucursal 28 (C1428ZAA) Ciudad Autnoma de Buenos Aires Argentina
79 Department of Applied Physics and Instrumentation Cork Institute of Technology Bishopstown Cork Ireland
2
The Astrophysical Journal 72643 (14pp) 2011 January 1 Abdo et al
80 Columbia Astrophysics Laboratory Columbia University New York NY 10027 USA81 INAF Osservatorio Astronomico di Torino Italy
82 Harvard-Smithsonian Center for Astrophysics MA USA83 Astronomical Institute St Petersburg State University Russia
84 Pulkovo Observatory Russia85 Isaac Newton Institute of Chile St Petersburg Branch Russia
86 Abastumani Observatory Mt Kanobili 0301 Abastumani Georgia87 Department of Astronomy University of Michigan MI USA
88 Metsahovi Radio Observatory Helsinki University of Technology TKK Finland89 Institute of Astronomy National Central University Taiwan
90 Tuorla Observatory Department of Physics and Astronomy University of Turku Finland91 Instituto de Astrofısica de Andalucıa CSIC Spain
92 Max-Planck-Institut fur Radioastronomie Germany93 Institute of Astronomy Bulgarian Academy of Sciences Bulgaria
94 Circolo Astrofili Talmassons Italy95 Instituto de Astronomıa Universidad Nacional Autonoma de Mexico Apdo Postal 70-265 CP 04510 Mexico DF Mexico
96 INAF Osservatorio Astrofisico di Catania Italy97 Astrophysical Institute Department of Physics and Astronomy Ohio University OH USA
98 Osservatorio Astronomico della Regione Autonoma Valle drsquoAosta Italy99 Armenzano Astronomical Observatory Italy
100 INAF Osservatorio Astronomico di Roma Italy101 INAF Osservatorio Astronomico di Collurania Teramo Italy
102 Agrupacio Astronomica de Sabadell Spain103 ZAH Landessternwarte Heidelberg Konigstuhl D-69117 Heidelberg Germany
104 Instituto de Astronomıa Universidad Nacional Autonoma deMexico Apdo Postal 877 CP 22800 Ensenada B C Mexico105 Institute for Astrophysical Research Boston University MA USA
106 DLR Institute of Planetary Research Rutherfordstr 2 D-12489 Berlin Germany107 INAOE Apdo Postal 51 amp 216 72000 Tonantzintla Puebla Mexico
108 Finnish Centre for Astronomy with ESO (FINCA) University of TurkuVaisalantie 20 FI-21500 Piikkio Finland109 Department of Physics University of Colorado Denver CO USA
110 INAF-Osservatorio Astronomico di Brera via E Bianchi 46 I-23807 Merate Italy111 Department of Astrophysical Sciences Princeton University Princeton NJ 08544 USA
112 Department of Astronomy University of California Berkeley CA 94720-3411 USA113 Max-Planck-Institut fur Radioastronomie Auf dem Hugel 69 D-53121 Bonn Germany
114 Department of Astronomy and Astrophysics University of California 1156 High Street Santa Cruz CA 95064 USA115 Landessternwarte Universitat HeidelbergKonigstuhl 12 D-69117 Heidelberg Germany
116 UCOLick Observatory University of California 1156 High Street Santa Cruz CA 95064 USA117 Institut de Radio Astronomie Millimetrique Avenida Divina Pastora 7 Local 20 E-18012 Granada Spain
Received 2010 June 17 accepted 2010 October 29 published 2010 December 14
ABSTRACT
The BL Lacertae object 3C 66A was detected in a flaring state by the Fermi Large Area Telescope (LAT) andVERITAS in 2008 October In addition to these gamma-ray observations F-GAMMA GASP-WEBT PAIRITELMDM ATOM Swift and Chandra provided radio to X-ray coverage The available light curves show variabilityand in particular correlated flares are observed in the optical and Fermi-LAT gamma-ray band The resultingspectral energy distribution can be well fitted using standard leptonic models with and without an external radiationfield for inverse Compton scattering It is found however that only the model with an external radiation field canaccommodate the intra-night variability observed at optical wavelengths
Key words BL Lacertae objects individual (3C 66A) ndash galaxies active ndash gamma rays galaxies
1 INTRODUCTION
The radio source 3C 66 (Bennett 1962) was shown by Mackay(1971) and Northover (1973) to actually consist of two unrelatedradio sources separated by 011 a compact source (3C 66A)and a resolved galaxy (3C 66B) 3C 66A was subsequentlyidentified as a quasi-stellar object by Wills amp Wills (1974) andas a BL Lacertae object by Smith et al (1976) based on its opticalspectrum 3C 66A is now a well-known blazar which like otheractive galactic nuclei (AGNs) is thought to be powered by
118 Royal Swedish Academy of Sciences Research Fellow funded by a grantfrom the K A Wallenberg Foundation119 Partially supported by the International Doctorate on Astroparticle Physics(IDAPP) program120 Now at DESY Platanenallee 6 D-15738 Zeuthen Germany121 Now at Institut fur Physik und Astronomie Universitat Potsdam D-14476Potsdam-GolmGermany DESY Platanenallee 6 D-15738 Zeuthen Germany122 Now at Los Alamos National Laboratory MS H803 Los Alamos NM87545 USA
accretion of material onto a supermassive black hole located inthe central region of the host galaxy (Urry amp Padovani 1995)Some AGNs present strong relativistic outflows in the formof jets where particles are believed to be accelerated to ultra-relativistic energies and gamma rays are subsequently producedBlazars are the particular subset of AGNs with jets aligned tothe observerrsquos line of sight Indeed the jet of 3C 66A has beenimaged using very long baseline interferometry (VLBI Tayloret al 1996 Jorstad et al 2001 Marscher et al 2002 Britzen et al2007) and superluminal motion has been inferred (Jorstad et al2001 Britzen et al 2008) This is indicative of the relativisticLorentz factor of the jet and its small angle with respect to theline of sight
BL Lacs are known for having very weak (if any) detectableemission lines which makes determination of their redshift quitedifficult The redshift of 3C 66A was reported as z = 0444 byMiller et al (1978) and also (although tentatively) by Kinneyet al (1991) Each measurement however is based on the
3
The Astrophysical Journal 72643 (14pp) 2011 January 1 Abdo et al
measurement of a single line and is not reliable (Bramel et al2005) Recent efforts (described in Section 25) to providefurther constraints have proven unsuccessful
Similar to other blazars the spectral energy distribution(SED) of 3C 66A has two pronounced peaks which suggeststhat at least two different physical emission processes are atwork (eg Joshi amp Bottcher 2007) The first peak extendingfrom radio to soft X-ray frequencies is likely due to synchrotronemission from high-energy electrons while different emissionmodels have been proposed to explain the second peak whichextends up to gamma-ray energies Given the location of itssynchrotron peak (1015 Hz) 3C 66A is further sub-classifiedas an intermediate synchrotron peaked (ISP) blazar (Abdo et al2010c)
The models that have been proposed to explain gamma-rayemission in blazars can be roughly categorized into leptonicor hadronic depending on whether the accelerated particlesresponsible for the gamma-ray emission are primarily electronsand positrons (hereafter ldquoelectronsrdquo) or protons In leptonicmodels high-energy electrons produce gamma rays via inverseCompton (IC) scattering of low-energy photons In synchrotronself-Compton (SSC) models the same population of electronsresponsible for the observed gamma rays generates the low-energy photon field through synchrotron emission In externalCompton (EC) models the low-energy photons originate outsidethe emission volume of the gamma rays Possible sources oftarget photons include accretion-disk photons radiated directlyinto the jet (Dermer amp Schlickeiser 1993) accretion-diskphotons scattered by emission-line clouds or dust into the jet(Sikora et al 1994) synchrotron radiation re-scattered backinto the jet by broad-line emission clouds (Ghisellini amp Madau1996) jet emission from an outer slow jet sheet (Ghiselliniet al 2005) or emission from faster or slower portions of the jet(Georganopoulos amp Kazanas 2004) In hadronic models gammarays are produced by high-energy protons either via protonsynchrotron radiation (Mucke et al 2003) or via secondaryemission from photo-pion and photo-pair-production reactions(see Bottcher (2007) and references therein for a review of blazargamma-ray emission processes)
One of the main obstacles in the broadband study of gamma-ray blazars is the lack of simultaneity or at least contempo-raneousness of the data at the various wavelengths At highenergies the situation is made even more difficult due to thelack of objects that can be detected by MeVGeV and TeV ob-servatories on comparable timescales Indeed until recently theknowledge of blazars at gamma-ray energies had been obtainedfrom observations performed in two disjoint energy regimes (1)the high-energy range (20 MeVlt E lt 10 GeV) studied in the1990s by EGRET (Thompson et al 1993) and (2) the very highenergy (VHE) regime (E gt 100 GeV) observed by ground-basedinstruments such as imaging atmospheric Cherenkov telescopes(IACTs Weekes 2000) Only123 Markarian 421 was detected byboth EGRET and the first IACTs (Kerrick et al 1995) Further-more blazars detected by EGRET at MeVGeV energies arepredominantly flat-spectrum radio quasars (FSRQs) while TeVblazars are to date predominantly BL Lacs It is important tounderstand these observational differences since they are likelyrelated to the physics of the AGN (Cavaliere amp DrsquoElia 2002) orto the evolution of blazars over cosmic time (Bottcher amp Dermer2002)
123 Markarian 501 was marginally detected by EGRET only during a fewmonths in 1996 (Kataoka et al 1999)
The current generation of gamma-ray instruments (AGILEFermi HESS MAGIC and VERITAS) is closing the gapbetween the two energy regimes due to improved instrumentsensitivities leading us toward a deeper and more completecharacterization of blazars as high-energy sources and as apopulation (Abdo et al 2009b) An example of the successfulsynergy of space-borne and ground-based observatories isprovided by the joint observations of 3C 66A by the FermiLAT and the Very Energetic Radiation Imaging Telescope ArraySystem (VERITAS) during its strong flare of 2008 OctoberThe flare was originally reported by VERITAS (Swordy 2008Acciari et al 2009) and soon after contemporaneous variabilitywas also detected at optical to infrared wavelengths (Larionovet al 2008) and in the Fermi-LAT energy band (Tosti 2008)Follow-up observations were obtained at radio optical andX-ray wavelengths in order to measure the flux and spectralvariability of the source across the electromagnetic spectrumand to obtain a quasi-simultaneous SED This paper reports theresults of this campaign including the broadband spectrum anda model interpretation of this constraining SED
2 OBSERVATIONS AND DATA ANALYSIS
21 VERITAS
VERITAS is an array of four 12 m diameter imagingCherenkov telescopes in southern Arizona USA (Acciari et al2008b) 3C 66A was observed with VERITAS for 14 hr from2007 September through 2008 January and for 46 hr between2008 September and 2008 November These observations (here-after 2007 and 2008 data) add up to sim328 hr of live time afterdata quality selection The data were analyzed following theprocedure described in Acciari et al (2008b)
As reported in Acciari et al (2009) the average spectrummeasured by VERITAS is very soft yielding a photon index Γof 41 plusmn04stat plusmn 06sys when fitted to a power law dNdE propEminusΓ The average integral flux above 200 GeV measured byVERITAS is (13 plusmn 01) times 10minus11 cmminus2 sminus1 which correspondsto 6 of the Crab Nebularsquos flux above this threshold In additiona strong flare with night-by-night VHE-flux variability wasdetected in 2008 October For this analysis the VERITASspectrum is calculated for the short time interval 2008 October8ndash10 (MJD 54747ndash54749 hereafter flare period) and for alonger period corresponding to the dark run124 where most of theVHE emission from 3C 66A was detected (MJD 54734ndash54749)It should be noted that the flare and dark run intervals overlapand are therefore not independent Table 1 lists the relevantinformation from each data set
As shown in Figure 1 the flare and dark run spectra are verysoft yielding nearly identical photon indices of 41 plusmn 06stat plusmn06sys entirely consistent with that derived from the full 2007and 2008 data set The integral flux above 200 GeV for theflare period is (25 plusmn 04) times 10minus11 cmminus2 sminus1 while the averageflux for the dark run period is (14 plusmn 02) times 10minus11 cmminus2 sminus1The extragalactic background light (EBL) de-absorbed spectralpoints for the dark run calculated using the optical depth valuesof Franceschini et al (2008) and assuming a nominal redshiftof z = 0444 are also shown in Figure 1 These points are wellfitted by a power-law function with Γ = 19 plusmn 05
124 IACTs like VERITAS do not operate on nights with bright moonlight Theseries of nights between consecutive bright moonlight periods is usuallyreferred to as a dark run
4
The Astrophysical Journal 72643 (14pp) 2011 January 1 Abdo et al
Table 1Results from VERITAS Observations of 3C 66A
Interval Live Time (hr) Non Noff Alpha Excess Significance (σ )
Flare 60 1531 7072 0121 6783 180Dark run 212 3888 20452 0125 13315 2222007 and 2008 281 7257 31201 0175 1791 211
Notes Live time corresponds to the effective exposure time after accountingfor data quality selection Non (Noff ) corresponds to the number of on (off)-source events passing background-rejection cuts Alpha is the normalizationof off-source events and the excess is equal to Non minus αNoff The significanceis expressed in number of standard deviations and is calculated according toEquation (17) of Li amp Ma (1983) See Acciari et al (2009) for a completedescription of the VERITAS analysis
22 Fermi-LAT
The LAT on board the Fermi Gamma-ray Space Telescope isa pair-conversion detector sensitive to gamma rays with energiesbetween 20 MeV and several hundred GeV (Atwood et al 2009)Since launch the instrument has operated almost exclusively insky survey mode covering the whole sky every 3 hr The overallcoverage of the sky is fairly uniform with exposure variations of 15 around the mean value The LAT data are analyzed usingScienceTools v9r15p5 and instrument response functions P6V3(available via the Fermi science support center125) Only photonsin the diffuse event class are selected for this analysis because oftheir reduced charged-particle background contamination andvery good angular reconstruction A zenith angle lt105 cut ininstrument coordinates is used to avoid gamma rays from theEarth limb The diffuse emission from the Galaxy is modeledusing a spatial model (gll iem v02fit) which was refinedwith Fermi-LAT data taken during the first year of operationThe extragalactic diffuse and residual instrumental backgroundsare modeled as an isotropic component and are included inthe fit126 The data are analyzed with an unbinned maximumlikelihood technique (Mattox et al 1996) using the likelihoodanalysis software developed by the LAT team
Although 3C 66A was detected by EGRET as source 3EGJ0222+4253 (Hartman et al 1999) detailed spatial and timinganalyses by Kuiper et al (2000) showed that this EGRETsource actually consists of the superposition of 3C 66A andthe nearby millisecond pulsar PSR J0218+4232 which is 096distant from the blazar This interpretation of the EGRET datais verified by Fermi-LAT whose improved angular resolutionpermits the clear separation of the two sources as shown inFigure 2 Furthermore the known pulsar period is detectedwith high confidence in the Fermi-LAT data (Abdo et al2009a) More importantly for this analysis the clear separationbetween the pulsar and the blazar enables studies of eachsource independently in the maximum likelihood analysis andthus permits an accurate determination of the spectrum andlocalization of each source with negligible contamination
Figure 2 also shows the localization of the Fermi andVERITAS sources with respect to blazar 3C 66A and radiogalaxy 3C 66B (see caption in Figure 2 for details) It is clearfrom the map that the Fermi-LAT and VERITAS localizationsare consistent and that the gamma-ray emission is confidentlyassociated with the blazar and not with the radio galaxy Somesmall contribution in the Fermi-LAT data from radio galaxy3C 66B as suggested by Aliu et al (2009) and Tavecchio amp
125 httpfermigsfcnasagovsscdataanalysisscitoolsoverviewhtml126 httpfermigsfcnasagovsscdataaccesslatBackgroundModelshtml
Energy (MeV)
210 310 410 510 610
)minus
1 s
minus2
(M
eV
cm
νFν
minus710
minus610
minus510
minus410
minus310
)minus
1 s
minus2
(e
rgs
cm
νFν
minus1210
minus1110
minus1010
minus910
intervalflareminusLATFermi intervaldark runminusLATFermi
minusLAT 6minusmonths average spectrumFermi
intervalflareVERITAS
intervaldarkrunVERITAS
VERITAS average spectrum 2007minus2008
(z=0444) dark runDeminusabsorbed VERITAS
(z=03) dark runDeminusabsorbed VERITAS
Figure 1 Gamma-ray SED of 3C 66A including Fermi-LAT and VERITASdata for the flare (red symbols) and dark run (blue symbols) intervals TheFermi-LAT spectra are also shown here as ldquobutterflyrdquo contours (solid lines)describing the statistical error on the spectrum (Abdo et al 2009b) Thepreviously reported Fermi-LAT six-month-average spectrum (Abdo et al 2010b)is also shown here (green circles) and is lower than the spectrum obtained duringthe campaign The average 2007ndash2008 VERITAS spectrum originally reportedin Acciari et al (2009) is displayed with green triangles In all cases theupper limits are calculated at 95 confidence level The de-absorbed dark runspectra obtained using the optical depth values of Franceschini et al (2008)are also shown as open circles and open squares for redshifts of 0444 and 03respectively
Ghisellini (2009) cannot be excluded given the large spillover oflow-energy photons from 3C 66A at the location of 3C 66B Thisis due to the long tails of the Fermi-LAT point-spread function atlow energies as described in Atwood et al (2009) Neverthelessconsidering only photons with energy E gt 1 GeV the upperlimit (95 confidence level) for a source at the location of 3C66B is 29 times 10minus8 cmminus2 sminus1 for the dark run period (with a teststatistic127 (TS) = 13) For the 11 months of data correspondingto the first Fermi-LAT catalog (Abdo et al 2010a) the upperlimit is 49 times 10minus9 cmminus2 sminus1 (TS = 58)
As in the analysis of the VERITAS observations the Fermi-LAT spectrum is calculated for the flare and for the darkrun periods The Fermi flare period flux F (E gt100 MeV) =(50 plusmn 14stat plusmn 03sys) times 10minus7 cmminus2 sminus1 is consistent withinerrors with the dark run flux of (39 plusmn 05stat plusmn 03sys) times10minus7 cmminus2 sminus1 In both cases the Fermi-LAT spectrum is quitehard and can be described by a power law with a photon indexΓ of 18 plusmn 01stat plusmn 01sys and 19 plusmn 01stat plusmn 01sys in the flareperiod and dark run intervals respectively Both spectra areshown in the high-energy SED in Figure 1
23 Chandra
3C 66A was observed by the Chandra observatory on 2008October 6 for a total of 376 ks with the Advanced CCD ImagingSpectrometer (ACIS) covering the energy band between 03and 10 keV The source was observed in the continuousclocking mode to avoid pile-up effects Standard analysis tools(CIAO 41) and calibration files (CALDB v350) provided bythe Chandra X-ray center128 are used
The time-averaged spectrum is obtained and re-binned to en-sure that each spectral channel contains at least 25 background-subtracted counts This condition allows the use of the χ2
127 The test statistic (TS) value quantifies the probability of having a pointsource at the location specified It is roughly the square of the significancevalue a TS of 25 corresponds to a signal of approximately 5 standarddeviations (Abdo et al 2010a)128 httpcxcharvardeduciao
5
The Astrophysical Journal 72643 (14pp) 2011 January 1 Abdo et al
Figure 2 Smoothed count map of the 3C 66A region as seen by Fermi-LAT between 2008 September 1 and December 31 with E gt 100 MeV The color bar hasunits of counts per pixel and the pixel dimensions are 01 times 01 The contour levels have been smoothed and correspond to 28 52 and 76 counts per pixel Thelocations of 3C 66A and 3C 66B (a radio galaxy that is 011 away) are shown as a cross and as a diamond respectively The location of millisecond pulsar PSR0218+4232 is also indicated with a white cross The magenta circle represents the VERITAS localization of the VHE source (RA DEC) = (2h22m41s6 plusmn 1s7stat plusmn6s0sys 4302prime35primeprime5 plusmn 21primeprime
stat plusmn 1prime30primeprimesys) as reported in Acciari et al (2009) The blue interior circle represents the 95 error radius of the Fermi-LAT localization
(RA DEC) = (02h22m40s3 plusmn 4s5 4302prime18primeprime6 plusmn 42primeprime1) as reported in the Fermi-LAT first source catalog (Abdo et al 2010a) All positions are based on the J2000epoch
quality-of-fit estimator to find the best-fit model XSPEC v124(Arnaud 1996) is used for the spectral analysis and fitting proce-dure Two spectral models have been used to fit the data singlepower law and broken power law Each model includes galacticH i column density (NHGal = 899 times 1020 cmminus2) according toDickey amp Lockman (1990) where the photoelectric absorptionis set with the XSPEC model phabs129 An additional local H i
column density was also tried but in both cases the spectra wereconsistent with pure galactic density Consequently the columndensity has been fixed to the galactic value in each model andthe results obtained are presented in Table 2 An F-test wasperformed to demonstrate that the spectral fit improves signif-icantly when using the extra degrees of freedom of the brokenpower-law model Table 2 also contains the results of the F-test
24 Swift XRT and UVOT
Following the VERITAS detection of VHE emission from3C 66A Target of Opportunity (ToO) observations of 3C 66Awith Swift were obtained for a total duration of sim10 ks TheSwift satellite observatory comprises an UVndashOptical telescope(UVOT) an X-ray telescope (XRT) and a Burst Alert Telescope(Gehrels et al 2004) Data reduction and calibration of the XRT
129 httpheasarcgsfcnasagovdocssoftwarelheasoftxanaduxspecmanualXSmodelPhabshtml
data are performed with HEASoft v65 standard tools AllXRT data presented here are taken in photon counting modewith negligible pile-up effects The X-ray spectrum of eachobservation is fitted with an absorbed power law using a fixedGalactic column density from Dickey amp Lockman (1990)which gives good χ2 values for all observations The measuredphoton spectral index ranges between 25 and 29 with a typicalstatistical uncertainty of 01
UVOT obtained data through each of six color filters VB and U together with filters defining three ultraviolet pass-bands UVW1 UVM2 and UVW2 with central wavelengths of260 nm 220 nm and 193 nm respectively The data are cal-ibrated using standard techniques (Poole et al 2008) and cor-rected for Galactic extinction by interpolating the absorptionvalues from Schlegel et al (1998) (EBminusV = 0083 mag) withthe galactic spectral extinction model of Fitzpatrick (1999)
25 Optical to Infrared Observations
The R magnitude of the host galaxy of 3C 66A is sim 19in the optical band (Wurtz et al 1996) Its contribution isnegligible compared to the typical AGN magnitude of R 15 therefore host-galaxy correction is not necessary
GASP-WEBT 3C 66A is continuously monitored by tele-scopes affiliated to the GLAST-AGILE support program of theWhole Earth Blazar Telescope (GASP-WEBT see Villata et al
6
The Astrophysical Journal 72643 (14pp) 2011 January 1 Abdo et al
Figure 3 3C 66A light curves covering 2008 August 22 to December 31 inorder of increasing wavelength The VERITAS observations are combined toobtain nightly flux values and the dashed and dotted lines represent the averageflux measured from the 2007 and 2008 data and its standard deviation TheFermi-LAT light curves contain time bins with a width of 3 days The averageflux and average photon index measured by Fermi-LAT during the first sixmonths of science operations are shown as horizontal lines in the respectivepanels In all cases the Fermi-LAT photon index is calculated over the 100MeV to 200 GeV energy range The long-term light curves at optical andinfrared wavelengths are presented in the two bottom panels In the bottompanel GASP-WEBT and PAIRITEL observations are represented by open andsolid symbols respectively
2008 2009) These observations provide a long-term light curveof this object with complete sampling as shown in Figure 3During the time interval in consideration (MJD 54700ndash54840)several observatories (Abastumani Armenzano Crimean ElVendrell LrsquoAmpolla Lulin New Mexico Skies Roque de losMuchachos (KVA) Rozhen Sabadell San Pedro Martir St Pe-tersburg Talmassons Teide (BRT) Torino Tuorla and Valledrsquo Aosta) contributed photometric observations in the R bandData in the J H and K bands were taken at the Campo Imper-atore observatory A list of the observatories and their locationsis available in Table 3
MDM Following the discovery of VHE emission 3C 66Awas observed with the 13 m telescope of the MDM Observatoryduring the nights of 2008 October 6ndash10 A total of 290 scienceframes in U B V and R bands (58 each) were taken throughoutthe entire visibility period (approx 430 ndash 1000 UT) duringeach night The light curves which cover the time around theflare are presented in Figure 4
ATOM Optical observations for this campaign in the R bandwere also obtained with the 08 m optical telescope ATOM
Figure 4 3C 66A light curves covering the period centered on the gamma-ray flare (2008 October 1ndash10) The VERITAS and Fermi-LAT panels werealready described in the caption of Figure 3 Swift Target-of-Opportunity(ToO) observations (panels 3ndash5 from the top) were obtained following thediscovery of VHE emission by VERITAS (Swordy 2008) Swift-UVOT andMDM observations are represented by open and solid symbols respectivelyThe optical light curve in panel 6 from the top displays intra-night variabilityAn example is identified in the plot when a rapid decline of the optical flux byΔFΔt sim minus02 mJy hrminus1 is observed on MJD 54747
in Namibia which monitors this source periodically Twentyphotometric observations are available starting on MJD 54740and are shown in Figures 3 and 4
PAIRITEL Near-infrared observations in the J H and Kswere obtained following the VHE flare with the 13 m PetersAutomated Infrared Imaging Telescope (PAIRITEL see Bloomet al 2006) located at the Fred Lawrence Whipple ObservatoryThe resulting light curves using differential photometry withfour nearby calibration stars are shown in Figure 4
Keck The optical spectrum of 3C 66A was measured withthe LRIS spectrometer (Oke et al 1995) on the Keck I telescopeon the night of 2009 September 17 under good conditions Theinstrument configuration resulted in a full width half-maximumof sim250 km sminus1 over the wavelength range 3200ndash5500 Aring (blueside) and sim200 km sminus1 over the range 6350ndash9000 Aring (red side)A series of exposures totaling 110 s (blue) and 50 s (red) wereobtained yielding a signal-to-noise (SN) per resolution elementof sim250 and 230 for the blue and red cameras respectively Thedata were reduced with the LowRedux130 pipeline and calibratedusing a spectrophotometric star observed on the same night
130 httpwwwucolickorgsimxavierLowReduxindexhtml
7
The Astrophysical Journal 72643 (14pp) 2011 January 1 Abdo et al
Table 2Best-fit Model Parameters for a Fit Performed to the Chandra Data in the 1ndash7 keV Energy Range
Single Power-law Model
Γ Flux (10minus12 erg cmminus2 sminus1) χ2dof
299 plusmn 003 347 plusmn 006 121 (2326193)
Broken Power-law Model
Γ1 Γ2 Flux (10minus12 erg cmminus2 sminus1) Break (keV) χ2dof F-test Probability
308+03minus05 224+023
037 358+007minus008 33+05
minus03 097 (1852191) 347 times 10minus10
Notes The galactic NHGal value is fixed to 899 times 1020 cmminus2 the value of the galactic H i column density according toDickey amp Lockman (1990) Errors indicate the 90 confidence level
Table 3List of Ground-based Observatories that Participated in This Campaign
Observatory Location Web Page
Radio Observatories
Crimean Radio Obs Ukraine wwwcraocrimeauaEffelsberg Germany wwwmpifrdeenglishradiotelescopeIRAM Spain wwwiram-instituteorgEN30-meter-telescopephpMedicina Italy wwwmedirainafitMetsahovi Finland wwwmetsahovifienNoto Italy wwwnotoirainafitUMRAO Michigan USA wwwastrolsaumicheduobsradiotel
Infrared Observatories
Campo Imperatore Italy wwwoa-teramoinafitPAIRITEL Arizona USA wwwpairitelorgOptical ObservatoriesAbastumani Georgia wwwgenaoorgArmenzano Italy wwwwebaliceitdcarosatiATOM Namibia wwwlswuni-heidelbergdeprojectshessATOMCrimean Astr Obs Ukraine wwwcraocrimeauaEl Vendrell SpainKitt Peak (MDM) Arizona USA wwwastrolsaumicheduobsmdmLrsquoAmpolla SpainLulin Taiwan wwwlulinncuedutwenglishNew Mexico Skies Obs New Mexico USA wwwnmskiescomRoque (KVA) Canary Islands Spain wwwotriiacesenonthtmRozhen Bulgaria wwwastrobasbgrozhenhtmlSabadell Spain wwwastrosabadellorghtmlesobservatoriosabhtmSan Pedro Martir Mexico wwwastrosspunammxindexspmhtmlSt Petersburg Russia wwwgaospbruTalmassons Italy wwwcastfvgitTeide (BRT) Canary Islands Spain wwwtelescopeorgTorino Italy wwwtoastroitTuorla Finland wwwastroutufiValle drsquo Aosta Italy wwwoavdaitenglishosservatorio
Gamma-ray Observatory
VERITAS Arizona USA wwwveritassaoarizonaedu
Inspection of the 3C 66A spectrum reveals no spectral featuresaside from those imposed by Earthrsquos atmosphere and the MilkyWay (Ca H+K) Therefore these new data do not offer anyinsight on the redshift of 3C 66A and in particular are unableto confirm the previously reported value of z = 0444 (Milleret al 1978)
26 Radio Observations
Radio observations are available thanks to the F-GAMMA(Fermi-Gamma-ray Space Telescope AGN Multi-frequencyMonitoring Alliance) program which is dedicated to monthly
monitoring of selected Fermi-LAT blazars (Fuhrmann et al2007 Angelakis et al 2008) Radio flux density measurementswere conducted with the 100 m Effelsberg radio telescope at485 835 1045 and 1460 GHz on 2008 October 16 Thesedata are supplemented with an additional measurement at 86GHz conducted with the IRAM 30 m telescope (Pico VeletaSpain) on 2008 October 8 The data were reduced using stan-dard procedures described in Fuhrmann et al (2008) Additionalradio observations taken between 2008 October 5 and 15 (con-temporaneous to the flare period) are provided by the MedicinaMetsahovi Noto and UMRAO observatories all of which aremembers of the GASP-WEBT consortium
8
The Astrophysical Journal 72643 (14pp) 2011 January 1 Abdo et al
3 DISCUSSION
31 Light Curves
The resulting multi-wavelength light curves from this cam-paign are shown in Figure 3 for those bands with long-term cov-erage and in Figure 4 for those observations that were obtainedshortly before and after the gamma-ray flare The VERITASobservations are combined to obtain nightly (E gt 200 GeV)flux values since no evidence for intra-night variability is ob-served The highest flux occurred on MJD 54749 and significantvariability is observed during the whole interval (χ2 probabilityless than 10minus4 for a fit of a constant flux)
The temporal dependence of the Fermi-LAT photon index andintegral flux above 100 MeV and 1 GeV are shown with timebins with width of 3 days in Figure 3 For those time intervalswith no significant detection a 95 confidence flux upper limitis calculated The flux and photon index from the Fermi-LATfirst source catalog (Abdo et al 2010a) are shown as horizontallines for comparison These values correspond to the averageflux and photon index measured during the first 11 months ofFermi operations and thus span the time interval considered inthe figures It is evident from the plot that the VHE flare detectedby VERITAS starting on MJD 54740 is coincident with a periodof high flux in the Fermi energy band The photon index duringthis time interval is consistent within errors with the averagephoton index Γ = 195 plusmn 003 measured during the first sixmonths of the Fermi mission (Abdo et al 2010b)
Long-term and well-sampled light curves are available atoptical and near-infrared wavelengths thanks to observations byGASP-WEBT ATOM MDM and PAIRITEL Unfortunatelyradio observations were too limited to obtain a light curve andno statement about variability in this band can be made Thebest sampling is available for the R band for which variationswith a factor of 2 are observed in the long-term light curveFurthermore variability on timescales of less than a day isobserved as indicated in Figure 4 and as previously reportedby Bottcher et al (2009) following the WEBT (Whole EarthBlazar Telescope) campaign on 3C 66A in 2007 and 2008
The increase in gamma-ray flux observed in the Fermi bandseems contemporaneous with a period of increased flux in theoptical and to test this hypothesis the discrete correlationfunction (DCF) is used (Edelson amp Krolik 1988) Figure 5shows the DCF of the F(E gt 1 GeV) gamma-ray band withrespect to the R band with time-lag bins of 3 5 and 7 days Theprofile of the DCF is consistent for all time-lag bins indicatingthat the result is independent of bin size The DCF with time-lagbins of 3 days was fitted with a Gaussian function of the formDCF(τ ) = Cmax times exp (τ minus τ0)2σ 2 where Cmax is the peakvalue of the DCF τ0 is the delay timescale at which the DCFpeaks and σ parameterizes the Gaussian width of the DCF Thebest-fit function is plotted in Figure 5 and the best-fit parametersare Cmax = 11 plusmn 03 τ0 = (07 plusmn 07) days and σ = (33 plusmn07) days An identical analysis was also performed betweenthe F(E gt 100 MeV) and the R optical band with consistentresults This indicates a clear correlation between the Fermi-LAT and optical energy bands with a time lag that is consistentwith zero and not greater than sim5 days Despite the sparsity ofthe VERITAS light curve (due in part to the time periods whenthe source was not observable due to the full Moon) the DCFanalysis was also performed to search for correlations with eitherthe Fermi-LAT or optical data Apart from the overall increasein flux no significant correlations can be established The onsetof the E gt 200 GeV flare seems delayed by about sim5 days
Time lag [days]minus30 minus20 minus10 0 10 20 30
DC
F
minus1
minus05
0
05
1
15 Bin Size3 days
5 days
7 days
Figure 5 Discrete correlation function (DCF) of the F(E gt 1 GeV) gamma-raylight curve with respect to the R-band light curve A positive time lag indicatesthat the gamma-ray band leads the optical band Different symbols correspondto different bin sizes of time lag as indicated in the legend The profile of theDCF is independent of bin size and is well described by a Gaussian functionof the form DCF(τ ) = Cmax times exp (τ minus τ0)2σ 2 The fit to the 3-day bin sizedistribution is shown in the plot as a solid black line and the best-fit parametersare Cmax = 11 plusmn 03 τ0 = (07 plusmn 07) days and σ = (33 plusmn 07) days
with respect to the opticalndashGeV flare but given the coveragegaps no firm conclusion can be drawn (eg the flare could havebeen already underway when the observations took place) Nosuch lag is expected from the homogeneous model described inthe next section but could arise in models with complex energystratification and geometry in the emitting region
32 SED and Modeling
The broadband SED derived from these observations ispresented in Figure 6 and modeled using the code of Bottcher ampChiang (2002) In this model a power-law distribution of ultra-relativistic electrons andor pairs with lower and upper energycutoffs at γmin and γmax respectively and power-law index qis injected into a spherical region of comoving radius RB Theinjection rate is normalized to an injection luminosity Le whichis a free input parameter of the model The model assumesa temporary equilibrium between particle injection radiativecooling due to synchrotron and Compton losses and particleescape on a time tesc equiv ηesc RBc where ηesc is a scale parameterin the range sim250ndash500 Both the internal synchrotron photonfield (SSC) and external photon sources (EC) are considered astargets for Compton scattering The emission region is movingwith a bulk Lorentz factor Γ along the jet To reduce the numberof free parameters we assume that the jet is oriented with respectto the line of sight at the superluminal angle so that the Dopplerfactor is equal to D = (Γ [1 minus β cos θobs])
minus1 = Γ where θobs isthe angle of the jet with respect to the line of sight Given theuncertainty in the redshift determination of 3C 66A a range ofplausible redshifts namely z = 01 02 03 and the generallyused catalog value z = 0444 are considered for the modelingAll model fits include EBL absorption using the optical depthvalues from Franceschini et al (2008)
Most VHE blazars known to date are high synchrotron peaked(HSP) blazars whose SEDs can often be fitted satisfactorilywith pure SSC models Since the transition from HSP to ISP iscontinuous a pure SSC model was fitted first to the radio throughVHE gamma-ray SED Independently of the model underconsideration the low-frequency part of the SED (lt1020 Hz) iswell fitted with a synchrotron component as shown in Figure 6
9
The Astrophysical Journal 72643 (14pp) 2011 January 1 Abdo et al
Figure 6 Broadband SED of 3C 66A during the 2008 October multi-wavelength campaign The observation that corresponds to each set of data points is indicated inthe legend As an example the EBL-absorbed EC+SSC model for z = 03 is plotted here for reference A description of the model is provided in the text
For clarity only the high-frequency range is shown in Figures 7and 8 where the different models are compared As can beseen from the figures a reasonable agreement with the overallSED can be achieved for any redshift in the range exploredThe weighted sum of squared residuals has been calculatedfor the Fermi-LAT and VERITAS flare data (8 data points intotal) in order to quantify the scatter of the points with respectto the model and is shown in Table 4 The best agreement isachieved when the source is located at z sim 02ndash03 For lowerredshifts the model spectrum is systematically too hard whileat z = 0444 the model spectrum is invariably too soft as a resultof EBL absorption It should be noted that the EBL model ofFranceschini et al (2008) predicts some of the lowest opticaldepth values in comparison to other models (Finke et al 2010Gilmore et al 2009 Stecker et al 2006) Thus a model spectrumwith redshift of 03 or above would be even harder to reconcilewith the observations when using other EBL models
A major problem of the SSC models with z 01 is thatRB is of the order of 5 times 1016 cm This does not allowfor variability timescales shorter than 1 day which seemsto be in contrast with the optical variability observed on shortertimescales A smaller RB would require an increase in theelectron energy density (with no change in the magnetic fieldin order to preserve the flux level of the synchrotron peak) andwould lead to internal gammandashgamma absorption This problemcould be mitigated by choosing extremely high Doppler factorsD 100 However these are significantly larger than thevalues inferred from VLBI observations of Fermi-LAT blazars(Savolainen et al 2010)131 Moreover all SSC models requirevery low magnetic fields far below the value expected fromequipartition (εB = LBLe sim 10minus3 1) where LB is thePoynting flux derived from the magnetic energy density and Le
131 As a caveat jet models with a decelerating flow (Georganopoulos ampKazanas 2003 Piner et al 2008) or with inhomogeneous transverse structure(Ghisellini et al 2005 Henri amp Sauge 2006) can accommodate very highDoppler factors in the gamma-ray emitting region and still be consistent withthe VLBI observations of the large scale jet
is the energy flux of the electrons propagating along the jetTable 4 lists the parameters used for the SSC models displayedin Figure 7
Subsequently an external infrared radiation field with adhoc properties was included as a source of photons to beCompton scattered For all SSC+EC models shown in Figure 8the peak frequency of the external radiation field is set toνext = 14 times 1014 Hz corresponding to near-IR This adoptedvalue is high enough to produce E 100 GeV photons from ICscattering off the synchrotron electrons and at the same time isbelow the energy regime in which KleinndashNishina effects takeplace Although the weighted sums of squared residuals forEC+SSC models are generally worse than for pure SSC modelsreasonable agreement with the overall SED can still be achievedfor redshifts z 03 Furthermore all SSC+EC models areconsistent with a variability timescale of Δtvar sim 4 hr Thisis in better agreement with the observed variability at opticalwavelengths than the pure SSC interpretation Also while theSSC+EC interpretation still requires sub-equipartition magneticfields the magnetic fields are significantly closer to equipartitionthan in the pure SSC case with LBLe sim 01 The parametersof the SSC+EC models are listed in Table 5
Models with and without EC component yield the bestagreement with the SED if the source is located at a redshiftz sim 02ndash03 Of course this depends on the EBL model used inthe analysis An EBL model that predicts higher attenuation thanFranceschini et al (2008) would lead to a lower redshift rangeand make it even more difficult to have agreement betweenthe SED models and the data when the source is located atredshifts z 04 Finally it is worth mentioning that the redshiftrange z sim 02ndash03 is in agreement with previous estimates byFinke et al (2008) who estimate the redshift of 3C 66A to bez = 0321 based on the magnitude of the host galaxy and byPrandini et al (2010) who use an empirical relation betweenthe previously reported Fermi-LAT and IACTs spectral slopesof blazars and their redshifts to estimate the redshift of 3C 66Ato be below z = 034 plusmn 005
10
The Astrophysical Journal 72643 (14pp) 2011 January 1 Abdo et al
Figure 7 SSC models for redshifts z = 0444 03 02 and 01 from top to bottom The Fermi-LAT and VERITAS data points follow the same convention usedin Figures 1 and 6 to distinguish between flare (red) and dark run (blue) data points In each panel the EBL-absorbed model is shown as a solid red line and thede-absorbed model as a red dashed line De-absorbed VERITAS flare points are shown as open squares In all cases the optical depth values from Franceschini et al(2008) are used The best agreement between the model and the data is achieved when the source is located at z = 02ndash03 For lower redshifts the model spectrum issystematically too hard while at z = 0444 the model spectrum is too soft
A detailed study of hadronic versus leptonic modeling of the2008 October data will be published elsewhere but it is worthmentioning that the synchrotron proton blazar (SPB) model hasbeen used to adequately reproduce the quasi-simultaneous SEDobserved during the 2003ndash2004 multi-wavelength campaign(Reimer et al 2008) On that occasion rapid intra-day variationsdown to a 2 hr timescale were observed while during the2008 campaign presented here these variations seem less rapidQualitatively the longer timescale variations may be due toa lower Doppler beaming at the same time that a stronglyreprocessed proton synchrotron component dominates the highenergy output of this source
4 SUMMARY
Multi-wavelength observations of 3C 66A were carried outprompted by the gamma-ray outburst detected by the VERITASand Fermi observatories in 2008 October This marks the first
occasion that a gamma-ray flare is detected by GeV and TeVinstruments in comparable timescales The light curves obtainedshow strong variability at every observed wavelength and inparticular the flux increase observed by VERITAS and Fermiis coincident with an optical outburst The clear correlationbetween the Fermi-LAT and R optical light curves permits oneto go beyond the source association reported in the first Fermi-LAT source catalog (Abdo et al 2010a) and finally identify thegamma-ray source 1FGL J02226+4302 as blazar 3C 66A
For the modeling of the overall SED a reasonable agreementcan be achieved using both a pure SSC model and an SSC+ECmodel with an external near-infrared radiation field as anadditional source for Compton scattering However the pureSSC model requires (1) a large emission region which isinconsistent with the observed intra-night scale variability atoptical wavelengths and (2) low magnetic fields about afactor sim10minus3 below equipartition In contrast an SSC+ECinterpretation allows for variability on timescales of a few hours
11
The Astrophysical Journal 72643 (14pp) 2011 January 1 Abdo et al
Figure 8 EC+SSC model for redshifts z =0444 03 02 and 01 from top to bottom The individual EBL-absorbed EC and SSC components are indicated asdash-dotted and dotted lines respectively The sum is shown as a solid red line (dashed when de-absorbed) The best agreement between the model and the data isachieved when the source is located at z sim 02
Table 4Parameters Used for the SSC Models Displayed in Figure 7
Model Parameter z = 01 z = 02 z = 03 z = 0444
Low-energy cutoff γmin 18 times 104 20 times 104 22 times 104 25 times 104
High-energy cutoff γmax 30 times 105 40 times 105 40 times 105 50 times 105
Injection index q 29 29 30 30Injection luminosity Le (1045 erg sminus1) 13 33 57 128Comoving magnetic field B (G) 003 002 002 001Poynting flux LB (1042 erg sminus1) 11 49 85 137εB equiv LBLe 09 times 10minus3 15 times 10minus3 15 times 10minus3 11 times 10minus3
Doppler factor (D) 30 30 40 50Plasmoid radius RB (1016 cm) 22 60 70 11Variability timescale δtmin
var (hr) 74 221 211 294
Weighted sum of squared residuals to VERITAS flare data 71 09 07 62Weighted sum of squared residuals to Fermi-LAT flare data 16 16 13 14Total weighted sum of squared residuals 87 25 19 76
Notes All SSC models require very low magnetic fields far below the value expected from equipartition (ie εB 1) Theweighted sum of squared residuals to the VERITAS and Fermi-LAT data and the total value for the combined data set areincluded at the bottom of the table The best agreement between the model and the data is obtained when the source is at redshiftz = 02ndash03
12
The Astrophysical Journal 72643 (14pp) 2011 January 1 Abdo et al
Table 5Parameters Used for the EC+SSC Model Fits Displayed in Figure 8
Model Parameter z = 01 z = 02 z = 03 z = 0444
Low-energy cutoff γmin 55 times 103 70 times 103 65 times 103 60 times 103
High-energy cutoff γmax 12 times 105 1512 times 105 1512 times 105 1512 times 105
Injection index q 30 30 30 30Injection luminosity Le (1044 erg sminus1) 11 42 60 104Comoving magnetic field B (G) 035 022 021 023Poynting flux LB (1043 erg sminus1) 10 24 60 112εB equiv LBLe 010 006 010 011Doppler factor D 30 30 40 50Plasmoid radius RB (1016 cm) 05 12 15 15Variability timescale δtmin
var (hr) 17 44 45 40Ext radiation energy density (10minus6 erg cmminus3) 54 24 12 13
Weighted sum of squared residuals to VERITAS flare data 48 36 79 157Weighted sum of squared residuals to Fermi-LAT flare data 10 12 08 15Total weighted sum of squared residuals 58 48 87 172
Notes These model fits require magnetic fields closer to equipartition and allow for the intra-night variability observedin the optical data The weighted sum of squared residuals to the VERITAS and Fermi-LAT data and the total value forthe combined data set are included at the bottom of the table
and for magnetic fields within about an order of magnitudeof though still below equipartition It is worth noting that theresults presented here agree with the findings following the(E gt 200 GeV) flare of blazar W Comae (also an ISP) in 2008March (Acciari et al 2008a) In both cases the high opticalluminosity is expected to play a key role in providing the seedpopulation for IC scattering
Intermediate synchrotron peaked blazars like 3C 66A are wellsuited for simultaneous observations by Fermi-LAT and ground-based IACTs like VERITAS Relative to the sensitivities ofthese instruments ISPs are bright enough to allow for time-resolved spectral measurements in each band during flaringepisodes These types of observations coupled with extensivemulti-wavelength coverage at lower energies will continue toprovide key tests of blazar emission models
The Fermi-LAT Collaboration acknowledges generous ongo-ing support from a number of agencies and institutes that havesupported both the development and the operation of the LATas well as scientific data analysis These include the NationalAeronautics and Space Administration and the Department ofEnergy in the United States the Commissariat a lrsquoEnergie Atom-ique and the Centre National de la Recherche ScientifiqueInstitut National de Physique Nucleaire et de Physique desParticules in France the Agenzia Spaziale Italiana and theIstituto Nazionale di Fisica Nucleare in Italy the Ministry ofEducation Culture Sports Science and Technology (MEXT)High Energy Accelerator Research Organization (KEK) andJapan Aerospace Exploration Agency (JAXA) in Japan and theK A Wallenberg Foundation the Swedish Research Coun-cil and the Swedish National Space Board in Sweden Ad-ditional support for science analysis during the operationsphase is gratefully acknowledged from the Istituto Nazionale diAstrofisica in Italy and the Centre National drsquoEtudes Spatiales inFrance
The VERITAS collaboration acknowledges the generous sup-port from the US Department of Energy the US National Sci-ence Foundation and the Smithsonian Institution by NSERCin Canada by Science Foundation Ireland and by STFC inUK The VERITAS collaboration also acknowledges the excel-
lent work of the technical support staff at the FLWO and thecollaborating institutions in the construction and operation ofthe instrument as well as support from the NASASwift guestinvestigator program (grant NNX08AU13G) for the Swift ob-servations
PAIRITEL is operated by the Smithsonian AstrophysicalObservatory (SAO) and was made possible by a grant fromthe Harvard University Milton Fund a camera loan from theUniversity of Virginia and continued support of the SAO andUC Berkeley The PAIRITEL project is further supported byNASASwift Guest Investigator grant NNG06GH50G Thisresearch is partly based on observations with the 100 m telescopeof the MPIfR (Max-Planck-Institut fur Radioastronomie) atEffelsberg and has also made use of observations with the IRAM30 m telescope The Metsahovi team acknowledges the supportfrom the Academy of Finland The Abastumani Observatoryteam acknowledges financial support by the Georgian NationalScience Foundation through grant GNSFST084-404 The StPetersburg University team acknowledges support from RussianRFBR foundation via grant 09-02-00092 AZT-24 observationsare made within an agreement between Pulkovo Rome andTeramo observatories
L C Reyes acknowledges the support by the Kavli Institutefor Cosmological Physics at the University of Chicago throughgrants NSF PHY-0114422 and NSF PHY-0551142 and anendowment from the Kavli Foundation and its founder FredKavli M Bottcher acknowledges support from NASA throughChandra Guest Investigator Grant GO8-9100X Some of theVERITAS simulations used in this work have been performedon the joint Fermilab-KICP supercomputing cluster supportedby grants from Fermilab the Kavli Institute for CosmologicalPhysics and the University of Chicago
REFERENCES
Abdo A A et al 2009a Science 325 848Abdo A A et al 2009b ApJ 707 1310Abdo A A et al 2010a ApJS 188 405Abdo A A et al 2010b ApJ 710 1271Abdo A A et al 2010c ApJ 716 30Acciari V A et al 2008a ApJ 684 L73
13
The Astrophysical Journal 72643 (14pp) 2011 January 1 Abdo et al
Acciari V A et al 2008b ApJ 679 1427Acciari V A et al 2009 ApJ 693 L104Aliu E et al 2009 ApJ 692 L29Angelakis E Fuhrmann L Marchili N Krichbaum T P amp Zensus J A
2008 Mem Soc Astron Ital 79 1042Arnaud K A 1996 in ASP Conf Ser 101 Astronomical Data Analysis
Software and Systems V ed G H Jacoby amp J Barnes (San FranciscoCA ASP) 17
Atwood W B et al 2009 ApJ 697 1071Bennett A S 1962 Mem R Astron Soc 68 163Bloom J S Starr D L Blake C H Skrutskie M F amp Falco E E 2006
in ASP Conf Ser 351 Astronomical Data Analysis Software and SystemsXV ed C Gabriel C Arviset D Ponz amp S Enrique (San Francisco CAASP) 751
Bottcher M 2007 ApampSS 309 95Bottcher M amp Chiang J 2002 ApJ 581 127Bottcher M amp Dermer C D 2002 ApJ 564 86Bottcher M et al 2009 ApJ 694 174Bramel D A et al 2005 ApJ 629 108Britzen S et al 2007 AampA 472 763Britzen S et al 2008 AampA 484 119Cavaliere A amp DrsquoElia V 2002 ApJ 571 226Dermer C D amp Schlickeiser R 1993 ApJ 416 458Dickey J M amp Lockman F J 1990 ARAampA 28 215Edelson R A amp Krolik J H 1988 ApJ 333 646Finke J D Razzaque S amp Dermer C D 2010 ApJ 712 238Finke J D Shields J C Bottcher M amp Basu S 2008 AampA 477
513Fitzpatrick E L 1999 PASP 111 63Franceschini A Rodighiero G amp Vaccari M 2008 AampA 487 837Fuhrmann L Zensus J A Krichbaum T P Angelakis E amp Readhead A
C S 2007 in AIP Conf Proc 921 The First GLAST Symposium ed SRitz P Michelson amp C A Meegan (Melville NY AIP) 249
Fuhrmann L et al 2008 AampA 490 1019Gehrels N et al 2004 ApJ 611 1005Georganopoulos M amp Kazanas D 2003 ApJ 594 L27Georganopoulos M amp Kazanas D 2004 ApJ 604 L81Ghisellini G amp Madau P 1996 MNRAS 280 67Ghisellini G Tavecchio F amp Chiaberge M 2005 AampA 432 401Gilmore R C Madau P Primack J R Somerville R S amp Haardt F
2009 MNRAS 399 1694Hartman R C et al 1999 ApJS 123 79Henri G amp Sauge L 2006 ApJ 640 185Jorstad S G Marscher A P Mattox J R Wehrle A E Bloom S D amp
Yurchenko A V 2001 ApJS 134 181Joshi M amp Bottcher M 2007 ApJ 662 884
Kataoka J et al 1999 Astropart Phys 11 149Kerrick A D et al 1995 ApJ 452 588Kinney A L Bohlin R C Blades J C amp York D G 1991 ApJS 75
645Kuiper L Hermsen W Verbunt F Thompson D J Stairs I H Lyne A
G Strickman M S amp Cusumano G 2000 AampA 359 615Larionov V M et al 2008 ATel 1755 1Li T-P amp Ma Y-Q 1983 ApJ 272 317Mackay C D 1971 MNRAS 154 209Marscher A P Jorstad S G Mattox J R amp Wehrle A E 2002 ApJ 577
85Mattox J R et al 1996 ApJ 461 396Miller J S French H B amp Hawley S A 1978 Proc Pittsburgh Conf on
BL Lac Objects ed A M Wolfe 176Mucke A Protheroe R J Engel R Rachen J P amp Stanev T 2003
Astropart Phys 18 593Northover K J E 1973 MNRAS 165 369Oke J B et al 1995 PASP 107 375Piner B G Pant N amp Edwards P G 2008 ApJ 678 64Poole T S et al 2008 MNRAS 383 627Prandini E Bonnoli G Maraschi L Mariotti M amp Tavecchio F 2010
MNRAS 405 L76Reimer A Joshi M amp Bottcher M 2008 in AIP Conf Ser 1085 High
Energy Gamma-Ray Astronomy ed F A Aharonian W Hofmann amp FRieger (Melville NY AIP) 502
Savolainen T Homan D C Hovatta T Kadler M Kovalev Y Y ListerM L Ros E amp Zensus J A 2010 AampA 512 A24
Schlegel D J Finkbeiner D P amp Davis M 1998 ApJ 500 525Sikora M Begelman M C amp Rees M J 1994 ApJ 421 153Smith H E Smith E O amp Spinrad H 1976 PASP 88 621Stecker F W Malkan M A amp Scully S T 2006 ApJ 648 774 (erratum
658 1392 [2007])Swordy S 2008 ATel 1753 1Tavecchio F amp Ghisellini G 2009 MNRAS 394 L131Taylor G B Vermeulen R C Readhead A C S Pearson T J Henstock
D R amp Wilkinson P N 1996 ApJS 107 37Thompson D J et al 1993 ApJS 86 629Tosti G 2008 ATel 1759 1Urry C M amp Padovani P 1995 PASP 107 803Villata M et al 2008 AampA 481 L79Villata M et al 2009 AampA 504 L9Weekes T C 2000 in AIP Conf Ser 515 GeVndashTeV Gamma Ray Astrophysics
Workshop Towards a Major Atmospheric Cherenkov Detector VI ed B LDingus M H Salamon amp D B Kieda (Melville NY AIP) 3
Wills B J amp Wills D 1974 ApJ 190 L97Wurtz R Stocke J T amp Yee H K C 1996 ApJS 103 109
14

The Astrophysical Journal 72643 (14pp) 2011 January 1 Abdo et al
80 Columbia Astrophysics Laboratory Columbia University New York NY 10027 USA81 INAF Osservatorio Astronomico di Torino Italy
82 Harvard-Smithsonian Center for Astrophysics MA USA83 Astronomical Institute St Petersburg State University Russia
84 Pulkovo Observatory Russia85 Isaac Newton Institute of Chile St Petersburg Branch Russia
86 Abastumani Observatory Mt Kanobili 0301 Abastumani Georgia87 Department of Astronomy University of Michigan MI USA
88 Metsahovi Radio Observatory Helsinki University of Technology TKK Finland89 Institute of Astronomy National Central University Taiwan
90 Tuorla Observatory Department of Physics and Astronomy University of Turku Finland91 Instituto de Astrofısica de Andalucıa CSIC Spain
92 Max-Planck-Institut fur Radioastronomie Germany93 Institute of Astronomy Bulgarian Academy of Sciences Bulgaria
94 Circolo Astrofili Talmassons Italy95 Instituto de Astronomıa Universidad Nacional Autonoma de Mexico Apdo Postal 70-265 CP 04510 Mexico DF Mexico
96 INAF Osservatorio Astrofisico di Catania Italy97 Astrophysical Institute Department of Physics and Astronomy Ohio University OH USA
98 Osservatorio Astronomico della Regione Autonoma Valle drsquoAosta Italy99 Armenzano Astronomical Observatory Italy
100 INAF Osservatorio Astronomico di Roma Italy101 INAF Osservatorio Astronomico di Collurania Teramo Italy
102 Agrupacio Astronomica de Sabadell Spain103 ZAH Landessternwarte Heidelberg Konigstuhl D-69117 Heidelberg Germany
104 Instituto de Astronomıa Universidad Nacional Autonoma deMexico Apdo Postal 877 CP 22800 Ensenada B C Mexico105 Institute for Astrophysical Research Boston University MA USA
106 DLR Institute of Planetary Research Rutherfordstr 2 D-12489 Berlin Germany107 INAOE Apdo Postal 51 amp 216 72000 Tonantzintla Puebla Mexico
108 Finnish Centre for Astronomy with ESO (FINCA) University of TurkuVaisalantie 20 FI-21500 Piikkio Finland109 Department of Physics University of Colorado Denver CO USA
110 INAF-Osservatorio Astronomico di Brera via E Bianchi 46 I-23807 Merate Italy111 Department of Astrophysical Sciences Princeton University Princeton NJ 08544 USA
112 Department of Astronomy University of California Berkeley CA 94720-3411 USA113 Max-Planck-Institut fur Radioastronomie Auf dem Hugel 69 D-53121 Bonn Germany
114 Department of Astronomy and Astrophysics University of California 1156 High Street Santa Cruz CA 95064 USA115 Landessternwarte Universitat HeidelbergKonigstuhl 12 D-69117 Heidelberg Germany
116 UCOLick Observatory University of California 1156 High Street Santa Cruz CA 95064 USA117 Institut de Radio Astronomie Millimetrique Avenida Divina Pastora 7 Local 20 E-18012 Granada Spain
Received 2010 June 17 accepted 2010 October 29 published 2010 December 14
ABSTRACT
The BL Lacertae object 3C 66A was detected in a flaring state by the Fermi Large Area Telescope (LAT) andVERITAS in 2008 October In addition to these gamma-ray observations F-GAMMA GASP-WEBT PAIRITELMDM ATOM Swift and Chandra provided radio to X-ray coverage The available light curves show variabilityand in particular correlated flares are observed in the optical and Fermi-LAT gamma-ray band The resultingspectral energy distribution can be well fitted using standard leptonic models with and without an external radiationfield for inverse Compton scattering It is found however that only the model with an external radiation field canaccommodate the intra-night variability observed at optical wavelengths
Key words BL Lacertae objects individual (3C 66A) ndash galaxies active ndash gamma rays galaxies
1 INTRODUCTION
The radio source 3C 66 (Bennett 1962) was shown by Mackay(1971) and Northover (1973) to actually consist of two unrelatedradio sources separated by 011 a compact source (3C 66A)and a resolved galaxy (3C 66B) 3C 66A was subsequentlyidentified as a quasi-stellar object by Wills amp Wills (1974) andas a BL Lacertae object by Smith et al (1976) based on its opticalspectrum 3C 66A is now a well-known blazar which like otheractive galactic nuclei (AGNs) is thought to be powered by
118 Royal Swedish Academy of Sciences Research Fellow funded by a grantfrom the K A Wallenberg Foundation119 Partially supported by the International Doctorate on Astroparticle Physics(IDAPP) program120 Now at DESY Platanenallee 6 D-15738 Zeuthen Germany121 Now at Institut fur Physik und Astronomie Universitat Potsdam D-14476Potsdam-GolmGermany DESY Platanenallee 6 D-15738 Zeuthen Germany122 Now at Los Alamos National Laboratory MS H803 Los Alamos NM87545 USA
accretion of material onto a supermassive black hole located inthe central region of the host galaxy (Urry amp Padovani 1995)Some AGNs present strong relativistic outflows in the formof jets where particles are believed to be accelerated to ultra-relativistic energies and gamma rays are subsequently producedBlazars are the particular subset of AGNs with jets aligned tothe observerrsquos line of sight Indeed the jet of 3C 66A has beenimaged using very long baseline interferometry (VLBI Tayloret al 1996 Jorstad et al 2001 Marscher et al 2002 Britzen et al2007) and superluminal motion has been inferred (Jorstad et al2001 Britzen et al 2008) This is indicative of the relativisticLorentz factor of the jet and its small angle with respect to theline of sight
BL Lacs are known for having very weak (if any) detectableemission lines which makes determination of their redshift quitedifficult The redshift of 3C 66A was reported as z = 0444 byMiller et al (1978) and also (although tentatively) by Kinneyet al (1991) Each measurement however is based on the
3
The Astrophysical Journal 72643 (14pp) 2011 January 1 Abdo et al
measurement of a single line and is not reliable (Bramel et al2005) Recent efforts (described in Section 25) to providefurther constraints have proven unsuccessful
Similar to other blazars the spectral energy distribution(SED) of 3C 66A has two pronounced peaks which suggeststhat at least two different physical emission processes are atwork (eg Joshi amp Bottcher 2007) The first peak extendingfrom radio to soft X-ray frequencies is likely due to synchrotronemission from high-energy electrons while different emissionmodels have been proposed to explain the second peak whichextends up to gamma-ray energies Given the location of itssynchrotron peak (1015 Hz) 3C 66A is further sub-classifiedas an intermediate synchrotron peaked (ISP) blazar (Abdo et al2010c)
The models that have been proposed to explain gamma-rayemission in blazars can be roughly categorized into leptonicor hadronic depending on whether the accelerated particlesresponsible for the gamma-ray emission are primarily electronsand positrons (hereafter ldquoelectronsrdquo) or protons In leptonicmodels high-energy electrons produce gamma rays via inverseCompton (IC) scattering of low-energy photons In synchrotronself-Compton (SSC) models the same population of electronsresponsible for the observed gamma rays generates the low-energy photon field through synchrotron emission In externalCompton (EC) models the low-energy photons originate outsidethe emission volume of the gamma rays Possible sources oftarget photons include accretion-disk photons radiated directlyinto the jet (Dermer amp Schlickeiser 1993) accretion-diskphotons scattered by emission-line clouds or dust into the jet(Sikora et al 1994) synchrotron radiation re-scattered backinto the jet by broad-line emission clouds (Ghisellini amp Madau1996) jet emission from an outer slow jet sheet (Ghiselliniet al 2005) or emission from faster or slower portions of the jet(Georganopoulos amp Kazanas 2004) In hadronic models gammarays are produced by high-energy protons either via protonsynchrotron radiation (Mucke et al 2003) or via secondaryemission from photo-pion and photo-pair-production reactions(see Bottcher (2007) and references therein for a review of blazargamma-ray emission processes)
One of the main obstacles in the broadband study of gamma-ray blazars is the lack of simultaneity or at least contempo-raneousness of the data at the various wavelengths At highenergies the situation is made even more difficult due to thelack of objects that can be detected by MeVGeV and TeV ob-servatories on comparable timescales Indeed until recently theknowledge of blazars at gamma-ray energies had been obtainedfrom observations performed in two disjoint energy regimes (1)the high-energy range (20 MeVlt E lt 10 GeV) studied in the1990s by EGRET (Thompson et al 1993) and (2) the very highenergy (VHE) regime (E gt 100 GeV) observed by ground-basedinstruments such as imaging atmospheric Cherenkov telescopes(IACTs Weekes 2000) Only123 Markarian 421 was detected byboth EGRET and the first IACTs (Kerrick et al 1995) Further-more blazars detected by EGRET at MeVGeV energies arepredominantly flat-spectrum radio quasars (FSRQs) while TeVblazars are to date predominantly BL Lacs It is important tounderstand these observational differences since they are likelyrelated to the physics of the AGN (Cavaliere amp DrsquoElia 2002) orto the evolution of blazars over cosmic time (Bottcher amp Dermer2002)
123 Markarian 501 was marginally detected by EGRET only during a fewmonths in 1996 (Kataoka et al 1999)
The current generation of gamma-ray instruments (AGILEFermi HESS MAGIC and VERITAS) is closing the gapbetween the two energy regimes due to improved instrumentsensitivities leading us toward a deeper and more completecharacterization of blazars as high-energy sources and as apopulation (Abdo et al 2009b) An example of the successfulsynergy of space-borne and ground-based observatories isprovided by the joint observations of 3C 66A by the FermiLAT and the Very Energetic Radiation Imaging Telescope ArraySystem (VERITAS) during its strong flare of 2008 OctoberThe flare was originally reported by VERITAS (Swordy 2008Acciari et al 2009) and soon after contemporaneous variabilitywas also detected at optical to infrared wavelengths (Larionovet al 2008) and in the Fermi-LAT energy band (Tosti 2008)Follow-up observations were obtained at radio optical andX-ray wavelengths in order to measure the flux and spectralvariability of the source across the electromagnetic spectrumand to obtain a quasi-simultaneous SED This paper reports theresults of this campaign including the broadband spectrum anda model interpretation of this constraining SED
2 OBSERVATIONS AND DATA ANALYSIS
21 VERITAS
VERITAS is an array of four 12 m diameter imagingCherenkov telescopes in southern Arizona USA (Acciari et al2008b) 3C 66A was observed with VERITAS for 14 hr from2007 September through 2008 January and for 46 hr between2008 September and 2008 November These observations (here-after 2007 and 2008 data) add up to sim328 hr of live time afterdata quality selection The data were analyzed following theprocedure described in Acciari et al (2008b)
As reported in Acciari et al (2009) the average spectrummeasured by VERITAS is very soft yielding a photon index Γof 41 plusmn04stat plusmn 06sys when fitted to a power law dNdE propEminusΓ The average integral flux above 200 GeV measured byVERITAS is (13 plusmn 01) times 10minus11 cmminus2 sminus1 which correspondsto 6 of the Crab Nebularsquos flux above this threshold In additiona strong flare with night-by-night VHE-flux variability wasdetected in 2008 October For this analysis the VERITASspectrum is calculated for the short time interval 2008 October8ndash10 (MJD 54747ndash54749 hereafter flare period) and for alonger period corresponding to the dark run124 where most of theVHE emission from 3C 66A was detected (MJD 54734ndash54749)It should be noted that the flare and dark run intervals overlapand are therefore not independent Table 1 lists the relevantinformation from each data set
As shown in Figure 1 the flare and dark run spectra are verysoft yielding nearly identical photon indices of 41 plusmn 06stat plusmn06sys entirely consistent with that derived from the full 2007and 2008 data set The integral flux above 200 GeV for theflare period is (25 plusmn 04) times 10minus11 cmminus2 sminus1 while the averageflux for the dark run period is (14 plusmn 02) times 10minus11 cmminus2 sminus1The extragalactic background light (EBL) de-absorbed spectralpoints for the dark run calculated using the optical depth valuesof Franceschini et al (2008) and assuming a nominal redshiftof z = 0444 are also shown in Figure 1 These points are wellfitted by a power-law function with Γ = 19 plusmn 05
124 IACTs like VERITAS do not operate on nights with bright moonlight Theseries of nights between consecutive bright moonlight periods is usuallyreferred to as a dark run
4
The Astrophysical Journal 72643 (14pp) 2011 January 1 Abdo et al
Table 1Results from VERITAS Observations of 3C 66A
Interval Live Time (hr) Non Noff Alpha Excess Significance (σ )
Flare 60 1531 7072 0121 6783 180Dark run 212 3888 20452 0125 13315 2222007 and 2008 281 7257 31201 0175 1791 211
Notes Live time corresponds to the effective exposure time after accountingfor data quality selection Non (Noff ) corresponds to the number of on (off)-source events passing background-rejection cuts Alpha is the normalizationof off-source events and the excess is equal to Non minus αNoff The significanceis expressed in number of standard deviations and is calculated according toEquation (17) of Li amp Ma (1983) See Acciari et al (2009) for a completedescription of the VERITAS analysis
22 Fermi-LAT
The LAT on board the Fermi Gamma-ray Space Telescope isa pair-conversion detector sensitive to gamma rays with energiesbetween 20 MeV and several hundred GeV (Atwood et al 2009)Since launch the instrument has operated almost exclusively insky survey mode covering the whole sky every 3 hr The overallcoverage of the sky is fairly uniform with exposure variations of 15 around the mean value The LAT data are analyzed usingScienceTools v9r15p5 and instrument response functions P6V3(available via the Fermi science support center125) Only photonsin the diffuse event class are selected for this analysis because oftheir reduced charged-particle background contamination andvery good angular reconstruction A zenith angle lt105 cut ininstrument coordinates is used to avoid gamma rays from theEarth limb The diffuse emission from the Galaxy is modeledusing a spatial model (gll iem v02fit) which was refinedwith Fermi-LAT data taken during the first year of operationThe extragalactic diffuse and residual instrumental backgroundsare modeled as an isotropic component and are included inthe fit126 The data are analyzed with an unbinned maximumlikelihood technique (Mattox et al 1996) using the likelihoodanalysis software developed by the LAT team
Although 3C 66A was detected by EGRET as source 3EGJ0222+4253 (Hartman et al 1999) detailed spatial and timinganalyses by Kuiper et al (2000) showed that this EGRETsource actually consists of the superposition of 3C 66A andthe nearby millisecond pulsar PSR J0218+4232 which is 096distant from the blazar This interpretation of the EGRET datais verified by Fermi-LAT whose improved angular resolutionpermits the clear separation of the two sources as shown inFigure 2 Furthermore the known pulsar period is detectedwith high confidence in the Fermi-LAT data (Abdo et al2009a) More importantly for this analysis the clear separationbetween the pulsar and the blazar enables studies of eachsource independently in the maximum likelihood analysis andthus permits an accurate determination of the spectrum andlocalization of each source with negligible contamination
Figure 2 also shows the localization of the Fermi andVERITAS sources with respect to blazar 3C 66A and radiogalaxy 3C 66B (see caption in Figure 2 for details) It is clearfrom the map that the Fermi-LAT and VERITAS localizationsare consistent and that the gamma-ray emission is confidentlyassociated with the blazar and not with the radio galaxy Somesmall contribution in the Fermi-LAT data from radio galaxy3C 66B as suggested by Aliu et al (2009) and Tavecchio amp
125 httpfermigsfcnasagovsscdataanalysisscitoolsoverviewhtml126 httpfermigsfcnasagovsscdataaccesslatBackgroundModelshtml
Energy (MeV)
210 310 410 510 610
)minus
1 s
minus2
(M
eV
cm
νFν
minus710
minus610
minus510
minus410
minus310
)minus
1 s
minus2
(e
rgs
cm
νFν
minus1210
minus1110
minus1010
minus910
intervalflareminusLATFermi intervaldark runminusLATFermi
minusLAT 6minusmonths average spectrumFermi
intervalflareVERITAS
intervaldarkrunVERITAS
VERITAS average spectrum 2007minus2008
(z=0444) dark runDeminusabsorbed VERITAS
(z=03) dark runDeminusabsorbed VERITAS
Figure 1 Gamma-ray SED of 3C 66A including Fermi-LAT and VERITASdata for the flare (red symbols) and dark run (blue symbols) intervals TheFermi-LAT spectra are also shown here as ldquobutterflyrdquo contours (solid lines)describing the statistical error on the spectrum (Abdo et al 2009b) Thepreviously reported Fermi-LAT six-month-average spectrum (Abdo et al 2010b)is also shown here (green circles) and is lower than the spectrum obtained duringthe campaign The average 2007ndash2008 VERITAS spectrum originally reportedin Acciari et al (2009) is displayed with green triangles In all cases theupper limits are calculated at 95 confidence level The de-absorbed dark runspectra obtained using the optical depth values of Franceschini et al (2008)are also shown as open circles and open squares for redshifts of 0444 and 03respectively
Ghisellini (2009) cannot be excluded given the large spillover oflow-energy photons from 3C 66A at the location of 3C 66B Thisis due to the long tails of the Fermi-LAT point-spread function atlow energies as described in Atwood et al (2009) Neverthelessconsidering only photons with energy E gt 1 GeV the upperlimit (95 confidence level) for a source at the location of 3C66B is 29 times 10minus8 cmminus2 sminus1 for the dark run period (with a teststatistic127 (TS) = 13) For the 11 months of data correspondingto the first Fermi-LAT catalog (Abdo et al 2010a) the upperlimit is 49 times 10minus9 cmminus2 sminus1 (TS = 58)
As in the analysis of the VERITAS observations the Fermi-LAT spectrum is calculated for the flare and for the darkrun periods The Fermi flare period flux F (E gt100 MeV) =(50 plusmn 14stat plusmn 03sys) times 10minus7 cmminus2 sminus1 is consistent withinerrors with the dark run flux of (39 plusmn 05stat plusmn 03sys) times10minus7 cmminus2 sminus1 In both cases the Fermi-LAT spectrum is quitehard and can be described by a power law with a photon indexΓ of 18 plusmn 01stat plusmn 01sys and 19 plusmn 01stat plusmn 01sys in the flareperiod and dark run intervals respectively Both spectra areshown in the high-energy SED in Figure 1
23 Chandra
3C 66A was observed by the Chandra observatory on 2008October 6 for a total of 376 ks with the Advanced CCD ImagingSpectrometer (ACIS) covering the energy band between 03and 10 keV The source was observed in the continuousclocking mode to avoid pile-up effects Standard analysis tools(CIAO 41) and calibration files (CALDB v350) provided bythe Chandra X-ray center128 are used
The time-averaged spectrum is obtained and re-binned to en-sure that each spectral channel contains at least 25 background-subtracted counts This condition allows the use of the χ2
127 The test statistic (TS) value quantifies the probability of having a pointsource at the location specified It is roughly the square of the significancevalue a TS of 25 corresponds to a signal of approximately 5 standarddeviations (Abdo et al 2010a)128 httpcxcharvardeduciao
5
The Astrophysical Journal 72643 (14pp) 2011 January 1 Abdo et al
Figure 2 Smoothed count map of the 3C 66A region as seen by Fermi-LAT between 2008 September 1 and December 31 with E gt 100 MeV The color bar hasunits of counts per pixel and the pixel dimensions are 01 times 01 The contour levels have been smoothed and correspond to 28 52 and 76 counts per pixel Thelocations of 3C 66A and 3C 66B (a radio galaxy that is 011 away) are shown as a cross and as a diamond respectively The location of millisecond pulsar PSR0218+4232 is also indicated with a white cross The magenta circle represents the VERITAS localization of the VHE source (RA DEC) = (2h22m41s6 plusmn 1s7stat plusmn6s0sys 4302prime35primeprime5 plusmn 21primeprime
stat plusmn 1prime30primeprimesys) as reported in Acciari et al (2009) The blue interior circle represents the 95 error radius of the Fermi-LAT localization
(RA DEC) = (02h22m40s3 plusmn 4s5 4302prime18primeprime6 plusmn 42primeprime1) as reported in the Fermi-LAT first source catalog (Abdo et al 2010a) All positions are based on the J2000epoch
quality-of-fit estimator to find the best-fit model XSPEC v124(Arnaud 1996) is used for the spectral analysis and fitting proce-dure Two spectral models have been used to fit the data singlepower law and broken power law Each model includes galacticH i column density (NHGal = 899 times 1020 cmminus2) according toDickey amp Lockman (1990) where the photoelectric absorptionis set with the XSPEC model phabs129 An additional local H i
column density was also tried but in both cases the spectra wereconsistent with pure galactic density Consequently the columndensity has been fixed to the galactic value in each model andthe results obtained are presented in Table 2 An F-test wasperformed to demonstrate that the spectral fit improves signif-icantly when using the extra degrees of freedom of the brokenpower-law model Table 2 also contains the results of the F-test
24 Swift XRT and UVOT
Following the VERITAS detection of VHE emission from3C 66A Target of Opportunity (ToO) observations of 3C 66Awith Swift were obtained for a total duration of sim10 ks TheSwift satellite observatory comprises an UVndashOptical telescope(UVOT) an X-ray telescope (XRT) and a Burst Alert Telescope(Gehrels et al 2004) Data reduction and calibration of the XRT
129 httpheasarcgsfcnasagovdocssoftwarelheasoftxanaduxspecmanualXSmodelPhabshtml
data are performed with HEASoft v65 standard tools AllXRT data presented here are taken in photon counting modewith negligible pile-up effects The X-ray spectrum of eachobservation is fitted with an absorbed power law using a fixedGalactic column density from Dickey amp Lockman (1990)which gives good χ2 values for all observations The measuredphoton spectral index ranges between 25 and 29 with a typicalstatistical uncertainty of 01
UVOT obtained data through each of six color filters VB and U together with filters defining three ultraviolet pass-bands UVW1 UVM2 and UVW2 with central wavelengths of260 nm 220 nm and 193 nm respectively The data are cal-ibrated using standard techniques (Poole et al 2008) and cor-rected for Galactic extinction by interpolating the absorptionvalues from Schlegel et al (1998) (EBminusV = 0083 mag) withthe galactic spectral extinction model of Fitzpatrick (1999)
25 Optical to Infrared Observations
The R magnitude of the host galaxy of 3C 66A is sim 19in the optical band (Wurtz et al 1996) Its contribution isnegligible compared to the typical AGN magnitude of R 15 therefore host-galaxy correction is not necessary
GASP-WEBT 3C 66A is continuously monitored by tele-scopes affiliated to the GLAST-AGILE support program of theWhole Earth Blazar Telescope (GASP-WEBT see Villata et al
6
The Astrophysical Journal 72643 (14pp) 2011 January 1 Abdo et al
Figure 3 3C 66A light curves covering 2008 August 22 to December 31 inorder of increasing wavelength The VERITAS observations are combined toobtain nightly flux values and the dashed and dotted lines represent the averageflux measured from the 2007 and 2008 data and its standard deviation TheFermi-LAT light curves contain time bins with a width of 3 days The averageflux and average photon index measured by Fermi-LAT during the first sixmonths of science operations are shown as horizontal lines in the respectivepanels In all cases the Fermi-LAT photon index is calculated over the 100MeV to 200 GeV energy range The long-term light curves at optical andinfrared wavelengths are presented in the two bottom panels In the bottompanel GASP-WEBT and PAIRITEL observations are represented by open andsolid symbols respectively
2008 2009) These observations provide a long-term light curveof this object with complete sampling as shown in Figure 3During the time interval in consideration (MJD 54700ndash54840)several observatories (Abastumani Armenzano Crimean ElVendrell LrsquoAmpolla Lulin New Mexico Skies Roque de losMuchachos (KVA) Rozhen Sabadell San Pedro Martir St Pe-tersburg Talmassons Teide (BRT) Torino Tuorla and Valledrsquo Aosta) contributed photometric observations in the R bandData in the J H and K bands were taken at the Campo Imper-atore observatory A list of the observatories and their locationsis available in Table 3
MDM Following the discovery of VHE emission 3C 66Awas observed with the 13 m telescope of the MDM Observatoryduring the nights of 2008 October 6ndash10 A total of 290 scienceframes in U B V and R bands (58 each) were taken throughoutthe entire visibility period (approx 430 ndash 1000 UT) duringeach night The light curves which cover the time around theflare are presented in Figure 4
ATOM Optical observations for this campaign in the R bandwere also obtained with the 08 m optical telescope ATOM
Figure 4 3C 66A light curves covering the period centered on the gamma-ray flare (2008 October 1ndash10) The VERITAS and Fermi-LAT panels werealready described in the caption of Figure 3 Swift Target-of-Opportunity(ToO) observations (panels 3ndash5 from the top) were obtained following thediscovery of VHE emission by VERITAS (Swordy 2008) Swift-UVOT andMDM observations are represented by open and solid symbols respectivelyThe optical light curve in panel 6 from the top displays intra-night variabilityAn example is identified in the plot when a rapid decline of the optical flux byΔFΔt sim minus02 mJy hrminus1 is observed on MJD 54747
in Namibia which monitors this source periodically Twentyphotometric observations are available starting on MJD 54740and are shown in Figures 3 and 4
PAIRITEL Near-infrared observations in the J H and Kswere obtained following the VHE flare with the 13 m PetersAutomated Infrared Imaging Telescope (PAIRITEL see Bloomet al 2006) located at the Fred Lawrence Whipple ObservatoryThe resulting light curves using differential photometry withfour nearby calibration stars are shown in Figure 4
Keck The optical spectrum of 3C 66A was measured withthe LRIS spectrometer (Oke et al 1995) on the Keck I telescopeon the night of 2009 September 17 under good conditions Theinstrument configuration resulted in a full width half-maximumof sim250 km sminus1 over the wavelength range 3200ndash5500 Aring (blueside) and sim200 km sminus1 over the range 6350ndash9000 Aring (red side)A series of exposures totaling 110 s (blue) and 50 s (red) wereobtained yielding a signal-to-noise (SN) per resolution elementof sim250 and 230 for the blue and red cameras respectively Thedata were reduced with the LowRedux130 pipeline and calibratedusing a spectrophotometric star observed on the same night
130 httpwwwucolickorgsimxavierLowReduxindexhtml
7
The Astrophysical Journal 72643 (14pp) 2011 January 1 Abdo et al
Table 2Best-fit Model Parameters for a Fit Performed to the Chandra Data in the 1ndash7 keV Energy Range
Single Power-law Model
Γ Flux (10minus12 erg cmminus2 sminus1) χ2dof
299 plusmn 003 347 plusmn 006 121 (2326193)
Broken Power-law Model
Γ1 Γ2 Flux (10minus12 erg cmminus2 sminus1) Break (keV) χ2dof F-test Probability
308+03minus05 224+023
037 358+007minus008 33+05
minus03 097 (1852191) 347 times 10minus10
Notes The galactic NHGal value is fixed to 899 times 1020 cmminus2 the value of the galactic H i column density according toDickey amp Lockman (1990) Errors indicate the 90 confidence level
Table 3List of Ground-based Observatories that Participated in This Campaign
Observatory Location Web Page
Radio Observatories
Crimean Radio Obs Ukraine wwwcraocrimeauaEffelsberg Germany wwwmpifrdeenglishradiotelescopeIRAM Spain wwwiram-instituteorgEN30-meter-telescopephpMedicina Italy wwwmedirainafitMetsahovi Finland wwwmetsahovifienNoto Italy wwwnotoirainafitUMRAO Michigan USA wwwastrolsaumicheduobsradiotel
Infrared Observatories
Campo Imperatore Italy wwwoa-teramoinafitPAIRITEL Arizona USA wwwpairitelorgOptical ObservatoriesAbastumani Georgia wwwgenaoorgArmenzano Italy wwwwebaliceitdcarosatiATOM Namibia wwwlswuni-heidelbergdeprojectshessATOMCrimean Astr Obs Ukraine wwwcraocrimeauaEl Vendrell SpainKitt Peak (MDM) Arizona USA wwwastrolsaumicheduobsmdmLrsquoAmpolla SpainLulin Taiwan wwwlulinncuedutwenglishNew Mexico Skies Obs New Mexico USA wwwnmskiescomRoque (KVA) Canary Islands Spain wwwotriiacesenonthtmRozhen Bulgaria wwwastrobasbgrozhenhtmlSabadell Spain wwwastrosabadellorghtmlesobservatoriosabhtmSan Pedro Martir Mexico wwwastrosspunammxindexspmhtmlSt Petersburg Russia wwwgaospbruTalmassons Italy wwwcastfvgitTeide (BRT) Canary Islands Spain wwwtelescopeorgTorino Italy wwwtoastroitTuorla Finland wwwastroutufiValle drsquo Aosta Italy wwwoavdaitenglishosservatorio
Gamma-ray Observatory
VERITAS Arizona USA wwwveritassaoarizonaedu
Inspection of the 3C 66A spectrum reveals no spectral featuresaside from those imposed by Earthrsquos atmosphere and the MilkyWay (Ca H+K) Therefore these new data do not offer anyinsight on the redshift of 3C 66A and in particular are unableto confirm the previously reported value of z = 0444 (Milleret al 1978)
26 Radio Observations
Radio observations are available thanks to the F-GAMMA(Fermi-Gamma-ray Space Telescope AGN Multi-frequencyMonitoring Alliance) program which is dedicated to monthly
monitoring of selected Fermi-LAT blazars (Fuhrmann et al2007 Angelakis et al 2008) Radio flux density measurementswere conducted with the 100 m Effelsberg radio telescope at485 835 1045 and 1460 GHz on 2008 October 16 Thesedata are supplemented with an additional measurement at 86GHz conducted with the IRAM 30 m telescope (Pico VeletaSpain) on 2008 October 8 The data were reduced using stan-dard procedures described in Fuhrmann et al (2008) Additionalradio observations taken between 2008 October 5 and 15 (con-temporaneous to the flare period) are provided by the MedicinaMetsahovi Noto and UMRAO observatories all of which aremembers of the GASP-WEBT consortium
8
The Astrophysical Journal 72643 (14pp) 2011 January 1 Abdo et al
3 DISCUSSION
31 Light Curves
The resulting multi-wavelength light curves from this cam-paign are shown in Figure 3 for those bands with long-term cov-erage and in Figure 4 for those observations that were obtainedshortly before and after the gamma-ray flare The VERITASobservations are combined to obtain nightly (E gt 200 GeV)flux values since no evidence for intra-night variability is ob-served The highest flux occurred on MJD 54749 and significantvariability is observed during the whole interval (χ2 probabilityless than 10minus4 for a fit of a constant flux)
The temporal dependence of the Fermi-LAT photon index andintegral flux above 100 MeV and 1 GeV are shown with timebins with width of 3 days in Figure 3 For those time intervalswith no significant detection a 95 confidence flux upper limitis calculated The flux and photon index from the Fermi-LATfirst source catalog (Abdo et al 2010a) are shown as horizontallines for comparison These values correspond to the averageflux and photon index measured during the first 11 months ofFermi operations and thus span the time interval considered inthe figures It is evident from the plot that the VHE flare detectedby VERITAS starting on MJD 54740 is coincident with a periodof high flux in the Fermi energy band The photon index duringthis time interval is consistent within errors with the averagephoton index Γ = 195 plusmn 003 measured during the first sixmonths of the Fermi mission (Abdo et al 2010b)
Long-term and well-sampled light curves are available atoptical and near-infrared wavelengths thanks to observations byGASP-WEBT ATOM MDM and PAIRITEL Unfortunatelyradio observations were too limited to obtain a light curve andno statement about variability in this band can be made Thebest sampling is available for the R band for which variationswith a factor of 2 are observed in the long-term light curveFurthermore variability on timescales of less than a day isobserved as indicated in Figure 4 and as previously reportedby Bottcher et al (2009) following the WEBT (Whole EarthBlazar Telescope) campaign on 3C 66A in 2007 and 2008
The increase in gamma-ray flux observed in the Fermi bandseems contemporaneous with a period of increased flux in theoptical and to test this hypothesis the discrete correlationfunction (DCF) is used (Edelson amp Krolik 1988) Figure 5shows the DCF of the F(E gt 1 GeV) gamma-ray band withrespect to the R band with time-lag bins of 3 5 and 7 days Theprofile of the DCF is consistent for all time-lag bins indicatingthat the result is independent of bin size The DCF with time-lagbins of 3 days was fitted with a Gaussian function of the formDCF(τ ) = Cmax times exp (τ minus τ0)2σ 2 where Cmax is the peakvalue of the DCF τ0 is the delay timescale at which the DCFpeaks and σ parameterizes the Gaussian width of the DCF Thebest-fit function is plotted in Figure 5 and the best-fit parametersare Cmax = 11 plusmn 03 τ0 = (07 plusmn 07) days and σ = (33 plusmn07) days An identical analysis was also performed betweenthe F(E gt 100 MeV) and the R optical band with consistentresults This indicates a clear correlation between the Fermi-LAT and optical energy bands with a time lag that is consistentwith zero and not greater than sim5 days Despite the sparsity ofthe VERITAS light curve (due in part to the time periods whenthe source was not observable due to the full Moon) the DCFanalysis was also performed to search for correlations with eitherthe Fermi-LAT or optical data Apart from the overall increasein flux no significant correlations can be established The onsetof the E gt 200 GeV flare seems delayed by about sim5 days
Time lag [days]minus30 minus20 minus10 0 10 20 30
DC
F
minus1
minus05
0
05
1
15 Bin Size3 days
5 days
7 days
Figure 5 Discrete correlation function (DCF) of the F(E gt 1 GeV) gamma-raylight curve with respect to the R-band light curve A positive time lag indicatesthat the gamma-ray band leads the optical band Different symbols correspondto different bin sizes of time lag as indicated in the legend The profile of theDCF is independent of bin size and is well described by a Gaussian functionof the form DCF(τ ) = Cmax times exp (τ minus τ0)2σ 2 The fit to the 3-day bin sizedistribution is shown in the plot as a solid black line and the best-fit parametersare Cmax = 11 plusmn 03 τ0 = (07 plusmn 07) days and σ = (33 plusmn 07) days
with respect to the opticalndashGeV flare but given the coveragegaps no firm conclusion can be drawn (eg the flare could havebeen already underway when the observations took place) Nosuch lag is expected from the homogeneous model described inthe next section but could arise in models with complex energystratification and geometry in the emitting region
32 SED and Modeling
The broadband SED derived from these observations ispresented in Figure 6 and modeled using the code of Bottcher ampChiang (2002) In this model a power-law distribution of ultra-relativistic electrons andor pairs with lower and upper energycutoffs at γmin and γmax respectively and power-law index qis injected into a spherical region of comoving radius RB Theinjection rate is normalized to an injection luminosity Le whichis a free input parameter of the model The model assumesa temporary equilibrium between particle injection radiativecooling due to synchrotron and Compton losses and particleescape on a time tesc equiv ηesc RBc where ηesc is a scale parameterin the range sim250ndash500 Both the internal synchrotron photonfield (SSC) and external photon sources (EC) are considered astargets for Compton scattering The emission region is movingwith a bulk Lorentz factor Γ along the jet To reduce the numberof free parameters we assume that the jet is oriented with respectto the line of sight at the superluminal angle so that the Dopplerfactor is equal to D = (Γ [1 minus β cos θobs])
minus1 = Γ where θobs isthe angle of the jet with respect to the line of sight Given theuncertainty in the redshift determination of 3C 66A a range ofplausible redshifts namely z = 01 02 03 and the generallyused catalog value z = 0444 are considered for the modelingAll model fits include EBL absorption using the optical depthvalues from Franceschini et al (2008)
Most VHE blazars known to date are high synchrotron peaked(HSP) blazars whose SEDs can often be fitted satisfactorilywith pure SSC models Since the transition from HSP to ISP iscontinuous a pure SSC model was fitted first to the radio throughVHE gamma-ray SED Independently of the model underconsideration the low-frequency part of the SED (lt1020 Hz) iswell fitted with a synchrotron component as shown in Figure 6
9
The Astrophysical Journal 72643 (14pp) 2011 January 1 Abdo et al
Figure 6 Broadband SED of 3C 66A during the 2008 October multi-wavelength campaign The observation that corresponds to each set of data points is indicated inthe legend As an example the EBL-absorbed EC+SSC model for z = 03 is plotted here for reference A description of the model is provided in the text
For clarity only the high-frequency range is shown in Figures 7and 8 where the different models are compared As can beseen from the figures a reasonable agreement with the overallSED can be achieved for any redshift in the range exploredThe weighted sum of squared residuals has been calculatedfor the Fermi-LAT and VERITAS flare data (8 data points intotal) in order to quantify the scatter of the points with respectto the model and is shown in Table 4 The best agreement isachieved when the source is located at z sim 02ndash03 For lowerredshifts the model spectrum is systematically too hard whileat z = 0444 the model spectrum is invariably too soft as a resultof EBL absorption It should be noted that the EBL model ofFranceschini et al (2008) predicts some of the lowest opticaldepth values in comparison to other models (Finke et al 2010Gilmore et al 2009 Stecker et al 2006) Thus a model spectrumwith redshift of 03 or above would be even harder to reconcilewith the observations when using other EBL models
A major problem of the SSC models with z 01 is thatRB is of the order of 5 times 1016 cm This does not allowfor variability timescales shorter than 1 day which seemsto be in contrast with the optical variability observed on shortertimescales A smaller RB would require an increase in theelectron energy density (with no change in the magnetic fieldin order to preserve the flux level of the synchrotron peak) andwould lead to internal gammandashgamma absorption This problemcould be mitigated by choosing extremely high Doppler factorsD 100 However these are significantly larger than thevalues inferred from VLBI observations of Fermi-LAT blazars(Savolainen et al 2010)131 Moreover all SSC models requirevery low magnetic fields far below the value expected fromequipartition (εB = LBLe sim 10minus3 1) where LB is thePoynting flux derived from the magnetic energy density and Le
131 As a caveat jet models with a decelerating flow (Georganopoulos ampKazanas 2003 Piner et al 2008) or with inhomogeneous transverse structure(Ghisellini et al 2005 Henri amp Sauge 2006) can accommodate very highDoppler factors in the gamma-ray emitting region and still be consistent withthe VLBI observations of the large scale jet
is the energy flux of the electrons propagating along the jetTable 4 lists the parameters used for the SSC models displayedin Figure 7
Subsequently an external infrared radiation field with adhoc properties was included as a source of photons to beCompton scattered For all SSC+EC models shown in Figure 8the peak frequency of the external radiation field is set toνext = 14 times 1014 Hz corresponding to near-IR This adoptedvalue is high enough to produce E 100 GeV photons from ICscattering off the synchrotron electrons and at the same time isbelow the energy regime in which KleinndashNishina effects takeplace Although the weighted sums of squared residuals forEC+SSC models are generally worse than for pure SSC modelsreasonable agreement with the overall SED can still be achievedfor redshifts z 03 Furthermore all SSC+EC models areconsistent with a variability timescale of Δtvar sim 4 hr Thisis in better agreement with the observed variability at opticalwavelengths than the pure SSC interpretation Also while theSSC+EC interpretation still requires sub-equipartition magneticfields the magnetic fields are significantly closer to equipartitionthan in the pure SSC case with LBLe sim 01 The parametersof the SSC+EC models are listed in Table 5
Models with and without EC component yield the bestagreement with the SED if the source is located at a redshiftz sim 02ndash03 Of course this depends on the EBL model used inthe analysis An EBL model that predicts higher attenuation thanFranceschini et al (2008) would lead to a lower redshift rangeand make it even more difficult to have agreement betweenthe SED models and the data when the source is located atredshifts z 04 Finally it is worth mentioning that the redshiftrange z sim 02ndash03 is in agreement with previous estimates byFinke et al (2008) who estimate the redshift of 3C 66A to bez = 0321 based on the magnitude of the host galaxy and byPrandini et al (2010) who use an empirical relation betweenthe previously reported Fermi-LAT and IACTs spectral slopesof blazars and their redshifts to estimate the redshift of 3C 66Ato be below z = 034 plusmn 005
10
The Astrophysical Journal 72643 (14pp) 2011 January 1 Abdo et al
Figure 7 SSC models for redshifts z = 0444 03 02 and 01 from top to bottom The Fermi-LAT and VERITAS data points follow the same convention usedin Figures 1 and 6 to distinguish between flare (red) and dark run (blue) data points In each panel the EBL-absorbed model is shown as a solid red line and thede-absorbed model as a red dashed line De-absorbed VERITAS flare points are shown as open squares In all cases the optical depth values from Franceschini et al(2008) are used The best agreement between the model and the data is achieved when the source is located at z = 02ndash03 For lower redshifts the model spectrum issystematically too hard while at z = 0444 the model spectrum is too soft
A detailed study of hadronic versus leptonic modeling of the2008 October data will be published elsewhere but it is worthmentioning that the synchrotron proton blazar (SPB) model hasbeen used to adequately reproduce the quasi-simultaneous SEDobserved during the 2003ndash2004 multi-wavelength campaign(Reimer et al 2008) On that occasion rapid intra-day variationsdown to a 2 hr timescale were observed while during the2008 campaign presented here these variations seem less rapidQualitatively the longer timescale variations may be due toa lower Doppler beaming at the same time that a stronglyreprocessed proton synchrotron component dominates the highenergy output of this source
4 SUMMARY
Multi-wavelength observations of 3C 66A were carried outprompted by the gamma-ray outburst detected by the VERITASand Fermi observatories in 2008 October This marks the first
occasion that a gamma-ray flare is detected by GeV and TeVinstruments in comparable timescales The light curves obtainedshow strong variability at every observed wavelength and inparticular the flux increase observed by VERITAS and Fermiis coincident with an optical outburst The clear correlationbetween the Fermi-LAT and R optical light curves permits oneto go beyond the source association reported in the first Fermi-LAT source catalog (Abdo et al 2010a) and finally identify thegamma-ray source 1FGL J02226+4302 as blazar 3C 66A
For the modeling of the overall SED a reasonable agreementcan be achieved using both a pure SSC model and an SSC+ECmodel with an external near-infrared radiation field as anadditional source for Compton scattering However the pureSSC model requires (1) a large emission region which isinconsistent with the observed intra-night scale variability atoptical wavelengths and (2) low magnetic fields about afactor sim10minus3 below equipartition In contrast an SSC+ECinterpretation allows for variability on timescales of a few hours
11
The Astrophysical Journal 72643 (14pp) 2011 January 1 Abdo et al
Figure 8 EC+SSC model for redshifts z =0444 03 02 and 01 from top to bottom The individual EBL-absorbed EC and SSC components are indicated asdash-dotted and dotted lines respectively The sum is shown as a solid red line (dashed when de-absorbed) The best agreement between the model and the data isachieved when the source is located at z sim 02
Table 4Parameters Used for the SSC Models Displayed in Figure 7
Model Parameter z = 01 z = 02 z = 03 z = 0444
Low-energy cutoff γmin 18 times 104 20 times 104 22 times 104 25 times 104
High-energy cutoff γmax 30 times 105 40 times 105 40 times 105 50 times 105
Injection index q 29 29 30 30Injection luminosity Le (1045 erg sminus1) 13 33 57 128Comoving magnetic field B (G) 003 002 002 001Poynting flux LB (1042 erg sminus1) 11 49 85 137εB equiv LBLe 09 times 10minus3 15 times 10minus3 15 times 10minus3 11 times 10minus3
Doppler factor (D) 30 30 40 50Plasmoid radius RB (1016 cm) 22 60 70 11Variability timescale δtmin
var (hr) 74 221 211 294
Weighted sum of squared residuals to VERITAS flare data 71 09 07 62Weighted sum of squared residuals to Fermi-LAT flare data 16 16 13 14Total weighted sum of squared residuals 87 25 19 76
Notes All SSC models require very low magnetic fields far below the value expected from equipartition (ie εB 1) Theweighted sum of squared residuals to the VERITAS and Fermi-LAT data and the total value for the combined data set areincluded at the bottom of the table The best agreement between the model and the data is obtained when the source is at redshiftz = 02ndash03
12
The Astrophysical Journal 72643 (14pp) 2011 January 1 Abdo et al
Table 5Parameters Used for the EC+SSC Model Fits Displayed in Figure 8
Model Parameter z = 01 z = 02 z = 03 z = 0444
Low-energy cutoff γmin 55 times 103 70 times 103 65 times 103 60 times 103
High-energy cutoff γmax 12 times 105 1512 times 105 1512 times 105 1512 times 105
Injection index q 30 30 30 30Injection luminosity Le (1044 erg sminus1) 11 42 60 104Comoving magnetic field B (G) 035 022 021 023Poynting flux LB (1043 erg sminus1) 10 24 60 112εB equiv LBLe 010 006 010 011Doppler factor D 30 30 40 50Plasmoid radius RB (1016 cm) 05 12 15 15Variability timescale δtmin
var (hr) 17 44 45 40Ext radiation energy density (10minus6 erg cmminus3) 54 24 12 13
Weighted sum of squared residuals to VERITAS flare data 48 36 79 157Weighted sum of squared residuals to Fermi-LAT flare data 10 12 08 15Total weighted sum of squared residuals 58 48 87 172
Notes These model fits require magnetic fields closer to equipartition and allow for the intra-night variability observedin the optical data The weighted sum of squared residuals to the VERITAS and Fermi-LAT data and the total value forthe combined data set are included at the bottom of the table
and for magnetic fields within about an order of magnitudeof though still below equipartition It is worth noting that theresults presented here agree with the findings following the(E gt 200 GeV) flare of blazar W Comae (also an ISP) in 2008March (Acciari et al 2008a) In both cases the high opticalluminosity is expected to play a key role in providing the seedpopulation for IC scattering
Intermediate synchrotron peaked blazars like 3C 66A are wellsuited for simultaneous observations by Fermi-LAT and ground-based IACTs like VERITAS Relative to the sensitivities ofthese instruments ISPs are bright enough to allow for time-resolved spectral measurements in each band during flaringepisodes These types of observations coupled with extensivemulti-wavelength coverage at lower energies will continue toprovide key tests of blazar emission models
The Fermi-LAT Collaboration acknowledges generous ongo-ing support from a number of agencies and institutes that havesupported both the development and the operation of the LATas well as scientific data analysis These include the NationalAeronautics and Space Administration and the Department ofEnergy in the United States the Commissariat a lrsquoEnergie Atom-ique and the Centre National de la Recherche ScientifiqueInstitut National de Physique Nucleaire et de Physique desParticules in France the Agenzia Spaziale Italiana and theIstituto Nazionale di Fisica Nucleare in Italy the Ministry ofEducation Culture Sports Science and Technology (MEXT)High Energy Accelerator Research Organization (KEK) andJapan Aerospace Exploration Agency (JAXA) in Japan and theK A Wallenberg Foundation the Swedish Research Coun-cil and the Swedish National Space Board in Sweden Ad-ditional support for science analysis during the operationsphase is gratefully acknowledged from the Istituto Nazionale diAstrofisica in Italy and the Centre National drsquoEtudes Spatiales inFrance
The VERITAS collaboration acknowledges the generous sup-port from the US Department of Energy the US National Sci-ence Foundation and the Smithsonian Institution by NSERCin Canada by Science Foundation Ireland and by STFC inUK The VERITAS collaboration also acknowledges the excel-
lent work of the technical support staff at the FLWO and thecollaborating institutions in the construction and operation ofthe instrument as well as support from the NASASwift guestinvestigator program (grant NNX08AU13G) for the Swift ob-servations
PAIRITEL is operated by the Smithsonian AstrophysicalObservatory (SAO) and was made possible by a grant fromthe Harvard University Milton Fund a camera loan from theUniversity of Virginia and continued support of the SAO andUC Berkeley The PAIRITEL project is further supported byNASASwift Guest Investigator grant NNG06GH50G Thisresearch is partly based on observations with the 100 m telescopeof the MPIfR (Max-Planck-Institut fur Radioastronomie) atEffelsberg and has also made use of observations with the IRAM30 m telescope The Metsahovi team acknowledges the supportfrom the Academy of Finland The Abastumani Observatoryteam acknowledges financial support by the Georgian NationalScience Foundation through grant GNSFST084-404 The StPetersburg University team acknowledges support from RussianRFBR foundation via grant 09-02-00092 AZT-24 observationsare made within an agreement between Pulkovo Rome andTeramo observatories
L C Reyes acknowledges the support by the Kavli Institutefor Cosmological Physics at the University of Chicago throughgrants NSF PHY-0114422 and NSF PHY-0551142 and anendowment from the Kavli Foundation and its founder FredKavli M Bottcher acknowledges support from NASA throughChandra Guest Investigator Grant GO8-9100X Some of theVERITAS simulations used in this work have been performedon the joint Fermilab-KICP supercomputing cluster supportedby grants from Fermilab the Kavli Institute for CosmologicalPhysics and the University of Chicago
REFERENCES
Abdo A A et al 2009a Science 325 848Abdo A A et al 2009b ApJ 707 1310Abdo A A et al 2010a ApJS 188 405Abdo A A et al 2010b ApJ 710 1271Abdo A A et al 2010c ApJ 716 30Acciari V A et al 2008a ApJ 684 L73
13
The Astrophysical Journal 72643 (14pp) 2011 January 1 Abdo et al
Acciari V A et al 2008b ApJ 679 1427Acciari V A et al 2009 ApJ 693 L104Aliu E et al 2009 ApJ 692 L29Angelakis E Fuhrmann L Marchili N Krichbaum T P amp Zensus J A
2008 Mem Soc Astron Ital 79 1042Arnaud K A 1996 in ASP Conf Ser 101 Astronomical Data Analysis
Software and Systems V ed G H Jacoby amp J Barnes (San FranciscoCA ASP) 17
Atwood W B et al 2009 ApJ 697 1071Bennett A S 1962 Mem R Astron Soc 68 163Bloom J S Starr D L Blake C H Skrutskie M F amp Falco E E 2006
in ASP Conf Ser 351 Astronomical Data Analysis Software and SystemsXV ed C Gabriel C Arviset D Ponz amp S Enrique (San Francisco CAASP) 751
Bottcher M 2007 ApampSS 309 95Bottcher M amp Chiang J 2002 ApJ 581 127Bottcher M amp Dermer C D 2002 ApJ 564 86Bottcher M et al 2009 ApJ 694 174Bramel D A et al 2005 ApJ 629 108Britzen S et al 2007 AampA 472 763Britzen S et al 2008 AampA 484 119Cavaliere A amp DrsquoElia V 2002 ApJ 571 226Dermer C D amp Schlickeiser R 1993 ApJ 416 458Dickey J M amp Lockman F J 1990 ARAampA 28 215Edelson R A amp Krolik J H 1988 ApJ 333 646Finke J D Razzaque S amp Dermer C D 2010 ApJ 712 238Finke J D Shields J C Bottcher M amp Basu S 2008 AampA 477
513Fitzpatrick E L 1999 PASP 111 63Franceschini A Rodighiero G amp Vaccari M 2008 AampA 487 837Fuhrmann L Zensus J A Krichbaum T P Angelakis E amp Readhead A
C S 2007 in AIP Conf Proc 921 The First GLAST Symposium ed SRitz P Michelson amp C A Meegan (Melville NY AIP) 249
Fuhrmann L et al 2008 AampA 490 1019Gehrels N et al 2004 ApJ 611 1005Georganopoulos M amp Kazanas D 2003 ApJ 594 L27Georganopoulos M amp Kazanas D 2004 ApJ 604 L81Ghisellini G amp Madau P 1996 MNRAS 280 67Ghisellini G Tavecchio F amp Chiaberge M 2005 AampA 432 401Gilmore R C Madau P Primack J R Somerville R S amp Haardt F
2009 MNRAS 399 1694Hartman R C et al 1999 ApJS 123 79Henri G amp Sauge L 2006 ApJ 640 185Jorstad S G Marscher A P Mattox J R Wehrle A E Bloom S D amp
Yurchenko A V 2001 ApJS 134 181Joshi M amp Bottcher M 2007 ApJ 662 884
Kataoka J et al 1999 Astropart Phys 11 149Kerrick A D et al 1995 ApJ 452 588Kinney A L Bohlin R C Blades J C amp York D G 1991 ApJS 75
645Kuiper L Hermsen W Verbunt F Thompson D J Stairs I H Lyne A
G Strickman M S amp Cusumano G 2000 AampA 359 615Larionov V M et al 2008 ATel 1755 1Li T-P amp Ma Y-Q 1983 ApJ 272 317Mackay C D 1971 MNRAS 154 209Marscher A P Jorstad S G Mattox J R amp Wehrle A E 2002 ApJ 577
85Mattox J R et al 1996 ApJ 461 396Miller J S French H B amp Hawley S A 1978 Proc Pittsburgh Conf on
BL Lac Objects ed A M Wolfe 176Mucke A Protheroe R J Engel R Rachen J P amp Stanev T 2003
Astropart Phys 18 593Northover K J E 1973 MNRAS 165 369Oke J B et al 1995 PASP 107 375Piner B G Pant N amp Edwards P G 2008 ApJ 678 64Poole T S et al 2008 MNRAS 383 627Prandini E Bonnoli G Maraschi L Mariotti M amp Tavecchio F 2010
MNRAS 405 L76Reimer A Joshi M amp Bottcher M 2008 in AIP Conf Ser 1085 High
Energy Gamma-Ray Astronomy ed F A Aharonian W Hofmann amp FRieger (Melville NY AIP) 502
Savolainen T Homan D C Hovatta T Kadler M Kovalev Y Y ListerM L Ros E amp Zensus J A 2010 AampA 512 A24
Schlegel D J Finkbeiner D P amp Davis M 1998 ApJ 500 525Sikora M Begelman M C amp Rees M J 1994 ApJ 421 153Smith H E Smith E O amp Spinrad H 1976 PASP 88 621Stecker F W Malkan M A amp Scully S T 2006 ApJ 648 774 (erratum
658 1392 [2007])Swordy S 2008 ATel 1753 1Tavecchio F amp Ghisellini G 2009 MNRAS 394 L131Taylor G B Vermeulen R C Readhead A C S Pearson T J Henstock
D R amp Wilkinson P N 1996 ApJS 107 37Thompson D J et al 1993 ApJS 86 629Tosti G 2008 ATel 1759 1Urry C M amp Padovani P 1995 PASP 107 803Villata M et al 2008 AampA 481 L79Villata M et al 2009 AampA 504 L9Weekes T C 2000 in AIP Conf Ser 515 GeVndashTeV Gamma Ray Astrophysics
Workshop Towards a Major Atmospheric Cherenkov Detector VI ed B LDingus M H Salamon amp D B Kieda (Melville NY AIP) 3
Wills B J amp Wills D 1974 ApJ 190 L97Wurtz R Stocke J T amp Yee H K C 1996 ApJS 103 109
14
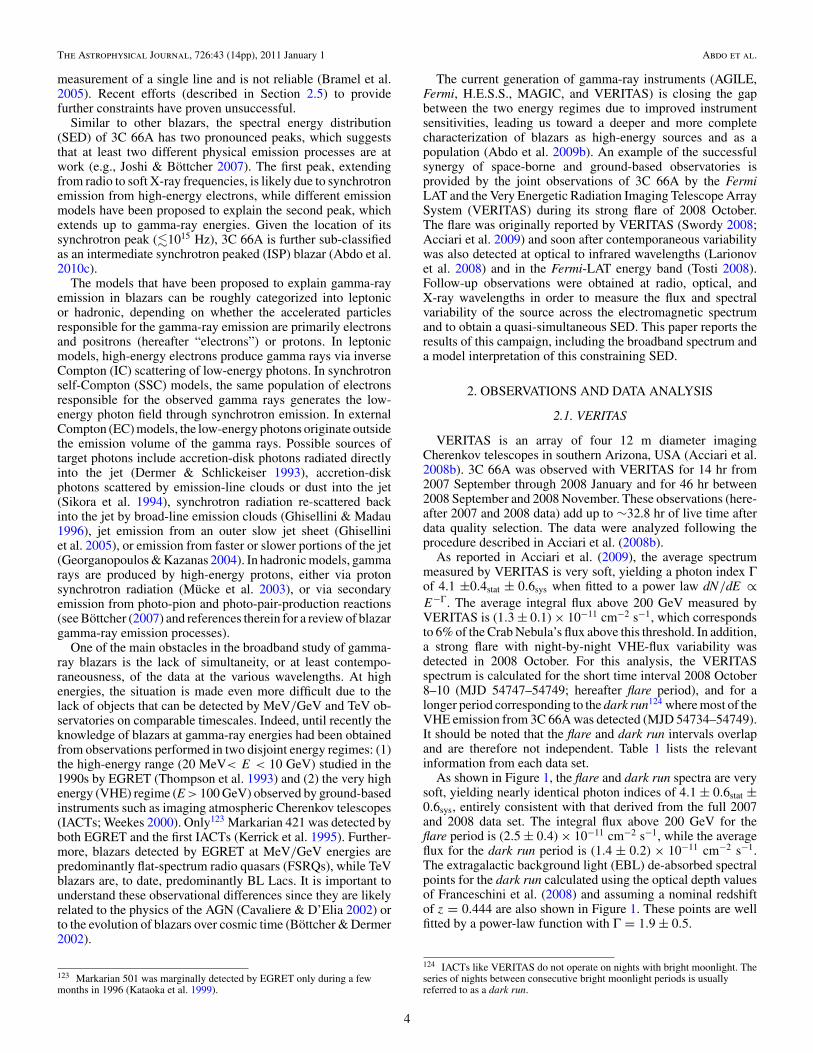
The Astrophysical Journal 72643 (14pp) 2011 January 1 Abdo et al
measurement of a single line and is not reliable (Bramel et al2005) Recent efforts (described in Section 25) to providefurther constraints have proven unsuccessful
Similar to other blazars the spectral energy distribution(SED) of 3C 66A has two pronounced peaks which suggeststhat at least two different physical emission processes are atwork (eg Joshi amp Bottcher 2007) The first peak extendingfrom radio to soft X-ray frequencies is likely due to synchrotronemission from high-energy electrons while different emissionmodels have been proposed to explain the second peak whichextends up to gamma-ray energies Given the location of itssynchrotron peak (1015 Hz) 3C 66A is further sub-classifiedas an intermediate synchrotron peaked (ISP) blazar (Abdo et al2010c)
The models that have been proposed to explain gamma-rayemission in blazars can be roughly categorized into leptonicor hadronic depending on whether the accelerated particlesresponsible for the gamma-ray emission are primarily electronsand positrons (hereafter ldquoelectronsrdquo) or protons In leptonicmodels high-energy electrons produce gamma rays via inverseCompton (IC) scattering of low-energy photons In synchrotronself-Compton (SSC) models the same population of electronsresponsible for the observed gamma rays generates the low-energy photon field through synchrotron emission In externalCompton (EC) models the low-energy photons originate outsidethe emission volume of the gamma rays Possible sources oftarget photons include accretion-disk photons radiated directlyinto the jet (Dermer amp Schlickeiser 1993) accretion-diskphotons scattered by emission-line clouds or dust into the jet(Sikora et al 1994) synchrotron radiation re-scattered backinto the jet by broad-line emission clouds (Ghisellini amp Madau1996) jet emission from an outer slow jet sheet (Ghiselliniet al 2005) or emission from faster or slower portions of the jet(Georganopoulos amp Kazanas 2004) In hadronic models gammarays are produced by high-energy protons either via protonsynchrotron radiation (Mucke et al 2003) or via secondaryemission from photo-pion and photo-pair-production reactions(see Bottcher (2007) and references therein for a review of blazargamma-ray emission processes)
One of the main obstacles in the broadband study of gamma-ray blazars is the lack of simultaneity or at least contempo-raneousness of the data at the various wavelengths At highenergies the situation is made even more difficult due to thelack of objects that can be detected by MeVGeV and TeV ob-servatories on comparable timescales Indeed until recently theknowledge of blazars at gamma-ray energies had been obtainedfrom observations performed in two disjoint energy regimes (1)the high-energy range (20 MeVlt E lt 10 GeV) studied in the1990s by EGRET (Thompson et al 1993) and (2) the very highenergy (VHE) regime (E gt 100 GeV) observed by ground-basedinstruments such as imaging atmospheric Cherenkov telescopes(IACTs Weekes 2000) Only123 Markarian 421 was detected byboth EGRET and the first IACTs (Kerrick et al 1995) Further-more blazars detected by EGRET at MeVGeV energies arepredominantly flat-spectrum radio quasars (FSRQs) while TeVblazars are to date predominantly BL Lacs It is important tounderstand these observational differences since they are likelyrelated to the physics of the AGN (Cavaliere amp DrsquoElia 2002) orto the evolution of blazars over cosmic time (Bottcher amp Dermer2002)
123 Markarian 501 was marginally detected by EGRET only during a fewmonths in 1996 (Kataoka et al 1999)
The current generation of gamma-ray instruments (AGILEFermi HESS MAGIC and VERITAS) is closing the gapbetween the two energy regimes due to improved instrumentsensitivities leading us toward a deeper and more completecharacterization of blazars as high-energy sources and as apopulation (Abdo et al 2009b) An example of the successfulsynergy of space-borne and ground-based observatories isprovided by the joint observations of 3C 66A by the FermiLAT and the Very Energetic Radiation Imaging Telescope ArraySystem (VERITAS) during its strong flare of 2008 OctoberThe flare was originally reported by VERITAS (Swordy 2008Acciari et al 2009) and soon after contemporaneous variabilitywas also detected at optical to infrared wavelengths (Larionovet al 2008) and in the Fermi-LAT energy band (Tosti 2008)Follow-up observations were obtained at radio optical andX-ray wavelengths in order to measure the flux and spectralvariability of the source across the electromagnetic spectrumand to obtain a quasi-simultaneous SED This paper reports theresults of this campaign including the broadband spectrum anda model interpretation of this constraining SED
2 OBSERVATIONS AND DATA ANALYSIS
21 VERITAS
VERITAS is an array of four 12 m diameter imagingCherenkov telescopes in southern Arizona USA (Acciari et al2008b) 3C 66A was observed with VERITAS for 14 hr from2007 September through 2008 January and for 46 hr between2008 September and 2008 November These observations (here-after 2007 and 2008 data) add up to sim328 hr of live time afterdata quality selection The data were analyzed following theprocedure described in Acciari et al (2008b)
As reported in Acciari et al (2009) the average spectrummeasured by VERITAS is very soft yielding a photon index Γof 41 plusmn04stat plusmn 06sys when fitted to a power law dNdE propEminusΓ The average integral flux above 200 GeV measured byVERITAS is (13 plusmn 01) times 10minus11 cmminus2 sminus1 which correspondsto 6 of the Crab Nebularsquos flux above this threshold In additiona strong flare with night-by-night VHE-flux variability wasdetected in 2008 October For this analysis the VERITASspectrum is calculated for the short time interval 2008 October8ndash10 (MJD 54747ndash54749 hereafter flare period) and for alonger period corresponding to the dark run124 where most of theVHE emission from 3C 66A was detected (MJD 54734ndash54749)It should be noted that the flare and dark run intervals overlapand are therefore not independent Table 1 lists the relevantinformation from each data set
As shown in Figure 1 the flare and dark run spectra are verysoft yielding nearly identical photon indices of 41 plusmn 06stat plusmn06sys entirely consistent with that derived from the full 2007and 2008 data set The integral flux above 200 GeV for theflare period is (25 plusmn 04) times 10minus11 cmminus2 sminus1 while the averageflux for the dark run period is (14 plusmn 02) times 10minus11 cmminus2 sminus1The extragalactic background light (EBL) de-absorbed spectralpoints for the dark run calculated using the optical depth valuesof Franceschini et al (2008) and assuming a nominal redshiftof z = 0444 are also shown in Figure 1 These points are wellfitted by a power-law function with Γ = 19 plusmn 05
124 IACTs like VERITAS do not operate on nights with bright moonlight Theseries of nights between consecutive bright moonlight periods is usuallyreferred to as a dark run
4
The Astrophysical Journal 72643 (14pp) 2011 January 1 Abdo et al
Table 1Results from VERITAS Observations of 3C 66A
Interval Live Time (hr) Non Noff Alpha Excess Significance (σ )
Flare 60 1531 7072 0121 6783 180Dark run 212 3888 20452 0125 13315 2222007 and 2008 281 7257 31201 0175 1791 211
Notes Live time corresponds to the effective exposure time after accountingfor data quality selection Non (Noff ) corresponds to the number of on (off)-source events passing background-rejection cuts Alpha is the normalizationof off-source events and the excess is equal to Non minus αNoff The significanceis expressed in number of standard deviations and is calculated according toEquation (17) of Li amp Ma (1983) See Acciari et al (2009) for a completedescription of the VERITAS analysis
22 Fermi-LAT
The LAT on board the Fermi Gamma-ray Space Telescope isa pair-conversion detector sensitive to gamma rays with energiesbetween 20 MeV and several hundred GeV (Atwood et al 2009)Since launch the instrument has operated almost exclusively insky survey mode covering the whole sky every 3 hr The overallcoverage of the sky is fairly uniform with exposure variations of 15 around the mean value The LAT data are analyzed usingScienceTools v9r15p5 and instrument response functions P6V3(available via the Fermi science support center125) Only photonsin the diffuse event class are selected for this analysis because oftheir reduced charged-particle background contamination andvery good angular reconstruction A zenith angle lt105 cut ininstrument coordinates is used to avoid gamma rays from theEarth limb The diffuse emission from the Galaxy is modeledusing a spatial model (gll iem v02fit) which was refinedwith Fermi-LAT data taken during the first year of operationThe extragalactic diffuse and residual instrumental backgroundsare modeled as an isotropic component and are included inthe fit126 The data are analyzed with an unbinned maximumlikelihood technique (Mattox et al 1996) using the likelihoodanalysis software developed by the LAT team
Although 3C 66A was detected by EGRET as source 3EGJ0222+4253 (Hartman et al 1999) detailed spatial and timinganalyses by Kuiper et al (2000) showed that this EGRETsource actually consists of the superposition of 3C 66A andthe nearby millisecond pulsar PSR J0218+4232 which is 096distant from the blazar This interpretation of the EGRET datais verified by Fermi-LAT whose improved angular resolutionpermits the clear separation of the two sources as shown inFigure 2 Furthermore the known pulsar period is detectedwith high confidence in the Fermi-LAT data (Abdo et al2009a) More importantly for this analysis the clear separationbetween the pulsar and the blazar enables studies of eachsource independently in the maximum likelihood analysis andthus permits an accurate determination of the spectrum andlocalization of each source with negligible contamination
Figure 2 also shows the localization of the Fermi andVERITAS sources with respect to blazar 3C 66A and radiogalaxy 3C 66B (see caption in Figure 2 for details) It is clearfrom the map that the Fermi-LAT and VERITAS localizationsare consistent and that the gamma-ray emission is confidentlyassociated with the blazar and not with the radio galaxy Somesmall contribution in the Fermi-LAT data from radio galaxy3C 66B as suggested by Aliu et al (2009) and Tavecchio amp
125 httpfermigsfcnasagovsscdataanalysisscitoolsoverviewhtml126 httpfermigsfcnasagovsscdataaccesslatBackgroundModelshtml
Energy (MeV)
210 310 410 510 610
)minus
1 s
minus2
(M
eV
cm
νFν
minus710
minus610
minus510
minus410
minus310
)minus
1 s
minus2
(e
rgs
cm
νFν
minus1210
minus1110
minus1010
minus910
intervalflareminusLATFermi intervaldark runminusLATFermi
minusLAT 6minusmonths average spectrumFermi
intervalflareVERITAS
intervaldarkrunVERITAS
VERITAS average spectrum 2007minus2008
(z=0444) dark runDeminusabsorbed VERITAS
(z=03) dark runDeminusabsorbed VERITAS
Figure 1 Gamma-ray SED of 3C 66A including Fermi-LAT and VERITASdata for the flare (red symbols) and dark run (blue symbols) intervals TheFermi-LAT spectra are also shown here as ldquobutterflyrdquo contours (solid lines)describing the statistical error on the spectrum (Abdo et al 2009b) Thepreviously reported Fermi-LAT six-month-average spectrum (Abdo et al 2010b)is also shown here (green circles) and is lower than the spectrum obtained duringthe campaign The average 2007ndash2008 VERITAS spectrum originally reportedin Acciari et al (2009) is displayed with green triangles In all cases theupper limits are calculated at 95 confidence level The de-absorbed dark runspectra obtained using the optical depth values of Franceschini et al (2008)are also shown as open circles and open squares for redshifts of 0444 and 03respectively
Ghisellini (2009) cannot be excluded given the large spillover oflow-energy photons from 3C 66A at the location of 3C 66B Thisis due to the long tails of the Fermi-LAT point-spread function atlow energies as described in Atwood et al (2009) Neverthelessconsidering only photons with energy E gt 1 GeV the upperlimit (95 confidence level) for a source at the location of 3C66B is 29 times 10minus8 cmminus2 sminus1 for the dark run period (with a teststatistic127 (TS) = 13) For the 11 months of data correspondingto the first Fermi-LAT catalog (Abdo et al 2010a) the upperlimit is 49 times 10minus9 cmminus2 sminus1 (TS = 58)
As in the analysis of the VERITAS observations the Fermi-LAT spectrum is calculated for the flare and for the darkrun periods The Fermi flare period flux F (E gt100 MeV) =(50 plusmn 14stat plusmn 03sys) times 10minus7 cmminus2 sminus1 is consistent withinerrors with the dark run flux of (39 plusmn 05stat plusmn 03sys) times10minus7 cmminus2 sminus1 In both cases the Fermi-LAT spectrum is quitehard and can be described by a power law with a photon indexΓ of 18 plusmn 01stat plusmn 01sys and 19 plusmn 01stat plusmn 01sys in the flareperiod and dark run intervals respectively Both spectra areshown in the high-energy SED in Figure 1
23 Chandra
3C 66A was observed by the Chandra observatory on 2008October 6 for a total of 376 ks with the Advanced CCD ImagingSpectrometer (ACIS) covering the energy band between 03and 10 keV The source was observed in the continuousclocking mode to avoid pile-up effects Standard analysis tools(CIAO 41) and calibration files (CALDB v350) provided bythe Chandra X-ray center128 are used
The time-averaged spectrum is obtained and re-binned to en-sure that each spectral channel contains at least 25 background-subtracted counts This condition allows the use of the χ2
127 The test statistic (TS) value quantifies the probability of having a pointsource at the location specified It is roughly the square of the significancevalue a TS of 25 corresponds to a signal of approximately 5 standarddeviations (Abdo et al 2010a)128 httpcxcharvardeduciao
5
The Astrophysical Journal 72643 (14pp) 2011 January 1 Abdo et al
Figure 2 Smoothed count map of the 3C 66A region as seen by Fermi-LAT between 2008 September 1 and December 31 with E gt 100 MeV The color bar hasunits of counts per pixel and the pixel dimensions are 01 times 01 The contour levels have been smoothed and correspond to 28 52 and 76 counts per pixel Thelocations of 3C 66A and 3C 66B (a radio galaxy that is 011 away) are shown as a cross and as a diamond respectively The location of millisecond pulsar PSR0218+4232 is also indicated with a white cross The magenta circle represents the VERITAS localization of the VHE source (RA DEC) = (2h22m41s6 plusmn 1s7stat plusmn6s0sys 4302prime35primeprime5 plusmn 21primeprime
stat plusmn 1prime30primeprimesys) as reported in Acciari et al (2009) The blue interior circle represents the 95 error radius of the Fermi-LAT localization
(RA DEC) = (02h22m40s3 plusmn 4s5 4302prime18primeprime6 plusmn 42primeprime1) as reported in the Fermi-LAT first source catalog (Abdo et al 2010a) All positions are based on the J2000epoch
quality-of-fit estimator to find the best-fit model XSPEC v124(Arnaud 1996) is used for the spectral analysis and fitting proce-dure Two spectral models have been used to fit the data singlepower law and broken power law Each model includes galacticH i column density (NHGal = 899 times 1020 cmminus2) according toDickey amp Lockman (1990) where the photoelectric absorptionis set with the XSPEC model phabs129 An additional local H i
column density was also tried but in both cases the spectra wereconsistent with pure galactic density Consequently the columndensity has been fixed to the galactic value in each model andthe results obtained are presented in Table 2 An F-test wasperformed to demonstrate that the spectral fit improves signif-icantly when using the extra degrees of freedom of the brokenpower-law model Table 2 also contains the results of the F-test
24 Swift XRT and UVOT
Following the VERITAS detection of VHE emission from3C 66A Target of Opportunity (ToO) observations of 3C 66Awith Swift were obtained for a total duration of sim10 ks TheSwift satellite observatory comprises an UVndashOptical telescope(UVOT) an X-ray telescope (XRT) and a Burst Alert Telescope(Gehrels et al 2004) Data reduction and calibration of the XRT
129 httpheasarcgsfcnasagovdocssoftwarelheasoftxanaduxspecmanualXSmodelPhabshtml
data are performed with HEASoft v65 standard tools AllXRT data presented here are taken in photon counting modewith negligible pile-up effects The X-ray spectrum of eachobservation is fitted with an absorbed power law using a fixedGalactic column density from Dickey amp Lockman (1990)which gives good χ2 values for all observations The measuredphoton spectral index ranges between 25 and 29 with a typicalstatistical uncertainty of 01
UVOT obtained data through each of six color filters VB and U together with filters defining three ultraviolet pass-bands UVW1 UVM2 and UVW2 with central wavelengths of260 nm 220 nm and 193 nm respectively The data are cal-ibrated using standard techniques (Poole et al 2008) and cor-rected for Galactic extinction by interpolating the absorptionvalues from Schlegel et al (1998) (EBminusV = 0083 mag) withthe galactic spectral extinction model of Fitzpatrick (1999)
25 Optical to Infrared Observations
The R magnitude of the host galaxy of 3C 66A is sim 19in the optical band (Wurtz et al 1996) Its contribution isnegligible compared to the typical AGN magnitude of R 15 therefore host-galaxy correction is not necessary
GASP-WEBT 3C 66A is continuously monitored by tele-scopes affiliated to the GLAST-AGILE support program of theWhole Earth Blazar Telescope (GASP-WEBT see Villata et al
6
The Astrophysical Journal 72643 (14pp) 2011 January 1 Abdo et al
Figure 3 3C 66A light curves covering 2008 August 22 to December 31 inorder of increasing wavelength The VERITAS observations are combined toobtain nightly flux values and the dashed and dotted lines represent the averageflux measured from the 2007 and 2008 data and its standard deviation TheFermi-LAT light curves contain time bins with a width of 3 days The averageflux and average photon index measured by Fermi-LAT during the first sixmonths of science operations are shown as horizontal lines in the respectivepanels In all cases the Fermi-LAT photon index is calculated over the 100MeV to 200 GeV energy range The long-term light curves at optical andinfrared wavelengths are presented in the two bottom panels In the bottompanel GASP-WEBT and PAIRITEL observations are represented by open andsolid symbols respectively
2008 2009) These observations provide a long-term light curveof this object with complete sampling as shown in Figure 3During the time interval in consideration (MJD 54700ndash54840)several observatories (Abastumani Armenzano Crimean ElVendrell LrsquoAmpolla Lulin New Mexico Skies Roque de losMuchachos (KVA) Rozhen Sabadell San Pedro Martir St Pe-tersburg Talmassons Teide (BRT) Torino Tuorla and Valledrsquo Aosta) contributed photometric observations in the R bandData in the J H and K bands were taken at the Campo Imper-atore observatory A list of the observatories and their locationsis available in Table 3
MDM Following the discovery of VHE emission 3C 66Awas observed with the 13 m telescope of the MDM Observatoryduring the nights of 2008 October 6ndash10 A total of 290 scienceframes in U B V and R bands (58 each) were taken throughoutthe entire visibility period (approx 430 ndash 1000 UT) duringeach night The light curves which cover the time around theflare are presented in Figure 4
ATOM Optical observations for this campaign in the R bandwere also obtained with the 08 m optical telescope ATOM
Figure 4 3C 66A light curves covering the period centered on the gamma-ray flare (2008 October 1ndash10) The VERITAS and Fermi-LAT panels werealready described in the caption of Figure 3 Swift Target-of-Opportunity(ToO) observations (panels 3ndash5 from the top) were obtained following thediscovery of VHE emission by VERITAS (Swordy 2008) Swift-UVOT andMDM observations are represented by open and solid symbols respectivelyThe optical light curve in panel 6 from the top displays intra-night variabilityAn example is identified in the plot when a rapid decline of the optical flux byΔFΔt sim minus02 mJy hrminus1 is observed on MJD 54747
in Namibia which monitors this source periodically Twentyphotometric observations are available starting on MJD 54740and are shown in Figures 3 and 4
PAIRITEL Near-infrared observations in the J H and Kswere obtained following the VHE flare with the 13 m PetersAutomated Infrared Imaging Telescope (PAIRITEL see Bloomet al 2006) located at the Fred Lawrence Whipple ObservatoryThe resulting light curves using differential photometry withfour nearby calibration stars are shown in Figure 4
Keck The optical spectrum of 3C 66A was measured withthe LRIS spectrometer (Oke et al 1995) on the Keck I telescopeon the night of 2009 September 17 under good conditions Theinstrument configuration resulted in a full width half-maximumof sim250 km sminus1 over the wavelength range 3200ndash5500 Aring (blueside) and sim200 km sminus1 over the range 6350ndash9000 Aring (red side)A series of exposures totaling 110 s (blue) and 50 s (red) wereobtained yielding a signal-to-noise (SN) per resolution elementof sim250 and 230 for the blue and red cameras respectively Thedata were reduced with the LowRedux130 pipeline and calibratedusing a spectrophotometric star observed on the same night
130 httpwwwucolickorgsimxavierLowReduxindexhtml
7
The Astrophysical Journal 72643 (14pp) 2011 January 1 Abdo et al
Table 2Best-fit Model Parameters for a Fit Performed to the Chandra Data in the 1ndash7 keV Energy Range
Single Power-law Model
Γ Flux (10minus12 erg cmminus2 sminus1) χ2dof
299 plusmn 003 347 plusmn 006 121 (2326193)
Broken Power-law Model
Γ1 Γ2 Flux (10minus12 erg cmminus2 sminus1) Break (keV) χ2dof F-test Probability
308+03minus05 224+023
037 358+007minus008 33+05
minus03 097 (1852191) 347 times 10minus10
Notes The galactic NHGal value is fixed to 899 times 1020 cmminus2 the value of the galactic H i column density according toDickey amp Lockman (1990) Errors indicate the 90 confidence level
Table 3List of Ground-based Observatories that Participated in This Campaign
Observatory Location Web Page
Radio Observatories
Crimean Radio Obs Ukraine wwwcraocrimeauaEffelsberg Germany wwwmpifrdeenglishradiotelescopeIRAM Spain wwwiram-instituteorgEN30-meter-telescopephpMedicina Italy wwwmedirainafitMetsahovi Finland wwwmetsahovifienNoto Italy wwwnotoirainafitUMRAO Michigan USA wwwastrolsaumicheduobsradiotel
Infrared Observatories
Campo Imperatore Italy wwwoa-teramoinafitPAIRITEL Arizona USA wwwpairitelorgOptical ObservatoriesAbastumani Georgia wwwgenaoorgArmenzano Italy wwwwebaliceitdcarosatiATOM Namibia wwwlswuni-heidelbergdeprojectshessATOMCrimean Astr Obs Ukraine wwwcraocrimeauaEl Vendrell SpainKitt Peak (MDM) Arizona USA wwwastrolsaumicheduobsmdmLrsquoAmpolla SpainLulin Taiwan wwwlulinncuedutwenglishNew Mexico Skies Obs New Mexico USA wwwnmskiescomRoque (KVA) Canary Islands Spain wwwotriiacesenonthtmRozhen Bulgaria wwwastrobasbgrozhenhtmlSabadell Spain wwwastrosabadellorghtmlesobservatoriosabhtmSan Pedro Martir Mexico wwwastrosspunammxindexspmhtmlSt Petersburg Russia wwwgaospbruTalmassons Italy wwwcastfvgitTeide (BRT) Canary Islands Spain wwwtelescopeorgTorino Italy wwwtoastroitTuorla Finland wwwastroutufiValle drsquo Aosta Italy wwwoavdaitenglishosservatorio
Gamma-ray Observatory
VERITAS Arizona USA wwwveritassaoarizonaedu
Inspection of the 3C 66A spectrum reveals no spectral featuresaside from those imposed by Earthrsquos atmosphere and the MilkyWay (Ca H+K) Therefore these new data do not offer anyinsight on the redshift of 3C 66A and in particular are unableto confirm the previously reported value of z = 0444 (Milleret al 1978)
26 Radio Observations
Radio observations are available thanks to the F-GAMMA(Fermi-Gamma-ray Space Telescope AGN Multi-frequencyMonitoring Alliance) program which is dedicated to monthly
monitoring of selected Fermi-LAT blazars (Fuhrmann et al2007 Angelakis et al 2008) Radio flux density measurementswere conducted with the 100 m Effelsberg radio telescope at485 835 1045 and 1460 GHz on 2008 October 16 Thesedata are supplemented with an additional measurement at 86GHz conducted with the IRAM 30 m telescope (Pico VeletaSpain) on 2008 October 8 The data were reduced using stan-dard procedures described in Fuhrmann et al (2008) Additionalradio observations taken between 2008 October 5 and 15 (con-temporaneous to the flare period) are provided by the MedicinaMetsahovi Noto and UMRAO observatories all of which aremembers of the GASP-WEBT consortium
8
The Astrophysical Journal 72643 (14pp) 2011 January 1 Abdo et al
3 DISCUSSION
31 Light Curves
The resulting multi-wavelength light curves from this cam-paign are shown in Figure 3 for those bands with long-term cov-erage and in Figure 4 for those observations that were obtainedshortly before and after the gamma-ray flare The VERITASobservations are combined to obtain nightly (E gt 200 GeV)flux values since no evidence for intra-night variability is ob-served The highest flux occurred on MJD 54749 and significantvariability is observed during the whole interval (χ2 probabilityless than 10minus4 for a fit of a constant flux)
The temporal dependence of the Fermi-LAT photon index andintegral flux above 100 MeV and 1 GeV are shown with timebins with width of 3 days in Figure 3 For those time intervalswith no significant detection a 95 confidence flux upper limitis calculated The flux and photon index from the Fermi-LATfirst source catalog (Abdo et al 2010a) are shown as horizontallines for comparison These values correspond to the averageflux and photon index measured during the first 11 months ofFermi operations and thus span the time interval considered inthe figures It is evident from the plot that the VHE flare detectedby VERITAS starting on MJD 54740 is coincident with a periodof high flux in the Fermi energy band The photon index duringthis time interval is consistent within errors with the averagephoton index Γ = 195 plusmn 003 measured during the first sixmonths of the Fermi mission (Abdo et al 2010b)
Long-term and well-sampled light curves are available atoptical and near-infrared wavelengths thanks to observations byGASP-WEBT ATOM MDM and PAIRITEL Unfortunatelyradio observations were too limited to obtain a light curve andno statement about variability in this band can be made Thebest sampling is available for the R band for which variationswith a factor of 2 are observed in the long-term light curveFurthermore variability on timescales of less than a day isobserved as indicated in Figure 4 and as previously reportedby Bottcher et al (2009) following the WEBT (Whole EarthBlazar Telescope) campaign on 3C 66A in 2007 and 2008
The increase in gamma-ray flux observed in the Fermi bandseems contemporaneous with a period of increased flux in theoptical and to test this hypothesis the discrete correlationfunction (DCF) is used (Edelson amp Krolik 1988) Figure 5shows the DCF of the F(E gt 1 GeV) gamma-ray band withrespect to the R band with time-lag bins of 3 5 and 7 days Theprofile of the DCF is consistent for all time-lag bins indicatingthat the result is independent of bin size The DCF with time-lagbins of 3 days was fitted with a Gaussian function of the formDCF(τ ) = Cmax times exp (τ minus τ0)2σ 2 where Cmax is the peakvalue of the DCF τ0 is the delay timescale at which the DCFpeaks and σ parameterizes the Gaussian width of the DCF Thebest-fit function is plotted in Figure 5 and the best-fit parametersare Cmax = 11 plusmn 03 τ0 = (07 plusmn 07) days and σ = (33 plusmn07) days An identical analysis was also performed betweenthe F(E gt 100 MeV) and the R optical band with consistentresults This indicates a clear correlation between the Fermi-LAT and optical energy bands with a time lag that is consistentwith zero and not greater than sim5 days Despite the sparsity ofthe VERITAS light curve (due in part to the time periods whenthe source was not observable due to the full Moon) the DCFanalysis was also performed to search for correlations with eitherthe Fermi-LAT or optical data Apart from the overall increasein flux no significant correlations can be established The onsetof the E gt 200 GeV flare seems delayed by about sim5 days
Time lag [days]minus30 minus20 minus10 0 10 20 30
DC
F
minus1
minus05
0
05
1
15 Bin Size3 days
5 days
7 days
Figure 5 Discrete correlation function (DCF) of the F(E gt 1 GeV) gamma-raylight curve with respect to the R-band light curve A positive time lag indicatesthat the gamma-ray band leads the optical band Different symbols correspondto different bin sizes of time lag as indicated in the legend The profile of theDCF is independent of bin size and is well described by a Gaussian functionof the form DCF(τ ) = Cmax times exp (τ minus τ0)2σ 2 The fit to the 3-day bin sizedistribution is shown in the plot as a solid black line and the best-fit parametersare Cmax = 11 plusmn 03 τ0 = (07 plusmn 07) days and σ = (33 plusmn 07) days
with respect to the opticalndashGeV flare but given the coveragegaps no firm conclusion can be drawn (eg the flare could havebeen already underway when the observations took place) Nosuch lag is expected from the homogeneous model described inthe next section but could arise in models with complex energystratification and geometry in the emitting region
32 SED and Modeling
The broadband SED derived from these observations ispresented in Figure 6 and modeled using the code of Bottcher ampChiang (2002) In this model a power-law distribution of ultra-relativistic electrons andor pairs with lower and upper energycutoffs at γmin and γmax respectively and power-law index qis injected into a spherical region of comoving radius RB Theinjection rate is normalized to an injection luminosity Le whichis a free input parameter of the model The model assumesa temporary equilibrium between particle injection radiativecooling due to synchrotron and Compton losses and particleescape on a time tesc equiv ηesc RBc where ηesc is a scale parameterin the range sim250ndash500 Both the internal synchrotron photonfield (SSC) and external photon sources (EC) are considered astargets for Compton scattering The emission region is movingwith a bulk Lorentz factor Γ along the jet To reduce the numberof free parameters we assume that the jet is oriented with respectto the line of sight at the superluminal angle so that the Dopplerfactor is equal to D = (Γ [1 minus β cos θobs])
minus1 = Γ where θobs isthe angle of the jet with respect to the line of sight Given theuncertainty in the redshift determination of 3C 66A a range ofplausible redshifts namely z = 01 02 03 and the generallyused catalog value z = 0444 are considered for the modelingAll model fits include EBL absorption using the optical depthvalues from Franceschini et al (2008)
Most VHE blazars known to date are high synchrotron peaked(HSP) blazars whose SEDs can often be fitted satisfactorilywith pure SSC models Since the transition from HSP to ISP iscontinuous a pure SSC model was fitted first to the radio throughVHE gamma-ray SED Independently of the model underconsideration the low-frequency part of the SED (lt1020 Hz) iswell fitted with a synchrotron component as shown in Figure 6
9
The Astrophysical Journal 72643 (14pp) 2011 January 1 Abdo et al
Figure 6 Broadband SED of 3C 66A during the 2008 October multi-wavelength campaign The observation that corresponds to each set of data points is indicated inthe legend As an example the EBL-absorbed EC+SSC model for z = 03 is plotted here for reference A description of the model is provided in the text
For clarity only the high-frequency range is shown in Figures 7and 8 where the different models are compared As can beseen from the figures a reasonable agreement with the overallSED can be achieved for any redshift in the range exploredThe weighted sum of squared residuals has been calculatedfor the Fermi-LAT and VERITAS flare data (8 data points intotal) in order to quantify the scatter of the points with respectto the model and is shown in Table 4 The best agreement isachieved when the source is located at z sim 02ndash03 For lowerredshifts the model spectrum is systematically too hard whileat z = 0444 the model spectrum is invariably too soft as a resultof EBL absorption It should be noted that the EBL model ofFranceschini et al (2008) predicts some of the lowest opticaldepth values in comparison to other models (Finke et al 2010Gilmore et al 2009 Stecker et al 2006) Thus a model spectrumwith redshift of 03 or above would be even harder to reconcilewith the observations when using other EBL models
A major problem of the SSC models with z 01 is thatRB is of the order of 5 times 1016 cm This does not allowfor variability timescales shorter than 1 day which seemsto be in contrast with the optical variability observed on shortertimescales A smaller RB would require an increase in theelectron energy density (with no change in the magnetic fieldin order to preserve the flux level of the synchrotron peak) andwould lead to internal gammandashgamma absorption This problemcould be mitigated by choosing extremely high Doppler factorsD 100 However these are significantly larger than thevalues inferred from VLBI observations of Fermi-LAT blazars(Savolainen et al 2010)131 Moreover all SSC models requirevery low magnetic fields far below the value expected fromequipartition (εB = LBLe sim 10minus3 1) where LB is thePoynting flux derived from the magnetic energy density and Le
131 As a caveat jet models with a decelerating flow (Georganopoulos ampKazanas 2003 Piner et al 2008) or with inhomogeneous transverse structure(Ghisellini et al 2005 Henri amp Sauge 2006) can accommodate very highDoppler factors in the gamma-ray emitting region and still be consistent withthe VLBI observations of the large scale jet
is the energy flux of the electrons propagating along the jetTable 4 lists the parameters used for the SSC models displayedin Figure 7
Subsequently an external infrared radiation field with adhoc properties was included as a source of photons to beCompton scattered For all SSC+EC models shown in Figure 8the peak frequency of the external radiation field is set toνext = 14 times 1014 Hz corresponding to near-IR This adoptedvalue is high enough to produce E 100 GeV photons from ICscattering off the synchrotron electrons and at the same time isbelow the energy regime in which KleinndashNishina effects takeplace Although the weighted sums of squared residuals forEC+SSC models are generally worse than for pure SSC modelsreasonable agreement with the overall SED can still be achievedfor redshifts z 03 Furthermore all SSC+EC models areconsistent with a variability timescale of Δtvar sim 4 hr Thisis in better agreement with the observed variability at opticalwavelengths than the pure SSC interpretation Also while theSSC+EC interpretation still requires sub-equipartition magneticfields the magnetic fields are significantly closer to equipartitionthan in the pure SSC case with LBLe sim 01 The parametersof the SSC+EC models are listed in Table 5
Models with and without EC component yield the bestagreement with the SED if the source is located at a redshiftz sim 02ndash03 Of course this depends on the EBL model used inthe analysis An EBL model that predicts higher attenuation thanFranceschini et al (2008) would lead to a lower redshift rangeand make it even more difficult to have agreement betweenthe SED models and the data when the source is located atredshifts z 04 Finally it is worth mentioning that the redshiftrange z sim 02ndash03 is in agreement with previous estimates byFinke et al (2008) who estimate the redshift of 3C 66A to bez = 0321 based on the magnitude of the host galaxy and byPrandini et al (2010) who use an empirical relation betweenthe previously reported Fermi-LAT and IACTs spectral slopesof blazars and their redshifts to estimate the redshift of 3C 66Ato be below z = 034 plusmn 005
10
The Astrophysical Journal 72643 (14pp) 2011 January 1 Abdo et al
Figure 7 SSC models for redshifts z = 0444 03 02 and 01 from top to bottom The Fermi-LAT and VERITAS data points follow the same convention usedin Figures 1 and 6 to distinguish between flare (red) and dark run (blue) data points In each panel the EBL-absorbed model is shown as a solid red line and thede-absorbed model as a red dashed line De-absorbed VERITAS flare points are shown as open squares In all cases the optical depth values from Franceschini et al(2008) are used The best agreement between the model and the data is achieved when the source is located at z = 02ndash03 For lower redshifts the model spectrum issystematically too hard while at z = 0444 the model spectrum is too soft
A detailed study of hadronic versus leptonic modeling of the2008 October data will be published elsewhere but it is worthmentioning that the synchrotron proton blazar (SPB) model hasbeen used to adequately reproduce the quasi-simultaneous SEDobserved during the 2003ndash2004 multi-wavelength campaign(Reimer et al 2008) On that occasion rapid intra-day variationsdown to a 2 hr timescale were observed while during the2008 campaign presented here these variations seem less rapidQualitatively the longer timescale variations may be due toa lower Doppler beaming at the same time that a stronglyreprocessed proton synchrotron component dominates the highenergy output of this source
4 SUMMARY
Multi-wavelength observations of 3C 66A were carried outprompted by the gamma-ray outburst detected by the VERITASand Fermi observatories in 2008 October This marks the first
occasion that a gamma-ray flare is detected by GeV and TeVinstruments in comparable timescales The light curves obtainedshow strong variability at every observed wavelength and inparticular the flux increase observed by VERITAS and Fermiis coincident with an optical outburst The clear correlationbetween the Fermi-LAT and R optical light curves permits oneto go beyond the source association reported in the first Fermi-LAT source catalog (Abdo et al 2010a) and finally identify thegamma-ray source 1FGL J02226+4302 as blazar 3C 66A
For the modeling of the overall SED a reasonable agreementcan be achieved using both a pure SSC model and an SSC+ECmodel with an external near-infrared radiation field as anadditional source for Compton scattering However the pureSSC model requires (1) a large emission region which isinconsistent with the observed intra-night scale variability atoptical wavelengths and (2) low magnetic fields about afactor sim10minus3 below equipartition In contrast an SSC+ECinterpretation allows for variability on timescales of a few hours
11
The Astrophysical Journal 72643 (14pp) 2011 January 1 Abdo et al
Figure 8 EC+SSC model for redshifts z =0444 03 02 and 01 from top to bottom The individual EBL-absorbed EC and SSC components are indicated asdash-dotted and dotted lines respectively The sum is shown as a solid red line (dashed when de-absorbed) The best agreement between the model and the data isachieved when the source is located at z sim 02
Table 4Parameters Used for the SSC Models Displayed in Figure 7
Model Parameter z = 01 z = 02 z = 03 z = 0444
Low-energy cutoff γmin 18 times 104 20 times 104 22 times 104 25 times 104
High-energy cutoff γmax 30 times 105 40 times 105 40 times 105 50 times 105
Injection index q 29 29 30 30Injection luminosity Le (1045 erg sminus1) 13 33 57 128Comoving magnetic field B (G) 003 002 002 001Poynting flux LB (1042 erg sminus1) 11 49 85 137εB equiv LBLe 09 times 10minus3 15 times 10minus3 15 times 10minus3 11 times 10minus3
Doppler factor (D) 30 30 40 50Plasmoid radius RB (1016 cm) 22 60 70 11Variability timescale δtmin
var (hr) 74 221 211 294
Weighted sum of squared residuals to VERITAS flare data 71 09 07 62Weighted sum of squared residuals to Fermi-LAT flare data 16 16 13 14Total weighted sum of squared residuals 87 25 19 76
Notes All SSC models require very low magnetic fields far below the value expected from equipartition (ie εB 1) Theweighted sum of squared residuals to the VERITAS and Fermi-LAT data and the total value for the combined data set areincluded at the bottom of the table The best agreement between the model and the data is obtained when the source is at redshiftz = 02ndash03
12
The Astrophysical Journal 72643 (14pp) 2011 January 1 Abdo et al
Table 5Parameters Used for the EC+SSC Model Fits Displayed in Figure 8
Model Parameter z = 01 z = 02 z = 03 z = 0444
Low-energy cutoff γmin 55 times 103 70 times 103 65 times 103 60 times 103
High-energy cutoff γmax 12 times 105 1512 times 105 1512 times 105 1512 times 105
Injection index q 30 30 30 30Injection luminosity Le (1044 erg sminus1) 11 42 60 104Comoving magnetic field B (G) 035 022 021 023Poynting flux LB (1043 erg sminus1) 10 24 60 112εB equiv LBLe 010 006 010 011Doppler factor D 30 30 40 50Plasmoid radius RB (1016 cm) 05 12 15 15Variability timescale δtmin
var (hr) 17 44 45 40Ext radiation energy density (10minus6 erg cmminus3) 54 24 12 13
Weighted sum of squared residuals to VERITAS flare data 48 36 79 157Weighted sum of squared residuals to Fermi-LAT flare data 10 12 08 15Total weighted sum of squared residuals 58 48 87 172
Notes These model fits require magnetic fields closer to equipartition and allow for the intra-night variability observedin the optical data The weighted sum of squared residuals to the VERITAS and Fermi-LAT data and the total value forthe combined data set are included at the bottom of the table
and for magnetic fields within about an order of magnitudeof though still below equipartition It is worth noting that theresults presented here agree with the findings following the(E gt 200 GeV) flare of blazar W Comae (also an ISP) in 2008March (Acciari et al 2008a) In both cases the high opticalluminosity is expected to play a key role in providing the seedpopulation for IC scattering
Intermediate synchrotron peaked blazars like 3C 66A are wellsuited for simultaneous observations by Fermi-LAT and ground-based IACTs like VERITAS Relative to the sensitivities ofthese instruments ISPs are bright enough to allow for time-resolved spectral measurements in each band during flaringepisodes These types of observations coupled with extensivemulti-wavelength coverage at lower energies will continue toprovide key tests of blazar emission models
The Fermi-LAT Collaboration acknowledges generous ongo-ing support from a number of agencies and institutes that havesupported both the development and the operation of the LATas well as scientific data analysis These include the NationalAeronautics and Space Administration and the Department ofEnergy in the United States the Commissariat a lrsquoEnergie Atom-ique and the Centre National de la Recherche ScientifiqueInstitut National de Physique Nucleaire et de Physique desParticules in France the Agenzia Spaziale Italiana and theIstituto Nazionale di Fisica Nucleare in Italy the Ministry ofEducation Culture Sports Science and Technology (MEXT)High Energy Accelerator Research Organization (KEK) andJapan Aerospace Exploration Agency (JAXA) in Japan and theK A Wallenberg Foundation the Swedish Research Coun-cil and the Swedish National Space Board in Sweden Ad-ditional support for science analysis during the operationsphase is gratefully acknowledged from the Istituto Nazionale diAstrofisica in Italy and the Centre National drsquoEtudes Spatiales inFrance
The VERITAS collaboration acknowledges the generous sup-port from the US Department of Energy the US National Sci-ence Foundation and the Smithsonian Institution by NSERCin Canada by Science Foundation Ireland and by STFC inUK The VERITAS collaboration also acknowledges the excel-
lent work of the technical support staff at the FLWO and thecollaborating institutions in the construction and operation ofthe instrument as well as support from the NASASwift guestinvestigator program (grant NNX08AU13G) for the Swift ob-servations
PAIRITEL is operated by the Smithsonian AstrophysicalObservatory (SAO) and was made possible by a grant fromthe Harvard University Milton Fund a camera loan from theUniversity of Virginia and continued support of the SAO andUC Berkeley The PAIRITEL project is further supported byNASASwift Guest Investigator grant NNG06GH50G Thisresearch is partly based on observations with the 100 m telescopeof the MPIfR (Max-Planck-Institut fur Radioastronomie) atEffelsberg and has also made use of observations with the IRAM30 m telescope The Metsahovi team acknowledges the supportfrom the Academy of Finland The Abastumani Observatoryteam acknowledges financial support by the Georgian NationalScience Foundation through grant GNSFST084-404 The StPetersburg University team acknowledges support from RussianRFBR foundation via grant 09-02-00092 AZT-24 observationsare made within an agreement between Pulkovo Rome andTeramo observatories
L C Reyes acknowledges the support by the Kavli Institutefor Cosmological Physics at the University of Chicago throughgrants NSF PHY-0114422 and NSF PHY-0551142 and anendowment from the Kavli Foundation and its founder FredKavli M Bottcher acknowledges support from NASA throughChandra Guest Investigator Grant GO8-9100X Some of theVERITAS simulations used in this work have been performedon the joint Fermilab-KICP supercomputing cluster supportedby grants from Fermilab the Kavli Institute for CosmologicalPhysics and the University of Chicago
REFERENCES
Abdo A A et al 2009a Science 325 848Abdo A A et al 2009b ApJ 707 1310Abdo A A et al 2010a ApJS 188 405Abdo A A et al 2010b ApJ 710 1271Abdo A A et al 2010c ApJ 716 30Acciari V A et al 2008a ApJ 684 L73
13
The Astrophysical Journal 72643 (14pp) 2011 January 1 Abdo et al
Acciari V A et al 2008b ApJ 679 1427Acciari V A et al 2009 ApJ 693 L104Aliu E et al 2009 ApJ 692 L29Angelakis E Fuhrmann L Marchili N Krichbaum T P amp Zensus J A
2008 Mem Soc Astron Ital 79 1042Arnaud K A 1996 in ASP Conf Ser 101 Astronomical Data Analysis
Software and Systems V ed G H Jacoby amp J Barnes (San FranciscoCA ASP) 17
Atwood W B et al 2009 ApJ 697 1071Bennett A S 1962 Mem R Astron Soc 68 163Bloom J S Starr D L Blake C H Skrutskie M F amp Falco E E 2006
in ASP Conf Ser 351 Astronomical Data Analysis Software and SystemsXV ed C Gabriel C Arviset D Ponz amp S Enrique (San Francisco CAASP) 751
Bottcher M 2007 ApampSS 309 95Bottcher M amp Chiang J 2002 ApJ 581 127Bottcher M amp Dermer C D 2002 ApJ 564 86Bottcher M et al 2009 ApJ 694 174Bramel D A et al 2005 ApJ 629 108Britzen S et al 2007 AampA 472 763Britzen S et al 2008 AampA 484 119Cavaliere A amp DrsquoElia V 2002 ApJ 571 226Dermer C D amp Schlickeiser R 1993 ApJ 416 458Dickey J M amp Lockman F J 1990 ARAampA 28 215Edelson R A amp Krolik J H 1988 ApJ 333 646Finke J D Razzaque S amp Dermer C D 2010 ApJ 712 238Finke J D Shields J C Bottcher M amp Basu S 2008 AampA 477
513Fitzpatrick E L 1999 PASP 111 63Franceschini A Rodighiero G amp Vaccari M 2008 AampA 487 837Fuhrmann L Zensus J A Krichbaum T P Angelakis E amp Readhead A
C S 2007 in AIP Conf Proc 921 The First GLAST Symposium ed SRitz P Michelson amp C A Meegan (Melville NY AIP) 249
Fuhrmann L et al 2008 AampA 490 1019Gehrels N et al 2004 ApJ 611 1005Georganopoulos M amp Kazanas D 2003 ApJ 594 L27Georganopoulos M amp Kazanas D 2004 ApJ 604 L81Ghisellini G amp Madau P 1996 MNRAS 280 67Ghisellini G Tavecchio F amp Chiaberge M 2005 AampA 432 401Gilmore R C Madau P Primack J R Somerville R S amp Haardt F
2009 MNRAS 399 1694Hartman R C et al 1999 ApJS 123 79Henri G amp Sauge L 2006 ApJ 640 185Jorstad S G Marscher A P Mattox J R Wehrle A E Bloom S D amp
Yurchenko A V 2001 ApJS 134 181Joshi M amp Bottcher M 2007 ApJ 662 884
Kataoka J et al 1999 Astropart Phys 11 149Kerrick A D et al 1995 ApJ 452 588Kinney A L Bohlin R C Blades J C amp York D G 1991 ApJS 75
645Kuiper L Hermsen W Verbunt F Thompson D J Stairs I H Lyne A
G Strickman M S amp Cusumano G 2000 AampA 359 615Larionov V M et al 2008 ATel 1755 1Li T-P amp Ma Y-Q 1983 ApJ 272 317Mackay C D 1971 MNRAS 154 209Marscher A P Jorstad S G Mattox J R amp Wehrle A E 2002 ApJ 577
85Mattox J R et al 1996 ApJ 461 396Miller J S French H B amp Hawley S A 1978 Proc Pittsburgh Conf on
BL Lac Objects ed A M Wolfe 176Mucke A Protheroe R J Engel R Rachen J P amp Stanev T 2003
Astropart Phys 18 593Northover K J E 1973 MNRAS 165 369Oke J B et al 1995 PASP 107 375Piner B G Pant N amp Edwards P G 2008 ApJ 678 64Poole T S et al 2008 MNRAS 383 627Prandini E Bonnoli G Maraschi L Mariotti M amp Tavecchio F 2010
MNRAS 405 L76Reimer A Joshi M amp Bottcher M 2008 in AIP Conf Ser 1085 High
Energy Gamma-Ray Astronomy ed F A Aharonian W Hofmann amp FRieger (Melville NY AIP) 502
Savolainen T Homan D C Hovatta T Kadler M Kovalev Y Y ListerM L Ros E amp Zensus J A 2010 AampA 512 A24
Schlegel D J Finkbeiner D P amp Davis M 1998 ApJ 500 525Sikora M Begelman M C amp Rees M J 1994 ApJ 421 153Smith H E Smith E O amp Spinrad H 1976 PASP 88 621Stecker F W Malkan M A amp Scully S T 2006 ApJ 648 774 (erratum
658 1392 [2007])Swordy S 2008 ATel 1753 1Tavecchio F amp Ghisellini G 2009 MNRAS 394 L131Taylor G B Vermeulen R C Readhead A C S Pearson T J Henstock
D R amp Wilkinson P N 1996 ApJS 107 37Thompson D J et al 1993 ApJS 86 629Tosti G 2008 ATel 1759 1Urry C M amp Padovani P 1995 PASP 107 803Villata M et al 2008 AampA 481 L79Villata M et al 2009 AampA 504 L9Weekes T C 2000 in AIP Conf Ser 515 GeVndashTeV Gamma Ray Astrophysics
Workshop Towards a Major Atmospheric Cherenkov Detector VI ed B LDingus M H Salamon amp D B Kieda (Melville NY AIP) 3
Wills B J amp Wills D 1974 ApJ 190 L97Wurtz R Stocke J T amp Yee H K C 1996 ApJS 103 109
14
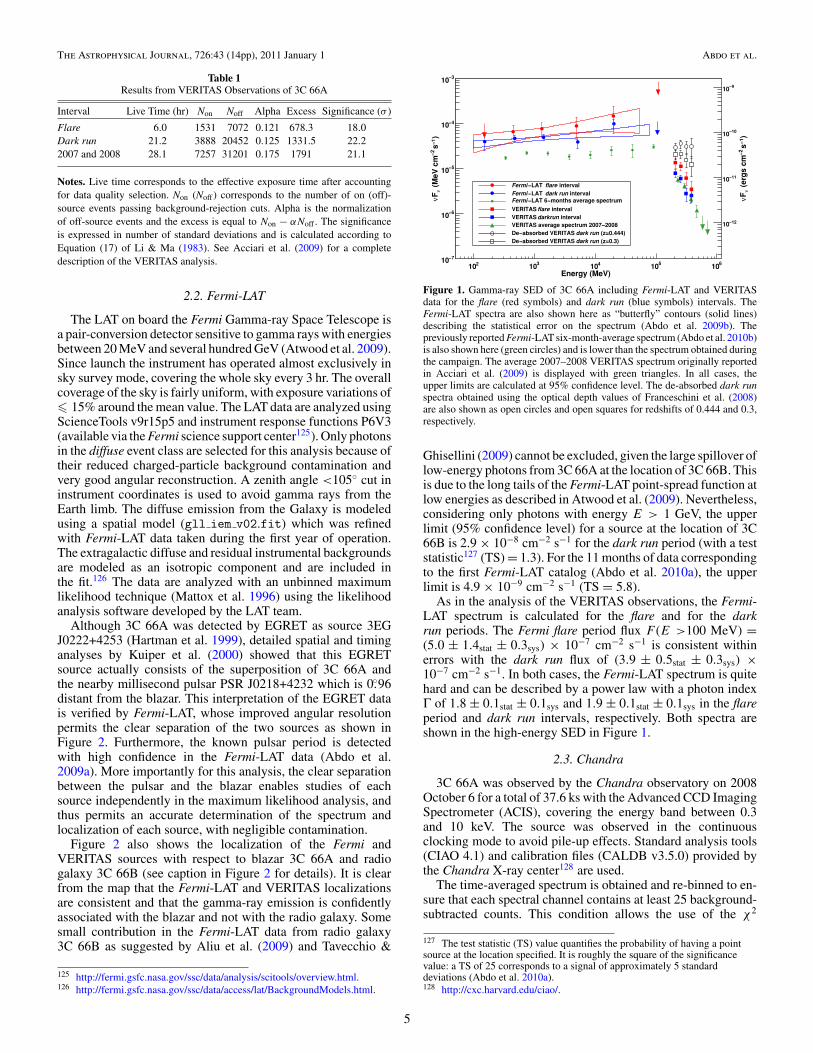
The Astrophysical Journal 72643 (14pp) 2011 January 1 Abdo et al
Table 1Results from VERITAS Observations of 3C 66A
Interval Live Time (hr) Non Noff Alpha Excess Significance (σ )
Flare 60 1531 7072 0121 6783 180Dark run 212 3888 20452 0125 13315 2222007 and 2008 281 7257 31201 0175 1791 211
Notes Live time corresponds to the effective exposure time after accountingfor data quality selection Non (Noff ) corresponds to the number of on (off)-source events passing background-rejection cuts Alpha is the normalizationof off-source events and the excess is equal to Non minus αNoff The significanceis expressed in number of standard deviations and is calculated according toEquation (17) of Li amp Ma (1983) See Acciari et al (2009) for a completedescription of the VERITAS analysis
22 Fermi-LAT
The LAT on board the Fermi Gamma-ray Space Telescope isa pair-conversion detector sensitive to gamma rays with energiesbetween 20 MeV and several hundred GeV (Atwood et al 2009)Since launch the instrument has operated almost exclusively insky survey mode covering the whole sky every 3 hr The overallcoverage of the sky is fairly uniform with exposure variations of 15 around the mean value The LAT data are analyzed usingScienceTools v9r15p5 and instrument response functions P6V3(available via the Fermi science support center125) Only photonsin the diffuse event class are selected for this analysis because oftheir reduced charged-particle background contamination andvery good angular reconstruction A zenith angle lt105 cut ininstrument coordinates is used to avoid gamma rays from theEarth limb The diffuse emission from the Galaxy is modeledusing a spatial model (gll iem v02fit) which was refinedwith Fermi-LAT data taken during the first year of operationThe extragalactic diffuse and residual instrumental backgroundsare modeled as an isotropic component and are included inthe fit126 The data are analyzed with an unbinned maximumlikelihood technique (Mattox et al 1996) using the likelihoodanalysis software developed by the LAT team
Although 3C 66A was detected by EGRET as source 3EGJ0222+4253 (Hartman et al 1999) detailed spatial and timinganalyses by Kuiper et al (2000) showed that this EGRETsource actually consists of the superposition of 3C 66A andthe nearby millisecond pulsar PSR J0218+4232 which is 096distant from the blazar This interpretation of the EGRET datais verified by Fermi-LAT whose improved angular resolutionpermits the clear separation of the two sources as shown inFigure 2 Furthermore the known pulsar period is detectedwith high confidence in the Fermi-LAT data (Abdo et al2009a) More importantly for this analysis the clear separationbetween the pulsar and the blazar enables studies of eachsource independently in the maximum likelihood analysis andthus permits an accurate determination of the spectrum andlocalization of each source with negligible contamination
Figure 2 also shows the localization of the Fermi andVERITAS sources with respect to blazar 3C 66A and radiogalaxy 3C 66B (see caption in Figure 2 for details) It is clearfrom the map that the Fermi-LAT and VERITAS localizationsare consistent and that the gamma-ray emission is confidentlyassociated with the blazar and not with the radio galaxy Somesmall contribution in the Fermi-LAT data from radio galaxy3C 66B as suggested by Aliu et al (2009) and Tavecchio amp
125 httpfermigsfcnasagovsscdataanalysisscitoolsoverviewhtml126 httpfermigsfcnasagovsscdataaccesslatBackgroundModelshtml
Energy (MeV)
210 310 410 510 610
)minus
1 s
minus2
(M
eV
cm
νFν
minus710
minus610
minus510
minus410
minus310
)minus
1 s
minus2
(e
rgs
cm
νFν
minus1210
minus1110
minus1010
minus910
intervalflareminusLATFermi intervaldark runminusLATFermi
minusLAT 6minusmonths average spectrumFermi
intervalflareVERITAS
intervaldarkrunVERITAS
VERITAS average spectrum 2007minus2008
(z=0444) dark runDeminusabsorbed VERITAS
(z=03) dark runDeminusabsorbed VERITAS
Figure 1 Gamma-ray SED of 3C 66A including Fermi-LAT and VERITASdata for the flare (red symbols) and dark run (blue symbols) intervals TheFermi-LAT spectra are also shown here as ldquobutterflyrdquo contours (solid lines)describing the statistical error on the spectrum (Abdo et al 2009b) Thepreviously reported Fermi-LAT six-month-average spectrum (Abdo et al 2010b)is also shown here (green circles) and is lower than the spectrum obtained duringthe campaign The average 2007ndash2008 VERITAS spectrum originally reportedin Acciari et al (2009) is displayed with green triangles In all cases theupper limits are calculated at 95 confidence level The de-absorbed dark runspectra obtained using the optical depth values of Franceschini et al (2008)are also shown as open circles and open squares for redshifts of 0444 and 03respectively
Ghisellini (2009) cannot be excluded given the large spillover oflow-energy photons from 3C 66A at the location of 3C 66B Thisis due to the long tails of the Fermi-LAT point-spread function atlow energies as described in Atwood et al (2009) Neverthelessconsidering only photons with energy E gt 1 GeV the upperlimit (95 confidence level) for a source at the location of 3C66B is 29 times 10minus8 cmminus2 sminus1 for the dark run period (with a teststatistic127 (TS) = 13) For the 11 months of data correspondingto the first Fermi-LAT catalog (Abdo et al 2010a) the upperlimit is 49 times 10minus9 cmminus2 sminus1 (TS = 58)
As in the analysis of the VERITAS observations the Fermi-LAT spectrum is calculated for the flare and for the darkrun periods The Fermi flare period flux F (E gt100 MeV) =(50 plusmn 14stat plusmn 03sys) times 10minus7 cmminus2 sminus1 is consistent withinerrors with the dark run flux of (39 plusmn 05stat plusmn 03sys) times10minus7 cmminus2 sminus1 In both cases the Fermi-LAT spectrum is quitehard and can be described by a power law with a photon indexΓ of 18 plusmn 01stat plusmn 01sys and 19 plusmn 01stat plusmn 01sys in the flareperiod and dark run intervals respectively Both spectra areshown in the high-energy SED in Figure 1
23 Chandra
3C 66A was observed by the Chandra observatory on 2008October 6 for a total of 376 ks with the Advanced CCD ImagingSpectrometer (ACIS) covering the energy band between 03and 10 keV The source was observed in the continuousclocking mode to avoid pile-up effects Standard analysis tools(CIAO 41) and calibration files (CALDB v350) provided bythe Chandra X-ray center128 are used
The time-averaged spectrum is obtained and re-binned to en-sure that each spectral channel contains at least 25 background-subtracted counts This condition allows the use of the χ2
127 The test statistic (TS) value quantifies the probability of having a pointsource at the location specified It is roughly the square of the significancevalue a TS of 25 corresponds to a signal of approximately 5 standarddeviations (Abdo et al 2010a)128 httpcxcharvardeduciao
5
The Astrophysical Journal 72643 (14pp) 2011 January 1 Abdo et al
Figure 2 Smoothed count map of the 3C 66A region as seen by Fermi-LAT between 2008 September 1 and December 31 with E gt 100 MeV The color bar hasunits of counts per pixel and the pixel dimensions are 01 times 01 The contour levels have been smoothed and correspond to 28 52 and 76 counts per pixel Thelocations of 3C 66A and 3C 66B (a radio galaxy that is 011 away) are shown as a cross and as a diamond respectively The location of millisecond pulsar PSR0218+4232 is also indicated with a white cross The magenta circle represents the VERITAS localization of the VHE source (RA DEC) = (2h22m41s6 plusmn 1s7stat plusmn6s0sys 4302prime35primeprime5 plusmn 21primeprime
stat plusmn 1prime30primeprimesys) as reported in Acciari et al (2009) The blue interior circle represents the 95 error radius of the Fermi-LAT localization
(RA DEC) = (02h22m40s3 plusmn 4s5 4302prime18primeprime6 plusmn 42primeprime1) as reported in the Fermi-LAT first source catalog (Abdo et al 2010a) All positions are based on the J2000epoch
quality-of-fit estimator to find the best-fit model XSPEC v124(Arnaud 1996) is used for the spectral analysis and fitting proce-dure Two spectral models have been used to fit the data singlepower law and broken power law Each model includes galacticH i column density (NHGal = 899 times 1020 cmminus2) according toDickey amp Lockman (1990) where the photoelectric absorptionis set with the XSPEC model phabs129 An additional local H i
column density was also tried but in both cases the spectra wereconsistent with pure galactic density Consequently the columndensity has been fixed to the galactic value in each model andthe results obtained are presented in Table 2 An F-test wasperformed to demonstrate that the spectral fit improves signif-icantly when using the extra degrees of freedom of the brokenpower-law model Table 2 also contains the results of the F-test
24 Swift XRT and UVOT
Following the VERITAS detection of VHE emission from3C 66A Target of Opportunity (ToO) observations of 3C 66Awith Swift were obtained for a total duration of sim10 ks TheSwift satellite observatory comprises an UVndashOptical telescope(UVOT) an X-ray telescope (XRT) and a Burst Alert Telescope(Gehrels et al 2004) Data reduction and calibration of the XRT
129 httpheasarcgsfcnasagovdocssoftwarelheasoftxanaduxspecmanualXSmodelPhabshtml
data are performed with HEASoft v65 standard tools AllXRT data presented here are taken in photon counting modewith negligible pile-up effects The X-ray spectrum of eachobservation is fitted with an absorbed power law using a fixedGalactic column density from Dickey amp Lockman (1990)which gives good χ2 values for all observations The measuredphoton spectral index ranges between 25 and 29 with a typicalstatistical uncertainty of 01
UVOT obtained data through each of six color filters VB and U together with filters defining three ultraviolet pass-bands UVW1 UVM2 and UVW2 with central wavelengths of260 nm 220 nm and 193 nm respectively The data are cal-ibrated using standard techniques (Poole et al 2008) and cor-rected for Galactic extinction by interpolating the absorptionvalues from Schlegel et al (1998) (EBminusV = 0083 mag) withthe galactic spectral extinction model of Fitzpatrick (1999)
25 Optical to Infrared Observations
The R magnitude of the host galaxy of 3C 66A is sim 19in the optical band (Wurtz et al 1996) Its contribution isnegligible compared to the typical AGN magnitude of R 15 therefore host-galaxy correction is not necessary
GASP-WEBT 3C 66A is continuously monitored by tele-scopes affiliated to the GLAST-AGILE support program of theWhole Earth Blazar Telescope (GASP-WEBT see Villata et al
6
The Astrophysical Journal 72643 (14pp) 2011 January 1 Abdo et al
Figure 3 3C 66A light curves covering 2008 August 22 to December 31 inorder of increasing wavelength The VERITAS observations are combined toobtain nightly flux values and the dashed and dotted lines represent the averageflux measured from the 2007 and 2008 data and its standard deviation TheFermi-LAT light curves contain time bins with a width of 3 days The averageflux and average photon index measured by Fermi-LAT during the first sixmonths of science operations are shown as horizontal lines in the respectivepanels In all cases the Fermi-LAT photon index is calculated over the 100MeV to 200 GeV energy range The long-term light curves at optical andinfrared wavelengths are presented in the two bottom panels In the bottompanel GASP-WEBT and PAIRITEL observations are represented by open andsolid symbols respectively
2008 2009) These observations provide a long-term light curveof this object with complete sampling as shown in Figure 3During the time interval in consideration (MJD 54700ndash54840)several observatories (Abastumani Armenzano Crimean ElVendrell LrsquoAmpolla Lulin New Mexico Skies Roque de losMuchachos (KVA) Rozhen Sabadell San Pedro Martir St Pe-tersburg Talmassons Teide (BRT) Torino Tuorla and Valledrsquo Aosta) contributed photometric observations in the R bandData in the J H and K bands were taken at the Campo Imper-atore observatory A list of the observatories and their locationsis available in Table 3
MDM Following the discovery of VHE emission 3C 66Awas observed with the 13 m telescope of the MDM Observatoryduring the nights of 2008 October 6ndash10 A total of 290 scienceframes in U B V and R bands (58 each) were taken throughoutthe entire visibility period (approx 430 ndash 1000 UT) duringeach night The light curves which cover the time around theflare are presented in Figure 4
ATOM Optical observations for this campaign in the R bandwere also obtained with the 08 m optical telescope ATOM
Figure 4 3C 66A light curves covering the period centered on the gamma-ray flare (2008 October 1ndash10) The VERITAS and Fermi-LAT panels werealready described in the caption of Figure 3 Swift Target-of-Opportunity(ToO) observations (panels 3ndash5 from the top) were obtained following thediscovery of VHE emission by VERITAS (Swordy 2008) Swift-UVOT andMDM observations are represented by open and solid symbols respectivelyThe optical light curve in panel 6 from the top displays intra-night variabilityAn example is identified in the plot when a rapid decline of the optical flux byΔFΔt sim minus02 mJy hrminus1 is observed on MJD 54747
in Namibia which monitors this source periodically Twentyphotometric observations are available starting on MJD 54740and are shown in Figures 3 and 4
PAIRITEL Near-infrared observations in the J H and Kswere obtained following the VHE flare with the 13 m PetersAutomated Infrared Imaging Telescope (PAIRITEL see Bloomet al 2006) located at the Fred Lawrence Whipple ObservatoryThe resulting light curves using differential photometry withfour nearby calibration stars are shown in Figure 4
Keck The optical spectrum of 3C 66A was measured withthe LRIS spectrometer (Oke et al 1995) on the Keck I telescopeon the night of 2009 September 17 under good conditions Theinstrument configuration resulted in a full width half-maximumof sim250 km sminus1 over the wavelength range 3200ndash5500 Aring (blueside) and sim200 km sminus1 over the range 6350ndash9000 Aring (red side)A series of exposures totaling 110 s (blue) and 50 s (red) wereobtained yielding a signal-to-noise (SN) per resolution elementof sim250 and 230 for the blue and red cameras respectively Thedata were reduced with the LowRedux130 pipeline and calibratedusing a spectrophotometric star observed on the same night
130 httpwwwucolickorgsimxavierLowReduxindexhtml
7
The Astrophysical Journal 72643 (14pp) 2011 January 1 Abdo et al
Table 2Best-fit Model Parameters for a Fit Performed to the Chandra Data in the 1ndash7 keV Energy Range
Single Power-law Model
Γ Flux (10minus12 erg cmminus2 sminus1) χ2dof
299 plusmn 003 347 plusmn 006 121 (2326193)
Broken Power-law Model
Γ1 Γ2 Flux (10minus12 erg cmminus2 sminus1) Break (keV) χ2dof F-test Probability
308+03minus05 224+023
037 358+007minus008 33+05
minus03 097 (1852191) 347 times 10minus10
Notes The galactic NHGal value is fixed to 899 times 1020 cmminus2 the value of the galactic H i column density according toDickey amp Lockman (1990) Errors indicate the 90 confidence level
Table 3List of Ground-based Observatories that Participated in This Campaign
Observatory Location Web Page
Radio Observatories
Crimean Radio Obs Ukraine wwwcraocrimeauaEffelsberg Germany wwwmpifrdeenglishradiotelescopeIRAM Spain wwwiram-instituteorgEN30-meter-telescopephpMedicina Italy wwwmedirainafitMetsahovi Finland wwwmetsahovifienNoto Italy wwwnotoirainafitUMRAO Michigan USA wwwastrolsaumicheduobsradiotel
Infrared Observatories
Campo Imperatore Italy wwwoa-teramoinafitPAIRITEL Arizona USA wwwpairitelorgOptical ObservatoriesAbastumani Georgia wwwgenaoorgArmenzano Italy wwwwebaliceitdcarosatiATOM Namibia wwwlswuni-heidelbergdeprojectshessATOMCrimean Astr Obs Ukraine wwwcraocrimeauaEl Vendrell SpainKitt Peak (MDM) Arizona USA wwwastrolsaumicheduobsmdmLrsquoAmpolla SpainLulin Taiwan wwwlulinncuedutwenglishNew Mexico Skies Obs New Mexico USA wwwnmskiescomRoque (KVA) Canary Islands Spain wwwotriiacesenonthtmRozhen Bulgaria wwwastrobasbgrozhenhtmlSabadell Spain wwwastrosabadellorghtmlesobservatoriosabhtmSan Pedro Martir Mexico wwwastrosspunammxindexspmhtmlSt Petersburg Russia wwwgaospbruTalmassons Italy wwwcastfvgitTeide (BRT) Canary Islands Spain wwwtelescopeorgTorino Italy wwwtoastroitTuorla Finland wwwastroutufiValle drsquo Aosta Italy wwwoavdaitenglishosservatorio
Gamma-ray Observatory
VERITAS Arizona USA wwwveritassaoarizonaedu
Inspection of the 3C 66A spectrum reveals no spectral featuresaside from those imposed by Earthrsquos atmosphere and the MilkyWay (Ca H+K) Therefore these new data do not offer anyinsight on the redshift of 3C 66A and in particular are unableto confirm the previously reported value of z = 0444 (Milleret al 1978)
26 Radio Observations
Radio observations are available thanks to the F-GAMMA(Fermi-Gamma-ray Space Telescope AGN Multi-frequencyMonitoring Alliance) program which is dedicated to monthly
monitoring of selected Fermi-LAT blazars (Fuhrmann et al2007 Angelakis et al 2008) Radio flux density measurementswere conducted with the 100 m Effelsberg radio telescope at485 835 1045 and 1460 GHz on 2008 October 16 Thesedata are supplemented with an additional measurement at 86GHz conducted with the IRAM 30 m telescope (Pico VeletaSpain) on 2008 October 8 The data were reduced using stan-dard procedures described in Fuhrmann et al (2008) Additionalradio observations taken between 2008 October 5 and 15 (con-temporaneous to the flare period) are provided by the MedicinaMetsahovi Noto and UMRAO observatories all of which aremembers of the GASP-WEBT consortium
8
The Astrophysical Journal 72643 (14pp) 2011 January 1 Abdo et al
3 DISCUSSION
31 Light Curves
The resulting multi-wavelength light curves from this cam-paign are shown in Figure 3 for those bands with long-term cov-erage and in Figure 4 for those observations that were obtainedshortly before and after the gamma-ray flare The VERITASobservations are combined to obtain nightly (E gt 200 GeV)flux values since no evidence for intra-night variability is ob-served The highest flux occurred on MJD 54749 and significantvariability is observed during the whole interval (χ2 probabilityless than 10minus4 for a fit of a constant flux)
The temporal dependence of the Fermi-LAT photon index andintegral flux above 100 MeV and 1 GeV are shown with timebins with width of 3 days in Figure 3 For those time intervalswith no significant detection a 95 confidence flux upper limitis calculated The flux and photon index from the Fermi-LATfirst source catalog (Abdo et al 2010a) are shown as horizontallines for comparison These values correspond to the averageflux and photon index measured during the first 11 months ofFermi operations and thus span the time interval considered inthe figures It is evident from the plot that the VHE flare detectedby VERITAS starting on MJD 54740 is coincident with a periodof high flux in the Fermi energy band The photon index duringthis time interval is consistent within errors with the averagephoton index Γ = 195 plusmn 003 measured during the first sixmonths of the Fermi mission (Abdo et al 2010b)
Long-term and well-sampled light curves are available atoptical and near-infrared wavelengths thanks to observations byGASP-WEBT ATOM MDM and PAIRITEL Unfortunatelyradio observations were too limited to obtain a light curve andno statement about variability in this band can be made Thebest sampling is available for the R band for which variationswith a factor of 2 are observed in the long-term light curveFurthermore variability on timescales of less than a day isobserved as indicated in Figure 4 and as previously reportedby Bottcher et al (2009) following the WEBT (Whole EarthBlazar Telescope) campaign on 3C 66A in 2007 and 2008
The increase in gamma-ray flux observed in the Fermi bandseems contemporaneous with a period of increased flux in theoptical and to test this hypothesis the discrete correlationfunction (DCF) is used (Edelson amp Krolik 1988) Figure 5shows the DCF of the F(E gt 1 GeV) gamma-ray band withrespect to the R band with time-lag bins of 3 5 and 7 days Theprofile of the DCF is consistent for all time-lag bins indicatingthat the result is independent of bin size The DCF with time-lagbins of 3 days was fitted with a Gaussian function of the formDCF(τ ) = Cmax times exp (τ minus τ0)2σ 2 where Cmax is the peakvalue of the DCF τ0 is the delay timescale at which the DCFpeaks and σ parameterizes the Gaussian width of the DCF Thebest-fit function is plotted in Figure 5 and the best-fit parametersare Cmax = 11 plusmn 03 τ0 = (07 plusmn 07) days and σ = (33 plusmn07) days An identical analysis was also performed betweenthe F(E gt 100 MeV) and the R optical band with consistentresults This indicates a clear correlation between the Fermi-LAT and optical energy bands with a time lag that is consistentwith zero and not greater than sim5 days Despite the sparsity ofthe VERITAS light curve (due in part to the time periods whenthe source was not observable due to the full Moon) the DCFanalysis was also performed to search for correlations with eitherthe Fermi-LAT or optical data Apart from the overall increasein flux no significant correlations can be established The onsetof the E gt 200 GeV flare seems delayed by about sim5 days
Time lag [days]minus30 minus20 minus10 0 10 20 30
DC
F
minus1
minus05
0
05
1
15 Bin Size3 days
5 days
7 days
Figure 5 Discrete correlation function (DCF) of the F(E gt 1 GeV) gamma-raylight curve with respect to the R-band light curve A positive time lag indicatesthat the gamma-ray band leads the optical band Different symbols correspondto different bin sizes of time lag as indicated in the legend The profile of theDCF is independent of bin size and is well described by a Gaussian functionof the form DCF(τ ) = Cmax times exp (τ minus τ0)2σ 2 The fit to the 3-day bin sizedistribution is shown in the plot as a solid black line and the best-fit parametersare Cmax = 11 plusmn 03 τ0 = (07 plusmn 07) days and σ = (33 plusmn 07) days
with respect to the opticalndashGeV flare but given the coveragegaps no firm conclusion can be drawn (eg the flare could havebeen already underway when the observations took place) Nosuch lag is expected from the homogeneous model described inthe next section but could arise in models with complex energystratification and geometry in the emitting region
32 SED and Modeling
The broadband SED derived from these observations ispresented in Figure 6 and modeled using the code of Bottcher ampChiang (2002) In this model a power-law distribution of ultra-relativistic electrons andor pairs with lower and upper energycutoffs at γmin and γmax respectively and power-law index qis injected into a spherical region of comoving radius RB Theinjection rate is normalized to an injection luminosity Le whichis a free input parameter of the model The model assumesa temporary equilibrium between particle injection radiativecooling due to synchrotron and Compton losses and particleescape on a time tesc equiv ηesc RBc where ηesc is a scale parameterin the range sim250ndash500 Both the internal synchrotron photonfield (SSC) and external photon sources (EC) are considered astargets for Compton scattering The emission region is movingwith a bulk Lorentz factor Γ along the jet To reduce the numberof free parameters we assume that the jet is oriented with respectto the line of sight at the superluminal angle so that the Dopplerfactor is equal to D = (Γ [1 minus β cos θobs])
minus1 = Γ where θobs isthe angle of the jet with respect to the line of sight Given theuncertainty in the redshift determination of 3C 66A a range ofplausible redshifts namely z = 01 02 03 and the generallyused catalog value z = 0444 are considered for the modelingAll model fits include EBL absorption using the optical depthvalues from Franceschini et al (2008)
Most VHE blazars known to date are high synchrotron peaked(HSP) blazars whose SEDs can often be fitted satisfactorilywith pure SSC models Since the transition from HSP to ISP iscontinuous a pure SSC model was fitted first to the radio throughVHE gamma-ray SED Independently of the model underconsideration the low-frequency part of the SED (lt1020 Hz) iswell fitted with a synchrotron component as shown in Figure 6
9
The Astrophysical Journal 72643 (14pp) 2011 January 1 Abdo et al
Figure 6 Broadband SED of 3C 66A during the 2008 October multi-wavelength campaign The observation that corresponds to each set of data points is indicated inthe legend As an example the EBL-absorbed EC+SSC model for z = 03 is plotted here for reference A description of the model is provided in the text
For clarity only the high-frequency range is shown in Figures 7and 8 where the different models are compared As can beseen from the figures a reasonable agreement with the overallSED can be achieved for any redshift in the range exploredThe weighted sum of squared residuals has been calculatedfor the Fermi-LAT and VERITAS flare data (8 data points intotal) in order to quantify the scatter of the points with respectto the model and is shown in Table 4 The best agreement isachieved when the source is located at z sim 02ndash03 For lowerredshifts the model spectrum is systematically too hard whileat z = 0444 the model spectrum is invariably too soft as a resultof EBL absorption It should be noted that the EBL model ofFranceschini et al (2008) predicts some of the lowest opticaldepth values in comparison to other models (Finke et al 2010Gilmore et al 2009 Stecker et al 2006) Thus a model spectrumwith redshift of 03 or above would be even harder to reconcilewith the observations when using other EBL models
A major problem of the SSC models with z 01 is thatRB is of the order of 5 times 1016 cm This does not allowfor variability timescales shorter than 1 day which seemsto be in contrast with the optical variability observed on shortertimescales A smaller RB would require an increase in theelectron energy density (with no change in the magnetic fieldin order to preserve the flux level of the synchrotron peak) andwould lead to internal gammandashgamma absorption This problemcould be mitigated by choosing extremely high Doppler factorsD 100 However these are significantly larger than thevalues inferred from VLBI observations of Fermi-LAT blazars(Savolainen et al 2010)131 Moreover all SSC models requirevery low magnetic fields far below the value expected fromequipartition (εB = LBLe sim 10minus3 1) where LB is thePoynting flux derived from the magnetic energy density and Le
131 As a caveat jet models with a decelerating flow (Georganopoulos ampKazanas 2003 Piner et al 2008) or with inhomogeneous transverse structure(Ghisellini et al 2005 Henri amp Sauge 2006) can accommodate very highDoppler factors in the gamma-ray emitting region and still be consistent withthe VLBI observations of the large scale jet
is the energy flux of the electrons propagating along the jetTable 4 lists the parameters used for the SSC models displayedin Figure 7
Subsequently an external infrared radiation field with adhoc properties was included as a source of photons to beCompton scattered For all SSC+EC models shown in Figure 8the peak frequency of the external radiation field is set toνext = 14 times 1014 Hz corresponding to near-IR This adoptedvalue is high enough to produce E 100 GeV photons from ICscattering off the synchrotron electrons and at the same time isbelow the energy regime in which KleinndashNishina effects takeplace Although the weighted sums of squared residuals forEC+SSC models are generally worse than for pure SSC modelsreasonable agreement with the overall SED can still be achievedfor redshifts z 03 Furthermore all SSC+EC models areconsistent with a variability timescale of Δtvar sim 4 hr Thisis in better agreement with the observed variability at opticalwavelengths than the pure SSC interpretation Also while theSSC+EC interpretation still requires sub-equipartition magneticfields the magnetic fields are significantly closer to equipartitionthan in the pure SSC case with LBLe sim 01 The parametersof the SSC+EC models are listed in Table 5
Models with and without EC component yield the bestagreement with the SED if the source is located at a redshiftz sim 02ndash03 Of course this depends on the EBL model used inthe analysis An EBL model that predicts higher attenuation thanFranceschini et al (2008) would lead to a lower redshift rangeand make it even more difficult to have agreement betweenthe SED models and the data when the source is located atredshifts z 04 Finally it is worth mentioning that the redshiftrange z sim 02ndash03 is in agreement with previous estimates byFinke et al (2008) who estimate the redshift of 3C 66A to bez = 0321 based on the magnitude of the host galaxy and byPrandini et al (2010) who use an empirical relation betweenthe previously reported Fermi-LAT and IACTs spectral slopesof blazars and their redshifts to estimate the redshift of 3C 66Ato be below z = 034 plusmn 005
10
The Astrophysical Journal 72643 (14pp) 2011 January 1 Abdo et al
Figure 7 SSC models for redshifts z = 0444 03 02 and 01 from top to bottom The Fermi-LAT and VERITAS data points follow the same convention usedin Figures 1 and 6 to distinguish between flare (red) and dark run (blue) data points In each panel the EBL-absorbed model is shown as a solid red line and thede-absorbed model as a red dashed line De-absorbed VERITAS flare points are shown as open squares In all cases the optical depth values from Franceschini et al(2008) are used The best agreement between the model and the data is achieved when the source is located at z = 02ndash03 For lower redshifts the model spectrum issystematically too hard while at z = 0444 the model spectrum is too soft
A detailed study of hadronic versus leptonic modeling of the2008 October data will be published elsewhere but it is worthmentioning that the synchrotron proton blazar (SPB) model hasbeen used to adequately reproduce the quasi-simultaneous SEDobserved during the 2003ndash2004 multi-wavelength campaign(Reimer et al 2008) On that occasion rapid intra-day variationsdown to a 2 hr timescale were observed while during the2008 campaign presented here these variations seem less rapidQualitatively the longer timescale variations may be due toa lower Doppler beaming at the same time that a stronglyreprocessed proton synchrotron component dominates the highenergy output of this source
4 SUMMARY
Multi-wavelength observations of 3C 66A were carried outprompted by the gamma-ray outburst detected by the VERITASand Fermi observatories in 2008 October This marks the first
occasion that a gamma-ray flare is detected by GeV and TeVinstruments in comparable timescales The light curves obtainedshow strong variability at every observed wavelength and inparticular the flux increase observed by VERITAS and Fermiis coincident with an optical outburst The clear correlationbetween the Fermi-LAT and R optical light curves permits oneto go beyond the source association reported in the first Fermi-LAT source catalog (Abdo et al 2010a) and finally identify thegamma-ray source 1FGL J02226+4302 as blazar 3C 66A
For the modeling of the overall SED a reasonable agreementcan be achieved using both a pure SSC model and an SSC+ECmodel with an external near-infrared radiation field as anadditional source for Compton scattering However the pureSSC model requires (1) a large emission region which isinconsistent with the observed intra-night scale variability atoptical wavelengths and (2) low magnetic fields about afactor sim10minus3 below equipartition In contrast an SSC+ECinterpretation allows for variability on timescales of a few hours
11
The Astrophysical Journal 72643 (14pp) 2011 January 1 Abdo et al
Figure 8 EC+SSC model for redshifts z =0444 03 02 and 01 from top to bottom The individual EBL-absorbed EC and SSC components are indicated asdash-dotted and dotted lines respectively The sum is shown as a solid red line (dashed when de-absorbed) The best agreement between the model and the data isachieved when the source is located at z sim 02
Table 4Parameters Used for the SSC Models Displayed in Figure 7
Model Parameter z = 01 z = 02 z = 03 z = 0444
Low-energy cutoff γmin 18 times 104 20 times 104 22 times 104 25 times 104
High-energy cutoff γmax 30 times 105 40 times 105 40 times 105 50 times 105
Injection index q 29 29 30 30Injection luminosity Le (1045 erg sminus1) 13 33 57 128Comoving magnetic field B (G) 003 002 002 001Poynting flux LB (1042 erg sminus1) 11 49 85 137εB equiv LBLe 09 times 10minus3 15 times 10minus3 15 times 10minus3 11 times 10minus3
Doppler factor (D) 30 30 40 50Plasmoid radius RB (1016 cm) 22 60 70 11Variability timescale δtmin
var (hr) 74 221 211 294
Weighted sum of squared residuals to VERITAS flare data 71 09 07 62Weighted sum of squared residuals to Fermi-LAT flare data 16 16 13 14Total weighted sum of squared residuals 87 25 19 76
Notes All SSC models require very low magnetic fields far below the value expected from equipartition (ie εB 1) Theweighted sum of squared residuals to the VERITAS and Fermi-LAT data and the total value for the combined data set areincluded at the bottom of the table The best agreement between the model and the data is obtained when the source is at redshiftz = 02ndash03
12
The Astrophysical Journal 72643 (14pp) 2011 January 1 Abdo et al
Table 5Parameters Used for the EC+SSC Model Fits Displayed in Figure 8
Model Parameter z = 01 z = 02 z = 03 z = 0444
Low-energy cutoff γmin 55 times 103 70 times 103 65 times 103 60 times 103
High-energy cutoff γmax 12 times 105 1512 times 105 1512 times 105 1512 times 105
Injection index q 30 30 30 30Injection luminosity Le (1044 erg sminus1) 11 42 60 104Comoving magnetic field B (G) 035 022 021 023Poynting flux LB (1043 erg sminus1) 10 24 60 112εB equiv LBLe 010 006 010 011Doppler factor D 30 30 40 50Plasmoid radius RB (1016 cm) 05 12 15 15Variability timescale δtmin
var (hr) 17 44 45 40Ext radiation energy density (10minus6 erg cmminus3) 54 24 12 13
Weighted sum of squared residuals to VERITAS flare data 48 36 79 157Weighted sum of squared residuals to Fermi-LAT flare data 10 12 08 15Total weighted sum of squared residuals 58 48 87 172
Notes These model fits require magnetic fields closer to equipartition and allow for the intra-night variability observedin the optical data The weighted sum of squared residuals to the VERITAS and Fermi-LAT data and the total value forthe combined data set are included at the bottom of the table
and for magnetic fields within about an order of magnitudeof though still below equipartition It is worth noting that theresults presented here agree with the findings following the(E gt 200 GeV) flare of blazar W Comae (also an ISP) in 2008March (Acciari et al 2008a) In both cases the high opticalluminosity is expected to play a key role in providing the seedpopulation for IC scattering
Intermediate synchrotron peaked blazars like 3C 66A are wellsuited for simultaneous observations by Fermi-LAT and ground-based IACTs like VERITAS Relative to the sensitivities ofthese instruments ISPs are bright enough to allow for time-resolved spectral measurements in each band during flaringepisodes These types of observations coupled with extensivemulti-wavelength coverage at lower energies will continue toprovide key tests of blazar emission models
The Fermi-LAT Collaboration acknowledges generous ongo-ing support from a number of agencies and institutes that havesupported both the development and the operation of the LATas well as scientific data analysis These include the NationalAeronautics and Space Administration and the Department ofEnergy in the United States the Commissariat a lrsquoEnergie Atom-ique and the Centre National de la Recherche ScientifiqueInstitut National de Physique Nucleaire et de Physique desParticules in France the Agenzia Spaziale Italiana and theIstituto Nazionale di Fisica Nucleare in Italy the Ministry ofEducation Culture Sports Science and Technology (MEXT)High Energy Accelerator Research Organization (KEK) andJapan Aerospace Exploration Agency (JAXA) in Japan and theK A Wallenberg Foundation the Swedish Research Coun-cil and the Swedish National Space Board in Sweden Ad-ditional support for science analysis during the operationsphase is gratefully acknowledged from the Istituto Nazionale diAstrofisica in Italy and the Centre National drsquoEtudes Spatiales inFrance
The VERITAS collaboration acknowledges the generous sup-port from the US Department of Energy the US National Sci-ence Foundation and the Smithsonian Institution by NSERCin Canada by Science Foundation Ireland and by STFC inUK The VERITAS collaboration also acknowledges the excel-
lent work of the technical support staff at the FLWO and thecollaborating institutions in the construction and operation ofthe instrument as well as support from the NASASwift guestinvestigator program (grant NNX08AU13G) for the Swift ob-servations
PAIRITEL is operated by the Smithsonian AstrophysicalObservatory (SAO) and was made possible by a grant fromthe Harvard University Milton Fund a camera loan from theUniversity of Virginia and continued support of the SAO andUC Berkeley The PAIRITEL project is further supported byNASASwift Guest Investigator grant NNG06GH50G Thisresearch is partly based on observations with the 100 m telescopeof the MPIfR (Max-Planck-Institut fur Radioastronomie) atEffelsberg and has also made use of observations with the IRAM30 m telescope The Metsahovi team acknowledges the supportfrom the Academy of Finland The Abastumani Observatoryteam acknowledges financial support by the Georgian NationalScience Foundation through grant GNSFST084-404 The StPetersburg University team acknowledges support from RussianRFBR foundation via grant 09-02-00092 AZT-24 observationsare made within an agreement between Pulkovo Rome andTeramo observatories
L C Reyes acknowledges the support by the Kavli Institutefor Cosmological Physics at the University of Chicago throughgrants NSF PHY-0114422 and NSF PHY-0551142 and anendowment from the Kavli Foundation and its founder FredKavli M Bottcher acknowledges support from NASA throughChandra Guest Investigator Grant GO8-9100X Some of theVERITAS simulations used in this work have been performedon the joint Fermilab-KICP supercomputing cluster supportedby grants from Fermilab the Kavli Institute for CosmologicalPhysics and the University of Chicago
REFERENCES
Abdo A A et al 2009a Science 325 848Abdo A A et al 2009b ApJ 707 1310Abdo A A et al 2010a ApJS 188 405Abdo A A et al 2010b ApJ 710 1271Abdo A A et al 2010c ApJ 716 30Acciari V A et al 2008a ApJ 684 L73
13
The Astrophysical Journal 72643 (14pp) 2011 January 1 Abdo et al
Acciari V A et al 2008b ApJ 679 1427Acciari V A et al 2009 ApJ 693 L104Aliu E et al 2009 ApJ 692 L29Angelakis E Fuhrmann L Marchili N Krichbaum T P amp Zensus J A
2008 Mem Soc Astron Ital 79 1042Arnaud K A 1996 in ASP Conf Ser 101 Astronomical Data Analysis
Software and Systems V ed G H Jacoby amp J Barnes (San FranciscoCA ASP) 17
Atwood W B et al 2009 ApJ 697 1071Bennett A S 1962 Mem R Astron Soc 68 163Bloom J S Starr D L Blake C H Skrutskie M F amp Falco E E 2006
in ASP Conf Ser 351 Astronomical Data Analysis Software and SystemsXV ed C Gabriel C Arviset D Ponz amp S Enrique (San Francisco CAASP) 751
Bottcher M 2007 ApampSS 309 95Bottcher M amp Chiang J 2002 ApJ 581 127Bottcher M amp Dermer C D 2002 ApJ 564 86Bottcher M et al 2009 ApJ 694 174Bramel D A et al 2005 ApJ 629 108Britzen S et al 2007 AampA 472 763Britzen S et al 2008 AampA 484 119Cavaliere A amp DrsquoElia V 2002 ApJ 571 226Dermer C D amp Schlickeiser R 1993 ApJ 416 458Dickey J M amp Lockman F J 1990 ARAampA 28 215Edelson R A amp Krolik J H 1988 ApJ 333 646Finke J D Razzaque S amp Dermer C D 2010 ApJ 712 238Finke J D Shields J C Bottcher M amp Basu S 2008 AampA 477
513Fitzpatrick E L 1999 PASP 111 63Franceschini A Rodighiero G amp Vaccari M 2008 AampA 487 837Fuhrmann L Zensus J A Krichbaum T P Angelakis E amp Readhead A
C S 2007 in AIP Conf Proc 921 The First GLAST Symposium ed SRitz P Michelson amp C A Meegan (Melville NY AIP) 249
Fuhrmann L et al 2008 AampA 490 1019Gehrels N et al 2004 ApJ 611 1005Georganopoulos M amp Kazanas D 2003 ApJ 594 L27Georganopoulos M amp Kazanas D 2004 ApJ 604 L81Ghisellini G amp Madau P 1996 MNRAS 280 67Ghisellini G Tavecchio F amp Chiaberge M 2005 AampA 432 401Gilmore R C Madau P Primack J R Somerville R S amp Haardt F
2009 MNRAS 399 1694Hartman R C et al 1999 ApJS 123 79Henri G amp Sauge L 2006 ApJ 640 185Jorstad S G Marscher A P Mattox J R Wehrle A E Bloom S D amp
Yurchenko A V 2001 ApJS 134 181Joshi M amp Bottcher M 2007 ApJ 662 884
Kataoka J et al 1999 Astropart Phys 11 149Kerrick A D et al 1995 ApJ 452 588Kinney A L Bohlin R C Blades J C amp York D G 1991 ApJS 75
645Kuiper L Hermsen W Verbunt F Thompson D J Stairs I H Lyne A
G Strickman M S amp Cusumano G 2000 AampA 359 615Larionov V M et al 2008 ATel 1755 1Li T-P amp Ma Y-Q 1983 ApJ 272 317Mackay C D 1971 MNRAS 154 209Marscher A P Jorstad S G Mattox J R amp Wehrle A E 2002 ApJ 577
85Mattox J R et al 1996 ApJ 461 396Miller J S French H B amp Hawley S A 1978 Proc Pittsburgh Conf on
BL Lac Objects ed A M Wolfe 176Mucke A Protheroe R J Engel R Rachen J P amp Stanev T 2003
Astropart Phys 18 593Northover K J E 1973 MNRAS 165 369Oke J B et al 1995 PASP 107 375Piner B G Pant N amp Edwards P G 2008 ApJ 678 64Poole T S et al 2008 MNRAS 383 627Prandini E Bonnoli G Maraschi L Mariotti M amp Tavecchio F 2010
MNRAS 405 L76Reimer A Joshi M amp Bottcher M 2008 in AIP Conf Ser 1085 High
Energy Gamma-Ray Astronomy ed F A Aharonian W Hofmann amp FRieger (Melville NY AIP) 502
Savolainen T Homan D C Hovatta T Kadler M Kovalev Y Y ListerM L Ros E amp Zensus J A 2010 AampA 512 A24
Schlegel D J Finkbeiner D P amp Davis M 1998 ApJ 500 525Sikora M Begelman M C amp Rees M J 1994 ApJ 421 153Smith H E Smith E O amp Spinrad H 1976 PASP 88 621Stecker F W Malkan M A amp Scully S T 2006 ApJ 648 774 (erratum
658 1392 [2007])Swordy S 2008 ATel 1753 1Tavecchio F amp Ghisellini G 2009 MNRAS 394 L131Taylor G B Vermeulen R C Readhead A C S Pearson T J Henstock
D R amp Wilkinson P N 1996 ApJS 107 37Thompson D J et al 1993 ApJS 86 629Tosti G 2008 ATel 1759 1Urry C M amp Padovani P 1995 PASP 107 803Villata M et al 2008 AampA 481 L79Villata M et al 2009 AampA 504 L9Weekes T C 2000 in AIP Conf Ser 515 GeVndashTeV Gamma Ray Astrophysics
Workshop Towards a Major Atmospheric Cherenkov Detector VI ed B LDingus M H Salamon amp D B Kieda (Melville NY AIP) 3
Wills B J amp Wills D 1974 ApJ 190 L97Wurtz R Stocke J T amp Yee H K C 1996 ApJS 103 109
14
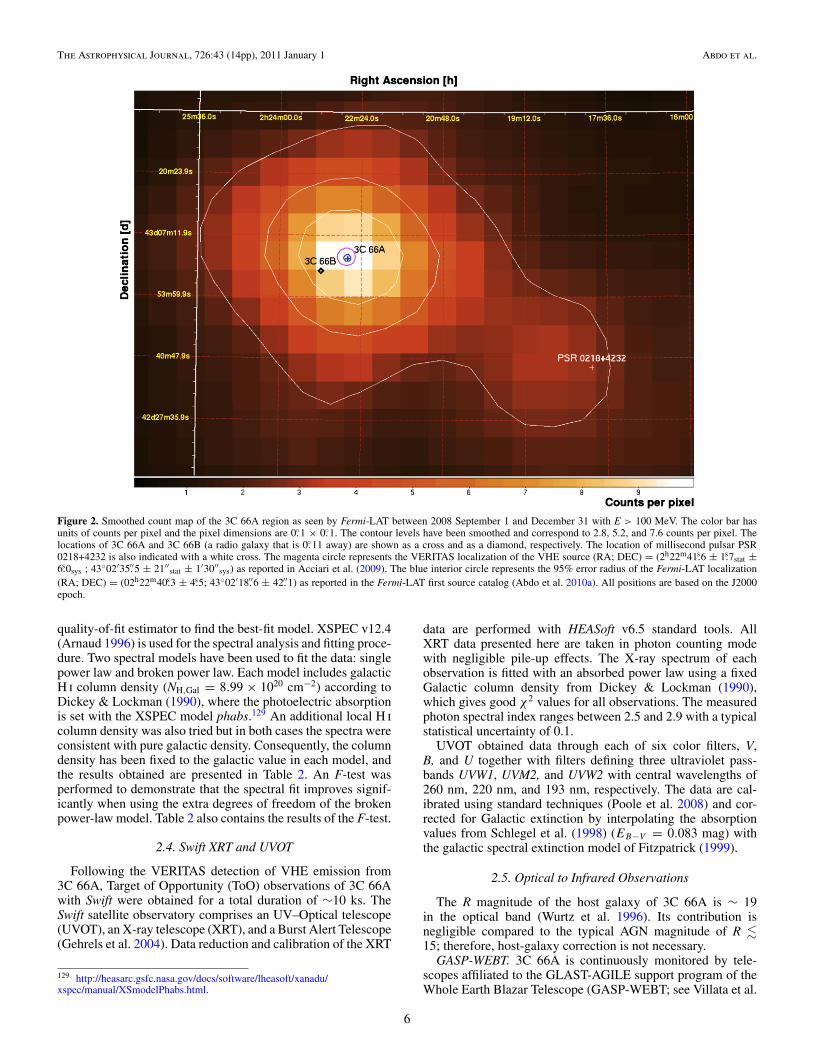
The Astrophysical Journal 72643 (14pp) 2011 January 1 Abdo et al
Figure 2 Smoothed count map of the 3C 66A region as seen by Fermi-LAT between 2008 September 1 and December 31 with E gt 100 MeV The color bar hasunits of counts per pixel and the pixel dimensions are 01 times 01 The contour levels have been smoothed and correspond to 28 52 and 76 counts per pixel Thelocations of 3C 66A and 3C 66B (a radio galaxy that is 011 away) are shown as a cross and as a diamond respectively The location of millisecond pulsar PSR0218+4232 is also indicated with a white cross The magenta circle represents the VERITAS localization of the VHE source (RA DEC) = (2h22m41s6 plusmn 1s7stat plusmn6s0sys 4302prime35primeprime5 plusmn 21primeprime
stat plusmn 1prime30primeprimesys) as reported in Acciari et al (2009) The blue interior circle represents the 95 error radius of the Fermi-LAT localization
(RA DEC) = (02h22m40s3 plusmn 4s5 4302prime18primeprime6 plusmn 42primeprime1) as reported in the Fermi-LAT first source catalog (Abdo et al 2010a) All positions are based on the J2000epoch
quality-of-fit estimator to find the best-fit model XSPEC v124(Arnaud 1996) is used for the spectral analysis and fitting proce-dure Two spectral models have been used to fit the data singlepower law and broken power law Each model includes galacticH i column density (NHGal = 899 times 1020 cmminus2) according toDickey amp Lockman (1990) where the photoelectric absorptionis set with the XSPEC model phabs129 An additional local H i
column density was also tried but in both cases the spectra wereconsistent with pure galactic density Consequently the columndensity has been fixed to the galactic value in each model andthe results obtained are presented in Table 2 An F-test wasperformed to demonstrate that the spectral fit improves signif-icantly when using the extra degrees of freedom of the brokenpower-law model Table 2 also contains the results of the F-test
24 Swift XRT and UVOT
Following the VERITAS detection of VHE emission from3C 66A Target of Opportunity (ToO) observations of 3C 66Awith Swift were obtained for a total duration of sim10 ks TheSwift satellite observatory comprises an UVndashOptical telescope(UVOT) an X-ray telescope (XRT) and a Burst Alert Telescope(Gehrels et al 2004) Data reduction and calibration of the XRT
129 httpheasarcgsfcnasagovdocssoftwarelheasoftxanaduxspecmanualXSmodelPhabshtml
data are performed with HEASoft v65 standard tools AllXRT data presented here are taken in photon counting modewith negligible pile-up effects The X-ray spectrum of eachobservation is fitted with an absorbed power law using a fixedGalactic column density from Dickey amp Lockman (1990)which gives good χ2 values for all observations The measuredphoton spectral index ranges between 25 and 29 with a typicalstatistical uncertainty of 01
UVOT obtained data through each of six color filters VB and U together with filters defining three ultraviolet pass-bands UVW1 UVM2 and UVW2 with central wavelengths of260 nm 220 nm and 193 nm respectively The data are cal-ibrated using standard techniques (Poole et al 2008) and cor-rected for Galactic extinction by interpolating the absorptionvalues from Schlegel et al (1998) (EBminusV = 0083 mag) withthe galactic spectral extinction model of Fitzpatrick (1999)
25 Optical to Infrared Observations
The R magnitude of the host galaxy of 3C 66A is sim 19in the optical band (Wurtz et al 1996) Its contribution isnegligible compared to the typical AGN magnitude of R 15 therefore host-galaxy correction is not necessary
GASP-WEBT 3C 66A is continuously monitored by tele-scopes affiliated to the GLAST-AGILE support program of theWhole Earth Blazar Telescope (GASP-WEBT see Villata et al
6
The Astrophysical Journal 72643 (14pp) 2011 January 1 Abdo et al
Figure 3 3C 66A light curves covering 2008 August 22 to December 31 inorder of increasing wavelength The VERITAS observations are combined toobtain nightly flux values and the dashed and dotted lines represent the averageflux measured from the 2007 and 2008 data and its standard deviation TheFermi-LAT light curves contain time bins with a width of 3 days The averageflux and average photon index measured by Fermi-LAT during the first sixmonths of science operations are shown as horizontal lines in the respectivepanels In all cases the Fermi-LAT photon index is calculated over the 100MeV to 200 GeV energy range The long-term light curves at optical andinfrared wavelengths are presented in the two bottom panels In the bottompanel GASP-WEBT and PAIRITEL observations are represented by open andsolid symbols respectively
2008 2009) These observations provide a long-term light curveof this object with complete sampling as shown in Figure 3During the time interval in consideration (MJD 54700ndash54840)several observatories (Abastumani Armenzano Crimean ElVendrell LrsquoAmpolla Lulin New Mexico Skies Roque de losMuchachos (KVA) Rozhen Sabadell San Pedro Martir St Pe-tersburg Talmassons Teide (BRT) Torino Tuorla and Valledrsquo Aosta) contributed photometric observations in the R bandData in the J H and K bands were taken at the Campo Imper-atore observatory A list of the observatories and their locationsis available in Table 3
MDM Following the discovery of VHE emission 3C 66Awas observed with the 13 m telescope of the MDM Observatoryduring the nights of 2008 October 6ndash10 A total of 290 scienceframes in U B V and R bands (58 each) were taken throughoutthe entire visibility period (approx 430 ndash 1000 UT) duringeach night The light curves which cover the time around theflare are presented in Figure 4
ATOM Optical observations for this campaign in the R bandwere also obtained with the 08 m optical telescope ATOM
Figure 4 3C 66A light curves covering the period centered on the gamma-ray flare (2008 October 1ndash10) The VERITAS and Fermi-LAT panels werealready described in the caption of Figure 3 Swift Target-of-Opportunity(ToO) observations (panels 3ndash5 from the top) were obtained following thediscovery of VHE emission by VERITAS (Swordy 2008) Swift-UVOT andMDM observations are represented by open and solid symbols respectivelyThe optical light curve in panel 6 from the top displays intra-night variabilityAn example is identified in the plot when a rapid decline of the optical flux byΔFΔt sim minus02 mJy hrminus1 is observed on MJD 54747
in Namibia which monitors this source periodically Twentyphotometric observations are available starting on MJD 54740and are shown in Figures 3 and 4
PAIRITEL Near-infrared observations in the J H and Kswere obtained following the VHE flare with the 13 m PetersAutomated Infrared Imaging Telescope (PAIRITEL see Bloomet al 2006) located at the Fred Lawrence Whipple ObservatoryThe resulting light curves using differential photometry withfour nearby calibration stars are shown in Figure 4
Keck The optical spectrum of 3C 66A was measured withthe LRIS spectrometer (Oke et al 1995) on the Keck I telescopeon the night of 2009 September 17 under good conditions Theinstrument configuration resulted in a full width half-maximumof sim250 km sminus1 over the wavelength range 3200ndash5500 Aring (blueside) and sim200 km sminus1 over the range 6350ndash9000 Aring (red side)A series of exposures totaling 110 s (blue) and 50 s (red) wereobtained yielding a signal-to-noise (SN) per resolution elementof sim250 and 230 for the blue and red cameras respectively Thedata were reduced with the LowRedux130 pipeline and calibratedusing a spectrophotometric star observed on the same night
130 httpwwwucolickorgsimxavierLowReduxindexhtml
7
The Astrophysical Journal 72643 (14pp) 2011 January 1 Abdo et al
Table 2Best-fit Model Parameters for a Fit Performed to the Chandra Data in the 1ndash7 keV Energy Range
Single Power-law Model
Γ Flux (10minus12 erg cmminus2 sminus1) χ2dof
299 plusmn 003 347 plusmn 006 121 (2326193)
Broken Power-law Model
Γ1 Γ2 Flux (10minus12 erg cmminus2 sminus1) Break (keV) χ2dof F-test Probability
308+03minus05 224+023
037 358+007minus008 33+05
minus03 097 (1852191) 347 times 10minus10
Notes The galactic NHGal value is fixed to 899 times 1020 cmminus2 the value of the galactic H i column density according toDickey amp Lockman (1990) Errors indicate the 90 confidence level
Table 3List of Ground-based Observatories that Participated in This Campaign
Observatory Location Web Page
Radio Observatories
Crimean Radio Obs Ukraine wwwcraocrimeauaEffelsberg Germany wwwmpifrdeenglishradiotelescopeIRAM Spain wwwiram-instituteorgEN30-meter-telescopephpMedicina Italy wwwmedirainafitMetsahovi Finland wwwmetsahovifienNoto Italy wwwnotoirainafitUMRAO Michigan USA wwwastrolsaumicheduobsradiotel
Infrared Observatories
Campo Imperatore Italy wwwoa-teramoinafitPAIRITEL Arizona USA wwwpairitelorgOptical ObservatoriesAbastumani Georgia wwwgenaoorgArmenzano Italy wwwwebaliceitdcarosatiATOM Namibia wwwlswuni-heidelbergdeprojectshessATOMCrimean Astr Obs Ukraine wwwcraocrimeauaEl Vendrell SpainKitt Peak (MDM) Arizona USA wwwastrolsaumicheduobsmdmLrsquoAmpolla SpainLulin Taiwan wwwlulinncuedutwenglishNew Mexico Skies Obs New Mexico USA wwwnmskiescomRoque (KVA) Canary Islands Spain wwwotriiacesenonthtmRozhen Bulgaria wwwastrobasbgrozhenhtmlSabadell Spain wwwastrosabadellorghtmlesobservatoriosabhtmSan Pedro Martir Mexico wwwastrosspunammxindexspmhtmlSt Petersburg Russia wwwgaospbruTalmassons Italy wwwcastfvgitTeide (BRT) Canary Islands Spain wwwtelescopeorgTorino Italy wwwtoastroitTuorla Finland wwwastroutufiValle drsquo Aosta Italy wwwoavdaitenglishosservatorio
Gamma-ray Observatory
VERITAS Arizona USA wwwveritassaoarizonaedu
Inspection of the 3C 66A spectrum reveals no spectral featuresaside from those imposed by Earthrsquos atmosphere and the MilkyWay (Ca H+K) Therefore these new data do not offer anyinsight on the redshift of 3C 66A and in particular are unableto confirm the previously reported value of z = 0444 (Milleret al 1978)
26 Radio Observations
Radio observations are available thanks to the F-GAMMA(Fermi-Gamma-ray Space Telescope AGN Multi-frequencyMonitoring Alliance) program which is dedicated to monthly
monitoring of selected Fermi-LAT blazars (Fuhrmann et al2007 Angelakis et al 2008) Radio flux density measurementswere conducted with the 100 m Effelsberg radio telescope at485 835 1045 and 1460 GHz on 2008 October 16 Thesedata are supplemented with an additional measurement at 86GHz conducted with the IRAM 30 m telescope (Pico VeletaSpain) on 2008 October 8 The data were reduced using stan-dard procedures described in Fuhrmann et al (2008) Additionalradio observations taken between 2008 October 5 and 15 (con-temporaneous to the flare period) are provided by the MedicinaMetsahovi Noto and UMRAO observatories all of which aremembers of the GASP-WEBT consortium
8
The Astrophysical Journal 72643 (14pp) 2011 January 1 Abdo et al
3 DISCUSSION
31 Light Curves
The resulting multi-wavelength light curves from this cam-paign are shown in Figure 3 for those bands with long-term cov-erage and in Figure 4 for those observations that were obtainedshortly before and after the gamma-ray flare The VERITASobservations are combined to obtain nightly (E gt 200 GeV)flux values since no evidence for intra-night variability is ob-served The highest flux occurred on MJD 54749 and significantvariability is observed during the whole interval (χ2 probabilityless than 10minus4 for a fit of a constant flux)
The temporal dependence of the Fermi-LAT photon index andintegral flux above 100 MeV and 1 GeV are shown with timebins with width of 3 days in Figure 3 For those time intervalswith no significant detection a 95 confidence flux upper limitis calculated The flux and photon index from the Fermi-LATfirst source catalog (Abdo et al 2010a) are shown as horizontallines for comparison These values correspond to the averageflux and photon index measured during the first 11 months ofFermi operations and thus span the time interval considered inthe figures It is evident from the plot that the VHE flare detectedby VERITAS starting on MJD 54740 is coincident with a periodof high flux in the Fermi energy band The photon index duringthis time interval is consistent within errors with the averagephoton index Γ = 195 plusmn 003 measured during the first sixmonths of the Fermi mission (Abdo et al 2010b)
Long-term and well-sampled light curves are available atoptical and near-infrared wavelengths thanks to observations byGASP-WEBT ATOM MDM and PAIRITEL Unfortunatelyradio observations were too limited to obtain a light curve andno statement about variability in this band can be made Thebest sampling is available for the R band for which variationswith a factor of 2 are observed in the long-term light curveFurthermore variability on timescales of less than a day isobserved as indicated in Figure 4 and as previously reportedby Bottcher et al (2009) following the WEBT (Whole EarthBlazar Telescope) campaign on 3C 66A in 2007 and 2008
The increase in gamma-ray flux observed in the Fermi bandseems contemporaneous with a period of increased flux in theoptical and to test this hypothesis the discrete correlationfunction (DCF) is used (Edelson amp Krolik 1988) Figure 5shows the DCF of the F(E gt 1 GeV) gamma-ray band withrespect to the R band with time-lag bins of 3 5 and 7 days Theprofile of the DCF is consistent for all time-lag bins indicatingthat the result is independent of bin size The DCF with time-lagbins of 3 days was fitted with a Gaussian function of the formDCF(τ ) = Cmax times exp (τ minus τ0)2σ 2 where Cmax is the peakvalue of the DCF τ0 is the delay timescale at which the DCFpeaks and σ parameterizes the Gaussian width of the DCF Thebest-fit function is plotted in Figure 5 and the best-fit parametersare Cmax = 11 plusmn 03 τ0 = (07 plusmn 07) days and σ = (33 plusmn07) days An identical analysis was also performed betweenthe F(E gt 100 MeV) and the R optical band with consistentresults This indicates a clear correlation between the Fermi-LAT and optical energy bands with a time lag that is consistentwith zero and not greater than sim5 days Despite the sparsity ofthe VERITAS light curve (due in part to the time periods whenthe source was not observable due to the full Moon) the DCFanalysis was also performed to search for correlations with eitherthe Fermi-LAT or optical data Apart from the overall increasein flux no significant correlations can be established The onsetof the E gt 200 GeV flare seems delayed by about sim5 days
Time lag [days]minus30 minus20 minus10 0 10 20 30
DC
F
minus1
minus05
0
05
1
15 Bin Size3 days
5 days
7 days
Figure 5 Discrete correlation function (DCF) of the F(E gt 1 GeV) gamma-raylight curve with respect to the R-band light curve A positive time lag indicatesthat the gamma-ray band leads the optical band Different symbols correspondto different bin sizes of time lag as indicated in the legend The profile of theDCF is independent of bin size and is well described by a Gaussian functionof the form DCF(τ ) = Cmax times exp (τ minus τ0)2σ 2 The fit to the 3-day bin sizedistribution is shown in the plot as a solid black line and the best-fit parametersare Cmax = 11 plusmn 03 τ0 = (07 plusmn 07) days and σ = (33 plusmn 07) days
with respect to the opticalndashGeV flare but given the coveragegaps no firm conclusion can be drawn (eg the flare could havebeen already underway when the observations took place) Nosuch lag is expected from the homogeneous model described inthe next section but could arise in models with complex energystratification and geometry in the emitting region
32 SED and Modeling
The broadband SED derived from these observations ispresented in Figure 6 and modeled using the code of Bottcher ampChiang (2002) In this model a power-law distribution of ultra-relativistic electrons andor pairs with lower and upper energycutoffs at γmin and γmax respectively and power-law index qis injected into a spherical region of comoving radius RB Theinjection rate is normalized to an injection luminosity Le whichis a free input parameter of the model The model assumesa temporary equilibrium between particle injection radiativecooling due to synchrotron and Compton losses and particleescape on a time tesc equiv ηesc RBc where ηesc is a scale parameterin the range sim250ndash500 Both the internal synchrotron photonfield (SSC) and external photon sources (EC) are considered astargets for Compton scattering The emission region is movingwith a bulk Lorentz factor Γ along the jet To reduce the numberof free parameters we assume that the jet is oriented with respectto the line of sight at the superluminal angle so that the Dopplerfactor is equal to D = (Γ [1 minus β cos θobs])
minus1 = Γ where θobs isthe angle of the jet with respect to the line of sight Given theuncertainty in the redshift determination of 3C 66A a range ofplausible redshifts namely z = 01 02 03 and the generallyused catalog value z = 0444 are considered for the modelingAll model fits include EBL absorption using the optical depthvalues from Franceschini et al (2008)
Most VHE blazars known to date are high synchrotron peaked(HSP) blazars whose SEDs can often be fitted satisfactorilywith pure SSC models Since the transition from HSP to ISP iscontinuous a pure SSC model was fitted first to the radio throughVHE gamma-ray SED Independently of the model underconsideration the low-frequency part of the SED (lt1020 Hz) iswell fitted with a synchrotron component as shown in Figure 6
9
The Astrophysical Journal 72643 (14pp) 2011 January 1 Abdo et al
Figure 6 Broadband SED of 3C 66A during the 2008 October multi-wavelength campaign The observation that corresponds to each set of data points is indicated inthe legend As an example the EBL-absorbed EC+SSC model for z = 03 is plotted here for reference A description of the model is provided in the text
For clarity only the high-frequency range is shown in Figures 7and 8 where the different models are compared As can beseen from the figures a reasonable agreement with the overallSED can be achieved for any redshift in the range exploredThe weighted sum of squared residuals has been calculatedfor the Fermi-LAT and VERITAS flare data (8 data points intotal) in order to quantify the scatter of the points with respectto the model and is shown in Table 4 The best agreement isachieved when the source is located at z sim 02ndash03 For lowerredshifts the model spectrum is systematically too hard whileat z = 0444 the model spectrum is invariably too soft as a resultof EBL absorption It should be noted that the EBL model ofFranceschini et al (2008) predicts some of the lowest opticaldepth values in comparison to other models (Finke et al 2010Gilmore et al 2009 Stecker et al 2006) Thus a model spectrumwith redshift of 03 or above would be even harder to reconcilewith the observations when using other EBL models
A major problem of the SSC models with z 01 is thatRB is of the order of 5 times 1016 cm This does not allowfor variability timescales shorter than 1 day which seemsto be in contrast with the optical variability observed on shortertimescales A smaller RB would require an increase in theelectron energy density (with no change in the magnetic fieldin order to preserve the flux level of the synchrotron peak) andwould lead to internal gammandashgamma absorption This problemcould be mitigated by choosing extremely high Doppler factorsD 100 However these are significantly larger than thevalues inferred from VLBI observations of Fermi-LAT blazars(Savolainen et al 2010)131 Moreover all SSC models requirevery low magnetic fields far below the value expected fromequipartition (εB = LBLe sim 10minus3 1) where LB is thePoynting flux derived from the magnetic energy density and Le
131 As a caveat jet models with a decelerating flow (Georganopoulos ampKazanas 2003 Piner et al 2008) or with inhomogeneous transverse structure(Ghisellini et al 2005 Henri amp Sauge 2006) can accommodate very highDoppler factors in the gamma-ray emitting region and still be consistent withthe VLBI observations of the large scale jet
is the energy flux of the electrons propagating along the jetTable 4 lists the parameters used for the SSC models displayedin Figure 7
Subsequently an external infrared radiation field with adhoc properties was included as a source of photons to beCompton scattered For all SSC+EC models shown in Figure 8the peak frequency of the external radiation field is set toνext = 14 times 1014 Hz corresponding to near-IR This adoptedvalue is high enough to produce E 100 GeV photons from ICscattering off the synchrotron electrons and at the same time isbelow the energy regime in which KleinndashNishina effects takeplace Although the weighted sums of squared residuals forEC+SSC models are generally worse than for pure SSC modelsreasonable agreement with the overall SED can still be achievedfor redshifts z 03 Furthermore all SSC+EC models areconsistent with a variability timescale of Δtvar sim 4 hr Thisis in better agreement with the observed variability at opticalwavelengths than the pure SSC interpretation Also while theSSC+EC interpretation still requires sub-equipartition magneticfields the magnetic fields are significantly closer to equipartitionthan in the pure SSC case with LBLe sim 01 The parametersof the SSC+EC models are listed in Table 5
Models with and without EC component yield the bestagreement with the SED if the source is located at a redshiftz sim 02ndash03 Of course this depends on the EBL model used inthe analysis An EBL model that predicts higher attenuation thanFranceschini et al (2008) would lead to a lower redshift rangeand make it even more difficult to have agreement betweenthe SED models and the data when the source is located atredshifts z 04 Finally it is worth mentioning that the redshiftrange z sim 02ndash03 is in agreement with previous estimates byFinke et al (2008) who estimate the redshift of 3C 66A to bez = 0321 based on the magnitude of the host galaxy and byPrandini et al (2010) who use an empirical relation betweenthe previously reported Fermi-LAT and IACTs spectral slopesof blazars and their redshifts to estimate the redshift of 3C 66Ato be below z = 034 plusmn 005
10
The Astrophysical Journal 72643 (14pp) 2011 January 1 Abdo et al
Figure 7 SSC models for redshifts z = 0444 03 02 and 01 from top to bottom The Fermi-LAT and VERITAS data points follow the same convention usedin Figures 1 and 6 to distinguish between flare (red) and dark run (blue) data points In each panel the EBL-absorbed model is shown as a solid red line and thede-absorbed model as a red dashed line De-absorbed VERITAS flare points are shown as open squares In all cases the optical depth values from Franceschini et al(2008) are used The best agreement between the model and the data is achieved when the source is located at z = 02ndash03 For lower redshifts the model spectrum issystematically too hard while at z = 0444 the model spectrum is too soft
A detailed study of hadronic versus leptonic modeling of the2008 October data will be published elsewhere but it is worthmentioning that the synchrotron proton blazar (SPB) model hasbeen used to adequately reproduce the quasi-simultaneous SEDobserved during the 2003ndash2004 multi-wavelength campaign(Reimer et al 2008) On that occasion rapid intra-day variationsdown to a 2 hr timescale were observed while during the2008 campaign presented here these variations seem less rapidQualitatively the longer timescale variations may be due toa lower Doppler beaming at the same time that a stronglyreprocessed proton synchrotron component dominates the highenergy output of this source
4 SUMMARY
Multi-wavelength observations of 3C 66A were carried outprompted by the gamma-ray outburst detected by the VERITASand Fermi observatories in 2008 October This marks the first
occasion that a gamma-ray flare is detected by GeV and TeVinstruments in comparable timescales The light curves obtainedshow strong variability at every observed wavelength and inparticular the flux increase observed by VERITAS and Fermiis coincident with an optical outburst The clear correlationbetween the Fermi-LAT and R optical light curves permits oneto go beyond the source association reported in the first Fermi-LAT source catalog (Abdo et al 2010a) and finally identify thegamma-ray source 1FGL J02226+4302 as blazar 3C 66A
For the modeling of the overall SED a reasonable agreementcan be achieved using both a pure SSC model and an SSC+ECmodel with an external near-infrared radiation field as anadditional source for Compton scattering However the pureSSC model requires (1) a large emission region which isinconsistent with the observed intra-night scale variability atoptical wavelengths and (2) low magnetic fields about afactor sim10minus3 below equipartition In contrast an SSC+ECinterpretation allows for variability on timescales of a few hours
11
The Astrophysical Journal 72643 (14pp) 2011 January 1 Abdo et al
Figure 8 EC+SSC model for redshifts z =0444 03 02 and 01 from top to bottom The individual EBL-absorbed EC and SSC components are indicated asdash-dotted and dotted lines respectively The sum is shown as a solid red line (dashed when de-absorbed) The best agreement between the model and the data isachieved when the source is located at z sim 02
Table 4Parameters Used for the SSC Models Displayed in Figure 7
Model Parameter z = 01 z = 02 z = 03 z = 0444
Low-energy cutoff γmin 18 times 104 20 times 104 22 times 104 25 times 104
High-energy cutoff γmax 30 times 105 40 times 105 40 times 105 50 times 105
Injection index q 29 29 30 30Injection luminosity Le (1045 erg sminus1) 13 33 57 128Comoving magnetic field B (G) 003 002 002 001Poynting flux LB (1042 erg sminus1) 11 49 85 137εB equiv LBLe 09 times 10minus3 15 times 10minus3 15 times 10minus3 11 times 10minus3
Doppler factor (D) 30 30 40 50Plasmoid radius RB (1016 cm) 22 60 70 11Variability timescale δtmin
var (hr) 74 221 211 294
Weighted sum of squared residuals to VERITAS flare data 71 09 07 62Weighted sum of squared residuals to Fermi-LAT flare data 16 16 13 14Total weighted sum of squared residuals 87 25 19 76
Notes All SSC models require very low magnetic fields far below the value expected from equipartition (ie εB 1) Theweighted sum of squared residuals to the VERITAS and Fermi-LAT data and the total value for the combined data set areincluded at the bottom of the table The best agreement between the model and the data is obtained when the source is at redshiftz = 02ndash03
12
The Astrophysical Journal 72643 (14pp) 2011 January 1 Abdo et al
Table 5Parameters Used for the EC+SSC Model Fits Displayed in Figure 8
Model Parameter z = 01 z = 02 z = 03 z = 0444
Low-energy cutoff γmin 55 times 103 70 times 103 65 times 103 60 times 103
High-energy cutoff γmax 12 times 105 1512 times 105 1512 times 105 1512 times 105
Injection index q 30 30 30 30Injection luminosity Le (1044 erg sminus1) 11 42 60 104Comoving magnetic field B (G) 035 022 021 023Poynting flux LB (1043 erg sminus1) 10 24 60 112εB equiv LBLe 010 006 010 011Doppler factor D 30 30 40 50Plasmoid radius RB (1016 cm) 05 12 15 15Variability timescale δtmin
var (hr) 17 44 45 40Ext radiation energy density (10minus6 erg cmminus3) 54 24 12 13
Weighted sum of squared residuals to VERITAS flare data 48 36 79 157Weighted sum of squared residuals to Fermi-LAT flare data 10 12 08 15Total weighted sum of squared residuals 58 48 87 172
Notes These model fits require magnetic fields closer to equipartition and allow for the intra-night variability observedin the optical data The weighted sum of squared residuals to the VERITAS and Fermi-LAT data and the total value forthe combined data set are included at the bottom of the table
and for magnetic fields within about an order of magnitudeof though still below equipartition It is worth noting that theresults presented here agree with the findings following the(E gt 200 GeV) flare of blazar W Comae (also an ISP) in 2008March (Acciari et al 2008a) In both cases the high opticalluminosity is expected to play a key role in providing the seedpopulation for IC scattering
Intermediate synchrotron peaked blazars like 3C 66A are wellsuited for simultaneous observations by Fermi-LAT and ground-based IACTs like VERITAS Relative to the sensitivities ofthese instruments ISPs are bright enough to allow for time-resolved spectral measurements in each band during flaringepisodes These types of observations coupled with extensivemulti-wavelength coverage at lower energies will continue toprovide key tests of blazar emission models
The Fermi-LAT Collaboration acknowledges generous ongo-ing support from a number of agencies and institutes that havesupported both the development and the operation of the LATas well as scientific data analysis These include the NationalAeronautics and Space Administration and the Department ofEnergy in the United States the Commissariat a lrsquoEnergie Atom-ique and the Centre National de la Recherche ScientifiqueInstitut National de Physique Nucleaire et de Physique desParticules in France the Agenzia Spaziale Italiana and theIstituto Nazionale di Fisica Nucleare in Italy the Ministry ofEducation Culture Sports Science and Technology (MEXT)High Energy Accelerator Research Organization (KEK) andJapan Aerospace Exploration Agency (JAXA) in Japan and theK A Wallenberg Foundation the Swedish Research Coun-cil and the Swedish National Space Board in Sweden Ad-ditional support for science analysis during the operationsphase is gratefully acknowledged from the Istituto Nazionale diAstrofisica in Italy and the Centre National drsquoEtudes Spatiales inFrance
The VERITAS collaboration acknowledges the generous sup-port from the US Department of Energy the US National Sci-ence Foundation and the Smithsonian Institution by NSERCin Canada by Science Foundation Ireland and by STFC inUK The VERITAS collaboration also acknowledges the excel-
lent work of the technical support staff at the FLWO and thecollaborating institutions in the construction and operation ofthe instrument as well as support from the NASASwift guestinvestigator program (grant NNX08AU13G) for the Swift ob-servations
PAIRITEL is operated by the Smithsonian AstrophysicalObservatory (SAO) and was made possible by a grant fromthe Harvard University Milton Fund a camera loan from theUniversity of Virginia and continued support of the SAO andUC Berkeley The PAIRITEL project is further supported byNASASwift Guest Investigator grant NNG06GH50G Thisresearch is partly based on observations with the 100 m telescopeof the MPIfR (Max-Planck-Institut fur Radioastronomie) atEffelsberg and has also made use of observations with the IRAM30 m telescope The Metsahovi team acknowledges the supportfrom the Academy of Finland The Abastumani Observatoryteam acknowledges financial support by the Georgian NationalScience Foundation through grant GNSFST084-404 The StPetersburg University team acknowledges support from RussianRFBR foundation via grant 09-02-00092 AZT-24 observationsare made within an agreement between Pulkovo Rome andTeramo observatories
L C Reyes acknowledges the support by the Kavli Institutefor Cosmological Physics at the University of Chicago throughgrants NSF PHY-0114422 and NSF PHY-0551142 and anendowment from the Kavli Foundation and its founder FredKavli M Bottcher acknowledges support from NASA throughChandra Guest Investigator Grant GO8-9100X Some of theVERITAS simulations used in this work have been performedon the joint Fermilab-KICP supercomputing cluster supportedby grants from Fermilab the Kavli Institute for CosmologicalPhysics and the University of Chicago
REFERENCES
Abdo A A et al 2009a Science 325 848Abdo A A et al 2009b ApJ 707 1310Abdo A A et al 2010a ApJS 188 405Abdo A A et al 2010b ApJ 710 1271Abdo A A et al 2010c ApJ 716 30Acciari V A et al 2008a ApJ 684 L73
13
The Astrophysical Journal 72643 (14pp) 2011 January 1 Abdo et al
Acciari V A et al 2008b ApJ 679 1427Acciari V A et al 2009 ApJ 693 L104Aliu E et al 2009 ApJ 692 L29Angelakis E Fuhrmann L Marchili N Krichbaum T P amp Zensus J A
2008 Mem Soc Astron Ital 79 1042Arnaud K A 1996 in ASP Conf Ser 101 Astronomical Data Analysis
Software and Systems V ed G H Jacoby amp J Barnes (San FranciscoCA ASP) 17
Atwood W B et al 2009 ApJ 697 1071Bennett A S 1962 Mem R Astron Soc 68 163Bloom J S Starr D L Blake C H Skrutskie M F amp Falco E E 2006
in ASP Conf Ser 351 Astronomical Data Analysis Software and SystemsXV ed C Gabriel C Arviset D Ponz amp S Enrique (San Francisco CAASP) 751
Bottcher M 2007 ApampSS 309 95Bottcher M amp Chiang J 2002 ApJ 581 127Bottcher M amp Dermer C D 2002 ApJ 564 86Bottcher M et al 2009 ApJ 694 174Bramel D A et al 2005 ApJ 629 108Britzen S et al 2007 AampA 472 763Britzen S et al 2008 AampA 484 119Cavaliere A amp DrsquoElia V 2002 ApJ 571 226Dermer C D amp Schlickeiser R 1993 ApJ 416 458Dickey J M amp Lockman F J 1990 ARAampA 28 215Edelson R A amp Krolik J H 1988 ApJ 333 646Finke J D Razzaque S amp Dermer C D 2010 ApJ 712 238Finke J D Shields J C Bottcher M amp Basu S 2008 AampA 477
513Fitzpatrick E L 1999 PASP 111 63Franceschini A Rodighiero G amp Vaccari M 2008 AampA 487 837Fuhrmann L Zensus J A Krichbaum T P Angelakis E amp Readhead A
C S 2007 in AIP Conf Proc 921 The First GLAST Symposium ed SRitz P Michelson amp C A Meegan (Melville NY AIP) 249
Fuhrmann L et al 2008 AampA 490 1019Gehrels N et al 2004 ApJ 611 1005Georganopoulos M amp Kazanas D 2003 ApJ 594 L27Georganopoulos M amp Kazanas D 2004 ApJ 604 L81Ghisellini G amp Madau P 1996 MNRAS 280 67Ghisellini G Tavecchio F amp Chiaberge M 2005 AampA 432 401Gilmore R C Madau P Primack J R Somerville R S amp Haardt F
2009 MNRAS 399 1694Hartman R C et al 1999 ApJS 123 79Henri G amp Sauge L 2006 ApJ 640 185Jorstad S G Marscher A P Mattox J R Wehrle A E Bloom S D amp
Yurchenko A V 2001 ApJS 134 181Joshi M amp Bottcher M 2007 ApJ 662 884
Kataoka J et al 1999 Astropart Phys 11 149Kerrick A D et al 1995 ApJ 452 588Kinney A L Bohlin R C Blades J C amp York D G 1991 ApJS 75
645Kuiper L Hermsen W Verbunt F Thompson D J Stairs I H Lyne A
G Strickman M S amp Cusumano G 2000 AampA 359 615Larionov V M et al 2008 ATel 1755 1Li T-P amp Ma Y-Q 1983 ApJ 272 317Mackay C D 1971 MNRAS 154 209Marscher A P Jorstad S G Mattox J R amp Wehrle A E 2002 ApJ 577
85Mattox J R et al 1996 ApJ 461 396Miller J S French H B amp Hawley S A 1978 Proc Pittsburgh Conf on
BL Lac Objects ed A M Wolfe 176Mucke A Protheroe R J Engel R Rachen J P amp Stanev T 2003
Astropart Phys 18 593Northover K J E 1973 MNRAS 165 369Oke J B et al 1995 PASP 107 375Piner B G Pant N amp Edwards P G 2008 ApJ 678 64Poole T S et al 2008 MNRAS 383 627Prandini E Bonnoli G Maraschi L Mariotti M amp Tavecchio F 2010
MNRAS 405 L76Reimer A Joshi M amp Bottcher M 2008 in AIP Conf Ser 1085 High
Energy Gamma-Ray Astronomy ed F A Aharonian W Hofmann amp FRieger (Melville NY AIP) 502
Savolainen T Homan D C Hovatta T Kadler M Kovalev Y Y ListerM L Ros E amp Zensus J A 2010 AampA 512 A24
Schlegel D J Finkbeiner D P amp Davis M 1998 ApJ 500 525Sikora M Begelman M C amp Rees M J 1994 ApJ 421 153Smith H E Smith E O amp Spinrad H 1976 PASP 88 621Stecker F W Malkan M A amp Scully S T 2006 ApJ 648 774 (erratum
658 1392 [2007])Swordy S 2008 ATel 1753 1Tavecchio F amp Ghisellini G 2009 MNRAS 394 L131Taylor G B Vermeulen R C Readhead A C S Pearson T J Henstock
D R amp Wilkinson P N 1996 ApJS 107 37Thompson D J et al 1993 ApJS 86 629Tosti G 2008 ATel 1759 1Urry C M amp Padovani P 1995 PASP 107 803Villata M et al 2008 AampA 481 L79Villata M et al 2009 AampA 504 L9Weekes T C 2000 in AIP Conf Ser 515 GeVndashTeV Gamma Ray Astrophysics
Workshop Towards a Major Atmospheric Cherenkov Detector VI ed B LDingus M H Salamon amp D B Kieda (Melville NY AIP) 3
Wills B J amp Wills D 1974 ApJ 190 L97Wurtz R Stocke J T amp Yee H K C 1996 ApJS 103 109
14
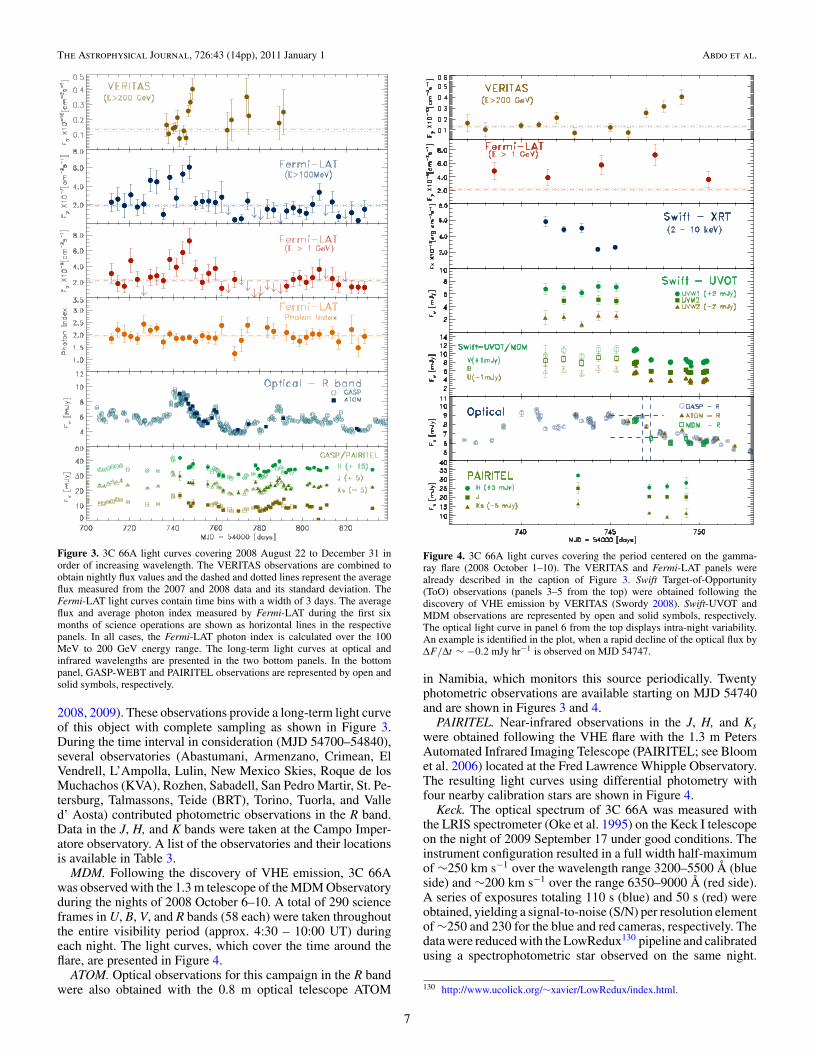
The Astrophysical Journal 72643 (14pp) 2011 January 1 Abdo et al
Figure 3 3C 66A light curves covering 2008 August 22 to December 31 inorder of increasing wavelength The VERITAS observations are combined toobtain nightly flux values and the dashed and dotted lines represent the averageflux measured from the 2007 and 2008 data and its standard deviation TheFermi-LAT light curves contain time bins with a width of 3 days The averageflux and average photon index measured by Fermi-LAT during the first sixmonths of science operations are shown as horizontal lines in the respectivepanels In all cases the Fermi-LAT photon index is calculated over the 100MeV to 200 GeV energy range The long-term light curves at optical andinfrared wavelengths are presented in the two bottom panels In the bottompanel GASP-WEBT and PAIRITEL observations are represented by open andsolid symbols respectively
2008 2009) These observations provide a long-term light curveof this object with complete sampling as shown in Figure 3During the time interval in consideration (MJD 54700ndash54840)several observatories (Abastumani Armenzano Crimean ElVendrell LrsquoAmpolla Lulin New Mexico Skies Roque de losMuchachos (KVA) Rozhen Sabadell San Pedro Martir St Pe-tersburg Talmassons Teide (BRT) Torino Tuorla and Valledrsquo Aosta) contributed photometric observations in the R bandData in the J H and K bands were taken at the Campo Imper-atore observatory A list of the observatories and their locationsis available in Table 3
MDM Following the discovery of VHE emission 3C 66Awas observed with the 13 m telescope of the MDM Observatoryduring the nights of 2008 October 6ndash10 A total of 290 scienceframes in U B V and R bands (58 each) were taken throughoutthe entire visibility period (approx 430 ndash 1000 UT) duringeach night The light curves which cover the time around theflare are presented in Figure 4
ATOM Optical observations for this campaign in the R bandwere also obtained with the 08 m optical telescope ATOM
Figure 4 3C 66A light curves covering the period centered on the gamma-ray flare (2008 October 1ndash10) The VERITAS and Fermi-LAT panels werealready described in the caption of Figure 3 Swift Target-of-Opportunity(ToO) observations (panels 3ndash5 from the top) were obtained following thediscovery of VHE emission by VERITAS (Swordy 2008) Swift-UVOT andMDM observations are represented by open and solid symbols respectivelyThe optical light curve in panel 6 from the top displays intra-night variabilityAn example is identified in the plot when a rapid decline of the optical flux byΔFΔt sim minus02 mJy hrminus1 is observed on MJD 54747
in Namibia which monitors this source periodically Twentyphotometric observations are available starting on MJD 54740and are shown in Figures 3 and 4
PAIRITEL Near-infrared observations in the J H and Kswere obtained following the VHE flare with the 13 m PetersAutomated Infrared Imaging Telescope (PAIRITEL see Bloomet al 2006) located at the Fred Lawrence Whipple ObservatoryThe resulting light curves using differential photometry withfour nearby calibration stars are shown in Figure 4
Keck The optical spectrum of 3C 66A was measured withthe LRIS spectrometer (Oke et al 1995) on the Keck I telescopeon the night of 2009 September 17 under good conditions Theinstrument configuration resulted in a full width half-maximumof sim250 km sminus1 over the wavelength range 3200ndash5500 Aring (blueside) and sim200 km sminus1 over the range 6350ndash9000 Aring (red side)A series of exposures totaling 110 s (blue) and 50 s (red) wereobtained yielding a signal-to-noise (SN) per resolution elementof sim250 and 230 for the blue and red cameras respectively Thedata were reduced with the LowRedux130 pipeline and calibratedusing a spectrophotometric star observed on the same night
130 httpwwwucolickorgsimxavierLowReduxindexhtml
7
The Astrophysical Journal 72643 (14pp) 2011 January 1 Abdo et al
Table 2Best-fit Model Parameters for a Fit Performed to the Chandra Data in the 1ndash7 keV Energy Range
Single Power-law Model
Γ Flux (10minus12 erg cmminus2 sminus1) χ2dof
299 plusmn 003 347 plusmn 006 121 (2326193)
Broken Power-law Model
Γ1 Γ2 Flux (10minus12 erg cmminus2 sminus1) Break (keV) χ2dof F-test Probability
308+03minus05 224+023
037 358+007minus008 33+05
minus03 097 (1852191) 347 times 10minus10
Notes The galactic NHGal value is fixed to 899 times 1020 cmminus2 the value of the galactic H i column density according toDickey amp Lockman (1990) Errors indicate the 90 confidence level
Table 3List of Ground-based Observatories that Participated in This Campaign
Observatory Location Web Page
Radio Observatories
Crimean Radio Obs Ukraine wwwcraocrimeauaEffelsberg Germany wwwmpifrdeenglishradiotelescopeIRAM Spain wwwiram-instituteorgEN30-meter-telescopephpMedicina Italy wwwmedirainafitMetsahovi Finland wwwmetsahovifienNoto Italy wwwnotoirainafitUMRAO Michigan USA wwwastrolsaumicheduobsradiotel
Infrared Observatories
Campo Imperatore Italy wwwoa-teramoinafitPAIRITEL Arizona USA wwwpairitelorgOptical ObservatoriesAbastumani Georgia wwwgenaoorgArmenzano Italy wwwwebaliceitdcarosatiATOM Namibia wwwlswuni-heidelbergdeprojectshessATOMCrimean Astr Obs Ukraine wwwcraocrimeauaEl Vendrell SpainKitt Peak (MDM) Arizona USA wwwastrolsaumicheduobsmdmLrsquoAmpolla SpainLulin Taiwan wwwlulinncuedutwenglishNew Mexico Skies Obs New Mexico USA wwwnmskiescomRoque (KVA) Canary Islands Spain wwwotriiacesenonthtmRozhen Bulgaria wwwastrobasbgrozhenhtmlSabadell Spain wwwastrosabadellorghtmlesobservatoriosabhtmSan Pedro Martir Mexico wwwastrosspunammxindexspmhtmlSt Petersburg Russia wwwgaospbruTalmassons Italy wwwcastfvgitTeide (BRT) Canary Islands Spain wwwtelescopeorgTorino Italy wwwtoastroitTuorla Finland wwwastroutufiValle drsquo Aosta Italy wwwoavdaitenglishosservatorio
Gamma-ray Observatory
VERITAS Arizona USA wwwveritassaoarizonaedu
Inspection of the 3C 66A spectrum reveals no spectral featuresaside from those imposed by Earthrsquos atmosphere and the MilkyWay (Ca H+K) Therefore these new data do not offer anyinsight on the redshift of 3C 66A and in particular are unableto confirm the previously reported value of z = 0444 (Milleret al 1978)
26 Radio Observations
Radio observations are available thanks to the F-GAMMA(Fermi-Gamma-ray Space Telescope AGN Multi-frequencyMonitoring Alliance) program which is dedicated to monthly
monitoring of selected Fermi-LAT blazars (Fuhrmann et al2007 Angelakis et al 2008) Radio flux density measurementswere conducted with the 100 m Effelsberg radio telescope at485 835 1045 and 1460 GHz on 2008 October 16 Thesedata are supplemented with an additional measurement at 86GHz conducted with the IRAM 30 m telescope (Pico VeletaSpain) on 2008 October 8 The data were reduced using stan-dard procedures described in Fuhrmann et al (2008) Additionalradio observations taken between 2008 October 5 and 15 (con-temporaneous to the flare period) are provided by the MedicinaMetsahovi Noto and UMRAO observatories all of which aremembers of the GASP-WEBT consortium
8
The Astrophysical Journal 72643 (14pp) 2011 January 1 Abdo et al
3 DISCUSSION
31 Light Curves
The resulting multi-wavelength light curves from this cam-paign are shown in Figure 3 for those bands with long-term cov-erage and in Figure 4 for those observations that were obtainedshortly before and after the gamma-ray flare The VERITASobservations are combined to obtain nightly (E gt 200 GeV)flux values since no evidence for intra-night variability is ob-served The highest flux occurred on MJD 54749 and significantvariability is observed during the whole interval (χ2 probabilityless than 10minus4 for a fit of a constant flux)
The temporal dependence of the Fermi-LAT photon index andintegral flux above 100 MeV and 1 GeV are shown with timebins with width of 3 days in Figure 3 For those time intervalswith no significant detection a 95 confidence flux upper limitis calculated The flux and photon index from the Fermi-LATfirst source catalog (Abdo et al 2010a) are shown as horizontallines for comparison These values correspond to the averageflux and photon index measured during the first 11 months ofFermi operations and thus span the time interval considered inthe figures It is evident from the plot that the VHE flare detectedby VERITAS starting on MJD 54740 is coincident with a periodof high flux in the Fermi energy band The photon index duringthis time interval is consistent within errors with the averagephoton index Γ = 195 plusmn 003 measured during the first sixmonths of the Fermi mission (Abdo et al 2010b)
Long-term and well-sampled light curves are available atoptical and near-infrared wavelengths thanks to observations byGASP-WEBT ATOM MDM and PAIRITEL Unfortunatelyradio observations were too limited to obtain a light curve andno statement about variability in this band can be made Thebest sampling is available for the R band for which variationswith a factor of 2 are observed in the long-term light curveFurthermore variability on timescales of less than a day isobserved as indicated in Figure 4 and as previously reportedby Bottcher et al (2009) following the WEBT (Whole EarthBlazar Telescope) campaign on 3C 66A in 2007 and 2008
The increase in gamma-ray flux observed in the Fermi bandseems contemporaneous with a period of increased flux in theoptical and to test this hypothesis the discrete correlationfunction (DCF) is used (Edelson amp Krolik 1988) Figure 5shows the DCF of the F(E gt 1 GeV) gamma-ray band withrespect to the R band with time-lag bins of 3 5 and 7 days Theprofile of the DCF is consistent for all time-lag bins indicatingthat the result is independent of bin size The DCF with time-lagbins of 3 days was fitted with a Gaussian function of the formDCF(τ ) = Cmax times exp (τ minus τ0)2σ 2 where Cmax is the peakvalue of the DCF τ0 is the delay timescale at which the DCFpeaks and σ parameterizes the Gaussian width of the DCF Thebest-fit function is plotted in Figure 5 and the best-fit parametersare Cmax = 11 plusmn 03 τ0 = (07 plusmn 07) days and σ = (33 plusmn07) days An identical analysis was also performed betweenthe F(E gt 100 MeV) and the R optical band with consistentresults This indicates a clear correlation between the Fermi-LAT and optical energy bands with a time lag that is consistentwith zero and not greater than sim5 days Despite the sparsity ofthe VERITAS light curve (due in part to the time periods whenthe source was not observable due to the full Moon) the DCFanalysis was also performed to search for correlations with eitherthe Fermi-LAT or optical data Apart from the overall increasein flux no significant correlations can be established The onsetof the E gt 200 GeV flare seems delayed by about sim5 days
Time lag [days]minus30 minus20 minus10 0 10 20 30
DC
F
minus1
minus05
0
05
1
15 Bin Size3 days
5 days
7 days
Figure 5 Discrete correlation function (DCF) of the F(E gt 1 GeV) gamma-raylight curve with respect to the R-band light curve A positive time lag indicatesthat the gamma-ray band leads the optical band Different symbols correspondto different bin sizes of time lag as indicated in the legend The profile of theDCF is independent of bin size and is well described by a Gaussian functionof the form DCF(τ ) = Cmax times exp (τ minus τ0)2σ 2 The fit to the 3-day bin sizedistribution is shown in the plot as a solid black line and the best-fit parametersare Cmax = 11 plusmn 03 τ0 = (07 plusmn 07) days and σ = (33 plusmn 07) days
with respect to the opticalndashGeV flare but given the coveragegaps no firm conclusion can be drawn (eg the flare could havebeen already underway when the observations took place) Nosuch lag is expected from the homogeneous model described inthe next section but could arise in models with complex energystratification and geometry in the emitting region
32 SED and Modeling
The broadband SED derived from these observations ispresented in Figure 6 and modeled using the code of Bottcher ampChiang (2002) In this model a power-law distribution of ultra-relativistic electrons andor pairs with lower and upper energycutoffs at γmin and γmax respectively and power-law index qis injected into a spherical region of comoving radius RB Theinjection rate is normalized to an injection luminosity Le whichis a free input parameter of the model The model assumesa temporary equilibrium between particle injection radiativecooling due to synchrotron and Compton losses and particleescape on a time tesc equiv ηesc RBc where ηesc is a scale parameterin the range sim250ndash500 Both the internal synchrotron photonfield (SSC) and external photon sources (EC) are considered astargets for Compton scattering The emission region is movingwith a bulk Lorentz factor Γ along the jet To reduce the numberof free parameters we assume that the jet is oriented with respectto the line of sight at the superluminal angle so that the Dopplerfactor is equal to D = (Γ [1 minus β cos θobs])
minus1 = Γ where θobs isthe angle of the jet with respect to the line of sight Given theuncertainty in the redshift determination of 3C 66A a range ofplausible redshifts namely z = 01 02 03 and the generallyused catalog value z = 0444 are considered for the modelingAll model fits include EBL absorption using the optical depthvalues from Franceschini et al (2008)
Most VHE blazars known to date are high synchrotron peaked(HSP) blazars whose SEDs can often be fitted satisfactorilywith pure SSC models Since the transition from HSP to ISP iscontinuous a pure SSC model was fitted first to the radio throughVHE gamma-ray SED Independently of the model underconsideration the low-frequency part of the SED (lt1020 Hz) iswell fitted with a synchrotron component as shown in Figure 6
9
The Astrophysical Journal 72643 (14pp) 2011 January 1 Abdo et al
Figure 6 Broadband SED of 3C 66A during the 2008 October multi-wavelength campaign The observation that corresponds to each set of data points is indicated inthe legend As an example the EBL-absorbed EC+SSC model for z = 03 is plotted here for reference A description of the model is provided in the text
For clarity only the high-frequency range is shown in Figures 7and 8 where the different models are compared As can beseen from the figures a reasonable agreement with the overallSED can be achieved for any redshift in the range exploredThe weighted sum of squared residuals has been calculatedfor the Fermi-LAT and VERITAS flare data (8 data points intotal) in order to quantify the scatter of the points with respectto the model and is shown in Table 4 The best agreement isachieved when the source is located at z sim 02ndash03 For lowerredshifts the model spectrum is systematically too hard whileat z = 0444 the model spectrum is invariably too soft as a resultof EBL absorption It should be noted that the EBL model ofFranceschini et al (2008) predicts some of the lowest opticaldepth values in comparison to other models (Finke et al 2010Gilmore et al 2009 Stecker et al 2006) Thus a model spectrumwith redshift of 03 or above would be even harder to reconcilewith the observations when using other EBL models
A major problem of the SSC models with z 01 is thatRB is of the order of 5 times 1016 cm This does not allowfor variability timescales shorter than 1 day which seemsto be in contrast with the optical variability observed on shortertimescales A smaller RB would require an increase in theelectron energy density (with no change in the magnetic fieldin order to preserve the flux level of the synchrotron peak) andwould lead to internal gammandashgamma absorption This problemcould be mitigated by choosing extremely high Doppler factorsD 100 However these are significantly larger than thevalues inferred from VLBI observations of Fermi-LAT blazars(Savolainen et al 2010)131 Moreover all SSC models requirevery low magnetic fields far below the value expected fromequipartition (εB = LBLe sim 10minus3 1) where LB is thePoynting flux derived from the magnetic energy density and Le
131 As a caveat jet models with a decelerating flow (Georganopoulos ampKazanas 2003 Piner et al 2008) or with inhomogeneous transverse structure(Ghisellini et al 2005 Henri amp Sauge 2006) can accommodate very highDoppler factors in the gamma-ray emitting region and still be consistent withthe VLBI observations of the large scale jet
is the energy flux of the electrons propagating along the jetTable 4 lists the parameters used for the SSC models displayedin Figure 7
Subsequently an external infrared radiation field with adhoc properties was included as a source of photons to beCompton scattered For all SSC+EC models shown in Figure 8the peak frequency of the external radiation field is set toνext = 14 times 1014 Hz corresponding to near-IR This adoptedvalue is high enough to produce E 100 GeV photons from ICscattering off the synchrotron electrons and at the same time isbelow the energy regime in which KleinndashNishina effects takeplace Although the weighted sums of squared residuals forEC+SSC models are generally worse than for pure SSC modelsreasonable agreement with the overall SED can still be achievedfor redshifts z 03 Furthermore all SSC+EC models areconsistent with a variability timescale of Δtvar sim 4 hr Thisis in better agreement with the observed variability at opticalwavelengths than the pure SSC interpretation Also while theSSC+EC interpretation still requires sub-equipartition magneticfields the magnetic fields are significantly closer to equipartitionthan in the pure SSC case with LBLe sim 01 The parametersof the SSC+EC models are listed in Table 5
Models with and without EC component yield the bestagreement with the SED if the source is located at a redshiftz sim 02ndash03 Of course this depends on the EBL model used inthe analysis An EBL model that predicts higher attenuation thanFranceschini et al (2008) would lead to a lower redshift rangeand make it even more difficult to have agreement betweenthe SED models and the data when the source is located atredshifts z 04 Finally it is worth mentioning that the redshiftrange z sim 02ndash03 is in agreement with previous estimates byFinke et al (2008) who estimate the redshift of 3C 66A to bez = 0321 based on the magnitude of the host galaxy and byPrandini et al (2010) who use an empirical relation betweenthe previously reported Fermi-LAT and IACTs spectral slopesof blazars and their redshifts to estimate the redshift of 3C 66Ato be below z = 034 plusmn 005
10
The Astrophysical Journal 72643 (14pp) 2011 January 1 Abdo et al
Figure 7 SSC models for redshifts z = 0444 03 02 and 01 from top to bottom The Fermi-LAT and VERITAS data points follow the same convention usedin Figures 1 and 6 to distinguish between flare (red) and dark run (blue) data points In each panel the EBL-absorbed model is shown as a solid red line and thede-absorbed model as a red dashed line De-absorbed VERITAS flare points are shown as open squares In all cases the optical depth values from Franceschini et al(2008) are used The best agreement between the model and the data is achieved when the source is located at z = 02ndash03 For lower redshifts the model spectrum issystematically too hard while at z = 0444 the model spectrum is too soft
A detailed study of hadronic versus leptonic modeling of the2008 October data will be published elsewhere but it is worthmentioning that the synchrotron proton blazar (SPB) model hasbeen used to adequately reproduce the quasi-simultaneous SEDobserved during the 2003ndash2004 multi-wavelength campaign(Reimer et al 2008) On that occasion rapid intra-day variationsdown to a 2 hr timescale were observed while during the2008 campaign presented here these variations seem less rapidQualitatively the longer timescale variations may be due toa lower Doppler beaming at the same time that a stronglyreprocessed proton synchrotron component dominates the highenergy output of this source
4 SUMMARY
Multi-wavelength observations of 3C 66A were carried outprompted by the gamma-ray outburst detected by the VERITASand Fermi observatories in 2008 October This marks the first
occasion that a gamma-ray flare is detected by GeV and TeVinstruments in comparable timescales The light curves obtainedshow strong variability at every observed wavelength and inparticular the flux increase observed by VERITAS and Fermiis coincident with an optical outburst The clear correlationbetween the Fermi-LAT and R optical light curves permits oneto go beyond the source association reported in the first Fermi-LAT source catalog (Abdo et al 2010a) and finally identify thegamma-ray source 1FGL J02226+4302 as blazar 3C 66A
For the modeling of the overall SED a reasonable agreementcan be achieved using both a pure SSC model and an SSC+ECmodel with an external near-infrared radiation field as anadditional source for Compton scattering However the pureSSC model requires (1) a large emission region which isinconsistent with the observed intra-night scale variability atoptical wavelengths and (2) low magnetic fields about afactor sim10minus3 below equipartition In contrast an SSC+ECinterpretation allows for variability on timescales of a few hours
11
The Astrophysical Journal 72643 (14pp) 2011 January 1 Abdo et al
Figure 8 EC+SSC model for redshifts z =0444 03 02 and 01 from top to bottom The individual EBL-absorbed EC and SSC components are indicated asdash-dotted and dotted lines respectively The sum is shown as a solid red line (dashed when de-absorbed) The best agreement between the model and the data isachieved when the source is located at z sim 02
Table 4Parameters Used for the SSC Models Displayed in Figure 7
Model Parameter z = 01 z = 02 z = 03 z = 0444
Low-energy cutoff γmin 18 times 104 20 times 104 22 times 104 25 times 104
High-energy cutoff γmax 30 times 105 40 times 105 40 times 105 50 times 105
Injection index q 29 29 30 30Injection luminosity Le (1045 erg sminus1) 13 33 57 128Comoving magnetic field B (G) 003 002 002 001Poynting flux LB (1042 erg sminus1) 11 49 85 137εB equiv LBLe 09 times 10minus3 15 times 10minus3 15 times 10minus3 11 times 10minus3
Doppler factor (D) 30 30 40 50Plasmoid radius RB (1016 cm) 22 60 70 11Variability timescale δtmin
var (hr) 74 221 211 294
Weighted sum of squared residuals to VERITAS flare data 71 09 07 62Weighted sum of squared residuals to Fermi-LAT flare data 16 16 13 14Total weighted sum of squared residuals 87 25 19 76
Notes All SSC models require very low magnetic fields far below the value expected from equipartition (ie εB 1) Theweighted sum of squared residuals to the VERITAS and Fermi-LAT data and the total value for the combined data set areincluded at the bottom of the table The best agreement between the model and the data is obtained when the source is at redshiftz = 02ndash03
12
The Astrophysical Journal 72643 (14pp) 2011 January 1 Abdo et al
Table 5Parameters Used for the EC+SSC Model Fits Displayed in Figure 8
Model Parameter z = 01 z = 02 z = 03 z = 0444
Low-energy cutoff γmin 55 times 103 70 times 103 65 times 103 60 times 103
High-energy cutoff γmax 12 times 105 1512 times 105 1512 times 105 1512 times 105
Injection index q 30 30 30 30Injection luminosity Le (1044 erg sminus1) 11 42 60 104Comoving magnetic field B (G) 035 022 021 023Poynting flux LB (1043 erg sminus1) 10 24 60 112εB equiv LBLe 010 006 010 011Doppler factor D 30 30 40 50Plasmoid radius RB (1016 cm) 05 12 15 15Variability timescale δtmin
var (hr) 17 44 45 40Ext radiation energy density (10minus6 erg cmminus3) 54 24 12 13
Weighted sum of squared residuals to VERITAS flare data 48 36 79 157Weighted sum of squared residuals to Fermi-LAT flare data 10 12 08 15Total weighted sum of squared residuals 58 48 87 172
Notes These model fits require magnetic fields closer to equipartition and allow for the intra-night variability observedin the optical data The weighted sum of squared residuals to the VERITAS and Fermi-LAT data and the total value forthe combined data set are included at the bottom of the table
and for magnetic fields within about an order of magnitudeof though still below equipartition It is worth noting that theresults presented here agree with the findings following the(E gt 200 GeV) flare of blazar W Comae (also an ISP) in 2008March (Acciari et al 2008a) In both cases the high opticalluminosity is expected to play a key role in providing the seedpopulation for IC scattering
Intermediate synchrotron peaked blazars like 3C 66A are wellsuited for simultaneous observations by Fermi-LAT and ground-based IACTs like VERITAS Relative to the sensitivities ofthese instruments ISPs are bright enough to allow for time-resolved spectral measurements in each band during flaringepisodes These types of observations coupled with extensivemulti-wavelength coverage at lower energies will continue toprovide key tests of blazar emission models
The Fermi-LAT Collaboration acknowledges generous ongo-ing support from a number of agencies and institutes that havesupported both the development and the operation of the LATas well as scientific data analysis These include the NationalAeronautics and Space Administration and the Department ofEnergy in the United States the Commissariat a lrsquoEnergie Atom-ique and the Centre National de la Recherche ScientifiqueInstitut National de Physique Nucleaire et de Physique desParticules in France the Agenzia Spaziale Italiana and theIstituto Nazionale di Fisica Nucleare in Italy the Ministry ofEducation Culture Sports Science and Technology (MEXT)High Energy Accelerator Research Organization (KEK) andJapan Aerospace Exploration Agency (JAXA) in Japan and theK A Wallenberg Foundation the Swedish Research Coun-cil and the Swedish National Space Board in Sweden Ad-ditional support for science analysis during the operationsphase is gratefully acknowledged from the Istituto Nazionale diAstrofisica in Italy and the Centre National drsquoEtudes Spatiales inFrance
The VERITAS collaboration acknowledges the generous sup-port from the US Department of Energy the US National Sci-ence Foundation and the Smithsonian Institution by NSERCin Canada by Science Foundation Ireland and by STFC inUK The VERITAS collaboration also acknowledges the excel-
lent work of the technical support staff at the FLWO and thecollaborating institutions in the construction and operation ofthe instrument as well as support from the NASASwift guestinvestigator program (grant NNX08AU13G) for the Swift ob-servations
PAIRITEL is operated by the Smithsonian AstrophysicalObservatory (SAO) and was made possible by a grant fromthe Harvard University Milton Fund a camera loan from theUniversity of Virginia and continued support of the SAO andUC Berkeley The PAIRITEL project is further supported byNASASwift Guest Investigator grant NNG06GH50G Thisresearch is partly based on observations with the 100 m telescopeof the MPIfR (Max-Planck-Institut fur Radioastronomie) atEffelsberg and has also made use of observations with the IRAM30 m telescope The Metsahovi team acknowledges the supportfrom the Academy of Finland The Abastumani Observatoryteam acknowledges financial support by the Georgian NationalScience Foundation through grant GNSFST084-404 The StPetersburg University team acknowledges support from RussianRFBR foundation via grant 09-02-00092 AZT-24 observationsare made within an agreement between Pulkovo Rome andTeramo observatories
L C Reyes acknowledges the support by the Kavli Institutefor Cosmological Physics at the University of Chicago throughgrants NSF PHY-0114422 and NSF PHY-0551142 and anendowment from the Kavli Foundation and its founder FredKavli M Bottcher acknowledges support from NASA throughChandra Guest Investigator Grant GO8-9100X Some of theVERITAS simulations used in this work have been performedon the joint Fermilab-KICP supercomputing cluster supportedby grants from Fermilab the Kavli Institute for CosmologicalPhysics and the University of Chicago
REFERENCES
Abdo A A et al 2009a Science 325 848Abdo A A et al 2009b ApJ 707 1310Abdo A A et al 2010a ApJS 188 405Abdo A A et al 2010b ApJ 710 1271Abdo A A et al 2010c ApJ 716 30Acciari V A et al 2008a ApJ 684 L73
13
The Astrophysical Journal 72643 (14pp) 2011 January 1 Abdo et al
Acciari V A et al 2008b ApJ 679 1427Acciari V A et al 2009 ApJ 693 L104Aliu E et al 2009 ApJ 692 L29Angelakis E Fuhrmann L Marchili N Krichbaum T P amp Zensus J A
2008 Mem Soc Astron Ital 79 1042Arnaud K A 1996 in ASP Conf Ser 101 Astronomical Data Analysis
Software and Systems V ed G H Jacoby amp J Barnes (San FranciscoCA ASP) 17
Atwood W B et al 2009 ApJ 697 1071Bennett A S 1962 Mem R Astron Soc 68 163Bloom J S Starr D L Blake C H Skrutskie M F amp Falco E E 2006
in ASP Conf Ser 351 Astronomical Data Analysis Software and SystemsXV ed C Gabriel C Arviset D Ponz amp S Enrique (San Francisco CAASP) 751
Bottcher M 2007 ApampSS 309 95Bottcher M amp Chiang J 2002 ApJ 581 127Bottcher M amp Dermer C D 2002 ApJ 564 86Bottcher M et al 2009 ApJ 694 174Bramel D A et al 2005 ApJ 629 108Britzen S et al 2007 AampA 472 763Britzen S et al 2008 AampA 484 119Cavaliere A amp DrsquoElia V 2002 ApJ 571 226Dermer C D amp Schlickeiser R 1993 ApJ 416 458Dickey J M amp Lockman F J 1990 ARAampA 28 215Edelson R A amp Krolik J H 1988 ApJ 333 646Finke J D Razzaque S amp Dermer C D 2010 ApJ 712 238Finke J D Shields J C Bottcher M amp Basu S 2008 AampA 477
513Fitzpatrick E L 1999 PASP 111 63Franceschini A Rodighiero G amp Vaccari M 2008 AampA 487 837Fuhrmann L Zensus J A Krichbaum T P Angelakis E amp Readhead A
C S 2007 in AIP Conf Proc 921 The First GLAST Symposium ed SRitz P Michelson amp C A Meegan (Melville NY AIP) 249
Fuhrmann L et al 2008 AampA 490 1019Gehrels N et al 2004 ApJ 611 1005Georganopoulos M amp Kazanas D 2003 ApJ 594 L27Georganopoulos M amp Kazanas D 2004 ApJ 604 L81Ghisellini G amp Madau P 1996 MNRAS 280 67Ghisellini G Tavecchio F amp Chiaberge M 2005 AampA 432 401Gilmore R C Madau P Primack J R Somerville R S amp Haardt F
2009 MNRAS 399 1694Hartman R C et al 1999 ApJS 123 79Henri G amp Sauge L 2006 ApJ 640 185Jorstad S G Marscher A P Mattox J R Wehrle A E Bloom S D amp
Yurchenko A V 2001 ApJS 134 181Joshi M amp Bottcher M 2007 ApJ 662 884
Kataoka J et al 1999 Astropart Phys 11 149Kerrick A D et al 1995 ApJ 452 588Kinney A L Bohlin R C Blades J C amp York D G 1991 ApJS 75
645Kuiper L Hermsen W Verbunt F Thompson D J Stairs I H Lyne A
G Strickman M S amp Cusumano G 2000 AampA 359 615Larionov V M et al 2008 ATel 1755 1Li T-P amp Ma Y-Q 1983 ApJ 272 317Mackay C D 1971 MNRAS 154 209Marscher A P Jorstad S G Mattox J R amp Wehrle A E 2002 ApJ 577
85Mattox J R et al 1996 ApJ 461 396Miller J S French H B amp Hawley S A 1978 Proc Pittsburgh Conf on
BL Lac Objects ed A M Wolfe 176Mucke A Protheroe R J Engel R Rachen J P amp Stanev T 2003
Astropart Phys 18 593Northover K J E 1973 MNRAS 165 369Oke J B et al 1995 PASP 107 375Piner B G Pant N amp Edwards P G 2008 ApJ 678 64Poole T S et al 2008 MNRAS 383 627Prandini E Bonnoli G Maraschi L Mariotti M amp Tavecchio F 2010
MNRAS 405 L76Reimer A Joshi M amp Bottcher M 2008 in AIP Conf Ser 1085 High
Energy Gamma-Ray Astronomy ed F A Aharonian W Hofmann amp FRieger (Melville NY AIP) 502
Savolainen T Homan D C Hovatta T Kadler M Kovalev Y Y ListerM L Ros E amp Zensus J A 2010 AampA 512 A24
Schlegel D J Finkbeiner D P amp Davis M 1998 ApJ 500 525Sikora M Begelman M C amp Rees M J 1994 ApJ 421 153Smith H E Smith E O amp Spinrad H 1976 PASP 88 621Stecker F W Malkan M A amp Scully S T 2006 ApJ 648 774 (erratum
658 1392 [2007])Swordy S 2008 ATel 1753 1Tavecchio F amp Ghisellini G 2009 MNRAS 394 L131Taylor G B Vermeulen R C Readhead A C S Pearson T J Henstock
D R amp Wilkinson P N 1996 ApJS 107 37Thompson D J et al 1993 ApJS 86 629Tosti G 2008 ATel 1759 1Urry C M amp Padovani P 1995 PASP 107 803Villata M et al 2008 AampA 481 L79Villata M et al 2009 AampA 504 L9Weekes T C 2000 in AIP Conf Ser 515 GeVndashTeV Gamma Ray Astrophysics
Workshop Towards a Major Atmospheric Cherenkov Detector VI ed B LDingus M H Salamon amp D B Kieda (Melville NY AIP) 3
Wills B J amp Wills D 1974 ApJ 190 L97Wurtz R Stocke J T amp Yee H K C 1996 ApJS 103 109
14
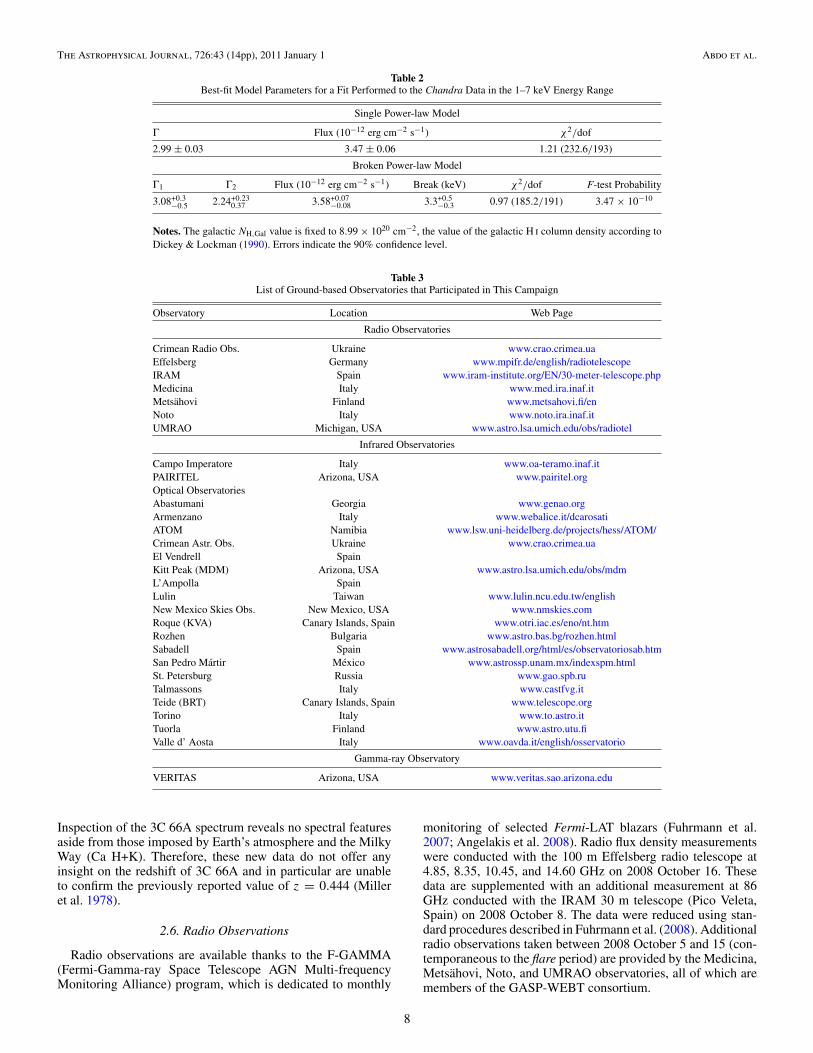
The Astrophysical Journal 72643 (14pp) 2011 January 1 Abdo et al
Table 2Best-fit Model Parameters for a Fit Performed to the Chandra Data in the 1ndash7 keV Energy Range
Single Power-law Model
Γ Flux (10minus12 erg cmminus2 sminus1) χ2dof
299 plusmn 003 347 plusmn 006 121 (2326193)
Broken Power-law Model
Γ1 Γ2 Flux (10minus12 erg cmminus2 sminus1) Break (keV) χ2dof F-test Probability
308+03minus05 224+023
037 358+007minus008 33+05
minus03 097 (1852191) 347 times 10minus10
Notes The galactic NHGal value is fixed to 899 times 1020 cmminus2 the value of the galactic H i column density according toDickey amp Lockman (1990) Errors indicate the 90 confidence level
Table 3List of Ground-based Observatories that Participated in This Campaign
Observatory Location Web Page
Radio Observatories
Crimean Radio Obs Ukraine wwwcraocrimeauaEffelsberg Germany wwwmpifrdeenglishradiotelescopeIRAM Spain wwwiram-instituteorgEN30-meter-telescopephpMedicina Italy wwwmedirainafitMetsahovi Finland wwwmetsahovifienNoto Italy wwwnotoirainafitUMRAO Michigan USA wwwastrolsaumicheduobsradiotel
Infrared Observatories
Campo Imperatore Italy wwwoa-teramoinafitPAIRITEL Arizona USA wwwpairitelorgOptical ObservatoriesAbastumani Georgia wwwgenaoorgArmenzano Italy wwwwebaliceitdcarosatiATOM Namibia wwwlswuni-heidelbergdeprojectshessATOMCrimean Astr Obs Ukraine wwwcraocrimeauaEl Vendrell SpainKitt Peak (MDM) Arizona USA wwwastrolsaumicheduobsmdmLrsquoAmpolla SpainLulin Taiwan wwwlulinncuedutwenglishNew Mexico Skies Obs New Mexico USA wwwnmskiescomRoque (KVA) Canary Islands Spain wwwotriiacesenonthtmRozhen Bulgaria wwwastrobasbgrozhenhtmlSabadell Spain wwwastrosabadellorghtmlesobservatoriosabhtmSan Pedro Martir Mexico wwwastrosspunammxindexspmhtmlSt Petersburg Russia wwwgaospbruTalmassons Italy wwwcastfvgitTeide (BRT) Canary Islands Spain wwwtelescopeorgTorino Italy wwwtoastroitTuorla Finland wwwastroutufiValle drsquo Aosta Italy wwwoavdaitenglishosservatorio
Gamma-ray Observatory
VERITAS Arizona USA wwwveritassaoarizonaedu
Inspection of the 3C 66A spectrum reveals no spectral featuresaside from those imposed by Earthrsquos atmosphere and the MilkyWay (Ca H+K) Therefore these new data do not offer anyinsight on the redshift of 3C 66A and in particular are unableto confirm the previously reported value of z = 0444 (Milleret al 1978)
26 Radio Observations
Radio observations are available thanks to the F-GAMMA(Fermi-Gamma-ray Space Telescope AGN Multi-frequencyMonitoring Alliance) program which is dedicated to monthly
monitoring of selected Fermi-LAT blazars (Fuhrmann et al2007 Angelakis et al 2008) Radio flux density measurementswere conducted with the 100 m Effelsberg radio telescope at485 835 1045 and 1460 GHz on 2008 October 16 Thesedata are supplemented with an additional measurement at 86GHz conducted with the IRAM 30 m telescope (Pico VeletaSpain) on 2008 October 8 The data were reduced using stan-dard procedures described in Fuhrmann et al (2008) Additionalradio observations taken between 2008 October 5 and 15 (con-temporaneous to the flare period) are provided by the MedicinaMetsahovi Noto and UMRAO observatories all of which aremembers of the GASP-WEBT consortium
8
The Astrophysical Journal 72643 (14pp) 2011 January 1 Abdo et al
3 DISCUSSION
31 Light Curves
The resulting multi-wavelength light curves from this cam-paign are shown in Figure 3 for those bands with long-term cov-erage and in Figure 4 for those observations that were obtainedshortly before and after the gamma-ray flare The VERITASobservations are combined to obtain nightly (E gt 200 GeV)flux values since no evidence for intra-night variability is ob-served The highest flux occurred on MJD 54749 and significantvariability is observed during the whole interval (χ2 probabilityless than 10minus4 for a fit of a constant flux)
The temporal dependence of the Fermi-LAT photon index andintegral flux above 100 MeV and 1 GeV are shown with timebins with width of 3 days in Figure 3 For those time intervalswith no significant detection a 95 confidence flux upper limitis calculated The flux and photon index from the Fermi-LATfirst source catalog (Abdo et al 2010a) are shown as horizontallines for comparison These values correspond to the averageflux and photon index measured during the first 11 months ofFermi operations and thus span the time interval considered inthe figures It is evident from the plot that the VHE flare detectedby VERITAS starting on MJD 54740 is coincident with a periodof high flux in the Fermi energy band The photon index duringthis time interval is consistent within errors with the averagephoton index Γ = 195 plusmn 003 measured during the first sixmonths of the Fermi mission (Abdo et al 2010b)
Long-term and well-sampled light curves are available atoptical and near-infrared wavelengths thanks to observations byGASP-WEBT ATOM MDM and PAIRITEL Unfortunatelyradio observations were too limited to obtain a light curve andno statement about variability in this band can be made Thebest sampling is available for the R band for which variationswith a factor of 2 are observed in the long-term light curveFurthermore variability on timescales of less than a day isobserved as indicated in Figure 4 and as previously reportedby Bottcher et al (2009) following the WEBT (Whole EarthBlazar Telescope) campaign on 3C 66A in 2007 and 2008
The increase in gamma-ray flux observed in the Fermi bandseems contemporaneous with a period of increased flux in theoptical and to test this hypothesis the discrete correlationfunction (DCF) is used (Edelson amp Krolik 1988) Figure 5shows the DCF of the F(E gt 1 GeV) gamma-ray band withrespect to the R band with time-lag bins of 3 5 and 7 days Theprofile of the DCF is consistent for all time-lag bins indicatingthat the result is independent of bin size The DCF with time-lagbins of 3 days was fitted with a Gaussian function of the formDCF(τ ) = Cmax times exp (τ minus τ0)2σ 2 where Cmax is the peakvalue of the DCF τ0 is the delay timescale at which the DCFpeaks and σ parameterizes the Gaussian width of the DCF Thebest-fit function is plotted in Figure 5 and the best-fit parametersare Cmax = 11 plusmn 03 τ0 = (07 plusmn 07) days and σ = (33 plusmn07) days An identical analysis was also performed betweenthe F(E gt 100 MeV) and the R optical band with consistentresults This indicates a clear correlation between the Fermi-LAT and optical energy bands with a time lag that is consistentwith zero and not greater than sim5 days Despite the sparsity ofthe VERITAS light curve (due in part to the time periods whenthe source was not observable due to the full Moon) the DCFanalysis was also performed to search for correlations with eitherthe Fermi-LAT or optical data Apart from the overall increasein flux no significant correlations can be established The onsetof the E gt 200 GeV flare seems delayed by about sim5 days
Time lag [days]minus30 minus20 minus10 0 10 20 30
DC
F
minus1
minus05
0
05
1
15 Bin Size3 days
5 days
7 days
Figure 5 Discrete correlation function (DCF) of the F(E gt 1 GeV) gamma-raylight curve with respect to the R-band light curve A positive time lag indicatesthat the gamma-ray band leads the optical band Different symbols correspondto different bin sizes of time lag as indicated in the legend The profile of theDCF is independent of bin size and is well described by a Gaussian functionof the form DCF(τ ) = Cmax times exp (τ minus τ0)2σ 2 The fit to the 3-day bin sizedistribution is shown in the plot as a solid black line and the best-fit parametersare Cmax = 11 plusmn 03 τ0 = (07 plusmn 07) days and σ = (33 plusmn 07) days
with respect to the opticalndashGeV flare but given the coveragegaps no firm conclusion can be drawn (eg the flare could havebeen already underway when the observations took place) Nosuch lag is expected from the homogeneous model described inthe next section but could arise in models with complex energystratification and geometry in the emitting region
32 SED and Modeling
The broadband SED derived from these observations ispresented in Figure 6 and modeled using the code of Bottcher ampChiang (2002) In this model a power-law distribution of ultra-relativistic electrons andor pairs with lower and upper energycutoffs at γmin and γmax respectively and power-law index qis injected into a spherical region of comoving radius RB Theinjection rate is normalized to an injection luminosity Le whichis a free input parameter of the model The model assumesa temporary equilibrium between particle injection radiativecooling due to synchrotron and Compton losses and particleescape on a time tesc equiv ηesc RBc where ηesc is a scale parameterin the range sim250ndash500 Both the internal synchrotron photonfield (SSC) and external photon sources (EC) are considered astargets for Compton scattering The emission region is movingwith a bulk Lorentz factor Γ along the jet To reduce the numberof free parameters we assume that the jet is oriented with respectto the line of sight at the superluminal angle so that the Dopplerfactor is equal to D = (Γ [1 minus β cos θobs])
minus1 = Γ where θobs isthe angle of the jet with respect to the line of sight Given theuncertainty in the redshift determination of 3C 66A a range ofplausible redshifts namely z = 01 02 03 and the generallyused catalog value z = 0444 are considered for the modelingAll model fits include EBL absorption using the optical depthvalues from Franceschini et al (2008)
Most VHE blazars known to date are high synchrotron peaked(HSP) blazars whose SEDs can often be fitted satisfactorilywith pure SSC models Since the transition from HSP to ISP iscontinuous a pure SSC model was fitted first to the radio throughVHE gamma-ray SED Independently of the model underconsideration the low-frequency part of the SED (lt1020 Hz) iswell fitted with a synchrotron component as shown in Figure 6
9
The Astrophysical Journal 72643 (14pp) 2011 January 1 Abdo et al
Figure 6 Broadband SED of 3C 66A during the 2008 October multi-wavelength campaign The observation that corresponds to each set of data points is indicated inthe legend As an example the EBL-absorbed EC+SSC model for z = 03 is plotted here for reference A description of the model is provided in the text
For clarity only the high-frequency range is shown in Figures 7and 8 where the different models are compared As can beseen from the figures a reasonable agreement with the overallSED can be achieved for any redshift in the range exploredThe weighted sum of squared residuals has been calculatedfor the Fermi-LAT and VERITAS flare data (8 data points intotal) in order to quantify the scatter of the points with respectto the model and is shown in Table 4 The best agreement isachieved when the source is located at z sim 02ndash03 For lowerredshifts the model spectrum is systematically too hard whileat z = 0444 the model spectrum is invariably too soft as a resultof EBL absorption It should be noted that the EBL model ofFranceschini et al (2008) predicts some of the lowest opticaldepth values in comparison to other models (Finke et al 2010Gilmore et al 2009 Stecker et al 2006) Thus a model spectrumwith redshift of 03 or above would be even harder to reconcilewith the observations when using other EBL models
A major problem of the SSC models with z 01 is thatRB is of the order of 5 times 1016 cm This does not allowfor variability timescales shorter than 1 day which seemsto be in contrast with the optical variability observed on shortertimescales A smaller RB would require an increase in theelectron energy density (with no change in the magnetic fieldin order to preserve the flux level of the synchrotron peak) andwould lead to internal gammandashgamma absorption This problemcould be mitigated by choosing extremely high Doppler factorsD 100 However these are significantly larger than thevalues inferred from VLBI observations of Fermi-LAT blazars(Savolainen et al 2010)131 Moreover all SSC models requirevery low magnetic fields far below the value expected fromequipartition (εB = LBLe sim 10minus3 1) where LB is thePoynting flux derived from the magnetic energy density and Le
131 As a caveat jet models with a decelerating flow (Georganopoulos ampKazanas 2003 Piner et al 2008) or with inhomogeneous transverse structure(Ghisellini et al 2005 Henri amp Sauge 2006) can accommodate very highDoppler factors in the gamma-ray emitting region and still be consistent withthe VLBI observations of the large scale jet
is the energy flux of the electrons propagating along the jetTable 4 lists the parameters used for the SSC models displayedin Figure 7
Subsequently an external infrared radiation field with adhoc properties was included as a source of photons to beCompton scattered For all SSC+EC models shown in Figure 8the peak frequency of the external radiation field is set toνext = 14 times 1014 Hz corresponding to near-IR This adoptedvalue is high enough to produce E 100 GeV photons from ICscattering off the synchrotron electrons and at the same time isbelow the energy regime in which KleinndashNishina effects takeplace Although the weighted sums of squared residuals forEC+SSC models are generally worse than for pure SSC modelsreasonable agreement with the overall SED can still be achievedfor redshifts z 03 Furthermore all SSC+EC models areconsistent with a variability timescale of Δtvar sim 4 hr Thisis in better agreement with the observed variability at opticalwavelengths than the pure SSC interpretation Also while theSSC+EC interpretation still requires sub-equipartition magneticfields the magnetic fields are significantly closer to equipartitionthan in the pure SSC case with LBLe sim 01 The parametersof the SSC+EC models are listed in Table 5
Models with and without EC component yield the bestagreement with the SED if the source is located at a redshiftz sim 02ndash03 Of course this depends on the EBL model used inthe analysis An EBL model that predicts higher attenuation thanFranceschini et al (2008) would lead to a lower redshift rangeand make it even more difficult to have agreement betweenthe SED models and the data when the source is located atredshifts z 04 Finally it is worth mentioning that the redshiftrange z sim 02ndash03 is in agreement with previous estimates byFinke et al (2008) who estimate the redshift of 3C 66A to bez = 0321 based on the magnitude of the host galaxy and byPrandini et al (2010) who use an empirical relation betweenthe previously reported Fermi-LAT and IACTs spectral slopesof blazars and their redshifts to estimate the redshift of 3C 66Ato be below z = 034 plusmn 005
10
The Astrophysical Journal 72643 (14pp) 2011 January 1 Abdo et al
Figure 7 SSC models for redshifts z = 0444 03 02 and 01 from top to bottom The Fermi-LAT and VERITAS data points follow the same convention usedin Figures 1 and 6 to distinguish between flare (red) and dark run (blue) data points In each panel the EBL-absorbed model is shown as a solid red line and thede-absorbed model as a red dashed line De-absorbed VERITAS flare points are shown as open squares In all cases the optical depth values from Franceschini et al(2008) are used The best agreement between the model and the data is achieved when the source is located at z = 02ndash03 For lower redshifts the model spectrum issystematically too hard while at z = 0444 the model spectrum is too soft
A detailed study of hadronic versus leptonic modeling of the2008 October data will be published elsewhere but it is worthmentioning that the synchrotron proton blazar (SPB) model hasbeen used to adequately reproduce the quasi-simultaneous SEDobserved during the 2003ndash2004 multi-wavelength campaign(Reimer et al 2008) On that occasion rapid intra-day variationsdown to a 2 hr timescale were observed while during the2008 campaign presented here these variations seem less rapidQualitatively the longer timescale variations may be due toa lower Doppler beaming at the same time that a stronglyreprocessed proton synchrotron component dominates the highenergy output of this source
4 SUMMARY
Multi-wavelength observations of 3C 66A were carried outprompted by the gamma-ray outburst detected by the VERITASand Fermi observatories in 2008 October This marks the first
occasion that a gamma-ray flare is detected by GeV and TeVinstruments in comparable timescales The light curves obtainedshow strong variability at every observed wavelength and inparticular the flux increase observed by VERITAS and Fermiis coincident with an optical outburst The clear correlationbetween the Fermi-LAT and R optical light curves permits oneto go beyond the source association reported in the first Fermi-LAT source catalog (Abdo et al 2010a) and finally identify thegamma-ray source 1FGL J02226+4302 as blazar 3C 66A
For the modeling of the overall SED a reasonable agreementcan be achieved using both a pure SSC model and an SSC+ECmodel with an external near-infrared radiation field as anadditional source for Compton scattering However the pureSSC model requires (1) a large emission region which isinconsistent with the observed intra-night scale variability atoptical wavelengths and (2) low magnetic fields about afactor sim10minus3 below equipartition In contrast an SSC+ECinterpretation allows for variability on timescales of a few hours
11
The Astrophysical Journal 72643 (14pp) 2011 January 1 Abdo et al
Figure 8 EC+SSC model for redshifts z =0444 03 02 and 01 from top to bottom The individual EBL-absorbed EC and SSC components are indicated asdash-dotted and dotted lines respectively The sum is shown as a solid red line (dashed when de-absorbed) The best agreement between the model and the data isachieved when the source is located at z sim 02
Table 4Parameters Used for the SSC Models Displayed in Figure 7
Model Parameter z = 01 z = 02 z = 03 z = 0444
Low-energy cutoff γmin 18 times 104 20 times 104 22 times 104 25 times 104
High-energy cutoff γmax 30 times 105 40 times 105 40 times 105 50 times 105
Injection index q 29 29 30 30Injection luminosity Le (1045 erg sminus1) 13 33 57 128Comoving magnetic field B (G) 003 002 002 001Poynting flux LB (1042 erg sminus1) 11 49 85 137εB equiv LBLe 09 times 10minus3 15 times 10minus3 15 times 10minus3 11 times 10minus3
Doppler factor (D) 30 30 40 50Plasmoid radius RB (1016 cm) 22 60 70 11Variability timescale δtmin
var (hr) 74 221 211 294
Weighted sum of squared residuals to VERITAS flare data 71 09 07 62Weighted sum of squared residuals to Fermi-LAT flare data 16 16 13 14Total weighted sum of squared residuals 87 25 19 76
Notes All SSC models require very low magnetic fields far below the value expected from equipartition (ie εB 1) Theweighted sum of squared residuals to the VERITAS and Fermi-LAT data and the total value for the combined data set areincluded at the bottom of the table The best agreement between the model and the data is obtained when the source is at redshiftz = 02ndash03
12
The Astrophysical Journal 72643 (14pp) 2011 January 1 Abdo et al
Table 5Parameters Used for the EC+SSC Model Fits Displayed in Figure 8
Model Parameter z = 01 z = 02 z = 03 z = 0444
Low-energy cutoff γmin 55 times 103 70 times 103 65 times 103 60 times 103
High-energy cutoff γmax 12 times 105 1512 times 105 1512 times 105 1512 times 105
Injection index q 30 30 30 30Injection luminosity Le (1044 erg sminus1) 11 42 60 104Comoving magnetic field B (G) 035 022 021 023Poynting flux LB (1043 erg sminus1) 10 24 60 112εB equiv LBLe 010 006 010 011Doppler factor D 30 30 40 50Plasmoid radius RB (1016 cm) 05 12 15 15Variability timescale δtmin
var (hr) 17 44 45 40Ext radiation energy density (10minus6 erg cmminus3) 54 24 12 13
Weighted sum of squared residuals to VERITAS flare data 48 36 79 157Weighted sum of squared residuals to Fermi-LAT flare data 10 12 08 15Total weighted sum of squared residuals 58 48 87 172
Notes These model fits require magnetic fields closer to equipartition and allow for the intra-night variability observedin the optical data The weighted sum of squared residuals to the VERITAS and Fermi-LAT data and the total value forthe combined data set are included at the bottom of the table
and for magnetic fields within about an order of magnitudeof though still below equipartition It is worth noting that theresults presented here agree with the findings following the(E gt 200 GeV) flare of blazar W Comae (also an ISP) in 2008March (Acciari et al 2008a) In both cases the high opticalluminosity is expected to play a key role in providing the seedpopulation for IC scattering
Intermediate synchrotron peaked blazars like 3C 66A are wellsuited for simultaneous observations by Fermi-LAT and ground-based IACTs like VERITAS Relative to the sensitivities ofthese instruments ISPs are bright enough to allow for time-resolved spectral measurements in each band during flaringepisodes These types of observations coupled with extensivemulti-wavelength coverage at lower energies will continue toprovide key tests of blazar emission models
The Fermi-LAT Collaboration acknowledges generous ongo-ing support from a number of agencies and institutes that havesupported both the development and the operation of the LATas well as scientific data analysis These include the NationalAeronautics and Space Administration and the Department ofEnergy in the United States the Commissariat a lrsquoEnergie Atom-ique and the Centre National de la Recherche ScientifiqueInstitut National de Physique Nucleaire et de Physique desParticules in France the Agenzia Spaziale Italiana and theIstituto Nazionale di Fisica Nucleare in Italy the Ministry ofEducation Culture Sports Science and Technology (MEXT)High Energy Accelerator Research Organization (KEK) andJapan Aerospace Exploration Agency (JAXA) in Japan and theK A Wallenberg Foundation the Swedish Research Coun-cil and the Swedish National Space Board in Sweden Ad-ditional support for science analysis during the operationsphase is gratefully acknowledged from the Istituto Nazionale diAstrofisica in Italy and the Centre National drsquoEtudes Spatiales inFrance
The VERITAS collaboration acknowledges the generous sup-port from the US Department of Energy the US National Sci-ence Foundation and the Smithsonian Institution by NSERCin Canada by Science Foundation Ireland and by STFC inUK The VERITAS collaboration also acknowledges the excel-
lent work of the technical support staff at the FLWO and thecollaborating institutions in the construction and operation ofthe instrument as well as support from the NASASwift guestinvestigator program (grant NNX08AU13G) for the Swift ob-servations
PAIRITEL is operated by the Smithsonian AstrophysicalObservatory (SAO) and was made possible by a grant fromthe Harvard University Milton Fund a camera loan from theUniversity of Virginia and continued support of the SAO andUC Berkeley The PAIRITEL project is further supported byNASASwift Guest Investigator grant NNG06GH50G Thisresearch is partly based on observations with the 100 m telescopeof the MPIfR (Max-Planck-Institut fur Radioastronomie) atEffelsberg and has also made use of observations with the IRAM30 m telescope The Metsahovi team acknowledges the supportfrom the Academy of Finland The Abastumani Observatoryteam acknowledges financial support by the Georgian NationalScience Foundation through grant GNSFST084-404 The StPetersburg University team acknowledges support from RussianRFBR foundation via grant 09-02-00092 AZT-24 observationsare made within an agreement between Pulkovo Rome andTeramo observatories
L C Reyes acknowledges the support by the Kavli Institutefor Cosmological Physics at the University of Chicago throughgrants NSF PHY-0114422 and NSF PHY-0551142 and anendowment from the Kavli Foundation and its founder FredKavli M Bottcher acknowledges support from NASA throughChandra Guest Investigator Grant GO8-9100X Some of theVERITAS simulations used in this work have been performedon the joint Fermilab-KICP supercomputing cluster supportedby grants from Fermilab the Kavli Institute for CosmologicalPhysics and the University of Chicago
REFERENCES
Abdo A A et al 2009a Science 325 848Abdo A A et al 2009b ApJ 707 1310Abdo A A et al 2010a ApJS 188 405Abdo A A et al 2010b ApJ 710 1271Abdo A A et al 2010c ApJ 716 30Acciari V A et al 2008a ApJ 684 L73
13
The Astrophysical Journal 72643 (14pp) 2011 January 1 Abdo et al
Acciari V A et al 2008b ApJ 679 1427Acciari V A et al 2009 ApJ 693 L104Aliu E et al 2009 ApJ 692 L29Angelakis E Fuhrmann L Marchili N Krichbaum T P amp Zensus J A
2008 Mem Soc Astron Ital 79 1042Arnaud K A 1996 in ASP Conf Ser 101 Astronomical Data Analysis
Software and Systems V ed G H Jacoby amp J Barnes (San FranciscoCA ASP) 17
Atwood W B et al 2009 ApJ 697 1071Bennett A S 1962 Mem R Astron Soc 68 163Bloom J S Starr D L Blake C H Skrutskie M F amp Falco E E 2006
in ASP Conf Ser 351 Astronomical Data Analysis Software and SystemsXV ed C Gabriel C Arviset D Ponz amp S Enrique (San Francisco CAASP) 751
Bottcher M 2007 ApampSS 309 95Bottcher M amp Chiang J 2002 ApJ 581 127Bottcher M amp Dermer C D 2002 ApJ 564 86Bottcher M et al 2009 ApJ 694 174Bramel D A et al 2005 ApJ 629 108Britzen S et al 2007 AampA 472 763Britzen S et al 2008 AampA 484 119Cavaliere A amp DrsquoElia V 2002 ApJ 571 226Dermer C D amp Schlickeiser R 1993 ApJ 416 458Dickey J M amp Lockman F J 1990 ARAampA 28 215Edelson R A amp Krolik J H 1988 ApJ 333 646Finke J D Razzaque S amp Dermer C D 2010 ApJ 712 238Finke J D Shields J C Bottcher M amp Basu S 2008 AampA 477
513Fitzpatrick E L 1999 PASP 111 63Franceschini A Rodighiero G amp Vaccari M 2008 AampA 487 837Fuhrmann L Zensus J A Krichbaum T P Angelakis E amp Readhead A
C S 2007 in AIP Conf Proc 921 The First GLAST Symposium ed SRitz P Michelson amp C A Meegan (Melville NY AIP) 249
Fuhrmann L et al 2008 AampA 490 1019Gehrels N et al 2004 ApJ 611 1005Georganopoulos M amp Kazanas D 2003 ApJ 594 L27Georganopoulos M amp Kazanas D 2004 ApJ 604 L81Ghisellini G amp Madau P 1996 MNRAS 280 67Ghisellini G Tavecchio F amp Chiaberge M 2005 AampA 432 401Gilmore R C Madau P Primack J R Somerville R S amp Haardt F
2009 MNRAS 399 1694Hartman R C et al 1999 ApJS 123 79Henri G amp Sauge L 2006 ApJ 640 185Jorstad S G Marscher A P Mattox J R Wehrle A E Bloom S D amp
Yurchenko A V 2001 ApJS 134 181Joshi M amp Bottcher M 2007 ApJ 662 884
Kataoka J et al 1999 Astropart Phys 11 149Kerrick A D et al 1995 ApJ 452 588Kinney A L Bohlin R C Blades J C amp York D G 1991 ApJS 75
645Kuiper L Hermsen W Verbunt F Thompson D J Stairs I H Lyne A
G Strickman M S amp Cusumano G 2000 AampA 359 615Larionov V M et al 2008 ATel 1755 1Li T-P amp Ma Y-Q 1983 ApJ 272 317Mackay C D 1971 MNRAS 154 209Marscher A P Jorstad S G Mattox J R amp Wehrle A E 2002 ApJ 577
85Mattox J R et al 1996 ApJ 461 396Miller J S French H B amp Hawley S A 1978 Proc Pittsburgh Conf on
BL Lac Objects ed A M Wolfe 176Mucke A Protheroe R J Engel R Rachen J P amp Stanev T 2003
Astropart Phys 18 593Northover K J E 1973 MNRAS 165 369Oke J B et al 1995 PASP 107 375Piner B G Pant N amp Edwards P G 2008 ApJ 678 64Poole T S et al 2008 MNRAS 383 627Prandini E Bonnoli G Maraschi L Mariotti M amp Tavecchio F 2010
MNRAS 405 L76Reimer A Joshi M amp Bottcher M 2008 in AIP Conf Ser 1085 High
Energy Gamma-Ray Astronomy ed F A Aharonian W Hofmann amp FRieger (Melville NY AIP) 502
Savolainen T Homan D C Hovatta T Kadler M Kovalev Y Y ListerM L Ros E amp Zensus J A 2010 AampA 512 A24
Schlegel D J Finkbeiner D P amp Davis M 1998 ApJ 500 525Sikora M Begelman M C amp Rees M J 1994 ApJ 421 153Smith H E Smith E O amp Spinrad H 1976 PASP 88 621Stecker F W Malkan M A amp Scully S T 2006 ApJ 648 774 (erratum
658 1392 [2007])Swordy S 2008 ATel 1753 1Tavecchio F amp Ghisellini G 2009 MNRAS 394 L131Taylor G B Vermeulen R C Readhead A C S Pearson T J Henstock
D R amp Wilkinson P N 1996 ApJS 107 37Thompson D J et al 1993 ApJS 86 629Tosti G 2008 ATel 1759 1Urry C M amp Padovani P 1995 PASP 107 803Villata M et al 2008 AampA 481 L79Villata M et al 2009 AampA 504 L9Weekes T C 2000 in AIP Conf Ser 515 GeVndashTeV Gamma Ray Astrophysics
Workshop Towards a Major Atmospheric Cherenkov Detector VI ed B LDingus M H Salamon amp D B Kieda (Melville NY AIP) 3
Wills B J amp Wills D 1974 ApJ 190 L97Wurtz R Stocke J T amp Yee H K C 1996 ApJS 103 109
14
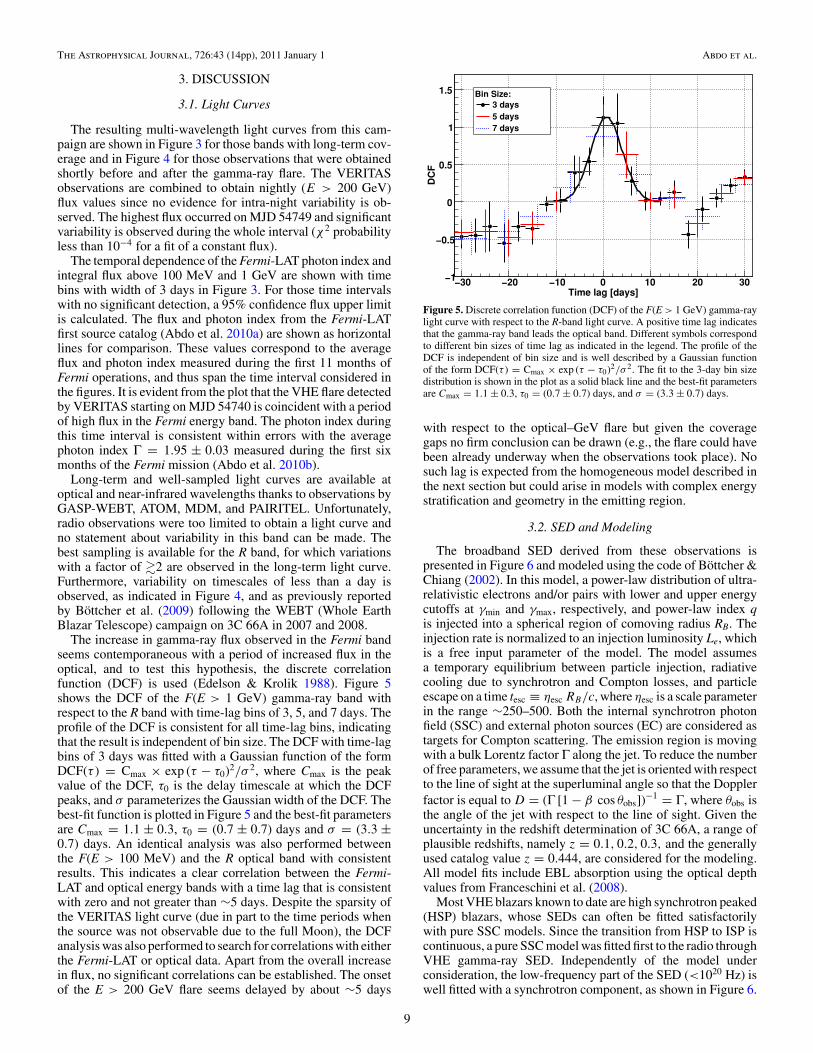
The Astrophysical Journal 72643 (14pp) 2011 January 1 Abdo et al
3 DISCUSSION
31 Light Curves
The resulting multi-wavelength light curves from this cam-paign are shown in Figure 3 for those bands with long-term cov-erage and in Figure 4 for those observations that were obtainedshortly before and after the gamma-ray flare The VERITASobservations are combined to obtain nightly (E gt 200 GeV)flux values since no evidence for intra-night variability is ob-served The highest flux occurred on MJD 54749 and significantvariability is observed during the whole interval (χ2 probabilityless than 10minus4 for a fit of a constant flux)
The temporal dependence of the Fermi-LAT photon index andintegral flux above 100 MeV and 1 GeV are shown with timebins with width of 3 days in Figure 3 For those time intervalswith no significant detection a 95 confidence flux upper limitis calculated The flux and photon index from the Fermi-LATfirst source catalog (Abdo et al 2010a) are shown as horizontallines for comparison These values correspond to the averageflux and photon index measured during the first 11 months ofFermi operations and thus span the time interval considered inthe figures It is evident from the plot that the VHE flare detectedby VERITAS starting on MJD 54740 is coincident with a periodof high flux in the Fermi energy band The photon index duringthis time interval is consistent within errors with the averagephoton index Γ = 195 plusmn 003 measured during the first sixmonths of the Fermi mission (Abdo et al 2010b)
Long-term and well-sampled light curves are available atoptical and near-infrared wavelengths thanks to observations byGASP-WEBT ATOM MDM and PAIRITEL Unfortunatelyradio observations were too limited to obtain a light curve andno statement about variability in this band can be made Thebest sampling is available for the R band for which variationswith a factor of 2 are observed in the long-term light curveFurthermore variability on timescales of less than a day isobserved as indicated in Figure 4 and as previously reportedby Bottcher et al (2009) following the WEBT (Whole EarthBlazar Telescope) campaign on 3C 66A in 2007 and 2008
The increase in gamma-ray flux observed in the Fermi bandseems contemporaneous with a period of increased flux in theoptical and to test this hypothesis the discrete correlationfunction (DCF) is used (Edelson amp Krolik 1988) Figure 5shows the DCF of the F(E gt 1 GeV) gamma-ray band withrespect to the R band with time-lag bins of 3 5 and 7 days Theprofile of the DCF is consistent for all time-lag bins indicatingthat the result is independent of bin size The DCF with time-lagbins of 3 days was fitted with a Gaussian function of the formDCF(τ ) = Cmax times exp (τ minus τ0)2σ 2 where Cmax is the peakvalue of the DCF τ0 is the delay timescale at which the DCFpeaks and σ parameterizes the Gaussian width of the DCF Thebest-fit function is plotted in Figure 5 and the best-fit parametersare Cmax = 11 plusmn 03 τ0 = (07 plusmn 07) days and σ = (33 plusmn07) days An identical analysis was also performed betweenthe F(E gt 100 MeV) and the R optical band with consistentresults This indicates a clear correlation between the Fermi-LAT and optical energy bands with a time lag that is consistentwith zero and not greater than sim5 days Despite the sparsity ofthe VERITAS light curve (due in part to the time periods whenthe source was not observable due to the full Moon) the DCFanalysis was also performed to search for correlations with eitherthe Fermi-LAT or optical data Apart from the overall increasein flux no significant correlations can be established The onsetof the E gt 200 GeV flare seems delayed by about sim5 days
Time lag [days]minus30 minus20 minus10 0 10 20 30
DC
F
minus1
minus05
0
05
1
15 Bin Size3 days
5 days
7 days
Figure 5 Discrete correlation function (DCF) of the F(E gt 1 GeV) gamma-raylight curve with respect to the R-band light curve A positive time lag indicatesthat the gamma-ray band leads the optical band Different symbols correspondto different bin sizes of time lag as indicated in the legend The profile of theDCF is independent of bin size and is well described by a Gaussian functionof the form DCF(τ ) = Cmax times exp (τ minus τ0)2σ 2 The fit to the 3-day bin sizedistribution is shown in the plot as a solid black line and the best-fit parametersare Cmax = 11 plusmn 03 τ0 = (07 plusmn 07) days and σ = (33 plusmn 07) days
with respect to the opticalndashGeV flare but given the coveragegaps no firm conclusion can be drawn (eg the flare could havebeen already underway when the observations took place) Nosuch lag is expected from the homogeneous model described inthe next section but could arise in models with complex energystratification and geometry in the emitting region
32 SED and Modeling
The broadband SED derived from these observations ispresented in Figure 6 and modeled using the code of Bottcher ampChiang (2002) In this model a power-law distribution of ultra-relativistic electrons andor pairs with lower and upper energycutoffs at γmin and γmax respectively and power-law index qis injected into a spherical region of comoving radius RB Theinjection rate is normalized to an injection luminosity Le whichis a free input parameter of the model The model assumesa temporary equilibrium between particle injection radiativecooling due to synchrotron and Compton losses and particleescape on a time tesc equiv ηesc RBc where ηesc is a scale parameterin the range sim250ndash500 Both the internal synchrotron photonfield (SSC) and external photon sources (EC) are considered astargets for Compton scattering The emission region is movingwith a bulk Lorentz factor Γ along the jet To reduce the numberof free parameters we assume that the jet is oriented with respectto the line of sight at the superluminal angle so that the Dopplerfactor is equal to D = (Γ [1 minus β cos θobs])
minus1 = Γ where θobs isthe angle of the jet with respect to the line of sight Given theuncertainty in the redshift determination of 3C 66A a range ofplausible redshifts namely z = 01 02 03 and the generallyused catalog value z = 0444 are considered for the modelingAll model fits include EBL absorption using the optical depthvalues from Franceschini et al (2008)
Most VHE blazars known to date are high synchrotron peaked(HSP) blazars whose SEDs can often be fitted satisfactorilywith pure SSC models Since the transition from HSP to ISP iscontinuous a pure SSC model was fitted first to the radio throughVHE gamma-ray SED Independently of the model underconsideration the low-frequency part of the SED (lt1020 Hz) iswell fitted with a synchrotron component as shown in Figure 6
9
The Astrophysical Journal 72643 (14pp) 2011 January 1 Abdo et al
Figure 6 Broadband SED of 3C 66A during the 2008 October multi-wavelength campaign The observation that corresponds to each set of data points is indicated inthe legend As an example the EBL-absorbed EC+SSC model for z = 03 is plotted here for reference A description of the model is provided in the text
For clarity only the high-frequency range is shown in Figures 7and 8 where the different models are compared As can beseen from the figures a reasonable agreement with the overallSED can be achieved for any redshift in the range exploredThe weighted sum of squared residuals has been calculatedfor the Fermi-LAT and VERITAS flare data (8 data points intotal) in order to quantify the scatter of the points with respectto the model and is shown in Table 4 The best agreement isachieved when the source is located at z sim 02ndash03 For lowerredshifts the model spectrum is systematically too hard whileat z = 0444 the model spectrum is invariably too soft as a resultof EBL absorption It should be noted that the EBL model ofFranceschini et al (2008) predicts some of the lowest opticaldepth values in comparison to other models (Finke et al 2010Gilmore et al 2009 Stecker et al 2006) Thus a model spectrumwith redshift of 03 or above would be even harder to reconcilewith the observations when using other EBL models
A major problem of the SSC models with z 01 is thatRB is of the order of 5 times 1016 cm This does not allowfor variability timescales shorter than 1 day which seemsto be in contrast with the optical variability observed on shortertimescales A smaller RB would require an increase in theelectron energy density (with no change in the magnetic fieldin order to preserve the flux level of the synchrotron peak) andwould lead to internal gammandashgamma absorption This problemcould be mitigated by choosing extremely high Doppler factorsD 100 However these are significantly larger than thevalues inferred from VLBI observations of Fermi-LAT blazars(Savolainen et al 2010)131 Moreover all SSC models requirevery low magnetic fields far below the value expected fromequipartition (εB = LBLe sim 10minus3 1) where LB is thePoynting flux derived from the magnetic energy density and Le
131 As a caveat jet models with a decelerating flow (Georganopoulos ampKazanas 2003 Piner et al 2008) or with inhomogeneous transverse structure(Ghisellini et al 2005 Henri amp Sauge 2006) can accommodate very highDoppler factors in the gamma-ray emitting region and still be consistent withthe VLBI observations of the large scale jet
is the energy flux of the electrons propagating along the jetTable 4 lists the parameters used for the SSC models displayedin Figure 7
Subsequently an external infrared radiation field with adhoc properties was included as a source of photons to beCompton scattered For all SSC+EC models shown in Figure 8the peak frequency of the external radiation field is set toνext = 14 times 1014 Hz corresponding to near-IR This adoptedvalue is high enough to produce E 100 GeV photons from ICscattering off the synchrotron electrons and at the same time isbelow the energy regime in which KleinndashNishina effects takeplace Although the weighted sums of squared residuals forEC+SSC models are generally worse than for pure SSC modelsreasonable agreement with the overall SED can still be achievedfor redshifts z 03 Furthermore all SSC+EC models areconsistent with a variability timescale of Δtvar sim 4 hr Thisis in better agreement with the observed variability at opticalwavelengths than the pure SSC interpretation Also while theSSC+EC interpretation still requires sub-equipartition magneticfields the magnetic fields are significantly closer to equipartitionthan in the pure SSC case with LBLe sim 01 The parametersof the SSC+EC models are listed in Table 5
Models with and without EC component yield the bestagreement with the SED if the source is located at a redshiftz sim 02ndash03 Of course this depends on the EBL model used inthe analysis An EBL model that predicts higher attenuation thanFranceschini et al (2008) would lead to a lower redshift rangeand make it even more difficult to have agreement betweenthe SED models and the data when the source is located atredshifts z 04 Finally it is worth mentioning that the redshiftrange z sim 02ndash03 is in agreement with previous estimates byFinke et al (2008) who estimate the redshift of 3C 66A to bez = 0321 based on the magnitude of the host galaxy and byPrandini et al (2010) who use an empirical relation betweenthe previously reported Fermi-LAT and IACTs spectral slopesof blazars and their redshifts to estimate the redshift of 3C 66Ato be below z = 034 plusmn 005
10
The Astrophysical Journal 72643 (14pp) 2011 January 1 Abdo et al
Figure 7 SSC models for redshifts z = 0444 03 02 and 01 from top to bottom The Fermi-LAT and VERITAS data points follow the same convention usedin Figures 1 and 6 to distinguish between flare (red) and dark run (blue) data points In each panel the EBL-absorbed model is shown as a solid red line and thede-absorbed model as a red dashed line De-absorbed VERITAS flare points are shown as open squares In all cases the optical depth values from Franceschini et al(2008) are used The best agreement between the model and the data is achieved when the source is located at z = 02ndash03 For lower redshifts the model spectrum issystematically too hard while at z = 0444 the model spectrum is too soft
A detailed study of hadronic versus leptonic modeling of the2008 October data will be published elsewhere but it is worthmentioning that the synchrotron proton blazar (SPB) model hasbeen used to adequately reproduce the quasi-simultaneous SEDobserved during the 2003ndash2004 multi-wavelength campaign(Reimer et al 2008) On that occasion rapid intra-day variationsdown to a 2 hr timescale were observed while during the2008 campaign presented here these variations seem less rapidQualitatively the longer timescale variations may be due toa lower Doppler beaming at the same time that a stronglyreprocessed proton synchrotron component dominates the highenergy output of this source
4 SUMMARY
Multi-wavelength observations of 3C 66A were carried outprompted by the gamma-ray outburst detected by the VERITASand Fermi observatories in 2008 October This marks the first
occasion that a gamma-ray flare is detected by GeV and TeVinstruments in comparable timescales The light curves obtainedshow strong variability at every observed wavelength and inparticular the flux increase observed by VERITAS and Fermiis coincident with an optical outburst The clear correlationbetween the Fermi-LAT and R optical light curves permits oneto go beyond the source association reported in the first Fermi-LAT source catalog (Abdo et al 2010a) and finally identify thegamma-ray source 1FGL J02226+4302 as blazar 3C 66A
For the modeling of the overall SED a reasonable agreementcan be achieved using both a pure SSC model and an SSC+ECmodel with an external near-infrared radiation field as anadditional source for Compton scattering However the pureSSC model requires (1) a large emission region which isinconsistent with the observed intra-night scale variability atoptical wavelengths and (2) low magnetic fields about afactor sim10minus3 below equipartition In contrast an SSC+ECinterpretation allows for variability on timescales of a few hours
11
The Astrophysical Journal 72643 (14pp) 2011 January 1 Abdo et al
Figure 8 EC+SSC model for redshifts z =0444 03 02 and 01 from top to bottom The individual EBL-absorbed EC and SSC components are indicated asdash-dotted and dotted lines respectively The sum is shown as a solid red line (dashed when de-absorbed) The best agreement between the model and the data isachieved when the source is located at z sim 02
Table 4Parameters Used for the SSC Models Displayed in Figure 7
Model Parameter z = 01 z = 02 z = 03 z = 0444
Low-energy cutoff γmin 18 times 104 20 times 104 22 times 104 25 times 104
High-energy cutoff γmax 30 times 105 40 times 105 40 times 105 50 times 105
Injection index q 29 29 30 30Injection luminosity Le (1045 erg sminus1) 13 33 57 128Comoving magnetic field B (G) 003 002 002 001Poynting flux LB (1042 erg sminus1) 11 49 85 137εB equiv LBLe 09 times 10minus3 15 times 10minus3 15 times 10minus3 11 times 10minus3
Doppler factor (D) 30 30 40 50Plasmoid radius RB (1016 cm) 22 60 70 11Variability timescale δtmin
var (hr) 74 221 211 294
Weighted sum of squared residuals to VERITAS flare data 71 09 07 62Weighted sum of squared residuals to Fermi-LAT flare data 16 16 13 14Total weighted sum of squared residuals 87 25 19 76
Notes All SSC models require very low magnetic fields far below the value expected from equipartition (ie εB 1) Theweighted sum of squared residuals to the VERITAS and Fermi-LAT data and the total value for the combined data set areincluded at the bottom of the table The best agreement between the model and the data is obtained when the source is at redshiftz = 02ndash03
12
The Astrophysical Journal 72643 (14pp) 2011 January 1 Abdo et al
Table 5Parameters Used for the EC+SSC Model Fits Displayed in Figure 8
Model Parameter z = 01 z = 02 z = 03 z = 0444
Low-energy cutoff γmin 55 times 103 70 times 103 65 times 103 60 times 103
High-energy cutoff γmax 12 times 105 1512 times 105 1512 times 105 1512 times 105
Injection index q 30 30 30 30Injection luminosity Le (1044 erg sminus1) 11 42 60 104Comoving magnetic field B (G) 035 022 021 023Poynting flux LB (1043 erg sminus1) 10 24 60 112εB equiv LBLe 010 006 010 011Doppler factor D 30 30 40 50Plasmoid radius RB (1016 cm) 05 12 15 15Variability timescale δtmin
var (hr) 17 44 45 40Ext radiation energy density (10minus6 erg cmminus3) 54 24 12 13
Weighted sum of squared residuals to VERITAS flare data 48 36 79 157Weighted sum of squared residuals to Fermi-LAT flare data 10 12 08 15Total weighted sum of squared residuals 58 48 87 172
Notes These model fits require magnetic fields closer to equipartition and allow for the intra-night variability observedin the optical data The weighted sum of squared residuals to the VERITAS and Fermi-LAT data and the total value forthe combined data set are included at the bottom of the table
and for magnetic fields within about an order of magnitudeof though still below equipartition It is worth noting that theresults presented here agree with the findings following the(E gt 200 GeV) flare of blazar W Comae (also an ISP) in 2008March (Acciari et al 2008a) In both cases the high opticalluminosity is expected to play a key role in providing the seedpopulation for IC scattering
Intermediate synchrotron peaked blazars like 3C 66A are wellsuited for simultaneous observations by Fermi-LAT and ground-based IACTs like VERITAS Relative to the sensitivities ofthese instruments ISPs are bright enough to allow for time-resolved spectral measurements in each band during flaringepisodes These types of observations coupled with extensivemulti-wavelength coverage at lower energies will continue toprovide key tests of blazar emission models
The Fermi-LAT Collaboration acknowledges generous ongo-ing support from a number of agencies and institutes that havesupported both the development and the operation of the LATas well as scientific data analysis These include the NationalAeronautics and Space Administration and the Department ofEnergy in the United States the Commissariat a lrsquoEnergie Atom-ique and the Centre National de la Recherche ScientifiqueInstitut National de Physique Nucleaire et de Physique desParticules in France the Agenzia Spaziale Italiana and theIstituto Nazionale di Fisica Nucleare in Italy the Ministry ofEducation Culture Sports Science and Technology (MEXT)High Energy Accelerator Research Organization (KEK) andJapan Aerospace Exploration Agency (JAXA) in Japan and theK A Wallenberg Foundation the Swedish Research Coun-cil and the Swedish National Space Board in Sweden Ad-ditional support for science analysis during the operationsphase is gratefully acknowledged from the Istituto Nazionale diAstrofisica in Italy and the Centre National drsquoEtudes Spatiales inFrance
The VERITAS collaboration acknowledges the generous sup-port from the US Department of Energy the US National Sci-ence Foundation and the Smithsonian Institution by NSERCin Canada by Science Foundation Ireland and by STFC inUK The VERITAS collaboration also acknowledges the excel-
lent work of the technical support staff at the FLWO and thecollaborating institutions in the construction and operation ofthe instrument as well as support from the NASASwift guestinvestigator program (grant NNX08AU13G) for the Swift ob-servations
PAIRITEL is operated by the Smithsonian AstrophysicalObservatory (SAO) and was made possible by a grant fromthe Harvard University Milton Fund a camera loan from theUniversity of Virginia and continued support of the SAO andUC Berkeley The PAIRITEL project is further supported byNASASwift Guest Investigator grant NNG06GH50G Thisresearch is partly based on observations with the 100 m telescopeof the MPIfR (Max-Planck-Institut fur Radioastronomie) atEffelsberg and has also made use of observations with the IRAM30 m telescope The Metsahovi team acknowledges the supportfrom the Academy of Finland The Abastumani Observatoryteam acknowledges financial support by the Georgian NationalScience Foundation through grant GNSFST084-404 The StPetersburg University team acknowledges support from RussianRFBR foundation via grant 09-02-00092 AZT-24 observationsare made within an agreement between Pulkovo Rome andTeramo observatories
L C Reyes acknowledges the support by the Kavli Institutefor Cosmological Physics at the University of Chicago throughgrants NSF PHY-0114422 and NSF PHY-0551142 and anendowment from the Kavli Foundation and its founder FredKavli M Bottcher acknowledges support from NASA throughChandra Guest Investigator Grant GO8-9100X Some of theVERITAS simulations used in this work have been performedon the joint Fermilab-KICP supercomputing cluster supportedby grants from Fermilab the Kavli Institute for CosmologicalPhysics and the University of Chicago
REFERENCES
Abdo A A et al 2009a Science 325 848Abdo A A et al 2009b ApJ 707 1310Abdo A A et al 2010a ApJS 188 405Abdo A A et al 2010b ApJ 710 1271Abdo A A et al 2010c ApJ 716 30Acciari V A et al 2008a ApJ 684 L73
13
The Astrophysical Journal 72643 (14pp) 2011 January 1 Abdo et al
Acciari V A et al 2008b ApJ 679 1427Acciari V A et al 2009 ApJ 693 L104Aliu E et al 2009 ApJ 692 L29Angelakis E Fuhrmann L Marchili N Krichbaum T P amp Zensus J A
2008 Mem Soc Astron Ital 79 1042Arnaud K A 1996 in ASP Conf Ser 101 Astronomical Data Analysis
Software and Systems V ed G H Jacoby amp J Barnes (San FranciscoCA ASP) 17
Atwood W B et al 2009 ApJ 697 1071Bennett A S 1962 Mem R Astron Soc 68 163Bloom J S Starr D L Blake C H Skrutskie M F amp Falco E E 2006
in ASP Conf Ser 351 Astronomical Data Analysis Software and SystemsXV ed C Gabriel C Arviset D Ponz amp S Enrique (San Francisco CAASP) 751
Bottcher M 2007 ApampSS 309 95Bottcher M amp Chiang J 2002 ApJ 581 127Bottcher M amp Dermer C D 2002 ApJ 564 86Bottcher M et al 2009 ApJ 694 174Bramel D A et al 2005 ApJ 629 108Britzen S et al 2007 AampA 472 763Britzen S et al 2008 AampA 484 119Cavaliere A amp DrsquoElia V 2002 ApJ 571 226Dermer C D amp Schlickeiser R 1993 ApJ 416 458Dickey J M amp Lockman F J 1990 ARAampA 28 215Edelson R A amp Krolik J H 1988 ApJ 333 646Finke J D Razzaque S amp Dermer C D 2010 ApJ 712 238Finke J D Shields J C Bottcher M amp Basu S 2008 AampA 477
513Fitzpatrick E L 1999 PASP 111 63Franceschini A Rodighiero G amp Vaccari M 2008 AampA 487 837Fuhrmann L Zensus J A Krichbaum T P Angelakis E amp Readhead A
C S 2007 in AIP Conf Proc 921 The First GLAST Symposium ed SRitz P Michelson amp C A Meegan (Melville NY AIP) 249
Fuhrmann L et al 2008 AampA 490 1019Gehrels N et al 2004 ApJ 611 1005Georganopoulos M amp Kazanas D 2003 ApJ 594 L27Georganopoulos M amp Kazanas D 2004 ApJ 604 L81Ghisellini G amp Madau P 1996 MNRAS 280 67Ghisellini G Tavecchio F amp Chiaberge M 2005 AampA 432 401Gilmore R C Madau P Primack J R Somerville R S amp Haardt F
2009 MNRAS 399 1694Hartman R C et al 1999 ApJS 123 79Henri G amp Sauge L 2006 ApJ 640 185Jorstad S G Marscher A P Mattox J R Wehrle A E Bloom S D amp
Yurchenko A V 2001 ApJS 134 181Joshi M amp Bottcher M 2007 ApJ 662 884
Kataoka J et al 1999 Astropart Phys 11 149Kerrick A D et al 1995 ApJ 452 588Kinney A L Bohlin R C Blades J C amp York D G 1991 ApJS 75
645Kuiper L Hermsen W Verbunt F Thompson D J Stairs I H Lyne A
G Strickman M S amp Cusumano G 2000 AampA 359 615Larionov V M et al 2008 ATel 1755 1Li T-P amp Ma Y-Q 1983 ApJ 272 317Mackay C D 1971 MNRAS 154 209Marscher A P Jorstad S G Mattox J R amp Wehrle A E 2002 ApJ 577
85Mattox J R et al 1996 ApJ 461 396Miller J S French H B amp Hawley S A 1978 Proc Pittsburgh Conf on
BL Lac Objects ed A M Wolfe 176Mucke A Protheroe R J Engel R Rachen J P amp Stanev T 2003
Astropart Phys 18 593Northover K J E 1973 MNRAS 165 369Oke J B et al 1995 PASP 107 375Piner B G Pant N amp Edwards P G 2008 ApJ 678 64Poole T S et al 2008 MNRAS 383 627Prandini E Bonnoli G Maraschi L Mariotti M amp Tavecchio F 2010
MNRAS 405 L76Reimer A Joshi M amp Bottcher M 2008 in AIP Conf Ser 1085 High
Energy Gamma-Ray Astronomy ed F A Aharonian W Hofmann amp FRieger (Melville NY AIP) 502
Savolainen T Homan D C Hovatta T Kadler M Kovalev Y Y ListerM L Ros E amp Zensus J A 2010 AampA 512 A24
Schlegel D J Finkbeiner D P amp Davis M 1998 ApJ 500 525Sikora M Begelman M C amp Rees M J 1994 ApJ 421 153Smith H E Smith E O amp Spinrad H 1976 PASP 88 621Stecker F W Malkan M A amp Scully S T 2006 ApJ 648 774 (erratum
658 1392 [2007])Swordy S 2008 ATel 1753 1Tavecchio F amp Ghisellini G 2009 MNRAS 394 L131Taylor G B Vermeulen R C Readhead A C S Pearson T J Henstock
D R amp Wilkinson P N 1996 ApJS 107 37Thompson D J et al 1993 ApJS 86 629Tosti G 2008 ATel 1759 1Urry C M amp Padovani P 1995 PASP 107 803Villata M et al 2008 AampA 481 L79Villata M et al 2009 AampA 504 L9Weekes T C 2000 in AIP Conf Ser 515 GeVndashTeV Gamma Ray Astrophysics
Workshop Towards a Major Atmospheric Cherenkov Detector VI ed B LDingus M H Salamon amp D B Kieda (Melville NY AIP) 3
Wills B J amp Wills D 1974 ApJ 190 L97Wurtz R Stocke J T amp Yee H K C 1996 ApJS 103 109
14
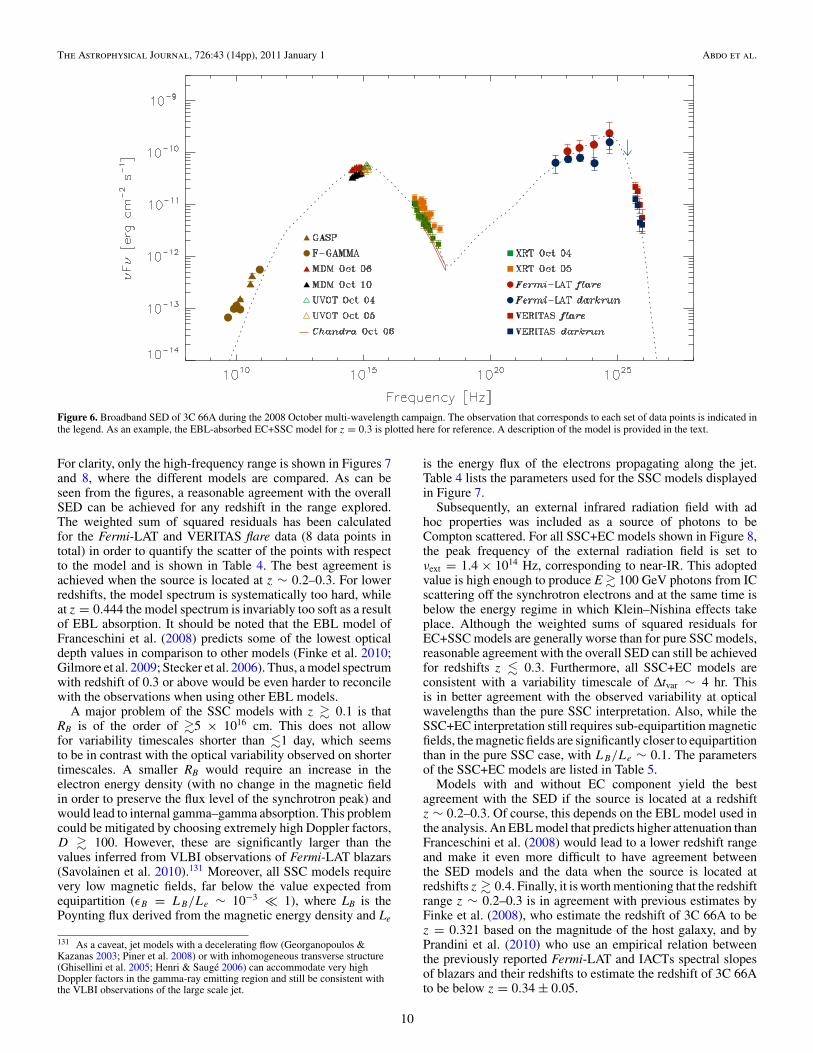
The Astrophysical Journal 72643 (14pp) 2011 January 1 Abdo et al
Figure 6 Broadband SED of 3C 66A during the 2008 October multi-wavelength campaign The observation that corresponds to each set of data points is indicated inthe legend As an example the EBL-absorbed EC+SSC model for z = 03 is plotted here for reference A description of the model is provided in the text
For clarity only the high-frequency range is shown in Figures 7and 8 where the different models are compared As can beseen from the figures a reasonable agreement with the overallSED can be achieved for any redshift in the range exploredThe weighted sum of squared residuals has been calculatedfor the Fermi-LAT and VERITAS flare data (8 data points intotal) in order to quantify the scatter of the points with respectto the model and is shown in Table 4 The best agreement isachieved when the source is located at z sim 02ndash03 For lowerredshifts the model spectrum is systematically too hard whileat z = 0444 the model spectrum is invariably too soft as a resultof EBL absorption It should be noted that the EBL model ofFranceschini et al (2008) predicts some of the lowest opticaldepth values in comparison to other models (Finke et al 2010Gilmore et al 2009 Stecker et al 2006) Thus a model spectrumwith redshift of 03 or above would be even harder to reconcilewith the observations when using other EBL models
A major problem of the SSC models with z 01 is thatRB is of the order of 5 times 1016 cm This does not allowfor variability timescales shorter than 1 day which seemsto be in contrast with the optical variability observed on shortertimescales A smaller RB would require an increase in theelectron energy density (with no change in the magnetic fieldin order to preserve the flux level of the synchrotron peak) andwould lead to internal gammandashgamma absorption This problemcould be mitigated by choosing extremely high Doppler factorsD 100 However these are significantly larger than thevalues inferred from VLBI observations of Fermi-LAT blazars(Savolainen et al 2010)131 Moreover all SSC models requirevery low magnetic fields far below the value expected fromequipartition (εB = LBLe sim 10minus3 1) where LB is thePoynting flux derived from the magnetic energy density and Le
131 As a caveat jet models with a decelerating flow (Georganopoulos ampKazanas 2003 Piner et al 2008) or with inhomogeneous transverse structure(Ghisellini et al 2005 Henri amp Sauge 2006) can accommodate very highDoppler factors in the gamma-ray emitting region and still be consistent withthe VLBI observations of the large scale jet
is the energy flux of the electrons propagating along the jetTable 4 lists the parameters used for the SSC models displayedin Figure 7
Subsequently an external infrared radiation field with adhoc properties was included as a source of photons to beCompton scattered For all SSC+EC models shown in Figure 8the peak frequency of the external radiation field is set toνext = 14 times 1014 Hz corresponding to near-IR This adoptedvalue is high enough to produce E 100 GeV photons from ICscattering off the synchrotron electrons and at the same time isbelow the energy regime in which KleinndashNishina effects takeplace Although the weighted sums of squared residuals forEC+SSC models are generally worse than for pure SSC modelsreasonable agreement with the overall SED can still be achievedfor redshifts z 03 Furthermore all SSC+EC models areconsistent with a variability timescale of Δtvar sim 4 hr Thisis in better agreement with the observed variability at opticalwavelengths than the pure SSC interpretation Also while theSSC+EC interpretation still requires sub-equipartition magneticfields the magnetic fields are significantly closer to equipartitionthan in the pure SSC case with LBLe sim 01 The parametersof the SSC+EC models are listed in Table 5
Models with and without EC component yield the bestagreement with the SED if the source is located at a redshiftz sim 02ndash03 Of course this depends on the EBL model used inthe analysis An EBL model that predicts higher attenuation thanFranceschini et al (2008) would lead to a lower redshift rangeand make it even more difficult to have agreement betweenthe SED models and the data when the source is located atredshifts z 04 Finally it is worth mentioning that the redshiftrange z sim 02ndash03 is in agreement with previous estimates byFinke et al (2008) who estimate the redshift of 3C 66A to bez = 0321 based on the magnitude of the host galaxy and byPrandini et al (2010) who use an empirical relation betweenthe previously reported Fermi-LAT and IACTs spectral slopesof blazars and their redshifts to estimate the redshift of 3C 66Ato be below z = 034 plusmn 005
10
The Astrophysical Journal 72643 (14pp) 2011 January 1 Abdo et al
Figure 7 SSC models for redshifts z = 0444 03 02 and 01 from top to bottom The Fermi-LAT and VERITAS data points follow the same convention usedin Figures 1 and 6 to distinguish between flare (red) and dark run (blue) data points In each panel the EBL-absorbed model is shown as a solid red line and thede-absorbed model as a red dashed line De-absorbed VERITAS flare points are shown as open squares In all cases the optical depth values from Franceschini et al(2008) are used The best agreement between the model and the data is achieved when the source is located at z = 02ndash03 For lower redshifts the model spectrum issystematically too hard while at z = 0444 the model spectrum is too soft
A detailed study of hadronic versus leptonic modeling of the2008 October data will be published elsewhere but it is worthmentioning that the synchrotron proton blazar (SPB) model hasbeen used to adequately reproduce the quasi-simultaneous SEDobserved during the 2003ndash2004 multi-wavelength campaign(Reimer et al 2008) On that occasion rapid intra-day variationsdown to a 2 hr timescale were observed while during the2008 campaign presented here these variations seem less rapidQualitatively the longer timescale variations may be due toa lower Doppler beaming at the same time that a stronglyreprocessed proton synchrotron component dominates the highenergy output of this source
4 SUMMARY
Multi-wavelength observations of 3C 66A were carried outprompted by the gamma-ray outburst detected by the VERITASand Fermi observatories in 2008 October This marks the first
occasion that a gamma-ray flare is detected by GeV and TeVinstruments in comparable timescales The light curves obtainedshow strong variability at every observed wavelength and inparticular the flux increase observed by VERITAS and Fermiis coincident with an optical outburst The clear correlationbetween the Fermi-LAT and R optical light curves permits oneto go beyond the source association reported in the first Fermi-LAT source catalog (Abdo et al 2010a) and finally identify thegamma-ray source 1FGL J02226+4302 as blazar 3C 66A
For the modeling of the overall SED a reasonable agreementcan be achieved using both a pure SSC model and an SSC+ECmodel with an external near-infrared radiation field as anadditional source for Compton scattering However the pureSSC model requires (1) a large emission region which isinconsistent with the observed intra-night scale variability atoptical wavelengths and (2) low magnetic fields about afactor sim10minus3 below equipartition In contrast an SSC+ECinterpretation allows for variability on timescales of a few hours
11
The Astrophysical Journal 72643 (14pp) 2011 January 1 Abdo et al
Figure 8 EC+SSC model for redshifts z =0444 03 02 and 01 from top to bottom The individual EBL-absorbed EC and SSC components are indicated asdash-dotted and dotted lines respectively The sum is shown as a solid red line (dashed when de-absorbed) The best agreement between the model and the data isachieved when the source is located at z sim 02
Table 4Parameters Used for the SSC Models Displayed in Figure 7
Model Parameter z = 01 z = 02 z = 03 z = 0444
Low-energy cutoff γmin 18 times 104 20 times 104 22 times 104 25 times 104
High-energy cutoff γmax 30 times 105 40 times 105 40 times 105 50 times 105
Injection index q 29 29 30 30Injection luminosity Le (1045 erg sminus1) 13 33 57 128Comoving magnetic field B (G) 003 002 002 001Poynting flux LB (1042 erg sminus1) 11 49 85 137εB equiv LBLe 09 times 10minus3 15 times 10minus3 15 times 10minus3 11 times 10minus3
Doppler factor (D) 30 30 40 50Plasmoid radius RB (1016 cm) 22 60 70 11Variability timescale δtmin
var (hr) 74 221 211 294
Weighted sum of squared residuals to VERITAS flare data 71 09 07 62Weighted sum of squared residuals to Fermi-LAT flare data 16 16 13 14Total weighted sum of squared residuals 87 25 19 76
Notes All SSC models require very low magnetic fields far below the value expected from equipartition (ie εB 1) Theweighted sum of squared residuals to the VERITAS and Fermi-LAT data and the total value for the combined data set areincluded at the bottom of the table The best agreement between the model and the data is obtained when the source is at redshiftz = 02ndash03
12
The Astrophysical Journal 72643 (14pp) 2011 January 1 Abdo et al
Table 5Parameters Used for the EC+SSC Model Fits Displayed in Figure 8
Model Parameter z = 01 z = 02 z = 03 z = 0444
Low-energy cutoff γmin 55 times 103 70 times 103 65 times 103 60 times 103
High-energy cutoff γmax 12 times 105 1512 times 105 1512 times 105 1512 times 105
Injection index q 30 30 30 30Injection luminosity Le (1044 erg sminus1) 11 42 60 104Comoving magnetic field B (G) 035 022 021 023Poynting flux LB (1043 erg sminus1) 10 24 60 112εB equiv LBLe 010 006 010 011Doppler factor D 30 30 40 50Plasmoid radius RB (1016 cm) 05 12 15 15Variability timescale δtmin
var (hr) 17 44 45 40Ext radiation energy density (10minus6 erg cmminus3) 54 24 12 13
Weighted sum of squared residuals to VERITAS flare data 48 36 79 157Weighted sum of squared residuals to Fermi-LAT flare data 10 12 08 15Total weighted sum of squared residuals 58 48 87 172
Notes These model fits require magnetic fields closer to equipartition and allow for the intra-night variability observedin the optical data The weighted sum of squared residuals to the VERITAS and Fermi-LAT data and the total value forthe combined data set are included at the bottom of the table
and for magnetic fields within about an order of magnitudeof though still below equipartition It is worth noting that theresults presented here agree with the findings following the(E gt 200 GeV) flare of blazar W Comae (also an ISP) in 2008March (Acciari et al 2008a) In both cases the high opticalluminosity is expected to play a key role in providing the seedpopulation for IC scattering
Intermediate synchrotron peaked blazars like 3C 66A are wellsuited for simultaneous observations by Fermi-LAT and ground-based IACTs like VERITAS Relative to the sensitivities ofthese instruments ISPs are bright enough to allow for time-resolved spectral measurements in each band during flaringepisodes These types of observations coupled with extensivemulti-wavelength coverage at lower energies will continue toprovide key tests of blazar emission models
The Fermi-LAT Collaboration acknowledges generous ongo-ing support from a number of agencies and institutes that havesupported both the development and the operation of the LATas well as scientific data analysis These include the NationalAeronautics and Space Administration and the Department ofEnergy in the United States the Commissariat a lrsquoEnergie Atom-ique and the Centre National de la Recherche ScientifiqueInstitut National de Physique Nucleaire et de Physique desParticules in France the Agenzia Spaziale Italiana and theIstituto Nazionale di Fisica Nucleare in Italy the Ministry ofEducation Culture Sports Science and Technology (MEXT)High Energy Accelerator Research Organization (KEK) andJapan Aerospace Exploration Agency (JAXA) in Japan and theK A Wallenberg Foundation the Swedish Research Coun-cil and the Swedish National Space Board in Sweden Ad-ditional support for science analysis during the operationsphase is gratefully acknowledged from the Istituto Nazionale diAstrofisica in Italy and the Centre National drsquoEtudes Spatiales inFrance
The VERITAS collaboration acknowledges the generous sup-port from the US Department of Energy the US National Sci-ence Foundation and the Smithsonian Institution by NSERCin Canada by Science Foundation Ireland and by STFC inUK The VERITAS collaboration also acknowledges the excel-
lent work of the technical support staff at the FLWO and thecollaborating institutions in the construction and operation ofthe instrument as well as support from the NASASwift guestinvestigator program (grant NNX08AU13G) for the Swift ob-servations
PAIRITEL is operated by the Smithsonian AstrophysicalObservatory (SAO) and was made possible by a grant fromthe Harvard University Milton Fund a camera loan from theUniversity of Virginia and continued support of the SAO andUC Berkeley The PAIRITEL project is further supported byNASASwift Guest Investigator grant NNG06GH50G Thisresearch is partly based on observations with the 100 m telescopeof the MPIfR (Max-Planck-Institut fur Radioastronomie) atEffelsberg and has also made use of observations with the IRAM30 m telescope The Metsahovi team acknowledges the supportfrom the Academy of Finland The Abastumani Observatoryteam acknowledges financial support by the Georgian NationalScience Foundation through grant GNSFST084-404 The StPetersburg University team acknowledges support from RussianRFBR foundation via grant 09-02-00092 AZT-24 observationsare made within an agreement between Pulkovo Rome andTeramo observatories
L C Reyes acknowledges the support by the Kavli Institutefor Cosmological Physics at the University of Chicago throughgrants NSF PHY-0114422 and NSF PHY-0551142 and anendowment from the Kavli Foundation and its founder FredKavli M Bottcher acknowledges support from NASA throughChandra Guest Investigator Grant GO8-9100X Some of theVERITAS simulations used in this work have been performedon the joint Fermilab-KICP supercomputing cluster supportedby grants from Fermilab the Kavli Institute for CosmologicalPhysics and the University of Chicago
REFERENCES
Abdo A A et al 2009a Science 325 848Abdo A A et al 2009b ApJ 707 1310Abdo A A et al 2010a ApJS 188 405Abdo A A et al 2010b ApJ 710 1271Abdo A A et al 2010c ApJ 716 30Acciari V A et al 2008a ApJ 684 L73
13
The Astrophysical Journal 72643 (14pp) 2011 January 1 Abdo et al
Acciari V A et al 2008b ApJ 679 1427Acciari V A et al 2009 ApJ 693 L104Aliu E et al 2009 ApJ 692 L29Angelakis E Fuhrmann L Marchili N Krichbaum T P amp Zensus J A
2008 Mem Soc Astron Ital 79 1042Arnaud K A 1996 in ASP Conf Ser 101 Astronomical Data Analysis
Software and Systems V ed G H Jacoby amp J Barnes (San FranciscoCA ASP) 17
Atwood W B et al 2009 ApJ 697 1071Bennett A S 1962 Mem R Astron Soc 68 163Bloom J S Starr D L Blake C H Skrutskie M F amp Falco E E 2006
in ASP Conf Ser 351 Astronomical Data Analysis Software and SystemsXV ed C Gabriel C Arviset D Ponz amp S Enrique (San Francisco CAASP) 751
Bottcher M 2007 ApampSS 309 95Bottcher M amp Chiang J 2002 ApJ 581 127Bottcher M amp Dermer C D 2002 ApJ 564 86Bottcher M et al 2009 ApJ 694 174Bramel D A et al 2005 ApJ 629 108Britzen S et al 2007 AampA 472 763Britzen S et al 2008 AampA 484 119Cavaliere A amp DrsquoElia V 2002 ApJ 571 226Dermer C D amp Schlickeiser R 1993 ApJ 416 458Dickey J M amp Lockman F J 1990 ARAampA 28 215Edelson R A amp Krolik J H 1988 ApJ 333 646Finke J D Razzaque S amp Dermer C D 2010 ApJ 712 238Finke J D Shields J C Bottcher M amp Basu S 2008 AampA 477
513Fitzpatrick E L 1999 PASP 111 63Franceschini A Rodighiero G amp Vaccari M 2008 AampA 487 837Fuhrmann L Zensus J A Krichbaum T P Angelakis E amp Readhead A
C S 2007 in AIP Conf Proc 921 The First GLAST Symposium ed SRitz P Michelson amp C A Meegan (Melville NY AIP) 249
Fuhrmann L et al 2008 AampA 490 1019Gehrels N et al 2004 ApJ 611 1005Georganopoulos M amp Kazanas D 2003 ApJ 594 L27Georganopoulos M amp Kazanas D 2004 ApJ 604 L81Ghisellini G amp Madau P 1996 MNRAS 280 67Ghisellini G Tavecchio F amp Chiaberge M 2005 AampA 432 401Gilmore R C Madau P Primack J R Somerville R S amp Haardt F
2009 MNRAS 399 1694Hartman R C et al 1999 ApJS 123 79Henri G amp Sauge L 2006 ApJ 640 185Jorstad S G Marscher A P Mattox J R Wehrle A E Bloom S D amp
Yurchenko A V 2001 ApJS 134 181Joshi M amp Bottcher M 2007 ApJ 662 884
Kataoka J et al 1999 Astropart Phys 11 149Kerrick A D et al 1995 ApJ 452 588Kinney A L Bohlin R C Blades J C amp York D G 1991 ApJS 75
645Kuiper L Hermsen W Verbunt F Thompson D J Stairs I H Lyne A
G Strickman M S amp Cusumano G 2000 AampA 359 615Larionov V M et al 2008 ATel 1755 1Li T-P amp Ma Y-Q 1983 ApJ 272 317Mackay C D 1971 MNRAS 154 209Marscher A P Jorstad S G Mattox J R amp Wehrle A E 2002 ApJ 577
85Mattox J R et al 1996 ApJ 461 396Miller J S French H B amp Hawley S A 1978 Proc Pittsburgh Conf on
BL Lac Objects ed A M Wolfe 176Mucke A Protheroe R J Engel R Rachen J P amp Stanev T 2003
Astropart Phys 18 593Northover K J E 1973 MNRAS 165 369Oke J B et al 1995 PASP 107 375Piner B G Pant N amp Edwards P G 2008 ApJ 678 64Poole T S et al 2008 MNRAS 383 627Prandini E Bonnoli G Maraschi L Mariotti M amp Tavecchio F 2010
MNRAS 405 L76Reimer A Joshi M amp Bottcher M 2008 in AIP Conf Ser 1085 High
Energy Gamma-Ray Astronomy ed F A Aharonian W Hofmann amp FRieger (Melville NY AIP) 502
Savolainen T Homan D C Hovatta T Kadler M Kovalev Y Y ListerM L Ros E amp Zensus J A 2010 AampA 512 A24
Schlegel D J Finkbeiner D P amp Davis M 1998 ApJ 500 525Sikora M Begelman M C amp Rees M J 1994 ApJ 421 153Smith H E Smith E O amp Spinrad H 1976 PASP 88 621Stecker F W Malkan M A amp Scully S T 2006 ApJ 648 774 (erratum
658 1392 [2007])Swordy S 2008 ATel 1753 1Tavecchio F amp Ghisellini G 2009 MNRAS 394 L131Taylor G B Vermeulen R C Readhead A C S Pearson T J Henstock
D R amp Wilkinson P N 1996 ApJS 107 37Thompson D J et al 1993 ApJS 86 629Tosti G 2008 ATel 1759 1Urry C M amp Padovani P 1995 PASP 107 803Villata M et al 2008 AampA 481 L79Villata M et al 2009 AampA 504 L9Weekes T C 2000 in AIP Conf Ser 515 GeVndashTeV Gamma Ray Astrophysics
Workshop Towards a Major Atmospheric Cherenkov Detector VI ed B LDingus M H Salamon amp D B Kieda (Melville NY AIP) 3
Wills B J amp Wills D 1974 ApJ 190 L97Wurtz R Stocke J T amp Yee H K C 1996 ApJS 103 109
14
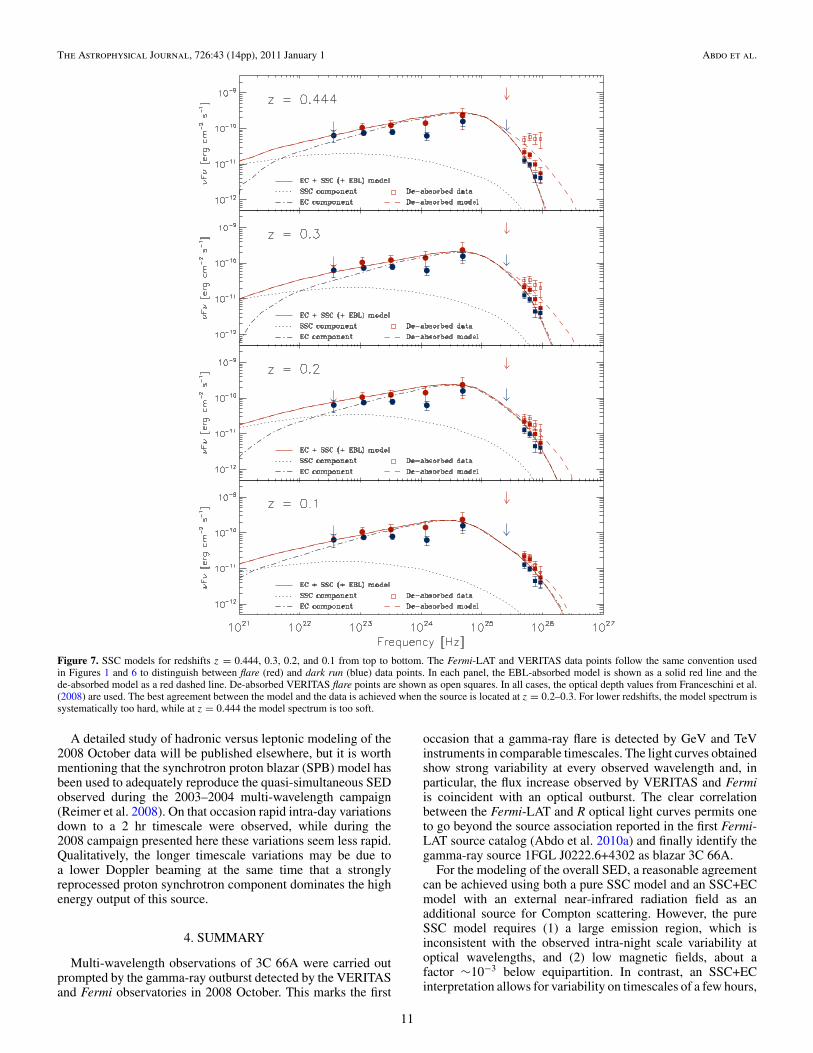
The Astrophysical Journal 72643 (14pp) 2011 January 1 Abdo et al
Figure 8 EC+SSC model for redshifts z =0444 03 02 and 01 from top to bottom The individual EBL-absorbed EC and SSC components are indicated asdash-dotted and dotted lines respectively The sum is shown as a solid red line (dashed when de-absorbed) The best agreement between the model and the data isachieved when the source is located at z sim 02
Table 4Parameters Used for the SSC Models Displayed in Figure 7
Model Parameter z = 01 z = 02 z = 03 z = 0444
Low-energy cutoff γmin 18 times 104 20 times 104 22 times 104 25 times 104
High-energy cutoff γmax 30 times 105 40 times 105 40 times 105 50 times 105
Injection index q 29 29 30 30Injection luminosity Le (1045 erg sminus1) 13 33 57 128Comoving magnetic field B (G) 003 002 002 001Poynting flux LB (1042 erg sminus1) 11 49 85 137εB equiv LBLe 09 times 10minus3 15 times 10minus3 15 times 10minus3 11 times 10minus3
Doppler factor (D) 30 30 40 50Plasmoid radius RB (1016 cm) 22 60 70 11Variability timescale δtmin
var (hr) 74 221 211 294
Weighted sum of squared residuals to VERITAS flare data 71 09 07 62Weighted sum of squared residuals to Fermi-LAT flare data 16 16 13 14Total weighted sum of squared residuals 87 25 19 76
Notes All SSC models require very low magnetic fields far below the value expected from equipartition (ie εB 1) Theweighted sum of squared residuals to the VERITAS and Fermi-LAT data and the total value for the combined data set areincluded at the bottom of the table The best agreement between the model and the data is obtained when the source is at redshiftz = 02ndash03
12
The Astrophysical Journal 72643 (14pp) 2011 January 1 Abdo et al
Table 5Parameters Used for the EC+SSC Model Fits Displayed in Figure 8
Model Parameter z = 01 z = 02 z = 03 z = 0444
Low-energy cutoff γmin 55 times 103 70 times 103 65 times 103 60 times 103
High-energy cutoff γmax 12 times 105 1512 times 105 1512 times 105 1512 times 105
Injection index q 30 30 30 30Injection luminosity Le (1044 erg sminus1) 11 42 60 104Comoving magnetic field B (G) 035 022 021 023Poynting flux LB (1043 erg sminus1) 10 24 60 112εB equiv LBLe 010 006 010 011Doppler factor D 30 30 40 50Plasmoid radius RB (1016 cm) 05 12 15 15Variability timescale δtmin
var (hr) 17 44 45 40Ext radiation energy density (10minus6 erg cmminus3) 54 24 12 13
Weighted sum of squared residuals to VERITAS flare data 48 36 79 157Weighted sum of squared residuals to Fermi-LAT flare data 10 12 08 15Total weighted sum of squared residuals 58 48 87 172
Notes These model fits require magnetic fields closer to equipartition and allow for the intra-night variability observedin the optical data The weighted sum of squared residuals to the VERITAS and Fermi-LAT data and the total value forthe combined data set are included at the bottom of the table
and for magnetic fields within about an order of magnitudeof though still below equipartition It is worth noting that theresults presented here agree with the findings following the(E gt 200 GeV) flare of blazar W Comae (also an ISP) in 2008March (Acciari et al 2008a) In both cases the high opticalluminosity is expected to play a key role in providing the seedpopulation for IC scattering
Intermediate synchrotron peaked blazars like 3C 66A are wellsuited for simultaneous observations by Fermi-LAT and ground-based IACTs like VERITAS Relative to the sensitivities ofthese instruments ISPs are bright enough to allow for time-resolved spectral measurements in each band during flaringepisodes These types of observations coupled with extensivemulti-wavelength coverage at lower energies will continue toprovide key tests of blazar emission models
The Fermi-LAT Collaboration acknowledges generous ongo-ing support from a number of agencies and institutes that havesupported both the development and the operation of the LATas well as scientific data analysis These include the NationalAeronautics and Space Administration and the Department ofEnergy in the United States the Commissariat a lrsquoEnergie Atom-ique and the Centre National de la Recherche ScientifiqueInstitut National de Physique Nucleaire et de Physique desParticules in France the Agenzia Spaziale Italiana and theIstituto Nazionale di Fisica Nucleare in Italy the Ministry ofEducation Culture Sports Science and Technology (MEXT)High Energy Accelerator Research Organization (KEK) andJapan Aerospace Exploration Agency (JAXA) in Japan and theK A Wallenberg Foundation the Swedish Research Coun-cil and the Swedish National Space Board in Sweden Ad-ditional support for science analysis during the operationsphase is gratefully acknowledged from the Istituto Nazionale diAstrofisica in Italy and the Centre National drsquoEtudes Spatiales inFrance
The VERITAS collaboration acknowledges the generous sup-port from the US Department of Energy the US National Sci-ence Foundation and the Smithsonian Institution by NSERCin Canada by Science Foundation Ireland and by STFC inUK The VERITAS collaboration also acknowledges the excel-
lent work of the technical support staff at the FLWO and thecollaborating institutions in the construction and operation ofthe instrument as well as support from the NASASwift guestinvestigator program (grant NNX08AU13G) for the Swift ob-servations
PAIRITEL is operated by the Smithsonian AstrophysicalObservatory (SAO) and was made possible by a grant fromthe Harvard University Milton Fund a camera loan from theUniversity of Virginia and continued support of the SAO andUC Berkeley The PAIRITEL project is further supported byNASASwift Guest Investigator grant NNG06GH50G Thisresearch is partly based on observations with the 100 m telescopeof the MPIfR (Max-Planck-Institut fur Radioastronomie) atEffelsberg and has also made use of observations with the IRAM30 m telescope The Metsahovi team acknowledges the supportfrom the Academy of Finland The Abastumani Observatoryteam acknowledges financial support by the Georgian NationalScience Foundation through grant GNSFST084-404 The StPetersburg University team acknowledges support from RussianRFBR foundation via grant 09-02-00092 AZT-24 observationsare made within an agreement between Pulkovo Rome andTeramo observatories
L C Reyes acknowledges the support by the Kavli Institutefor Cosmological Physics at the University of Chicago throughgrants NSF PHY-0114422 and NSF PHY-0551142 and anendowment from the Kavli Foundation and its founder FredKavli M Bottcher acknowledges support from NASA throughChandra Guest Investigator Grant GO8-9100X Some of theVERITAS simulations used in this work have been performedon the joint Fermilab-KICP supercomputing cluster supportedby grants from Fermilab the Kavli Institute for CosmologicalPhysics and the University of Chicago
REFERENCES
Abdo A A et al 2009a Science 325 848Abdo A A et al 2009b ApJ 707 1310Abdo A A et al 2010a ApJS 188 405Abdo A A et al 2010b ApJ 710 1271Abdo A A et al 2010c ApJ 716 30Acciari V A et al 2008a ApJ 684 L73
13
The Astrophysical Journal 72643 (14pp) 2011 January 1 Abdo et al
Acciari V A et al 2008b ApJ 679 1427Acciari V A et al 2009 ApJ 693 L104Aliu E et al 2009 ApJ 692 L29Angelakis E Fuhrmann L Marchili N Krichbaum T P amp Zensus J A
2008 Mem Soc Astron Ital 79 1042Arnaud K A 1996 in ASP Conf Ser 101 Astronomical Data Analysis
Software and Systems V ed G H Jacoby amp J Barnes (San FranciscoCA ASP) 17
Atwood W B et al 2009 ApJ 697 1071Bennett A S 1962 Mem R Astron Soc 68 163Bloom J S Starr D L Blake C H Skrutskie M F amp Falco E E 2006
in ASP Conf Ser 351 Astronomical Data Analysis Software and SystemsXV ed C Gabriel C Arviset D Ponz amp S Enrique (San Francisco CAASP) 751
Bottcher M 2007 ApampSS 309 95Bottcher M amp Chiang J 2002 ApJ 581 127Bottcher M amp Dermer C D 2002 ApJ 564 86Bottcher M et al 2009 ApJ 694 174Bramel D A et al 2005 ApJ 629 108Britzen S et al 2007 AampA 472 763Britzen S et al 2008 AampA 484 119Cavaliere A amp DrsquoElia V 2002 ApJ 571 226Dermer C D amp Schlickeiser R 1993 ApJ 416 458Dickey J M amp Lockman F J 1990 ARAampA 28 215Edelson R A amp Krolik J H 1988 ApJ 333 646Finke J D Razzaque S amp Dermer C D 2010 ApJ 712 238Finke J D Shields J C Bottcher M amp Basu S 2008 AampA 477
513Fitzpatrick E L 1999 PASP 111 63Franceschini A Rodighiero G amp Vaccari M 2008 AampA 487 837Fuhrmann L Zensus J A Krichbaum T P Angelakis E amp Readhead A
C S 2007 in AIP Conf Proc 921 The First GLAST Symposium ed SRitz P Michelson amp C A Meegan (Melville NY AIP) 249
Fuhrmann L et al 2008 AampA 490 1019Gehrels N et al 2004 ApJ 611 1005Georganopoulos M amp Kazanas D 2003 ApJ 594 L27Georganopoulos M amp Kazanas D 2004 ApJ 604 L81Ghisellini G amp Madau P 1996 MNRAS 280 67Ghisellini G Tavecchio F amp Chiaberge M 2005 AampA 432 401Gilmore R C Madau P Primack J R Somerville R S amp Haardt F
2009 MNRAS 399 1694Hartman R C et al 1999 ApJS 123 79Henri G amp Sauge L 2006 ApJ 640 185Jorstad S G Marscher A P Mattox J R Wehrle A E Bloom S D amp
Yurchenko A V 2001 ApJS 134 181Joshi M amp Bottcher M 2007 ApJ 662 884
Kataoka J et al 1999 Astropart Phys 11 149Kerrick A D et al 1995 ApJ 452 588Kinney A L Bohlin R C Blades J C amp York D G 1991 ApJS 75
645Kuiper L Hermsen W Verbunt F Thompson D J Stairs I H Lyne A
G Strickman M S amp Cusumano G 2000 AampA 359 615Larionov V M et al 2008 ATel 1755 1Li T-P amp Ma Y-Q 1983 ApJ 272 317Mackay C D 1971 MNRAS 154 209Marscher A P Jorstad S G Mattox J R amp Wehrle A E 2002 ApJ 577
85Mattox J R et al 1996 ApJ 461 396Miller J S French H B amp Hawley S A 1978 Proc Pittsburgh Conf on
BL Lac Objects ed A M Wolfe 176Mucke A Protheroe R J Engel R Rachen J P amp Stanev T 2003
Astropart Phys 18 593Northover K J E 1973 MNRAS 165 369Oke J B et al 1995 PASP 107 375Piner B G Pant N amp Edwards P G 2008 ApJ 678 64Poole T S et al 2008 MNRAS 383 627Prandini E Bonnoli G Maraschi L Mariotti M amp Tavecchio F 2010
MNRAS 405 L76Reimer A Joshi M amp Bottcher M 2008 in AIP Conf Ser 1085 High
Energy Gamma-Ray Astronomy ed F A Aharonian W Hofmann amp FRieger (Melville NY AIP) 502
Savolainen T Homan D C Hovatta T Kadler M Kovalev Y Y ListerM L Ros E amp Zensus J A 2010 AampA 512 A24
Schlegel D J Finkbeiner D P amp Davis M 1998 ApJ 500 525Sikora M Begelman M C amp Rees M J 1994 ApJ 421 153Smith H E Smith E O amp Spinrad H 1976 PASP 88 621Stecker F W Malkan M A amp Scully S T 2006 ApJ 648 774 (erratum
658 1392 [2007])Swordy S 2008 ATel 1753 1Tavecchio F amp Ghisellini G 2009 MNRAS 394 L131Taylor G B Vermeulen R C Readhead A C S Pearson T J Henstock
D R amp Wilkinson P N 1996 ApJS 107 37Thompson D J et al 1993 ApJS 86 629Tosti G 2008 ATel 1759 1Urry C M amp Padovani P 1995 PASP 107 803Villata M et al 2008 AampA 481 L79Villata M et al 2009 AampA 504 L9Weekes T C 2000 in AIP Conf Ser 515 GeVndashTeV Gamma Ray Astrophysics
Workshop Towards a Major Atmospheric Cherenkov Detector VI ed B LDingus M H Salamon amp D B Kieda (Melville NY AIP) 3
Wills B J amp Wills D 1974 ApJ 190 L97Wurtz R Stocke J T amp Yee H K C 1996 ApJS 103 109
14
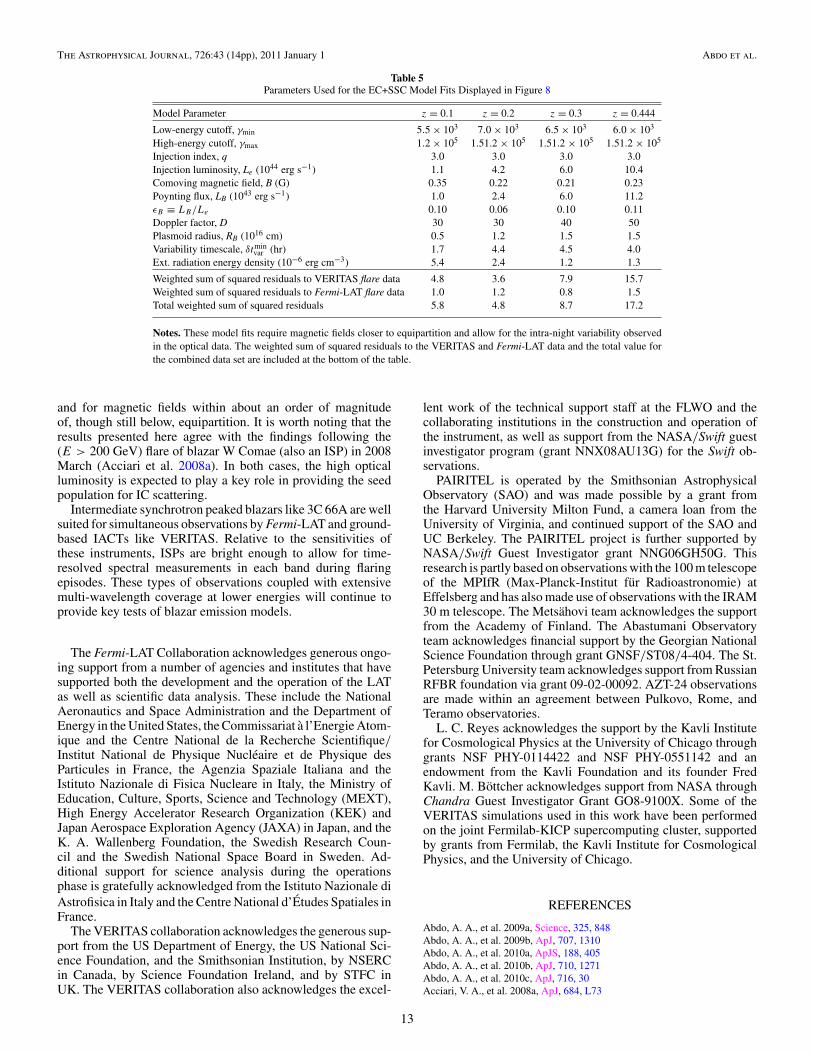
The Astrophysical Journal 72643 (14pp) 2011 January 1 Abdo et al
Table 5Parameters Used for the EC+SSC Model Fits Displayed in Figure 8
Model Parameter z = 01 z = 02 z = 03 z = 0444
Low-energy cutoff γmin 55 times 103 70 times 103 65 times 103 60 times 103
High-energy cutoff γmax 12 times 105 1512 times 105 1512 times 105 1512 times 105
Injection index q 30 30 30 30Injection luminosity Le (1044 erg sminus1) 11 42 60 104Comoving magnetic field B (G) 035 022 021 023Poynting flux LB (1043 erg sminus1) 10 24 60 112εB equiv LBLe 010 006 010 011Doppler factor D 30 30 40 50Plasmoid radius RB (1016 cm) 05 12 15 15Variability timescale δtmin
var (hr) 17 44 45 40Ext radiation energy density (10minus6 erg cmminus3) 54 24 12 13
Weighted sum of squared residuals to VERITAS flare data 48 36 79 157Weighted sum of squared residuals to Fermi-LAT flare data 10 12 08 15Total weighted sum of squared residuals 58 48 87 172
Notes These model fits require magnetic fields closer to equipartition and allow for the intra-night variability observedin the optical data The weighted sum of squared residuals to the VERITAS and Fermi-LAT data and the total value forthe combined data set are included at the bottom of the table
and for magnetic fields within about an order of magnitudeof though still below equipartition It is worth noting that theresults presented here agree with the findings following the(E gt 200 GeV) flare of blazar W Comae (also an ISP) in 2008March (Acciari et al 2008a) In both cases the high opticalluminosity is expected to play a key role in providing the seedpopulation for IC scattering
Intermediate synchrotron peaked blazars like 3C 66A are wellsuited for simultaneous observations by Fermi-LAT and ground-based IACTs like VERITAS Relative to the sensitivities ofthese instruments ISPs are bright enough to allow for time-resolved spectral measurements in each band during flaringepisodes These types of observations coupled with extensivemulti-wavelength coverage at lower energies will continue toprovide key tests of blazar emission models
The Fermi-LAT Collaboration acknowledges generous ongo-ing support from a number of agencies and institutes that havesupported both the development and the operation of the LATas well as scientific data analysis These include the NationalAeronautics and Space Administration and the Department ofEnergy in the United States the Commissariat a lrsquoEnergie Atom-ique and the Centre National de la Recherche ScientifiqueInstitut National de Physique Nucleaire et de Physique desParticules in France the Agenzia Spaziale Italiana and theIstituto Nazionale di Fisica Nucleare in Italy the Ministry ofEducation Culture Sports Science and Technology (MEXT)High Energy Accelerator Research Organization (KEK) andJapan Aerospace Exploration Agency (JAXA) in Japan and theK A Wallenberg Foundation the Swedish Research Coun-cil and the Swedish National Space Board in Sweden Ad-ditional support for science analysis during the operationsphase is gratefully acknowledged from the Istituto Nazionale diAstrofisica in Italy and the Centre National drsquoEtudes Spatiales inFrance
The VERITAS collaboration acknowledges the generous sup-port from the US Department of Energy the US National Sci-ence Foundation and the Smithsonian Institution by NSERCin Canada by Science Foundation Ireland and by STFC inUK The VERITAS collaboration also acknowledges the excel-
lent work of the technical support staff at the FLWO and thecollaborating institutions in the construction and operation ofthe instrument as well as support from the NASASwift guestinvestigator program (grant NNX08AU13G) for the Swift ob-servations
PAIRITEL is operated by the Smithsonian AstrophysicalObservatory (SAO) and was made possible by a grant fromthe Harvard University Milton Fund a camera loan from theUniversity of Virginia and continued support of the SAO andUC Berkeley The PAIRITEL project is further supported byNASASwift Guest Investigator grant NNG06GH50G Thisresearch is partly based on observations with the 100 m telescopeof the MPIfR (Max-Planck-Institut fur Radioastronomie) atEffelsberg and has also made use of observations with the IRAM30 m telescope The Metsahovi team acknowledges the supportfrom the Academy of Finland The Abastumani Observatoryteam acknowledges financial support by the Georgian NationalScience Foundation through grant GNSFST084-404 The StPetersburg University team acknowledges support from RussianRFBR foundation via grant 09-02-00092 AZT-24 observationsare made within an agreement between Pulkovo Rome andTeramo observatories
L C Reyes acknowledges the support by the Kavli Institutefor Cosmological Physics at the University of Chicago throughgrants NSF PHY-0114422 and NSF PHY-0551142 and anendowment from the Kavli Foundation and its founder FredKavli M Bottcher acknowledges support from NASA throughChandra Guest Investigator Grant GO8-9100X Some of theVERITAS simulations used in this work have been performedon the joint Fermilab-KICP supercomputing cluster supportedby grants from Fermilab the Kavli Institute for CosmologicalPhysics and the University of Chicago
REFERENCES
Abdo A A et al 2009a Science 325 848Abdo A A et al 2009b ApJ 707 1310Abdo A A et al 2010a ApJS 188 405Abdo A A et al 2010b ApJ 710 1271Abdo A A et al 2010c ApJ 716 30Acciari V A et al 2008a ApJ 684 L73
13
The Astrophysical Journal 72643 (14pp) 2011 January 1 Abdo et al
Acciari V A et al 2008b ApJ 679 1427Acciari V A et al 2009 ApJ 693 L104Aliu E et al 2009 ApJ 692 L29Angelakis E Fuhrmann L Marchili N Krichbaum T P amp Zensus J A
2008 Mem Soc Astron Ital 79 1042Arnaud K A 1996 in ASP Conf Ser 101 Astronomical Data Analysis
Software and Systems V ed G H Jacoby amp J Barnes (San FranciscoCA ASP) 17
Atwood W B et al 2009 ApJ 697 1071Bennett A S 1962 Mem R Astron Soc 68 163Bloom J S Starr D L Blake C H Skrutskie M F amp Falco E E 2006
in ASP Conf Ser 351 Astronomical Data Analysis Software and SystemsXV ed C Gabriel C Arviset D Ponz amp S Enrique (San Francisco CAASP) 751
Bottcher M 2007 ApampSS 309 95Bottcher M amp Chiang J 2002 ApJ 581 127Bottcher M amp Dermer C D 2002 ApJ 564 86Bottcher M et al 2009 ApJ 694 174Bramel D A et al 2005 ApJ 629 108Britzen S et al 2007 AampA 472 763Britzen S et al 2008 AampA 484 119Cavaliere A amp DrsquoElia V 2002 ApJ 571 226Dermer C D amp Schlickeiser R 1993 ApJ 416 458Dickey J M amp Lockman F J 1990 ARAampA 28 215Edelson R A amp Krolik J H 1988 ApJ 333 646Finke J D Razzaque S amp Dermer C D 2010 ApJ 712 238Finke J D Shields J C Bottcher M amp Basu S 2008 AampA 477
513Fitzpatrick E L 1999 PASP 111 63Franceschini A Rodighiero G amp Vaccari M 2008 AampA 487 837Fuhrmann L Zensus J A Krichbaum T P Angelakis E amp Readhead A
C S 2007 in AIP Conf Proc 921 The First GLAST Symposium ed SRitz P Michelson amp C A Meegan (Melville NY AIP) 249
Fuhrmann L et al 2008 AampA 490 1019Gehrels N et al 2004 ApJ 611 1005Georganopoulos M amp Kazanas D 2003 ApJ 594 L27Georganopoulos M amp Kazanas D 2004 ApJ 604 L81Ghisellini G amp Madau P 1996 MNRAS 280 67Ghisellini G Tavecchio F amp Chiaberge M 2005 AampA 432 401Gilmore R C Madau P Primack J R Somerville R S amp Haardt F
2009 MNRAS 399 1694Hartman R C et al 1999 ApJS 123 79Henri G amp Sauge L 2006 ApJ 640 185Jorstad S G Marscher A P Mattox J R Wehrle A E Bloom S D amp
Yurchenko A V 2001 ApJS 134 181Joshi M amp Bottcher M 2007 ApJ 662 884
Kataoka J et al 1999 Astropart Phys 11 149Kerrick A D et al 1995 ApJ 452 588Kinney A L Bohlin R C Blades J C amp York D G 1991 ApJS 75
645Kuiper L Hermsen W Verbunt F Thompson D J Stairs I H Lyne A
G Strickman M S amp Cusumano G 2000 AampA 359 615Larionov V M et al 2008 ATel 1755 1Li T-P amp Ma Y-Q 1983 ApJ 272 317Mackay C D 1971 MNRAS 154 209Marscher A P Jorstad S G Mattox J R amp Wehrle A E 2002 ApJ 577
85Mattox J R et al 1996 ApJ 461 396Miller J S French H B amp Hawley S A 1978 Proc Pittsburgh Conf on
BL Lac Objects ed A M Wolfe 176Mucke A Protheroe R J Engel R Rachen J P amp Stanev T 2003
Astropart Phys 18 593Northover K J E 1973 MNRAS 165 369Oke J B et al 1995 PASP 107 375Piner B G Pant N amp Edwards P G 2008 ApJ 678 64Poole T S et al 2008 MNRAS 383 627Prandini E Bonnoli G Maraschi L Mariotti M amp Tavecchio F 2010
MNRAS 405 L76Reimer A Joshi M amp Bottcher M 2008 in AIP Conf Ser 1085 High
Energy Gamma-Ray Astronomy ed F A Aharonian W Hofmann amp FRieger (Melville NY AIP) 502
Savolainen T Homan D C Hovatta T Kadler M Kovalev Y Y ListerM L Ros E amp Zensus J A 2010 AampA 512 A24
Schlegel D J Finkbeiner D P amp Davis M 1998 ApJ 500 525Sikora M Begelman M C amp Rees M J 1994 ApJ 421 153Smith H E Smith E O amp Spinrad H 1976 PASP 88 621Stecker F W Malkan M A amp Scully S T 2006 ApJ 648 774 (erratum
658 1392 [2007])Swordy S 2008 ATel 1753 1Tavecchio F amp Ghisellini G 2009 MNRAS 394 L131Taylor G B Vermeulen R C Readhead A C S Pearson T J Henstock
D R amp Wilkinson P N 1996 ApJS 107 37Thompson D J et al 1993 ApJS 86 629Tosti G 2008 ATel 1759 1Urry C M amp Padovani P 1995 PASP 107 803Villata M et al 2008 AampA 481 L79Villata M et al 2009 AampA 504 L9Weekes T C 2000 in AIP Conf Ser 515 GeVndashTeV Gamma Ray Astrophysics
Workshop Towards a Major Atmospheric Cherenkov Detector VI ed B LDingus M H Salamon amp D B Kieda (Melville NY AIP) 3
Wills B J amp Wills D 1974 ApJ 190 L97Wurtz R Stocke J T amp Yee H K C 1996 ApJS 103 109
14
Related Documents