Int. J. Machine Intelligence and Sensory Signal Processing, Vol. 2, No. 2, 2018 97 Copyright © 2018 Inderscience Enterprises Ltd. Multi-view data ensemble clustering: a cluster-level perspective Jiye Liang* Department of Computer Science, Taiyuan Normal University, China and Key Laboratory of Computational Intelligence and Chinese Information Processing of Ministry of Education, School of Computer and Information Technology, Shanxi University, Taiyuan, China Email: [email protected] *Corresponding author Qianyu Shi Key Laboratory of Computational Intelligence and Chinese Information, Processing of Ministry of Education, School of Computer and Information Technology, Shanxi University, Taiyuan, China Email: [email protected] Xingwang Zhao Key Laboratory of Computational Intelligence and Chinese Information Processing of Ministry of Education, School of Computer and Information Technology, Shanxi University, Taiyuan, China Email: [email protected] Abstract: Ensemble clustering has recently emerged a powerful clustering analysis technology for multi-view data. From the existing work, these techniques held great promise, but most of them are inefficient for large data. Some researchers have also proposed efficient ensemble clustering algorithms, but these algorithms devote to data objects with the same feature spaces, which are not satisfied for multi-view data. To overcome these deficiencies, an efficient ensemble clustering algorithm for multi-view mixed data is developed from the cluster-level perspective. Firstly, a set of clustering solutions are produced with the K-prototypes clustering algorithm on each view multiple times, respectively. Then, a cluster-cluster similarity matrix is constructed by considering all the clustering solutions. Next, the METIS algorithm is conduct meta-clustering based on the similarity matrix. After that, the final clustering results are obtained by applying majority voting to assign the objects to their

Welcome message from author
This document is posted to help you gain knowledge. Please leave a comment to let me know what you think about it! Share it to your friends and learn new things together.
Transcript

Int. J. Machine Intelligence and Sensory Signal Processing, Vol. 2, No. 2, 2018 97
Copyright © 2018 Inderscience Enterprises Ltd.
Multi-view data ensemble clustering: a cluster-level perspective
Jiye Liang* Department of Computer Science, Taiyuan Normal University, China and Key Laboratory of Computational Intelligence and Chinese Information Processing of Ministry of Education, School of Computer and Information Technology, Shanxi University, Taiyuan, China Email: [email protected] *Corresponding author
Qianyu Shi Key Laboratory of Computational Intelligence and Chinese Information, Processing of Ministry of Education, School of Computer and Information Technology, Shanxi University, Taiyuan, China Email: [email protected]
Xingwang Zhao Key Laboratory of Computational Intelligence and Chinese Information Processing of Ministry of Education, School of Computer and Information Technology, Shanxi University, Taiyuan, China Email: [email protected]
Abstract: Ensemble clustering has recently emerged a powerful clustering analysis technology for multi-view data. From the existing work, these techniques held great promise, but most of them are inefficient for large data. Some researchers have also proposed efficient ensemble clustering algorithms, but these algorithms devote to data objects with the same feature spaces, which are not satisfied for multi-view data. To overcome these deficiencies, an efficient ensemble clustering algorithm for multi-view mixed data is developed from the cluster-level perspective. Firstly, a set of clustering solutions are produced with the K-prototypes clustering algorithm on each view multiple times, respectively. Then, a cluster-cluster similarity matrix is constructed by considering all the clustering solutions. Next, the METIS algorithm is conduct meta-clustering based on the similarity matrix. After that, the final clustering results are obtained by applying majority voting to assign the objects to their

98 J. Liang et al.
corresponding clusters based on the meta-clustering. The corresponding time complexity of the proposed algorithm is analysed as well. Experimental results on several multi-view datasets demonstrated the superiority of our proposed algorithm.
Keywords: multi-view data; mixed data; k-prototypes clustering algorithm; ensemble clustering.
Reference to this paper should be made as follows: Liang, J., Shi, Q. and Zhao, X. (2018) ‘Multi-view data ensemble clustering: a cluster-level perspective’, Int. J. Machine Intelligence and Sensory Signal Processing, Vol. 2, No. 2, pp.97–120.
Biographical notes: Jiye Liang is a Professor with the Department of Computer Science at the Taiyuan Normal University. He is also a Director of the Key Laboratory of Computational Intelligence and Chinese Information Processing of Ministry of Education at the Shanxi University. He received his MSc and PhD degrees from the Xi’an Jiaotong University in 1990 and 2001, respectively. His current research interests include computational intelligence, granular computing, data mining and knowledge discovery. He has published more than 190 journal papers in his research fields.
Qianyu Shi is currently working toward the Master’s degree in the School of Computer and Information Technology at the Shanxi University. Her research interests are in the areas of data mining and machine learning.
Xingwang Zhao is currently working toward the PhD degree in the School of Computer and Information Technology at the Shanxi University. His research interests are in the areas of data mining and machine learning.
1 Introduction
For a given dataset, clustering analysis is a process of automatically assigning similar objects to the same group based on the similarity measure between objects, so that objects of the same group are as similar as possible whereas objects belonging to different groups are as dissimilar as possible (Jain, 2010; Xu and Wunsch, 2005; Huang et al., 2012; Rana et al., 2013). Currently, clustering analysis techniques have been widely used in the field of bioinformatics, social networks, image processing, etc. (Han et al., 2011).
Multi-view data are instances that have multiple views, that is to say, objects are consistent, but there are certain differences between the feature spaces of the objects. For example, in order to evaluate economic growth of countries, there are multiple views including purchasing power, unemployment rate, gross domestic product (GDP), etc. As the second example, we can refer to a banking customer dataset, variables include a demographic view representing demographic information of customers, an account view showing the information about customer accounts, and a consumption view describing customer spending behaviours. Developing clustering algorithms for multi-view data is a very important task.
Ensemble clustering algorithms recently hold great promise for dealing with multi-view data due to their advantages of enhancing the clustering accuracy, robustness,
Multi-view data ensemble clustering: a cluster-level perspective 99
parallelism and so on (Fred and Jain, 2005; Iam-On and Boongoen, 2015; Ghosh and Acharya, 2011; Zhao et al., 2017). For a particular dataset, different clustering algorithms, or even the same algorithm with different parameters, may produce distinct solutions. It is impossible to select the most appropriate clustering algorithm with the correct parameter values for a given dataset without any further information in most cases. It is because the characteristic of the dataset is unknown but most of clustering algorithm focuses on their individual criteria about the underlying dataset. Ensemble clustering algorithms have recently emerged to overcome these limitations, and have been shown to be more effective and robust. The main objective of ensemble clustering is to combine multiple clusterings of a dataset into a unified and comprehensive final clustering result. This combined clustering result takes advantage of different criteria at the same time to achieve accuracy superior to that of any individual clustering. For multi-view data, ensemble clustering algorithms combine the clustering results from each view (Li et al., 2012; Bickel and Scheffere, 2004; Tzortzis and Likas, 2010; Cleuziou et al., 2009). For example, there are many departments to record information of students in the university. Students’ affairs division records student achievements, but the centre of apartment holds student accommodations. If we want to cluster the students for analysis, all the data are not need to be send to a single site. Each department can perform clustering based on the local data views and send only the clustering results for combining. In this way, only a small amount of data are transferred and only clustering results of each view could be shared instead of original data. This provides benefits of saving bandwidth and preserving privacy at the same time. However, traditional ensemble clustering algorithms work on object level in the ensemble stage, which is faced with the problem of larger amount of computation, higher time complexity, especially when datasets have huge number of objects.
As a consequence, some researchers have also made some exploration with respect to this issue (Yu et al., 2012, 2014; Wu et al., 2012; Chung and Dai, 2013). For example, structure ensemble, which is firstly proposed by Yu et al. (2012, 2014), can solve the problem of cluster fusion in the ensemble learning well. Unlike traditional cluster ensemble approaches the main objective of which is to align individual labels obtained from different clustering solutions, the structure ensemble approach focuses on how to integrate multiple cluster structures extracted from different datasets into a unified structure. In the literature (Wu et al., 2012; Chung and Dai, 2013), a new concept called clustering fragment is incorporated for increased speed. A data fragment is any subset of the data that is not split by any of the clustering results. As the number of data fragments is usually far smaller than the number of data points, ensemble clustering based on data fragments is very likely to have a much lower time complexity than directly on data points without sacrificing effectiveness. The above mentioned algorithms are suitable for data clustering ensemble which are described by the same feature spaces. However, data objects from multiple views usually have different feature spaces. That is to say, there is diverse dimensionality in the multi-view data analysis. To tackle the above problems, it is particularly necessary to provide an efficient ensemble clustering algorithm for multi-view data.
In this paper, a novel ensemble clustering algorithm for multi-view data with mixed numerical and categorical attributes is developed. First, a set of clustering solutions are produced by executing the k-prototypes clustering algorithm (Huang, 1998) on each view multiple times, respectively. Then, considering all the clustering solutions, the algorithm
100 J. Liang et al.
computes the relations between input clusters and displays this information in a similarity matrix (SM). Because our proposed ensemble clustering algorithm works on cluster level, it is very scalable and runs efficiently. Even datasets having large number of objects can be processed in practical run times. Next, the METIS algorithm (Karypis and Kumar, 1998) is used to conduct metaclustering based on the cluster-cluster SM. After that, each metacluster contains a set of clusters. And an object can occur multiple times in a metacluster. Finally, majority voting (Mimaroglu and Aksehirli, 2011) is performed on the metaclustering to produce a non-overlapping final clustering. As a result, each object is assigned to only one cluster where it exists most frequently. The effectiveness and efficiency of the proposed algorithm are empirically demonstrated over some multi-view datasets in terms of three benchmark evaluation measures. The experimental results show that the proposed algorithm achieves good performance in comparison with several traditional ensemble clustering algorithms for multi-view data.
The remainder of this paper is organised as follows. In Section 2, some related works are discussed. Section 3 proposes an ensemble clustering algorithm for multi-view data. Experimental results are shown in Section 4. Finally, Section 5 provides conclusions.
2 Related work
2.1 K-prototypes clustering algorithm
In 1998, Huang (1998) proposed the k-prototypes algorithm, which is a simple integration of the k-means (Macqueen, 1967) and k-modes (Huang, 1998) algorithms. The k-prototypes algorithm is widely used because frequently encountered objects in real world database are mixed-type objects, and it is efficient in processing large datasets. In the k-prototypes algorithm, the dissimilarity measure takes into account both numerical attributes and categorical attributes. The dissimilarity measure on numerical attributes is defined by the squared Euclidean distance. For the categorical part, the computation of dissimilarity is performed by simple matching, which is the same as that of the k-modes algorithm.
Let x, y be two objects described by A attributes, ,r c rA A A A∪ denotes numerical attributes, Ac denotes categorical attributes. Hence, x can be denoted as (xr, xc)T with
1 2 | |( , , , )rr r r r
Ax x x x and 1 2 | |( , , , ).cc c c c
Ax x x x Similarly, y can be denoted as (yr, yc)T
with 1 2 | |( , , , )rr r r r
Ay y y y and 1 2 | |( , , , ).cc c c c
Ay y y y The dissimilarity of the
numerical parts between two mixed-type objects x and y is calculated according to
2
1
( , )r
r
Ar rq qA
q
D x y x y (1)
The dissimilarity of the categorical parts between two mixed-type objects x and y is calculated according to
1
( , ) ,c
c
Ac cq qA
q
D x y δ x y (2)
Multi-view data ensemble clustering: a cluster-level perspective 101
where
1,,
0,
c cq qc c
q q c cq q
x yδ x y
x y
As a matter of fact, the dissimilarity used in the k-prototypes algorithm is calculated between an object and a prototype. Suppose that the clustering results of a given mixed dataset D = {x1, x2, , xn} consisting of n objects, are Ck = {C1, C2, , Ck},whose cluster prototypes are Zk = {z1, z2, , zk}, where k is the number of clusters. The dissimilarity between xi(1 ≤ i ≤ n) and the prototype zj(1 ≤ j ≤ k), can be measured by
1 1
, ,,
, ,
r c
r c
r ci j i jA Ai j k k
i p i pA Ap p
D x z D x zA AD x zA A
D x z D x z (3)
where ( , )r i pAD x z and ( , )c i pAD x z are calculated according to equations (1) and (2), respectively.
Based on the abovementioned dissimilarity (Liang et al., 2012b), K-prototypes clustering algorithm is described in Table 1. Table 1 K-prototypes clustering algorithm
Input: a mixed dataset D, the number of clusters k in the final clustering. Output: final clustering.
1 Select k initial prototypes from the mixed dataset D randomly, one for each cluster. 2 Allocate an object to the cluster whose prototype is the nearest to it according to
equation (3). 3 Repeat 4 Update the prototype of the cluster after each allocation. 5 Retest the dissimilarity of objects against the current prototypes according to
equation (3). If an object is found such that its nearest prototype belongs to another cluster rather than its current one, reallocate the object to that cluster.
6 Until no object has changed clusters after a full cycle test of the whole dataset or a given stopping criterion is fulfilled.
7 Return the final clustering.
2.2 Ensemble clustering
Ensemble clustering combines different clustering results of a dataset to obtain a single consolidated clustering, and it has exhibited great potential in improving the robustness as well as the quality of clustering results. Therefore, ensemble clustering has become one of the important research directions in the ensemble learning branch in recent years (Zhang and Suganthan, 2015; Pan et al., 2015). In general, the whole process of ensemble clustering involves two critical steps: generation of base clusterings, and aggregation of clustering solutions (Zhao et al., 2017).
102 J. Liang et al.
The objective of the first step is to generate a set of different clustering results which are as diverse as possible. The existing approaches that are applied to generate multiple clusterings on a dataset can be categorised into five types:
applying different clustering algorithms as the basic clustering algorithms to obtain different solutions (Strehl and Ghosh, 2002)
applying the same clustering algorithm but changing the input parameter values, e.g., different the number of clusters k, to generate different clustering solutions (Iam-on and Boongoen, 2010)
running a random initialisation clustering algorithm multiple times, e.g., adopting different initial centres for k-prototypes (Fred and Jain, 2005)
using selected subsets of features, i.e., projection (Topchy et al., 2003)
sub-sampling, re-sampling or adding noise to the original data (Valentini, 2007).
The objective of the second step is to obtain a unified and comprehensive final clustering result which is as accurate as possible. The examples of existing well-known ensemble methods are:
The feature-based method that simply transforms the problem of cluster ensembles to categorical data clustering, i.e., cluster label of each clustering solution is treated as a new feature describing each object, the quality of final clustering result depends on the clustering algorithms for categorical data (Nguyen and Caruana, 2007; Topchy et al., 2005).
The voting-based method that learns from classifier ensemble (Terrades et al., 2009), but there is no supervised information in ensemble clustering which is different from classifier ensemble. The final partition is found through relabeling the base clustering results (Boulis and Ostendorf, 2004).
The co-association-based method that makes use of co-occurrences in the same clusters to create a co-association matrix, in which entries are viewed as pairwise similarity among objects, so any similarity-based clustering algorithm, e.g., hierarchical clustering, can be applied to this matrix to find consensus clustering (Fred and Jain, 2005).
The graph-based algorithms that employ a graph partitioning methodology, Strehl and Ghosh (2002) present the three graph-based ensemble clustering algorithms: the cluster-based similarity partitioning algorithm (CSPA), the hyper-graph partitioning algorithm (HGPA), and the metaclustering algorithm (MCLA), which will be introduced in the Section 4.3. Each algorithm constructs a graph based on a pairwise matrix from the initial set of base clusterings, and then applies graph-clustering techniques to get the final clustering result. Fern and Brodley (2003, 2004) use the binary cluster-association matrix to generate a bipartite graph which models both objects and clusters as vertices, and considers both the similarities between objects and the similarities between clusters, then this graph is partitioned to achieve the final clustering result, using either METIS or spectral graph partitioning (SPEC) (Ng et al., 2001).
Multi-view data ensemble clustering: a cluster-level perspective 103
From the above, the time complexity of classical ensemble clustering algorithms is highly sensitive to the data size. When the number of objects is large, these algorithms will be unsuitable for practical application.
3 An ensemble clustering algorithm for multi-view data
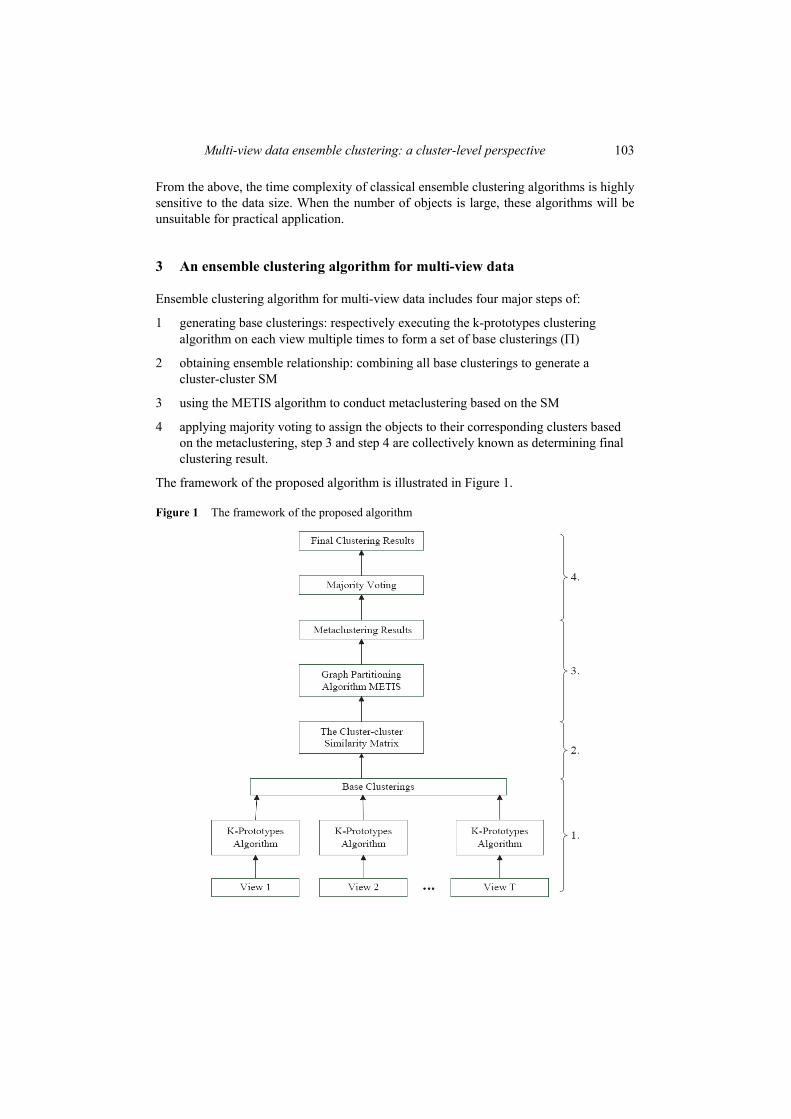
Ensemble clustering algorithm for multi-view data includes four major steps of:
1 generating base clusterings: respectively executing the k-prototypes clustering algorithm on each view multiple times to form a set of base clusterings ( )
2 obtaining ensemble relationship: combining all base clusterings to generate a cluster-cluster SM
3 using the METIS algorithm to conduct metaclustering based on the SM
4 applying majority voting to assign the objects to their corresponding clusters based on the metaclustering, step 3 and step 4 are collectively known as determining final clustering result.
The framework of the proposed algorithm is illustrated in Figure 1.
Figure 1 The framework of the proposed algorithm

104 J. Liang et al.
3.1 Generating base clusterings
Consider the dataset D consisting of n objects coming from T views. The multi-view data D = (D1, D2, , DT) can be represented as 1 1 1 1
1 2 1 2( , , , ), , ( , ,T T TnD d d d D d d
, )Tnd where Dt(1 ≤ t ≤ T ) denotes the set of objects from the tth view, and t
id is the ith object in Dt. Let the cluster number of all base clusterings be k. Respectively execute k-prototypes clustering algorithm Mt times on each view Dt based on random initial cluster centres to get different base clusterings 1 2{ , , , }t t t t
j j j jkπ C C C with 1 ≤ t ≤ T and
1 ≤ j ≤ Mt, (1 )tjqC q k is the qth cluster in the jth base clustering t
jπ of the tth view. Therefore, the set of base clusterings can be denoted as
11 1 11 2 1( ) { , , , , , , , }.
TT T
M MD π π π π π The goal of multi-view clustering is to find a
new and better clustering * * *1 2*( ) { , , , }kπ D C C C by using the information provided in
(D).
3.2 Obtaining ensemble relationship
In this step, the similarities of different clusters need to be computed. In the literature, many similarity or dissimilarity measure between clusters have been proposed. For example, in the agglomerative clustering algorithms, the difference between clusters is measured by using the distances between the closest or farthest data objects of two clusters, i.e., single link and complete link. They are sensitive to noise due to the dependence on a few objects. The distance between centres of clusters is often used to measure the dissimilarity between two clusters in the centres-based clustering algorithms. This measure is robust to noise and computationally efficient, but it cannot reflect the distinction of the boundary between two clusters and cannot assess distance between centres which have different feature spaces. Jaccard measure uses the number of the common objects included by the two clusters to reflect their similarity. The measure does not consider the objects whose cluster labels may be incorrect in a cluster. The number of these objects affects the effectiveness of the measure. Besides, the measure treats the similarity between clusters to be roughly 0 if they belong to the same base clustering, such measure is rather rough but we can capture the relationships between clusters according to other base clusterings. Thus, a new measure method is proposed to compute similarity of clusters in this paper by depending on the relationship between base clusterings.
Each cluster of base clusterings is viewed as a new data sample, and creates a new dataset C = {c1, c2, , cm} with m = k × (M1 + M2 + + MT). The SM SMm × m is constructed to store the relationship between any pair of clusters. Each element SM(cp, cq) in the matrix denotes the similarity of clusters cp and cq(1 ≤ p, q ≤ m) (Wang et al., 2013). Let cp be a cluster of the base clustering πi(πi (D)), i.e., cp πi and cq be a cluster of the base clustering πj(πj (D)), i.e., cq πj.
If i = j, i.e., cp and cq belong to the same base clustering, the similarity of clusters cp and cq is computed based on other base clustering πs(s ≠ i, πs (D)). Let cr be a cluster of the base clustering πs and 0, 0,r p r qc c c c∩ ∩ the similarity of clusters cp and cq based on cr is
Multi-view data ensemble clustering: a cluster-level perspective 105
, min ,p q r r p r qSM c c c P c c P c c (4)
where
,r p r qr p r q
p q
c c c cP c c P c c
c c∩ ∩
(5)
Combining the similarity based on every cluster in πs, so the similarity of clusters cp and cq based on the base clustering πs is
0, 0,
, ,r p r q r s
p q s p q rc c c c c π
SM c c π SM c c c∩ ∩
(6)
Combining the similarity based on every base clustering, and in order to improve accuracy, we assign a weight to every base clustering. So the similarity of clusters cp and cq is
,,
s p q ss i
p qs
s i
ω SM c c πSM c c
ω (7)
where ωs is the weight for base clustering πs. If i ≠ j, i.e., cp and cq belong to different base clusterings, the similarity of clusters cp
and cq is computed based on other base clustering πs(s ≠ i, j, πs (D)). Similar to the above process, every cluster in the base clustering πs is compared to cp and cq, respectively. The similarity of clusters cp and cq based on the base clustering πs is computed according to equation (6), then combining the similarity based on every base clustering. Due to different base clusterings that cp and cq belong to, the similarity of clusters cp and cq is computed based on base clusterings except for πi and πj, which is defined as follows
,
,
,
,s p q s
s i jp q
ss i j
ω SM c c π
SM c cω
(8)
where ωs is the weight for base clustering πs. Equation (6) considers the similarity of two cluster cp and cq on each possible cluster
in base clustering πs to capture the co-occurrence comparison between them (Cost and Salzberg, 1993; Wang et al., 2011). Further, the similarity between the cluster pair (cp, cq) can be calculated on top of SM(cp, cq|πs) by aggregating all the relative similarity on base clusterings other than πi and πj. For the parameter ωs, in this paper, we simply collect information from the crowd of base clusterings to estimate the quality of a base clustering as the weight. Each base clustering is compared with the other ones in the ensemble and the average opinion is obtained for quality estimation (Huang et al., 2013).
The weight ωi for base clustering πi is defined as follows
106 J. Liang et al.
( ),
1 ,1
j
i i jπ D i j
ω Sim π πM
(9)
where M = M1 + M2 + + MT, Sim(πi, πj) represents the similarity between the two base clusterings πi and πj. In this paper, the normalised mutual information (NMI) (Strehl and Ghosh, 2002) which will be introduced in the next section is used as the similarity measure Sim(πi, πj). The greater agreement of a base clustering from the crowd is, the higher its weight is supposed to be.
3.3 Determining final clustering result
Having obtained a cluster-cluster SM, a graph-based partitioning method is exploited to obtain the metaclustering. This consensus function requires the underlying matrix to be initially transformed into a weighted metalevel graph G = (V, W), where V is a set of vertices representing clusters C in the ensemble, and W denotes a set of weighted edges that can be defined from the SM. Afterward, a graph partitioning algorithm called METIS is used to partition the metalevel graph into k metaclusters, each metacluster contains a set of clusters. By this time, we obtain a clustering result of the dataset C which consists of all clusters in base clusterings.
Each object has a specific association degree to each metacluster. This can be estimated from the number of original clusters to which the object belongs, in the underlying metacluster, because an object can occur multiple times in a metacluster and can also occur in different metaclusters. In order to produce a non-overlapping final clustering, majority voting is performed on the metaclustering. The final clustering is produced by assigning each object to only one metacluster with which it is most frequently associated, i.e., it exists most frequently.
3.4 Algorithm description
Based on the above introduced major steps, an ensemble clustering algorithm for multi-view data (abbreviated as ENCA) is described in Table 2. Table 2 An ensemble clustering algorithm for multi-view data
Input: a multi-view dataset D = {D1, D2, , DT}, the number of clusters k in the final clustering.
Output: final clustering.
1 Respectively execute the K-prototypes clustering algorithm Mt(1 ≤ t ≤ T) times on each view Dt to get a set of base clusterings ∏(D).
2 Calculate the cluster-cluster SM SMm × m according to equation (8). 3 Utilise METIS to conduct metaclustering based on the SM SMm × m. 4 Perform majority voting on the metaclustering to produce a final clustering π* (D).
The following is the time complexities in the ensemble stage of the ENCA algorithm. The time complexity of constructing cluster-cluster SM is O(m3), where m is the number of all clusters. We use METIS for partition with time complexity being O(m2) and the computational cost of assigning the objects to the corresponding clusters based on
Multi-view data ensemble clustering: a cluster-level perspective 107
majority voting is O(kn). Since k << n, the overall time complexity of the proposed algorithm is O(m3) + O(n).
4 Experimental evaluations
In this section, we conduct effectiveness and efficiency tests to analyse the performance of the proposed algorithm (ENCA) on some multi-view datasets in terms of three benchmark evaluation measures.
4.1 Investigated datasets
ENCA is tested on seven real multi-view datasets, including two real multi-view UCI datasets (UCI Machine Learning Repository, http://archive.ics.uci.edu/ml), i.e., multiple features (MF) dataset and image segmentation (IS) dataset, and Reuters RCV1/RCV2 Multilingual (Reuters) dataset (Amini et al., 2009). The details of these datasets are summarised in Table 3. Table 3 Detail description of datasets
Datasets Sizes Views Dimensions Clusters
MF 2,000 Mfeat-fou view 76 10 Mfeat-fac view 216 Mfeat-kar view 64 Mfeat-pix view 240 Mfeat-zer view 47 Mfeat-mor view 6
IS 2,310 Shape view 9 7 RGB view 10
Rt.SP-EN 12,342 SP view 11,547 6
EN view 21,530 Rt.EN-FR 18,758 EN view 21,531 6
FR view 24,892 Rt.IT-SP 24,039 IT view 15,506 6
SP view 11,547 Rt.FR-GR 26,648 FR view 24,893 6
GR view 34,278 Rt.GR-IT 29,953 GR view 34,279 6
IT view 15,505
4.2 Evaluation criteria
In order to evaluate the effectiveness of the clustering algorithms, we have adopted the following three popular external criteria: clustering accuracy (CA) (Liang et al., 2012a), adjusted rand index (ARI) (Liang et al., 2012a), and NMI (Strehl and Ghosh, 2002),
108 J. Liang et al.
which measure the agreement of the clustering results produced by an algorithm and the ground truth.
Suppose that C = {C1, C2, , CI} and P = {P1, P2, , PJ} represent the clustering results and pre-defined classes of the dataset with n objects, respectively. I and J are the number of clusters C and classes P; nij is the number of common objects of cluster Ci and pre-defined class Pj; ni is the number of objects in cluster Ci; and nj is the number of objects in class Pj. Then the three popular external criteria are as follows.
Clustering accuracy (CA). CA measures the percentage of correctly classified objects in the clustering solution compared to pre-defined class labels. The CA is defined as
11
maxI J
ijj
i
nCA
n (10)
ARI. ARI takes into account the number of objects that exist in the same cluster and different clusters (Hubert and Arabie, 1985). The ARI is defined as
1 1 21 ( )2
I Jij
i j
nη
ARIρ v η
(11)
1 1
2, ,2 2 ( 1)
I Ji i
i j
n n ρvρ v ηn n
(12)
NMI. This is one of the common external clustering validation metrics, which estimates the extent of the clustering structure with the external classification information of the data. Thus, NMI is defined as
1 1
1 1
log
log log
I Jij
iji ji j
I Jji
i ji j
nnn
n nNMI
nnn nn n
(13)
The maximum value of the three external criteria is one. If the clustering structure is close to the true class structure, then the values of them are high. The higher the values of the three measures for a clustering result, the better the clustering performance is.
4.3 Experiment design
To fully evaluate the performance of the proposed method, it is compared to six ensemble clustering methods, i.e., CO + SL, CO + CL, CO + AL, CSPA, HGPA, and MCLA. The first three algorithms are based principally on the pairwise similarity among objects (Fred

Multi-view data ensemble clustering: a cluster-level perspective 109
and Jain, 2005). Given a cluster ensemble of multiview dataset (D), a n × n SM (CO) is
constructed by CO(di, dj) = 1 1
1 ( , )(1 , ),tMT
t t tm i j
t m
S d d i j nM
where CO(di, dj) {0, 1}
represents the similarity measure between objects di, dj. In addition, ( , ) 1t t tm i jS d d if
( ) ( ),t t t tm mi jv d v d and ( , ) 0t t t
m i jS d d otherwise. Note that ( )t tm iv d denotes the cluster
label to which tid belongs in the base clustering .t
mπ The single-linkage (SL), complete-linkage (CL) and average linkage (AL) agglomerative hierarchical clusterings are applied to this matrix to yield the final partition π*(D).
The last three algorithms are graph-based ensemble clustering algorithms (Strehl and Ghosh, 2002). CSPA constructs an undirected weighted graph based on the CO matrix, and then METIS is used to partition the graph into k clusters. HGPA constructs a hypergraph, where each object is a vertex, and each cluster is a hyperedge. HMETIS (Karypis et al., 1999) is applied to partition the hypergraph into k unconnected components. MCLA is similar to our proposed algorithm, and the only difference is that similarity between any two clusters is computed using the binary Jaccard measure.
All the experiments are conducted in MATLAB R2014b 64bit edition on a workstation (Windows 64 bit, Intel(R) Xeon(R) 2.60 GHz E5-2650 CPU, 128 GB of RAM, Windows Server 2008 operating system). The proposed algorithm and the comparative algorithm are coded in MATLAB 8.4 programming language. The performance of each ensemble clustering algorithms is measured by the average CA, ARI, and NMI after performing the same approach ten times.
4.4 Experimental results
4.4.1 Effectiveness analysis
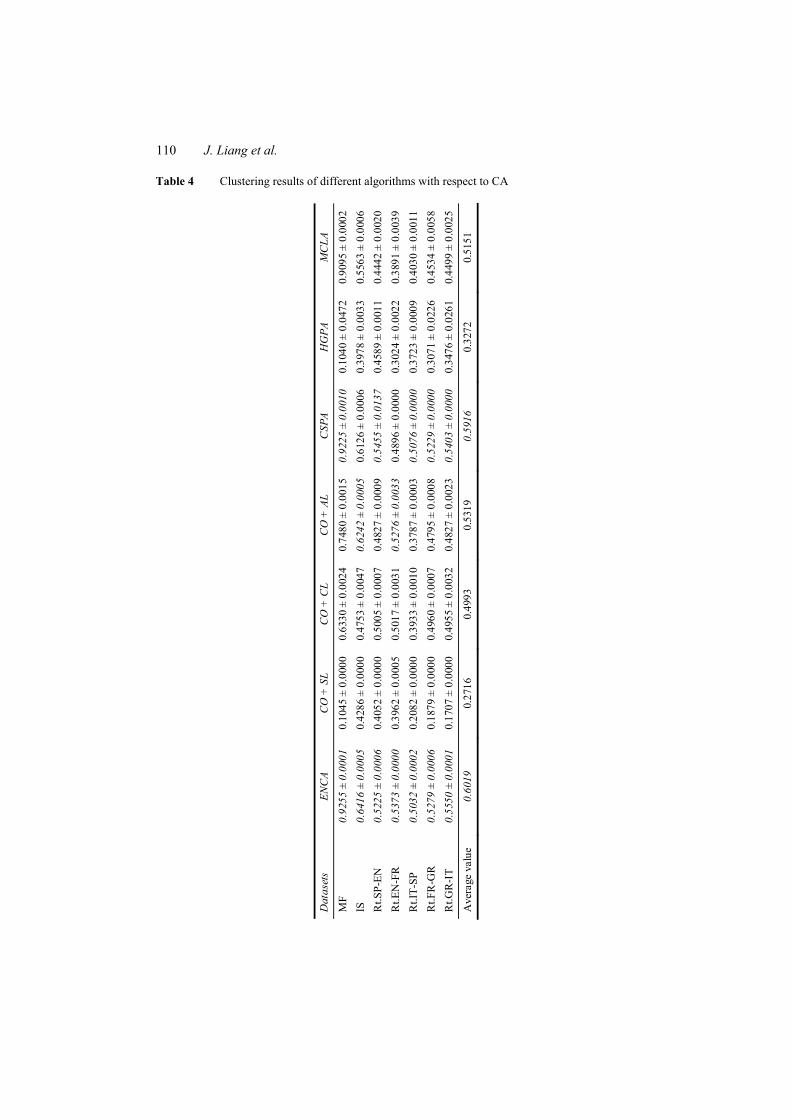
Based on three benchmark evaluation measures, the performance of different ensemble clustering algorithms over examined datasets are shown in Tables 4–6 when each ensemble clustering algorithm corresponds to 30 clustering solutions on each view. For each dataset, the highest two index values are highlighted in italics. The results shown in these tables indicate the superior effectiveness of ENCA, as compared to other ensemble clustering algorithms included in this experiment. No matter what kind of index is chosen as evaluation measure, ENCA is the leader on multi-view datasets, by producing five best quality output clusterings on seven datasets. CSPA does well and is the most effective among compared algorithms, by producing two best quality final clusterings. Another important discovery is that ENCA achieves comparable or better performance than the other algorithms on all the datasets. Although it is not leading on several datasets, it never produces very bad clusterings and its index values are even close to the best in most cases. In addition, the average index values of ENCA on all the datasets are also remarkable as shown in the same tables. Also in all cases the variance is almost equal to zero(to the fourth decimal digit)that shows the stability of the proposed algorithm.
110 J. Liang et al.
Table 4 Clustering results of different algorithms with respect to CA
Dat
aset
s EN
CA
CO
+ S
L C
O +
CL
CO
+ A
L C
SPA
HG
PA
MC
LA
MF
0.92
55 ±
0.0
001
0.10
45 ±
0.0
000
0.63
30 ±
0.0
024
0.74
80 ±
0.0
015
0.92
25 ±
0.0
010
0.10
40 ±
0.0
472
0.90
95 ±
0.0
002
IS
0.64
16 ±
0.0
005
0.42
86 ±
0.0
000
0.47
53 ±
0.0
047
0.62
42 ±
0.0
005
0.61
26 ±
0.0
006
0.39
78 ±
0.0
033
0.55
63 ±
0.0
006
Rt.S
P-EN
0.
5225
± 0
.000
6 0.
4052
± 0
.000
0 0.
5005
± 0
.000
7 0.
4827
± 0
.000
9 0.
5455
± 0
.013
7 0.
4589
± 0
.001
1 0.
4442
± 0
.002
0 R
t.EN
-FR
0.
5373
± 0
.000
0 0.
3962
± 0
.000
5 0.
5017
± 0
.003
1 0.
5276
± 0
.003
3 0.
4896
± 0
.000
0 0.
3024
± 0
.002
2 0.
3891
± 0
.003
9 R
t.IT-
SP
0.50
32 ±
0.0
002
0.20
82 ±
0.0
000
0.39
33 ±
0.0
010
0.37
87 ±
0.0
003
0.50
76 ±
0.0
000
0.37
23 ±
0.0
009
0.40
30 ±
0.0
011
Rt.F
R-G
R
0.52
79 ±
0.0
006
0.18
79 ±
0.0
000
0.49
60 ±
0.0
007
0.47
95 ±
0.0
008
0.52
29 ±
0.0
000
0.30
71 ±
0.0
226
0.45
34 ±
0.0
058
Rt.G
R-I
T 0.
5550
± 0
.000
1 0.
1707
± 0
.000
0 0.
4955
± 0
.003
2 0.
4827
± 0
.002
3 0.
5403
± 0
.000
0 0.
3476
± 0
.026
1 0.
4499
± 0
.002
5
Ave
rage
val
ue
0.60
19
0.27
16
0.49
93
0.53
19
0.59
16
0.32
72
0.51
51

Multi-view data ensemble clustering: a cluster-level perspective 111
Table 5 Clustering results of different algorithms with respect to ARI
Dat
aset
s EN
CA
CO
+ S
L C
O +
CL
CO
+ A
L C
SPA
HG
PA
MC
LA
MF
0.84
21 ±
0.0
002
0.00
00 ±
0.0
000
0.42
05 ±
0.0
086
0.69
82 ±
0.0
012
0.84
05 ±
0.0
015
–0.0
042
± 0.
0385
0.
8182
± 0
.000
6 IS
0.
5121
± 0
.000
5 0.
2363
± 0
.000
0 0.
2447
± 0
.008
7 0.
4656
± 0
.000
5 0.
4624
± 0
.000
4 0.
2189
± 0
.004
0 0.
3304
± 0
.001
6 R
t.SP-
EN
0.17
01 ±
0.0
004
–0.0
116
± 0.
0000
0.
1222
± 0
.005
8 0.
1004
± 0
.000
6 0.
2059
± 0
.019
1 0.
1255
± 0
.005
0 0.
1345
± 0
.003
3 R
t.EN
-FR
0.
2348
± 0
.000
0 0.
0164
± 0
.000
0 0.
1476
± 0
.005
6 0.
1697
± 0
.004
8 0.
1604
± 0
.000
0 0.
0108
± 0
.000
7 0.
0503
± 0
.004
9 R
t.IT-
SP
0.24
52 ±
0.0
001
0.00
00 ±
0.0
000
0.15
92 ±
0.0
006
0.15
12 ±
0.0
001
0.24
67 ±
0.0
000
0.13
74 ±
0.0
007
0.18
45 ±
0.0
013
Rt.F
R-G
R
0.26
90 ±
0.0
006
0.00
00 ±
0.0
000
0.23
33 ±
0.0
008
0.21
31 ±
0.0
007
0.26
13 ±
0.0
000
0.08
94 ±
0.0
127
0.18
93 ±
0.0
044
Rt.G
R-I
T 0.
3116
± 0
.000
4 0.
0001
± 0
.000
0 0.
2861
± 0
.002
2 0.
2718
± 0
.000
9 0.
2973
± 0
.000
0 0.
1364
± 0
.015
0 0.
2660
± 0
.001
6
Ave
rage
val
ue
0.36
93
0.03
45
0.23
05
0.29
57
0.35
35
0.10
20
0.28
19

112 J. Liang et al.
Table 6 Clustering results of different algorithms with respect to NMI
Dat
aset
s EN
CA
CO
+ S
L C
O +
CL
CO
+ A
L C
SPA
HG
PA
MC
LA
MF
0.85
92 ±
0.0
001
0.03
47 ±
0.0
000
0.71
03 ±
0.0
017
0.81
70 ±
0.0
002
0.85
17 ±
0.0
004
0.00
01 ±
0.0
773
0.84
43 ±
0.0
003
IS
0.61
78 ±
0.0
006
0.60
05 ±
0.0
000
0.46
00 ±
0.0
029
0.56
55 ±
0.0
003
0.57
83 ±
0.0
004
0.27
49 ±
0.0
063
0.48
30 ±
0.0
012
Rt.S
P-EN
0.
3320
± 0
.000
7 0.
0337
± 0
.000
2 0.
3114
± 0
.000
6 0.
2975
± 0
.000
7 0.
3273
± 0
.034
3 0.
1515
± 0
.004
2 0.
2283
± 0
.002
0 R
t.EN
-FR
0.
3354
± 0
.000
0 0.
2227
± 0
.000
7 0.
2744
± 0
.001
8 0.
3086
± 0
.000
9 0.
2647
± 0
.000
0 0.
0308
± 0
.002
2 0.
1501
± 0
.011
8 R
t.IT-
SP
0.35
05 ±
0.0
000
0.00
58 ±
0.0
000
0.28
08 ±
0.0
006
0.26
51 ±
0.0
001
0.35
16 ±
0.0
000
0.20
23 ±
0.0
016
0.30
33 ±
0.0
013
Rt.F
R-G
R
0.44
61
± 0.
0004
0.
0063
± 0
.000
0 0.
4180
± 0
.001
3 0.
4231
± 0
.001
0 0.
3781
± 0
.000
0 0.
1292
± 0
.026
5 0.
3890
± 0
.006
5 R
t.GR
-IT
0.41
09 ±
0.0
000
0.02
00 ±
0.0
004
0.37
87 ±
0.0
005
0.38
79 ±
0.0
003
0.41
83 ±
0.0
000
0.18
44 ±
0.0
255
0.39
52 ±
0.0
005
Ave
rage
val
ue
0.47
88
0.13
20
0.40
48
0.43
78
0.45
29
0.13
90
0.39
90
Multi-view data ensemble clustering: a cluster-level perspective 113
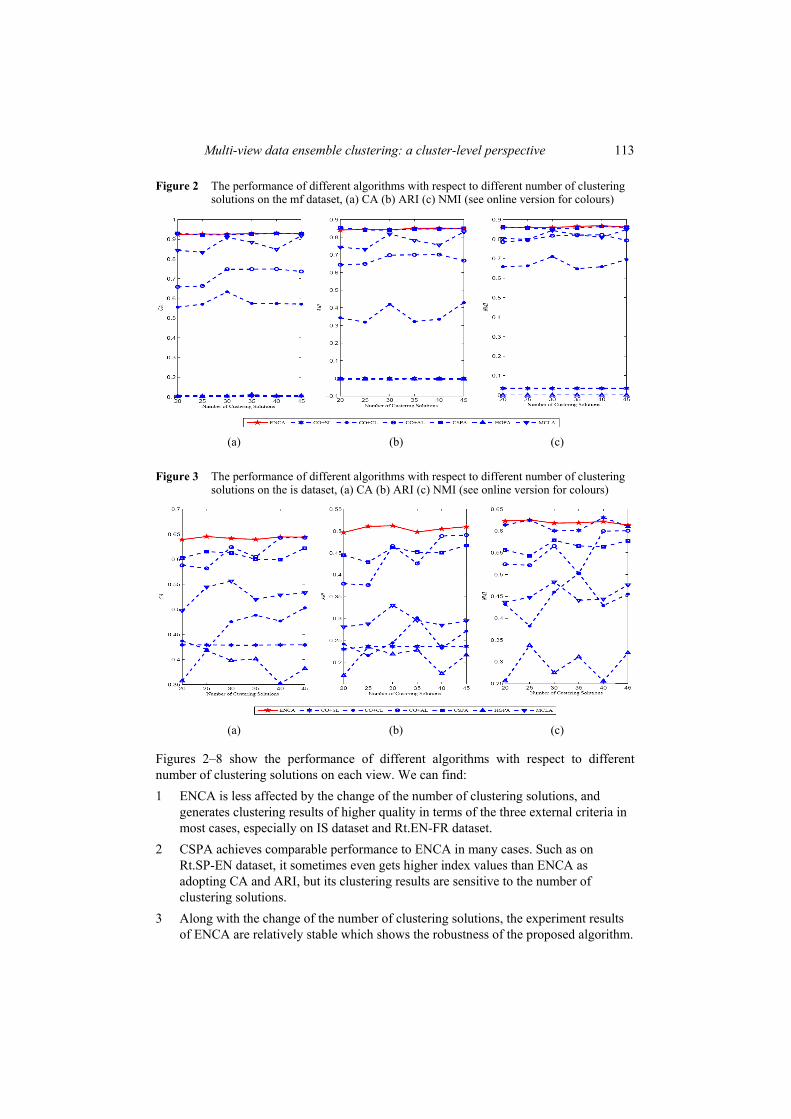
Figure 2 The performance of different algorithms with respect to different number of clustering solutions on the mf dataset, (a) CA (b) ARI (c) NMI (see online version for colours)
(a) (b) (c)
Figure 3 The performance of different algorithms with respect to different number of clustering solutions on the is dataset, (a) CA (b) ARI (c) NMI (see online version for colours)
(a) (b) (c)
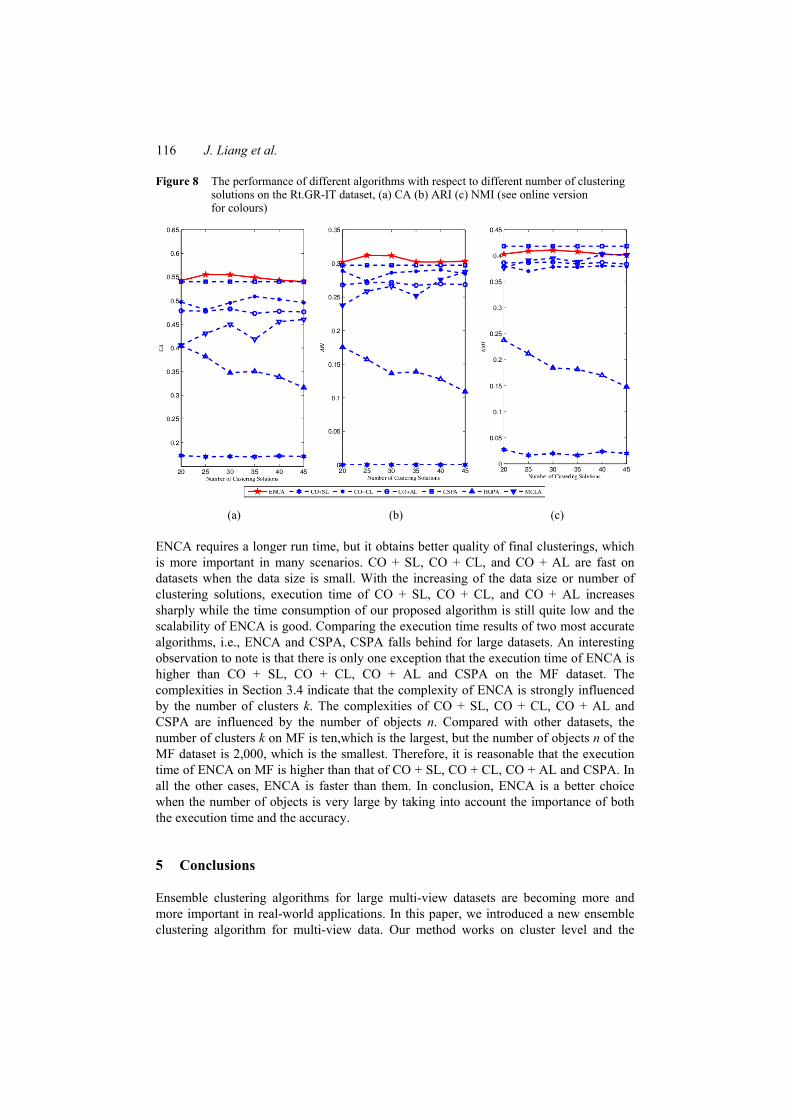
Figures 2–8 show the performance of different algorithms with respect to different number of clustering solutions on each view. We can find: 1 ENCA is less affected by the change of the number of clustering solutions, and
generates clustering results of higher quality in terms of the three external criteria in most cases, especially on IS dataset and Rt.EN-FR dataset.
2 CSPA achieves comparable performance to ENCA in many cases. Such as on Rt.SP-EN dataset, it sometimes even gets higher index values than ENCA as adopting CA and ARI, but its clustering results are sensitive to the number of clustering solutions.
3 Along with the change of the number of clustering solutions, the experiment results of ENCA are relatively stable which shows the robustness of the proposed algorithm.

114 J. Liang et al.
Figure 4 The performance of different algorithms with respect to different number of clustering solutions on the Rt.SP-EN dataset, (a) CA (b) ARI (c) NMI (see online version for colours)
(a) (b) (c)
Figure 5 The performance of different algorithms with respect to different number of clustering solutions on the Rt.EN-FR dataset, (a) CA (b) ARI (c) NMI (see online version for colours)
(a) (b) (c)
4.4.2 Efficiency analysis
Figure 9 shows the average execution time results in the ensemble stage of ensemble clustering algorithms with respect to different number of clustering solutions on each view. There exist a trade off between the run time and the accuracy. For example, although HGPA and MCLA are the most efficient methods, the results obtained by these two algorithms are not as satisfactory as ENCA and CSPA, which is illustrated in above experiments. That’s because HGPA and MCLA also work on cluster level, HGPA only uses clusters to construct hyperedge and MCLA computes similarity between two

Multi-view data ensemble clustering: a cluster-level perspective 115
clusters by simply using the binary Jaccard measure which is not as complex as ENCA. HGPA and MCLA out perform other ensemble clustering algorithms in terms of running time but sacrificing effectiveness.
Figure 6 The performance of different algorithms with respect to different number of clustering solutions on the Rt.IT-SP dataset, (a) CA (b) ARI (c) NMI (see online version for colours)
(a) (b) (c)
Figure 7 The performance of different algorithms with respect to different number of clustering solutions on the Rt.FR-GR dataset, (a) CA (b) ARI (c) NMI (see online version for colours)
(a) (b) (c)
116 J. Liang et al.
Figure 8 The performance of different algorithms with respect to different number of clustering solutions on the Rt.GR-IT dataset, (a) CA (b) ARI (c) NMI (see online version for colours)
(a) (b) (c)
ENCA requires a longer run time, but it obtains better quality of final clusterings, which is more important in many scenarios. CO + SL, CO + CL, and CO + AL are fast on datasets when the data size is small. With the increasing of the data size or number of clustering solutions, execution time of CO + SL, CO + CL, and CO + AL increases sharply while the time consumption of our proposed algorithm is still quite low and the scalability of ENCA is good. Comparing the execution time results of two most accurate algorithms, i.e., ENCA and CSPA, CSPA falls behind for large datasets. An interesting observation to note is that there is only one exception that the execution time of ENCA is higher than CO + SL, CO + CL, CO + AL and CSPA on the MF dataset. The complexities in Section 3.4 indicate that the complexity of ENCA is strongly influenced by the number of clusters k. The complexities of CO + SL, CO + CL, CO + AL and CSPA are influenced by the number of objects n. Compared with other datasets, the number of clusters k on MF is ten,which is the largest, but the number of objects n of the MF dataset is 2,000, which is the smallest. Therefore, it is reasonable that the execution time of ENCA on MF is higher than that of CO + SL, CO + CL, CO + AL and CSPA. In all the other cases, ENCA is faster than them. In conclusion, ENCA is a better choice when the number of objects is very large by taking into account the importance of both the execution time and the accuracy.
5 Conclusions
Ensemble clustering algorithms for large multi-view datasets are becoming more and more important in real-world applications. In this paper, we introduced a new ensemble clustering algorithm for multi-view data. Our method works on cluster level and the

Multi-view data ensemble clustering: a cluster-level perspective 117
number of clusters is usually far smaller than the number of objects. Therefore, the efficiency of the proposed algorithm is high for large-scale datasets clustering. To demonstrate the effectiveness and efficiency of the proposed algorithm, a serial of experiments are conducted on several multi view datasets in terms of three benchmark evaluation measures. The results show that the proposed algorithm outperforms the other traditional ensemble clustering algorithms for multi-view data by taking into account the importance of both the execution time and the accuracy.
Figure 9 Running time comparison of different clustering algorithms, (a) MF (b) IS (c) Rt.SP−EN (d) Rt.EN−FR (e) Rt.IT−SP (f) Rt.FR−GR (g) Rt.GR−IT (see online version for colours)
(a) (b) (c)
(a) (b) (c) (d)
118 J. Liang et al.
Acknowledgements
This work was supported by National Natural Science Fund of China (Nos. 61432011, 61603230, U1435212), the Natural Science Foundation of Shanxi Province (No. 201601D202039), and the Graduate Education Innovation Project of Shanxi Province (2016SY002).
References Amini, M., Usunier, N. and Goutte, C. (2009) ‘Learning from multiple partially observed views-an
application to multilingual text categorization’, in Proceedings of the 16th International Conference on Neural Information Processing, pp.28–36, Bangkok, Thailand.
Bickel, S. and Scheffere, T. (2004) ‘Multi-view clustering’, in Proceedings of the 4th IEEE International Conference on Data Mining Workshops, Washington, USA, pp.19–26.
Boulis, C. and Ostendorf, M. (2004) Combining Multiple Clustering Systems, Vol. 3202, pp.63–74, Springer, Berlin Heidelberg.
Chung, C.H. and Dai, B.R. (2013) ‘A fragment-based iterative consensus clustering algorithm with a robust similarity’, Knowledge and Information Systems, Vol. 41, No. 3, pp.591–609.
Cleuziou, G., Exbrayat, M., Martin, L. and Sublemontier, J.H. (2009) ‘CoFKM: a centralized method for multiple-view clustering’, in Proceedings of the 9th IEEE International Conference on Data Mining, pp.752–757, Miami, Florida, USA.
Cost, S. and Salzberg, S. (1993) ‘A weighted nearest neighbor algorithm for learning with symbolic features’, Machine Learning, Vol. 10, No. 1, pp.57–78.
Fern, X.Z. and Brodley, C.E. (2003) ‘Random projection for high dimensional data clustering: a cluster ensemble approach’, in Proceedings of 20th International Conference on Machine Learning, pp.186–193, Washington, DC, USA.
Fern, X.Z. and Brodley, C.E. (2004) ‘Solving cluster ensemble problems by bipartite graph partitioning’, in Proceedings of 21st International Conference on Machine Learning, pp.36–43, Banff, Alberta, Canada.
Fred, A.L. and Jain, A.K. (2005) ‘Combining multiple clusterings using evidence accumulation’, IEEE Transactions on Pattern Analysis and Machine Intelligence, Vol. 27, No. 6, pp.835–850.
Ghosh, J. and Acharya, A. (2011) ‘Cluster ensembles’, Wiley Interdisciplinary Reviews: Data Mining and Knowledge Discovery, Vol. 1, No. 4, pp.305–315.
Han, J.W. and Kamber, M. and Pei J. (2011) Data Mining Concepts and Techniques, 3rd ed., Elsevier Inc., Netherlands.
Huang, D., Lai, J.H. and Wang, C.D. (2013) ‘Exploiting the wisdom of crowd: a multi-granularity approach to clustering ensemble’, in Sun, C., Fang, F., Zhou, Z.H., Yang, W. and Liu, Z.Y. (Eds.): Intelligence Science and Big Data Engineering. IScIDE 2013. Lecture Notes in Computer Science, Vol. 8261, Springer, Berlin, Heidelberg.
Huang, H.C., Chuang, Y.Y. and Chen, C.S. (2012) ‘Multiple kernel fuzzy clustering’, IEEE Transactions Fuzzy System, Vol. 20, No. 1, pp.120–134.
Huang, Z.X. (1998) ‘Extensions to the k-means algorithm for clustering large data sets with categorical values’, Data Mining and Knowledge Discovery, Vol. 2, No. 3, pp.283–304.
Hubert, L. and Arabie, P. (1985) ‘Comparing partitions’, Journal of Classification, Vol. 2, No. 1, pp.193–218.
Iam-On, N. and Boongoen, T. (2015) ‘Comparative study of matrix refinement approaches for ensemble clustering’, Machine Learning, Vol. 98, Nos. 1/2, pp.269–300.
Iam-on, N., Boongoen, T. and Garrett, S. (2010) ‘LCE: a link-based cluster ensemble method for improved gene expression data analysis’, Bioinformatics, Vol. 26, No. 12, pp.1513–1519.
Multi-view data ensemble clustering: a cluster-level perspective 119
Jain, A.K. (2010) ‘Data clustering: 50 years beyondK-means’, Pattern Recognition Letters, Vol. 31, No. 8, pp.651–666.
Karypis, G. and Kumar, V. (1998) ‘Multilevel k-way partitioning scheme for irregular graphs’, Journal of Parallel and Distributed Computing, Vol. 48, No. 1, pp.96–129.
Karypis, G., Aggarwal, R., Kumar, V. and Shekhar, S. (1999) ‘Multilevel hypergraph partitioning: Applications in VLSI domain’, IEEE Transactions Very Large Scale Integration Systems, Vol. 7, No. 1, pp.69–79.
Li, G.X., Chang, K.Y. and Hoi, S.C.H. (2012) ‘Multi-view semi-supervised learning with consensus’, IEEE Transactions on Knowledge and Data Engineering, Vol. 24, No. 11, pp.2040–2051.
Liang, J.Y., Bai, L., Dang, C.Y. and Cao, F.Y. (2012a) ‘The k-means-type algorithms versus imbalanced data distributions’, IEEE Transactions on Fuzzy Systems, Vol. 20, No. 4, pp.728–745.
Liang, J.Y., Zhao, X.W., Li, D.Y., Cao, F.Y. and Dang, C.Y. (2012b) ‘Determining the number of clusters using information entropy for mixed data’, Pattern Recognition, Vol. 45, No. 6, pp.2251–2265.
Macqueen, J. (1967) ‘Some methods for classification and analysis of multivariate observations’, in Proceedings of the 5th Berkeley Symposium on Mathematical Statistics and Probability, pp.281–297, Berkeley, California.
Mimaroglu, S. and Aksehirli, E. (2011) ‘DICLENS: divisive clustering ensemble with automatic cluster number’, IEEE/ACM Transactions on Computational Biology and Bioinformatics, Vol. 9, No. 2, pp.408–420.
Ng, A.Y., Jordan, M.I. and Weiss, Y. (2001) ‘On spectral clustering: analysis and an algorithm’, Advances in Neural Information Processing Systems, Vol. 14, pp.849–856.
Nguyen, N. and Caruana, R. (2007) ‘Consensus clusterings’, in Proceedings of IEEE 7th International Conference on Data Mining, pp.607–612, Omaha, Nebraska, USA.
Pan, S., Wu, J., Zhu, X. and Zhang, C. (2015) ‘Graph ensemble boosting for imbalanced noisy graph stream classification’, IEEE Transactions on Cybernetics, Vol. 45, No. 5, pp.954–968.
Rana, S., Jasola, S. and Kumar, R. (2013) ‘A boundary restricted adaptive particle swarm optimization for data clustering’, International Journal of Machine Learning and Cybernetics, Vol. 4, No. 4, pp.391–400.
Strehl, A. and Ghosh, J. (2002) ‘Cluster ensembles: a knowledge reuse framework for combining multiple partitions’, Journal of Machine Learning Research, Vol. 3, pp.583–617.
Terrades, O.R., Valveny, E. and Tabbone, S. (2009) ‘Optimal classifier fusion in a nonbayesian probabilistic framework’, IEEE Transactions on Pattern Analysis and Machine Intelligence, Vol. 31, No. 9, pp.1630–644.
Topchy, A., Jain, A.K. and Punch, W. (2003) ‘Combining multiple weak clusterings’, in Proceedings of IEEE 3rd International Conference on Data Mining, Melbourne, Florida, USA, pp.331–338.
Topchy, A.P., Jain, A.K. and Punch, W.F. (2005) ‘Clustering ensembles: models of consensus and weak partitions’, IEEE Transactions on Pattern Analysis and Machine Intelligence, Vol. 27, No. 12, pp.1866–1881.
Tzortzis, G. and Likas, C. (2010) ‘Multiple view clustering using a weighted combination of exemplar-basedmixturemodels’, IEEE Transactions on Neural Networks, Vol. 21, No. 12, pp.1925–1938.
UCI Machine Learning Repository [online] http://archive.ics.uci.edu/ml (17 January 2017). Valentini, G. (2007) ‘Mosclust: a software library for discovering significant structures in
bio-molecular data’, Bioinformatics, Vol. 23, No. 3, pp.387–389. Wang, C., Cao, L., Wang, M., Li, J., Wei, W., and Ou, Y. (2011) ‘Coupled nominal similarity in
unsupervised learning’, in Proceedings of the 20th ACM International Conference on Information and Knowledge Management, pp.973–978, New York, USA.
120 J. Liang et al.
Wang, C., She, Z. and Cao, L.B. (2013) ‘Coupled clustering ensemble: incorporating coupling relationships both between base clusterings and objects’, in Proceedings of IEEE 29th International Conference on Data Engineering, pp.374–385, Brisbane, Australia.
Wu, O., Hu, W., Maybank, S.J., Zhu, M. and Li, B. (2012) ‘Efficient clustering aggregation based on data fragments’, IEEE Transactions on Systems Man and Cybernetics Part B, Vol. 42, No. 3, pp.913–926.
Xu, R. and Wunsch, D. (2005) ‘Survey of clustering algorithm’, IEEE Transactions on Neural Networks, Vol. 16, No. 3, pp.645–678.
Yu, Z. W., Li, L., Wong, H.-S., You, J., Han, G. Q., Gao, Y. J. and Yu, G. X. (2014) ‘Probabilistic cluster structure ensemble’, Information Science, Vol. 267, pp.16-34.
Yu, Z.W., You, J., Wong, H-S. and Han, G.Q. (2012) ‘From cluster ensemble to structure ensemble’, Information Science, Vol. 198, pp.81–99.
Zhang, L. and Suganthan, P.N. (2015) ‘Oblique decision tree ensemble via multisurface proximal support vector machine’, IEEE Transactions on Cybernetics, Vol. 45, No. 10, pp.2165–2176.
Zhao, X.W., Liang, J.Y. and Dang, C.Y. (2017) ‘Clustering ensemble selection for categorical data based on internal validity indices’, Pattern Recognition, Vol. 69, pp.150–168.
Related Documents