Journal of Chromatography A, 1270 (2012) 28–40 Contents lists available at SciVerse ScienceDirect Journal of Chromatography A j our na l ho me p ag e: www.elsevier.com/locate/chroma Multi-mycotoxin analysis in wheat semolina using an acetonitrile-based extraction procedure and gas chromatography–tandem mass spectrometry Yelko Rodríguez-Carrasco, Houda Berrada ∗ , Guillermina Font, Jordi Ma˜ nes University of Valencia, Department of Food Science, Av. Vicent Andrés Estellés s/n, 46100 Burjassot, Spain a r t i c l e i n f o Article history: Received 5 October 2012 Received in revised form 29 October 2012 Accepted 30 October 2012 Available online 5 November 2012 Keywords: Multi-mycotoxin QuEChERS GC–MS/MS Triple quadrupole Wheat a b s t r a c t A new analytical method for the rapid and simultaneous determination of ten mycotoxins including patulin, zearalenone and eight trichothecenes (nivalenol, fusarenon-X, diacetoxyscirpenol, 3-acetyl- deoxynivalenol, neosolaniol, deoxynivalenol, T-2 and HT-2) in wheat semolina has been developed and optimized. Sample extraction and purification were performed with a modified QuEChERS-based (acronym of Quick, Easy, Cheap, Effective, Rugged and Safe) procedure and determined by gas chro- matography (GC) coupled to triple quadrupole instrument (QqQ). This is the first paper on the application of GC–QqQ-MS/MS to analysis of mycotoxins. Careful optimization of the gas chromatography–tandem mass spectrometry parameters was achieved in order to attain a fast separation with the best sensitivity allowing a total run time of 16 min. The validation was performed by analyzing recovery samples at three different spiked concentrations, 20, 40 and 80 g kg −1 , with four replicates (n = 4) at each concentration. Recoveries ranged from 74% to 124% and the intra-day precision and inter-day precision, expressed as relative standard deviation, were lower than 13% and 17%, respectively for all studied compounds, except for zearalenone. Limits of quantification (LOQ) were lower than 10 g kg −1 for all studied mycotoxins. Eight concentration levels were used for constructing the calibration curves which showed good linear- ity between LOQ and 100 times LOQ concentration levels (linear range). Matrix-matched calibration for applying the method in routine analysis is recommended for reliable quantitative results. The method validated was successfully applied to fifteen wheat semolina samples detecting occurrence of mycotoxins at concentrations below the maximum permissible level. © 2012 Elsevier B.V. All rights reserved. 1. Introduction Food contamination with toxigenic molds has attracted increas- ing attention especially over the past decade. Most grain, such as wheat, maize and rice, can be infested by filamentous and micro- scopic fungi which can produce a wide range of mycotoxins. Myco- toxins are defined as secondary metabolites produced by a variety of fungi e.g. Fusarium, Aspergillus, Alternaria, Penicillium, Claviceps, etc. under appropriate circumstances. Some of the mycotoxins can have carcinogenic, mutagenic or teratogenic properties, and thus the occurrence of mycotoxins in agricultural commodities has been long recognized as a potential hazard for both human and animal health [1]. Usually, exposure is through consumption of contami- nated food and feed, which causes diseases known as mycotoxicosis [2]. It was shown that toxin concentration and visible infection may not correlate in every case, and mycotoxins can be present in com- modities without being able to detect fungi associated with the toxins and vice versa. Hence, urgent measures such as continuous ∗ Corresponding author. Tel.: +34 963544958; fax: +34 963544954. E-mail address: [email protected] (H. Berrada). monitoring and regulation of maximum mycotoxin levels in food products and commodities have been set in several countries [3]. A variety of Fusarium molds produce a number of different toxins, such as trichothecenes and zearalonene (Table 1). Trichothecenes are a family of closed related sesquiterpenoids and according to their characteristic functional groups are divided into four groups (A–D). Type A trichothecenes are represented by HT-2 and T-2 tox- ins as well as by diacetoxyscirpenol (DAS) and neosolaniol (NEO). Type B trochothecenes is most frequently represented by deoxyni- valenol (DON) and for its derivates 3-acetyl-deoxynivalenol (3-ADON) and 15-acetyl-deoxynivalenol (15-ADON) together with other type B trichothecenes such as fusarenon-X (FUS-X) and nivalenol (NIV). They are immunosuppressive compounds which inhibit the synthesis of protein and may cause tissue necrosis, hemorrhage throughout the digestive tract, depression of blood regenerative processes in the marrow and spleen, changes in repro- ductive organs, diarrhea, vomiting, reduced feed intake, weight loss, abortion and death [4,5]. Regarding zearalenone (ZON), it is an estrogenic compound which causes hyperestrogenism and a variety of symptoms, such as decreasing fertility or increasing embryolethal resorptions in livestock and could be an important etiologic agent of intoxication in young children [6]. Other molds, 0021-9673/$ – see front matter © 2012 Elsevier B.V. All rights reserved. http://dx.doi.org/10.1016/j.chroma.2012.10.061

Welcome message from author
This document is posted to help you gain knowledge. Please leave a comment to let me know what you think about it! Share it to your friends and learn new things together.
Transcript
Me
YU
a
ARRAA
KMQGTW
1
iwstoehtlhn[nmt
0h
Journal of Chromatography A, 1270 (2012) 28– 40
Contents lists available at SciVerse ScienceDirect
Journal of Chromatography A
j our na l ho me p ag e: www.elsev ier .com/ locate /chroma
ulti-mycotoxin analysis in wheat semolina using an acetonitrile-basedxtraction procedure and gas chromatography–tandem mass spectrometry
elko Rodríguez-Carrasco, Houda Berrada ∗, Guillermina Font, Jordi Manesniversity of Valencia, Department of Food Science, Av. Vicent Andrés Estellés s/n, 46100 Burjassot, Spain
r t i c l e i n f o
rticle history:eceived 5 October 2012eceived in revised form 29 October 2012ccepted 30 October 2012vailable online 5 November 2012
eywords:ulti-mycotoxinuEChERSC–MS/MSriple quadrupoleheat
a b s t r a c t
A new analytical method for the rapid and simultaneous determination of ten mycotoxins includingpatulin, zearalenone and eight trichothecenes (nivalenol, fusarenon-X, diacetoxyscirpenol, 3-acetyl-deoxynivalenol, neosolaniol, deoxynivalenol, T-2 and HT-2) in wheat semolina has been developedand optimized. Sample extraction and purification were performed with a modified QuEChERS-based(acronym of Quick, Easy, Cheap, Effective, Rugged and Safe) procedure and determined by gas chro-matography (GC) coupled to triple quadrupole instrument (QqQ). This is the first paper on the applicationof GC–QqQ-MS/MS to analysis of mycotoxins. Careful optimization of the gas chromatography–tandemmass spectrometry parameters was achieved in order to attain a fast separation with the best sensitivityallowing a total run time of 16 min. The validation was performed by analyzing recovery samples at threedifferent spiked concentrations, 20, 40 and 80 �g kg−1, with four replicates (n = 4) at each concentration.Recoveries ranged from 74% to 124% and the intra-day precision and inter-day precision, expressed asrelative standard deviation, were lower than 13% and 17%, respectively for all studied compounds, except
−1
for zearalenone. Limits of quantification (LOQ) were lower than 10 �g kg for all studied mycotoxins.Eight concentration levels were used for constructing the calibration curves which showed good linear-ity between LOQ and 100 times LOQ concentration levels (linear range). Matrix-matched calibration forapplying the method in routine analysis is recommended for reliable quantitative results. The methodvalidated was successfully applied to fifteen wheat semolina samples detecting occurrence of mycotoxinsat concentrations below the maximum permissible level.. Introduction
Food contamination with toxigenic molds has attracted increas-ng attention especially over the past decade. Most grain, such as
heat, maize and rice, can be infested by filamentous and micro-copic fungi which can produce a wide range of mycotoxins. Myco-oxins are defined as secondary metabolites produced by a varietyf fungi e.g. Fusarium, Aspergillus, Alternaria, Penicillium, Claviceps,tc. under appropriate circumstances. Some of the mycotoxins canave carcinogenic, mutagenic or teratogenic properties, and thushe occurrence of mycotoxins in agricultural commodities has beenong recognized as a potential hazard for both human and animalealth [1]. Usually, exposure is through consumption of contami-ated food and feed, which causes diseases known as mycotoxicosis2]. It was shown that toxin concentration and visible infection may
ot correlate in every case, and mycotoxins can be present in com-odities without being able to detect fungi associated with theoxins and vice versa. Hence, urgent measures such as continuous
∗ Corresponding author. Tel.: +34 963544958; fax: +34 963544954.E-mail address: [email protected] (H. Berrada).
021-9673/$ – see front matter © 2012 Elsevier B.V. All rights reserved.ttp://dx.doi.org/10.1016/j.chroma.2012.10.061
© 2012 Elsevier B.V. All rights reserved.
monitoring and regulation of maximum mycotoxin levels in foodproducts and commodities have been set in several countries [3].A variety of Fusarium molds produce a number of different toxins,such as trichothecenes and zearalonene (Table 1). Trichothecenesare a family of closed related sesquiterpenoids and according totheir characteristic functional groups are divided into four groups(A–D). Type A trichothecenes are represented by HT-2 and T-2 tox-ins as well as by diacetoxyscirpenol (DAS) and neosolaniol (NEO).Type B trochothecenes is most frequently represented by deoxyni-valenol (DON) and for its derivates 3-acetyl-deoxynivalenol(3-ADON) and 15-acetyl-deoxynivalenol (15-ADON) together withother type B trichothecenes such as fusarenon-X (FUS-X) andnivalenol (NIV). They are immunosuppressive compounds whichinhibit the synthesis of protein and may cause tissue necrosis,hemorrhage throughout the digestive tract, depression of bloodregenerative processes in the marrow and spleen, changes in repro-ductive organs, diarrhea, vomiting, reduced feed intake, weightloss, abortion and death [4,5]. Regarding zearalenone (ZON), it
is an estrogenic compound which causes hyperestrogenism anda variety of symptoms, such as decreasing fertility or increasingembryolethal resorptions in livestock and could be an importantetiologic agent of intoxication in young children [6]. Other molds,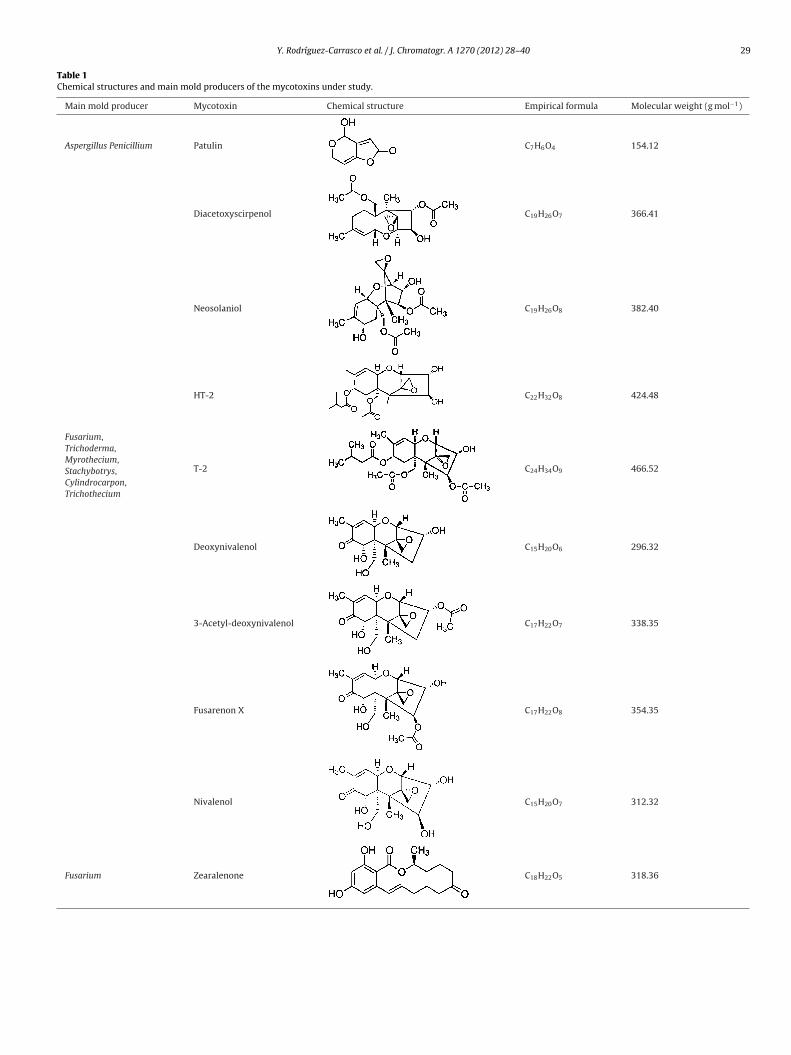
Y. Rodríguez-Carrasco et al. / J. Chromatogr. A 1270 (2012) 28– 40 29
Table 1Chemical structures and main mold producers of the mycotoxins under study.
Main mold producer Mycotoxin Chemical structure Empirical formula Molecular weight (g mol−1)
Aspergillus Penicillium Patulin C7H6O4 154.12
Fusarium,Trichoderma,Myrothecium,Stachybotrys,Cylindrocarpon,Trichothecium
Diacetoxyscirpenol C19H26O7 366.41
Neosolaniol C19H26O8 382.40
HT-2 C22H32O8 424.48
T-2 C24H34O9 466.52
Deoxynivalenol C15H20O6 296.32
3-Acetyl-deoxynivalenol C17H22O7 338.35
Fusarenon X C17H22O8 354.35
Nivalenol C15H20O7 312.32
Fusarium Zearalenone C18H22O5 318.36

3 . Chro
adowtAvCa
naielmttAmocseubiqmawsaiGmclclpcttt
mdtiqcspau[semmi
emd
0 Y. Rodríguez-Carrasco et al. / J
s Aspergillus and Penicillium, also can colonize grains and pro-uce mycotoxins. Patulin (PAT) is produced by different speciesf Penicillium, Aspergillus, and Byssochlamys (Table 1). The mostidespread among these fungi, Penicillium expansum, is known
o invade fruits, berries, vegetables, bread and meat products [7].cute symptoms of patulin consumption can include agitation, con-ulsions, edema, ulceration, intestinal inflammation and vomiting.hronic health effects of patulin were observed in experimentalnimals, while its effects on humans are not clear yet [8].
The importance of food quality control is widely recognizedowadays to assure the compliance of regulation of these productsnd guarantee the consumers health. The presence of mycotox-ns in food is a matter of concern. For this reason, strict legislationxists at European Union (EU) level that establishes maximumevels. To ensure both regulatory levels, mass spectrometric deter-
ination and maximum levels fixed by EU, as well as to assesshe toxicological risk for humans, the use of an analytical methodhat has been proved to generate reliable results is required.dditionally, there is a growing demand to reinforce the use ofulti-mycotoxin methods to reduce time-frames and increase
verall throughput [9]. In this way, for official food control, both gashromatography and liquid chromatography coupled with masspectrometry using different analyzers offer several advantagesnabling analysis of complex samples. Over the last few years, liq-id chromatography–tandem mass spectrometry (LC–MS/MS) hasecome the most extensively used analytical method for mycotox-
ns belonging to different chemical families enabling their efficientuantitative determination in several food commodities. GC–MSethods offer a narrower analytical scope allowing simultaneously
very useful and relatively inexpensive analytical performanceith some clear advantages as lower detection limits and greater
electivity [10–13]. In the multistage tandem mass spectrometricnalysis, ion trap is selected for the fragmentation behavior stud-es acquiring information about the product ions [14,15] whileC-TOF is used as novel technique, for accurate mass measure-ents based on the extract masses [16]. The coupling of gas
hromatography with a triple quadrupole mass spectrometer ana-yzer is a potent analytical tool for the determination of trace foodontaminants in foodstuffs [17–19]. The use of triple quadrupoleeads the possibility of adequate selection of precursor and ionroducts to reduce chemical noise in the chromatograms [20]. Spe-ial attention was devoted in this paper to the optimization ofriple quadrupole operating parameters because to our knowledgehere are a scarce detailed specification and discussion on settingshese parameters.
The development of multi-mycotoxin methods with one com-on sample preparation and a single final determination is highly
esirable. In this regard, the most critical step is the extrac-ion that should allow good recoveries for all mycotoxins undernvestigation in a specific food matrix. The technique most fre-uently reported in the literature is solvent extraction but in manyases, is not selective enough to comply with the needs of foodafety and regulations and is coupled with a clean up on a solidhase extraction (SPE) column [21]. Extraction techniques suchs matrix solid phase dispersion (MSPD) [22,23], pressurized liq-id extraction (PLE) [24,25], solid-phase microextraction (SPME)26], molecular imprinted polymers (MIPs) [27,28] and disper-ive liquid–liquid microextraction (DLLME) [29] have been widelymployed to achieve extraction and clean up during the deter-ination of multiresidue and multiclass compounds in differentatrices requiring less organic solvent and in general yielded sat-
sfactory results.
Recently, QuEChERS extraction procedure has been frequentlymployed as a sample preparation methodology for multiresidueycotoxin analysis, and has been modified and validated for the
etection of a broad range of pollutants in food, including acidic and
matogr. A 1270 (2012) 28– 40
basic ones [25,30–33]. The original QuEChERS method developedby Anastassiades et al. [34] consists of initial extraction with ace-tonitrile, followed by partitioning after the addition of adequatelymixed salts (anhydrous magnesium sulfate and sodium chloride),after which the extract is subjected to dispersive solid-phaseextraction (d-SPE) followed by clean up with primary secondaryamine and anhydrous magnesium sulfate. However, many mod-ifications have been introduced, such as buffering the extractionmedium with an acetate [35] or citrate buffer [36], or changes inthe extraction solutions [37] in order to extract a wide range ofcompounds as was reported by Romero-González et al. [38] whooptimized a QuEChERS-based extraction for more than 90 com-pounds. This technique has many advantages as the fastness andthe high simple throughput, the smaller volumes of no chlorinatedorganic solvents used and the good recoveries obtained.
To the best of our knowledge, up to now no paper hasbeen reported on the application of GC–QqQ-MS/MS for thedetermination of mycotoxins in food samples. In this paper, amulti-mycotoxin method based on QuEChERS extraction and usingGC–MS/MS analysis with triple quadrupole for detection, quan-tification and reliable identification of the analytes present in thesamples, was developed and validated in order to attain the legallimits established by EU regulation for these mycotoxins [39–41].An additional goal was to evaluate the occurrence of ten selectedmycotoxins in wheat semolina samples commercialized in Spain.
2. Materials and methods
2.1. Chemical and reagents
Solvents (acetonitrile, hexane and methanol) were purchasedfrom Merck KGaA (Darmstadt, Germany). Anhydrous magnesiumsulphate was obtained from Alfa Aesar GmbH & Co. (Karlsruhe,Germany); sodium chloride was purchased from Merck and C18was purchased from Phenomenex (Torrance, USA).
The derivatization reagent composed of BSA(N,O-bis(trimethylsilyl)acetamide) + TMCS (trimethylchlorosi-lane) + TMSI (N-trimethylsilyimidazole) (3:2:3) was purchasedfrom Supelco (Bellefonte, PA). Sodium dihydrogen phosphate anddisodium hydrogen phosphate, used to prepare phosphate buffer,were acquired from Panreac Quimica S.L.U. (Barcelona, Spain).
2.2. Analytical standards
The standards of patulin, zearalenone and the type A andB trichothecenes: deoxynivalenol, 3-acetyldeoxynivalenol, diace-toxyscirpenol, nivalenol, fusarenon-X, neosolaniol, T-2 and HT-2toxin were obtain from Sigma–Aldrich (St. Louis, USA). On theone hand, all stock solutions were prepared by dissolving 1 mg ofthe mycotoxin in 1 mL of pure methanol, obtaining a 1 mg mL−1
(1000 mg L−1) solution. On the other hand, the stock solutions werediluted with acetonitrile in order to obtain the appropriate multi-compounds working standard solutions. All standards were keptat −20 ◦C.
2.3. GC–QqQ-MS/MS conditions
Chromatographic determination was carried out using a GCsystem Agilent 7890A coupled with an Agilent 7000A triplequadrupole mass spectrometer with inert electron-impact ionsource and an Agilent 7693 autosampler (Agilent Technologies,Palo Alto, USA). The mass spectrometer was operated in electron
impact ionization (EI, 70 eV). The transfer line and source tempera-tures were 280 and 230 ◦C, respectively. The collision gas for MS/MSexperiments was nitrogen, and the helium was used as quench-ing gas, both at 99.999% purity supplied by Carburos Metálicos S.L.
Y. Rodríguez-Carrasco et al. / J. Chromatogr. A 1270 (2012) 28– 40 31
ethod
(A
×eiitipa
2
c(sa
2
2
iiaiotaSC
TSm
Fig. 1. Schematic flow of the procedure followed in the proposed m
Barcelona, Spain). Data were acquired and processed using thegilent Masshunter version B.04.00 software.
Analytes were separated on a HP-5MS 30 m × 0.25 mm 0.25 �m capillary column. One microliter of the final cleanxtract of mycotoxins was injected in splitless mode at 250 ◦Cn programmable temperature vaporization (PTV) inlet employ-ng helium as carrier gas at fixed pressure of 20.3 psi. The ovenemperature program was initially 80 ◦C, and the temperature wasncreased to 245 ◦C at 60 ◦C min−1. After a 3 min hold time, the tem-erature was increased to 260 ◦C at 3 ◦C min−1 and finally to 270 ◦Ct 10 ◦C min−1 and then held for 10 min.
.4. Sampling
A total of fifteen wheat semolina samples were randomly pur-hased in supermarkets located in Valencia Metropolitan AreaSpain). All samples were homogenized using a laboratory mill andtored in a dark and a dry place into specific plastic food containersnd analyzed within 2 days of sampling.
.5. Sample preparation
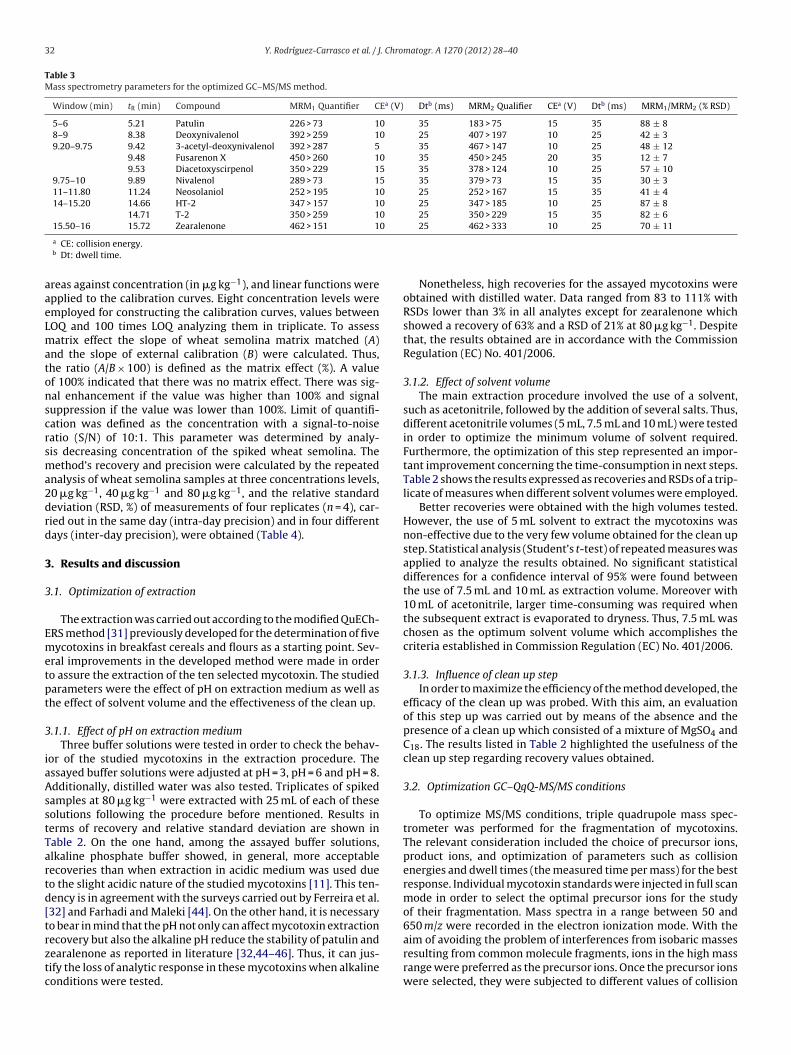
.5.1. Extraction and clean-upA schematic flow diagram of the QuEChERS procedure employed
s shown in Fig. 1A. 5 g of each homogenized sample were weighednto a 50 mL centrifuge tube and 25 mL of distilled water weredded prior to be sonicated for 15 min. The main extractionnvolved the addition of 7.5 mL of acetonitrile, 4 g of MgSO4 and 1 gf NaCl. To induce phase separation and mycotoxins partitioning,
he tube was shaken on a vortex for 30 s and centrifuged for 3 mint 4000 rpm. Then the upper layer was submitted to a dispersivePE clean up with a mixture of 900 mg of MgSO4 and 300 mg of18. The tube was vortexed for 30 s and centrifuged for 1 min atable 2tudy of the effect of pH in the medium, the volume of acetonitrile used and influence oycotoxins. Results expressed as recoveries ± % RSDs (n = 3).
Compound Buffered solution, %REC (RSD) Distilled water%REC (RSD)
Vo
pH = 3 pH = 6 pH = 8 V =
PAT 76 ± 7 59 ± 10 50 ± 4 96 ± 3
No
DON 46 ± 4 43 ± 2 67 ± 1 83 ± 1
3-ADON 92 ± 1 84 ± 1 97 ± 1 98 ± 1
FUS-X 65 ± 3 59 ± 5 96 ± 1 94 ± 1
DAS 107 ± 1 86 ± 1 106 ± 1 107 ± 2
NIV 53 ± 1 52 ± 5 91 ± 2 89 ± 2
NEO 79 ± 1 73 ± 2 91 ± 1 90 ± 2
HT-2 93 ± 2 58 ± 2 89 ± 2 85 ± 3
T-2 118 ± 2 86 ± 2 114 ± 1 111 ± 2
ZON 13 ± 15 31 ± 9 22 ± 19 63 ± 21
ology. (A) Extraction and clean up step, and (B) derivatization step.
1500 rpm. After purification the extract was transferred into a vialand evaporated to dryness under nitrogen flow.
2.5.2. DerivatizationThe dry extract was added with 50 �L of BSA + TMCS + TMSI
(3:2:3) and the sample was left for 30 min at room temperature.The derivatized sample was diluted to 250 �L with hexane andmixed thoroughly on a vortex for 30 s. Then the hexane was washedwith 1 mL of phosphate buffer (60 mM, pH 7) and mixed until theupper layer was clear. Finally, the hexane layer was transferred toan autosampler vial for the chromatographic analysis (Fig. 1B).
2.6. Method validation
Two MS/MS transitions were acquired for each mycotoxinreaching four identification points with a defined MRM transitionsratio for the developed method as is indicated in the requirementsfor mass spectrometry [42,43]. For each compound, the most abun-dant MRM transition was used for quantification while the othertransition was used for confirmation. The criteria applied to con-firm the identity of a mycotoxin were: (1) a signal for each of thetwo MRM transitions of the analyte had to be identical in the sampleand in the standard or matrix matched, obtaining four identificationpoints for each analyte; (2) the peak ratio of the confirmation tran-sition against quantification one should be within the establishedin Table 3; (3) the relative retention time of the analyte in both,sample and standard solution, should be as maximum difference of0.1 min.
Linearity and matrix effects were studied using standard solu-
tions and matrix matched calibrations. Matrix matched calibrationcurves were built by spiking blank samples with selected mycotox-ins before extraction. Both external calibration curves and matrixmatched calibration curves were constructed by plotting peakf the clean up as the optimization parameters in the extraction step of the studied
lume of solvent, %REC (RSD) Clean-up, %REC (RSD)
5 mL V = 7.5 mL V = 10 mL V = 7.5 mL V = 10 mL
n effective
87 ± 10 88 ± 17 93 ± 1 91 ± 777 ± 12 69 ± 16 86 ± 1 83 ± 678 ± 9 95 ± 10 86 ± 1 89 ± 689 ± 6 99 ± 14 88 ± 3 92 ± 899 ± 7 102 ± 19 95 ± 6 106 ± 991 ± 3 81 ± 9 92 ± 2 98 ± 1285 ± 6 96 ± 13 82 ± 5 94 ± 1681 ± 7 104 ± 29 84 ± 7 101 ± 17
107 ± 5 127 ± 31 106 ± 5 121 ± 1564 ± 40 87 ± 8 86 ± 11 93 ± 14
32 Y. Rodríguez-Carrasco et al. / J. Chromatogr. A 1270 (2012) 28– 40
Table 3Mass spectrometry parameters for the optimized GC–MS/MS method.
Window (min) tR (min) Compound MRM1 Quantifier CEa (V) Dtb (ms) MRM2 Qualifier CEa (V) Dtb (ms) MRM1/MRM2 (% RSD)
5–6 5.21 Patulin 226 > 73 10 35 183 > 75 15 35 88 ± 88–9 8.38 Deoxynivalenol 392 > 259 10 25 407 > 197 10 25 42 ± 39.20–9.75 9.42 3-acetyl-deoxynivalenol 392 > 287 5 35 467 > 147 10 25 48 ± 12
9.48 Fusarenon X 450 > 260 10 35 450 > 245 20 35 12 ± 79.53 Diacetoxyscirpenol 350 > 229 15 35 378 > 124 10 25 57 ± 10
9.75–10 9.89 Nivalenol 289 > 73 15 35 379 > 73 15 35 30 ± 311–11.80 11.24 Neosolaniol 252 > 195 10 25 252 > 167 15 35 41 ± 414–15.20 14.66 HT-2 347 > 157 10 25 347 > 185 10 25 87 ± 8
14.71 T-2 350 > 259 10 25 350 > 229 15 35 82 ± 60
aaeLmatonscrsma2drd
3
3
Emetpt
3
iaAsstTartd[trztc
15.50–16 15.72 Zearalenone 462 > 151 1
a CE: collision energy.b Dt: dwell time.
reas against concentration (in �g kg−1), and linear functions werepplied to the calibration curves. Eight concentration levels weremployed for constructing the calibration curves, values betweenOQ and 100 times LOQ analyzing them in triplicate. To assessatrix effect the slope of wheat semolina matrix matched (A)
nd the slope of external calibration (B) were calculated. Thus,he ratio (A/B × 100) is defined as the matrix effect (%). A valuef 100% indicated that there was no matrix effect. There was sig-al enhancement if the value was higher than 100% and signaluppression if the value was lower than 100%. Limit of quantifi-ation was defined as the concentration with a signal-to-noiseatio (S/N) of 10:1. This parameter was determined by analy-is decreasing concentration of the spiked wheat semolina. Theethod’s recovery and precision were calculated by the repeated
nalysis of wheat semolina samples at three concentrations levels,0 �g kg−1, 40 �g kg−1 and 80 �g kg−1, and the relative standardeviation (RSD, %) of measurements of four replicates (n = 4), car-ied out in the same day (intra-day precision) and in four differentays (inter-day precision), were obtained (Table 4).
. Results and discussion
.1. Optimization of extraction
The extraction was carried out according to the modified QuECh-RS method [31] previously developed for the determination of fiveycotoxins in breakfast cereals and flours as a starting point. Sev-
ral improvements in the developed method were made in ordero assure the extraction of the ten selected mycotoxin. The studiedarameters were the effect of pH on extraction medium as well ashe effect of solvent volume and the effectiveness of the clean up.
.1.1. Effect of pH on extraction mediumThree buffer solutions were tested in order to check the behav-
or of the studied mycotoxins in the extraction procedure. Thessayed buffer solutions were adjusted at pH = 3, pH = 6 and pH = 8.dditionally, distilled water was also tested. Triplicates of spikedamples at 80 �g kg−1 were extracted with 25 mL of each of theseolutions following the procedure before mentioned. Results inerms of recovery and relative standard deviation are shown inable 2. On the one hand, among the assayed buffer solutions,lkaline phosphate buffer showed, in general, more acceptableecoveries than when extraction in acidic medium was used dueo the slight acidic nature of the studied mycotoxins [11]. This ten-ency is in agreement with the surveys carried out by Ferreira et al.32] and Farhadi and Maleki [44]. On the other hand, it is necessaryo bear in mind that the pH not only can affect mycotoxin extraction
ecovery but also the alkaline pH reduce the stability of patulin andearalenone as reported in literature [32,44–46]. Thus, it can jus-ify the loss of analytic response in these mycotoxins when alkalineonditions were tested.25 462 > 333 10 25 70 ± 11
Nonetheless, high recoveries for the assayed mycotoxins wereobtained with distilled water. Data ranged from 83 to 111% withRSDs lower than 3% in all analytes except for zearalenone whichshowed a recovery of 63% and a RSD of 21% at 80 �g kg−1. Despitethat, the results obtained are in accordance with the CommissionRegulation (EC) No. 401/2006.
3.1.2. Effect of solvent volumeThe main extraction procedure involved the use of a solvent,
such as acetonitrile, followed by the addition of several salts. Thus,different acetonitrile volumes (5 mL, 7.5 mL and 10 mL) were testedin order to optimize the minimum volume of solvent required.Furthermore, the optimization of this step represented an impor-tant improvement concerning the time-consumption in next steps.Table 2 shows the results expressed as recoveries and RSDs of a trip-licate of measures when different solvent volumes were employed.
Better recoveries were obtained with the high volumes tested.However, the use of 5 mL solvent to extract the mycotoxins wasnon-effective due to the very few volume obtained for the clean upstep. Statistical analysis (Student’s t-test) of repeated measures wasapplied to analyze the results obtained. No significant statisticaldifferences for a confidence interval of 95% were found betweenthe use of 7.5 mL and 10 mL as extraction volume. Moreover with10 mL of acetonitrile, larger time-consuming was required whenthe subsequent extract is evaporated to dryness. Thus, 7.5 mL waschosen as the optimum solvent volume which accomplishes thecriteria established in Commission Regulation (EC) No. 401/2006.
3.1.3. Influence of clean up stepIn order to maximize the efficiency of the method developed, the
efficacy of the clean up was probed. With this aim, an evaluationof this step up was carried out by means of the absence and thepresence of a clean up which consisted of a mixture of MgSO4 andC18. The results listed in Table 2 highlighted the usefulness of theclean up step regarding recovery values obtained.
3.2. Optimization GC–QqQ-MS/MS conditions
To optimize MS/MS conditions, triple quadrupole mass spec-trometer was performed for the fragmentation of mycotoxins.The relevant consideration included the choice of precursor ions,product ions, and optimization of parameters such as collisionenergies and dwell times (the measured time per mass) for the bestresponse. Individual mycotoxin standards were injected in full scanmode in order to select the optimal precursor ions for the studyof their fragmentation. Mass spectra in a range between 50 and650 m/z were recorded in the electron ionization mode. With the
aim of avoiding the problem of interferences from isobaric massesresulting from common molecule fragments, ions in the high massrange were preferred as the precursor ions. Once the precursor ionswere selected, they were subjected to different values of collision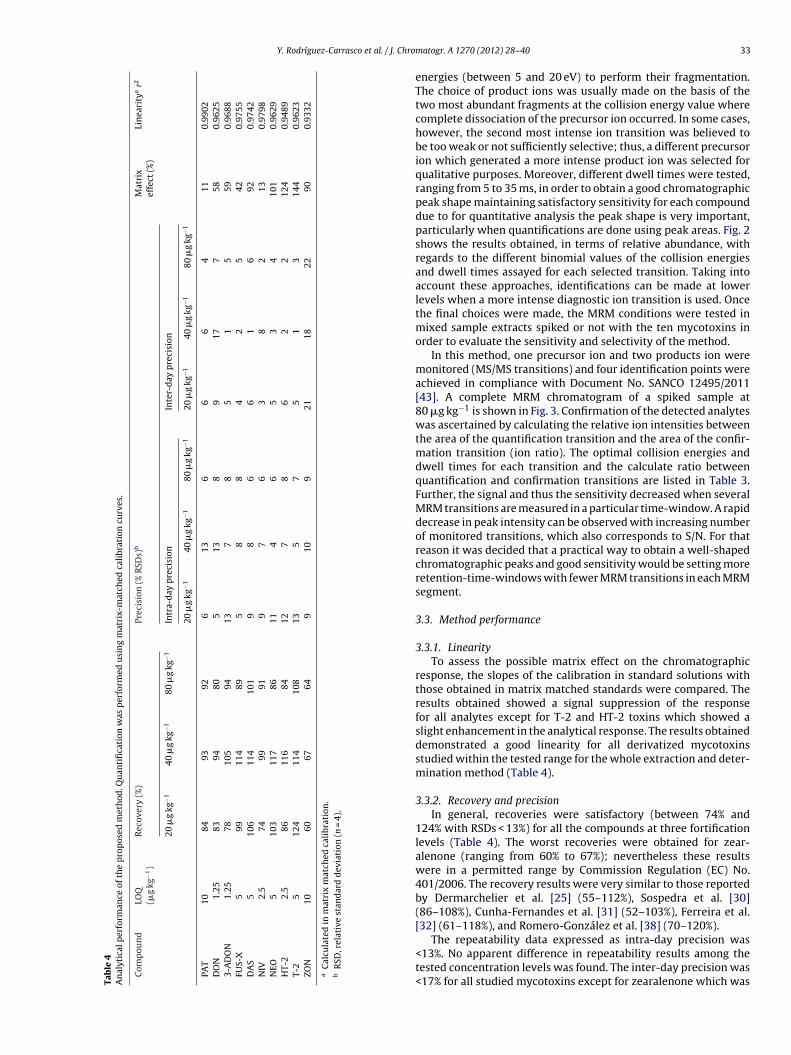
Y. Rodríguez-Carrasco et al. / J. Chro
Tab
le
4A
nal
ytic
al
per
form
ance
of
the
pro
pos
ed
met
hod
. Qu
anti
fica
tion
was
per
form
ed
usi
ng
mat
rix-
mat
ched
cali
brat
ion
curv
es.
Com
pou
nd
LOQ
(�g
kg−1
)R
ecov
ery
(%)
Prec
isio
n
(%
RSD
s)b
Mat
rix
effe
ct
(%)
Lin
eari
tya
r2
20
�g
kg−1
40
�g
kg−1
80
�g
kg−1
Intr
a-d
ay
pre
cisi
on
Inte
r-d
ay
pre
cisi
on
20
�g
kg−1
40
�g
kg−1
80
�g
kg−1
20
�g
kg−1
40
�g
kg−1
80
�g
kg−1
PAT
10
84
93
92
6
13
6
6
6
4
11
0.99
02D
ON
1.25
83
94
80
5
13
8
9
17
7
58
0.96
253-
AD
ON
1.25
78
105
94
13
7
8
5
1
5
59
0.96
88FU
S-X
5
99
114
89
5
8
8
4
2
5
42
0.97
55D
AS
5
106
114
101
9
8
6
6
1
6 92
0.97
42N
IV
2.5
74
99
91
9
7
6
3
8
2 13
0.97
98N
EO
5
103
117
86
11
4
6
5
3
4
101
0.96
29H
T-2
2.5
86
116
84
12
7
8
6
2
2
124
0.94
89T-
2
5
124
114
108
13
5
7
5
1
3
144
0.96
23ZO
N10
60
67
64
9
10
9
21
18
22
90
0.93
32
aC
alcu
late
d
in
mat
rix
mat
ched
cali
brat
ion
.b
RSD
, rel
ativ
e
stan
dar
d
dev
iati
on
(n
=
4).
matogr. A 1270 (2012) 28– 40 33
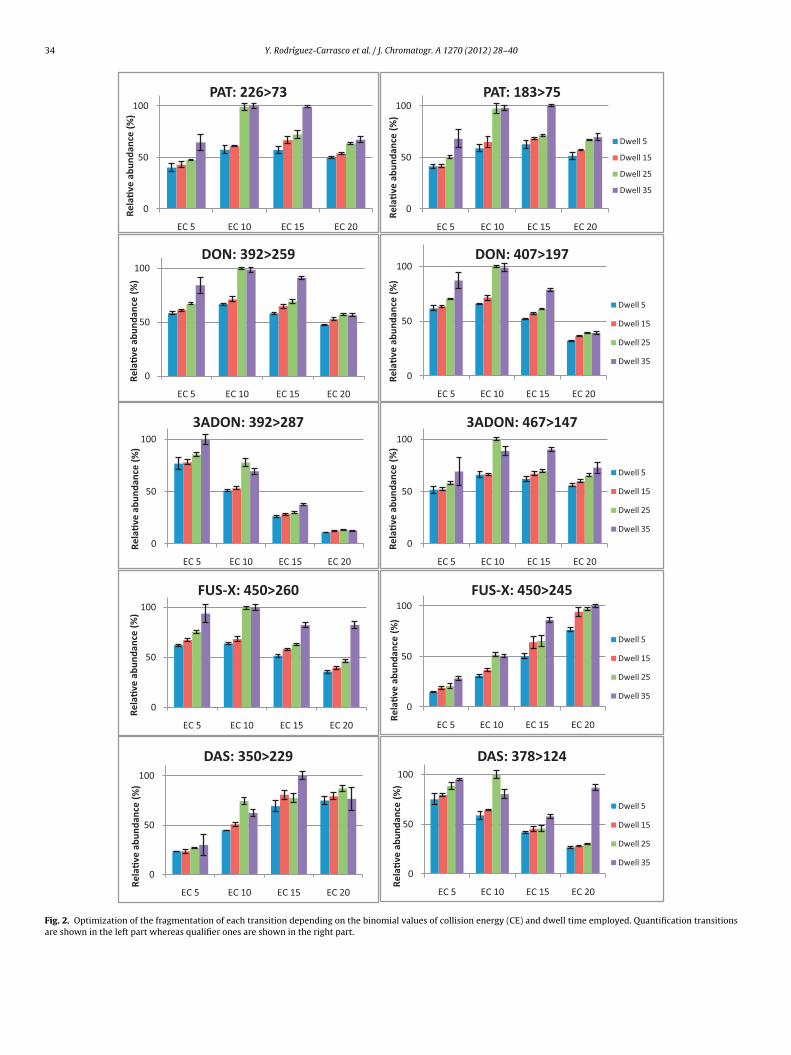
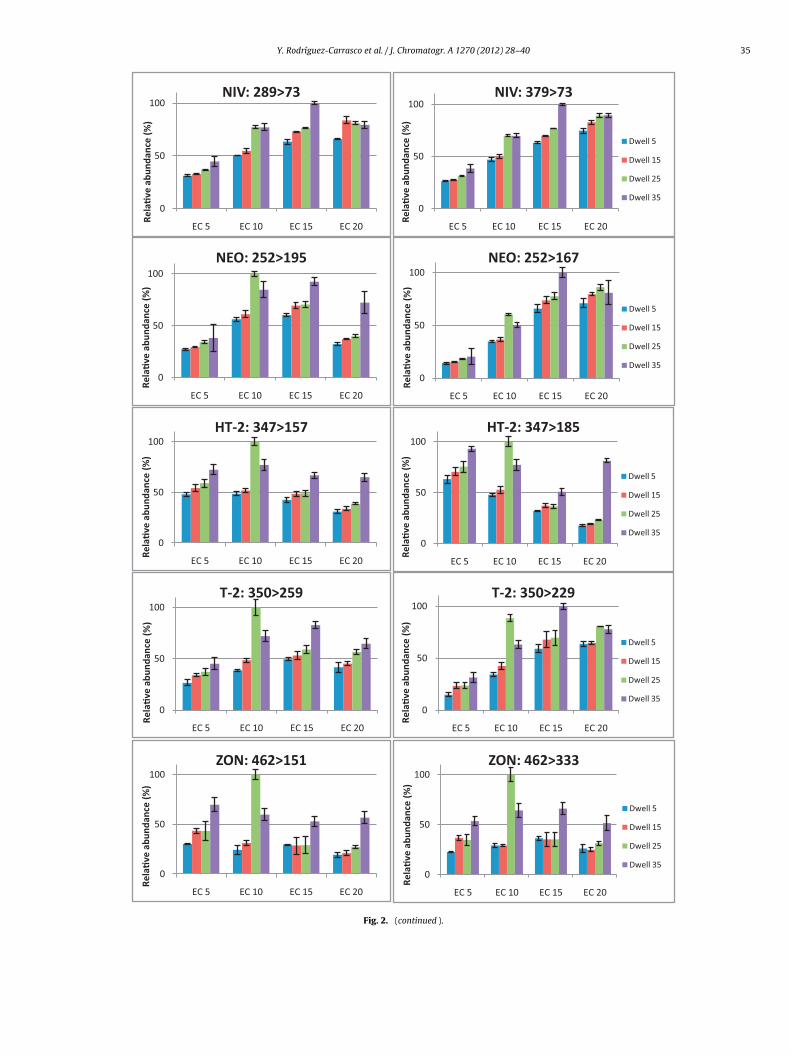
energies (between 5 and 20 eV) to perform their fragmentation.The choice of product ions was usually made on the basis of thetwo most abundant fragments at the collision energy value wherecomplete dissociation of the precursor ion occurred. In some cases,however, the second most intense ion transition was believed tobe too weak or not sufficiently selective; thus, a different precursorion which generated a more intense product ion was selected forqualitative purposes. Moreover, different dwell times were tested,ranging from 5 to 35 ms, in order to obtain a good chromatographicpeak shape maintaining satisfactory sensitivity for each compounddue to for quantitative analysis the peak shape is very important,particularly when quantifications are done using peak areas. Fig. 2shows the results obtained, in terms of relative abundance, withregards to the different binomial values of the collision energiesand dwell times assayed for each selected transition. Taking intoaccount these approaches, identifications can be made at lowerlevels when a more intense diagnostic ion transition is used. Oncethe final choices were made, the MRM conditions were tested inmixed sample extracts spiked or not with the ten mycotoxins inorder to evaluate the sensitivity and selectivity of the method.
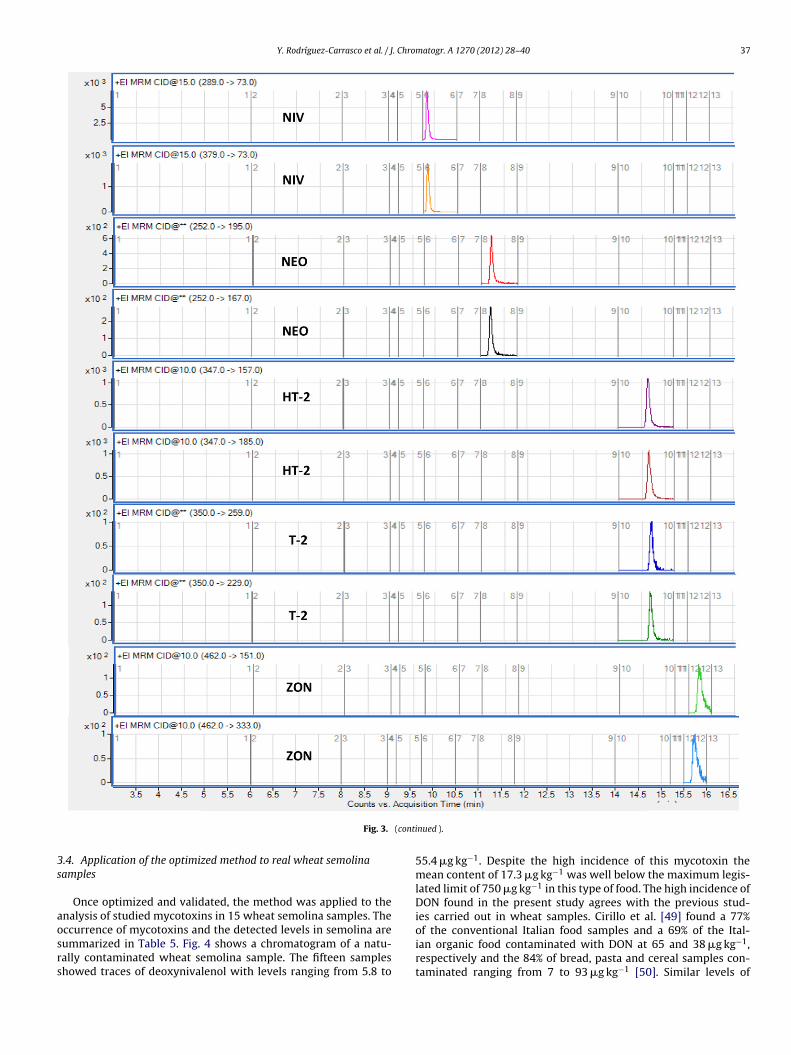
In this method, one precursor ion and two products ion weremonitored (MS/MS transitions) and four identification points wereachieved in compliance with Document No. SANCO 12495/2011[43]. A complete MRM chromatogram of a spiked sample at80 �g kg−1 is shown in Fig. 3. Confirmation of the detected analyteswas ascertained by calculating the relative ion intensities betweenthe area of the quantification transition and the area of the confir-mation transition (ion ratio). The optimal collision energies anddwell times for each transition and the calculate ratio betweenquantification and confirmation transitions are listed in Table 3.Further, the signal and thus the sensitivity decreased when severalMRM transitions are measured in a particular time-window. A rapiddecrease in peak intensity can be observed with increasing numberof monitored transitions, which also corresponds to S/N. For thatreason it was decided that a practical way to obtain a well-shapedchromatographic peaks and good sensitivity would be setting moreretention-time-windows with fewer MRM transitions in each MRMsegment.
3.3. Method performance
3.3.1. LinearityTo assess the possible matrix effect on the chromatographic
response, the slopes of the calibration in standard solutions withthose obtained in matrix matched standards were compared. Theresults obtained showed a signal suppression of the responsefor all analytes except for T-2 and HT-2 toxins which showed aslight enhancement in the analytical response. The results obtaineddemonstrated a good linearity for all derivatized mycotoxinsstudied within the tested range for the whole extraction and deter-mination method (Table 4).
3.3.2. Recovery and precisionIn general, recoveries were satisfactory (between 74% and
124% with RSDs < 13%) for all the compounds at three fortificationlevels (Table 4). The worst recoveries were obtained for zear-alenone (ranging from 60% to 67%); nevertheless these resultswere in a permitted range by Commission Regulation (EC) No.401/2006. The recovery results were very similar to those reportedby Dermarchelier et al. [25] (55–112%), Sospedra et al. [30](86–108%), Cunha-Fernandes et al. [31] (52–103%), Ferreira et al.[32] (61–118%), and Romero-González et al. [38] (70–120%).
The repeatability data expressed as intra-day precision was<13%. No apparent difference in repeatability results among thetested concentration levels was found. The inter-day precision was<17% for all studied mycotoxins except for zearalenone which was
34 Y. Rodríguez-Carrasco et al. / J. Chromatogr. A 1270 (2012) 28– 40
0
50
100
EC 5 EC 10 EC 15 EC 20
Rela
�ve
abun
danc
e (%
)
PAT: 226>73
0
50
100
EC 5 EC 10 EC 15 EC 20
Rela
�ve
abun
danc
e (%
)
PAT: 183>75
Dwell 5
Dwell 15
Dwell 25
Dwell 35
0
50
100
EC 5 EC 10 EC 15 EC 20
Rela
�ve
abun
danc
e (%
)
DON: 392>259
0
50
100
EC 5 EC 10 EC 15 EC 20Re
la�v
e ab
unda
nce
(%)
DON: 407>197
Dwell 5
Dwell 15
Dwell 25
Dwell 35
0
50
100
EC 5 EC 10 EC 15 EC 20
Rela
�ve
abun
danc
e (%
)
3ADON: 392>287
0
50
100
EC 5 EC 10 EC 15 EC 20
Rela
�ve
abun
danc
e (%
)
3ADON: 467>147
Dwell 5
Dwell 15
Dwell 25
Dwell 35
0
50
100
EC 5 EC 10 EC 15 EC 20
Rela
�ve
abun
danc
e (%
)
FUS-X: 450>260
0
50
100
EC 5 EC 10 EC 15 EC 20
Rela
�ve
abun
danc
e (%
)
FUS-X: 450>245
Dwell 5
Dwell 15
Dwell 25
Dwell 35
0
50
100
EC 5 EC 10 EC 15 EC 20
Rela
�ve
abun
danc
e (%
)
DAS: 350>229
0
50
100
EC 5 EC 10 EC 15 EC 20
Rela
�ve
abun
danc
e (%
)
DAS: 378>124
Dwell 5
Dwell 15
Dwell 25
Dwell 35
Fig. 2. Optimization of the fragmentation of each transition depending on the binomial values of collision energy (CE) and dwell time employed. Quantification transitionsare shown in the left part whereas qualifier ones are shown in the right part.
Y. Rodríguez-Carrasco et al. / J. Chromatogr. A 1270 (2012) 28– 40 35
0
50
100
EC 5 EC 10 EC 15 EC 20
Rela
�ve
abun
danc
e (%
)
NIV: 289>73
0
50
100
EC 5 EC 10 EC 15 EC 20
Rela
�ve
abun
danc
e (%
)
NIV: 379>73
Dwell 5
Dwell 15
Dwell 25
Dwell 35
0
50
100
EC 5 EC 10 EC 15 EC 20
Rela
�ve
abun
danc
e (%
)
NEO: 252>1 95
0
50
100
EC 5 EC 10 EC 15 EC 20Re
la�v
e ab
unda
nce
(%)
NEO: 252>1 67
Dwell 5
Dwell 15
Dwell 25
Dwell 35
0
50
100
EC 5 EC 10 EC 15 EC 20Rela
�ve
abun
danc
e (%
)
HT-2: 347>157
0
50
100
EC 5 EC 10 EC 15 EC 20
Rela
�ve
abun
danc
e (%
)
HT-2: 347>185
Dwell 5
Dwell 15
Dwell 25
Dwell 35
0
50
100
EC 5 EC 10 EC 15 EC 20
Rela
�ve
abun
danc
e (%
)
T-2: 350>259
0
50
100
EC 5 EC 10 EC 15 EC 20
Rela
�ve
abun
danc
e (%
)
T-2: 350>229
Dwell 5
Dwell 15
Dwell 25
Dwell 35
0
50
100
EC 5 EC 10 EC 15 EC 20
Rela
�ve
abun
danc
e (%
)
ZON: 462>1 51
0
50
100
EC 5 EC 10 EC 15 EC 20
Rela
�ve
abun
danc
e (%
)
ZON: 462>3 33
Dwell 5
Dwell 15
Dwell 25
Dwell 35
Fig. 2. (continued ).

3 . Chro
shs
3
f
6 Y. Rodríguez-Carrasco et al. / J
lightly upper than 20%, in spite of that, the repeatability obtainedere lies also well within the commonly reported range Commis-ion Regulation (EC) No. 401/2006.
.3.3. Limit of quantificationTable 4 outlines LOQs of this method which were in a range
rom 1.25 to 10 �g kg−1. The levels of LOQ obtained were lower
Fig. 3. Complete MRM chromatogram
matogr. A 1270 (2012) 28– 40
than the maximum limits established by the EU for the legislatedmycotoxins [40,41]. In addition, the LOQs of all studied mycotoxinswere lower than those obtained by liquid chromatography deter-mination even avoiding the derivatization step [1,47,48] and by
GC–TOF-MS [16]. The high selectivity obtained with the GC-QqQwith the specific mass MS/MS transitions versus scanning a com-plete spectrum in TOF-MS could explain the results obtained.of a spiked sample at 80 �g kg−1.
Y. Rodríguez-Carrasco et al. / J. Chromatogr. A 1270 (2012) 28– 40 37
(conti
3s
aosrs
Fig. 3.
.4. Application of the optimized method to real wheat semolinaamples
Once optimized and validated, the method was applied to thenalysis of studied mycotoxins in 15 wheat semolina samples. Theccurrence of mycotoxins and the detected levels in semolina are
ummarized in Table 5. Fig. 4 shows a chromatogram of a natu-ally contaminated wheat semolina sample. The fifteen sampleshowed traces of deoxynivalenol with levels ranging from 5.8 tonued ).
55.4 �g kg−1. Despite the high incidence of this mycotoxin themean content of 17.3 �g kg−1 was well below the maximum legis-lated limit of 750 �g kg−1 in this type of food. The high incidence ofDON found in the present study agrees with the previous stud-ies carried out in wheat samples. Cirillo et al. [49] found a 77%of the conventional Italian food samples and a 69% of the Ital-
ian organic food contaminated with DON at 65 and 38 �g kg−1,respectively and the 84% of bread, pasta and cereal samples con-taminated ranging from 7 to 93 �g kg−1 [50]. Similar levels of
38 Y. Rodríguez-Carrasco et al. / J. Chromatogr. A 1270 (2012) 28– 40
Table 5Occurrence of the studied mycotoxins in naturally contaminated wheat semolina samples.
Sample Occurrence mycotoxin (�g kg−1)
DON 3-ADON NIV HT-2
1 6.2 ± 0.4 n.d. n.d. n.d.2 9.4 ± 0.8 n.d. n.d. n.d.3 12.2 ± 2.1 n.d. 10.3 ± 1.4 7.1 ± 0.94 6.2 ± 0.1 n.d. n.d. n.d.5 52.2 ± 1.8 n.d. n.d. n.d.6 16.8 ± 5.8 n.d. n.d. n.d.7 14.7 ± 2.1 n.d. n.d. n.d.8 8.6 ± 2.9 n.d. n.d. n.d.9 8.9 ± 0.5 n.d. 8.8 ± 1.6 8.7 ± 1.910 55.4 ± 4.5 4.4 ± 0.1 13.6 ± 1.4 6.7 ± 0.211 13.9 ± 1.8 n.d. n.d. 6.9 ± 0.112 7.4 ± 0.1 n.d. n.d. n.d.13 5.8 ± 0.2 n.d. n.d. 15.2 ± 2.414 26.1 ± 7.2 n.d. n.d. n.d.15 16.9 ± 0.7 n.d. n.d. n.d.
64
Dacfo2
Fc
% Positive samples (n = 15) 100%
Mean (�g kg−1) 17.3
ON contamination were found by Schollenberger et al. [51] withn incidence of 92% in German bread samples and an average
ontent of 134 �g kg−1. In this way, Cano-Sancho et al. [47]ound that the totally of the Spanish bread samples and the 74%f pasta analyzed were DON positive with a mean content of42 �g kg−1 and 199 �g kg−1, respectively. Similar results wereig. 4. GC–MS/MS chromatogram of a naturally contaminated wheat semolina at 55.4 �gharacteristic transitions viewed in MRM mode (C).
.7% 20% 33.3%
.4 10.9 8.9
found by González-Osnaya and co-workers [52] with an occurrenceof DON in Spanish pasta samples of 62.6% ranging from 10.9 to
623.3 �g kg−1 and by Cunha and Fernandes [31] who reported amean of 322 �g kg−1 in cereals from Portugal. Tanaka et al. [53]reported an incidence of 86% of the wheat Japanese samples ana-lyzed with an average of 333 �g kg−1, which were also accordingkg−1 of DON showed in full scan mode (A), the mass spectrum of DON (B) and the
. Chro
wsE
(Hsi4wei[3
ns[wrrFwp
3
wTwn4oatmDp
csgoa
4
qdaswmwaaCabfnl
[
[
[
[
[[[[[[
[
[[[[[
[
[[
[
[[[[[
[[
[
[
[
[
[
[
Y. Rodríguez-Carrasco et al. / J
ith the 272 �g kg−1 reported by Jestoi et al. [1] in Finnish grainamples and with the 274.6 �g kg−1 found in feedstuffs in Southernurope by Griessler et al. [54].
A significant number of semolina samples tested were positive33%) for HT-2 toxin with an average amount of 8.9 �g kg−1. TheT-2 analyses were conducted by different research groups and
imilar amounts were found. Cano-Sancho et al. [47] reported anncidence of 10% in the samples analyzed with a mean content of6 �g kg−1 and comparable results were reported by Jestoi and co-orkers [1] with an average content of 40 �g kg−1. Recently, Skrbic
t al. [55] reported a mean contamination of HT-2 at 9 �g kg−1
n the wheat samples analyzed. In the same way Lattanzio et al.56] found in Italian cereal-based food samples an average of.4 �g kg−1.
Data in Table 5 showed that the 20% of semolina samples wereivalenol positive with an arithmetic mean of all contaminatedamples tested of 10.9 �g kg−1. Jestoi et al. [1], Lattanzio et al.56] and Tanaka et al. [53] reported different NIV occurrence inheat samples with a mean contents of 150, 63.5 and 7 �g kg−1,
espectively. Referent to 3-ADON, scarce literature was reportedegarding wheat contamination. An average of 17 �g kg−1 in theinnish grain samples analyzed was reported by Jestoi et al. [1],hile 3-ADON was quantified in only one semolina sample in theresent study at 4.4 �g kg−1.
.5. Co-occurrence of mycotoxins in the samples
Fusarium fungi can produce a number of different mycotoxins,hich can be produced simultaneously in a single matrix [57].
he number of positive samples for more than one mycotoxinas surprisingly high. One semolina sample showed simulta-eous occurrence for DON, 3-ADON, NIV and HT-2 at 55.4 �g kg−1,.4 �g kg−1, 13.6 �g kg−1 and 6.7 �g kg−1, respectively, whereasther four samples contained different amounts of DON, NIVnd HT-2 toxins (Table 5). The results obtained suggest thathe most common case of co-occurrence with the evaluated
ycotoxins can be drawn by the simultaneous occurrence ofON and HT-2 toxin, as was previously elucidated in otherublications [47,55].
Interestingly, in most pasta and cereal-based food products, theo-occurrence of two or more mycotoxins was found. Additionally,everal reports suggested that the mycotoxins could have syner-istic effect in vivo; therefore, the knowledge of the occurrencef all mycotoxins should be considered a challenge in exposuressessment studies.
. Conclusions
A rapid, sensitive and robust gas chromatography–tripleuadrupole mass spectrometry method was developed for theetermination of ten mycotoxins in wheat based food. Accept-ble recoveries were obtained for all mycotoxins at three differentpiked levels. Limits of quantification (from 1.25 to 10 �g kg−1)ere lower than the maximum limit established by EU. Further-ore, GC–MS/MS optimized offers good sensibility and selectivity,ith structural information for unequivocal identification of target
nalytes. Finally, this method was applied to fifteen real samplesnd several amounts of four different mycotoxins were found.onsidering the advantages of the proposed method, this could bepplied for regular monitoring of mycotoxins in wheat-based food
y routine laboratories. Thus, the relevance of analytical methodor simultaneous monitoring of these toxins is confirmed and theeed to include the co-occurrence maximum limits in the futureegislative reports is suggested.
[
[[[
matogr. A 1270 (2012) 28– 40 39
Acknowledgements
This work was supported by the Spanish Ministry of Science andInnovation (AGL2010-17024/ALI). Y. Rodríguez-Carrasco thanksthe F.P.U. Grant (No. AP2010-2940) provided by the Ministry ofEducation.
References
[1] M. Jestoi, A. Ritieni, A. Rizzo, J. Agric. Food Chem. 52 (2004) 1464.[2] A. Prandini, S. Sigolo, L. Filippi, P. Battilani, G. Piva, Food Chem. Toxicol. 47
(2009) 927.[3] P. Songsermsakul, E. Razzazi-Fazeli, J. Liq. Chromatogr. Relat. Technol. 31 (2008)
1641.[4] A. Gutleb, E. Morrison, A. Murk, Environ. Toxicol. Pharmacol. 11 (2002)
309.[5] H.J. van der Fels-Klerx, I. Stratakou, World Mycotoxin J. 3 (2010) 349.[6] M. Metzler, E. Pfeiffer, A.A. Hildebrand, World Mycotoxin J. 3 (2010) 385.[7] M. Rychlik, P. Schieberle, Eur. Food Res. Technol. 212 (2001) 274.[8] D. Spadaro, A. Ciavorella, S. Frati, A. Garibaldi, M.L. Gullino, Food Control 18
(2007) 1098.[9] R. Krska, P. Schubert-Ullrich, A. Molinelli, M. Sulyok, S. Macdonald, C. Crews,
Food Addit. Contam. 25 (2008) 152.10] T. Tanaka, A. Yoneda, S. Inoue, Y. Sugiura, Y. Ueno, J. Chromatogr. A 882 (2000)
23.11] V. Vishwanath, M. Sulyok, R. Labuda, W. Bicker, R. Krska, Anal. Bioanal. Chem.
395 (2009) 1355.12] R. Koeppen, M. Koch, D. Siegel, S. Merkel, R. Maul, I. Nehls, Appl. Microbiol.
Biotechnol. 86 (2010) 1595.13] J.P. Meneely, F. Ricci, H.P. van Egmond, C.T. Elliott, TrAC-Trends Anal. Chem. 30
(2011) 192.14] K. Schwadorf, H. Muller, Chromatographia 32 (1991) 137.15] H. Melchert, E. Pabel, J. Chromatogr. A 1056 (2004) 195.16] H.H. Jelen, E. Wasowicz, J. Chromatogr. A 1215 (2008) 203.17] S. Walorczyk, J. Chromatogr. A 1165 (2007) 200.18] J. Lee, J. Park, G. Jang, K. Hwang, J. Chromatogr. A 1187 (2008) 25.19] U. Koesukwiwat, S.J. Lehotay, N. Leepipatpiboon, J. Chromatogr. A 1218 (2011)
7039.20] F. Zhang, X. Chu, L. Sun, Y. Zhao, Y. Ling, X. Wang, W. Yong, M. Yang, X. Li, J.
Chromatogr. A 1209 (2008) 220.21] R. Krska, E. Welzig, H. Boudra, Anim. Feed Sci. Technol. 137 (2007) 241.22] J. Rubert, C. Soler, J. Manes, Talanta 85 (2011) 206.23] R. Wu, Y. Dang, L. Niu, H. Hu, J. Food Compos. Anal. 21 (2008) 582.24] L. Carnpone, A.L. Piccinelli, L. Aliberti, L. Rastrelli, J. Sep. Sci. 32 (2009) 3837.25] A. Desmarchelier, J. Oberson, P. Tella, E. Gremaud, W. Seefelder, P. Mottier, J.
Agric. Food Chem. 58 (2010) 7510.26] J.C.R. Demyttenaere, R.M. Morina, N. De Kimpe, P. Sandra, J. Chromatogr. A 1027
(2004) 147.27] D. Zhao, J. Jia, X. Yu, X. Sun, Anal. Bioanal. Chem. 401 (2011) 2259.28] J.L. Urraca, M. Dolores Marazuela, M.C. Moreno-Bondi, Anal. Bioanal. Chem. 385
(2006) 1155.29] L. Campone, A.L. Piccinelli, R. Celano, L. Rastrelli, J. Chromatogr. A 1218 (2011)
7648.30] I. Sospedra, J. Blesa, J.M. Soriano, J. Manes, J. Chromatogr. A 1217 (2010) 1437.31] S.C. Cunha, J.O. Fernandes, J. Sep. Sci. 33 (2010) 600.32] I. Ferreira, J.O. Fernandes, S.C. Cunha, Food Control 27 (2012) 188.33] L. Monaci, E. De Angelis, A. Visconti, J. Chromatogr. A 1218 (2011) 8646.34] M. Anastassiades, S. Lehotay, D. Stajnbaher, F. Schenck, J. AOAC Int. 86 (2003)
412.35] S. Lehotay, K. Mastovska, A. Lightfield, J. AOAC Int. 88 (2005) 60A.36] S.J. Lehotay, K.A. Son, H. Kwon, U. Koesukwiwat, W. Fu, K. Mastovska, E. Hoh,
N. Leepipatpiboon, J. Chromatogr. A 1217 (2010) 2548.37] R.P. Lopes, R.C. Reyes, R. Romero-González, J.L.M. Vidal, A.G. Frenich, J. Chro-
matogr. B 39 (2012) 895.38] R. Romero-González, A. Garrido Frenich, J.L. Martínez Vidal, O.D. Prestes, S.L.
Grio, J. Chromatogr. A 1218 (2011) 1477.39] Commission Regulation (EC) No. 401/2006, of 23 February 2006 laying down
the methods of sampling and analysis for the official control of the levels ofmycotoxins in foodstuffs (text with EEA relevance).
40] Commission Regulation (EC) No. 1881/2006, of 19 December 2006 setting max-imum levels for certain contaminants in foodstuffs (text with EEA relevance).
41] Commission Regulation (EC) No. 1126/2007, of 28 September 2007 amendingRegulation (EC) No 1881/2006 setting maximum levels for certain contami-nants in foodstuffs as regards Fusarium toxins in maize and maize products(text with EEA relevance).
42] Commission Decision 2002/657/EC (2002) of 12 August 2002 implementingCouncil Directive 96/23/EC concerning the performance of analytical methodsand the interpretation of results (text with EEA relevance).
43] Document No. SANCO/12495/2011, Method validation and quality control pro-cedures for pesticide residues analysis in food and feed.
44] K. Farhadi, R. Maleki, J. Chin. Chem. Soc. 58 (2011) 340.45] R. Brackett, E. Marth, Z. Lebensm. Unters. Forsch. 169 (1979) 92.46] S. Drusch, S. Kopka, J. Kaeding, Food Chem. 100 (2007) 192.

4 . Chro
[
[[[
[
[
[
[
[
0 Y. Rodríguez-Carrasco et al. / J
47] G. Cano-Sancho, J. Gauchi, V. Sanchis, S. Marin, A.J. Ramos, Food Addit. Contam.A28 (2011) 1098.
48] J. Rubert, K. James, J. Manes, C. Soler, Food Chem. Toxicol. 50 (2012) 2034.49] T. Cirillo, A. Ritieni, M. Visone, R. Cocchieri, J. Agric. Food Chem. 51 (2003) 8128.50] T. Cirillo, A. Ritieni, F. Galvano, R. Cocchieri, Food Addit. Contam. A20 (2003)
566.51] M. Schollenberger, W. Drochner, M. Rufle, S. Suchy, H. Terry-Jara, H. Muller, J.
Food Compos. Anal. 18 (2005) 69.52] L. Gonzalez-Osnaya, C. Cortes, J.M. Soriano, J.C. Molto, J. Manes, Food Chem. 124
(2011) 156.
[
[
matogr. A 1270 (2012) 28– 40
53] H. Tanaka, M. Takino, Y. Sugita-Konishi, T. Tanaka, A. Toriba, K. Hayakawa, RapidCommun. Mass Spectrom. 23 (2009) 3119.
54] K. Griessler, I. Rodrigues, J. Handl, U. Hofstetter, World Mycotoxin J. 3 (2010)301.
55] B. Skrbic, A. Malachova, J. Zivancev, Z. Veprikova, J. Hajslova, Food Control 22
(2011) 1261.56] V.M.T. Lattanzio, M. Solfrizzo, A. Visconti, Food Addit. Contam. 25 (2008)320.
57] A. Mankeviciene, B. Butkute, I. Gaurilcikiene, Z. Dabkevicius, S. Suproniene,Food Control 22 (2011) 970.
Related Documents


