PROJECT REPORT Multi-kettle beer brewing Production planning at Hops & Grains: the Personal Brewing Company. Researching the viability of the “Second Craft beer Revolution” through simulation of production processes. Yorick Bosch S1380109 Industrial Engineering and Management [email protected] Mentors: Dr. Ir. M. R. K. Mes, MSc. B. Gerrits External Supervisor: R. Chin

Welcome message from author
This document is posted to help you gain knowledge. Please leave a comment to let me know what you think about it! Share it to your friends and learn new things together.
Transcript

PROJECT REPORT
Multi-kettle
beer brewing Production planning at Hops &
Grains: the Personal Brewing
Company. Researching the
viability of the “Second Craft
beer Revolution” through
simulation of production
processes.
Yorick Bosch S1380109 Industrial Engineering and Management [email protected] Mentors: Dr. Ir. M. R. K. Mes, MSc. B. Gerrits External Supervisor: R. Chin
1
Executive Summary Context and research motivation Hops & Grains: the Personal Brewing Company (H&G) is a beer brewery located in the Netherlands
that engages its customers through a website, where the customers can create, customize and order
beer recipes. These recipes are then brewed in small batches in the brewery, and get sent to the
customer after the necessary fermentation and bottling procedures have been completed. Beer
brewing is a complicated process with many variables, and in normal breweries it makes sense to
pursue a policy of standardization and economies of scale. Normal breweries use a few large kettles
to create one or more standardized beer recipes in bulk, easing further automated production steps
and lowering overall costs.
This is not a possibility for H&G: their business model relies on the ability to produce a multitude of
small, individually distinct batches of beer and that requires a complete re-work of how a brewery is
supposed to operate. They cope with this by using small, flexible brewing kettles and performing
many tasks by hand, but this causes a drop in productivity (litres of beer produced per employee)
compared to normal breweries. Their beers are more expensive than mass-produced beers but still in
order to become profitable, H&G management considers a target of five batches of beer brewed per
active brewer per day a minimum. This target is not being reached.
Because the company is in its start-up stage, the current brewhouse has not been equipped to full
theoretical capacity and H&G management is reluctant to make the necessary investments without
first being confident in the solidness and scalability of their business model. However, the company
still has a goal of selling 1250 crates of custom beer in 2021. The author of this thesis is one of the
primary stakeholders at H&G, running the production facility in real life.
Approach After discussions with Hops & Grains management it was decided to make the scalability problem the
main focus of this research. After conducting a literature study into simulation studies conducted for
other breweries, it was found that no formal research has been conducted on a small-scale multi-
kettle brewing operation such as Hops & Grains. Therefore, the research in this report will be
exploratory in nature.
Because investing in more kettles was not an option, it was chosen to build a Discrete Event
Simulation (DES) model of the brewery that could be expanded to house any number of kettles,
workstations, or storage locations, and that could be modified with different employee assignments
or customer preferences for different products. The DES model was built in Siemens’ Tecnomatic
Plant Simulator, as members of H&G management were already familiar with the program.
Data previously gathered by Hops & Grains staff on production times was deemed too inaccurate or
incomplete to serve as a basis of the simulation model. In order to fill the model with accurate times
for the different steps in the production process an observation study was conducted. In this report
we discuss the current production processes that take place, the work-times that were gathered for
the multitude of jobs in the brewery, the factors that we decided to include or exclude during the
building of the DES model, the experiments that we conducted using the model, and the conclusions
from these experiments.
Results The simulation model shows that Hops & Grains’ business model is indeed profitable and scalable,
provided enough orders enter the system and time is managed efficiently. The plans to scale up
production to meet the targets of 2021 is achievable within the confines of the current production
2
location assuming an additional 3 kettles are placed, storage capacity is increased to 70+ locations
and two employees are available to work in the brewery. If demand for product is not high enough,
less storage capacity would be needed overall but having enough kettles would still increase
profitability. Incentivising customers to purchase more IPA-style beers as opposed to stout-style
beers will increase average throughput through the brewery and free up more storage space for
different orders, due to their shorter lagering times. If storage capacity becomes a bottleneck it may
be advisable to incentivise customers towards ordering more IPA’s.
The minimum viability level of the brewery that was envisioned by H&G management, 5 brews per
brewer per day, is not accurate if we assume a mix of orders of different bottle types and amounts
enters the brewery. However, in a scenario where customers prefer single crates of the cheapest
product, the minimum viability level becomes more evident and the system verges on unprofitability
even in the best setups. The view of H&G management that incentivising customers to purchase
bigger batches of/or bigger bottles will increase profits is correct. Bigger brewery setups were also
modelled and experimented on, and show promising outlooks for the future of the company.
Conclusions The simulation model discussed in the report gives great insight into the mechanics behind a small
multi-kettle brewing operation. It provides the management of Hops & Grains with guidelines to
improve their production processes in the current production environment and gives useful pointers
to improvements that need to be made to be able to scale their business up further.
Possible limitations to the accuracy of this research are differences between the current model of
brewing kettle used as opposed to future models that Hops & Grains plans to purchase. This, as well
as overall improvements to their production processes are estimated to make the currently gathered
job times obsolete. However, most of these would result in time savings that do not impact the flow
of products through the brewery, meaning the current model could simply be updated with shorter
process times. Also, multiple more detailed and nuanced aspects of the brewery such as water taps,
sparge water heating, different sizes of yeasting barrels and hop/yeast usage were only modelled
minimally.
More serious are the limited options for employee handling in the current model, which makes it
hard to realistically simulate a larger brewery. If many employees are present in the current model
they will, upon finishing a job, pick up the first job that becomes available, even if it is completely
unrelated to their first job. It would be logical to apply certain restrictions to the type of jobs that
employees can pick up to improve clarity for the employee. All these limitations would be a great
avenue of research for future projects.
Outlook
In light of the results and conclusions of the report, it is advised that H&G proceed with their plan of
placing extra kettles and storage space in the current brewery, in order to attain maximum
profitability per batch brewed. Increasing the number of orders placed through their website
application will also be of importance to achieve this. If and when an expansion into a new
production location is required, an improved version of the simulation model will be required to
make accurate predictions about the necessities of the bigger brewery. No matter what happens, the
number of available fermentation/lagering spaces will remain a hard limit to the number of beers
that can be output by the brewery. As an aside, it is advised that H&G tries to standardize and
professionalize their individual production steps as much as possible, to make them scalable for the
future and easier to incorporate into a simulation model.
3
Preface You are about to read the final report of my thesis project about the production planning and
simulation of the Hops & Grains brewery, with which I hope to bring a fitting end to my Bachelor of
Industrial Engineering and Management at the University of Twente.
It is a project that I’ve worked on for over half a year by this point, and that has been a very
rewarding experience for me personally. I have been involved with Hops & Grains from the very start
of the company, two years ago, and I’ve seen it grow from something that was simply an ambitious
idea into a fully fledged brewing operation with its own brewery, customers, suppliers, an advanced
website and serious potential. The current team of five people is working hard to improve our
product selection and give our customers a good experience, but as described in the report we were
uncertain that H&G could ever generate real profits. This project has renewed my own confidence in
our ability to make the company work and given me new energy to continue to further improve our
processes. To my colleagues, I want to offer my thanks for their hard work and sacrifices.
It is rare for a student to be allowed to perform any thesis project at their own company, and I
believe it speaks to the credit of the University of Twente that they created an environment where
this is not only possible, but encouraged. I’d like to thank the staff of the faculty of Behavioural and
Management Sciences specifically for allowing this project to continue.
When I originally started the project, I was planning to research the optimal heuristics behind the
production planning of multiple batches of beer. However, since the project would definitely require
a simulation model in order to come to relevant conclusions, I needed to find new supervisors that
knew the ins and outs of simulation software. I don’t think I could have made a better choice than to
ask Martijn Mes and by extention Berry Gerrits for this role: their enthusiastic support of the project,
feedback on the simulation model and my report, patience and above all their love of beer has
helped me bring this project to a successful conclusion. I extend them my sincere gratitude.
As it is slightly unethical to ask one of my own colleagues to become an internal supervisor, an
outside supervisor had to be found. For this I asked Rocco Chin, founder of Enschede’s friendly local
brewpub: Stanislaus Brewskovitch. Although our feedback sessions have been sparsely dotted
around the timeframe of the project, I still want to thank him for taking the project seriously and for
his overall interest in the business.
Last but not least I want to thank my friends and family for their support during the lead-up to this
report: it’s taken me a while and I hope you’ll find that this final version is worth it.
Best regards,
Yorick Bosch
Enschede, 26/06/2019
4
Table of Contents Executive Summary ................................................................................................................................. 1
Context and research motivation .................................................................................................... 1
Approach ......................................................................................................................................... 1
Results ............................................................................................................................................. 1
Conclusions ...................................................................................................................................... 2
Preface ..................................................................................................................................................... 3
Chapter 1 - Introduction ...................................................................................................................... 6
1.1 - Problem identification ............................................................................................................. 6
1.2 - Problem solving approach ....................................................................................................... 7
1.3 - Research Questions ................................................................................................................ 8
Chapter 2 - Content analysis ............................................................................................................. 10
2.1 - Current state of the brewery ................................................................................................ 10
2.2 - Production process ................................................................................................................ 11
2.3 - Time measurements .............................................................................................................. 12
Chapter 3 - Literature Review ........................................................................................................... 15
Chapter 4 - Conceptual Model .......................................................................................................... 17
4.1 – Orders and recipe composition ............................................................................................ 17
4.2 - Path ....................................................................................................................................... 19
4.3 - Kettles and other workstations ............................................................................................ 23
4.4 - Time calculations .................................................................................................................. 23
4.5 - Task simulation ..................................................................................................................... 24
4.6 - Workers ................................................................................................................................ 25
4.7 - Finances ................................................................................................................................ 25
4.8 - Time Measurement .............................................................................................................. 26
4.9 – List of Assumptions ............................................................................................................... 28
Conclusions .................................................................................................................................... 29
Chapter 5 - Simulation model and experiments ............................................................................... 30
5.1 – Input configuration ............................................................................................................... 30
5.2 – Output selection ................................................................................................................... 31
5.3 - First experiments .................................................................................................................. 32
5.4 – Baseline results ..................................................................................................................... 33
5.5 – Baseline interventions, new scenarios ................................................................................. 35
5.6 – Big brewery V1 and V2 ......................................................................................................... 36
5.7 – Big brewery V3-V6 ................................................................................................................ 39
5.8 – Brewery V8 ........................................................................................................................... 41
5
5.9 – Conclusion ............................................................................................................................ 42
Chapter 6 - Conclusion .......................................................................................................................... 43
6.1 – Scalability of multi-kettle brewing systems .......................................................................... 43
6.2 – Discussion and limitations .................................................................................................... 43
6.3 – Recommendations ................................................................................................................ 44
Appendix A: Literature Study regarding validity of observation studies .............................................. 46
Introduction ....................................................................................................................................... 46
Literature review ........................................................................................................................... 46
Judgement checklist ...................................................................................................................... 47
Theses concerning observation studies in production environments .......................................... 48
Conclusion ..................................................................................................................................... 49
Appendix B: Methodology Report ......................................................................................................... 50
The brewery ...................................................................................................................................... 50
Results ............................................................................................................................................... 51
Current/recorded activities ............................................................................................................... 52
Appendix C: Test Results ....................................................................................................................... 63
References ............................................................................................................................................. 70
6
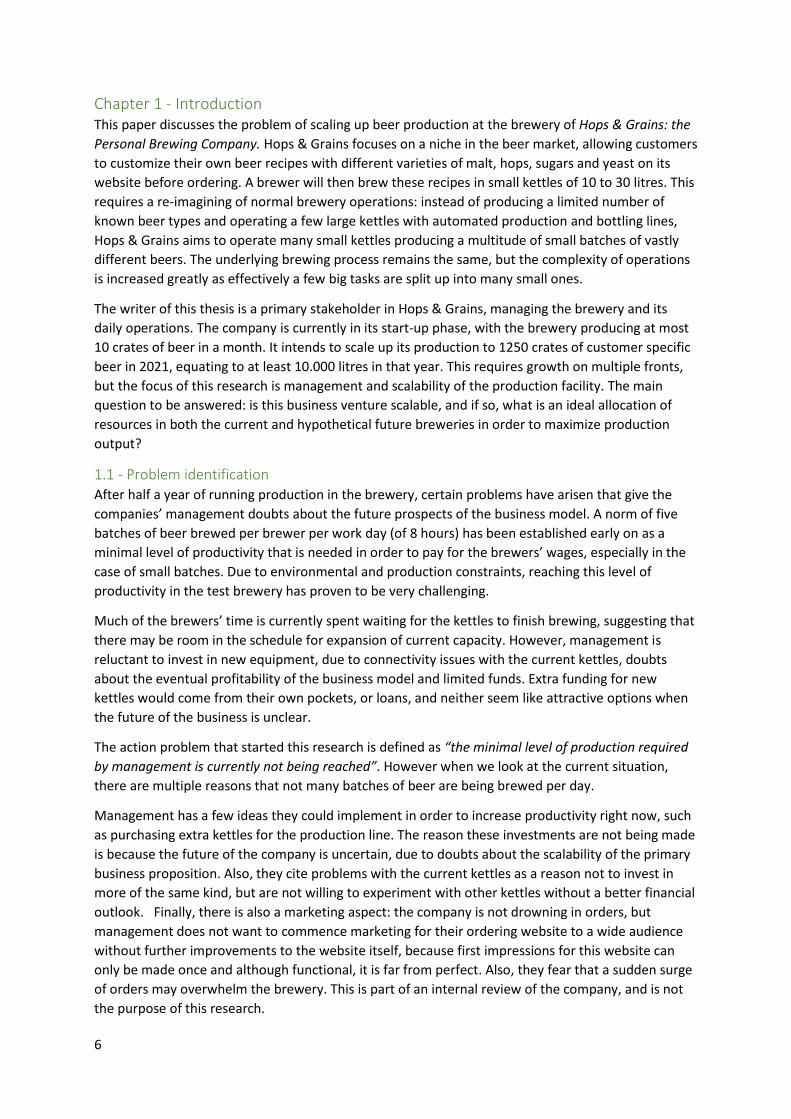
Chapter 1 - Introduction This paper discusses the problem of scaling up beer production at the brewery of Hops & Grains: the
Personal Brewing Company. Hops & Grains focuses on a niche in the beer market, allowing customers
to customize their own beer recipes with different varieties of malt, hops, sugars and yeast on its
website before ordering. A brewer will then brew these recipes in small kettles of 10 to 30 litres. This
requires a re-imagining of normal brewery operations: instead of producing a limited number of
known beer types and operating a few large kettles with automated production and bottling lines,
Hops & Grains aims to operate many small kettles producing a multitude of small batches of vastly
different beers. The underlying brewing process remains the same, but the complexity of operations
is increased greatly as effectively a few big tasks are split up into many small ones.
The writer of this thesis is a primary stakeholder in Hops & Grains, managing the brewery and its
daily operations. The company is currently in its start-up phase, with the brewery producing at most
10 crates of beer in a month. It intends to scale up its production to 1250 crates of customer specific
beer in 2021, equating to at least 10.000 litres in that year. This requires growth on multiple fronts,
but the focus of this research is management and scalability of the production facility. The main
question to be answered: is this business venture scalable, and if so, what is an ideal allocation of
resources in both the current and hypothetical future breweries in order to maximize production
output?
1.1 - Problem identification After half a year of running production in the brewery, certain problems have arisen that give the
companies’ management doubts about the future prospects of the business model. A norm of five
batches of beer brewed per brewer per work day (of 8 hours) has been established early on as a
minimal level of productivity that is needed in order to pay for the brewers’ wages, especially in the
case of small batches. Due to environmental and production constraints, reaching this level of
productivity in the test brewery has proven to be very challenging.
Much of the brewers’ time is currently spent waiting for the kettles to finish brewing, suggesting that
there may be room in the schedule for expansion of current capacity. However, management is
reluctant to invest in new equipment, due to connectivity issues with the current kettles, doubts
about the eventual profitability of the business model and limited funds. Extra funding for new
kettles would come from their own pockets, or loans, and neither seem like attractive options when
the future of the business is unclear.
The action problem that started this research is defined as “the minimal level of production required
by management is currently not being reached”. However when we look at the current situation,
there are multiple reasons that not many batches of beer are being brewed per day.
Management has a few ideas they could implement in order to increase productivity right now, such
as purchasing extra kettles for the production line. The reason these investments are not being made
is because the future of the company is uncertain, due to doubts about the scalability of the primary
business proposition. Also, they cite problems with the current kettles as a reason not to invest in
more of the same kind, but are not willing to experiment with other kettles without a better financial
outlook. Finally, there is also a marketing aspect: the company is not drowning in orders, but
management does not want to commence marketing for their ordering website to a wide audience
without further improvements to the website itself, because first impressions for this website can
only be made once and although functional, it is far from perfect. Also, they fear that a sudden surge
of orders may overwhelm the brewery. This is part of an internal review of the company, and is not
the purpose of this research.
7
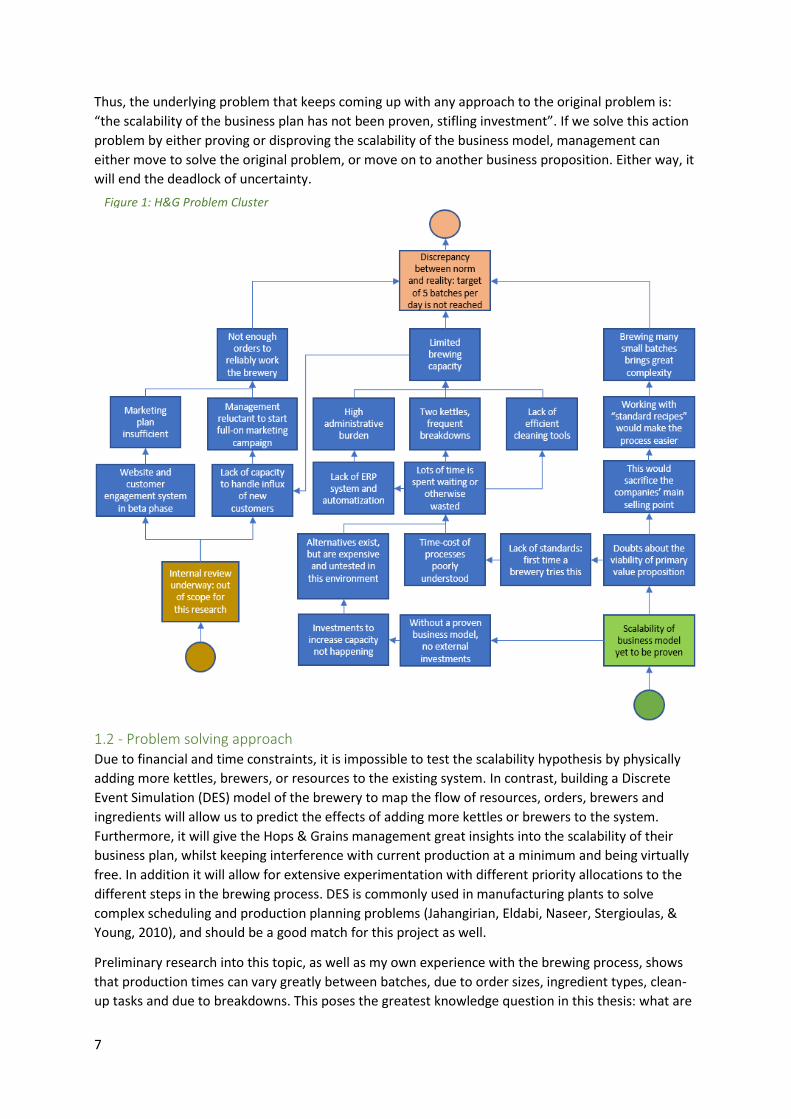
Thus, the underlying problem that keeps coming up with any approach to the original problem is:
“the scalability of the business plan has not been proven, stifling investment”. If we solve this action
problem by either proving or disproving the scalability of the business model, management can
either move to solve the original problem, or move on to another business proposition. Either way, it
will end the deadlock of uncertainty.
1.2 - Problem solving approach Due to financial and time constraints, it is impossible to test the scalability hypothesis by physically
adding more kettles, brewers, or resources to the existing system. In contrast, building a Discrete
Event Simulation (DES) model of the brewery to map the flow of resources, orders, brewers and
ingredients will allow us to predict the effects of adding more kettles or brewers to the system.
Furthermore, it will give the Hops & Grains management great insights into the scalability of their
business plan, whilst keeping interference with current production at a minimum and being virtually
free. In addition it will allow for extensive experimentation with different priority allocations to the
different steps in the brewing process. DES is commonly used in manufacturing plants to solve
complex scheduling and production planning problems (Jahangirian, Eldabi, Naseer, Stergioulas, &
Young, 2010), and should be a good match for this project as well.
Preliminary research into this topic, as well as my own experience with the brewing process, shows
that production times can vary greatly between batches, due to order sizes, ingredient types, clean-
up tasks and due to breakdowns. This poses the greatest knowledge question in this thesis: what are
Figure 1: H&G Problem Cluster
8
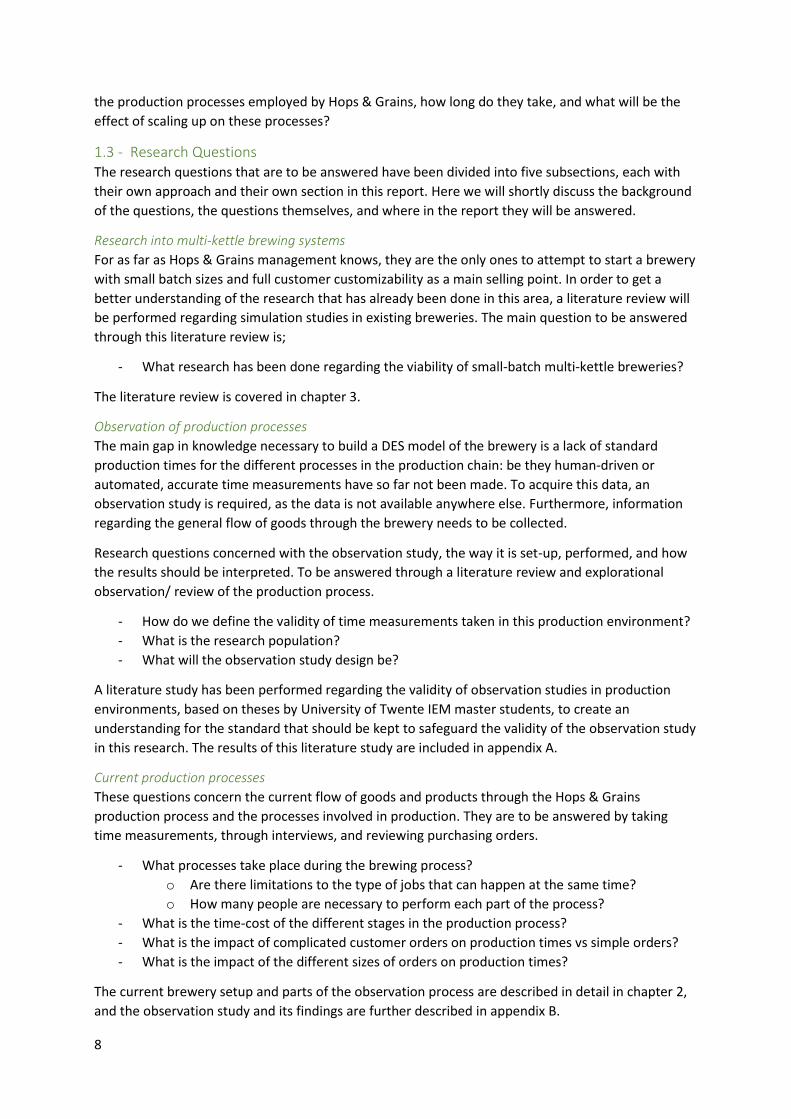
the production processes employed by Hops & Grains, how long do they take, and what will be the
effect of scaling up on these processes?
1.3 - Research Questions The research questions that are to be answered have been divided into five subsections, each with
their own approach and their own section in this report. Here we will shortly discuss the background
of the questions, the questions themselves, and where in the report they will be answered.
Research into multi-kettle brewing systems
For as far as Hops & Grains management knows, they are the only ones to attempt to start a brewery
with small batch sizes and full customer customizability as a main selling point. In order to get a
better understanding of the research that has already been done in this area, a literature review will
be performed regarding simulation studies in existing breweries. The main question to be answered
through this literature review is;
- What research has been done regarding the viability of small-batch multi-kettle breweries?
The literature review is covered in chapter 3.
Observation of production processes
The main gap in knowledge necessary to build a DES model of the brewery is a lack of standard
production times for the different processes in the production chain: be they human-driven or
automated, accurate time measurements have so far not been made. To acquire this data, an
observation study is required, as the data is not available anywhere else. Furthermore, information
regarding the general flow of goods through the brewery needs to be collected.
Research questions concerned with the observation study, the way it is set-up, performed, and how
the results should be interpreted. To be answered through a literature review and explorational
observation/ review of the production process.
- How do we define the validity of time measurements taken in this production environment?
- What is the research population?
- What will the observation study design be?
A literature study has been performed regarding the validity of observation studies in production
environments, based on theses by University of Twente IEM master students, to create an
understanding for the standard that should be kept to safeguard the validity of the observation study
in this research. The results of this literature study are included in appendix A.
Current production processes
These questions concern the current flow of goods and products through the Hops & Grains
production process and the processes involved in production. They are to be answered by taking
time measurements, through interviews, and reviewing purchasing orders.
- What processes take place during the brewing process?
o Are there limitations to the type of jobs that can happen at the same time?
o How many people are necessary to perform each part of the process?
- What is the time-cost of the different stages in the production process?
- What is the impact of complicated customer orders on production times vs simple orders?
- What is the impact of the different sizes of orders on production times?
The current brewery setup and parts of the observation process are described in detail in chapter 2,
and the observation study and its findings are further described in appendix B.
9
Simulation Model Targets
In order to build a useful and accurate DES model of the brewery, we need to focus on the most
relevant outputs, and measure the performance of the model in certain setups. Important to note is
the way we transcribe the current situation to a functional, scalable simulation model. These
questions are to be answered through study of the production processes and analysing relevant
literature.
- How do we model the complex brewing operations in an easily scalable model?
- To what degree do we simulate the different jobs in the brewery?
The building of the simulation model will be discussed in chapter 4.
Key Performance indicators
In addition to the other research questions, Hops & Grains management has designated a handful of
key performance indicators that are relevant to any envisioned version of the brewery. Thus, the DES
model must be able to answer the following questions:
- What is the total time employees work on jobs, divided by their total time spent at the
brewery?
- What is the waiting time between critical parts of the production process?
- How many individual orders are processed through the system?
- How many crates are produced and delivered?
- How much of the available storage capacity is occupied on an average day in the brewery?
- How many days do orders spend in the brewery on average?
- How many orders are cancelled before the end of the brew day (because they take too
long)?
- How much revenue is generated, and does this offset the costs of operations?
Of these, the most important are Profit and Waiting time, which is a main quality indicator. These
KPI’s and what their results tell us about different brewery setups/scenarios will be discussed in
detail in chapter 5.
Scalability
Scalability is “the property of a system to handle a growing amount of work by adding resources to
the system” (Bondi, 2000). In order to asses whether or not Hops & Grains possesses a scalable
business model, we must test the simulation on its ability to handle more orders as we add more
resources to the system.
These are research questions regarding the subject of scalability, the application of the findings of
the observation study in a Discrete Event Simulation Model, and finalization of the deliverables. To
be answered using interviews, simple observation, literature review and simulation.
- What are the scale-up targets?
o What would a scaled-up version of this business look like?
o How do we conclude that “scaling up” is possible?
- What are the expected benefits of scaling up the production?
o Will scaling up be possible within the confines of the current brewery, or is a bigger
space required?
o What are the limitations of the current space?
o What bottlenecks can be expected when scaling up production?
These questions are answered in chapter 6.
10
Chapter 2 - Content analysis This chapter covers the layout of the brewery, the processes that are required to brew a single batch
of beer, the work-time measurements that were done and the methods used to gather this data.
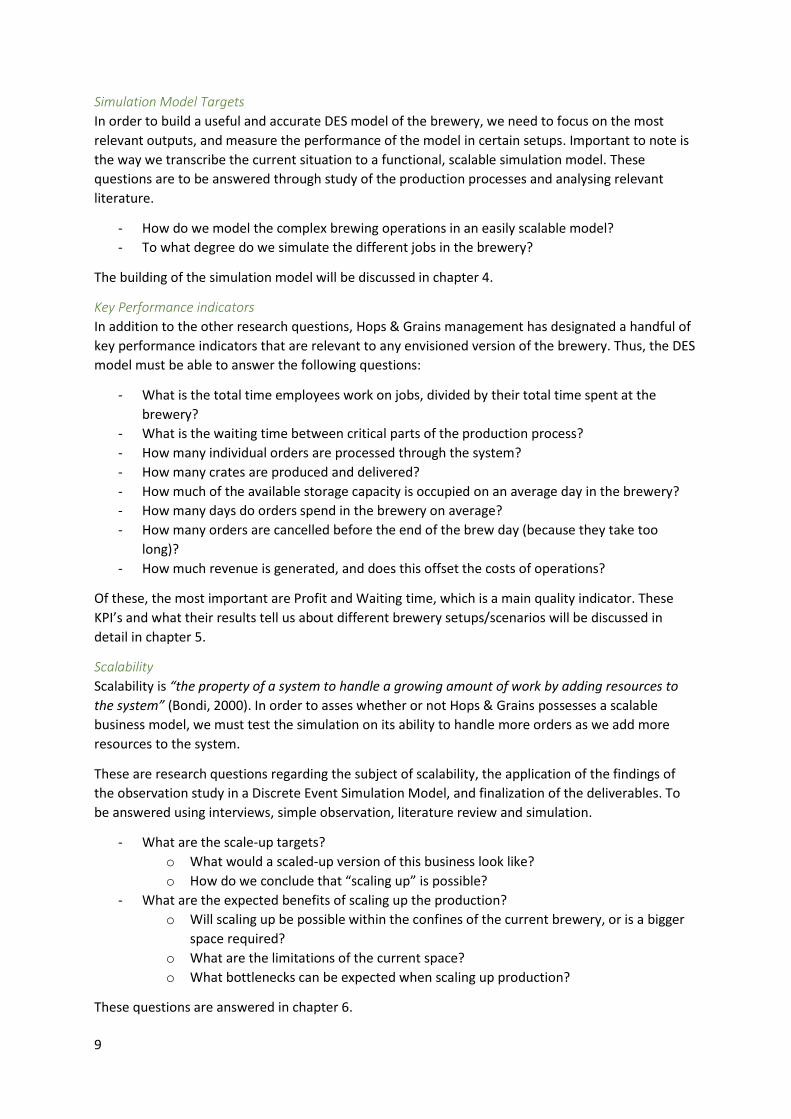
2.1 - Current state of the brewery The brewery has been operational for just under a year at the time of writing, and is very basic in
nature due to monetary constraints. In terms of equipment, it currently houses a few stainless steel
surface areas, two 30L brewing kettles, a malt measurement and milling area with 8 barrels that can
be filled with malt or flakes, and storage capacity for 8 unopened bags of malt or flakes on top. The
brewery houses a freezer unit with limited (< 100L) room for hops, yeasts and different herbs. A
limited amount of water points are available, with two taps for hoses to connect to, a sink for
cleaning and a single waterpoint that is used primarily to flush bottles. Finally, a large walk-in fridge is
located in the corner of the brewery, currently turned off and used as a fermentation chamber.
Inside this fermentation chamber there is currently room for 30 batches of beer, although
management expects to be able to increase this to at least 50 batches if needed.
A design for the layout of the brewery can be found in Figure 2. In this design the number of kettles
has been increased to 5 whilst the number of sparge water heaters has been increased to 4, but not
much else is changed.
Figure 2: Current design for potential layout of the brewery
11
The website the brewery depends on to collect order is also still under heavy development, although
a beta-version is currently online and orders do trickle in at a rate of approximately one per two
weeks. When the new version is online management expects this rate to gradually increase to 5 per
week, at which point they estimate a serious capacity problem would start to appear in the current
brewery setup, requiring the purchase of additional kettles and the aforementioned expansion of
storage capacity.
One further task that is not a standardized part of the process yet is the delivery of completed
batches to a customers’ home address. As such, it will not be a part of this study.
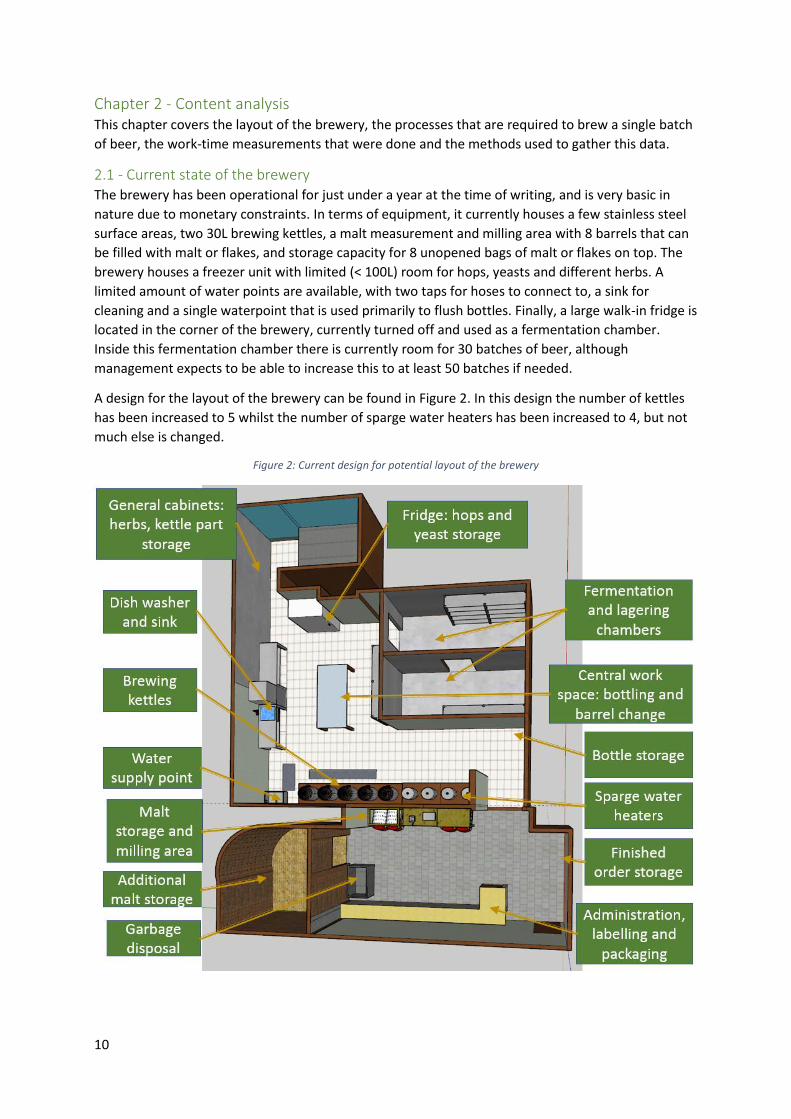
2.2 - Production process Figure 3 shows the current process flow of a single order in the Hops & Grains brewery. All these
steps require employee intervention either during the entire process, or only to prepare a machine
to do a job. All jobs can be performed by a single employee. From beginning to end, the process
takes a minimum of three weeks, with times up to five weeks not being uncommon. The different
processes and their descriptions are shown in Table 1.
Figure 3
12
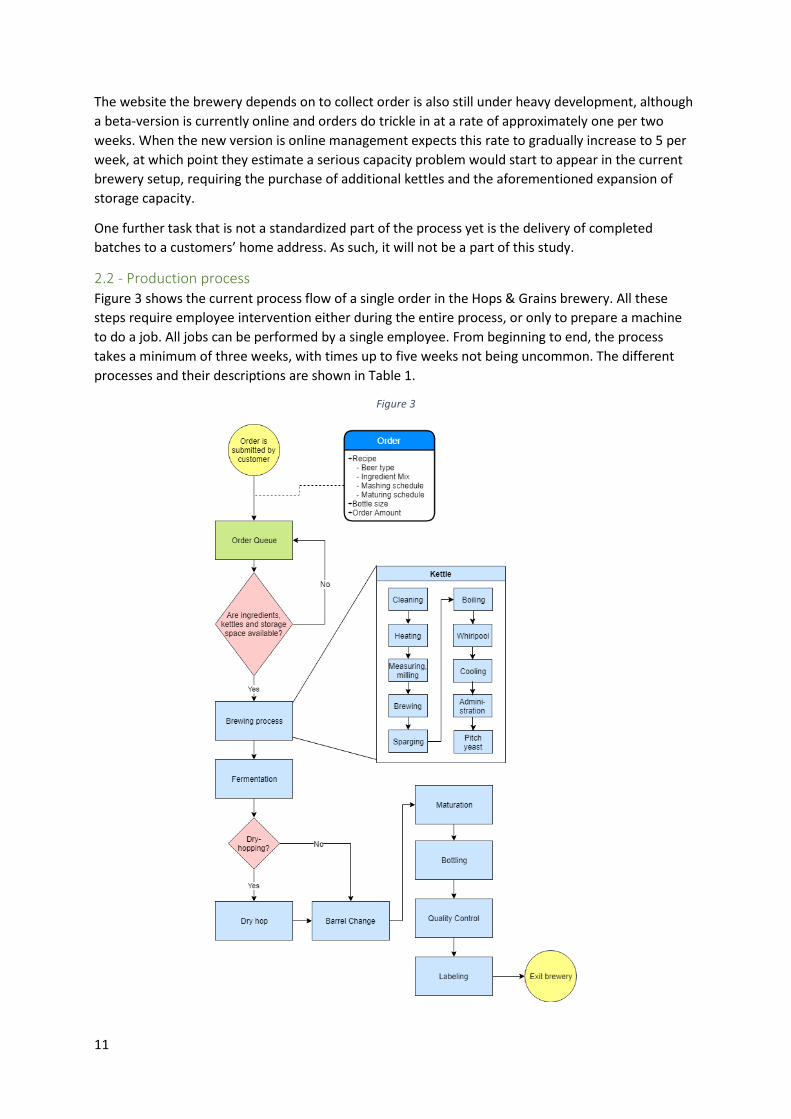
Table 1: Brewing Steps
Process Description
Cleaning Once a kettle is chosen, it is rinsed and its components prepared for usage
Heating The kettle is filled with the appropriate amount of water and set to heating
Measure/milling The specified amount of grain and flakes are measured out and the grains are milled
Brewing Once the kettle has reached mashing temperature, the grains are added and the automatic mashing cycle commences. Starch molecules are broken down into sugars, creating a sugary water mix called wort.
Sparging After mashing finishes, the grains are lifted above the kettle and heated sparging water is gently distributed over top to extract final sugars from the grains
Boiling The wort is brought to a boil and during a 60-minute period hops, potential herbs, sugars, and beer additives are added to the wort at the 60 minute, 30 minute, and 5 minute mark respectively.
Whirlpool After the boiling finishes, a whirlpool is created in the kettle with a paddle attachment, and the wort is left to rest for 10 minutes
Cooling A counter-flow chilling unit is connected to the kettle and the wort is cooled to 20 degrees Celsius, before being deposited in a clean yeasting vat. Initial gravity measurements are taken and yeast is pitched into the wort: this last action turns it into beer.
Fermentation The beer is placed in a fermentation chamber at stable room temperature and during a seven-day period, it is left to ferment beer sugars into alcohol. If the beer requires dry hopping, these are added after only three days, leaving the beer to soak up flavour for another four days.
Barrel Change After the seven days of fermentation, the beer is transferred into a new, clean yeasting vat to get rid of the sediment that has settled in the old one.
Maturing Depending on the beer type, the beer is left to mature for 1 to 3 weeks in the fermentation chamber. Ideally, this last fermentation chamber is cooled to 2 degrees.
Bottling Final gravity measurements are taken to calculate the amount of alcohol that has formed in the beer. Bottling sugar is added to the beer to re-activate the yeast. The correct type of bottles are cleaned and filled with the beer, before being capped with cleaned bottlecaps and being rinsed. The bottles are clearly marked to indicate their contents, administration is updated, and they are stored for a minimum of three days to allow pressure to build up.
Quality Control A single bottle is opened and tasted to check the contents for quality.
Labelling The chosen labels are updated with the correct information regarding alcohol contents, ingredients, beer colour, etc. They are printed and the bottles are labelled manually, placed in a box, sealed with a wax stamp, and prepared for transport.
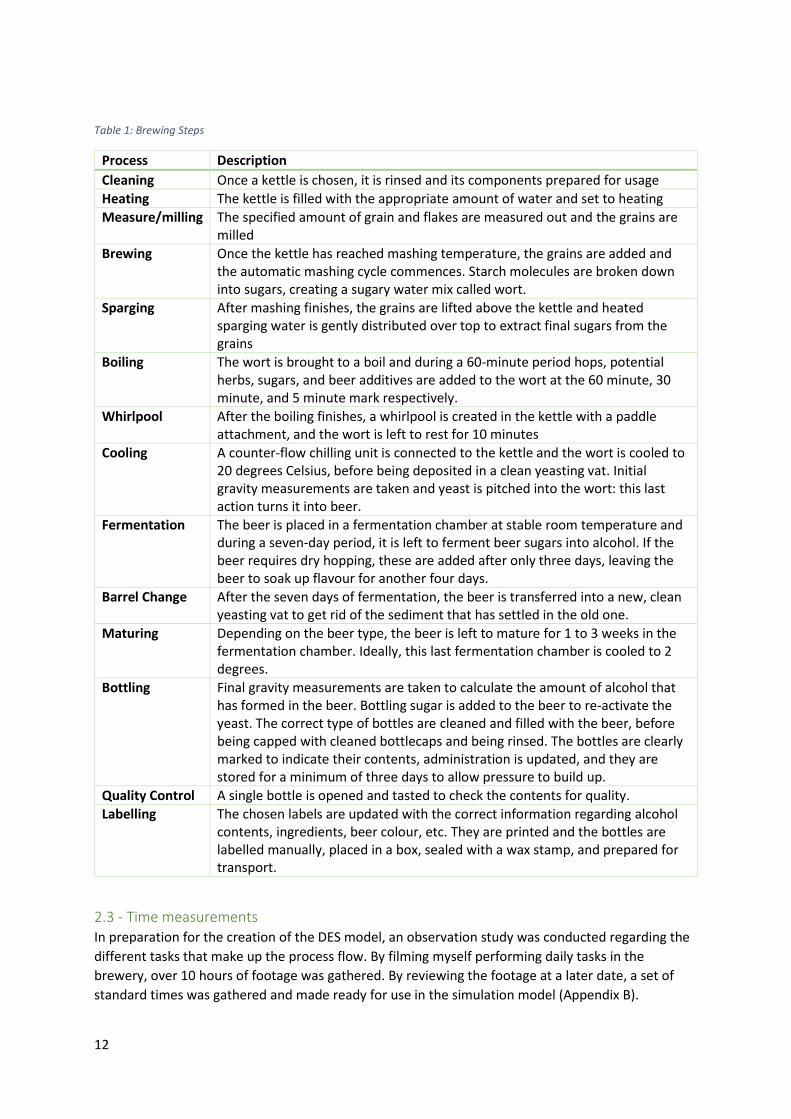
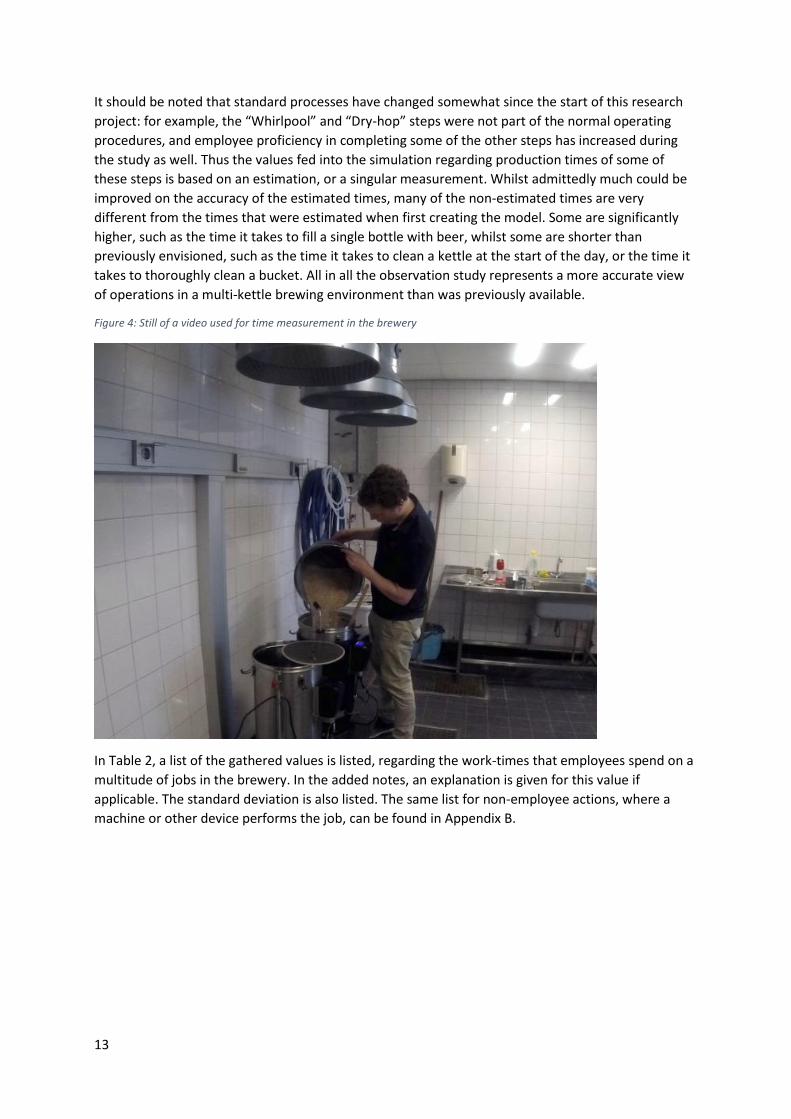
2.3 - Time measurements In preparation for the creation of the DES model, an observation study was conducted regarding the
different tasks that make up the process flow. By filming myself performing daily tasks in the
brewery, over 10 hours of footage was gathered. By reviewing the footage at a later date, a set of
standard times was gathered and made ready for use in the simulation model (Appendix B).
13
It should be noted that standard processes have changed somewhat since the start of this research
project: for example, the “Whirlpool” and “Dry-hop” steps were not part of the normal operating
procedures, and employee proficiency in completing some of the other steps has increased during
the study as well. Thus the values fed into the simulation regarding production times of some of
these steps is based on an estimation, or a singular measurement. Whilst admittedly much could be
improved on the accuracy of the estimated times, many of the non-estimated times are very
different from the times that were estimated when first creating the model. Some are significantly
higher, such as the time it takes to fill a single bottle with beer, whilst some are shorter than
previously envisioned, such as the time it takes to clean a kettle at the start of the day, or the time it
takes to thoroughly clean a bucket. All in all the observation study represents a more accurate view
of operations in a multi-kettle brewing environment than was previously available.
Figure 4: Still of a video used for time measurement in the brewery
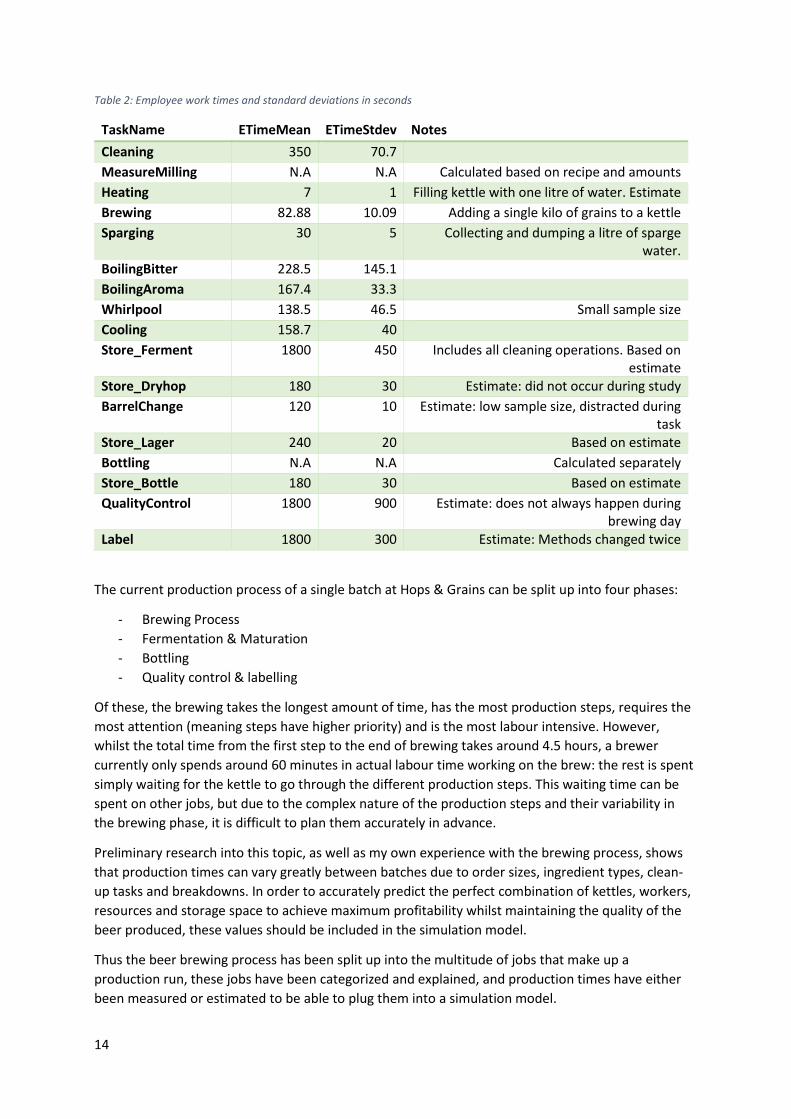
In Table 2, a list of the gathered values is listed, regarding the work-times that employees spend on a
multitude of jobs in the brewery. In the added notes, an explanation is given for this value if
applicable. The standard deviation is also listed. The same list for non-employee actions, where a
machine or other device performs the job, can be found in Appendix B.
14
Table 2: Employee work times and standard deviations in seconds
TaskName ETimeMean ETimeStdev Notes
Cleaning 350 70.7
MeasureMilling N.A N.A Calculated based on recipe and amounts
Heating 7 1 Filling kettle with one litre of water. Estimate
Brewing 82.88 10.09 Adding a single kilo of grains to a kettle
Sparging 30 5 Collecting and dumping a litre of sparge water.
BoilingBitter 228.5 145.1
BoilingAroma 167.4 33.3
Whirlpool 138.5 46.5 Small sample size
Cooling 158.7 40
Store_Ferment 1800 450 Includes all cleaning operations. Based on estimate
Store_Dryhop 180 30 Estimate: did not occur during study
BarrelChange 120 10 Estimate: low sample size, distracted during task
Store_Lager 240 20 Based on estimate
Bottling N.A N.A Calculated separately
Store_Bottle 180 30 Based on estimate
QualityControl 1800 900 Estimate: does not always happen during brewing day
Label 1800 300 Estimate: Methods changed twice
The current production process of a single batch at Hops & Grains can be split up into four phases:
- Brewing Process
- Fermentation & Maturation
- Bottling
- Quality control & labelling
Of these, the brewing takes the longest amount of time, has the most production steps, requires the
most attention (meaning steps have higher priority) and is the most labour intensive. However,
whilst the total time from the first step to the end of brewing takes around 4.5 hours, a brewer
currently only spends around 60 minutes in actual labour time working on the brew: the rest is spent
simply waiting for the kettle to go through the different production steps. This waiting time can be
spent on other jobs, but due to the complex nature of the production steps and their variability in
the brewing phase, it is difficult to plan them accurately in advance.
Preliminary research into this topic, as well as my own experience with the brewing process, shows
that production times can vary greatly between batches due to order sizes, ingredient types, clean-
up tasks and breakdowns. In order to accurately predict the perfect combination of kettles, workers,
resources and storage space to achieve maximum profitability whilst maintaining the quality of the
beer produced, these values should be included in the simulation model.
Thus the beer brewing process has been split up into the multitude of jobs that make up a
production run, these jobs have been categorized and explained, and production times have either
been measured or estimated to be able to plug them into a simulation model.
15
Chapter 3 - Literature Review In this chapter, we will discuss the literature study that has been performed to answer the research
question “What research has been done regarding the viability of small-batch multi-kettle
breweries?”. Beer brewing has been a major industry for many generations, and as such it has not
stayed untouched by scientific research. Many studies concerning efficiency or scalability at Small
and Medium Breweries (SMB’s) have been conducted regarding different steps of the brewing
process, of which I have selected a few for further review in the order that these steps actually take
place in the real world: firstly focussing on operations planning, and then the steps of the brewing
process.
On Scopus a search was done for articles with a relevance to “Breweries” or “Brewing” and
“Simulation” because I was interested in articles that have to do with simulation of brewery
processes. This lead to 215 results. Of these, many had to do with simulation of complex biochemical
reactions in yeast cultures, energy recovery from discarded resources, toxicology of specific food
types, climate change impact reports and even wine making, all which were excluded as they are not
relevant for the study. All in all, I excluded any study that was not directly targeted at managerial
processes in the brewing industry and made a selection I deemed most relevant consisting of the
following 10 studies.
For example, DES has been used to predict Overall Equipment Effectiveness (OEE) in a SMB by using
automatic translation of real-time plant data into management performance metrics. These were fed
into a DES model of the brewery in question, allowing schedules to be altered accordingly, thus
maximizing KPI’s such as OOE in brewery production systems through real-time DES-enabled decision
making (Mousavi, 2017). Similarly, Siemens Tecnomatic Plant Simulator was used to model a brewery
to create a flexible planning tool for brewing operations. By allowing a brewer to change parameters
and production targets, the tool would output an appropriate production schedule, taking key
bottlenecks into account and maximizing production potential of the available brewing resources.
(Bangsow, 2013)
Moving on from planning to the brewing itself: working in Engineering Equation Solver (EES), four
researchers simulated an entire brewery and the associated energy demands, focusing their research
on energy consumption and conservation options throughout the entire brewing process. As a result,
new mashing profiles were developed that allow improved processing time and quality of produced
beer-wort (Muster-Slawitsch, Hubmann, Murkovic, & Brunner, 2014). Some of the same researchers
later created a calculation tool to predict energy needs in breweries before and after implementation
of key energy-saving technologies (Muster‐Slawitsch, Brunner, & Fluch, 2014).
Cleaning of kettles after brewing is an important step in the process, due to the stickiness of residue
left in the kettle and the health impacts this may have on future brews. EVALPSN control networks
were used to simulate ideal usage of pipelines during CIP (Clean In Pipe) and filtration procedures in
the brewing process, to ensure optimal availability of critical infrastructure in advanced breweries
(Chung & Lai, 2008). Others researched the entire production chain but focussed their main efforts
on simulating the demand for cooling power during wort cooling, fermentation and maturation using
data driven stochastic modelling and simulation (Hubert, Baur, Delgado, Helmers, & Rabiger, 2016).
Another simulation study was performed with a focus on the effects of temperature changes on
yeast activity in the fermentation process. In “Multi-objective process optimisation of beer
fermentation via dynamic simulation”, the beer-wort fermentation processes was simulated with a
focus on enhancing yeast performance through temperature changes controlled by simulated
16
annealing. This study considered ethanol maximisation as well as batch time minimisation (Rodman
& Gerogiorgis, 2016).
Other studies focussed on cleaning and bottling procedures, mainly with a focus to save water:
“Optimisation of water usage in a brewery clean-in-place system using reference nets”, simulates
cleaning systems in a brewery with the objective to save water costs using high-level petri nets
(Pettigrew, Blomenhofer, Hubert, Groß, & Delgado, 2015). In a follow-up study, “Simulation
modelling of bottling line water demand levels using reference nets and stochastic models”, some of
the same researchers also used high-level petri nets and Java to focus on SMB water management in
the bottling phase, and stochastic demand modelling (Hubert, Baur, Delgado, Helmers, & Rabiger,
2016).
Bottling procedures were also studied in regards to a packaging line, where advanced techniques for
discrete event simulation were utilized to cover a wide range of methods and applications to
emulate, advice and predict the behaviour of the complex real-world systems of supply and demand
in a major aluminium can packaging line (Achkar, Picech, & Méndez, 2015). This last paper covers an
“important brewery”, implying a large-scale system.
This was a quick look into the great amount of research that has been done regarding simulation
studies in small to medium breweries (SMBs) and larger breweries as well. These studies cover a
large variety of topics concerning the brewing process, from initial mashing procedures to
fermentation efficiency and bottling works. Many also focus on energy or water conservation.
Discrete Event Simulation has been used in many of these studies and it follows that it will also fit
well for my own simulation. However, no publicly available research has been concluded on the topic
of production planning in small-batch multi-kettle breweries, indicating a gap of knowledge in this
area that is to be filled with conclusions from my own thesis.
17
Chapter 4 - Conceptual Model This chapter focuses on conceptualizing the Discrete Event Simulation (DES) model that represents
the Hops & Grains brewery. The model must simulate the brewing process and resource
management from the moment an order arrives in the brewery, to the moment an order is ready to
be packaged and sent to the customer. This DES model is filled with moving entities representing
workers and orders, resources depicting the different stages in the brewing process that orders in
the system go through, and the processes that guide them through the system. The model is flexible,
allowing an observer to change the number of workers, kettles, storage- and production locations
presented in the system. This is to enable experimentation with an optimal set-up for the current,
relatively small brewery, as well as a preferred set-up for hypothetical future breweries.
Employee occupancy and overtime is also tracked, as well as the hourly occupancy of the available
storage space and daily finances. This way, the model will give an accurate overview of the most
important KPI’s, as directed by Hops & Grains management.
In this chapter we will discuss the composition of simulated customer orders that are passed into the
model, the path these orders will take through the model, kettles and other job locations, time
calculations for different tasks, task simulation, workers and their properties, finance calculations,
time measurements and finally a list of assumptions that has been made during the building of the
model.
4.1 – Orders and recipe composition In the real world, after a customer creates a recipe in the recipe mixer, an order is passed along to
the brewer with information such as the ingredient composition, amount of fermentable ingredients
per 10 litres of final product, the bottle-type and number of crates as chosen by the customer. This is
important, as different beer styles take different ingredients to brew, and bottle types and amounts
have great impact on the length that is taken to complete many steps in the process.
This information is also generated for each order as it first enters the simulated brewery. Firstly when
an order enters the brewery, one of four recipe types is chosen: Blond, IPA, Tripel, or Stout. Although
a gross oversimplification of the types of beers that can be created in real life, their base values and
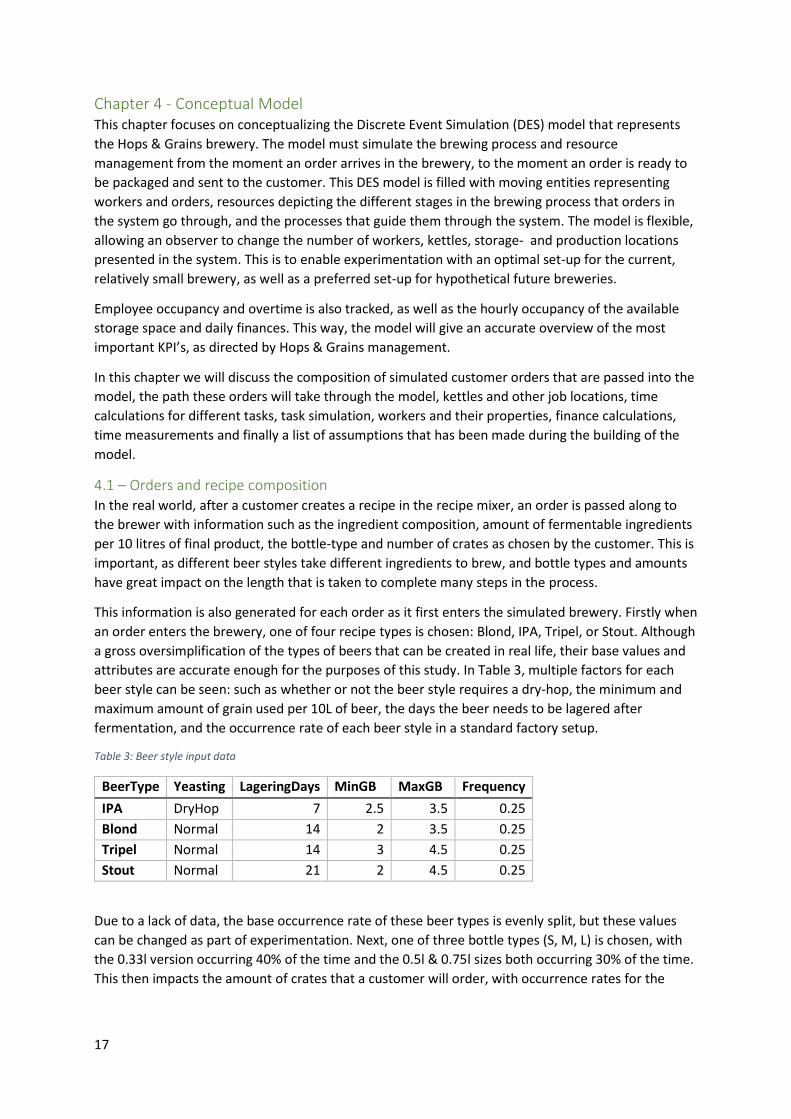
attributes are accurate enough for the purposes of this study. In Table 3, multiple factors for each
beer style can be seen: such as whether or not the beer style requires a dry-hop, the minimum and
maximum amount of grain used per 10L of beer, the days the beer needs to be lagered after
fermentation, and the occurrence rate of each beer style in a standard factory setup.
Table 3: Beer style input data
BeerType Yeasting LageringDays MinGB MaxGB Frequency
IPA DryHop 7 2.5 3.5 0.25
Blond Normal 14 2 3.5 0.25
Tripel Normal 14 3 4.5 0.25
Stout Normal 21 2 4.5 0.25
Due to a lack of data, the base occurrence rate of these beer types is evenly split, but these values
can be changed as part of experimentation. Next, one of three bottle types (S, M, L) is chosen, with
the 0.33l version occurring 40% of the time and the 0.5l & 0.75l sizes both occurring 30% of the time.
This then impacts the amount of crates that a customer will order, with occurrence rates for the
18
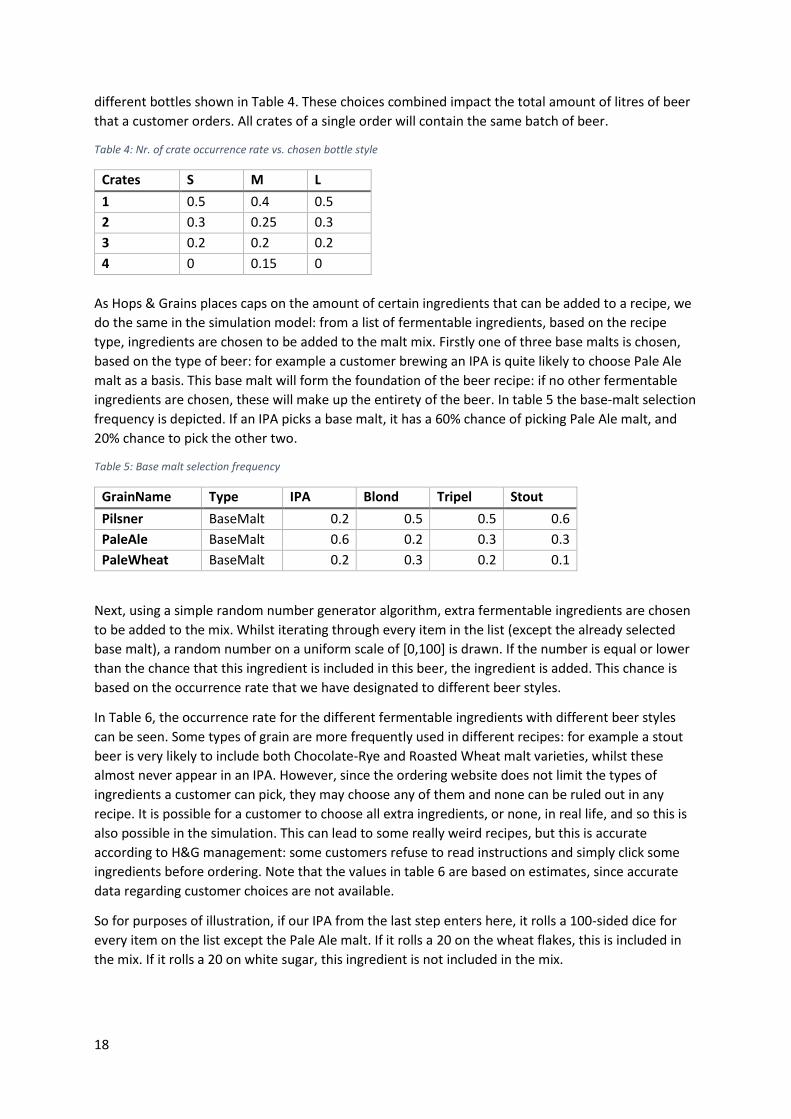
different bottles shown in Table 4. These choices combined impact the total amount of litres of beer
that a customer orders. All crates of a single order will contain the same batch of beer.
Table 4: Nr. of crate occurrence rate vs. chosen bottle style
Crates S M L
1 0.5 0.4 0.5
2 0.3 0.25 0.3
3 0.2 0.2 0.2
4 0 0.15 0
As Hops & Grains places caps on the amount of certain ingredients that can be added to a recipe, we
do the same in the simulation model: from a list of fermentable ingredients, based on the recipe
type, ingredients are chosen to be added to the malt mix. Firstly one of three base malts is chosen,
based on the type of beer: for example a customer brewing an IPA is quite likely to choose Pale Ale
malt as a basis. This base malt will form the foundation of the beer recipe: if no other fermentable
ingredients are chosen, these will make up the entirety of the beer. In table 5 the base-malt selection
frequency is depicted. If an IPA picks a base malt, it has a 60% chance of picking Pale Ale malt, and
20% chance to pick the other two.
Table 5: Base malt selection frequency
GrainName Type IPA Blond Tripel Stout
Pilsner BaseMalt 0.2 0.5 0.5 0.6
PaleAle BaseMalt 0.6 0.2 0.3 0.3
PaleWheat BaseMalt 0.2 0.3 0.2 0.1
Next, using a simple random number generator algorithm, extra fermentable ingredients are chosen
to be added to the mix. Whilst iterating through every item in the list (except the already selected
base malt), a random number on a uniform scale of [0,100] is drawn. If the number is equal or lower
than the chance that this ingredient is included in this beer, the ingredient is added. This chance is
based on the occurrence rate that we have designated to different beer styles.
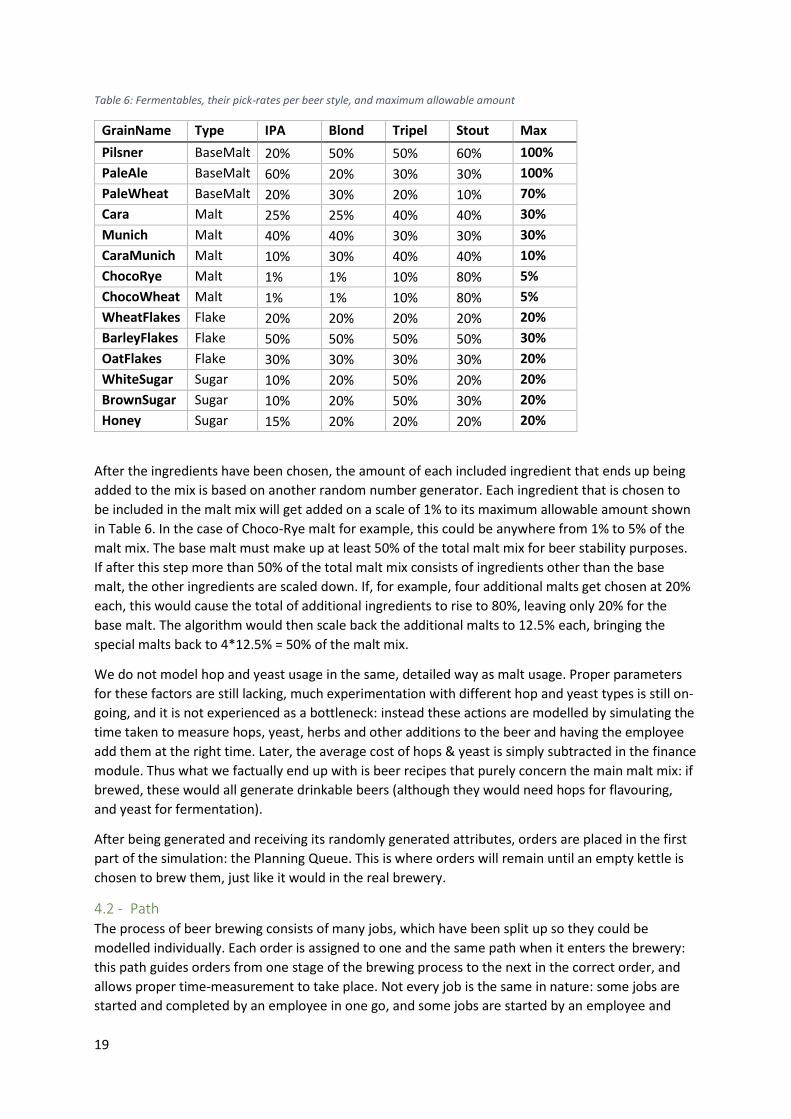
In Table 6, the occurrence rate for the different fermentable ingredients with different beer styles
can be seen. Some types of grain are more frequently used in different recipes: for example a stout
beer is very likely to include both Chocolate-Rye and Roasted Wheat malt varieties, whilst these
almost never appear in an IPA. However, since the ordering website does not limit the types of
ingredients a customer can pick, they may choose any of them and none can be ruled out in any
recipe. It is possible for a customer to choose all extra ingredients, or none, in real life, and so this is
also possible in the simulation. This can lead to some really weird recipes, but this is accurate
according to H&G management: some customers refuse to read instructions and simply click some
ingredients before ordering. Note that the values in table 6 are based on estimates, since accurate
data regarding customer choices are not available.
So for purposes of illustration, if our IPA from the last step enters here, it rolls a 100-sided dice for
every item on the list except the Pale Ale malt. If it rolls a 20 on the wheat flakes, this is included in
the mix. If it rolls a 20 on white sugar, this ingredient is not included in the mix.
19
Table 6: Fermentables, their pick-rates per beer style, and maximum allowable amount
GrainName Type IPA Blond Tripel Stout Max
Pilsner BaseMalt 20% 50% 50% 60% 100%
PaleAle BaseMalt 60% 20% 30% 30% 100%
PaleWheat BaseMalt 20% 30% 20% 10% 70%
Cara Malt 25% 25% 40% 40% 30%
Munich Malt 40% 40% 30% 30% 30%
CaraMunich Malt 10% 30% 40% 40% 10%
ChocoRye Malt 1% 1% 10% 80% 5%
ChocoWheat Malt 1% 1% 10% 80% 5%
WheatFlakes Flake 20% 20% 20% 20% 20%
BarleyFlakes Flake 50% 50% 50% 50% 30%
OatFlakes Flake 30% 30% 30% 30% 20%
WhiteSugar Sugar 10% 20% 50% 20% 20%
BrownSugar Sugar 10% 20% 50% 30% 20%
Honey Sugar 15% 20% 20% 20% 20%
After the ingredients have been chosen, the amount of each included ingredient that ends up being
added to the mix is based on another random number generator. Each ingredient that is chosen to
be included in the malt mix will get added on a scale of 1% to its maximum allowable amount shown
in Table 6. In the case of Choco-Rye malt for example, this could be anywhere from 1% to 5% of the
malt mix. The base malt must make up at least 50% of the total malt mix for beer stability purposes.
If after this step more than 50% of the total malt mix consists of ingredients other than the base
malt, the other ingredients are scaled down. If, for example, four additional malts get chosen at 20%
each, this would cause the total of additional ingredients to rise to 80%, leaving only 20% for the
base malt. The algorithm would then scale back the additional malts to 12.5% each, bringing the
special malts back to 4*12.5% = 50% of the malt mix.
We do not model hop and yeast usage in the same, detailed way as malt usage. Proper parameters
for these factors are still lacking, much experimentation with different hop and yeast types is still on-
going, and it is not experienced as a bottleneck: instead these actions are modelled by simulating the
time taken to measure hops, yeast, herbs and other additions to the beer and having the employee
add them at the right time. Later, the average cost of hops & yeast is simply subtracted in the finance
module. Thus what we factually end up with is beer recipes that purely concern the main malt mix: if
brewed, these would all generate drinkable beers (although they would need hops for flavouring,
and yeast for fermentation).
After being generated and receiving its randomly generated attributes, orders are placed in the first
part of the simulation: the Planning Queue. This is where orders will remain until an empty kettle is
chosen to brew them, just like it would in the real brewery.
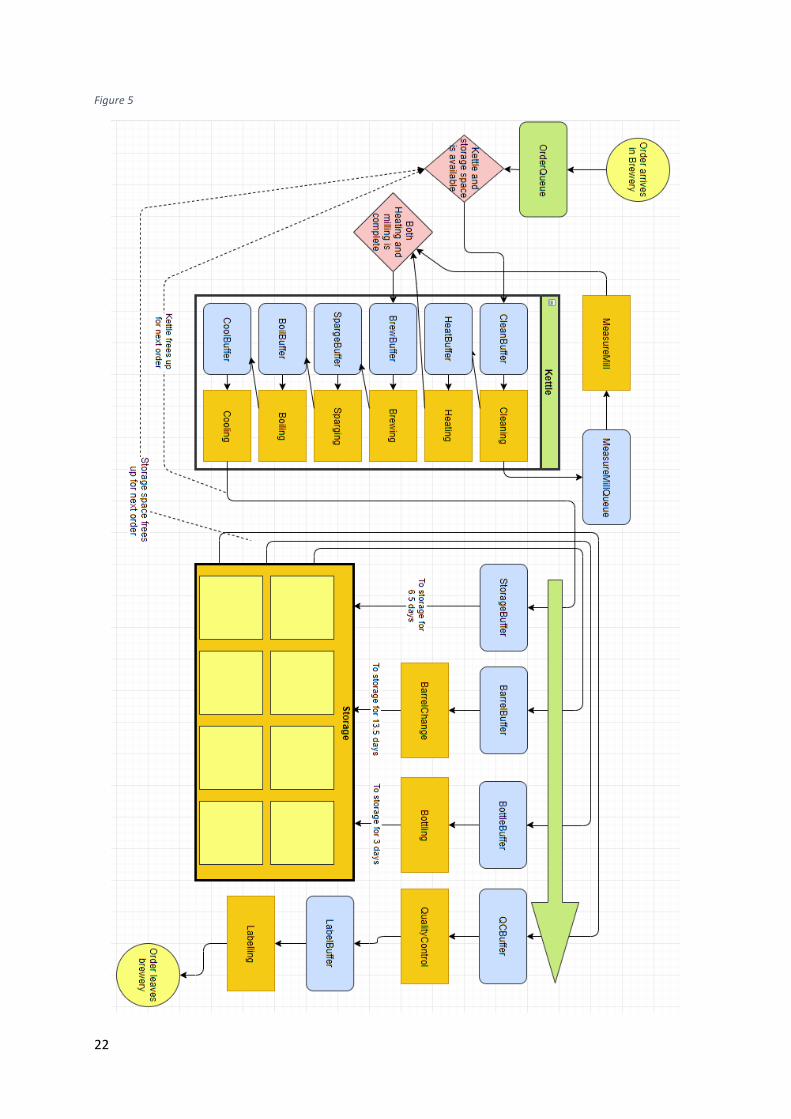
4.2 - Path The process of beer brewing consists of many jobs, which have been split up so they could be
modelled individually. Each order is assigned to one and the same path when it enters the brewery:
this path guides orders from one stage of the brewing process to the next in the correct order, and
allows proper time-measurement to take place. Not every job is the same in nature: some jobs are
started and completed by an employee in one go, and some jobs are started by an employee and
20
finished by a machine. After a machine finishes a step, the next job in line is picked up by an
employee and it is assumed that this job includes any finishing touches needed on the last job, such
as putting an order back in storage. We separate the jobs into two parts: “employee time” and
“machine time”, to differentiate between parts where an employee spends time on a job and the
part where a machine takes over.
Note that in the “Machine time” we include any step of the brewing process where employee
intervention is not needed, even if no machines are actually involved. The most notable example of
this is the “machine time” for the fermentation process, where an order simply sits on a shelf for
almost a week.
In essence, this model simulates the continuous stream of employee actions needed to complete
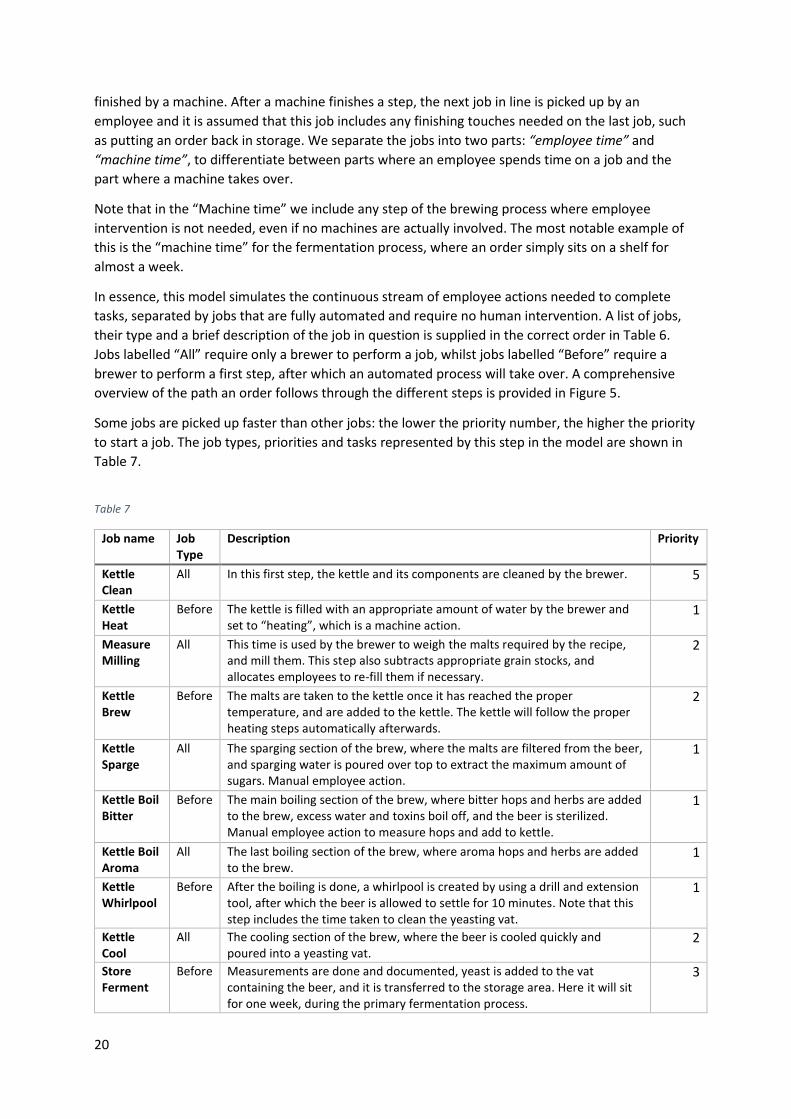
tasks, separated by jobs that are fully automated and require no human intervention. A list of jobs,
their type and a brief description of the job in question is supplied in the correct order in Table 6.
Jobs labelled “All” require only a brewer to perform a job, whilst jobs labelled “Before” require a
brewer to perform a first step, after which an automated process will take over. A comprehensive
overview of the path an order follows through the different steps is provided in Figure 5.
Some jobs are picked up faster than other jobs: the lower the priority number, the higher the priority
to start a job. The job types, priorities and tasks represented by this step in the model are shown in
Table 7.
Table 7
Job name Job Type
Description Priority
Kettle Clean
All In this first step, the kettle and its components are cleaned by the brewer. 5
Kettle Heat
Before The kettle is filled with an appropriate amount of water by the brewer and set to “heating”, which is a machine action.
1
Measure Milling
All This time is used by the brewer to weigh the malts required by the recipe, and mill them. This step also subtracts appropriate grain stocks, and allocates employees to re-fill them if necessary.
2
Kettle Brew
Before The malts are taken to the kettle once it has reached the proper temperature, and are added to the kettle. The kettle will follow the proper heating steps automatically afterwards.
2
Kettle Sparge
All The sparging section of the brew, where the malts are filtered from the beer, and sparging water is poured over top to extract the maximum amount of sugars. Manual employee action.
1
Kettle Boil Bitter
Before The main boiling section of the brew, where bitter hops and herbs are added to the brew, excess water and toxins boil off, and the beer is sterilized. Manual employee action to measure hops and add to kettle.
1
Kettle Boil Aroma
All The last boiling section of the brew, where aroma hops and herbs are added to the brew.
1
Kettle Whirlpool
Before After the boiling is done, a whirlpool is created by using a drill and extension tool, after which the beer is allowed to settle for 10 minutes. Note that this step includes the time taken to clean the yeasting vat.
1
Kettle Cool
All The cooling section of the brew, where the beer is cooled quickly and poured into a yeasting vat.
2
Store Ferment
Before Measurements are done and documented, yeast is added to the vat containing the beer, and it is transferred to the storage area. Here it will sit for one week, during the primary fermentation process.
3
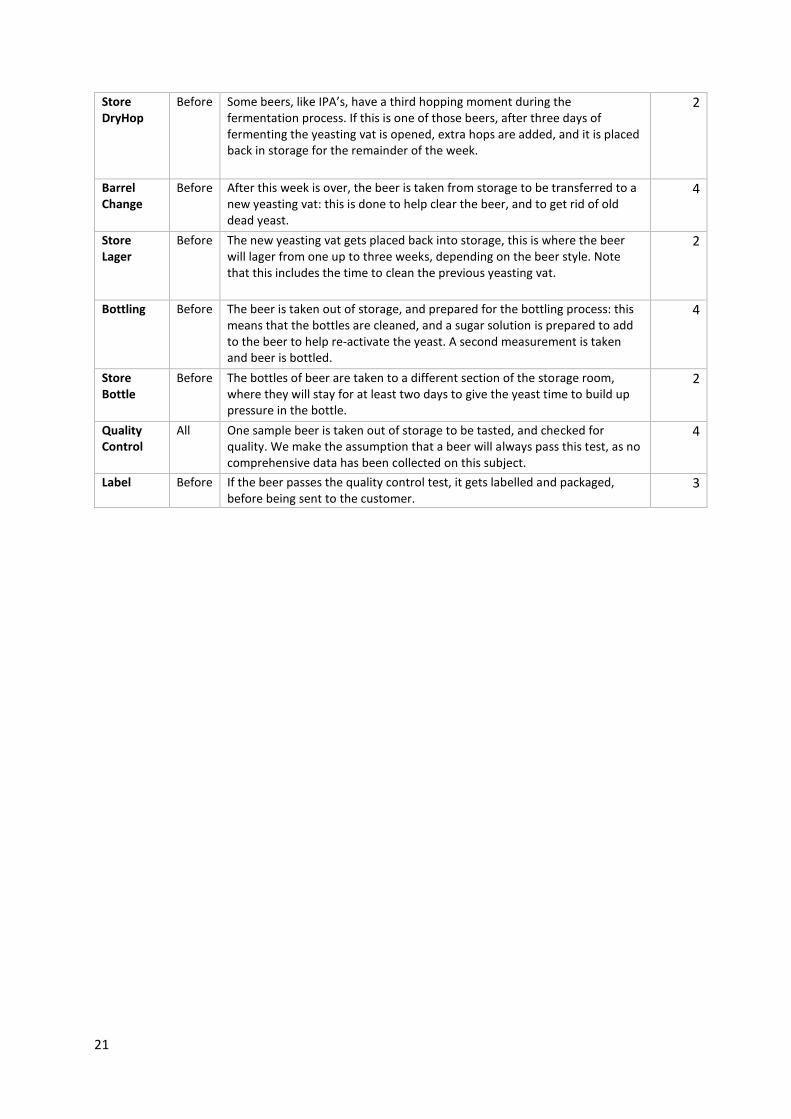
21
Store DryHop
Before Some beers, like IPA’s, have a third hopping moment during the fermentation process. If this is one of those beers, after three days of fermenting the yeasting vat is opened, extra hops are added, and it is placed back in storage for the remainder of the week.
2
Barrel Change
Before After this week is over, the beer is taken from storage to be transferred to a new yeasting vat: this is done to help clear the beer, and to get rid of old dead yeast.
4
Store Lager
Before The new yeasting vat gets placed back into storage, this is where the beer will lager from one up to three weeks, depending on the beer style. Note that this includes the time to clean the previous yeasting vat.
2
Bottling Before The beer is taken out of storage, and prepared for the bottling process: this means that the bottles are cleaned, and a sugar solution is prepared to add to the beer to help re-activate the yeast. A second measurement is taken and beer is bottled.
4
Store Bottle
Before The bottles of beer are taken to a different section of the storage room, where they will stay for at least two days to give the yeast time to build up pressure in the bottle.
2
Quality Control
All One sample beer is taken out of storage to be tasted, and checked for quality. We make the assumption that a beer will always pass this test, as no comprehensive data has been collected on this subject.
4
Label Before If the beer passes the quality control test, it gets labelled and packaged, before being sent to the customer.
3
22
Figure 5
23
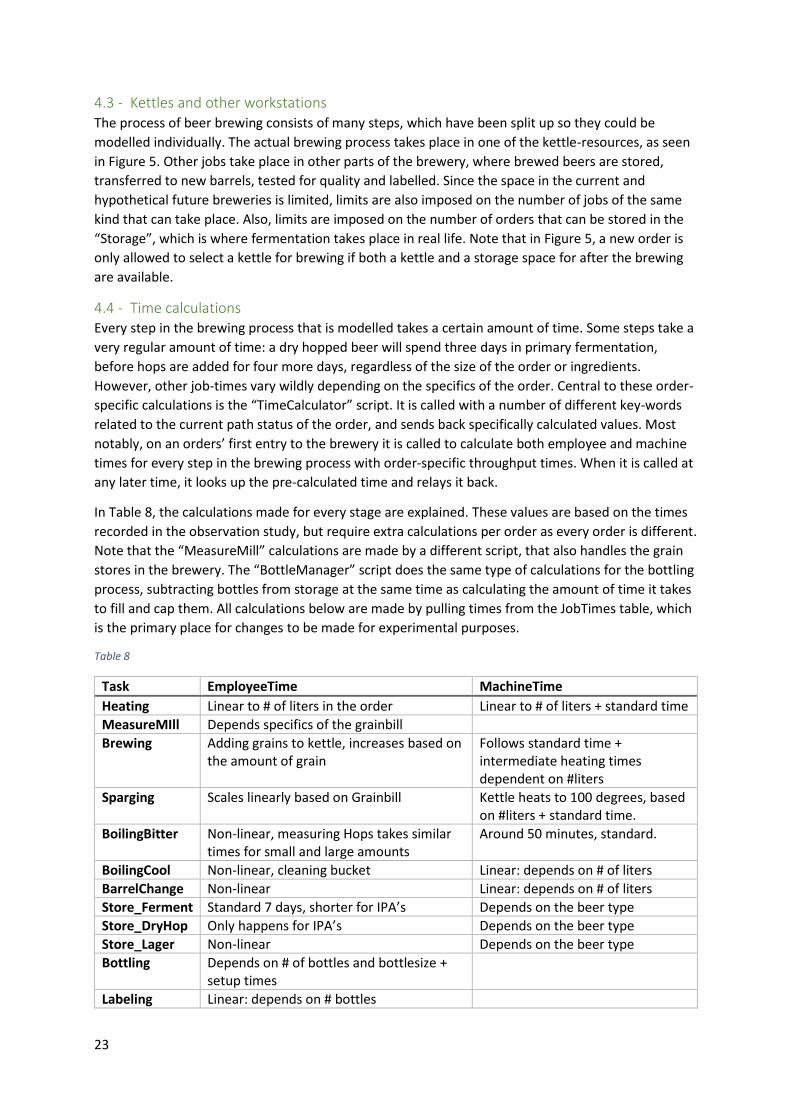
4.3 - Kettles and other workstations The process of beer brewing consists of many steps, which have been split up so they could be
modelled individually. The actual brewing process takes place in one of the kettle-resources, as seen
in Figure 5. Other jobs take place in other parts of the brewery, where brewed beers are stored,
transferred to new barrels, tested for quality and labelled. Since the space in the current and
hypothetical future breweries is limited, limits are also imposed on the number of jobs of the same
kind that can take place. Also, limits are imposed on the number of orders that can be stored in the
“Storage”, which is where fermentation takes place in real life. Note that in Figure 5, a new order is
only allowed to select a kettle for brewing if both a kettle and a storage space for after the brewing
are available.
4.4 - Time calculations Every step in the brewing process that is modelled takes a certain amount of time. Some steps take a
very regular amount of time: a dry hopped beer will spend three days in primary fermentation,
before hops are added for four more days, regardless of the size of the order or ingredients.
However, other job-times vary wildly depending on the specifics of the order. Central to these order-
specific calculations is the “TimeCalculator” script. It is called with a number of different key-words
related to the current path status of the order, and sends back specifically calculated values. Most
notably, on an orders’ first entry to the brewery it is called to calculate both employee and machine
times for every step in the brewing process with order-specific throughput times. When it is called at
any later time, it looks up the pre-calculated time and relays it back.
In Table 8, the calculations made for every stage are explained. These values are based on the times
recorded in the observation study, but require extra calculations per order as every order is different.
Note that the “MeasureMill” calculations are made by a different script, that also handles the grain
stores in the brewery. The “BottleManager” script does the same type of calculations for the bottling
process, subtracting bottles from storage at the same time as calculating the amount of time it takes
to fill and cap them. All calculations below are made by pulling times from the JobTimes table, which
is the primary place for changes to be made for experimental purposes.
Table 8
Task EmployeeTime MachineTime
Heating Linear to # of liters in the order Linear to # of liters + standard time
MeasureMIll Depends specifics of the grainbill
Brewing Adding grains to kettle, increases based on the amount of grain
Follows standard time + intermediate heating times dependent on #liters
Sparging Scales linearly based on Grainbill Kettle heats to 100 degrees, based on #liters + standard time.
BoilingBitter Non-linear, measuring Hops takes similar times for small and large amounts
Around 50 minutes, standard.
BoilingCool Non-linear, cleaning bucket Linear: depends on # of liters
BarrelChange Non-linear Linear: depends on # of liters
Store_Ferment Standard 7 days, shorter for IPA’s Depends on the beer type
Store_DryHop Only happens for IPA’s Depends on the beer type
Store_Lager Non-linear Depends on the beer type
Bottling Depends on # of bottles and bottlesize + setup times
Labeling Linear: depends on # bottles
24
Heating consists of two parts: the time it takes to fill the kettle with water to the right level, and the
time it takes to heat. Both functions increase linearly with the amount of liters in the brew.
Additionally, heating the metal walls of the kettle takes a set amount of time. Calculating the time it
takes to measure and mill also subtracts grain from stock, and incorporates the time needed to
perform a re-filling of a barrel into the measure-milling time.
Sparging consists of three separate tasks: filling the boiler with water to be heated, spilling this water
over the brew, and waiting for the kettle to heat to 100 degrees. For convenience, we assume that a
steady supply of water at the right temperature is always available, as this will likely be the case in a
more advanced version of the brewery. It is directly dependent on the grainbill of the order: for
every KG of grains, about two litres of water are used in sparging. The combined actions of
measuring a litre of water and spilling it over the brew have been measured to be almost exactly 30
seconds on average.
Boiling takes one hour. The first hop addition only happens when the boil starts, and the second only
happens 5 minutes before the end of the boil. The employee actions for these additions take the
same amount of time, meaning this value is used twice. After the main boiling phase is finished, a
whirlpool is created and the kettle is left alone for 10 minutes. The cooling needs to be started and
finished by an employee, and this includes the time taken to sanitize the fermentation vessel. The
cooling itself is dependent on the amount of litres in the brew. During the fermentation step, the
time taken to perform both the normal and dry-hopping stages will be pulled from the pre-calculated
values. For any beer that is not an IPA, the Dry-hop step should turn up as 0, effectively skipping it.
Finally, calculating the time it takes to clean and fill the bottles subtracts these bottles from stock, so
this is only done when it's the orders turn to be bottled.
4.5 - Task simulation Every step of the simulation is made up of two parts: a buffer and a workspace. In Figure 5, the
buffers are represented by blue rounded rectangles, while the workspaces are represented by
orange rectangles with straight edges. The buffer is where an order is sent when it first enters the
step, and the workspace is where both Employee- and Machine-jobs are performed. When an order
enters the buffer, a job is added to a list of jobs that can be picked up by employees or performed by
machines respectively. This job consists of the following data: [Order, Task, employee requirement,
status, priority].
The simulation will then iterate through this list, starting with jobs of high priority that have been in
the queue longer, and checks if a job can or should start every time a change in resource availability
happens. If the brewery is closed for example, no jobs will be started at all, and if the storage is full,
no new orders will be brewed until a new place frees up. All jobs that require a worker depend on
the availability of a free worker at the time, and if a job takes place at a job location, a spot must be
free for it as well. When conditions are met and a job is deemed fit to start, the required time to
finish this part of the job is pulled from a table of work-times specifically generated for this order. If a
worker is required, the worker is set to occupied, the job status is set to “in Progress” and the part of
the simulation that handles the end of jobs is called to trigger in the future at the time where the
task is complete.
At the moment in the future where the job is completed, the simulation checks the type of job that
has been completed, and if a follow-up is required. If, in a task consisting of both an employee- and
machine-job only the employee job has finished, the job is replaced by a machine-job that is to take
place immediately. If a task is totally finished, resources are managed and the job is sent to the next
part of its path, where it will end up in the buffer, signalling the start of waiting time for a new task.
25
This process is repeated until an order has passed through all parts of the simulation, and is
completed.
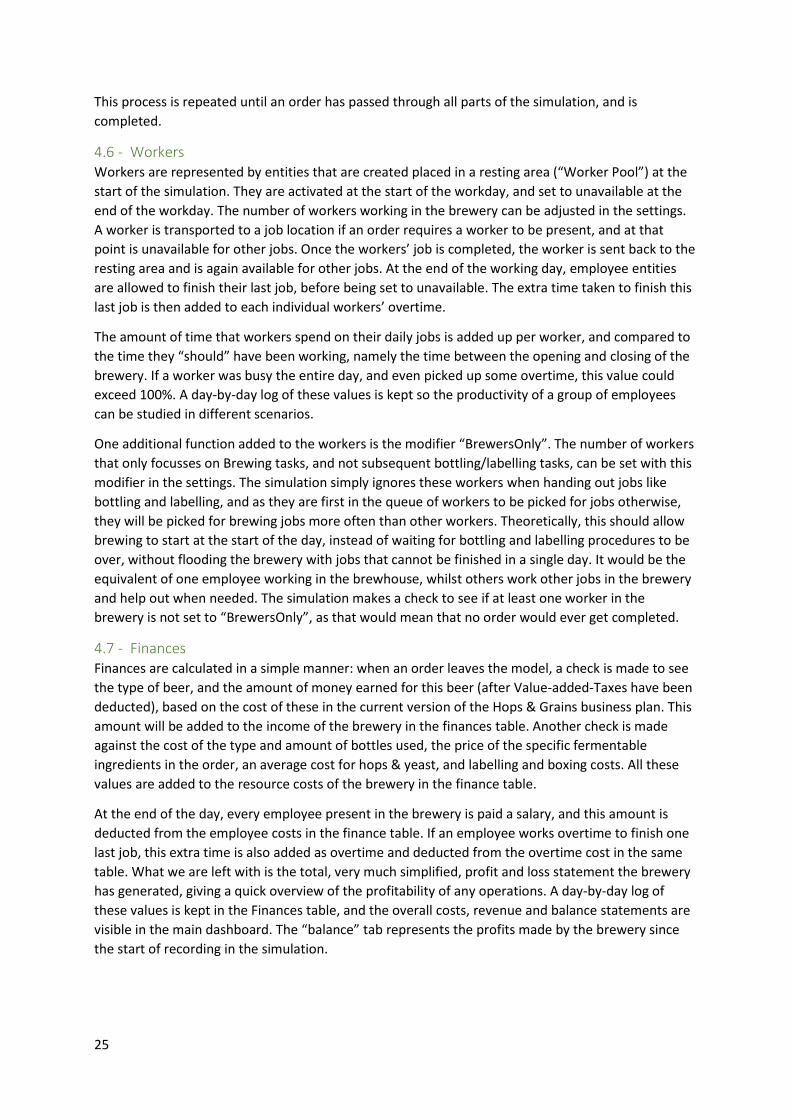
4.6 - Workers Workers are represented by entities that are created placed in a resting area (“Worker Pool”) at the
start of the simulation. They are activated at the start of the workday, and set to unavailable at the
end of the workday. The number of workers working in the brewery can be adjusted in the settings.
A worker is transported to a job location if an order requires a worker to be present, and at that
point is unavailable for other jobs. Once the workers’ job is completed, the worker is sent back to the
resting area and is again available for other jobs. At the end of the working day, employee entities
are allowed to finish their last job, before being set to unavailable. The extra time taken to finish this
last job is then added to each individual workers’ overtime.
The amount of time that workers spend on their daily jobs is added up per worker, and compared to
the time they “should” have been working, namely the time between the opening and closing of the
brewery. If a worker was busy the entire day, and even picked up some overtime, this value could
exceed 100%. A day-by-day log of these values is kept so the productivity of a group of employees
can be studied in different scenarios.
One additional function added to the workers is the modifier “BrewersOnly”. The number of workers
that only focusses on Brewing tasks, and not subsequent bottling/labelling tasks, can be set with this
modifier in the settings. The simulation simply ignores these workers when handing out jobs like
bottling and labelling, and as they are first in the queue of workers to be picked for jobs otherwise,
they will be picked for brewing jobs more often than other workers. Theoretically, this should allow
brewing to start at the start of the day, instead of waiting for bottling and labelling procedures to be
over, without flooding the brewery with jobs that cannot be finished in a single day. It would be the
equivalent of one employee working in the brewhouse, whilst others work other jobs in the brewery
and help out when needed. The simulation makes a check to see if at least one worker in the
brewery is not set to “BrewersOnly”, as that would mean that no order would ever get completed.
4.7 - Finances Finances are calculated in a simple manner: when an order leaves the model, a check is made to see
the type of beer, and the amount of money earned for this beer (after Value-added-Taxes have been
deducted), based on the cost of these in the current version of the Hops & Grains business plan. This
amount will be added to the income of the brewery in the finances table. Another check is made
against the cost of the type and amount of bottles used, the price of the specific fermentable
ingredients in the order, an average cost for hops & yeast, and labelling and boxing costs. All these
values are added to the resource costs of the brewery in the finance table.
At the end of the day, every employee present in the brewery is paid a salary, and this amount is
deducted from the employee costs in the finance table. If an employee works overtime to finish one
last job, this extra time is also added as overtime and deducted from the overtime cost in the same
table. What we are left with is the total, very much simplified, profit and loss statement the brewery
has generated, giving a quick overview of the profitability of any operations. A day-by-day log of
these values is kept in the Finances table, and the overall costs, revenue and balance statements are
visible in the main dashboard. The “balance” tab represents the profits made by the brewery since
the start of recording in the simulation.
26
4.8 - Time Measurement An order has its’ time tracked every time it makes a move in the model: when it enters a queue,
when an employee picks up the order, when a machine takes over production, or when it finishes a
step in the path. This data is collected and compiled by the script “RecordTime”, which records the
specific time at which an order made the move, and calculates the difference between the last move.
At the end of a stage, all recorded times are added up and compared to the actual time an order
spent in this part of the simulation: if they do not add up, a mistake has been made somewhere. In
addition, when an order leaves the model entirely, a check is made to see if all the individual total
times recorded in the model add up to the total time that has passed since entry into the first job. A
visual representation of this can be seen in Figure 8.
This script responds to different keywords, namely: [entry, EmployeeEntry, MachineEntry, End,
ExitModel]. The method that calls them and the purpose of the keyword is described in Table 9. A
simplified visual representation of the recorded times per stage are presented in Figures 6 and 7.
Note that the time an order leaves a step in the process should be equal to the time they enter the
buffer in the next step.
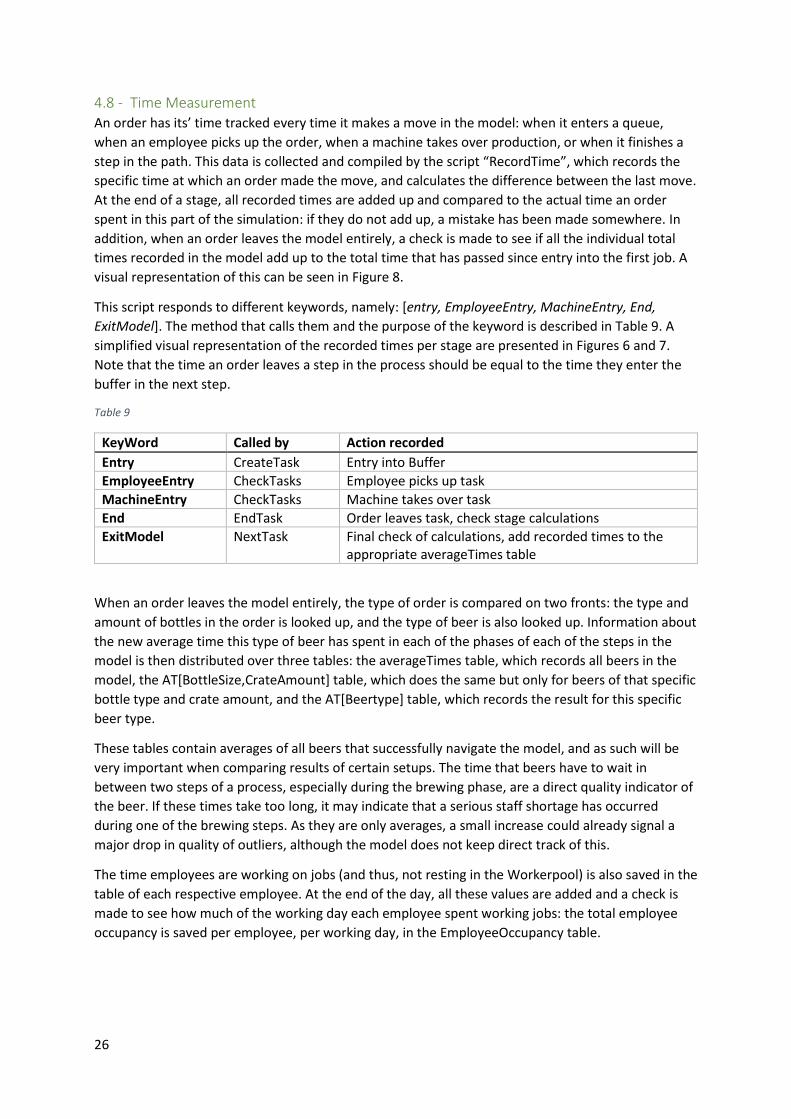
Table 9
KeyWord Called by Action recorded
Entry CreateTask Entry into Buffer
EmployeeEntry CheckTasks Employee picks up task
MachineEntry CheckTasks Machine takes over task
End EndTask Order leaves task, check stage calculations
ExitModel NextTask Final check of calculations, add recorded times to the appropriate averageTimes table
When an order leaves the model entirely, the type of order is compared on two fronts: the type and
amount of bottles in the order is looked up, and the type of beer is also looked up. Information about
the new average time this type of beer has spent in each of the phases of each of the steps in the
model is then distributed over three tables: the averageTimes table, which records all beers in the
model, the AT[BottleSize,CrateAmount] table, which does the same but only for beers of that specific
bottle type and crate amount, and the AT[Beertype] table, which records the result for this specific
beer type.
These tables contain averages of all beers that successfully navigate the model, and as such will be
very important when comparing results of certain setups. The time that beers have to wait in
between two steps of a process, especially during the brewing phase, are a direct quality indicator of
the beer. If these times take too long, it may indicate that a serious staff shortage has occurred
during one of the brewing steps. As they are only averages, a small increase could already signal a
major drop in quality of outliers, although the model does not keep direct track of this.
The time employees are working on jobs (and thus, not resting in the Workerpool) is also saved in the
table of each respective employee. At the end of the day, all these values are added and a check is
made to see how much of the working day each employee spent working jobs: the total employee
occupancy is saved per employee, per working day, in the EmployeeOccupancy table.
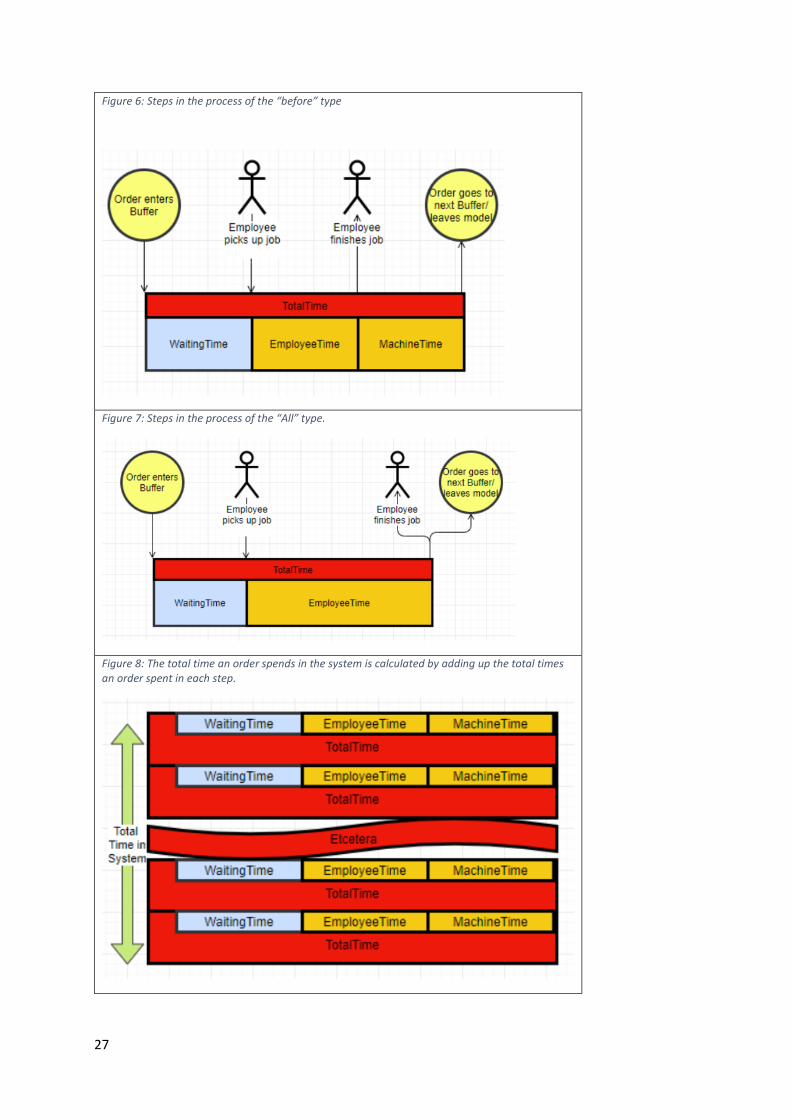
27
Figure 6: Steps in the process of the “before” type
Figure 7: Steps in the process of the “All” type.
Figure 8: The total time an order spends in the system is calculated by adding up the total times an order spent in each step.
28
4.9 – List of Assumptions Although an effort has been made to include all important aspects of the current brewery in a
functional simulation, certain assumptions had to be made in order to complete the model within a
reasonable time frame. The most important of these assumptions are summarized here.
We make the assumption that Hops & Grains has started a marketing campaign which has
overwhelmed the capacity of the brewery. There is a theoretically infinite queue of different orders
waiting, and as soon as a space frees up, it is taken by the next order. Since the main purpose of the
model is to simulate the production environment and no reliable data exists on arrival times, we
choose to supply the model with as many orders as it can process to seek out the bottlenecks in
production. This assumption caused some issues during experimentation, which will be handled in
the next chapter.
Some of the working times were not measured (accurately) and have to be based on estimates.
Many other working times were measured and do appear in the dataset used as inputs in the model,
but do not cover enough independent data points to satisfy full reliability. The missing figures are
filled in using assumptions based on the writers’ own experience with the processes that transpire in
the brewery. The full list of measurements and calculated standard times can be viewed in Appendix
B.
The kettles that are currently used will likely be replaced by more user-friendly models in the future,
due to their reliance on Bluetooth technology. Whilst adequate for the current situation, using a
large number of these kettles for a future, expanded brewery is expected to lead to failures and loss
of productivity due to interconnectivity issues. Additionally, newer kettles will be easier to clean,
which will lead to more productivity from brewing staff. We make the assumption that the times
collected for these kettles will also hold in future scenarios, but this is far from certain.
The model does not simulate walking paths for employees. Instead, walking time was included in the
standard times that were gathered in the methodological report. However, should the brewery ever
be expanded to a different location, these values will have to be re-calculated as they will not be
representative of a new floorplan.
In this model we assume that all materials and ingredients are always in stock, whilst this is likely to
be far less certain in an expanded brewery. Although times taken to re-stock empty grain barrels are
taken into account, having enough in stock to satisfy all demand may prove to be a problem for the
future and would require careful resource management. This was specifically not the research target
of this thesis and thus I feel comfortable leaving it out of my report, but it may be an interesting
avenue for future research.
Storage locations are always filled with one batch of beer, but different quantities of beer are stored
in different storage containers and this means that in real life, more limits on storage exist than we
currently simulate in the model. The model assumes that all storage locations for batches of beer are
the same, and makes no distinction between 10l or 30l batches, whilst these do require different
storage containers.
The number and capacity of water taps at the brewery are a bottleneck during production and clean-
up operations at peak times, but these too were not modelled. The same goes for sparge water
heaters, dish washers, fridges, scales and other various appliances. Including these in the model
would add much complexity without impacting results all that much. Simply ensuring that every
kettle has its own tap is much more convenient in a brewery anyways, and would be the goal of H&G
regardless.
29
Regarding employee interactions with the system, the model implicitly assumes that:
1) all employees are equally adept at performing all jobs in the brewery
2) all employees are perfectly aware of all free jobs in the brewery
3) all employees are instantly interchangeable
For example in the current model, an employee that just finished a sparging action in kettle 1 will be
able to instantly start working on bottling operations for a random different batch, and upon
completion of that task start measure-milling operations for a batch that will be brewed in kettle 14.
In real life, it is much more likely that an employee would be assigned to only a couple of kettles, and
be made responsible for the brews in those kettles that day, whilst another employee focusses on
bottling operations. Because of the great amount of processes that can take place at the same time,
it is unlikely that employees would know what jobs they can pick up at any given moment. Also, it is
likely that orders would be “saved up”, so multiple batches could always be brewed at the same
time. This would enable management to send brewers home on days where orders are slow. In an
expanded version of the model, this could be included.
Conclusions A clear picture now exists of the brewery and the way that we choose to model its different aspects.
With all these factors settled, we have enough information to build a reasonably accurate
representation of the Hops & Grains brewery in Siemens’ Tecnomatic Plant Simulation.
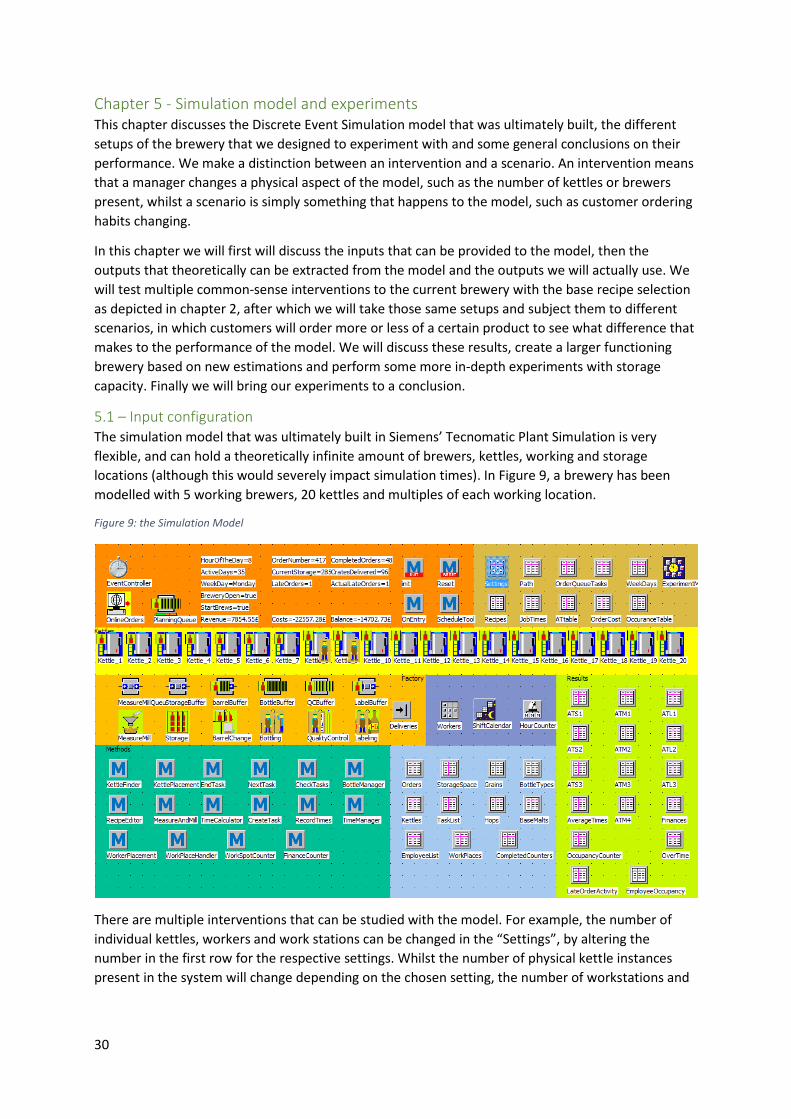
30
Chapter 5 - Simulation model and experiments This chapter discusses the Discrete Event Simulation model that was ultimately built, the different
setups of the brewery that we designed to experiment with and some general conclusions on their
performance. We make a distinction between an intervention and a scenario. An intervention means
that a manager changes a physical aspect of the model, such as the number of kettles or brewers
present, whilst a scenario is simply something that happens to the model, such as customer ordering
habits changing.
In this chapter we will first will discuss the inputs that can be provided to the model, then the
outputs that theoretically can be extracted from the model and the outputs we will actually use. We
will test multiple common-sense interventions to the current brewery with the base recipe selection
as depicted in chapter 2, after which we will take those same setups and subject them to different
scenarios, in which customers will order more or less of a certain product to see what difference that
makes to the performance of the model. We will discuss these results, create a larger functioning
brewery based on new estimations and perform some more in-depth experiments with storage
capacity. Finally we will bring our experiments to a conclusion.
5.1 – Input configuration The simulation model that was ultimately built in Siemens’ Tecnomatic Plant Simulation is very
flexible, and can hold a theoretically infinite amount of brewers, kettles, working and storage
locations (although this would severely impact simulation times). In Figure 9, a brewery has been
modelled with 5 working brewers, 20 kettles and multiples of each working location.
Figure 9: the Simulation Model
There are multiple interventions that can be studied with the model. For example, the number of
individual kettles, workers and work stations can be changed in the “Settings”, by altering the
number in the first row for the respective settings. Whilst the number of physical kettle instances
present in the system will change depending on the chosen setting, the number of workstations and
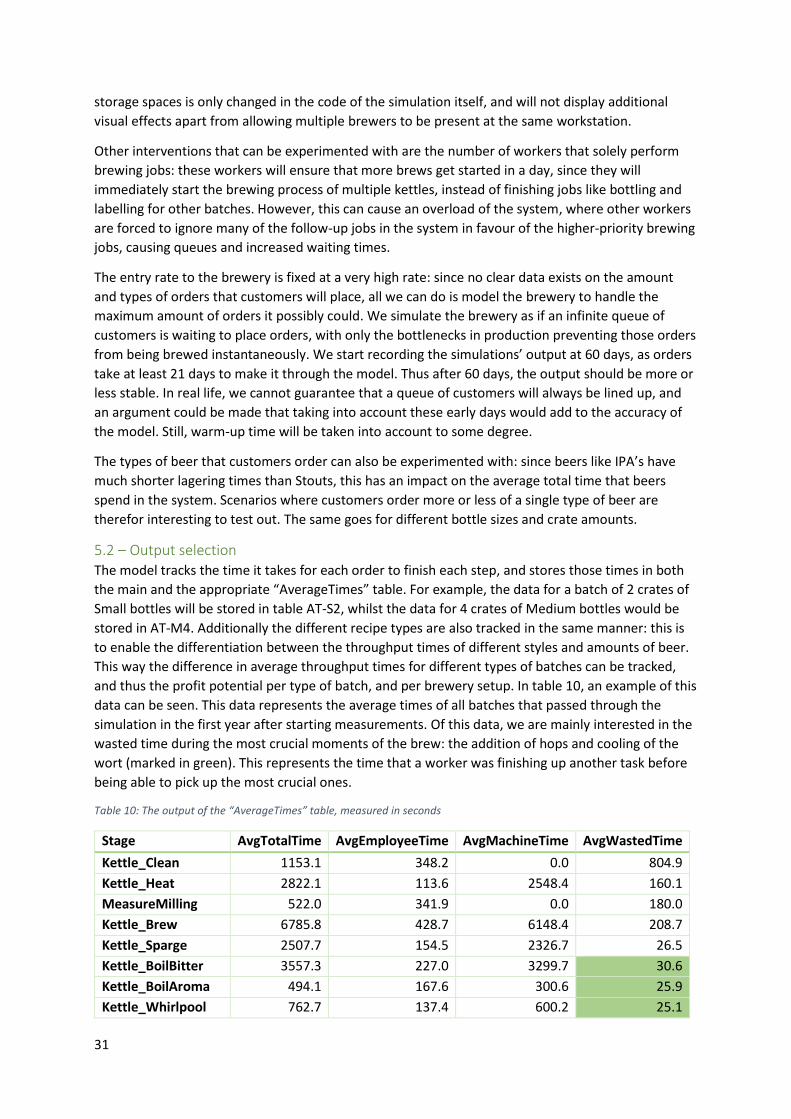
31
storage spaces is only changed in the code of the simulation itself, and will not display additional
visual effects apart from allowing multiple brewers to be present at the same workstation.
Other interventions that can be experimented with are the number of workers that solely perform
brewing jobs: these workers will ensure that more brews get started in a day, since they will
immediately start the brewing process of multiple kettles, instead of finishing jobs like bottling and
labelling for other batches. However, this can cause an overload of the system, where other workers
are forced to ignore many of the follow-up jobs in the system in favour of the higher-priority brewing
jobs, causing queues and increased waiting times.
The entry rate to the brewery is fixed at a very high rate: since no clear data exists on the amount
and types of orders that customers will place, all we can do is model the brewery to handle the
maximum amount of orders it possibly could. We simulate the brewery as if an infinite queue of
customers is waiting to place orders, with only the bottlenecks in production preventing those orders
from being brewed instantaneously. We start recording the simulations’ output at 60 days, as orders
take at least 21 days to make it through the model. Thus after 60 days, the output should be more or
less stable. In real life, we cannot guarantee that a queue of customers will always be lined up, and
an argument could be made that taking into account these early days would add to the accuracy of
the model. Still, warm-up time will be taken into account to some degree.
The types of beer that customers order can also be experimented with: since beers like IPA’s have
much shorter lagering times than Stouts, this has an impact on the average total time that beers
spend in the system. Scenarios where customers order more or less of a single type of beer are
therefor interesting to test out. The same goes for different bottle sizes and crate amounts.
5.2 – Output selection The model tracks the time it takes for each order to finish each step, and stores those times in both
the main and the appropriate “AverageTimes” table. For example, the data for a batch of 2 crates of
Small bottles will be stored in table AT-S2, whilst the data for 4 crates of Medium bottles would be
stored in AT-M4. Additionally the different recipe types are also tracked in the same manner: this is
to enable the differentiation between the throughput times of different styles and amounts of beer.
This way the difference in average throughput times for different types of batches can be tracked,
and thus the profit potential per type of batch, and per brewery setup. In table 10, an example of this
data can be seen. This data represents the average times of all batches that passed through the
simulation in the first year after starting measurements. Of this data, we are mainly interested in the
wasted time during the most crucial moments of the brew: the addition of hops and cooling of the
wort (marked in green). This represents the time that a worker was finishing up another task before
being able to pick up the most crucial ones.
Table 10: The output of the “AverageTimes” table, measured in seconds
Stage AvgTotalTime AvgEmployeeTime AvgMachineTime AvgWastedTime
Kettle_Clean 1153.1 348.2 0.0 804.9
Kettle_Heat 2822.1 113.6 2548.4 160.1
MeasureMilling 522.0 341.9 0.0 180.0
Kettle_Brew 6785.8 428.7 6148.4 208.7
Kettle_Sparge 2507.7 154.5 2326.7 26.5
Kettle_BoilBitter 3557.3 227.0 3299.7 30.6
Kettle_BoilAroma 494.1 167.6 300.6 25.9
Kettle_Whirlpool 762.7 137.4 600.2 25.1
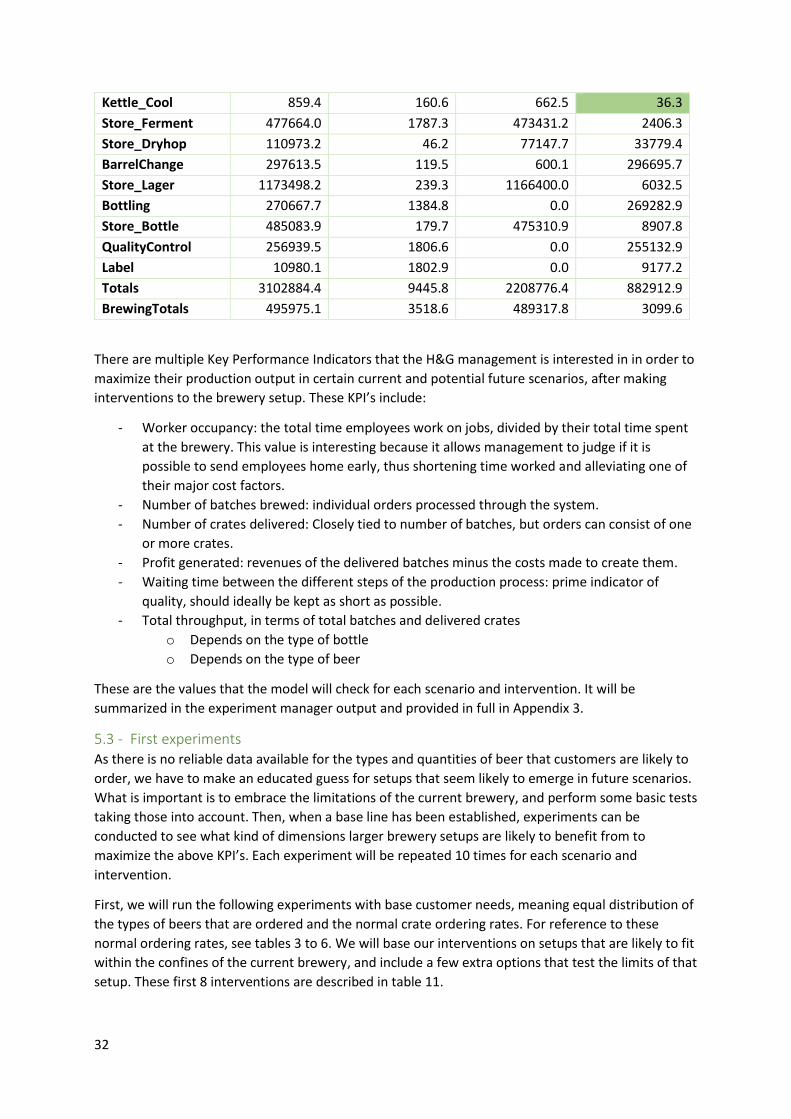
32
Kettle_Cool 859.4 160.6 662.5 36.3
Store_Ferment 477664.0 1787.3 473431.2 2406.3
Store_Dryhop 110973.2 46.2 77147.7 33779.4
BarrelChange 297613.5 119.5 600.1 296695.7
Store_Lager 1173498.2 239.3 1166400.0 6032.5
Bottling 270667.7 1384.8 0.0 269282.9
Store_Bottle 485083.9 179.7 475310.9 8907.8
QualityControl 256939.5 1806.6 0.0 255132.9
Label 10980.1 1802.9 0.0 9177.2
Totals 3102884.4 9445.8 2208776.4 882912.9
BrewingTotals 495975.1 3518.6 489317.8 3099.6
There are multiple Key Performance Indicators that the H&G management is interested in in order to
maximize their production output in certain current and potential future scenarios, after making
interventions to the brewery setup. These KPI’s include:
- Worker occupancy: the total time employees work on jobs, divided by their total time spent
at the brewery. This value is interesting because it allows management to judge if it is
possible to send employees home early, thus shortening time worked and alleviating one of
their major cost factors.
- Number of batches brewed: individual orders processed through the system.
- Number of crates delivered: Closely tied to number of batches, but orders can consist of one
or more crates.
- Profit generated: revenues of the delivered batches minus the costs made to create them.
- Waiting time between the different steps of the production process: prime indicator of
quality, should ideally be kept as short as possible.
- Total throughput, in terms of total batches and delivered crates
o Depends on the type of bottle
o Depends on the type of beer
These are the values that the model will check for each scenario and intervention. It will be
summarized in the experiment manager output and provided in full in Appendix 3.
5.3 - First experiments As there is no reliable data available for the types and quantities of beer that customers are likely to
order, we have to make an educated guess for setups that seem likely to emerge in future scenarios.
What is important is to embrace the limitations of the current brewery, and perform some basic tests
taking those into account. Then, when a base line has been established, experiments can be
conducted to see what kind of dimensions larger brewery setups are likely to benefit from to
maximize the above KPI’s. Each experiment will be repeated 10 times for each scenario and
intervention.
First, we will run the following experiments with base customer needs, meaning equal distribution of
the types of beers that are ordered and the normal crate ordering rates. For reference to these
normal ordering rates, see tables 3 to 6. We will base our interventions on setups that are likely to fit
within the confines of the current brewery, and include a few extra options that test the limits of that
setup. These first 8 interventions are described in table 11.
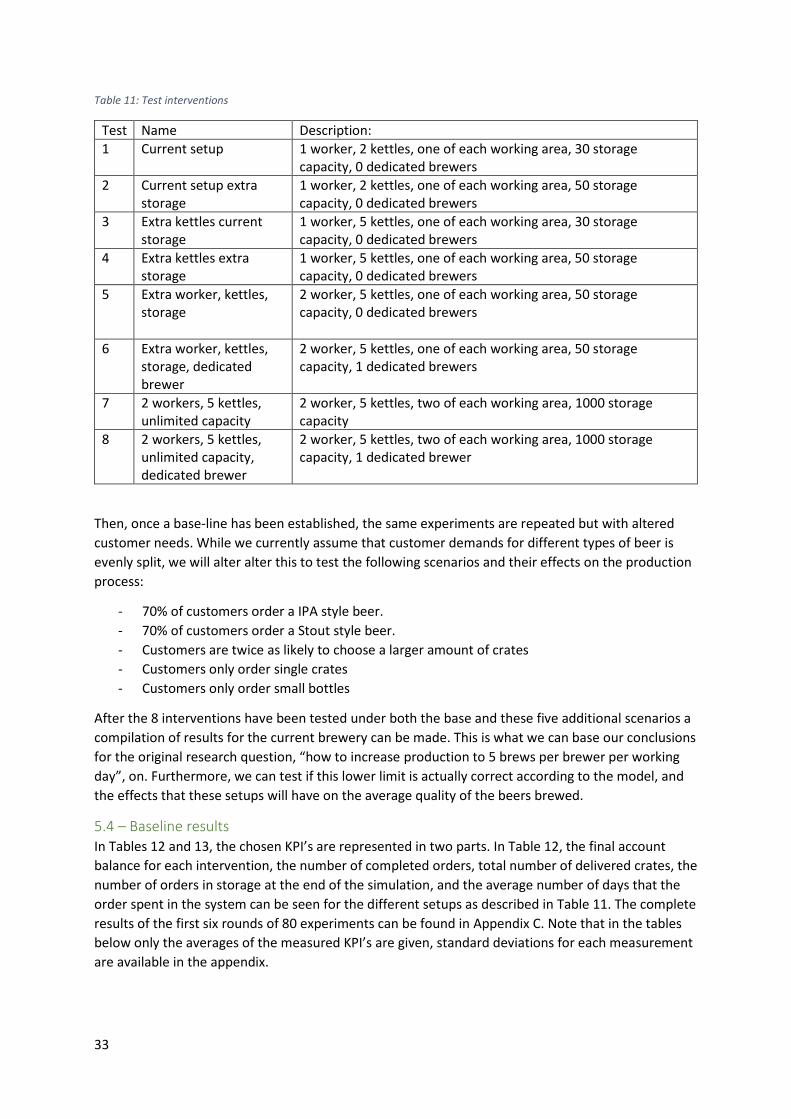
33
Table 11: Test interventions
Test Name Description:
1 Current setup 1 worker, 2 kettles, one of each working area, 30 storage capacity, 0 dedicated brewers
2 Current setup extra storage
1 worker, 2 kettles, one of each working area, 50 storage capacity, 0 dedicated brewers
3 Extra kettles current storage
1 worker, 5 kettles, one of each working area, 30 storage capacity, 0 dedicated brewers
4 Extra kettles extra storage
1 worker, 5 kettles, one of each working area, 50 storage capacity, 0 dedicated brewers
5 Extra worker, kettles, storage
2 worker, 5 kettles, one of each working area, 50 storage capacity, 0 dedicated brewers
6 Extra worker, kettles, storage, dedicated brewer
2 worker, 5 kettles, one of each working area, 50 storage capacity, 1 dedicated brewers
7 2 workers, 5 kettles, unlimited capacity
2 worker, 5 kettles, two of each working area, 1000 storage capacity
8 2 workers, 5 kettles, unlimited capacity, dedicated brewer
2 worker, 5 kettles, two of each working area, 1000 storage capacity, 1 dedicated brewer
Then, once a base-line has been established, the same experiments are repeated but with altered
customer needs. While we currently assume that customer demands for different types of beer is
evenly split, we will alter alter this to test the following scenarios and their effects on the production
process:
- 70% of customers order a IPA style beer.
- 70% of customers order a Stout style beer.
- Customers are twice as likely to choose a larger amount of crates
- Customers only order single crates
- Customers only order small bottles
After the 8 interventions have been tested under both the base and these five additional scenarios a
compilation of results for the current brewery can be made. This is what we can base our conclusions
for the original research question, “how to increase production to 5 brews per brewer per working
day”, on. Furthermore, we can test if this lower limit is actually correct according to the model, and
the effects that these setups will have on the average quality of the beers brewed.
5.4 – Baseline results In Tables 12 and 13, the chosen KPI’s are represented in two parts. In Table 12, the final account
balance for each intervention, the number of completed orders, total number of delivered crates, the
number of orders in storage at the end of the simulation, and the average number of days that the
order spent in the system can be seen for the different setups as described in Table 11. The complete
results of the first six rounds of 80 experiments can be found in Appendix C. Note that in the tables
below only the averages of the measured KPI’s are given, standard deviations for each measurement
are available in the appendix.
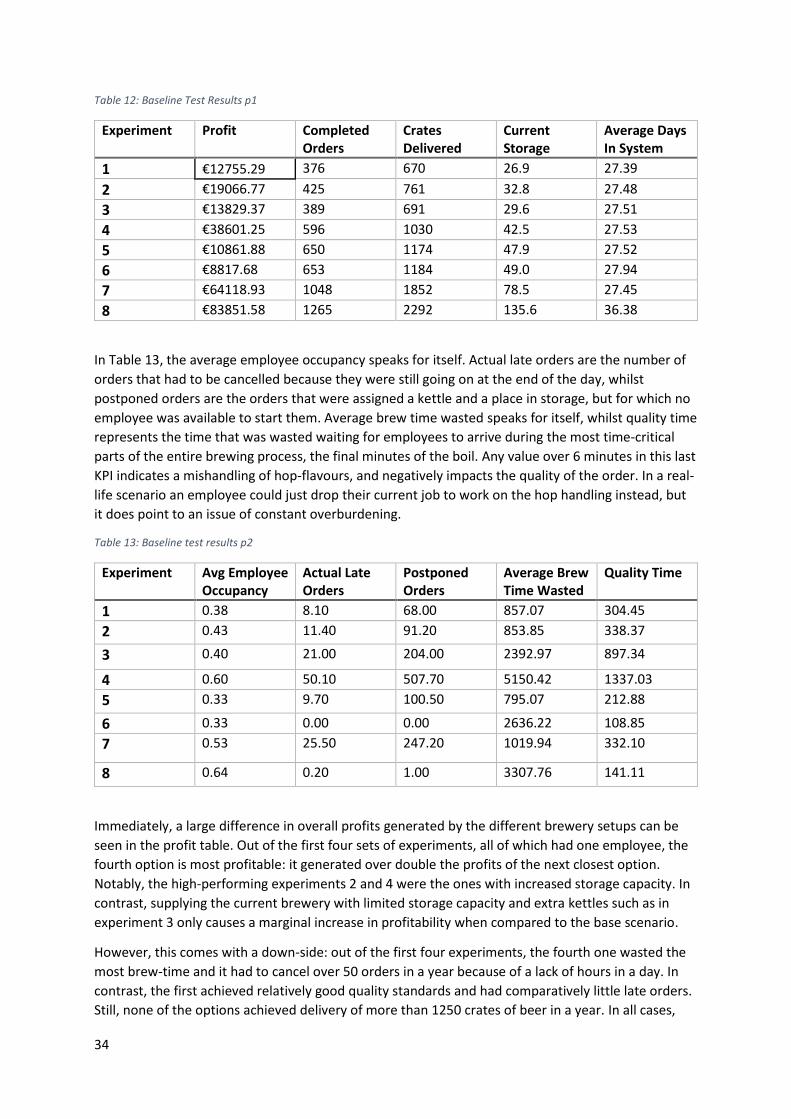
34
Table 12: Baseline Test Results p1
Experiment Profit Completed Orders
Crates Delivered
Current Storage
Average Days In System
1 €12755.29 376 670 26.9 27.39
2 €19066.77 425 761 32.8 27.48
3 €13829.37 389 691 29.6 27.51
4 €38601.25 596 1030 42.5 27.53
5 €10861.88 650 1174 47.9 27.52
6 €8817.68 653 1184 49.0 27.94
7 €64118.93 1048 1852 78.5 27.45
8 €83851.58 1265 2292 135.6 36.38
In Table 13, the average employee occupancy speaks for itself. Actual late orders are the number of
orders that had to be cancelled because they were still going on at the end of the day, whilst
postponed orders are the orders that were assigned a kettle and a place in storage, but for which no
employee was available to start them. Average brew time wasted speaks for itself, whilst quality time
represents the time that was wasted waiting for employees to arrive during the most time-critical
parts of the entire brewing process, the final minutes of the boil. Any value over 6 minutes in this last
KPI indicates a mishandling of hop-flavours, and negatively impacts the quality of the order. In a real-
life scenario an employee could just drop their current job to work on the hop handling instead, but
it does point to an issue of constant overburdening.
Table 13: Baseline test results p2
Experiment Avg Employee Occupancy
Actual Late Orders
Postponed Orders
Average Brew Time Wasted
Quality Time
1 0.38 8.10 68.00 857.07 304.45
2 0.43 11.40 91.20 853.85 338.37
3 0.40 21.00 204.00 2392.97 897.34
4 0.60 50.10 507.70 5150.42 1337.03
5 0.33 9.70 100.50 795.07 212.88
6 0.33 0.00 0.00 2636.22 108.85
7 0.53 25.50 247.20 1019.94 332.10
8 0.64 0.20 1.00 3307.76 141.11
Immediately, a large difference in overall profits generated by the different brewery setups can be
seen in the profit table. Out of the first four sets of experiments, all of which had one employee, the
fourth option is most profitable: it generated over double the profits of the next closest option.
Notably, the high-performing experiments 2 and 4 were the ones with increased storage capacity. In
contrast, supplying the current brewery with limited storage capacity and extra kettles such as in
experiment 3 only causes a marginal increase in profitability when compared to the base scenario.
However, this comes with a down-side: out of the first four experiments, the fourth one wasted the
most brew-time and it had to cancel over 50 orders in a year because of a lack of hours in a day. In
contrast, the first achieved relatively good quality standards and had comparatively little late orders.
Still, none of the options achieved delivery of more than 1250 crates of beer in a year. In all cases,
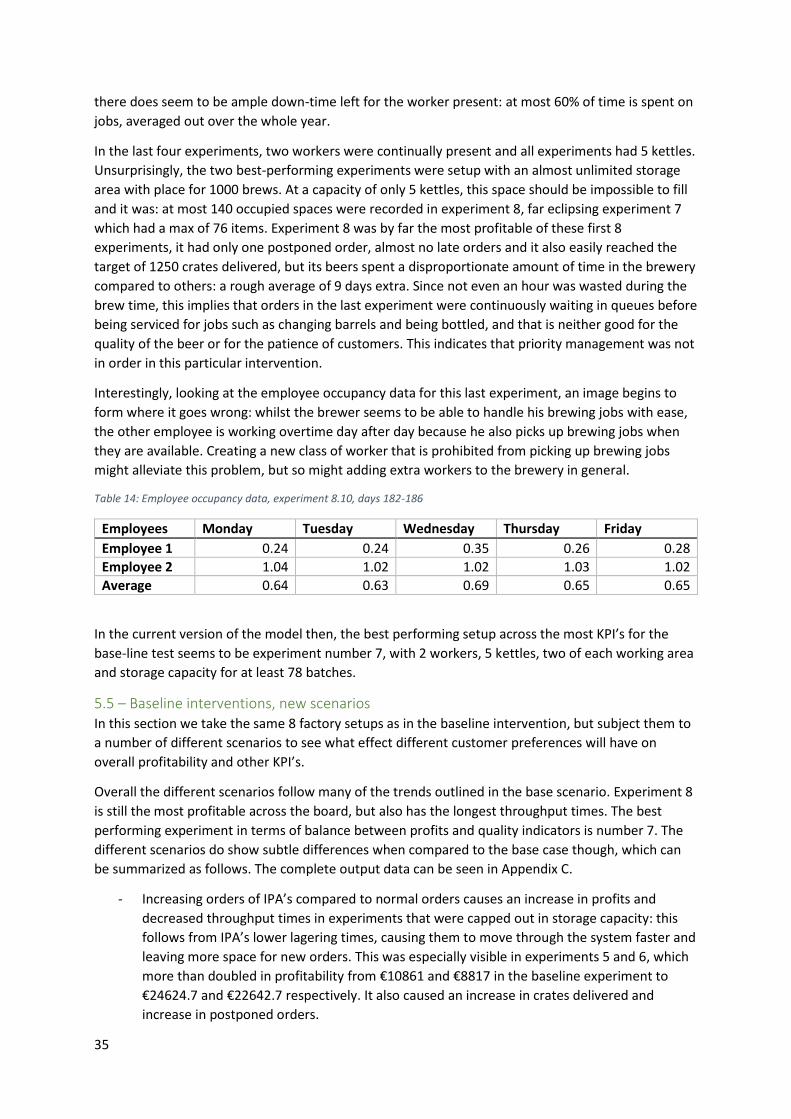
35
there does seem to be ample down-time left for the worker present: at most 60% of time is spent on
jobs, averaged out over the whole year.
In the last four experiments, two workers were continually present and all experiments had 5 kettles.
Unsurprisingly, the two best-performing experiments were setup with an almost unlimited storage
area with place for 1000 brews. At a capacity of only 5 kettles, this space should be impossible to fill
and it was: at most 140 occupied spaces were recorded in experiment 8, far eclipsing experiment 7
which had a max of 76 items. Experiment 8 was by far the most profitable of these first 8
experiments, it had only one postponed order, almost no late orders and it also easily reached the
target of 1250 crates delivered, but its beers spent a disproportionate amount of time in the brewery
compared to others: a rough average of 9 days extra. Since not even an hour was wasted during the
brew time, this implies that orders in the last experiment were continuously waiting in queues before
being serviced for jobs such as changing barrels and being bottled, and that is neither good for the
quality of the beer or for the patience of customers. This indicates that priority management was not
in order in this particular intervention.
Interestingly, looking at the employee occupancy data for this last experiment, an image begins to
form where it goes wrong: whilst the brewer seems to be able to handle his brewing jobs with ease,
the other employee is working overtime day after day because he also picks up brewing jobs when
they are available. Creating a new class of worker that is prohibited from picking up brewing jobs
might alleviate this problem, but so might adding extra workers to the brewery in general.
Table 14: Employee occupancy data, experiment 8.10, days 182-186
Employees Monday Tuesday Wednesday Thursday Friday
Employee 1 0.24 0.24 0.35 0.26 0.28
Employee 2 1.04 1.02 1.02 1.03 1.02
Average 0.64 0.63 0.69 0.65 0.65
In the current version of the model then, the best performing setup across the most KPI’s for the
base-line test seems to be experiment number 7, with 2 workers, 5 kettles, two of each working area
and storage capacity for at least 78 batches.
5.5 – Baseline interventions, new scenarios In this section we take the same 8 factory setups as in the baseline intervention, but subject them to
a number of different scenarios to see what effect different customer preferences will have on
overall profitability and other KPI’s.
Overall the different scenarios follow many of the trends outlined in the base scenario. Experiment 8
is still the most profitable across the board, but also has the longest throughput times. The best
performing experiment in terms of balance between profits and quality indicators is number 7. The
different scenarios do show subtle differences when compared to the base case though, which can
be summarized as follows. The complete output data can be seen in Appendix C.
- Increasing orders of IPA’s compared to normal orders causes an increase in profits and
decreased throughput times in experiments that were capped out in storage capacity: this
follows from IPA’s lower lagering times, causing them to move through the system faster and
leaving more space for new orders. This was especially visible in experiments 5 and 6, which
more than doubled in profitability from €10861 and €8817 in the baseline experiment to
€24624.7 and €22642.7 respectively. It also caused an increase in crates delivered and
increase in postponed orders.
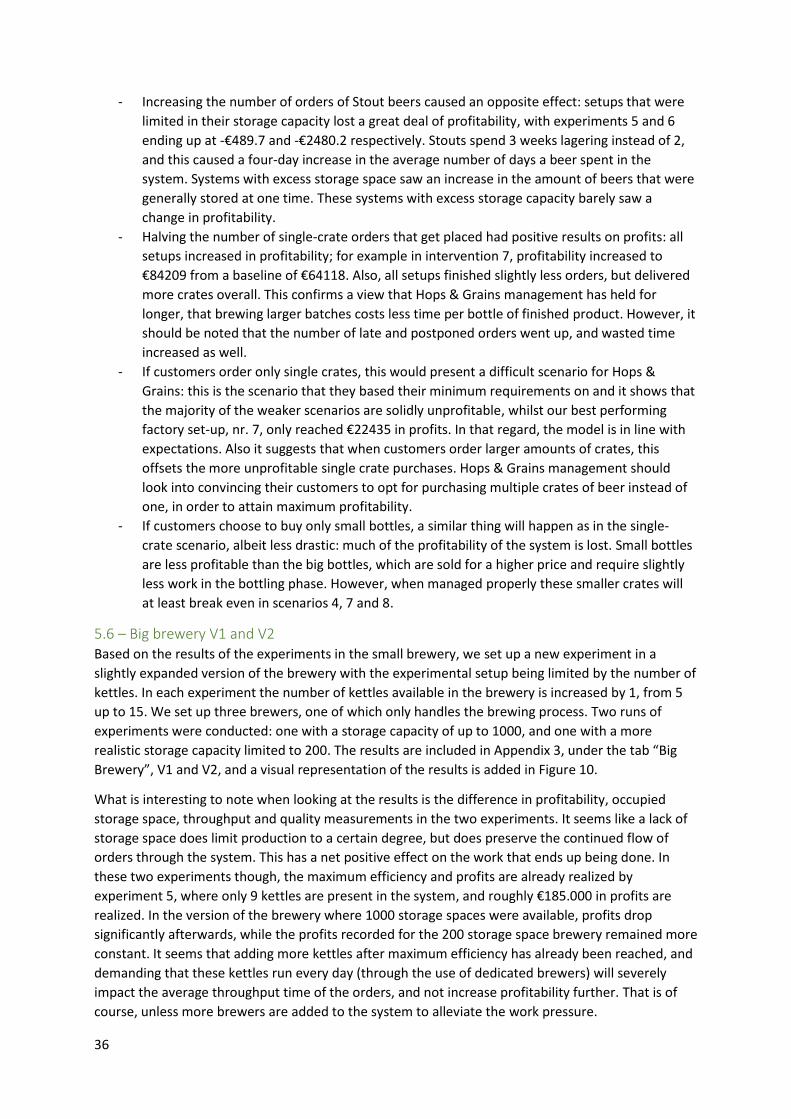
36
- Increasing the number of orders of Stout beers caused an opposite effect: setups that were
limited in their storage capacity lost a great deal of profitability, with experiments 5 and 6
ending up at -€489.7 and -€2480.2 respectively. Stouts spend 3 weeks lagering instead of 2,
and this caused a four-day increase in the average number of days a beer spent in the
system. Systems with excess storage space saw an increase in the amount of beers that were
generally stored at one time. These systems with excess storage capacity barely saw a
change in profitability.
- Halving the number of single-crate orders that get placed had positive results on profits: all
setups increased in profitability; for example in intervention 7, profitability increased to
€84209 from a baseline of €64118. Also, all setups finished slightly less orders, but delivered
more crates overall. This confirms a view that Hops & Grains management has held for
longer, that brewing larger batches costs less time per bottle of finished product. However, it
should be noted that the number of late and postponed orders went up, and wasted time
increased as well.
- If customers order only single crates, this would present a difficult scenario for Hops &
Grains: this is the scenario that they based their minimum requirements on and it shows that
the majority of the weaker scenarios are solidly unprofitable, whilst our best performing
factory set-up, nr. 7, only reached €22435 in profits. In that regard, the model is in line with
expectations. Also it suggests that when customers order larger amounts of crates, this
offsets the more unprofitable single crate purchases. Hops & Grains management should
look into convincing their customers to opt for purchasing multiple crates of beer instead of
one, in order to attain maximum profitability.
- If customers choose to buy only small bottles, a similar thing will happen as in the single-
crate scenario, albeit less drastic: much of the profitability of the system is lost. Small bottles
are less profitable than the big bottles, which are sold for a higher price and require slightly
less work in the bottling phase. However, when managed properly these smaller crates will
at least break even in scenarios 4, 7 and 8.
5.6 – Big brewery V1 and V2 Based on the results of the experiments in the small brewery, we set up a new experiment in a
slightly expanded version of the brewery with the experimental setup being limited by the number of
kettles. In each experiment the number of kettles available in the brewery is increased by 1, from 5
up to 15. We set up three brewers, one of which only handles the brewing process. Two runs of
experiments were conducted: one with a storage capacity of up to 1000, and one with a more
realistic storage capacity limited to 200. The results are included in Appendix 3, under the tab “Big
Brewery”, V1 and V2, and a visual representation of the results is added in Figure 10.
What is interesting to note when looking at the results is the difference in profitability, occupied
storage space, throughput and quality measurements in the two experiments. It seems like a lack of
storage space does limit production to a certain degree, but does preserve the continued flow of
orders through the system. This has a net positive effect on the work that ends up being done. In
these two experiments though, the maximum efficiency and profits are already realized by
experiment 5, where only 9 kettles are present in the system, and roughly €185.000 in profits are
realized. In the version of the brewery where 1000 storage spaces were available, profits drop
significantly afterwards, while the profits recorded for the 200 storage space brewery remained more
constant. It seems that adding more kettles after maximum efficiency has already been reached, and
demanding that these kettles run every day (through the use of dedicated brewers) will severely
impact the average throughput time of the orders, and not increase profitability further. That is of
course, unless more brewers are added to the system to alleviate the work pressure.
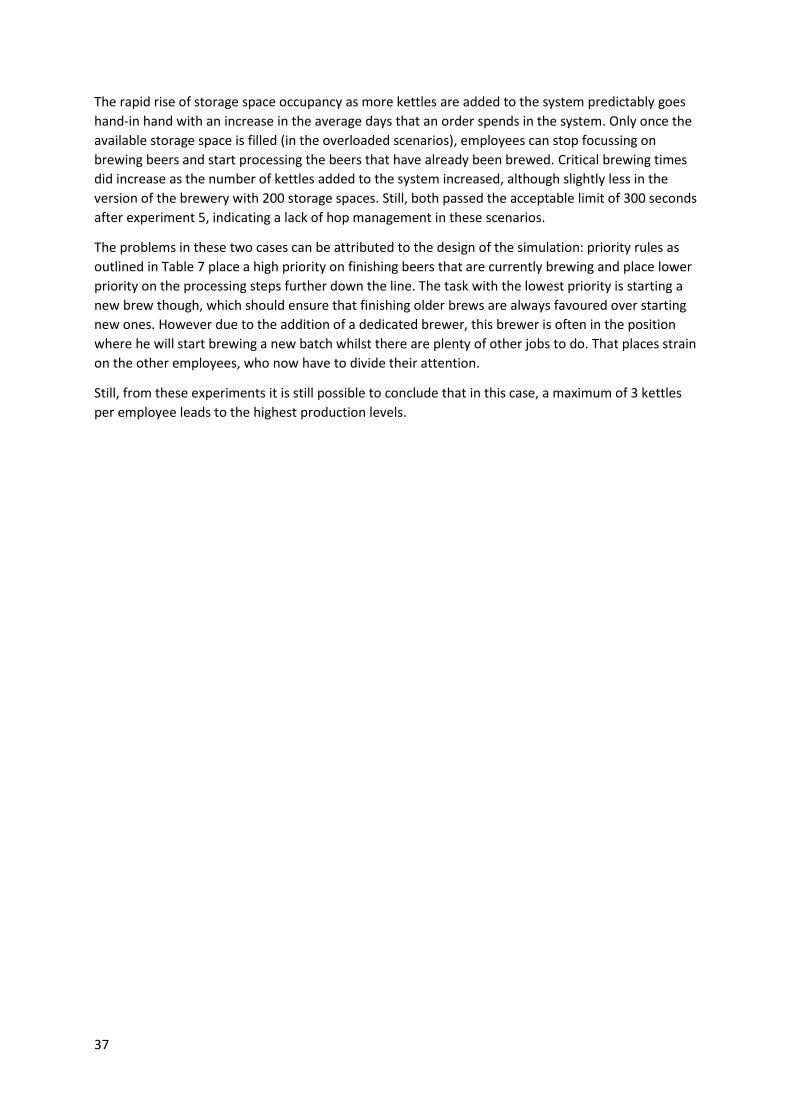
37
The rapid rise of storage space occupancy as more kettles are added to the system predictably goes
hand-in hand with an increase in the average days that an order spends in the system. Only once the
available storage space is filled (in the overloaded scenarios), employees can stop focussing on
brewing beers and start processing the beers that have already been brewed. Critical brewing times
did increase as the number of kettles added to the system increased, although slightly less in the
version of the brewery with 200 storage spaces. Still, both passed the acceptable limit of 300 seconds
after experiment 5, indicating a lack of hop management in these scenarios.
The problems in these two cases can be attributed to the design of the simulation: priority rules as
outlined in Table 7 place a high priority on finishing beers that are currently brewing and place lower
priority on the processing steps further down the line. The task with the lowest priority is starting a
new brew though, which should ensure that finishing older brews are always favoured over starting
new ones. However due to the addition of a dedicated brewer, this brewer is often in the position
where he will start brewing a new batch whilst there are plenty of other jobs to do. That places strain
on the other employees, who now have to divide their attention.
Still, from these experiments it is still possible to conclude that in this case, a maximum of 3 kettles
per employee leads to the highest production levels.
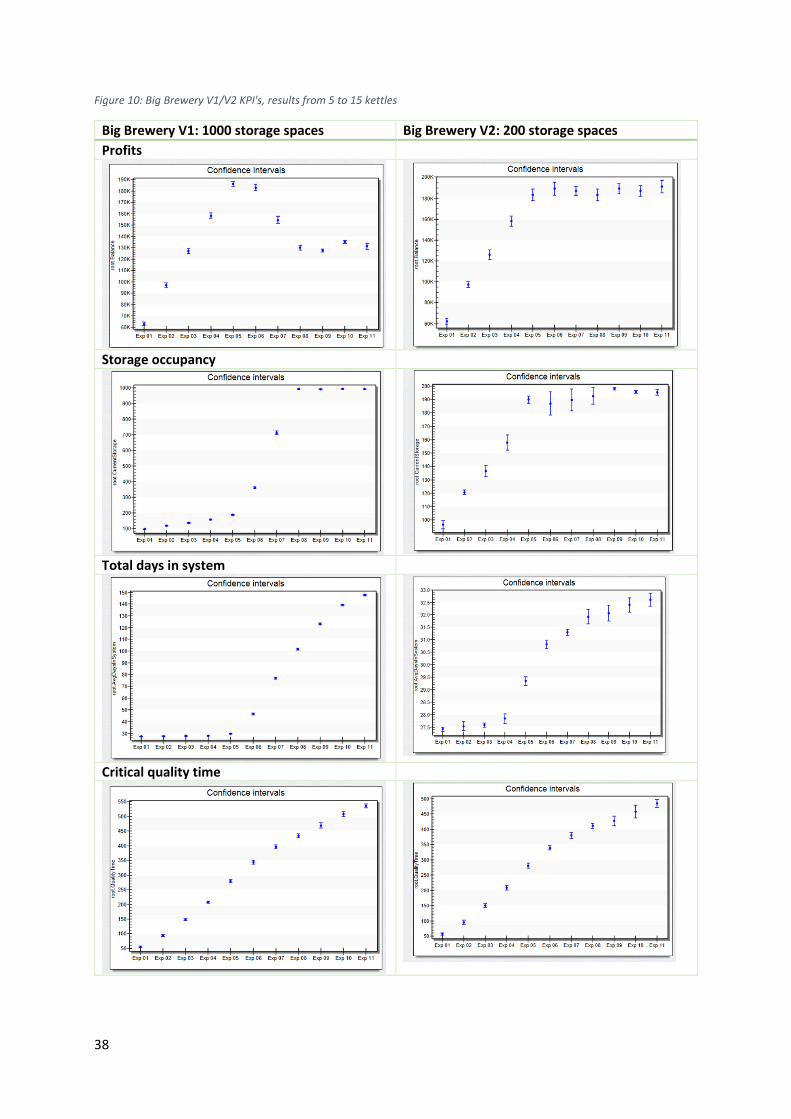
38
Figure 10: Big Brewery V1/V2 KPI's, results from 5 to 15 kettles
Big Brewery V1: 1000 storage spaces Big Brewery V2: 200 storage spaces
Profits
Storage occupancy
Total days in system
Critical quality time
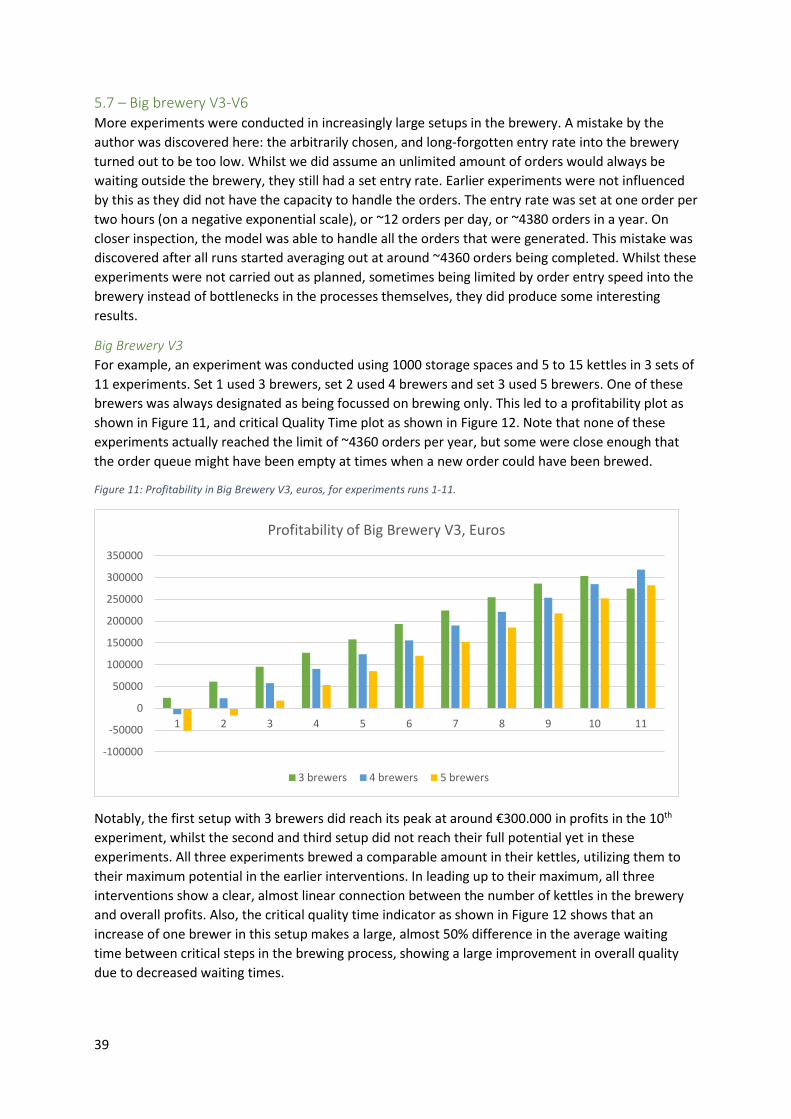
39
5.7 – Big brewery V3-V6 More experiments were conducted in increasingly large setups in the brewery. A mistake by the
author was discovered here: the arbitrarily chosen, and long-forgotten entry rate into the brewery
turned out to be too low. Whilst we did assume an unlimited amount of orders would always be
waiting outside the brewery, they still had a set entry rate. Earlier experiments were not influenced
by this as they did not have the capacity to handle the orders. The entry rate was set at one order per
two hours (on a negative exponential scale), or ~12 orders per day, or ~4380 orders in a year. On
closer inspection, the model was able to handle all the orders that were generated. This mistake was
discovered after all runs started averaging out at around ~4360 orders being completed. Whilst these
experiments were not carried out as planned, sometimes being limited by order entry speed into the
brewery instead of bottlenecks in the processes themselves, they did produce some interesting
results.
Big Brewery V3
For example, an experiment was conducted using 1000 storage spaces and 5 to 15 kettles in 3 sets of
11 experiments. Set 1 used 3 brewers, set 2 used 4 brewers and set 3 used 5 brewers. One of these
brewers was always designated as being focussed on brewing only. This led to a profitability plot as
shown in Figure 11, and critical Quality Time plot as shown in Figure 12. Note that none of these
experiments actually reached the limit of ~4360 orders per year, but some were close enough that
the order queue might have been empty at times when a new order could have been brewed.
Figure 11: Profitability in Big Brewery V3, euros, for experiments runs 1-11.
Notably, the first setup with 3 brewers did reach its peak at around €300.000 in profits in the 10th
experiment, whilst the second and third setup did not reach their full potential yet in these
experiments. All three experiments brewed a comparable amount in their kettles, utilizing them to
their maximum potential in the earlier interventions. In leading up to their maximum, all three
interventions show a clear, almost linear connection between the number of kettles in the brewery
and overall profits. Also, the critical quality time indicator as shown in Figure 12 shows that an
increase of one brewer in this setup makes a large, almost 50% difference in the average waiting
time between critical steps in the brewing process, showing a large improvement in overall quality
due to decreased waiting times.
-100000
-50000
0
50000
100000
150000
200000
250000
300000
350000
1 2 3 4 5 6 7 8 9 10 11
Profitability of Big Brewery V3, Euros
3 brewers 4 brewers 5 brewers
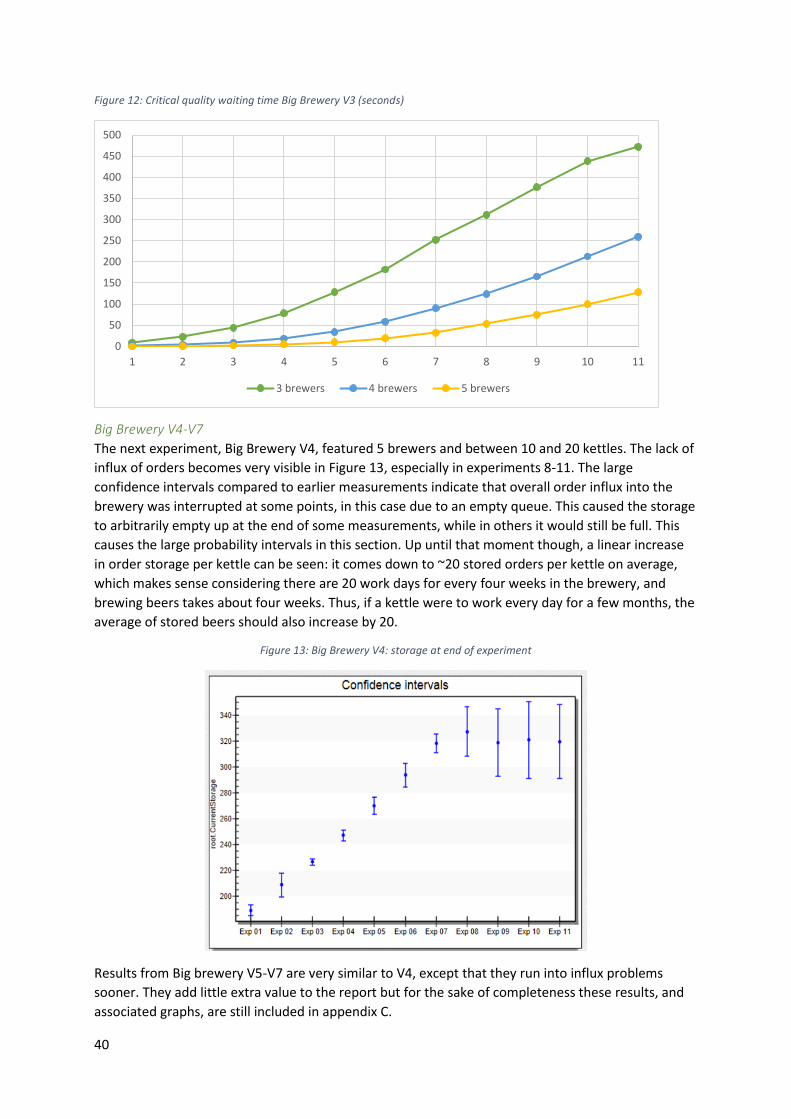
40
Figure 12: Critical quality waiting time Big Brewery V3 (seconds)
Big Brewery V4-V7
The next experiment, Big Brewery V4, featured 5 brewers and between 10 and 20 kettles. The lack of
influx of orders becomes very visible in Figure 13, especially in experiments 8-11. The large
confidence intervals compared to earlier measurements indicate that overall order influx into the
brewery was interrupted at some points, in this case due to an empty queue. This caused the storage
to arbitrarily empty up at the end of some measurements, while in others it would still be full. This
causes the large probability intervals in this section. Up until that moment though, a linear increase
in order storage per kettle can be seen: it comes down to ~20 stored orders per kettle on average,
which makes sense considering there are 20 work days for every four weeks in the brewery, and
brewing beers takes about four weeks. Thus, if a kettle were to work every day for a few months, the
average of stored beers should also increase by 20.
Figure 13: Big Brewery V4: storage at end of experiment
Results from Big brewery V5-V7 are very similar to V4, except that they run into influx problems
sooner. They add little extra value to the report but for the sake of completeness these results, and
associated graphs, are still included in appendix C.
0
50
100
150
200
250
300
350
400
450
500
1 2 3 4 5 6 7 8 9 10 11
3 brewers 4 brewers 5 brewers
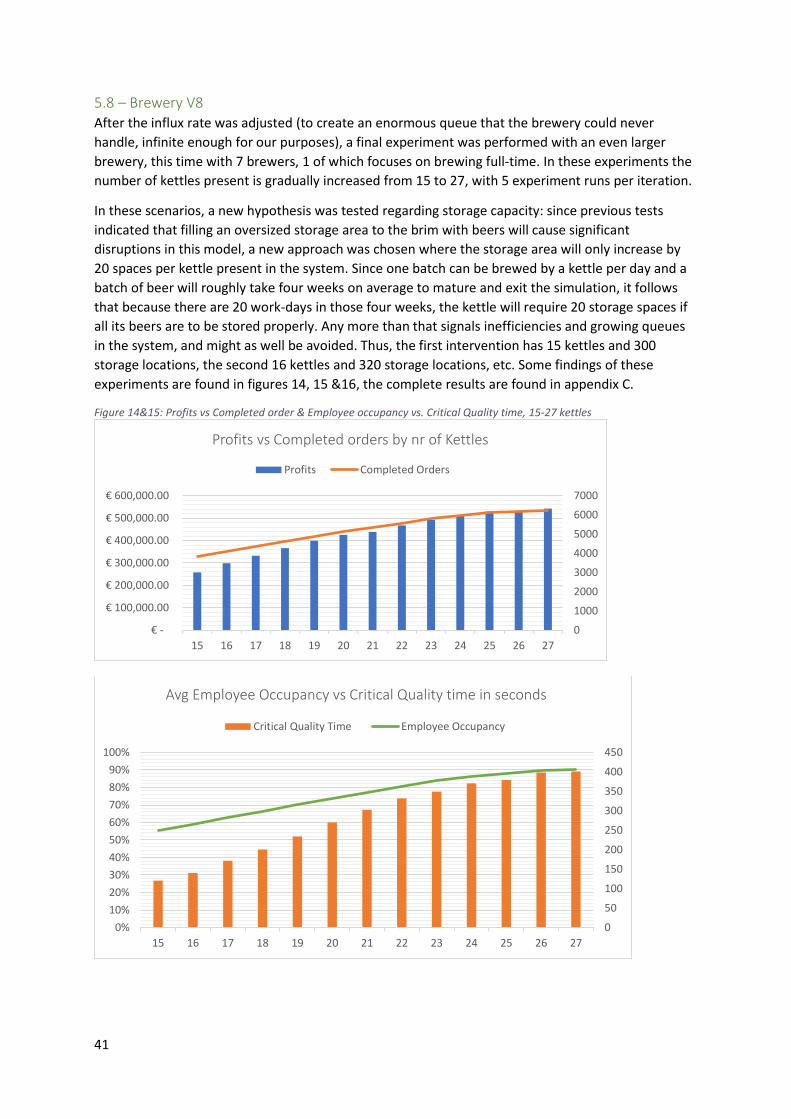
41
5.8 – Brewery V8 After the influx rate was adjusted (to create an enormous queue that the brewery could never
handle, infinite enough for our purposes), a final experiment was performed with an even larger
brewery, this time with 7 brewers, 1 of which focuses on brewing full-time. In these experiments the
number of kettles present is gradually increased from 15 to 27, with 5 experiment runs per iteration.
In these scenarios, a new hypothesis was tested regarding storage capacity: since previous tests
indicated that filling an oversized storage area to the brim with beers will cause significant
disruptions in this model, a new approach was chosen where the storage area will only increase by
20 spaces per kettle present in the system. Since one batch can be brewed by a kettle per day and a
batch of beer will roughly take four weeks on average to mature and exit the simulation, it follows
that because there are 20 work-days in those four weeks, the kettle will require 20 storage spaces if
all its beers are to be stored properly. Any more than that signals inefficiencies and growing queues
in the system, and might as well be avoided. Thus, the first intervention has 15 kettles and 300
storage locations, the second 16 kettles and 320 storage locations, etc. Some findings of these
experiments are found in figures 14, 15 &16, the complete results are found in appendix C.
Figure 14&15: Profits vs Completed order & Employee occupancy vs. Critical Quality time, 15-27 kettles
0
1000
2000
3000
4000
5000
6000
7000
€ -
€ 100,000.00
€ 200,000.00
€ 300,000.00
€ 400,000.00
€ 500,000.00
€ 600,000.00
15 16 17 18 19 20 21 22 23 24 25 26 27
Profits vs Completed orders by nr of Kettles
Profits Completed Orders
0
50
100
150
200
250
300
350
400
450
0%
10%
20%
30%
40%
50%
60%
70%
80%
90%
100%
15 16 17 18 19 20 21 22 23 24 25 26 27
Avg Employee Occupancy vs Critical Quality time in seconds
Critical Quality Time Employee Occupancy
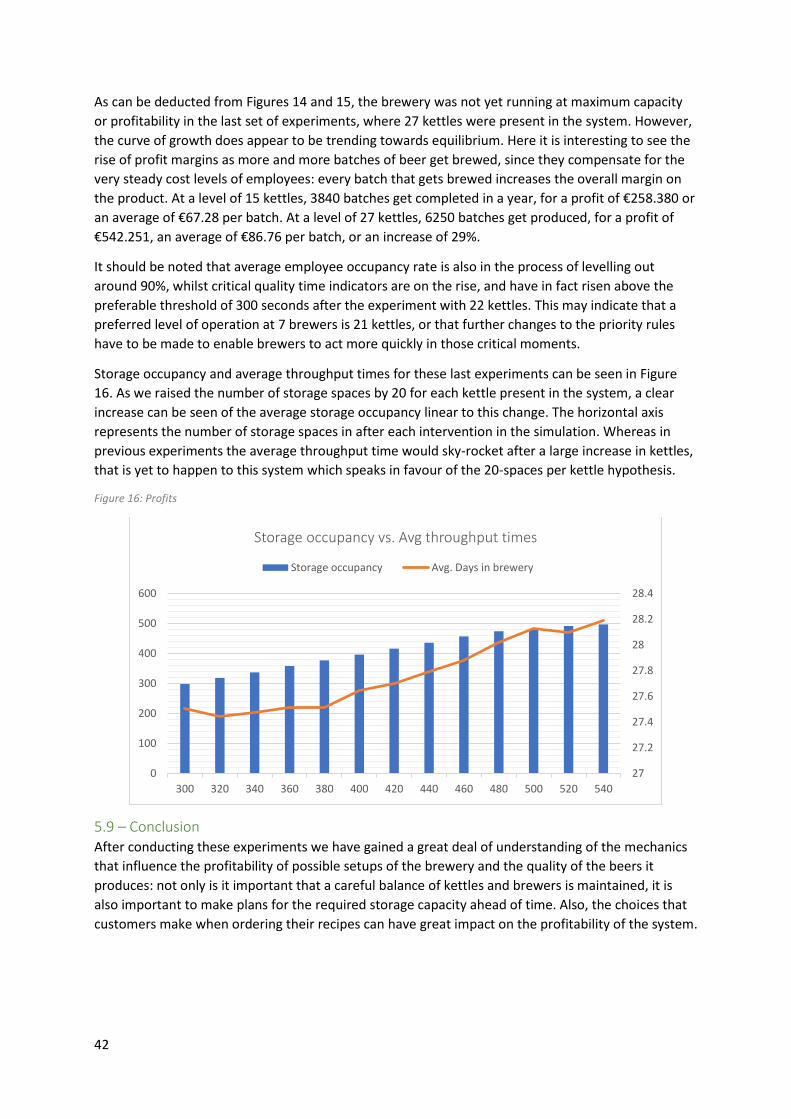
42
As can be deducted from Figures 14 and 15, the brewery was not yet running at maximum capacity
or profitability in the last set of experiments, where 27 kettles were present in the system. However,
the curve of growth does appear to be trending towards equilibrium. Here it is interesting to see the
rise of profit margins as more and more batches of beer get brewed, since they compensate for the
very steady cost levels of employees: every batch that gets brewed increases the overall margin on
the product. At a level of 15 kettles, 3840 batches get completed in a year, for a profit of €258.380 or
an average of €67.28 per batch. At a level of 27 kettles, 6250 batches get produced, for a profit of
€542.251, an average of €86.76 per batch, or an increase of 29%.
It should be noted that average employee occupancy rate is also in the process of levelling out
around 90%, whilst critical quality time indicators are on the rise, and have in fact risen above the
preferable threshold of 300 seconds after the experiment with 22 kettles. This may indicate that a
preferred level of operation at 7 brewers is 21 kettles, or that further changes to the priority rules
have to be made to enable brewers to act more quickly in those critical moments.
Storage occupancy and average throughput times for these last experiments can be seen in Figure
16. As we raised the number of storage spaces by 20 for each kettle present in the system, a clear
increase can be seen of the average storage occupancy linear to this change. The horizontal axis
represents the number of storage spaces in after each intervention in the simulation. Whereas in
previous experiments the average throughput time would sky-rocket after a large increase in kettles,
that is yet to happen to this system which speaks in favour of the 20-spaces per kettle hypothesis.
Figure 16: Profits
5.9 – Conclusion After conducting these experiments we have gained a great deal of understanding of the mechanics
that influence the profitability of possible setups of the brewery and the quality of the beers it
produces: not only is it important that a careful balance of kettles and brewers is maintained, it is
also important to make plans for the required storage capacity ahead of time. Also, the choices that
customers make when ordering their recipes can have great impact on the profitability of the system.
27
27.2
27.4
27.6
27.8
28
28.2
28.4
0
100
200
300
400
500
600
300 320 340 360 380 400 420 440 460 480 500 520 540
Storage occupancy vs. Avg throughput times
Storage occupancy Avg. Days in brewery
43
Chapter 6 - Conclusion In this final section of the report we will review the outcomes of the experiments that were
conducted and their connection to our conclusions on the scalability question that lay at the basis of
this research. We will also discuss some limitations of the current simulation model and further
improvements that could be made to the model in potential future versions. We will then outline
some final advice for Hops & Grains management to improve their production processes, and outline
some avenues of further research.
6.1 – Scalability of multi-kettle brewing systems Scalability is “the property of a system to handle a growing amount of work by adding resources to
the system” (Bondi, 2000). According to the current model, the brewery is most definitely scalable:
an increase in workers, kettles and storage capacity does result in a near-linear increase in completed
orders and profits, has a positive impact on profit margins, and also coincides with a non-negligible
increase in quality for the final products and more stable throughput times.
Scaling up production in the current brewery is possible. If we base our conclusions on the baseline
results as described in section 5.4, it is advised to focus on increasing storage capacity to at least 50
(and preferably 78+) spaces, and add three extra kettles to the system. This will increase the brewing
capacity to 1850 crates per year, which is well above the target of 1250 crates in 2021. This is, of
course, assuming that the brewery will have enough customers to allow it to handle new orders
every working day. If this is not the case, the brewery may suffice with fewer storage spaces, and less
full-time employees.
On the hard limit of five brews per brewer per day, as calculated by Hops & Grains management, we
can reach the following conclusion: it is valid, in the case that customers will mainly purchase small
batches of 33cl bottles. Since these are the most labour intensive and comparatively unprofitable
batches to brew, this comes as no surprise. However, in the base scenario described in this thesis,
where a mix of small, medium and large bottles is purchased in differing quantities, this limit does
not apply, as these larger batches of more expensive bottles are more profitable.
For future expansion plans, the current simulation proves promising prospects: since the proposition
is scalable adding more kettles and brewers to the system will, theoretically, always increase
production capacity. In our simulations, the most effective ratio of kettles to brewers turned out to
be 3:1 in the latest experiment, but this is assuming that every employee picks up any job in the
brewery at the moment they finish their last job. However, more experimentation and more reliable
input data might be required before a definitive conclusion on that subject can be reached.
Important to realize is that, in any case, storage capacity will remain a hard boundary for the possible
number of completed brews.
6.2 – Discussion and limitations The discrete event simulation model that was developed for this project is extensive, but it is not
quite complete yet. For example, the quality control and labelling steps feel inadequate in their
current form and will need extra work in a future version of the model. The quality control step
should be performed by a group of cooperating workers in real life, which cannot currently be
modelled, whilst the labelling step should depend on the amount of labels required and the time it
takes to print and place them on the bottles. The execution of these steps is still a little unclear in the
current production process. In a next version of the model the development of these production
steps will hopefully be further underway, and a more accurate assessment of the work-load they add
can be modelled.
44
Also, introducing different sizes of storage containers for different quantities of beer will increase the
accuracy of the simulation. For the sake of completeness, at least the actual hop- and yeast costs
should be included in the processes of the simulation if this project ever gets a follow-up. In the case
of such a follow up, a more long-term and extensive observation study should be conducted to
provide more data points to plug into the simulation, as the dataset that was eventually used has its
own share of problems.
The simulation would further benefit if enhanced worker management could take place, as at the
moment it has no way of taking specific worker assignments into account. For example such options
as designating some brewers to only work on specific kettles, assigning workers to only focus on non-
brewing tasks, starting brews only if a certain number of kettles can be filled, dismissing staff if they
are not needed for a day, or only brewing on certain days would be interesting to experiment with.
They will most certainly play a part in daily brewing operations if Hops & Grains were to grow to a
certain size, and as such should be included in the model.
Finally, the conclusions reached in this research only apply to a brewery that is working through a
back-log of orders, not a brewery that is able to handle all orders that come in. Such a setup could be
modelled quite easily with the current model as a basis, but more data on the entry rate of the
brewery would be required in order to make it accurate.
6.3 – Recommendations Hops & Grains is advised to increase the number of kettles in their brewhouse by three so that five
units will be usable for a single day of brewing. Increasing the storage space for batches in the
brewery to a minimum of 70 spots should also be a priority if the goal of 1250 crates in 2021 is to be
reached.
According to the experiments with different scenarios of customer purchases, Hops & Grains would
be well-advised to promote larger orders of more expensive bottles to their customers over smaller
orders of cheaper bottles, as scenarios where the former were purchased more often were more
profitable than the latter. Also, promoting IPA-style beers over Stout-style beers would increase
throughput in the brewery in case of limited storage capacity, although it will slightly increase costs
due to increased hop usage.
Furthermore Hops & Grains is advised to work on the standardization and further professionalisation
of their production processes. Creating standardized work stations could work wonders for overall
productivity and would doubtlessly improve the efficiency of the different tasks in the brewery above
the levels that were used in this report. Scaling the business will also prove to be easier once
standardized workstations have been developed, since those stations can just be replicated.
6.4 – Suggestions for further research
The simulation model that was created could be further enhanced to calculate the advantages of
new equipment, concerning the amount of time that would be saved when using it. Additionally, it
could be used to simulate the behaviour of bigger orders in the brewery if larger kettles were
present, or the addition of extra packaging options to the website mixer. In the case of any such
follow-up, H&G is advised to run the simulation on a good computer, or to make it more efficient, as
my laptop took over 3.5 hours to complete the last set of simulations included in this report.
Simulating very complex breweries using this model will likely take days.
In the model, a sweet spot of one brewer per three kettles and 20 storage spaces per kettle was
found. Whether or not this proves to be a good guideline for the future most certainly depends on

45
the accuracy of the model, but such a sweet spot must exist and so it could be an interesting avenue
of research. However, more accurate work times must be collected in such a case to serve as the
basis of the simulation. Both areas could be interesting avenues of research, either for another
student or Hops & Grains staff itself.
46
Appendix A: Literature Study regarding validity of observation studies
Introduction My bachelor thesis assignment will be the production planning at Hops & Grains: the Personal
Brewing Company, a brewery start-up I founded and manage with four fellow students. Hops &
Grains brews small batches of customized craft beer for individual customers. I am a primary
stakeholder in this company, managing the brewery itself and its daily operations. Little to no
research has been done on the best way to plan brewing operations in this type of an operation
(Swinnen, 2018), which is why I chose to pursue it as a research topic.
In order to plan operations accurately, I intend to build a simulation model of the brewery, which can
be scaled to include multiple employees and large amounts of individual kettles. For this simulation
model to be accurate, data needs to be collected on the times that personnel spends on many
different brewing related tasks in our pilot plant. For this, an observation study is required, as the
data is not available anywhere else. My biggest problem in this is my lack of knowledge on how to
perform this type of research.
The knowledge problem I would like to solve is therefore: What are the assessment criteria to assess
the validity of observation studies in a production environment? As an aside, I want to study the
procedures that modern managers and operational researchers might employ when performing time
measurement studies in worker-driven production processes, to see how I can apply this theory in
my own research. This should lead me to raise my understanding of observational research from my
current basic level to a level where I feel confident performing my own research.
Literature review This chapter will cover the results of a literature study conducted to find relevant literature regarding
the topic of observation studies in production environments. Concepts and variables regarding
general observation studies will be briefly explained, the criteria for validity isolated, and a checklist
created which can be used to group any given observation study (in a production environment) into
its own category, to allow for easy comparison between methods used in different studies and to
judge the validity of the study.
Observation is the active acquisition of data from a primary source, either by using ones own senses,
or measurement instruments. Observation is one of the most common ways for humans to collect
data, but it only qualifies as scientific inquiry when it is conducted specifically to answer a research
question, is systematically planned and executed, uses proper controls, and provides a reliable and
valid account of what happened (Cooper, 2014). Observation studies are important starting steps for
many types of research, with applications ranging within almost any scientific discipline as a tool for
primary data gathering or as a supplement to other methods. In observation studies there is always
an observer and a subject being observed.
Depending on the research question that an investigator poses, a choice should be made regarding
the type of observation study that is required to answer this question. The knowledge question that
a researcher is trying to answer will impact the type of data that needs to be collected, and the way it
is to be measured. Data regarding employee boredom requires a different method of gathering than
data regarding production times, say, the analysis of spoken conversations or facial expressions vs.
work measurement. According to Cooper, two major categories of observation study can be defined:
behavioural observation and non-behavioural observation.
Non-behavioural observation is the overarching category for record analysis and physical process
analysis, which includes time/motion studies of manufacturing processes, combined with the overall
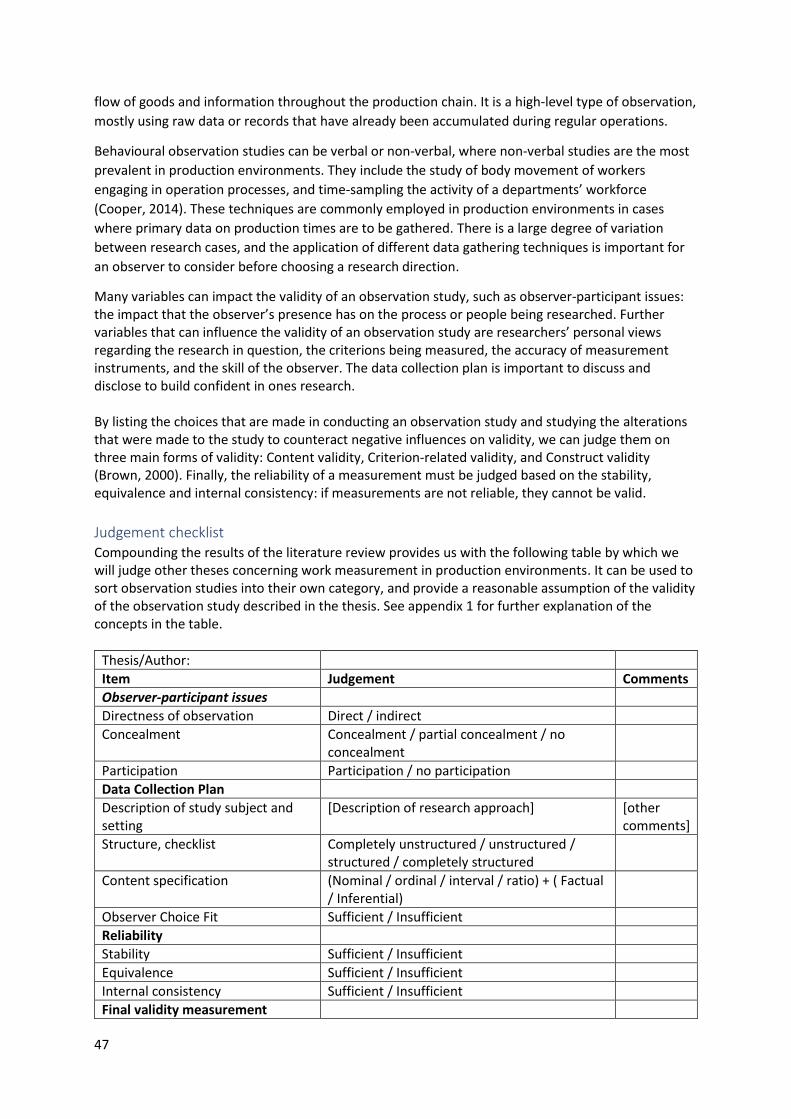
47
flow of goods and information throughout the production chain. It is a high-level type of observation,
mostly using raw data or records that have already been accumulated during regular operations.
Behavioural observation studies can be verbal or non-verbal, where non-verbal studies are the most
prevalent in production environments. They include the study of body movement of workers
engaging in operation processes, and time-sampling the activity of a departments’ workforce
(Cooper, 2014). These techniques are commonly employed in production environments in cases
where primary data on production times are to be gathered. There is a large degree of variation
between research cases, and the application of different data gathering techniques is important for
an observer to consider before choosing a research direction.
Many variables can impact the validity of an observation study, such as observer-participant issues: the impact that the observer’s presence has on the process or people being researched. Further variables that can influence the validity of an observation study are researchers’ personal views regarding the research in question, the criterions being measured, the accuracy of measurement instruments, and the skill of the observer. The data collection plan is important to discuss and disclose to build confident in ones research. By listing the choices that are made in conducting an observation study and studying the alterations that were made to the study to counteract negative influences on validity, we can judge them on three main forms of validity: Content validity, Criterion-related validity, and Construct validity (Brown, 2000). Finally, the reliability of a measurement must be judged based on the stability, equivalence and internal consistency: if measurements are not reliable, they cannot be valid.
Judgement checklist Compounding the results of the literature review provides us with the following table by which we will judge other theses concerning work measurement in production environments. It can be used to sort observation studies into their own category, and provide a reasonable assumption of the validity of the observation study described in the thesis. See appendix 1 for further explanation of the concepts in the table.
Thesis/Author:
Item Judgement Comments
Observer-participant issues
Directness of observation Direct / indirect
Concealment Concealment / partial concealment / no concealment
Participation Participation / no participation
Data Collection Plan
Description of study subject and setting
[Description of research approach] [other comments]
Structure, checklist Completely unstructured / unstructured / structured / completely structured
Content specification (Nominal / ordinal / interval / ratio) + ( Factual / Inferential)
Observer Choice Fit Sufficient / Insufficient
Reliability
Stability Sufficient / Insufficient
Equivalence Sufficient / Insufficient
Internal consistency Sufficient / Insufficient
Final validity measurement
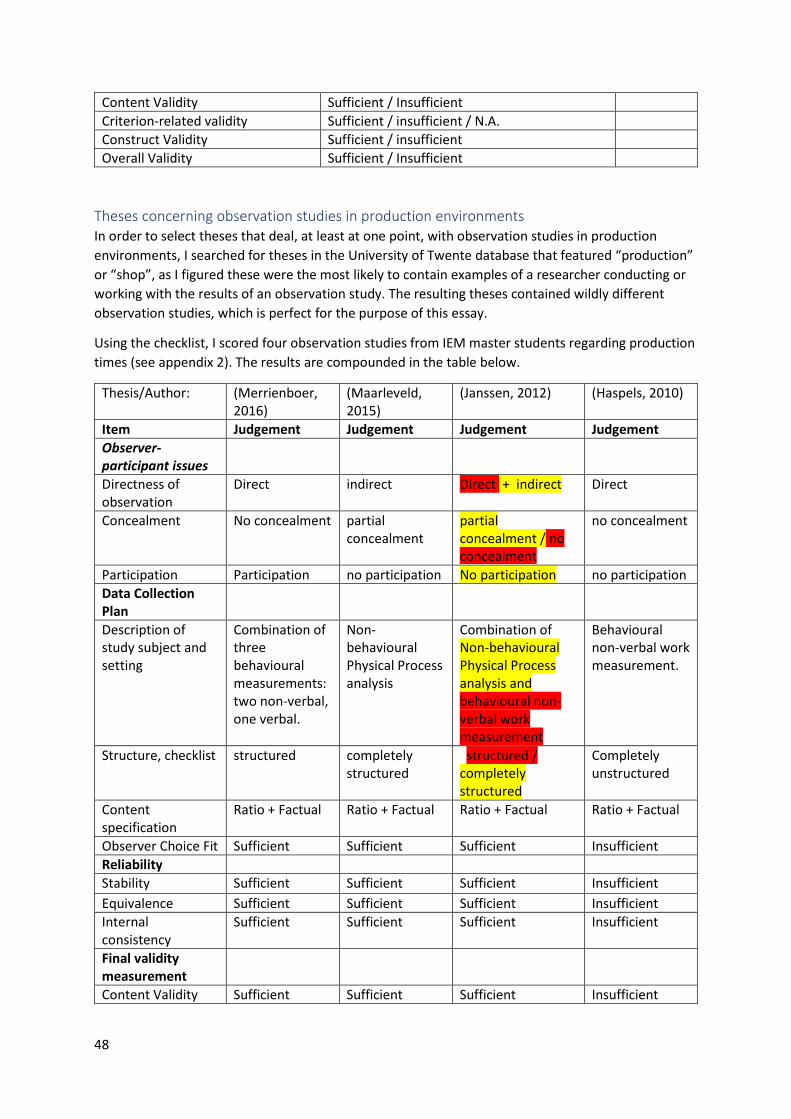
48
Content Validity Sufficient / Insufficient
Criterion-related validity Sufficient / insufficient / N.A.
Construct Validity Sufficient / insufficient
Overall Validity Sufficient / Insufficient
Theses concerning observation studies in production environments In order to select theses that deal, at least at one point, with observation studies in production
environments, I searched for theses in the University of Twente database that featured “production”
or “shop”, as I figured these were the most likely to contain examples of a researcher conducting or
working with the results of an observation study. The resulting theses contained wildly different
observation studies, which is perfect for the purpose of this essay.
Using the checklist, I scored four observation studies from IEM master students regarding production
times (see appendix 2). The results are compounded in the table below.
Thesis/Author: (Merrienboer, 2016)
(Maarleveld, 2015)
(Janssen, 2012) (Haspels, 2010)
Item Judgement Judgement Judgement Judgement
Observer-participant issues
Directness of observation
Direct indirect Direct + indirect Direct
Concealment No concealment partial concealment
partial concealment / no concealment
no concealment
Participation Participation no participation No participation no participation
Data Collection Plan
Description of study subject and setting
Combination of three behavioural measurements: two non-verbal, one verbal.
Non-behavioural Physical Process analysis
Combination of Non-behavioural Physical Process analysis and behavioural non-verbal work measurement
Behavioural non-verbal work measurement.
Structure, checklist structured completely structured
structured / completely structured
Completely unstructured
Content specification
Ratio + Factual Ratio + Factual Ratio + Factual Ratio + Factual
Observer Choice Fit Sufficient Sufficient Sufficient Insufficient
Reliability
Stability Sufficient Sufficient Sufficient Insufficient
Equivalence Sufficient Sufficient Sufficient Insufficient
Internal consistency
Sufficient Sufficient Sufficient Insufficient
Final validity measurement
Content Validity Sufficient Sufficient Sufficient Insufficient
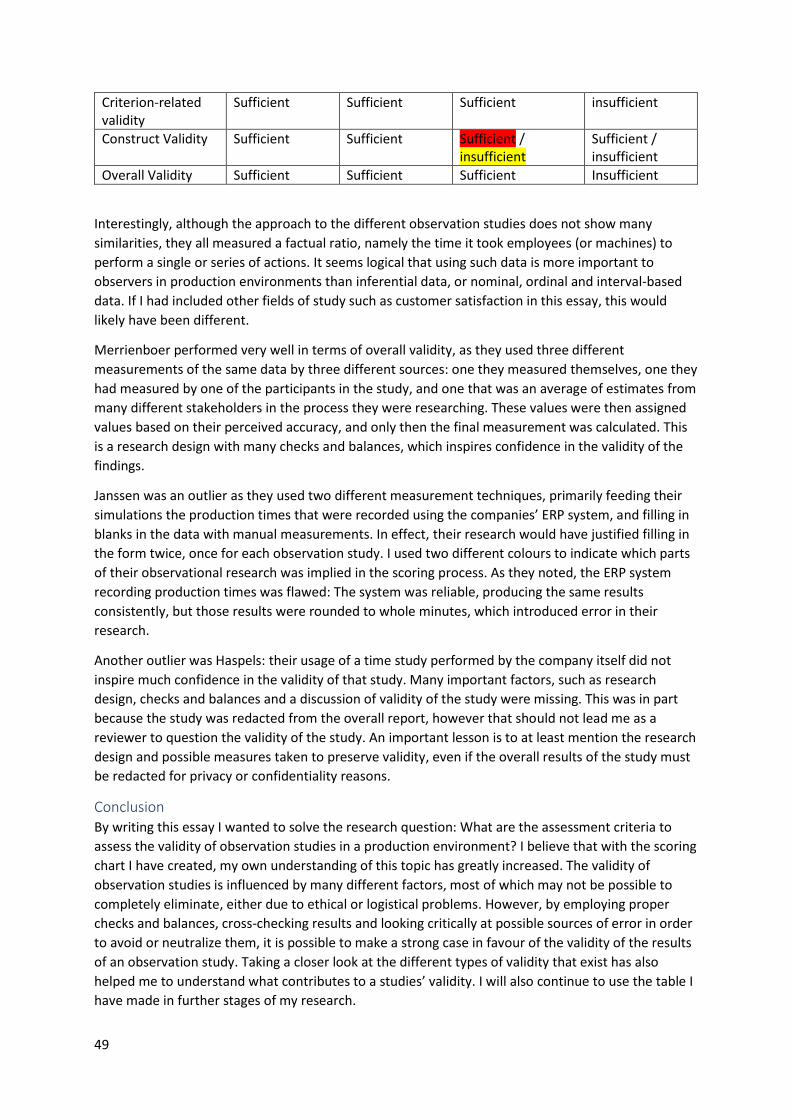
49
Criterion-related validity
Sufficient Sufficient Sufficient insufficient
Construct Validity Sufficient Sufficient Sufficient / insufficient
Sufficient / insufficient
Overall Validity Sufficient Sufficient Sufficient Insufficient
Interestingly, although the approach to the different observation studies does not show many
similarities, they all measured a factual ratio, namely the time it took employees (or machines) to
perform a single or series of actions. It seems logical that using such data is more important to
observers in production environments than inferential data, or nominal, ordinal and interval-based
data. If I had included other fields of study such as customer satisfaction in this essay, this would
likely have been different.
Merrienboer performed very well in terms of overall validity, as they used three different
measurements of the same data by three different sources: one they measured themselves, one they
had measured by one of the participants in the study, and one that was an average of estimates from
many different stakeholders in the process they were researching. These values were then assigned
values based on their perceived accuracy, and only then the final measurement was calculated. This
is a research design with many checks and balances, which inspires confidence in the validity of the
findings.
Janssen was an outlier as they used two different measurement techniques, primarily feeding their
simulations the production times that were recorded using the companies’ ERP system, and filling in
blanks in the data with manual measurements. In effect, their research would have justified filling in
the form twice, once for each observation study. I used two different colours to indicate which parts
of their observational research was implied in the scoring process. As they noted, the ERP system
recording production times was flawed: The system was reliable, producing the same results
consistently, but those results were rounded to whole minutes, which introduced error in their
research.
Another outlier was Haspels: their usage of a time study performed by the company itself did not
inspire much confidence in the validity of that study. Many important factors, such as research
design, checks and balances and a discussion of validity of the study were missing. This was in part
because the study was redacted from the overall report, however that should not lead me as a
reviewer to question the validity of the study. An important lesson is to at least mention the research
design and possible measures taken to preserve validity, even if the overall results of the study must
be redacted for privacy or confidentiality reasons.
Conclusion By writing this essay I wanted to solve the research question: What are the assessment criteria to
assess the validity of observation studies in a production environment? I believe that with the scoring
chart I have created, my own understanding of this topic has greatly increased. The validity of
observation studies is influenced by many different factors, most of which may not be possible to
completely eliminate, either due to ethical or logistical problems. However, by employing proper
checks and balances, cross-checking results and looking critically at possible sources of error in order
to avoid or neutralize them, it is possible to make a strong case in favour of the validity of the results
of an observation study. Taking a closer look at the different types of validity that exist has also
helped me to understand what contributes to a studies’ validity. I will also continue to use the table I
have made in further stages of my research.
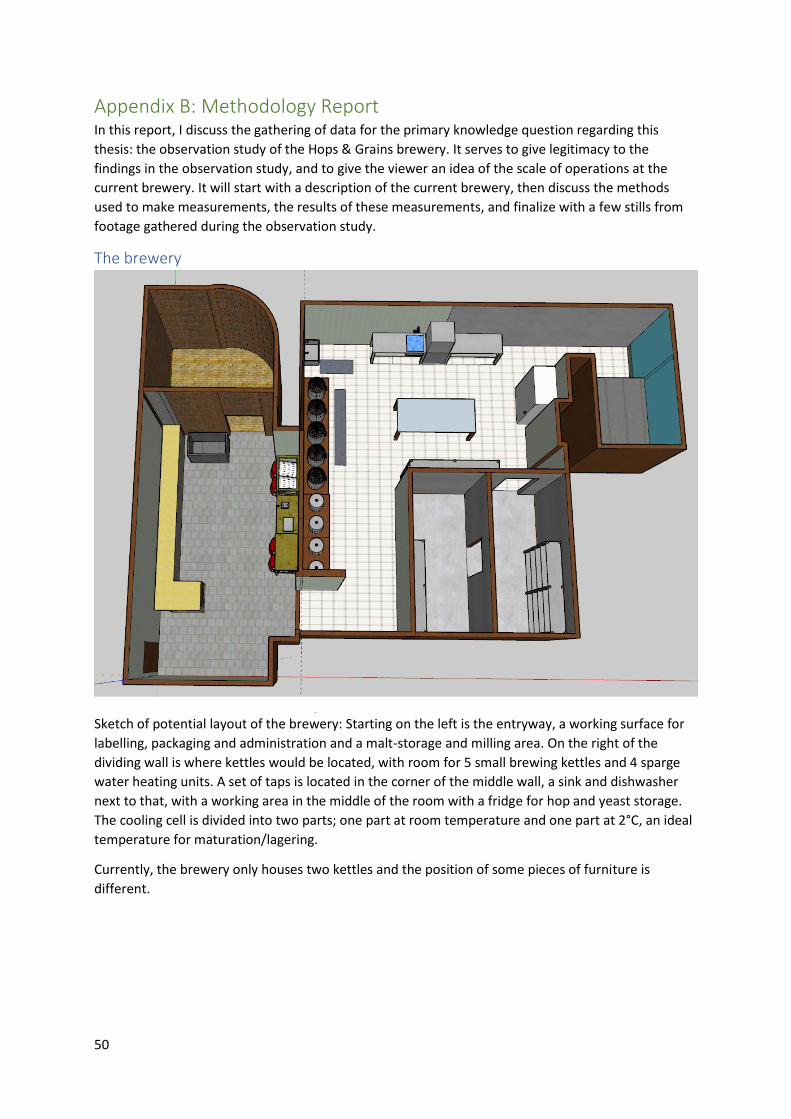
50
Appendix B: Methodology Report In this report, I discuss the gathering of data for the primary knowledge question regarding this
thesis: the observation study of the Hops & Grains brewery. It serves to give legitimacy to the
findings in the observation study, and to give the viewer an idea of the scale of operations at the
current brewery. It will start with a description of the current brewery, then discuss the methods
used to make measurements, the results of these measurements, and finalize with a few stills from
footage gathered during the observation study.
The brewery
Sketch of potential layout of the brewery: Starting on the left is the entryway, a working surface for
labelling, packaging and administration and a malt-storage and milling area. On the right of the
dividing wall is where kettles would be located, with room for 5 small brewing kettles and 4 sparge
water heating units. A set of taps is located in the corner of the middle wall, a sink and dishwasher
next to that, with a working area in the middle of the room with a fridge for hop and yeast storage.
The cooling cell is divided into two parts; one part at room temperature and one part at 2°C, an ideal
temperature for maturation/lagering.
Currently, the brewery only houses two kettles and the position of some pieces of furniture is
different.
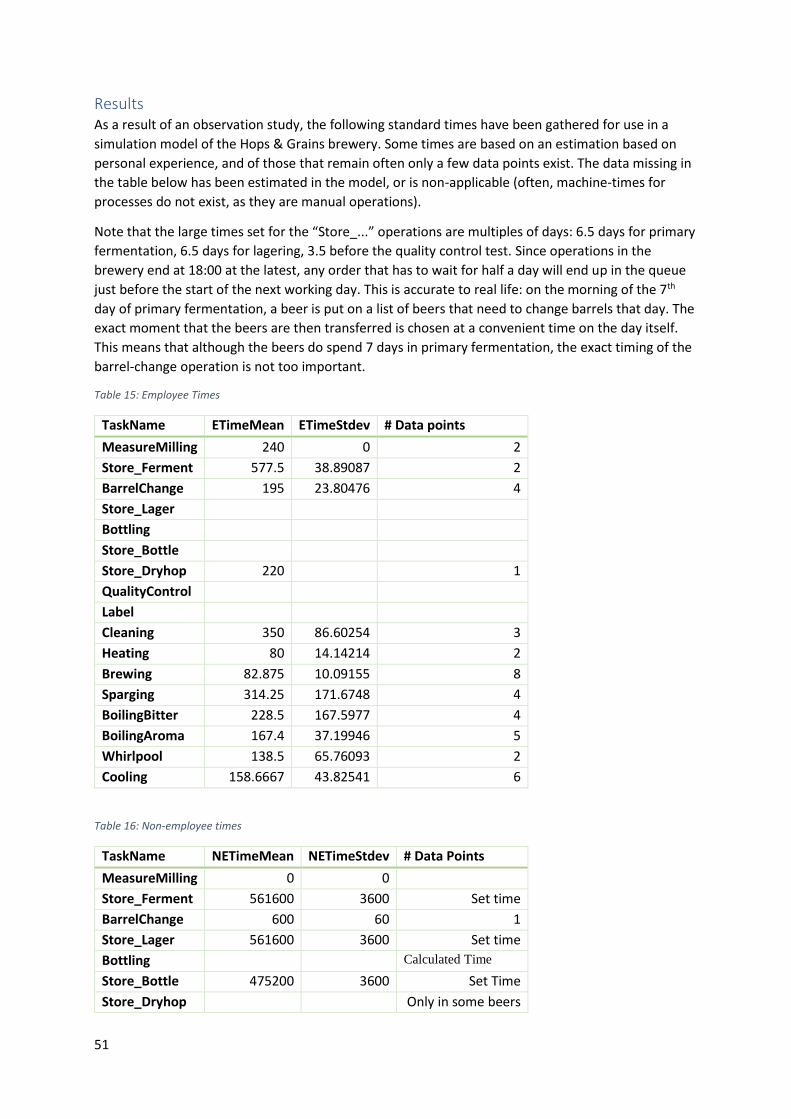
51
Results As a result of an observation study, the following standard times have been gathered for use in a
simulation model of the Hops & Grains brewery. Some times are based on an estimation based on
personal experience, and of those that remain often only a few data points exist. The data missing in
the table below has been estimated in the model, or is non-applicable (often, machine-times for
processes do not exist, as they are manual operations).
Note that the large times set for the “Store_...” operations are multiples of days: 6.5 days for primary
fermentation, 6.5 days for lagering, 3.5 before the quality control test. Since operations in the
brewery end at 18:00 at the latest, any order that has to wait for half a day will end up in the queue
just before the start of the next working day. This is accurate to real life: on the morning of the 7th
day of primary fermentation, a beer is put on a list of beers that need to change barrels that day. The
exact moment that the beers are then transferred is chosen at a convenient time on the day itself.
This means that although the beers do spend 7 days in primary fermentation, the exact timing of the
barrel-change operation is not too important.
Table 15: Employee Times
TaskName ETimeMean ETimeStdev # Data points
MeasureMilling 240 0 2
Store_Ferment 577.5 38.89087 2
BarrelChange 195 23.80476 4
Store_Lager
Bottling
Store_Bottle
Store_Dryhop 220
1
QualityControl
Label
Cleaning 350 86.60254 3
Heating 80 14.14214 2
Brewing 82.875 10.09155 8
Sparging 314.25 171.6748 4
BoilingBitter 228.5 167.5977 4
BoilingAroma 167.4 37.19946 5
Whirlpool 138.5 65.76093 2
Cooling 158.6667 43.82541 6
Table 16: Non-employee times
TaskName NETimeMean NETimeStdev # Data Points
MeasureMilling 0 0
Store_Ferment 561600 3600 Set time
BarrelChange 600 60 1
Store_Lager 561600 3600 Set time
Bottling
Calculated Time
Store_Bottle 475200 3600 Set Time
Store_Dryhop
Only in some beers
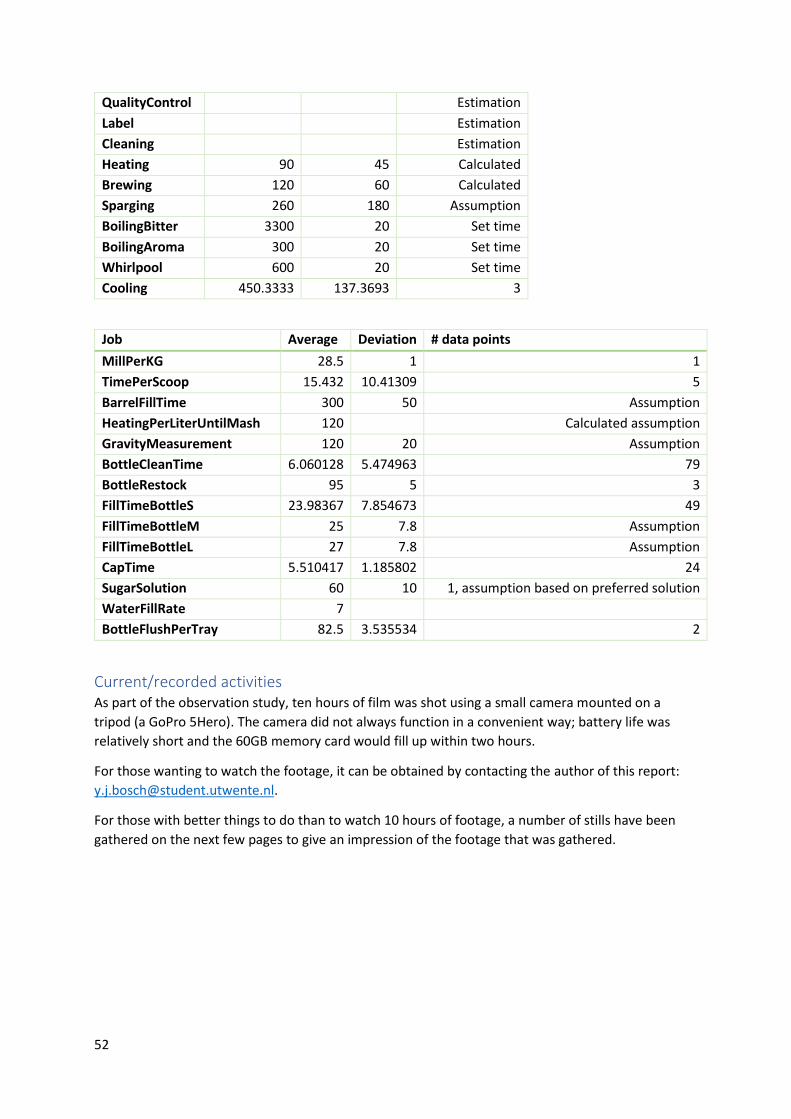
52
QualityControl
Estimation
Label
Estimation
Cleaning
Estimation
Heating 90 45 Calculated
Brewing 120 60 Calculated
Sparging 260 180 Assumption
BoilingBitter 3300 20 Set time
BoilingAroma 300 20 Set time
Whirlpool 600 20 Set time
Cooling 450.3333 137.3693 3
Job Average Deviation # data points
MillPerKG 28.5 1 1
TimePerScoop 15.432 10.41309 5
BarrelFillTime 300 50 Assumption
HeatingPerLiterUntilMash 120
Calculated assumption
GravityMeasurement 120 20 Assumption
BottleCleanTime 6.060128 5.474963 79
BottleRestock 95 5 3
FillTimeBottleS 23.98367 7.854673 49
FillTimeBottleM 25 7.8 Assumption
FillTimeBottleL 27 7.8 Assumption
CapTime 5.510417 1.185802 24
SugarSolution 60 10 1, assumption based on preferred solution
WaterFillRate 7
BottleFlushPerTray 82.5 3.535534 2
Current/recorded activities As part of the observation study, ten hours of film was shot using a small camera mounted on a
tripod (a GoPro 5Hero). The camera did not always function in a convenient way; battery life was
relatively short and the 60GB memory card would fill up within two hours.
For those wanting to watch the footage, it can be obtained by contacting the author of this report:
For those with better things to do than to watch 10 hours of footage, a number of stills have been
gathered on the next few pages to give an impression of the footage that was gathered.
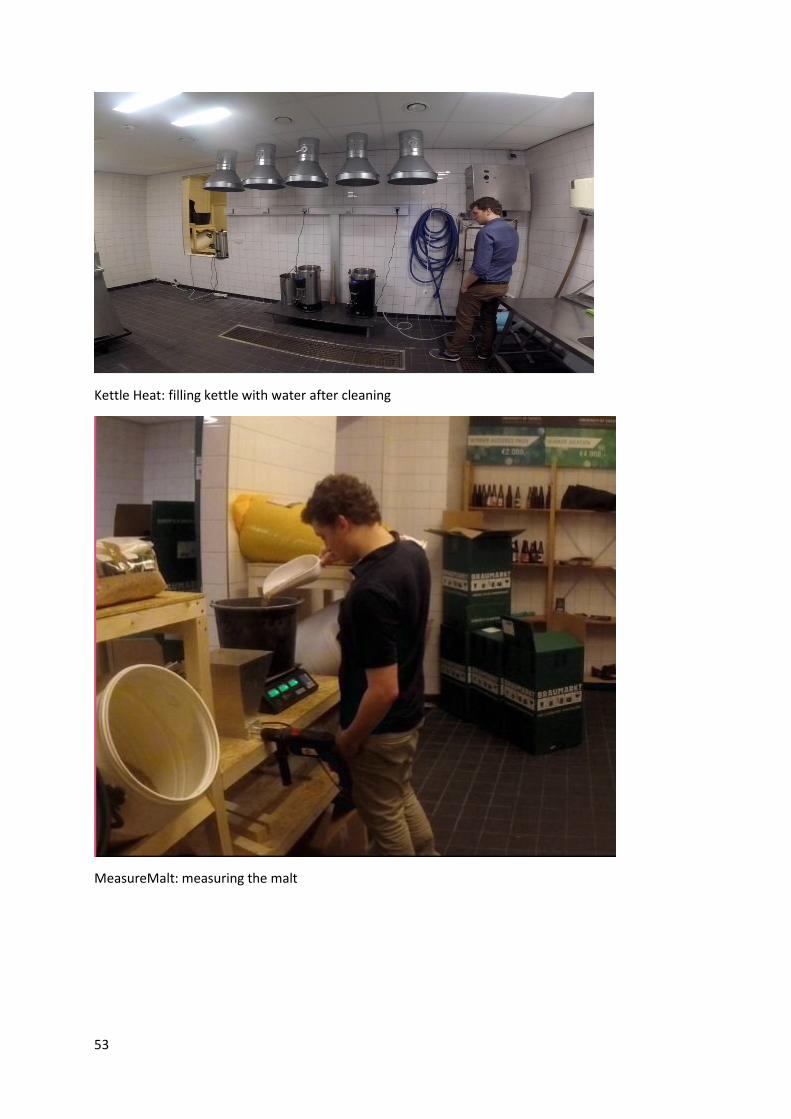
53
Kettle Heat: filling kettle with water after cleaning
MeasureMalt: measuring the malt
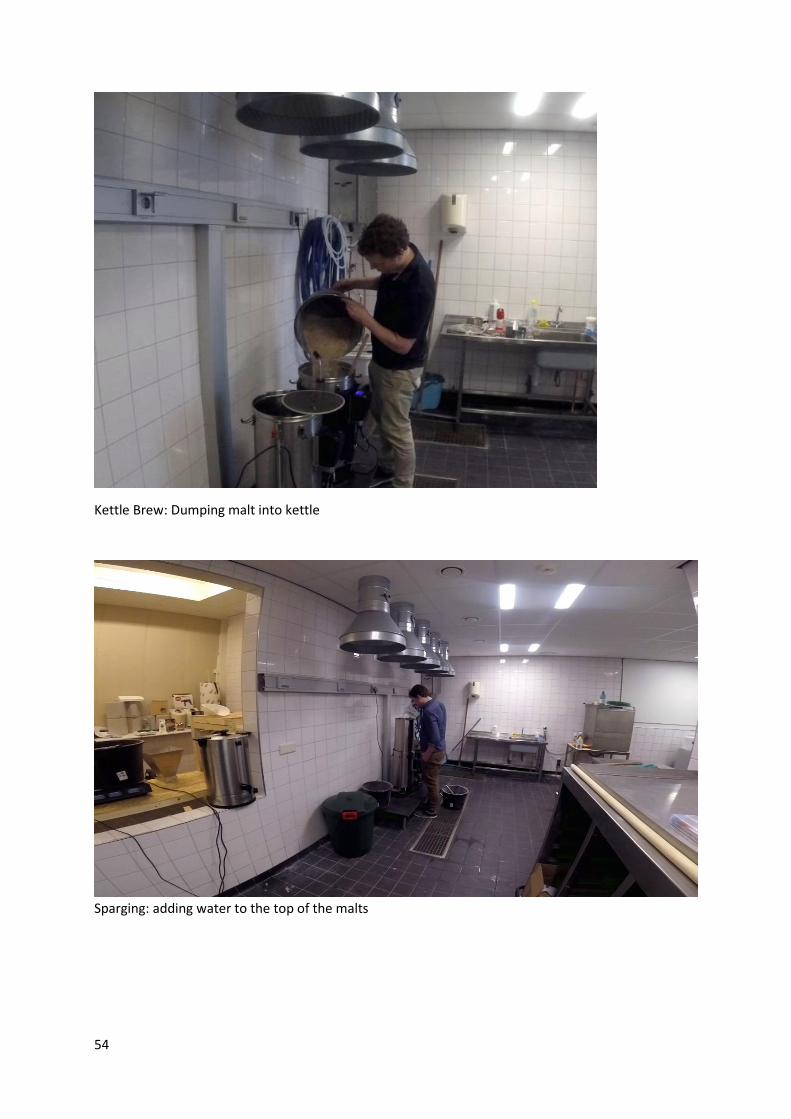
54
Kettle Brew: Dumping malt into kettle
Sparging: adding water to the top of the malts
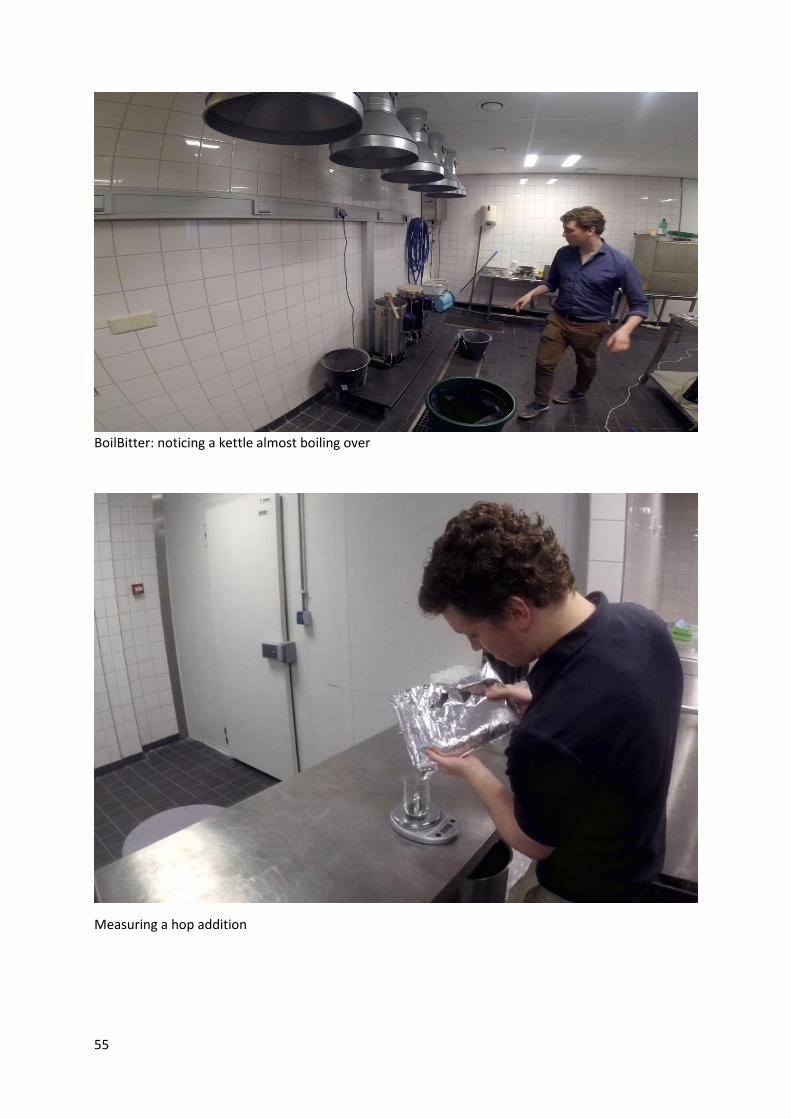
55
BoilBitter: noticing a kettle almost boiling over
Measuring a hop addition
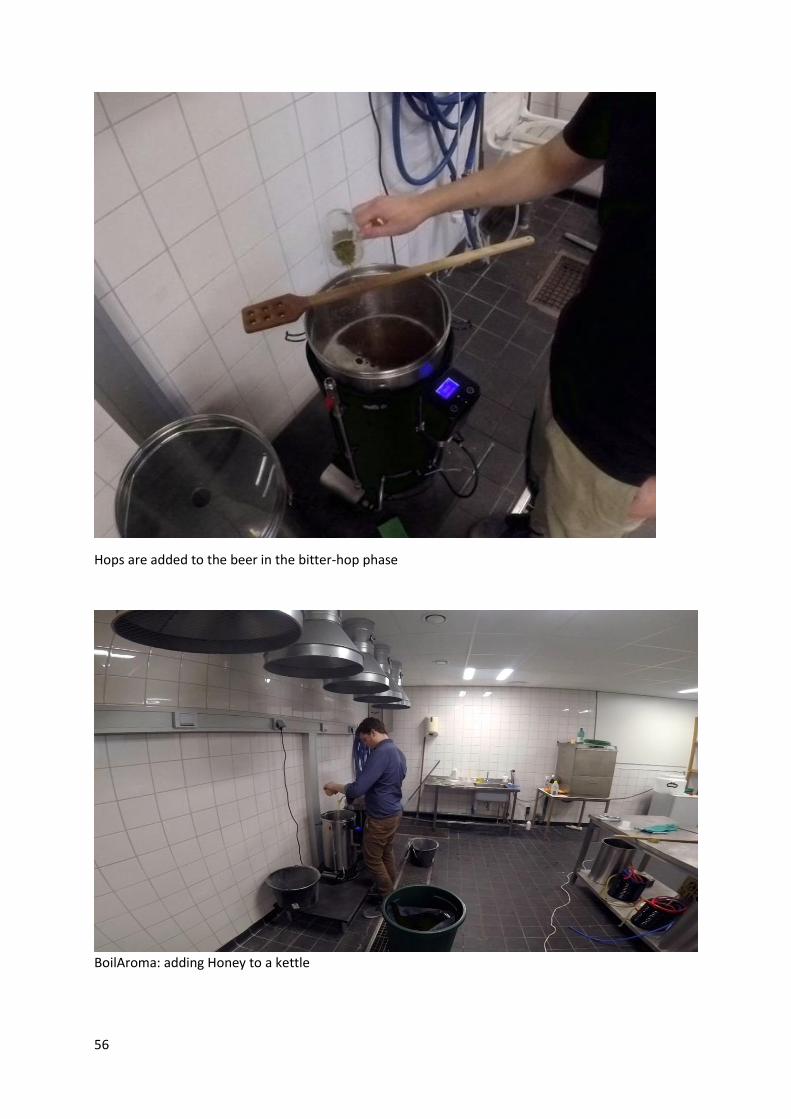
56
Hops are added to the beer in the bitter-hop phase
BoilAroma: adding Honey to a kettle
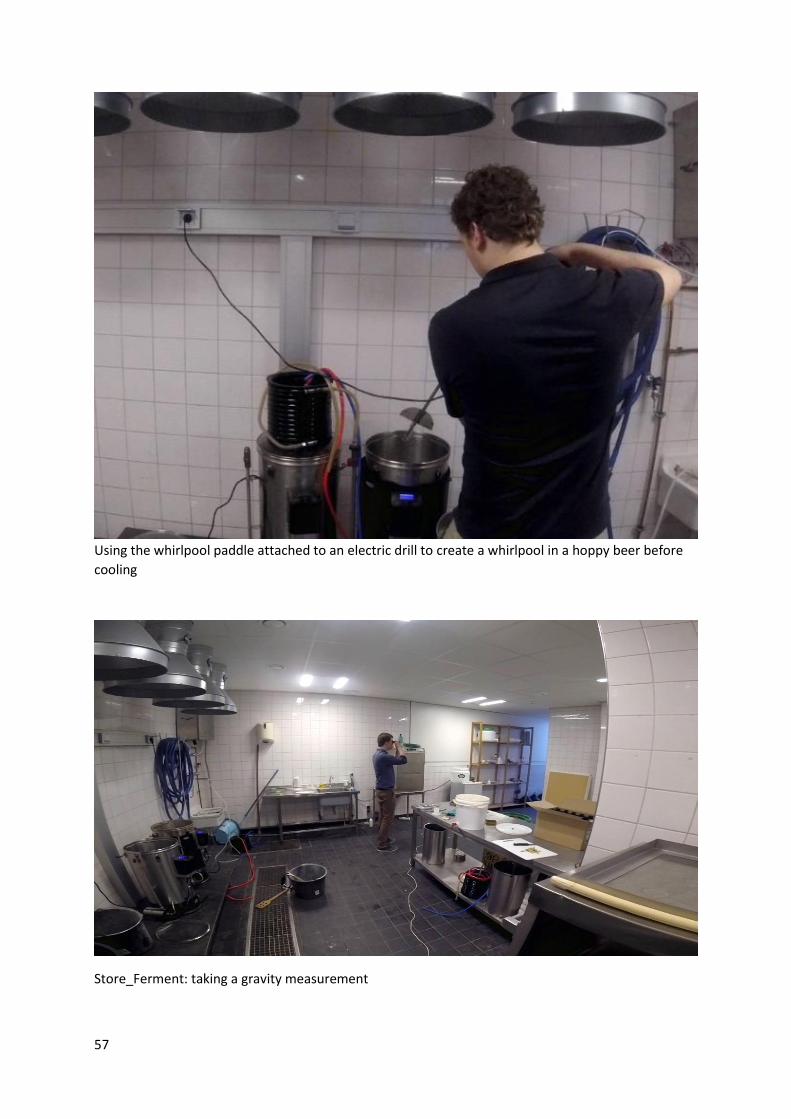
57
Using the whirlpool paddle attached to an electric drill to create a whirlpool in a hoppy beer before
cooling
Store_Ferment: taking a gravity measurement
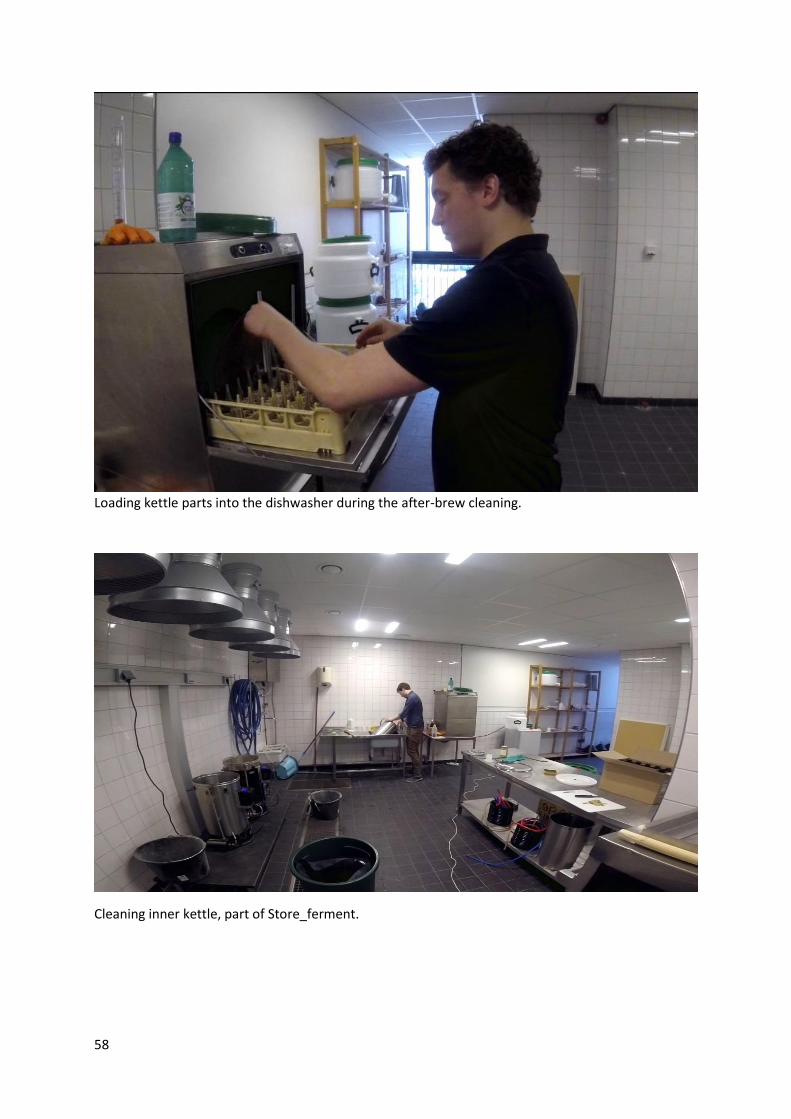
58
Loading kettle parts into the dishwasher during the after-brew cleaning.
Cleaning inner kettle, part of Store_ferment.
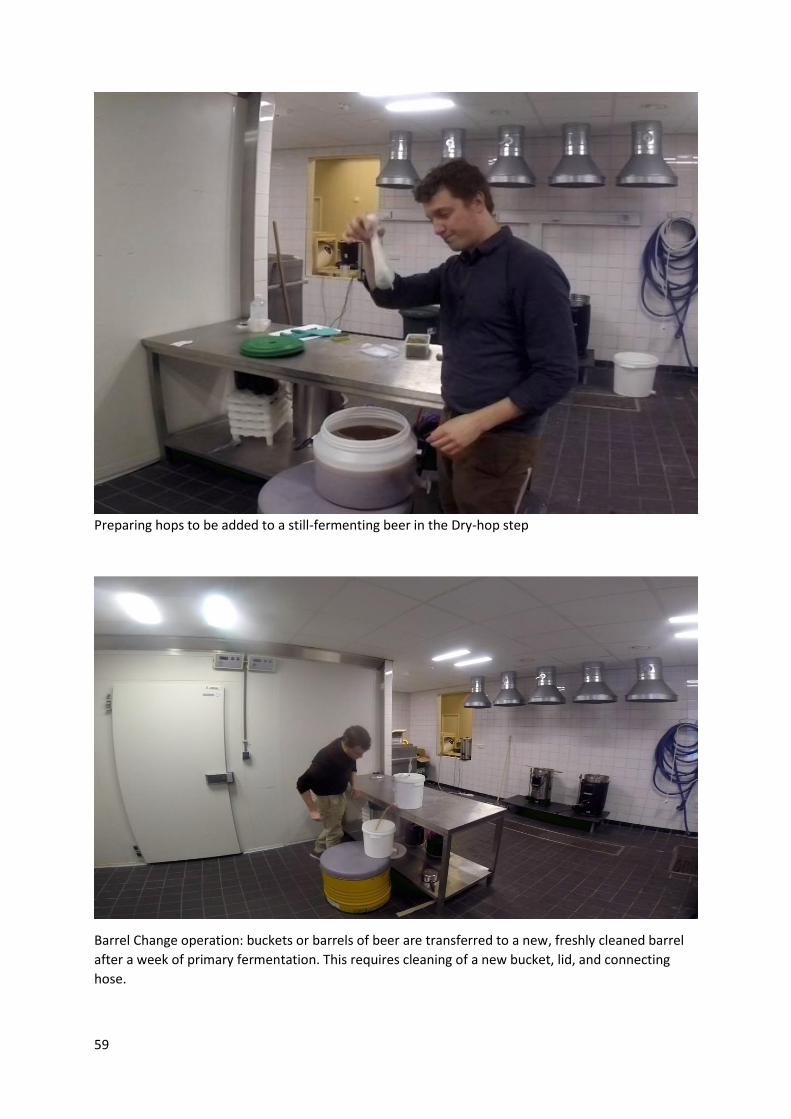
59
Preparing hops to be added to a still-fermenting beer in the Dry-hop step
Barrel Change operation: buckets or barrels of beer are transferred to a new, freshly cleaned barrel
after a week of primary fermentation. This requires cleaning of a new bucket, lid, and connecting
hose.
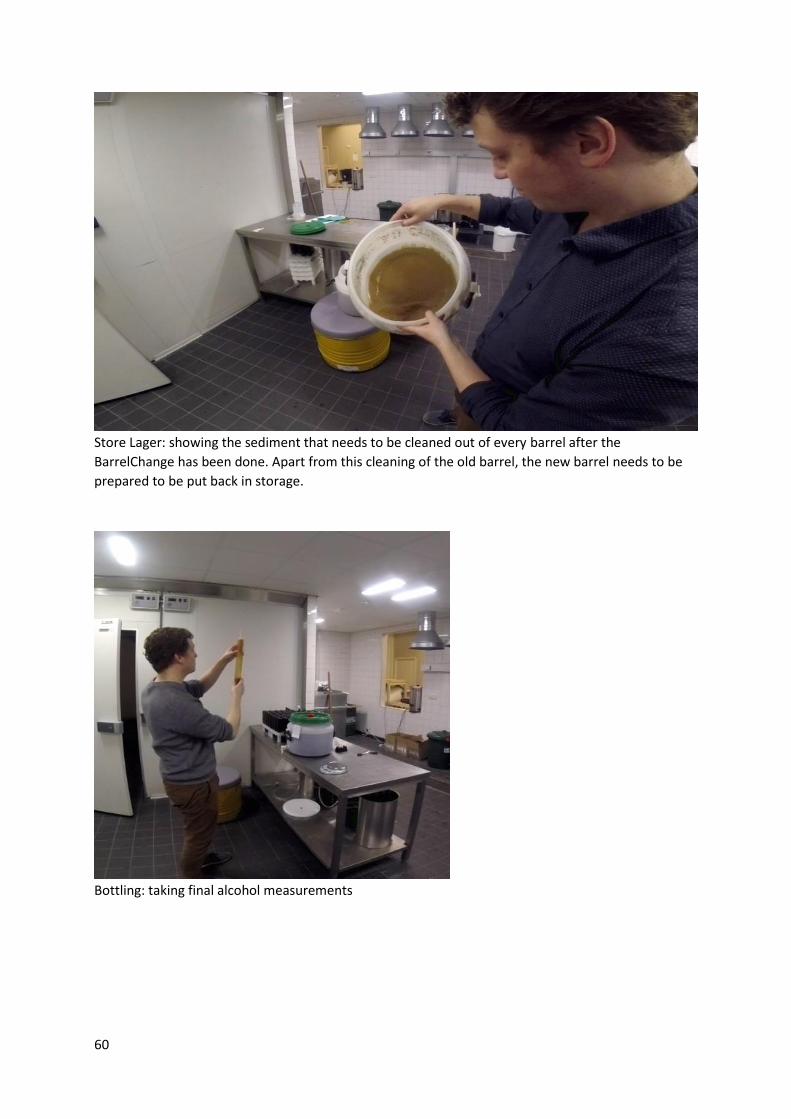
60
Store Lager: showing the sediment that needs to be cleaned out of every barrel after the
BarrelChange has been done. Apart from this cleaning of the old barrel, the new barrel needs to be
prepared to be put back in storage.
Bottling: taking final alcohol measurements
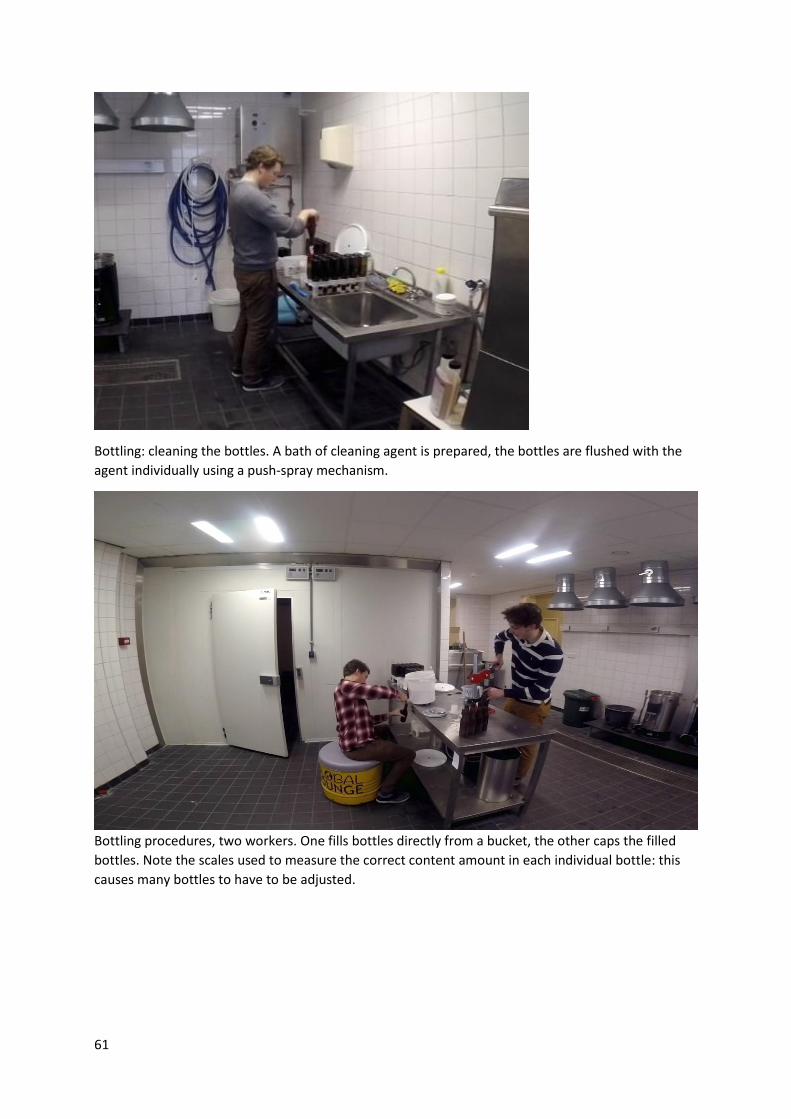
61
Bottling: cleaning the bottles. A bath of cleaning agent is prepared, the bottles are flushed with the
agent individually using a push-spray mechanism.
Bottling procedures, two workers. One fills bottles directly from a bucket, the other caps the filled
bottles. Note the scales used to measure the correct content amount in each individual bottle: this
causes many bottles to have to be adjusted.
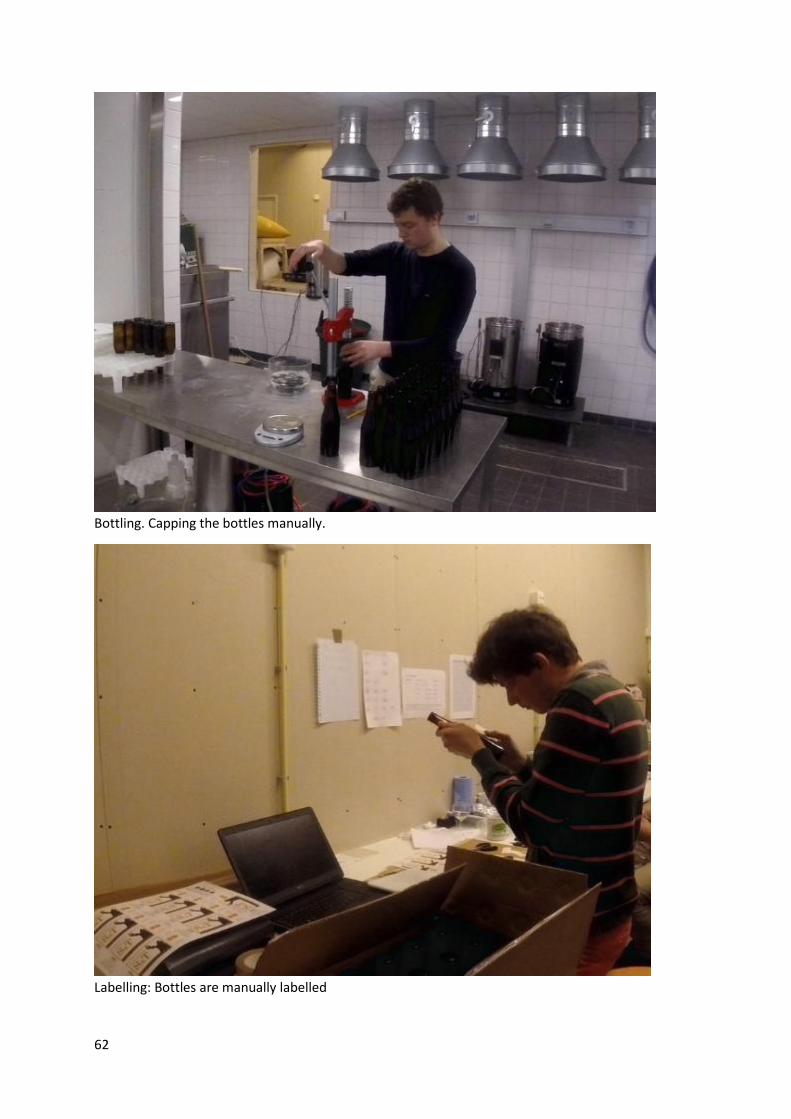
62
Bottling. Capping the bottles manually.
Labelling: Bottles are manually labelled
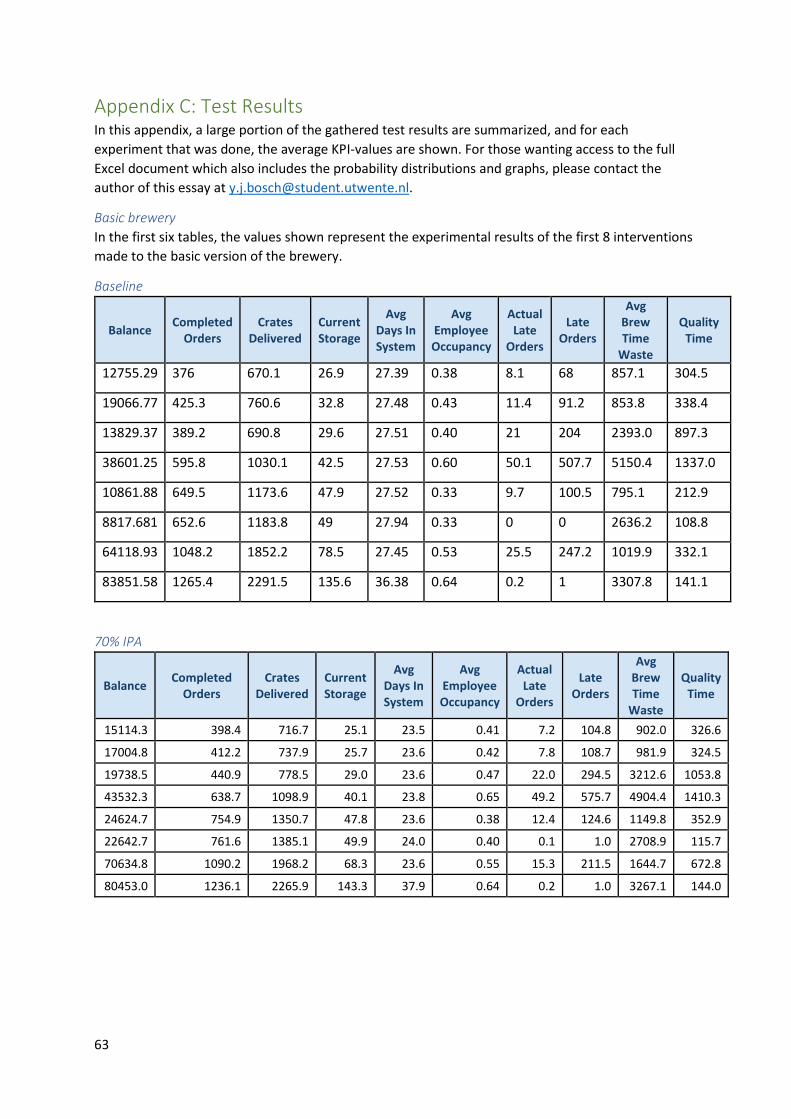
63
Appendix C: Test Results In this appendix, a large portion of the gathered test results are summarized, and for each
experiment that was done, the average KPI-values are shown. For those wanting access to the full
Excel document which also includes the probability distributions and graphs, please contact the
author of this essay at [email protected].
Basic brewery
In the first six tables, the values shown represent the experimental results of the first 8 interventions
made to the basic version of the brewery.
Baseline
Balance Completed
Orders Crates
Delivered Current Storage
Avg Days In System
Avg Employee Occupancy
Actual Late
Orders
Late Orders
Avg Brew Time
Waste
Quality Time
12755.29 376 670.1 26.9 27.39 0.38 8.1 68 857.1 304.5
19066.77 425.3 760.6 32.8 27.48 0.43 11.4 91.2 853.8 338.4
13829.37 389.2 690.8 29.6 27.51 0.40 21 204 2393.0 897.3
38601.25 595.8 1030.1 42.5 27.53 0.60 50.1 507.7 5150.4 1337.0
10861.88 649.5 1173.6 47.9 27.52 0.33 9.7 100.5 795.1 212.9
8817.681 652.6 1183.8 49 27.94 0.33 0 0 2636.2 108.8
64118.93 1048.2 1852.2 78.5 27.45 0.53 25.5 247.2 1019.9 332.1
83851.58 1265.4 2291.5 135.6 36.38 0.64 0.2 1 3307.8 141.1
70% IPA
Balance Completed
Orders Crates
Delivered Current Storage
Avg Days In System
Avg Employee Occupancy
Actual Late
Orders
Late Orders
Avg Brew Time
Waste
Quality Time
15114.3 398.4 716.7 25.1 23.5 0.41 7.2 104.8 902.0 326.6
17004.8 412.2 737.9 25.7 23.6 0.42 7.8 108.7 981.9 324.5
19738.5 440.9 778.5 29.0 23.6 0.47 22.0 294.5 3212.6 1053.8
43532.3 638.7 1098.9 40.1 23.8 0.65 49.2 575.7 4904.4 1410.3
24624.7 754.9 1350.7 47.8 23.6 0.38 12.4 124.6 1149.8 352.9
22642.7 761.6 1385.1 49.9 24.0 0.40 0.1 1.0 2708.9 115.7
70634.8 1090.2 1968.2 68.3 23.6 0.55 15.3 211.5 1644.7 672.8
80453.0 1236.1 2265.9 143.3 37.9 0.64 0.2 1.0 3267.1 144.0
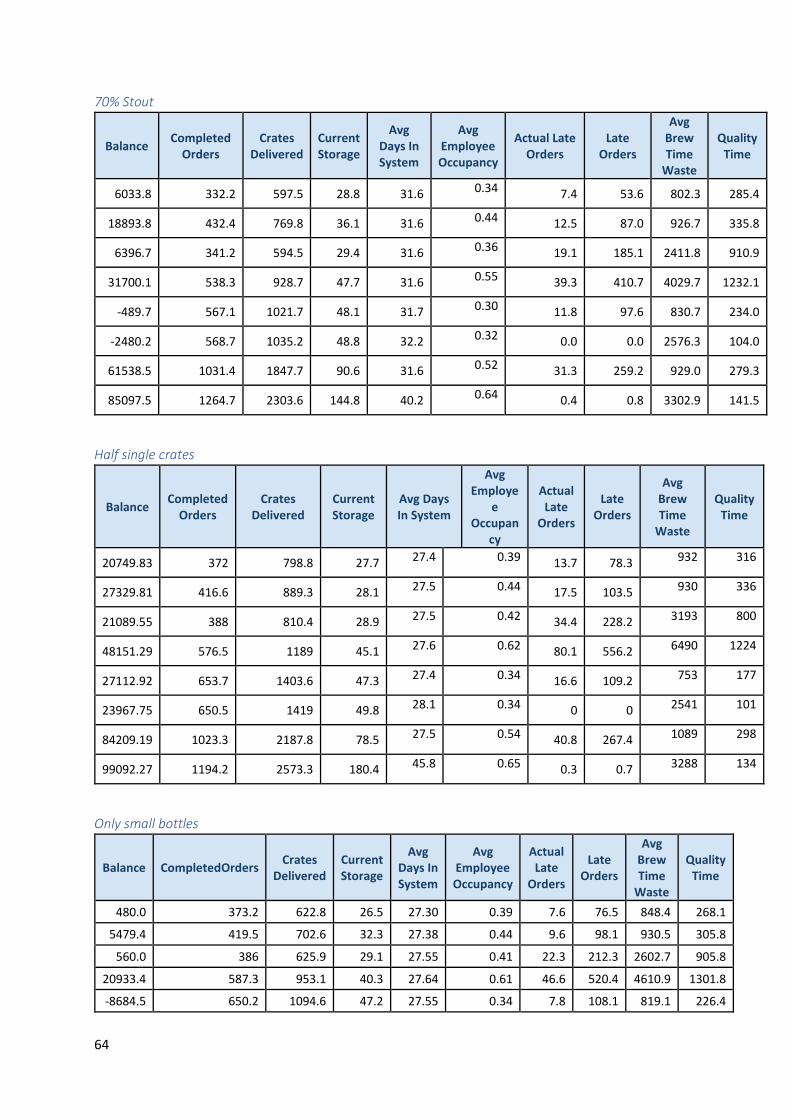
64
70% Stout
Balance Completed
Orders Crates
Delivered Current Storage
Avg Days In System
Avg Employee Occupancy
Actual Late Orders
Late Orders
Avg Brew Time
Waste
Quality Time
6033.8 332.2 597.5 28.8 31.6 0.34 7.4 53.6 802.3 285.4
18893.8 432.4 769.8 36.1 31.6 0.44 12.5 87.0 926.7 335.8
6396.7 341.2 594.5 29.4 31.6 0.36 19.1 185.1 2411.8 910.9
31700.1 538.3 928.7 47.7 31.6 0.55 39.3 410.7 4029.7 1232.1
-489.7 567.1 1021.7 48.1 31.7 0.30 11.8 97.6 830.7 234.0
-2480.2 568.7 1035.2 48.8 32.2 0.32 0.0 0.0 2576.3 104.0
61538.5 1031.4 1847.7 90.6 31.6 0.52 31.3 259.2 929.0 279.3
85097.5 1264.7 2303.6 144.8 40.2 0.64 0.4 0.8 3302.9 141.5
Half single crates
Balance Completed
Orders Crates
Delivered Current Storage
Avg Days In System
Avg Employe
e Occupan
cy
Actual Late
Orders
Late Orders
Avg Brew Time
Waste
Quality Time
20749.83 372 798.8 27.7 27.4 0.39 13.7 78.3 932 316
27329.81 416.6 889.3 28.1 27.5 0.44 17.5 103.5 930 336
21089.55 388 810.4 28.9 27.5 0.42 34.4 228.2 3193 800
48151.29 576.5 1189 45.1 27.6 0.62 80.1 556.2 6490 1224
27112.92 653.7 1403.6 47.3 27.4 0.34 16.6 109.2 753 177
23967.75 650.5 1419 49.8 28.1 0.34 0 0 2541 101
84209.19 1023.3 2187.8 78.5 27.5 0.54 40.8 267.4 1089 298
99092.27 1194.2 2573.3 180.4 45.8 0.65 0.3 0.7 3288 134
Only small bottles
Balance CompletedOrders Crates
Delivered Current Storage
Avg Days In System
Avg Employee Occupancy
Actual Late
Orders
Late Orders
Avg Brew Time
Waste
Quality Time
480.0 373.2 622.8 26.5 27.30 0.39 7.6 76.5 848.4 268.1
5479.4 419.5 702.6 32.3 27.38 0.44 9.6 98.1 930.5 305.8
560.0 386 625.9 29.1 27.55 0.41 22.3 212.3 2602.7 905.8
20933.4 587.3 953.1 40.3 27.64 0.61 46.6 520.4 4610.9 1301.8
-8684.5 650.2 1094.6 47.2 27.55 0.34 7.8 108.1 819.1 226.4
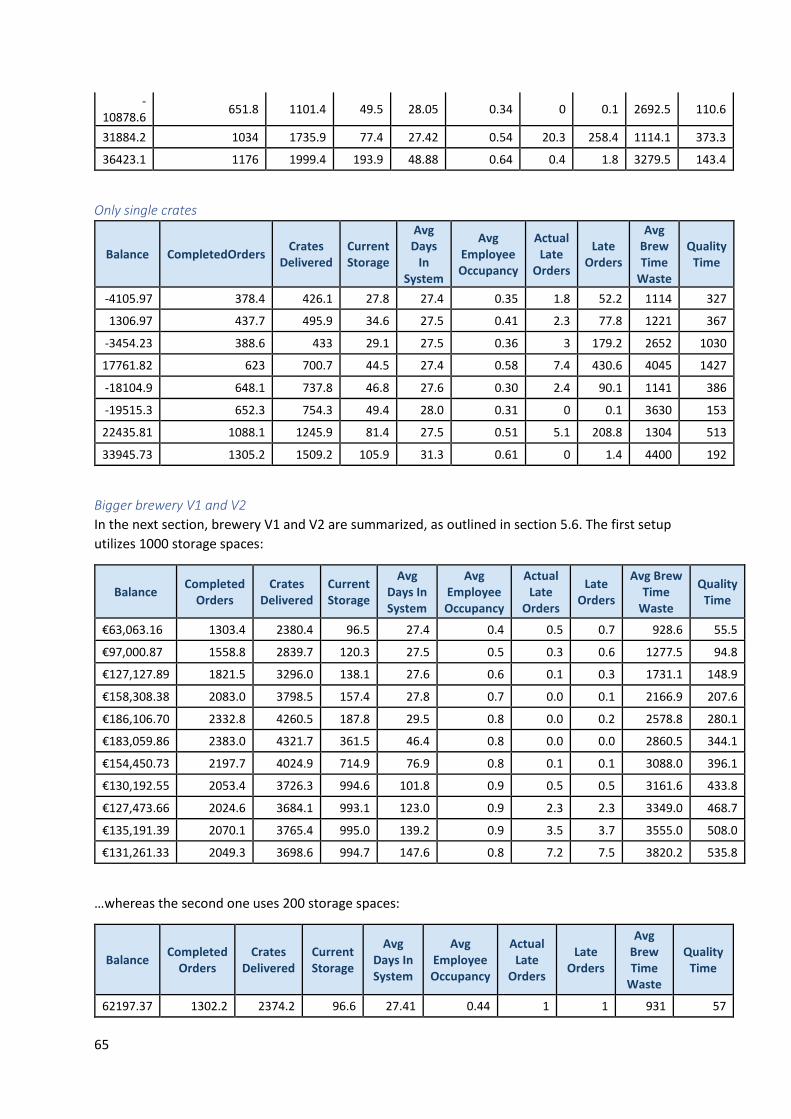
65
-10878.6
651.8 1101.4 49.5 28.05 0.34 0 0.1 2692.5 110.6
31884.2 1034 1735.9 77.4 27.42 0.54 20.3 258.4 1114.1 373.3
36423.1 1176 1999.4 193.9 48.88 0.64 0.4 1.8 3279.5 143.4
Only single crates
Balance CompletedOrders Crates
Delivered Current Storage
Avg Days
In System
Avg Employee Occupancy
Actual Late
Orders
Late Orders
Avg Brew Time
Waste
Quality Time
-4105.97 378.4 426.1 27.8 27.4 0.35 1.8 52.2 1114 327
1306.97 437.7 495.9 34.6 27.5 0.41 2.3 77.8 1221 367
-3454.23 388.6 433 29.1 27.5 0.36 3 179.2 2652 1030
17761.82 623 700.7 44.5 27.4 0.58 7.4 430.6 4045 1427
-18104.9 648.1 737.8 46.8 27.6 0.30 2.4 90.1 1141 386
-19515.3 652.3 754.3 49.4 28.0 0.31 0 0.1 3630 153
22435.81 1088.1 1245.9 81.4 27.5 0.51 5.1 208.8 1304 513
33945.73 1305.2 1509.2 105.9 31.3 0.61 0 1.4 4400 192
Bigger brewery V1 and V2
In the next section, brewery V1 and V2 are summarized, as outlined in section 5.6. The first setup
utilizes 1000 storage spaces:
Balance Completed
Orders Crates
Delivered Current Storage
Avg Days In System
Avg Employee Occupancy
Actual Late
Orders
Late Orders
Avg Brew Time
Waste
Quality Time
€63,063.16 1303.4 2380.4 96.5 27.4 0.4 0.5 0.7 928.6 55.5
€97,000.87 1558.8 2839.7 120.3 27.5 0.5 0.3 0.6 1277.5 94.8
€127,127.89 1821.5 3296.0 138.1 27.6 0.6 0.1 0.3 1731.1 148.9
€158,308.38 2083.0 3798.5 157.4 27.8 0.7 0.0 0.1 2166.9 207.6
€186,106.70 2332.8 4260.5 187.8 29.5 0.8 0.0 0.2 2578.8 280.1
€183,059.86 2383.0 4321.7 361.5 46.4 0.8 0.0 0.0 2860.5 344.1
€154,450.73 2197.7 4024.9 714.9 76.9 0.8 0.1 0.1 3088.0 396.1
€130,192.55 2053.4 3726.3 994.6 101.8 0.9 0.5 0.5 3161.6 433.8
€127,473.66 2024.6 3684.1 993.1 123.0 0.9 2.3 2.3 3349.0 468.7
€135,191.39 2070.1 3765.4 995.0 139.2 0.9 3.5 3.7 3555.0 508.0
€131,261.33 2049.3 3698.6 994.7 147.6 0.8 7.2 7.5 3820.2 535.8
…whereas the second one uses 200 storage spaces:
Balance Completed
Orders Crates
Delivered Current Storage
Avg Days In System
Avg Employee Occupancy
Actual Late
Orders
Late Orders
Avg Brew Time
Waste
Quality Time
62197.37 1302.2 2374.2 96.6 27.41 0.44 1 1 931 57
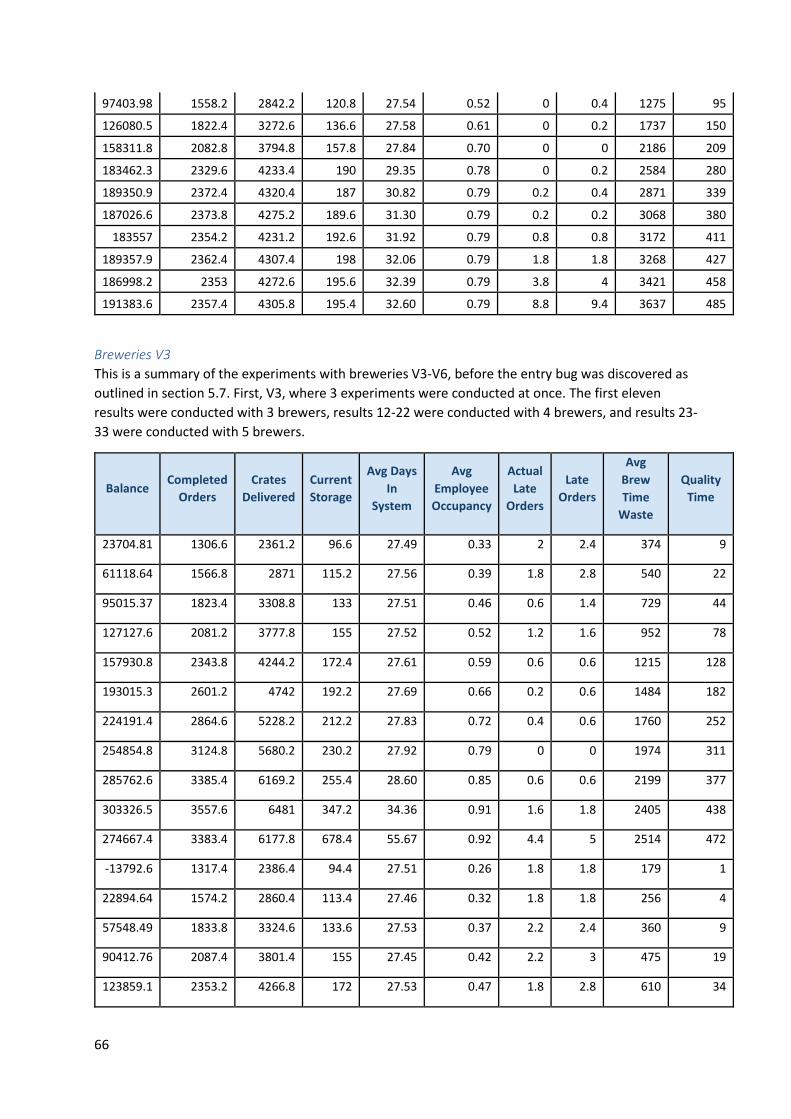
66
97403.98 1558.2 2842.2 120.8 27.54 0.52 0 0.4 1275 95
126080.5 1822.4 3272.6 136.6 27.58 0.61 0 0.2 1737 150
158311.8 2082.8 3794.8 157.8 27.84 0.70 0 0 2186 209
183462.3 2329.6 4233.4 190 29.35 0.78 0 0.2 2584 280
189350.9 2372.4 4320.4 187 30.82 0.79 0.2 0.4 2871 339
187026.6 2373.8 4275.2 189.6 31.30 0.79 0.2 0.2 3068 380
183557 2354.2 4231.2 192.6 31.92 0.79 0.8 0.8 3172 411
189357.9 2362.4 4307.4 198 32.06 0.79 1.8 1.8 3268 427
186998.2 2353 4272.6 195.6 32.39 0.79 3.8 4 3421 458
191383.6 2357.4 4305.8 195.4 32.60 0.79 8.8 9.4 3637 485
Breweries V3
This is a summary of the experiments with breweries V3-V6, before the entry bug was discovered as
outlined in section 5.7. First, V3, where 3 experiments were conducted at once. The first eleven
results were conducted with 3 brewers, results 12-22 were conducted with 4 brewers, and results 23-
33 were conducted with 5 brewers.
Balance Completed
Orders
Crates
Delivered
Current
Storage
Avg Days
In
System
Avg
Employee
Occupancy
Actual
Late
Orders
Late
Orders
Avg
Brew
Time
Waste
Quality
Time
23704.81 1306.6 2361.2 96.6 27.49 0.33 2 2.4 374 9
61118.64 1566.8 2871 115.2 27.56 0.39 1.8 2.8 540 22
95015.37 1823.4 3308.8 133 27.51 0.46 0.6 1.4 729 44
127127.6 2081.2 3777.8 155 27.52 0.52 1.2 1.6 952 78
157930.8 2343.8 4244.2 172.4 27.61 0.59 0.6 0.6 1215 128
193015.3 2601.2 4742 192.2 27.69 0.66 0.2 0.6 1484 182
224191.4 2864.6 5228.2 212.2 27.83 0.72 0.4 0.6 1760 252
254854.8 3124.8 5680.2 230.2 27.92 0.79 0 0 1974 311
285762.6 3385.4 6169.2 255.4 28.60 0.85 0.6 0.6 2199 377
303326.5 3557.6 6481 347.2 34.36 0.91 1.6 1.8 2405 438
274667.4 3383.4 6177.8 678.4 55.67 0.92 4.4 5 2514 472
-13792.6 1317.4 2386.4 94.4 27.51 0.26 1.8 1.8 179 1
22894.64 1574.2 2860.4 113.4 27.46 0.32 1.8 1.8 256 4
57548.49 1833.8 3324.6 133.6 27.53 0.37 2.2 2.4 360 9
90412.76 2087.4 3801.4 155 27.45 0.42 2.2 3 475 19
123859.1 2353.2 4266.8 172 27.53 0.47 1.8 2.8 610 34
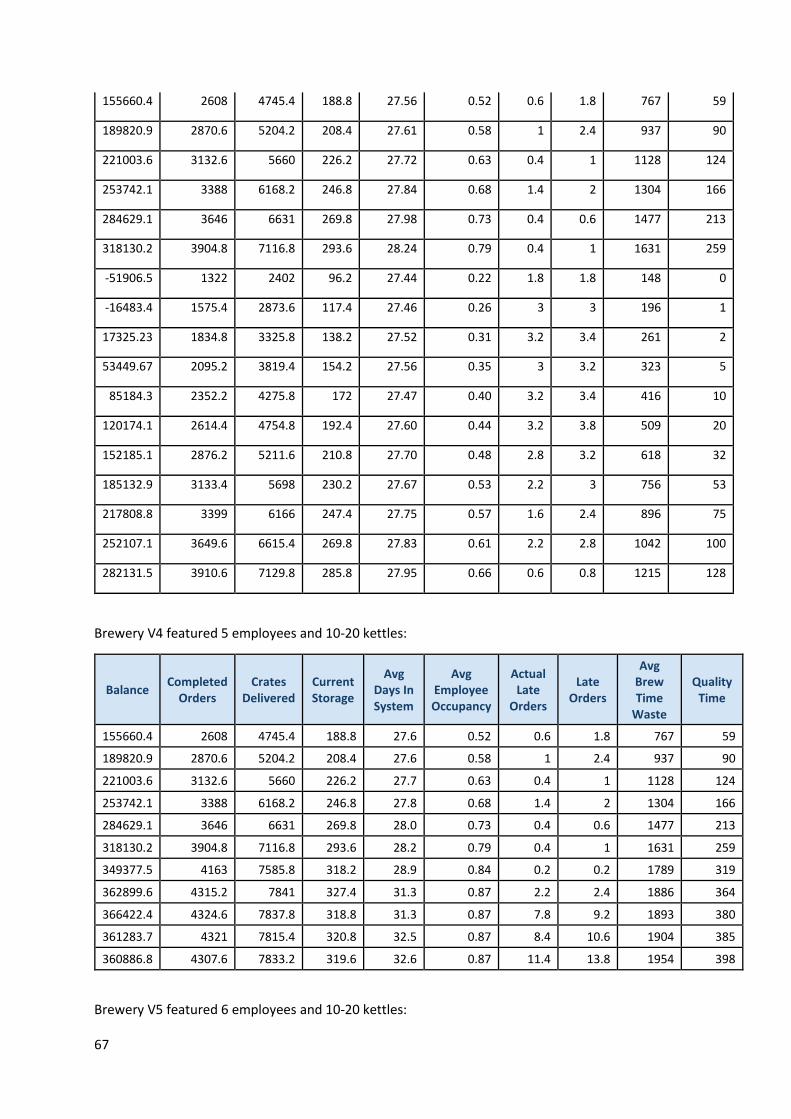
67
155660.4 2608 4745.4 188.8 27.56 0.52 0.6 1.8 767 59
189820.9 2870.6 5204.2 208.4 27.61 0.58 1 2.4 937 90
221003.6 3132.6 5660 226.2 27.72 0.63 0.4 1 1128 124
253742.1 3388 6168.2 246.8 27.84 0.68 1.4 2 1304 166
284629.1 3646 6631 269.8 27.98 0.73 0.4 0.6 1477 213
318130.2 3904.8 7116.8 293.6 28.24 0.79 0.4 1 1631 259
-51906.5 1322 2402 96.2 27.44 0.22 1.8 1.8 148 0
-16483.4 1575.4 2873.6 117.4 27.46 0.26 3 3 196 1
17325.23 1834.8 3325.8 138.2 27.52 0.31 3.2 3.4 261 2
53449.67 2095.2 3819.4 154.2 27.56 0.35 3 3.2 323 5
85184.3 2352.2 4275.8 172 27.47 0.40 3.2 3.4 416 10
120174.1 2614.4 4754.8 192.4 27.60 0.44 3.2 3.8 509 20
152185.1 2876.2 5211.6 210.8 27.70 0.48 2.8 3.2 618 32
185132.9 3133.4 5698 230.2 27.67 0.53 2.2 3 756 53
217808.8 3399 6166 247.4 27.75 0.57 1.6 2.4 896 75
252107.1 3649.6 6615.4 269.8 27.83 0.61 2.2 2.8 1042 100
282131.5 3910.6 7129.8 285.8 27.95 0.66 0.6 0.8 1215 128
Brewery V4 featured 5 employees and 10-20 kettles:
Balance Completed
Orders Crates
Delivered Current Storage
Avg Days In System
Avg Employee Occupancy
Actual Late
Orders
Late Orders
Avg Brew Time
Waste
Quality Time
155660.4 2608 4745.4 188.8 27.6 0.52 0.6 1.8 767 59
189820.9 2870.6 5204.2 208.4 27.6 0.58 1 2.4 937 90
221003.6 3132.6 5660 226.2 27.7 0.63 0.4 1 1128 124
253742.1 3388 6168.2 246.8 27.8 0.68 1.4 2 1304 166
284629.1 3646 6631 269.8 28.0 0.73 0.4 0.6 1477 213
318130.2 3904.8 7116.8 293.6 28.2 0.79 0.4 1 1631 259
349377.5 4163 7585.8 318.2 28.9 0.84 0.2 0.2 1789 319
362899.6 4315.2 7841 327.4 31.3 0.87 2.2 2.4 1886 364
366422.4 4324.6 7837.8 318.8 31.3 0.87 7.8 9.2 1893 380
361283.7 4321 7815.4 320.8 32.5 0.87 8.4 10.6 1904 385
360886.8 4307.6 7833.2 319.6 32.6 0.87 11.4 13.8 1954 398
Brewery V5 featured 6 employees and 10-20 kettles:
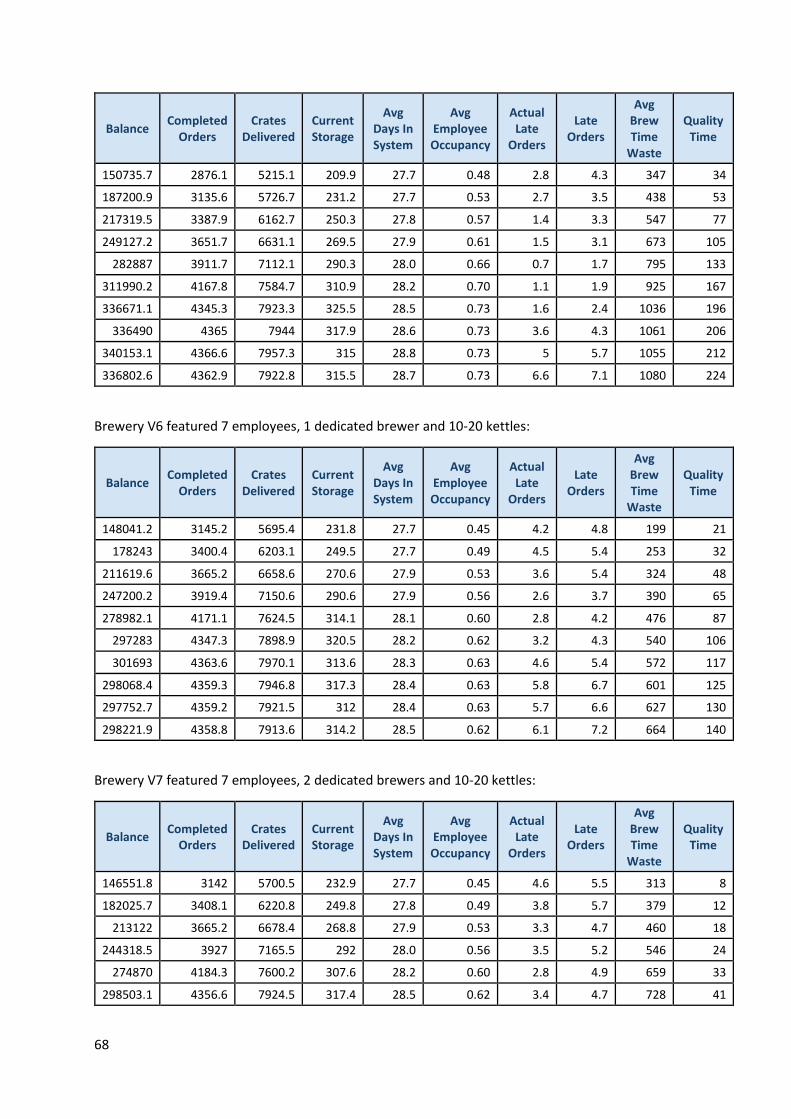
68
Balance Completed
Orders Crates
Delivered Current Storage
Avg Days In System
Avg Employee Occupancy
Actual Late
Orders
Late Orders
Avg Brew Time
Waste
Quality Time
150735.7 2876.1 5215.1 209.9 27.7 0.48 2.8 4.3 347 34
187200.9 3135.6 5726.7 231.2 27.7 0.53 2.7 3.5 438 53
217319.5 3387.9 6162.7 250.3 27.8 0.57 1.4 3.3 547 77
249127.2 3651.7 6631.1 269.5 27.9 0.61 1.5 3.1 673 105
282887 3911.7 7112.1 290.3 28.0 0.66 0.7 1.7 795 133
311990.2 4167.8 7584.7 310.9 28.2 0.70 1.1 1.9 925 167
336671.1 4345.3 7923.3 325.5 28.5 0.73 1.6 2.4 1036 196
336490 4365 7944 317.9 28.6 0.73 3.6 4.3 1061 206
340153.1 4366.6 7957.3 315 28.8 0.73 5 5.7 1055 212
336802.6 4362.9 7922.8 315.5 28.7 0.73 6.6 7.1 1080 224
Brewery V6 featured 7 employees, 1 dedicated brewer and 10-20 kettles:
Balance Completed
Orders Crates
Delivered Current Storage
Avg Days In System
Avg Employee Occupancy
Actual Late
Orders
Late Orders
Avg Brew Time
Waste
Quality Time
148041.2 3145.2 5695.4 231.8 27.7 0.45 4.2 4.8 199 21
178243 3400.4 6203.1 249.5 27.7 0.49 4.5 5.4 253 32
211619.6 3665.2 6658.6 270.6 27.9 0.53 3.6 5.4 324 48
247200.2 3919.4 7150.6 290.6 27.9 0.56 2.6 3.7 390 65
278982.1 4171.1 7624.5 314.1 28.1 0.60 2.8 4.2 476 87
297283 4347.3 7898.9 320.5 28.2 0.62 3.2 4.3 540 106
301693 4363.6 7970.1 313.6 28.3 0.63 4.6 5.4 572 117
298068.4 4359.3 7946.8 317.3 28.4 0.63 5.8 6.7 601 125
297752.7 4359.2 7921.5 312 28.4 0.63 5.7 6.6 627 130
298221.9 4358.8 7913.6 314.2 28.5 0.62 6.1 7.2 664 140
Brewery V7 featured 7 employees, 2 dedicated brewers and 10-20 kettles:
Balance Completed
Orders Crates
Delivered Current Storage
Avg Days In System
Avg Employee Occupancy
Actual Late
Orders
Late Orders
Avg Brew Time
Waste
Quality Time
146551.8 3142 5700.5 232.9 27.7 0.45 4.6 5.5 313 8
182025.7 3408.1 6220.8 249.8 27.8 0.49 3.8 5.7 379 12
213122 3665.2 6678.4 268.8 27.9 0.53 3.3 4.7 460 18
244318.5 3927 7165.5 292 28.0 0.56 3.5 5.2 546 24
274870 4184.3 7600.2 307.6 28.2 0.60 2.8 4.9 659 33
298503.1 4356.6 7924.5 317.4 28.5 0.62 3.4 4.7 728 41
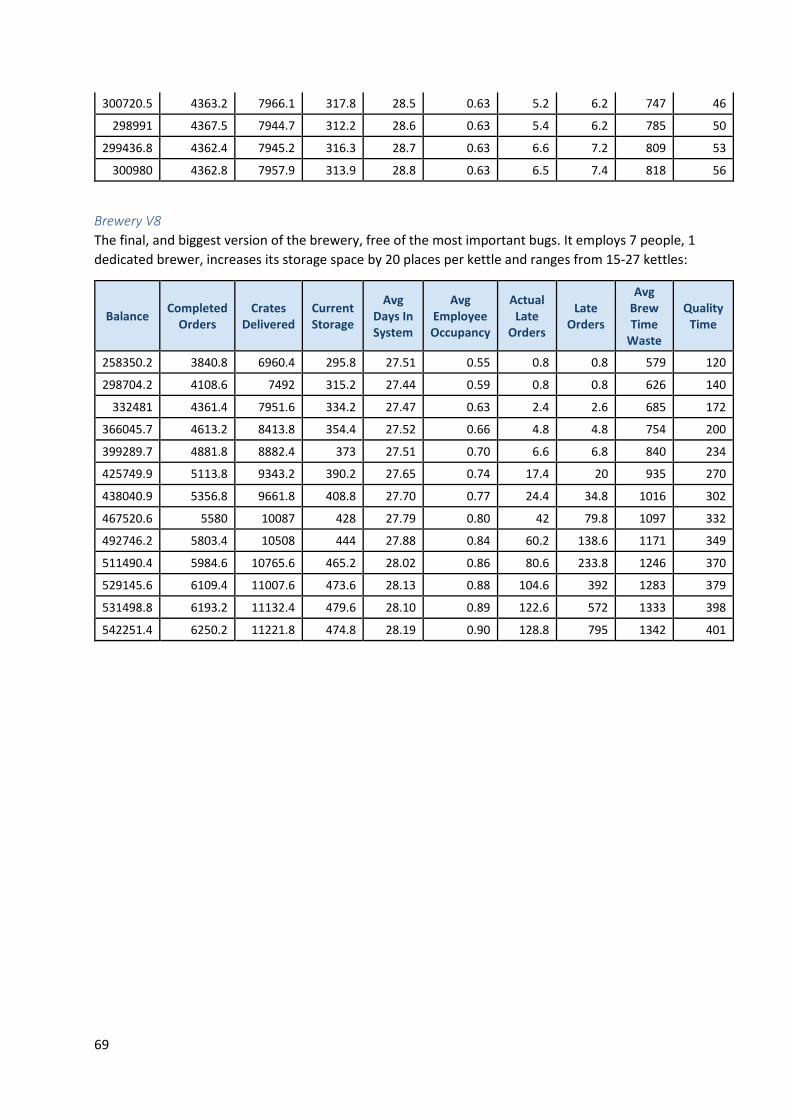
69
300720.5 4363.2 7966.1 317.8 28.5 0.63 5.2 6.2 747 46
298991 4367.5 7944.7 312.2 28.6 0.63 5.4 6.2 785 50
299436.8 4362.4 7945.2 316.3 28.7 0.63 6.6 7.2 809 53
300980 4362.8 7957.9 313.9 28.8 0.63 6.5 7.4 818 56
Brewery V8
The final, and biggest version of the brewery, free of the most important bugs. It employs 7 people, 1
dedicated brewer, increases its storage space by 20 places per kettle and ranges from 15-27 kettles:
Balance Completed
Orders Crates
Delivered Current Storage
Avg Days In System
Avg Employee Occupancy
Actual Late
Orders
Late Orders
Avg Brew Time
Waste
Quality Time
258350.2 3840.8 6960.4 295.8 27.51 0.55 0.8 0.8 579 120
298704.2 4108.6 7492 315.2 27.44 0.59 0.8 0.8 626 140
332481 4361.4 7951.6 334.2 27.47 0.63 2.4 2.6 685 172
366045.7 4613.2 8413.8 354.4 27.52 0.66 4.8 4.8 754 200
399289.7 4881.8 8882.4 373 27.51 0.70 6.6 6.8 840 234
425749.9 5113.8 9343.2 390.2 27.65 0.74 17.4 20 935 270
438040.9 5356.8 9661.8 408.8 27.70 0.77 24.4 34.8 1016 302
467520.6 5580 10087 428 27.79 0.80 42 79.8 1097 332
492746.2 5803.4 10508 444 27.88 0.84 60.2 138.6 1171 349
511490.4 5984.6 10765.6 465.2 28.02 0.86 80.6 233.8 1246 370
529145.6 6109.4 11007.6 473.6 28.13 0.88 104.6 392 1283 379
531498.8 6193.2 11132.4 479.6 28.10 0.89 122.6 572 1333 398
542251.4 6250.2 11221.8 474.8 28.19 0.90 128.8 795 1342 401
70
References Achkar, V., Picech, L., & Méndez, C. (2015). Modeling, simulation and optimization of logistics
management of a cans packaging line. Santa Fe, Argentina: European Modeling and
Simulation Symposium.
Bangsow, S. (2013). Production planning and resource scheduling of a brewery with plant simulation.
In D. Monroy, & C. Vallejo, Use Cases of Discrete Event Simulation: Appliance and Research
(pp. 321-330). Quindío, Colombia: Springer, Berlin.
Bondi, A. B. ( 2000). Characteristics of scalability and their impact on performance. . Proceedings of
the second international workshop on Software and performance, 195-203 .
Brown, J. D. (2000). What is construct validity? Retrieved from Shiken, statistics corner newsletter:
http://hosted.jalt.org/test/bro_8.htm
Chung, S.-L., & Lai, Y.-H. (2008). Process Control of Brewery Plants. Journal of the Chinese Institute of
Engineers, vol 31, 27-140.
Cooper, D. R. (2014). Observation Studies. In D. R. Cooper, Business Research Methods, 12th edition
(pp. 170-187). New York, USA: McGraw-Hill/Irwin.
Haspels, E. K. (2010, Februari). Collection, the starting point:. Retrieved from University of Twente
thesis database: https://essay.utwente.nl/60696/1/MSc_Eljo_Haspels.pdf
Hubert, S., Baur, F., Delgado, A., Helmers, T., & Rabiger, N. (2016). Simulation modeling of bottling
line water demand levels using reference nets and stochastic models. Erlangen, Germany:
Winter Simulation Conference.
Hubert, S., Helmers, T., Groβ, F., & Delgado, A. (2016). Data driven stochastic modelling and
simulation of cooling demand within breweries. Journal of food engineering.
Jahangirian, M., Eldabi, T., Naseer, A., Stergioulas, L. K., & Young, T. (2010). Simulation in
manufacturing and business: A review. European Journal of Operational Research, 1-13.
Retrieved from https://ac.els-cdn.com/S0377221709004263/1-s2.0-S0377221709004263-
main.pdf?_tid=3d088786-a184-47db-8ed2-
abb80de2161c&acdnat=1544046963_9b6c48bdc9d64c445234799d64772fc1
Janssen, G. (2012, August 23). Towards Control of Capacity at the Spare Parts Production of Nefit.
Retrieved from University of Twente thesis database:
https://essay.utwente.nl/62085/1/Master_thesis_report_Guus_Janssen.pdf
Maarleveld, P. (2015, November 5). Structured production planning and control using a push-pull
hybrid approach. Retrieved from University of Twente thesis database:
https://essay.utwente.nl/68794/9/Maarleveld_MA_MBS_PUBLIC.pdf
Merrienboer, I. v. (2016, April). Reducing production lead time at Zodiac Galleys Europe. Retrieved
from University of Twente Thesis database:
https://essay.utwente.nl/69480/1/Merrienboer_MA_Behavioural%2C%20Management%20a
nd%20Social%20Sciences.pdf
Mousavi, A. (2017). Automatic translation of plant data into management performance metrics: a
case for real-time and predictive production control. International Journal of Production
Research.
71
Muster‐Slawitsch, B., Brunner, C., & Fluch, J. (2014). Application of an advanced pinch methodology
for the food and drink production. Gleisdorf: Wires Energy and Environment.
Muster-Slawitsch, B., Hubmann, M., Murkovic, M., & Brunner, C. (2014). Process modelling and
technology evaluation in brewing. Gleisdorf, Austria: Chemical Engineering and Processing:
Process Intensification.
Pettigrew, L., Blomenhofer, V., Hubert, S., Groß, F., & Delgado, A. (2015). Optimisation of water
usage in a brewery clean-in-place system using reference nets. Erlangen, Germany: Journal of
Cleaner Production.
Rodman, A., & Gerogiorgis, D. (2016). Multi-objective process optimisation of beer fermentation via
dynamic simulation. Edinburgh, UK: Institute for Materials and Processes (IMP), School of
Engineering, University of Edinburgh.
Swinnen, J. (2018). Economic Perspectives on Craft Beer: A Revolution in the Global Beer Industry.
Cham, Switserland: Palgrave MacMillan.
Related Documents