Energy and Buildings 66 (2013) 373–383 Contents lists available at ScienceDirect Energy and Buildings j ourna l ho me page: www.elsevier.com/locate/enbuild Multi-criteria heatwave vulnerability assessment of residential wall systems Jun Han ∗ , Dong Chen, Xiaoming Wang CSIRO Climate Adaptation Flagship and CSIRO Ecosystem Sciences, Commonwealth Scientific and Industrial Research Organisation (CSIRO), Highett, Victoria 3190, Australia a r t i c l e i n f o Article history: Received 17 March 2013 Received in revised form 3 June 2013 Accepted 7 July 2013 Keywords: Heatwave Adaptation Thermal performance Overheating Cooling load Dynamic building simulation model Finite difference approach a b s t r a c t It is generally accepted that building external wall design affects its ability to protect occupants from weather extremes, such as heatwaves. However, there is no established methodology to assess this abil- ity in assisting building designers to identify the most resilient design. This study aims at developing an analytical tool to examine wall heatwave vulnerability using dynamic thermal modelling and multi- criteria analysis. Optimum wall design for Melbourne was identified among eight selected residential walls based on various criteria, i.e. maximum air temperature (MAT), maximum air temperature differ- ence (MATD), thermal discomfort proportion (TDP), statistical maximum air temperature (SMAT), and averaged night-time temperature (ANT). Using these criteria wall designs were ranked and ranking devi- ations among the criteria were analysed. Results showed that uninsulated brick veneer wall is the most vulnerable design, experiencing a maximum daytime room temperature of 31 ◦ C and proportion in dis- comfort of 31.5% during heatwaves. While insulated cavity brick wall is found to be the most resilient design in most cases. The results indicate that using insulated cavity brick wall in Melbourne would signif- icantly reduce summer overheating and thermal discomfort in non-air conditioned buildings in daytime period. It was found that no one criterion should be used for evaluating both daytime and night-time wall performance as ranking would be different between daytime and night-time periods. The decision procedure for design of a residential wall system may need to be reconsidered using the multi-criteria analysis, particularly under global warming. © 2013 Elsevier B.V. All rights reserved. 1. Introduction In the past decade, the number of extreme heatwaves has been on the rise globally, for example, the Shanghai in 2003 [1], the Euro- pean in 2003 [2], the Greece in 2007 [3], the southern Australia in 2009 [4], and the U.S. in 2012 [5]. According to World Bank report 2012 [6], the global climate is warming, and its average tempera- ture is anticipated to rise by 4 ◦ C by the end of this century, without effective interventions. Such increases in the future climate are likely to lead to more frequent and longer heatwaves [7,8]. An intensifying heatwave event can have a significant social and economic impact on communities, especially on public health [9–11]. Public health problems, heat-related illness and deaths for example, might increase as a result of changing climate and increasing temperature. Research found that if outdoor ambient temperature increases beyond a particular threshold, so do mor- tality/morbidity rates [12]. ∗ Corresponding author. Tel.: +61 3 92526462; fax: +61 3 92526249. E-mail addresses: [email protected], [email protected] (J. Han). As the main shelter of human beings, buildings play a vital role in protecting occupants from extreme environment and should be designed to cope with the warming climate and likely heat- wave impacts. In this regard, we are now facing the challenges not only in designing low energy buildings to reduce greenhouse gas emissions for mitigating global warming, but also in maintain- ing required thermal comfort under changing climate, in particular, during extreme climate event. Current building codes, such as the Australian National Construction Code [13], set the criteria for reg- ulating the energy efficiency of residential buildings. However, they consider little about the ability of current wall structures to buffer against extreme weather events and corresponding thermal stress to which occupants are exposed. Consequently, in recent years, there is a growing interest in investigating the impact of climate change, possible adaptation and mitigation measures to reduce overheating risks. Various mitiga- tion strategies were proposed and assessed, such as use of controls for blinds to reduce solar heat gain [14], natural ventilation [15–17], better construction material [18] and energy efficient building envelope [19], upgrading office IT equipment and light [20], double glazing [21]. The selection of building construction materials is one of the most important factors in designing a low energy and better 0378-7788/$ – see front matter © 2013 Elsevier B.V. All rights reserved. http://dx.doi.org/10.1016/j.enbuild.2013.07.015

Welcome message from author
This document is posted to help you gain knowledge. Please leave a comment to let me know what you think about it! Share it to your friends and learn new things together.
Transcript
Mw
JCV
a
ARRA
KHATOCDF
1
op22tel
a[fitt
0h
Energy and Buildings 66 (2013) 373–383
Contents lists available at ScienceDirect
Energy and Buildings
j ourna l ho me page: www.elsev ier .com/ locate /enbui ld
ulti-criteria heatwave vulnerability assessment of residentialall systems
un Han ∗, Dong Chen, Xiaoming WangSIRO Climate Adaptation Flagship and CSIRO Ecosystem Sciences, Commonwealth Scientific and Industrial Research Organisation (CSIRO), Highett,ictoria 3190, Australia
r t i c l e i n f o
rticle history:eceived 17 March 2013eceived in revised form 3 June 2013ccepted 7 July 2013
eywords:eatwavedaptationhermal performanceverheatingooling loadynamic building simulation model
a b s t r a c t
It is generally accepted that building external wall design affects its ability to protect occupants fromweather extremes, such as heatwaves. However, there is no established methodology to assess this abil-ity in assisting building designers to identify the most resilient design. This study aims at developingan analytical tool to examine wall heatwave vulnerability using dynamic thermal modelling and multi-criteria analysis. Optimum wall design for Melbourne was identified among eight selected residentialwalls based on various criteria, i.e. maximum air temperature (MAT), maximum air temperature differ-ence (MATD), thermal discomfort proportion (TDP), statistical maximum air temperature (SMAT), andaveraged night-time temperature (ANT). Using these criteria wall designs were ranked and ranking devi-ations among the criteria were analysed. Results showed that uninsulated brick veneer wall is the mostvulnerable design, experiencing a maximum daytime room temperature of 31 ◦C and proportion in dis-comfort of 31.5% during heatwaves. While insulated cavity brick wall is found to be the most resilient
inite difference approach design in most cases. The results indicate that using insulated cavity brick wall in Melbourne would signif-icantly reduce summer overheating and thermal discomfort in non-air conditioned buildings in daytimeperiod. It was found that no one criterion should be used for evaluating both daytime and night-timewall performance as ranking would be different between daytime and night-time periods. The decisionprocedure for design of a residential wall system may need to be reconsidered using the multi-criteriaanalysis, particularly under global warming.
. Introduction
In the past decade, the number of extreme heatwaves has beenn the rise globally, for example, the Shanghai in 2003 [1], the Euro-ean in 2003 [2], the Greece in 2007 [3], the southern Australia in009 [4], and the U.S. in 2012 [5]. According to World Bank report012 [6], the global climate is warming, and its average tempera-ure is anticipated to rise by 4 ◦C by the end of this century, withoutffective interventions. Such increases in the future climate areikely to lead to more frequent and longer heatwaves [7,8].
An intensifying heatwave event can have a significant socialnd economic impact on communities, especially on public health9–11]. Public health problems, heat-related illness and deathsor example, might increase as a result of changing climate andncreasing temperature. Research found that if outdoor ambient
emperature increases beyond a particular threshold, so do mor-ality/morbidity rates [12].∗ Corresponding author. Tel.: +61 3 92526462; fax: +61 3 92526249.E-mail addresses: [email protected], [email protected] (J. Han).
378-7788/$ – see front matter © 2013 Elsevier B.V. All rights reserved.ttp://dx.doi.org/10.1016/j.enbuild.2013.07.015
© 2013 Elsevier B.V. All rights reserved.
As the main shelter of human beings, buildings play a vital rolein protecting occupants from extreme environment and shouldbe designed to cope with the warming climate and likely heat-wave impacts. In this regard, we are now facing the challengesnot only in designing low energy buildings to reduce greenhousegas emissions for mitigating global warming, but also in maintain-ing required thermal comfort under changing climate, in particular,during extreme climate event. Current building codes, such as theAustralian National Construction Code [13], set the criteria for reg-ulating the energy efficiency of residential buildings. However, theyconsider little about the ability of current wall structures to bufferagainst extreme weather events and corresponding thermal stressto which occupants are exposed.
Consequently, in recent years, there is a growing interest ininvestigating the impact of climate change, possible adaptation andmitigation measures to reduce overheating risks. Various mitiga-tion strategies were proposed and assessed, such as use of controlsfor blinds to reduce solar heat gain [14], natural ventilation [15–17],
better construction material [18] and energy efficient buildingenvelope [19], upgrading office IT equipment and light [20], doubleglazing [21]. The selection of building construction materials is oneof the most important factors in designing a low energy and better
374 J. Han et al. / Energy and Build
Nomenclature
A area (m2)a constant (–)b constant (–)Bi Biot number (–)Cp specific heat capacity (J/kg K)Ct turbulent natural convection constant (–)Fo Fourier number (–)GT intensity of solar radiation on wall (W/m2)g acceleration of gravity (m/s2)H height of the air gap (m)h convective heat transfer coefficient (W/m2 K)h average heat transfer coefficient (W/m2 K)k thermal conductivity (W/m K)L width of the air gap (m)NuL average Nusselt number (–)n number of material or space surface (–)Pr Prandtl number (–)RaL Rayleigh number (–)SHGC solar heat gain coefficient (–)T temperature (◦C)t time (s)Uwin heat loss coefficient (W/m2 K)V volume of space (m3)V0 wind velocity (m/s)x coordinate as defined (–)
Greek symbols˛ thermal diffusivity (m2/s)
volumetric thermal expansion coefficient (K−1)� density (kg/m3)� kinematic viscosity (m2/s)ε absorptivity (–)
Subscriptsair room air or air in the gap of wallc refers to cold wallD thickness of solid walld thickness of air cavitye environmentg air gaph refers to hot walli inner surface of wallin inside or indoorj number of materialmax maximumN number of nodeo outsider roofwf wall surface and fluid in the air gap of the wallwin windoww1 left wall surface of the air gap in the cavity wall
tsavwhitm
w2 right wall surface of the air gap in the cavity wall
hermal comfort building in response to large diurnal temperaturewings [22]. Porritt et al. [23] claimed that external wall insulationnd measures to reduce solar heat gain are the most effective inter-entions to reduce overheating as a result of heatwaves. Internalall insulation seems less effective and could even increase over-
eating in some cases [24]. In addition, building form is anothermportant factor in designing a comfort building to modify or fil-er climate extremes. An integrated design of building construction
aterial and building form as a total system is a sustainable way
ings 66 (2013) 373–383
to achieve optimum comfort and energy savings without heavilydepending on mechanical cooling systems. This passive buildingdesign strategy does not have a high initial cost, while it providesan effective solution to mitigate heatwave.
In addition to the effect of climate change, the urban heat island(UHI) phenomenon as another contributing factor to overheating inbuildings cannot be neglected. Indoor temperature and its relatedoverheating risk in urban buildings are likely to be exacerbated inthe future as a result of the combined effect of UHI effects and cli-mate change [25]. According to Coutts [39], a mean maximum UHIintensity of 3–4 ◦C at 2 a.m. in January in Melbourne was predictedusing an urban canopy model software. Oikonomou et al. [26] com-pared the relative importance of UHI and the thermal quality ofdwellings for overheating in London. Their study indicates that thethermal characteristics of a dwelling have a greater effect on indoortemperatures during the ‘hot’ period than the UHI itself. The effectsof built form and other dwelling characteristics appear to be moreimportant determinants of indoor thermal performance.
The relationship between thermal comfort and building designhas been well recognised and investigated among building pro-fessionals in the past. Various overheating assessment criteriawere adopted and applied based on different purposes. A simpleapproach, such as static thresholds of comfort, is sometimes usedto define when a building might be too warm [27]. Another crite-rion, the adaptive comfort criterion, takes consideration of adaptiveapproach to thermal comfort. Upper limits for temperatures inbuilding with and without heating and cooling are suggested interms of running mean of the outdoor temperature [28]. Nicol et al.[29] suggested that criteria for building overheating can be definedas achieving a specified Potential Discomfort Index (PDI) and alsodescribed an approach to predict the magnitude or frequency ofoverheating in buildings. Wright et al. [30] measured the internaltemperatures in four dwellings in Manchester and five dwellings inLondon, of diverse ages, sizes and constructions during the August2003 heatwaves. Resultant statistics and various comfort metricsindicated a high level of discomfort in most dwellings, particularlyin London. Sakka et al. [31] investigated indoor thermal characteris-tics in 50 free-running low income houses during the extremely hotsummer of 2007 in Athens, Greece. Very high indoor temperatures,up to 40 ◦C, were observed.
The above literature review indicates that warming climatedue to climate change and UHI will increase the risk of over-heating. However, few studies have been conducted to assess theheat vulnerability of residential walls in order to identify optimalbuilding design which can result in reduced energy consumptionduring extreme heatwave event while maintaining thermal com-fort requirement at the same time. The current study is to examinethe vulnerability of selected Australian residential walls to heat-wave in Melbourne using dynamic thermal modelling. Numericalsimulations of the periodic heat transfer through various walls werecarried out first. Then the dynamic thermal performance of wallsystems and their resulted room air temperature were comparedand analysed in terms of various assessment criteria in order toidentify effective wall designs to accommodate heatwaves in Mel-bourne.
2. Dynamic thermal modelling
2.1. Heat transfer in solid walls
The purpose of the study is to examine the vulnerability of var-
ious residential walls to heatwaves. Eight different wall structuresselected from Australian residential wall catalogue were stud-ied. Traditional weatherboard wall is not included in the presentstudy, as it is now not commonly used for new residential building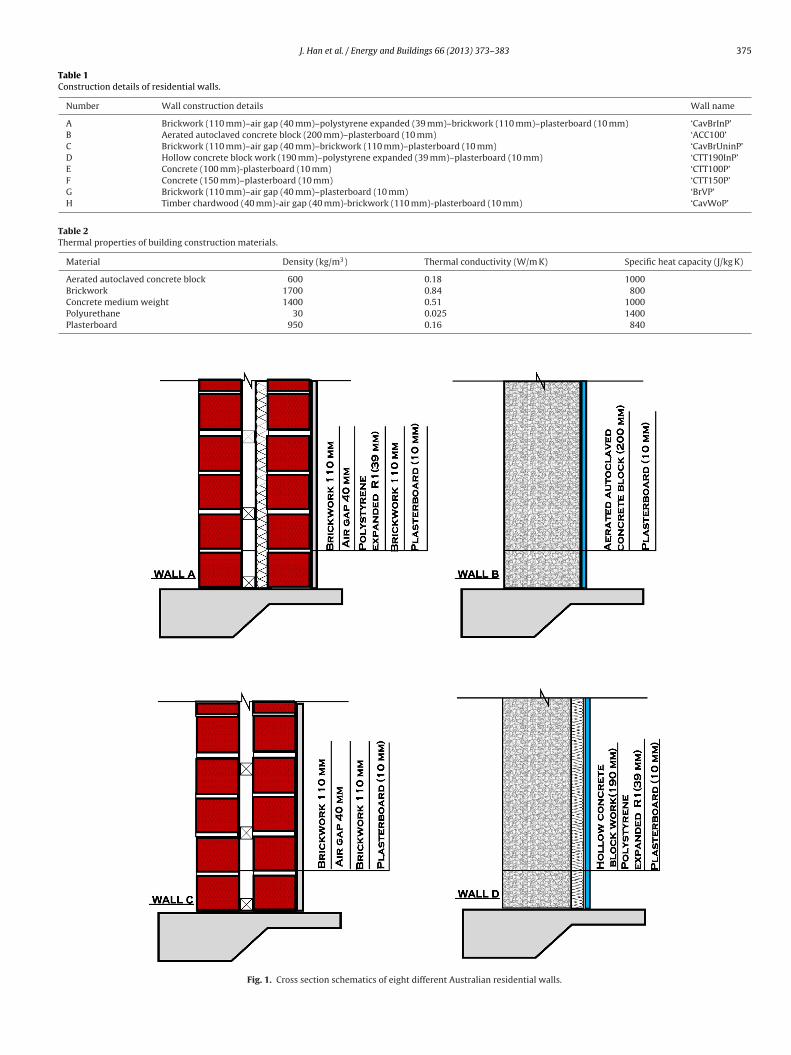
J. Han et al. / Energy and Buildings 66 (2013) 373–383 375
Table 1Construction details of residential walls.
Number Wall construction details Wall name
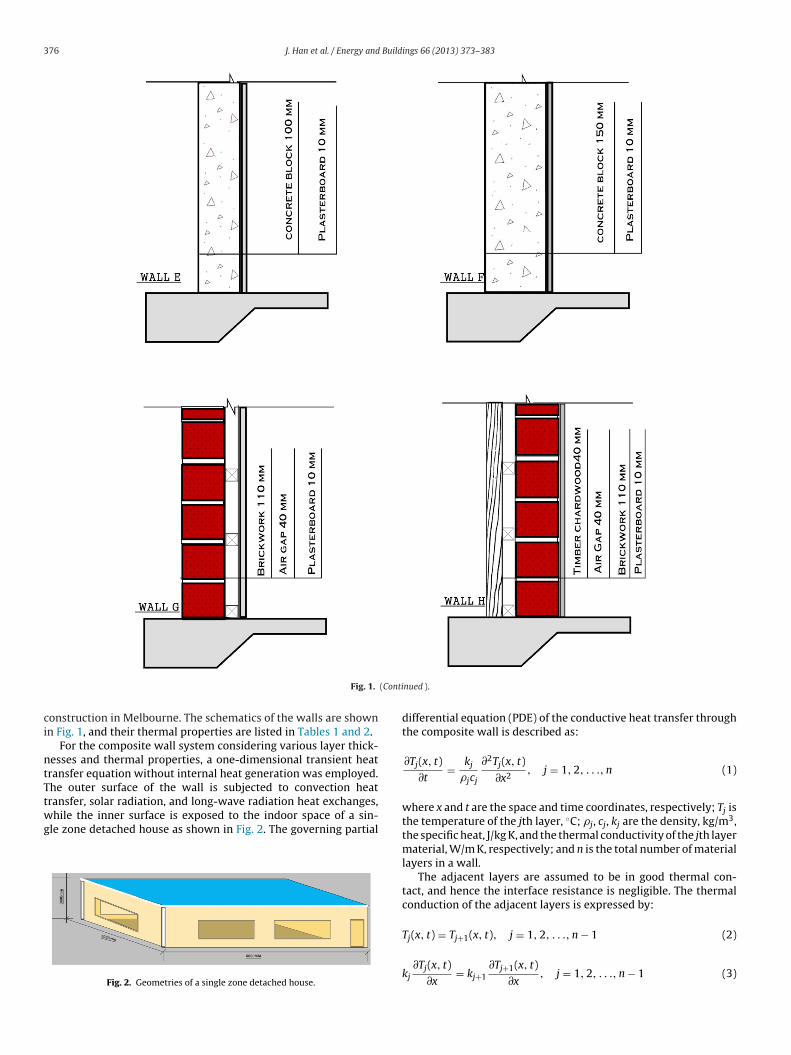
A Brickwork (110 mm)–air gap (40 mm)–polystyrene expanded (39 mm)–brickwork (110 mm)–plasterboard (10 mm) ‘CavBrInP’B Aerated autoclaved concrete block (200 mm)–plasterboard (10 mm) ‘ACC100’C Brickwork (110 mm)–air gap (40 mm)–brickwork (110 mm)–plasterboard (10 mm) ‘CavBrUninP’D Hollow concrete block work (190 mm)–polystyrene expanded (39 mm)–plasterboard (10 mm) ‘CTT190InP’E Concrete (100 mm)-plasterboard (10 mm) ‘CTT100P’F Concrete (150 mm)–plasterboard (10 mm) ‘CTT150P’G Brickwork (110 mm)–air gap (40 mm)–plasterboard (10 mm) ‘BrVP’H Timber chardwood (40 mm)-air gap (40 mm)-brickwork (110 mm)-plasterboard (10 mm) ‘CavWoP’
Table 2Thermal properties of building construction materials.
Material Density (kg/m3) Thermal conductivity (W/m K) Specific heat capacity (J/kg K)
Aerated autoclaved concrete block 600 0.18 1000Brickwork 1700 0.84 800
Concrete medium weight 1400Polyurethane 30
Plasterboard 950
Fig. 1. Cross section schematics of eight d
0.51 10000.025 14000.16 840
ifferent Australian residential walls.
376 J. Han et al. / Energy and Buildings 66 (2013) 373–383
(Conti
ci
ntTtwg
Fig. 1.
onstruction in Melbourne. The schematics of the walls are shownn Fig. 1, and their thermal properties are listed in Tables 1 and 2.
For the composite wall system considering various layer thick-esses and thermal properties, a one-dimensional transient heatransfer equation without internal heat generation was employed.he outer surface of the wall is subjected to convection heat
ransfer, solar radiation, and long-wave radiation heat exchanges,hile the inner surface is exposed to the indoor space of a sin-le zone detached house as shown in Fig. 2. The governing partial
Fig. 2. Geometries of a single zone detached house.
nued ).
differential equation (PDE) of the conductive heat transfer throughthe composite wall is described as:
∂Tj(x, t)∂t
= kj
�jcj
∂2Tj(x, t)
∂x2, j = 1, 2, . . ., n (1)
where x and t are the space and time coordinates, respectively; Tj isthe temperature of the jth layer, ◦C; �j, cj, kj are the density, kg/m3,the specific heat, J/kg K, and the thermal conductivity of the jth layermaterial, W/m K, respectively; and n is the total number of materiallayers in a wall.
The adjacent layers are assumed to be in good thermal con-tact, and hence the interface resistance is negligible. The thermalconduction of the adjacent layers is expressed by:
Tj(x, t) = Tj+1(x, t), j = 1, 2, . . ., n − 1 (2)
kj∂Tj(x, t)
∂x= kj+1
∂Tj+1(x, t)∂x
, j = 1, 2, . . ., n − 1 (3)
J. Han et al. / Energy and Build
Table 3MoWiTT model constants.
Wind direction Ct (W/m2 K4/3) a (W/m2 K(m/s)b) b (–)
t
T
g
wtud
−
Ht
T
wGsaTaosetf
h
wtaTa
2
�
wahh2r
i
−
Windward 0.84 2.38 0.89Leeward 0.84 2.86 0.617
The initial temperature distribution across the wall is assumedo be uniform and is expressed as follows:
j(x, 0) = T0 (4)
The boundary conditions at the inner surface of the wall areiven as follows:
−k1∂T(x, t)
∂x
∣∣∣∣x=0
= hi(Tin − Tx=0) (5)
here hi is the convection heat transfer coefficient, W/m2 K; fromhe ASHRAE handbook of fundamentals [32]: hi = 9.26W/m2 K forpward direction of heat flow, and hi = 6.13 W/m2 K for downwardirection of heat flow, Tin is the room temperature, ◦C.
The boundary conditions at the outer surface are:
kn∂T(x, t)
∂x
∣∣∣∣x=D
= h0(Tx=D − Te) (6)
ere, Te, the sol–air temperature is calculated based on the ambientemperature, solar radiation and heat transfer coefficient [33].
e = T0 + εGT
h0(7)
here ε is the solar absorptivity of the outer surface of the wall;T is the total intensity of solar radiation incident upon the outerurface of the wall, which is calculated according to sun positionnd follows the procedure in author’s previous work [34], W/m2;x=D is the temperature of the outer surface of the wall, ◦C; T0 is thembient temperature, ◦C. The convective heat transfer coefficientf the outer surface, h0, is dependent on the outdoor air conditions,uch as air velocity and its direction, and the temperature differ-nce between the wall outer surface and the ambient air. Accordingo the MoWiTT model [35], the coefficient can be determined asollows:
0 =√
[Ct(�T)1/3]2 + [aVb
0 ]2
(8)
here Ct is the turbulent natural convection constant; �T is theemperature difference between the outer surface and outside air;
and b are constants; V0 is wind speed at standard conditions, m/s.he values of the coefficients and constants for the MoWiTT modelre summarised in Table 3.
.2. Heat transfer in the air cavity of the wall
For the air cavity in a wall:
VcdT∞dt
= hwf Ag(Tw1 − T∞) + hwf Ag(Tw2 − T∞) (9)
here T∞ is temperature in the air cavity, ◦C; � is the density of their in the cavity, kg/m3; V is air volume in the cavity, m3; c is specificeat capacity of air, J/kg K. Ag is wall surface area; hwf is overalleat transfer coefficient which will be further discussed in Section.4, Tw1 andTw2 are left and right side wall surface temperatures,espectively, ◦C. They are calculated by Eqs. (1), (10) and (11).
The surface energy balances at the two surfaces of the air cavity
n the wall are:k∂T(x, t)
∂x
∣∣∣∣x=D
= hwf (Tw1 − T∞) (10)
ings 66 (2013) 373–383 377
− k∂T(x, t)
∂x
∣∣∣∣x=D+d
= hwf (T∞ − Tw2) (11)
where d denotes the thickness of the air in the wall.
2.3. Heat balance of the room air
An enclosed single-zone building of internal volume V is con-sidered with various external wall designs as shown in Fig. 2. Theair in the building is assumed to be well-mixed with a uniform airtemperature. Internal heat gain, air exchange and latent heat loadare not considered for ease of wall performance comparison. Adia-batic boundary conditions are applied to the floor. The heat balanceof the room air is described as:
�VcdTin
dt=
n∑i=1
hwf Aw,i(Tw,i − Tin) + hrAr(Tr − Tin)
+n∑
i=1
UwinAwin,i(Tout − Tin) +n∑
i=1
GT,iAwin,iSHGC (12)
where � is the density of the air in the room, kg/m3; V is the volumeof the room; c is specific heat capacity of air Tin is room air temper-ature, ◦C; hwf is overall heat transfer coefficient between wall androom air, W/m2 K; AW,i is the surface area of the ith wall, m2; TW,iis the surface temperature of the ith wall, ◦C; hr is convective heattransfer coefficient of the roof, W/m2 K; Tr is the interior surfacetemperature of the roof, ◦C; Uwin is the overall heat loss coefficientof the windows, Uwin = 4.2 W/m2 K, [32]; Awin,i is the surface areaof the ith window, m2; Tout is outdoor ambient temperature, ◦C;GT,i is solar radiation striking the vertical surface, W/m2; SHGC issolar heat gain coefficient of a double glazed window assumed atSHGC = 0.71 [36].
2.4. Heat transfer coefficients
The convective heat transfer coefficients in the air gap of the cav-ity wall types, such as ‘wall A, C, G, H’ were determined through a setof existing correlations in the literature. The following correlationsproposed by Catton [37] have been used:
NuL = 0.22(
Pr
0.2 + PrRaL
)0.28(H
L
)−1/4, for
⎡⎢⎢⎣
2 < HL < 10
Pr < 105
RaL < 1010
⎤⎥⎥⎦
(13)
NuL = 0.18(
Pr
0.2 + PrRaL
)0.29, for
⎡⎢⎢⎣
1 < HL < 2
10−3 < Pr < 105
103 < (RaLPr)/(0.2 + Pr)
⎤⎥⎥⎦
(14)
The Rayleigh number RaL is determined by the following for-mula:
RaL = gˇ(Tw1 − Tw2)L3
˛�(15)
Convection coefficients for the vertical cavity heated from oneside may be obtained from the following corrections. All properties
are evaluated at the mean temperature, (Tw1 + Tw2)/2.NuL = hL
k(16)
378 J. Han et al. / Energy and Buildings 66 (2013) 373–383
0 24 48 72 96 120 144 168
0
450
900
2009
TMY
Solar radiation
SO
LA
R R
AD
IAT
ION
(W/m
2)
TIME(Hour)
0 24 48 72 96 120 144 168
5
10
15
20
25
30
35
40
45
2009
TMY Heat wave
Ambient air
TE
MP
ER
AT
UR
E(o
C)
TIME (Hour)
F h–31st
wvPgts˛W
3
spseam
3
tfi
T
T
T
T
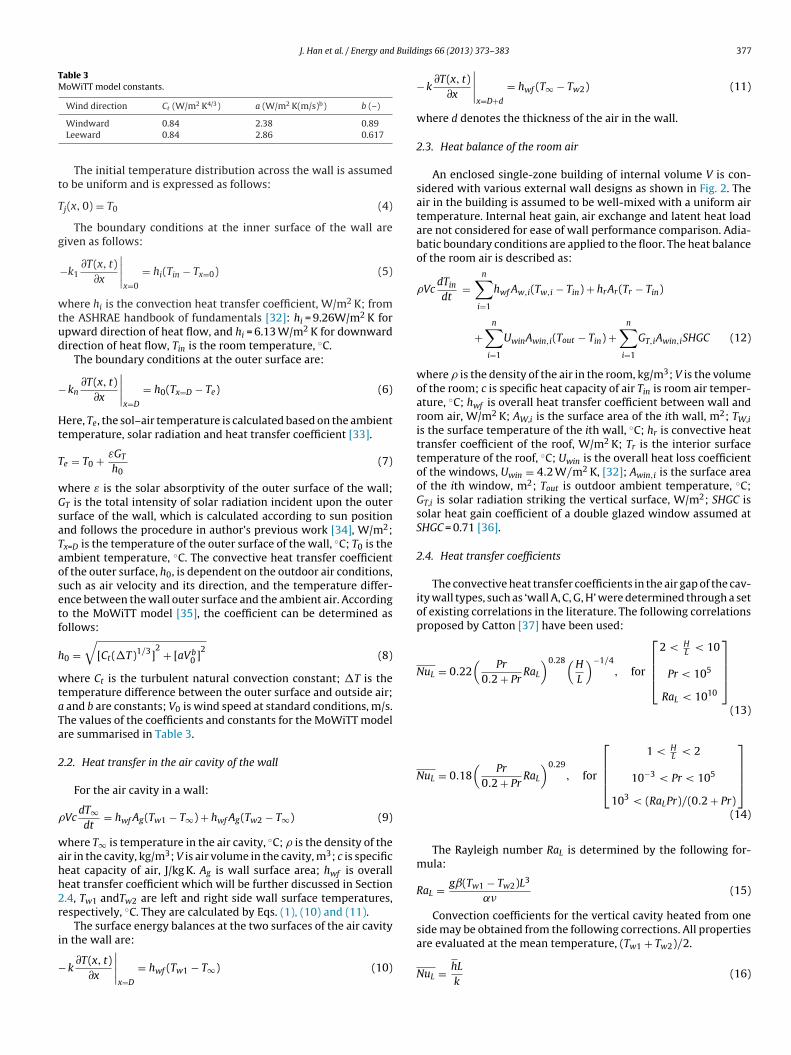
ig. 3. Ambient air temperature and global solar radiation from TMY and 2009 (25the red circle.
here NuL is average Nusselt number which is the ratio of con-ective to conductive heat transfer; RaL is Rayleigh number; Pr israndtl number; H is height of air gap, m; L is the thickness of airap, m; g is acceleration of gravity, g = 9.8 m/s2; is volumetrichermal expansion coefficient, K−1; Tw1 and Tw2 are left and rightide wall surface temperatures, ◦C; � is kinematic viscosity, m2/s;
is thermal diffusivity, m2/s; h is average heat transfer coefficient,/m2 K.
. Numerical solution procedure
The transient heat transfer equations as shown in Section 2 areolved numerically by explicit finite difference approach. A com-uter code using Fortran 90 compiler has been developed for theolution of the above equations. The following lists finite differencequations for various nodes including the interior nodes, bound-ry nodes, interface face nodes between two layers of differentaterials.
.1. Finite difference formulations
A dynamic model is introduced for analysing the transient heatransfer through the walls, which was solved by the control volumenite-difference method employing an explicit scheme.
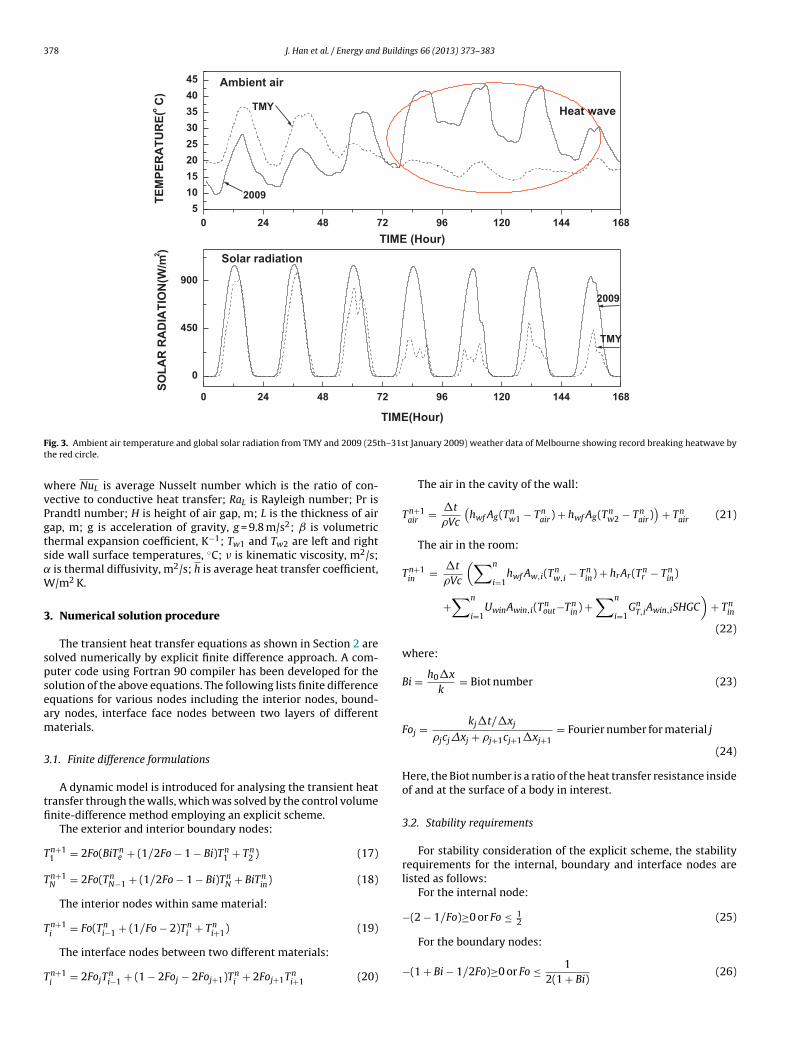
The exterior and interior boundary nodes:
n+11 = 2Fo(BiTn
e + (1/2Fo − 1 − Bi)Tn1 + Tn
2 ) (17)
n+1N = 2Fo(Tn
N−1 + (1/2Fo − 1 − Bi)TnN + BiTn
in) (18)
The interior nodes within same material:
n+1 = Fo(Tn + (1/Fo − 2)Tn + Tn ) (19)
i i−1 i i+1The interface nodes between two different materials:
n+1i
= 2FojTni−1 + (1 − 2Foj − 2Foj+1)Tn
i + 2Foj+1Tni+1 (20)
t January 2009) weather data of Melbourne showing record breaking heatwave by
The air in the cavity of the wall:
Tn+1air
= �t
�Vc
(hwf Ag(Tn
w1 − Tnair) + hwf Ag(Tn
w2 − Tnair)
)+ Tn
air (21)
The air in the room:
Tn+1in
= �t
�Vc
(∑n
i=1hwf Aw,i(T
nw,i − Tn
in) + hrAr(Tnr − Tn
in)
+∑n
i=1UwinAwin,i(T
nout−Tn
in) +∑n
i=1Gn
T,iAwin,iSHGC)
+ Tnin
(22)
where:
Bi = h0�x
k= Biot number (23)
Foj = kj�t/�xj
�jcj�xj + �j+1cj+1�xj+1= Fourier number for material j
(24)
Here, the Biot number is a ratio of the heat transfer resistance insideof and at the surface of a body in interest.
3.2. Stability requirements
For stability consideration of the explicit scheme, the stabilityrequirements for the internal, boundary and interface nodes arelisted as follows:
For the internal node:
−(2 − 1/Fo)≥0 or Fo ≤ 12 (25)
For the boundary nodes:
−(1 + Bi − 1/2Fo)≥0 or Fo ≤ 12(1 + Bi)
(26)
J. Han et al. / Energy and Build
Fc
e
−
4
4
tfTcfft
aMtl2p
4
wdtaopaohsf2nt
ah
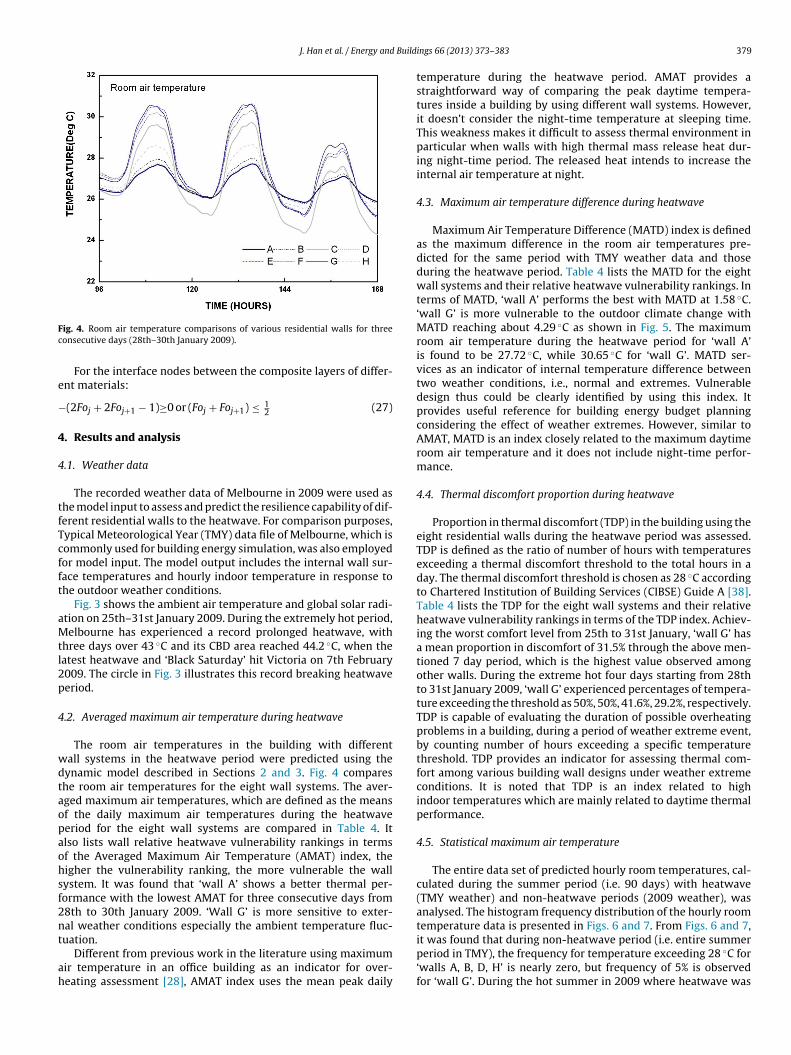
ig. 4. Room air temperature comparisons of various residential walls for threeonsecutive days (28th–30th January 2009).
For the interface nodes between the composite layers of differ-nt materials:
(2Foj + 2Foj+1 − 1)≥0 or (Foj + Foj+1) ≤ 12 (27)
. Results and analysis
.1. Weather data
The recorded weather data of Melbourne in 2009 were used ashe model input to assess and predict the resilience capability of dif-erent residential walls to the heatwave. For comparison purposes,ypical Meteorological Year (TMY) data file of Melbourne, which isommonly used for building energy simulation, was also employedor model input. The model output includes the internal wall sur-ace temperatures and hourly indoor temperature in response tohe outdoor weather conditions.
Fig. 3 shows the ambient air temperature and global solar radi-tion on 25th–31st January 2009. During the extremely hot period,elbourne has experienced a record prolonged heatwave, with
hree days over 43 ◦C and its CBD area reached 44.2 ◦C, when theatest heatwave and ‘Black Saturday’ hit Victoria on 7th February009. The circle in Fig. 3 illustrates this record breaking heatwaveeriod.
.2. Averaged maximum air temperature during heatwave
The room air temperatures in the building with differentall systems in the heatwave period were predicted using theynamic model described in Sections 2 and 3. Fig. 4 compareshe room air temperatures for the eight wall systems. The aver-ged maximum air temperatures, which are defined as the meansf the daily maximum air temperatures during the heatwaveeriod for the eight wall systems are compared in Table 4. Itlso lists wall relative heatwave vulnerability rankings in termsf the Averaged Maximum Air Temperature (AMAT) index, theigher the vulnerability ranking, the more vulnerable the wallystem. It was found that ‘wall A’ shows a better thermal per-ormance with the lowest AMAT for three consecutive days from8th to 30th January 2009. ‘Wall G’ is more sensitive to exter-al weather conditions especially the ambient temperature fluc-
uation.Different from previous work in the literature using maximumir temperature in an office building as an indicator for over-eating assessment [28], AMAT index uses the mean peak daily
ings 66 (2013) 373–383 379
temperature during the heatwave period. AMAT provides astraightforward way of comparing the peak daytime tempera-tures inside a building by using different wall systems. However,it doesn’t consider the night-time temperature at sleeping time.This weakness makes it difficult to assess thermal environment inparticular when walls with high thermal mass release heat dur-ing night-time period. The released heat intends to increase theinternal air temperature at night.
4.3. Maximum air temperature difference during heatwave
Maximum Air Temperature Difference (MATD) index is definedas the maximum difference in the room air temperatures pre-dicted for the same period with TMY weather data and thoseduring the heatwave period. Table 4 lists the MATD for the eightwall systems and their relative heatwave vulnerability rankings. Interms of MATD, ‘wall A’ performs the best with MATD at 1.58 ◦C.‘wall G’ is more vulnerable to the outdoor climate change withMATD reaching about 4.29 ◦C as shown in Fig. 5. The maximumroom air temperature during the heatwave period for ‘wall A’is found to be 27.72 ◦C, while 30.65 ◦C for ‘wall G’. MATD ser-vices as an indicator of internal temperature difference betweentwo weather conditions, i.e., normal and extremes. Vulnerabledesign thus could be clearly identified by using this index. Itprovides useful reference for building energy budget planningconsidering the effect of weather extremes. However, similar toAMAT, MATD is an index closely related to the maximum daytimeroom air temperature and it does not include night-time perfor-mance.
4.4. Thermal discomfort proportion during heatwave
Proportion in thermal discomfort (TDP) in the building using theeight residential walls during the heatwave period was assessed.TDP is defined as the ratio of number of hours with temperaturesexceeding a thermal discomfort threshold to the total hours in aday. The thermal discomfort threshold is chosen as 28 ◦C accordingto Chartered Institution of Building Services (CIBSE) Guide A [38].Table 4 lists the TDP for the eight wall systems and their relativeheatwave vulnerability rankings in terms of the TDP index. Achiev-ing the worst comfort level from 25th to 31st January, ‘wall G’ hasa mean proportion in discomfort of 31.5% through the above men-tioned 7 day period, which is the highest value observed amongother walls. During the extreme hot four days starting from 28thto 31st January 2009, ‘wall G’ experienced percentages of tempera-ture exceeding the threshold as 50%, 50%, 41.6%, 29.2%, respectively.TDP is capable of evaluating the duration of possible overheatingproblems in a building, during a period of weather extreme event,by counting number of hours exceeding a specific temperaturethreshold. TDP provides an indicator for assessing thermal com-fort among various building wall designs under weather extremeconditions. It is noted that TDP is an index related to highindoor temperatures which are mainly related to daytime thermalperformance.
4.5. Statistical maximum air temperature
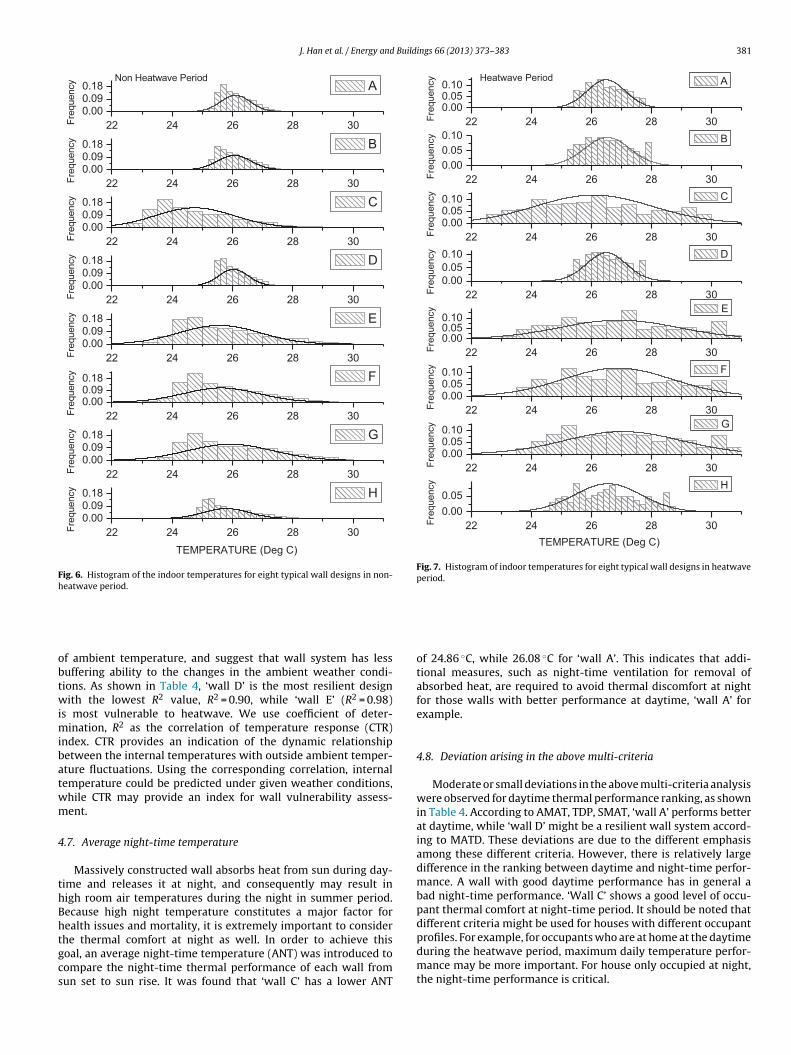
The entire data set of predicted hourly room temperatures, cal-culated during the summer period (i.e. 90 days) with heatwave(TMY weather) and non-heatwave periods (2009 weather), wasanalysed. The histogram frequency distribution of the hourly roomtemperature data is presented in Figs. 6 and 7. From Figs. 6 and 7,
it was found that during non-heatwave period (i.e. entire summerperiod in TMY), the frequency for temperature exceeding 28 ◦C for‘walls A, B, D, H’ is nearly zero, but frequency of 5% is observedfor ‘wall G’. During the hot summer in 2009 where heatwave was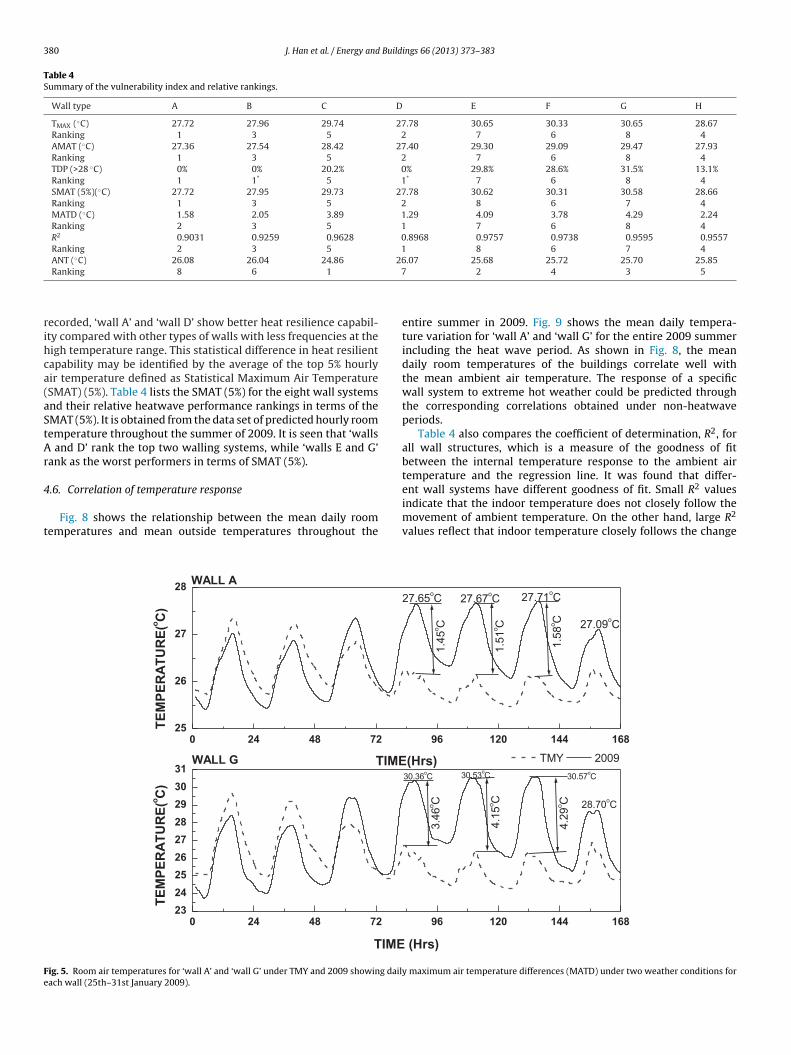
380 J. Han et al. / Energy and Buildings 66 (2013) 373–383
Table 4Summary of the vulnerability index and relative rankings.
Wall type A B C D E F G H
TMAX (◦C) 27.72 27.96 29.74 27.78 30.65 30.33 30.65 28.67Ranking 1 3 5 2 7 6 8 4AMAT (◦C) 27.36 27.54 28.42 27.40 29.30 29.09 29.47 27.93Ranking 1 3 5 2 7 6 8 4TDP (>28 ◦C) 0% 0% 20.2% 0% 29.8% 28.6% 31.5% 13.1%Ranking 1 1* 5 1* 7 6 8 4SMAT (5%)(◦C) 27.72 27.95 29.73 27.78 30.62 30.31 30.58 28.66Ranking 1 3 5 2 8 6 7 4MATD (◦C) 1.58 2.05 3.89 1.29 4.09 3.78 4.29 2.24Ranking 2 3 5 1 7 6 8 4R2 0.9031 0.9259 0.9628 0.8968 0.9757 0.9738 0.9595 0.9557Ranking 2 3 5 1 8 6 7 4ANT (◦C) 26.08 26.04 24.86 26.07 25.68 25.72 25.70 25.85
7
rihca(aStAr
4
t
Fe
Ranking 8 6 1
ecorded, ‘wall A’ and ‘wall D’ show better heat resilience capabil-ty compared with other types of walls with less frequencies at theigh temperature range. This statistical difference in heat resilientapability may be identified by the average of the top 5% hourlyir temperature defined as Statistical Maximum Air TemperatureSMAT) (5%). Table 4 lists the SMAT (5%) for the eight wall systemsnd their relative heatwave performance rankings in terms of theMAT (5%). It is obtained from the data set of predicted hourly roomemperature throughout the summer of 2009. It is seen that ‘walls
and D’ rank the top two walling systems, while ‘walls E and G’ank as the worst performers in terms of SMAT (5%).
.6. Correlation of temperature response
Fig. 8 shows the relationship between the mean daily roomemperatures and mean outside temperatures throughout the
0 24 48 72 23
24
25
26
27
28
29
30
31WALL G
TIME
0 24 48 72 25
26
27
28WALL A
TE
MP
ER
AT
UR
E(o
C)
TE
MP
ER
AT
UR
E(o
C)
TIME
ig. 5. Room air temperatures for ‘wall A’ and ‘wall G’ under TMY and 2009 showing dailach wall (25th–31st January 2009).
2 4 3 5
entire summer in 2009. Fig. 9 shows the mean daily tempera-ture variation for ‘wall A’ and ‘wall G’ for the entire 2009 summerincluding the heat wave period. As shown in Fig. 8, the meandaily room temperatures of the buildings correlate well withthe mean ambient air temperature. The response of a specificwall system to extreme hot weather could be predicted throughthe corresponding correlations obtained under non-heatwaveperiods.
Table 4 also compares the coefficient of determination, R2, forall wall structures, which is a measure of the goodness of fitbetween the internal temperature response to the ambient airtemperature and the regression line. It was found that differ-
ent wall systems have different goodness of fit. Small R2 valuesindicate that the indoor temperature does not closely follow themovement of ambient temperature. On the other hand, large R2values reflect that indoor temperature closely follows the change
96 12 0 14 4 16 8
30.36oC
3.4
6oC 28.70
oC
30.57oC
4.2
9oC
4.1
5oC
30.53oC
( Hrs)
96 12 0 14 4 16 8
TMY 200 9
1.5
8oC
1.5
1oC
1.4
5oC 27.09
oC
27.71oC27.67
oC27.65
oC
(Hrs)
y maximum air temperature differences (MATD) under two weather conditions for
J. Han et al. / Energy and Buildings 66 (2013) 373–383 381
22 24 26 28 30
0.000.090.18
Fre
quency
TEMPERATURE (Deg C)
H
22 24 26 28 30
0.000.090.18
Fre
quency G
22 24 26 28 30
0.000.090.18
Fre
quency F
22 24 26 28 30
0.000.090.18
Fre
quency E
22 24 26 28 30
0.000.090.18
Fre
quency D
22 24 26 28 30
0.000.090.18
Fre
quency C
22 24 26 28 30
0.000.090.18
Fre
quency B
22 24 26 28 30
0.000.090.18
Non Heatwave PeriodF
requency A
Fig. 6. Histogram of the indoor temperatures for eight typical wall designs in non-heatwave period.
obtwimibatwm
4
thBhtgcs
22 24 26 28 30
0.00
0.05
Fre
quency
TEMPE RATUR E ( Deg C)
H
22 24 26 28 30
0.000.050.10
Fre
quency G
22 24 26 28 30
0.000.050.10
Fre
quency F
22 24 26 28 30
0.000.050.10
Fre
quency E
22 24 26 28 30
0.00
0.05
0.10
Fre
quency D
22 24 26 28 30
0.000.050.10
Fre
quency C
22 24 26 28 30
0.00
0.05
0.10
Fre
quency B
22 24 26 28 30
0.000.050.10
Heatwave Period
Fre
quency A
Fig. 7. Histogram of indoor temperatures for eight typical wall designs in heatwaveperiod.
f ambient temperature, and suggest that wall system has lessuffering ability to the changes in the ambient weather condi-ions. As shown in Table 4, ‘wall D’ is the most resilient designith the lowest R2 value, R2 = 0.90, while ‘wall E’ (R2 = 0.98)
s most vulnerable to heatwave. We use coefficient of deter-ination, R2 as the correlation of temperature response (CTR)
ndex. CTR provides an indication of the dynamic relationshipetween the internal temperatures with outside ambient temper-ture fluctuations. Using the corresponding correlation, internalemperature could be predicted under given weather conditions,hile CTR may provide an index for wall vulnerability assess-ent.
.7. Average night-time temperature
Massively constructed wall absorbs heat from sun during day-ime and releases it at night, and consequently may result inigh room air temperatures during the night in summer period.ecause high night temperature constitutes a major factor forealth issues and mortality, it is extremely important to consider
he thermal comfort at night as well. In order to achieve thisoal, an average night-time temperature (ANT) was introduced toompare the night-time thermal performance of each wall fromun set to sun rise. It was found that ‘wall C’ has a lower ANTof 24.86 ◦C, while 26.08 ◦C for ‘wall A’. This indicates that addi-tional measures, such as night-time ventilation for removal ofabsorbed heat, are required to avoid thermal discomfort at nightfor those walls with better performance at daytime, ‘wall A’ forexample.
4.8. Deviation arising in the above multi-criteria
Moderate or small deviations in the above multi-criteria analysiswere observed for daytime thermal performance ranking, as shownin Table 4. According to AMAT, TDP, SMAT, ‘wall A’ performs betterat daytime, while ‘wall D’ might be a resilient wall system accord-ing to MATD. These deviations are due to the different emphasisamong these different criteria. However, there is relatively largedifference in the ranking between daytime and night-time perfor-mance. A wall with good daytime performance has in general abad night-time performance. ‘Wall C’ shows a good level of occu-pant thermal comfort at night-time period. It should be noted thatdifferent criteria might be used for houses with different occupantprofiles. For example, for occupants who are at home at the daytime
during the heatwave period, maximum daily temperature perfor-mance may be more important. For house only occupied at night,the night-time performance is critical.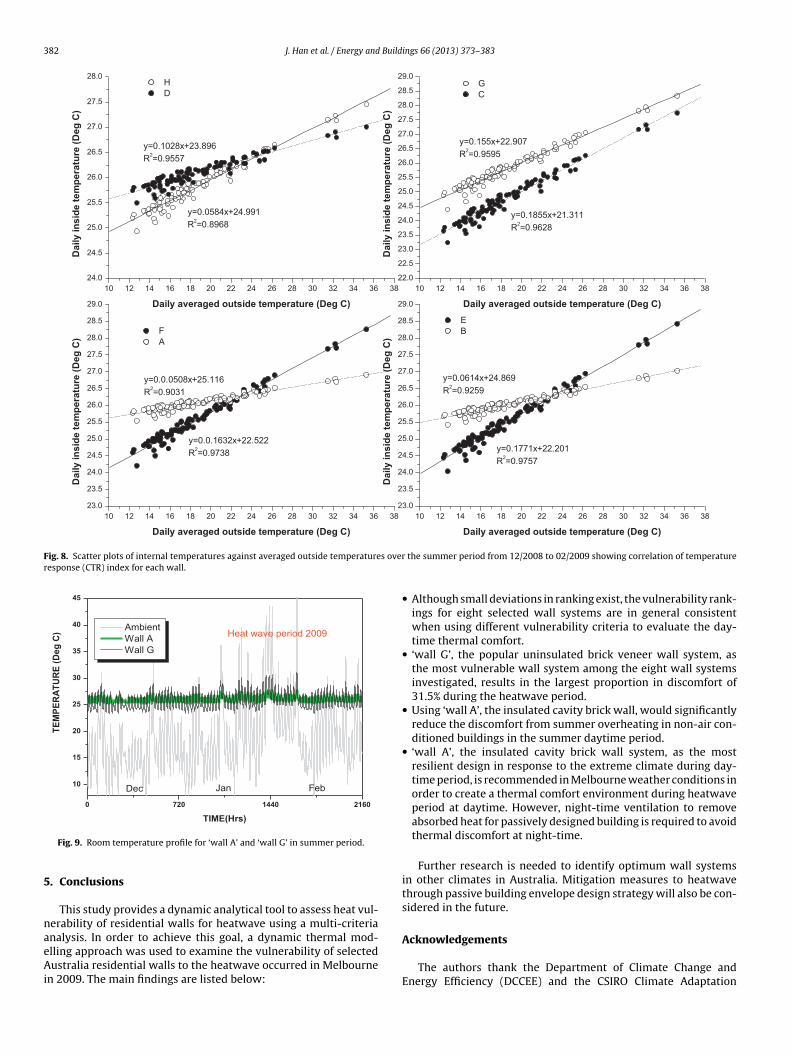
382 J. Han et al. / Energy and Buildings 66 (2013) 373–383
10 12 14 16 18 20 22 24 26 28 30 32 34 36 38
24.0
24.5
25.0
25.5
26.0
26.5
27.0
27.5
28.0
y=0.0584x+24.991
R2=0.8968
y=0.1028 x+23 .896
R2=0.9557
H
D
Da
ily
in
sid
e t
em
pe
ratu
re (
De
g C
)
Daily averaged outside temperature (Deg C)
10 12 14 16 18 20 22 24 26 28 30 32 34 36 38
22.0
22.5
23.0
23.5
24.0
24.5
25.0
25.5
26.0
26.5
27.0
27.5
28.0
28.5
29.0
y=0.1855x+21.311
R2=0.9628
y=0.155 x+22 .907
R2=0.959 5
G
C
Da
ily
in
sid
e t
em
pe
ratu
re (
De
g C
)
Daily averaged outside temperature (Deg C)
10 12 14 16 18 20 22 24 26 28 30 32 34 36 38
23.0
23.5
24.0
24.5
25.0
25.5
26.0
26.5
27.0
27.5
28.0
28.5
29.0
y=0.0.1632 x+22 .522
R2=0.973 8
y=0.0.0508 x+25 .116
R2=0.903 1
F
A
Da
ily
in
sid
e t
em
pe
ratu
re (
De
g C
)
Dail y ave raged outside tempe ratur e (Deg C)
10 12 14 16 18 20 22 24 26 28 30 32 34 36 38
23.0
23.5
24.0
24.5
25.0
25.5
26.0
26.5
27.0
27.5
28.0
28.5
29.0
y=0.1771 x+22 .201
R2=0.9757
y=0.0614x+24.869
R2=0.925 9
E
B
Da
ily
in
sid
e t
em
pe
ratu
re (
De
g C
)
Dail y ave raged outside tempe ratur e (Deg C)
Fig. 8. Scatter plots of internal temperatures against averaged outside temperatures overresponse (CTR) index for each wall.
0 720 1440 2160
10
15
20
25
30
35
40
45
Heat wave pe riod 200 9
FebJanDec
TE
MP
ER
AT
UR
E (
Deg
C)
TIME(Hrs)
Ambien t
Wall A
Wall G
5
naeAi
Acknowledgements
Fig. 9. Room temperature profile for ‘wall A’ and ‘wall G’ in summer period.
. Conclusions
This study provides a dynamic analytical tool to assess heat vul-erability of residential walls for heatwave using a multi-criterianalysis. In order to achieve this goal, a dynamic thermal mod-
lling approach was used to examine the vulnerability of selectedustralia residential walls to the heatwave occurred in Melbournen 2009. The main findings are listed below:
the summer period from 12/2008 to 02/2009 showing correlation of temperature
• Although small deviations in ranking exist, the vulnerability rank-ings for eight selected wall systems are in general consistentwhen using different vulnerability criteria to evaluate the day-time thermal comfort.
• ‘wall G’, the popular uninsulated brick veneer wall system, asthe most vulnerable wall system among the eight wall systemsinvestigated, results in the largest proportion in discomfort of31.5% during the heatwave period.
• Using ‘wall A’, the insulated cavity brick wall, would significantlyreduce the discomfort from summer overheating in non-air con-ditioned buildings in the summer daytime period.
• ‘wall A’, the insulated cavity brick wall system, as the mostresilient design in response to the extreme climate during day-time period, is recommended in Melbourne weather conditions inorder to create a thermal comfort environment during heatwaveperiod at daytime. However, night-time ventilation to removeabsorbed heat for passively designed building is required to avoidthermal discomfort at night-time.
Further research is needed to identify optimum wall systemsin other climates in Australia. Mitigation measures to heatwavethrough passive building envelope design strategy will also be con-sidered in the future.
The authors thank the Department of Climate Change andEnergy Efficiency (DCCEE) and the CSIRO Climate Adaptation
Build
Fag
R
[
[
[
[
[
[
[
[
[
[
[
[
[
[
[
[
[
[
[
[
[
[
[
[[
[
[[
[
J. Han et al. / Energy and
lagship for funding this research. The authors also express theirppreciation to Minh N. Nguyen of CSIRO, for valuable advice andenerous support.
eferences
[1] W. Huang, H. Kan, S. Kovats, The impact of the 2003 heat wave on mortality inShanghai, China, Science of the Total Environment 408 (11) (2010) 2418–2420.
[2] P.A. Stott, D.A. Stone, M.R. Allen, Human contribution to the European heatwaveof 2003, Nature 432 (7017) (2004) 610–614.
[3] D. Founda, C. Giannakopoulos, The exceptionally hot summer of 2007 in Athens,Greece — a typical summer in the future climate? Global and Planetary Change67 (3–4) (2009) 227–236.
[4] D.J. Karoly, The recent bushfires and extreme heat wave in southeast Australia,Bulletin of the Australian Meteorological and Oceanographic Society 22 (2009)10–13.
[5] State of the Climate: Global Hazards for October 2012, NOAA National ClimaticData Center, 2012.
[6] Climate Change Report Warns of Dramatically Warmer World This Century,The World Bank, 2012.
[7] CSIRO, The science of climate change, 2007.[8] G.A. Meehl, C. Tebaldi, More intense, more frequent, and longer lasting heat
waves in the 21st century, Science 305 (5686) (2004) 994–997.[9] C. Huang, A.G. Barnett, X. Wang, S. Tong, Effects of extreme temperatures
on years of life lost for cardiovascular deaths: a time series study in Bris-bane, Australia, Circulation: Cardiovascular Quality and Outcomes 5 (5) (2012)609–614.
10] C. Huang, A.G. Barnett, X. Wang, S. Tong, The impact of temperature on yearsof life lost in Brisbane, Australia, Nature Climate Change 2 (4) (2012) 265–270.
11] C.B. Huang, A.G. Barnett, X. Wang, P. Vaneckova, G. FitzGerald, S. Tong, Projec-ting future heat-related mortality under climate change scenarios: a systematicreview, Environmental Health Perspectives 119 (12) (2011) 9.
12] M. Anderson, C. Carmichael, V. Murray, A. Dengel, M. Swainson, Defining indoorheat thresholds for health in the UK, Perspectives in Public Health 133 (3) (2013)158–164.
13] B. A.B.C.B., in: C. Australian Building Codes Board (Ed.), The Building Code ofAustralia, 2009.
14] A. Roetzel, A. Tsangrassoulis, Impact of climate change on comfort and energyperformance in offices, Building and Environment 57 (0) (2012) 349–361.
15] M.L. Fong, Z. Lin, K.F. Fong, T.T. Chow, T. Yao, Evaluation of thermal comfortconditions in a classroom with three ventilation methods, Indoor Air 21 (3)(2011) 231–239.
16] W. Liu, Y. Zheng, Q. Deng, L. Yang, Human thermal adaptive behaviour in nat-urally ventilated offices for different outdoor air temperatures: a case study inChangsha China, Building and Environment 50 (2012) 76–89.
17] Z. Wang, L. Zhang, J. Zhao, Y. He, Thermal comfort for naturally ventilated res-idential buildings in Harbin, Energy and Buildings 42 (12) (2010) 2406–2415.
18] T.G. Nijland, O.C.G. Adan, R.P.J. Van Hees, B.D. Van Etten, Evaluation of theeffects of expected climate change on the durability of building materials withsuggestions for adaptation, Heron 54 (1) (2009) 37–48.
19] Z. Ren, Z. Chen, X. Wang, Climate change adaptation pathways for Australianresidential buildings, Building and Environment 46 (11) (2011) 2398–2412.
[
ings 66 (2013) 373–383 383
20] D.P. Jenkins, The importance of office internal heat gains in reducing coolingloads in a changing climate, International Journal of Low-Carbon Technologies4 (3) (2009) 134–140.
21] M.R. Gaterell, M.E. McEvoy, The impact of climate change uncertainties on theperformance of energy efficiency measures applied to dwellings, Energy andBuildings 37 (9) (2005) 982–995.
22] C.A. Balaras, The role of thermal mass on the cooling load of buildings. Anoverview of computational methods, Energy and Buildings 24 (1) (1996) 1–10.
23] S. Porritt, L. Shao, P. Cropper, C. Goodier, Adapting dwellings for heat waves,Sustainable Cities and Society 1 (2) (2011) 81–90.
24] S.M. Porritt, P.C. Cropper, L. Shao, C.I. Goodier, Ranking of interventions toreduce dwelling overheating during heat waves, Energy and Buildings 55 (0)(2012) 16–27.
25] C. Demanuele, A. Mavrogianni, M. Davies, M. Kolokotroni, Using localisedweather files to assess overheating in naturally ventilated offices withinLondon’s urban heat island, Building Services Engineering Research and Tech-nology 33 (4) (2012) 351–369.
26] E. Oikonomou, M. Davies, A. Mavrogianni, P. Biddulph, P. Wilkinson, M.Kolokotroni, Modelling the relative importance of the urban heat island andthe thermal quality of dwellings for overheating in London, Building and Envi-ronment 57 (0) (2012) 223–238.
27] D.P. Jenkins, M. Gul, S. Patidar, P.F.G. Banfill, G. Gibson, G. Menzies, Designing amethodology for integrating industry practice into a probabilistic overheatingtool for future building performance, Energy and Buildings 54 (2012) 73–80.
28] F. Nicol, M. Humphreys, Maximum temperatures in European office buildingsto avoid heat discomfort, Solar Energy 81 (3) (2007) 295–304.
29] J.F. Nicol, J. Hacker, B. Spires, H. Davies, Suggestion for new approach to over-heating diagnostics, Building Research and Information 37 (4) (2009) 348–357.
30] A. Wright, A. Young, S. Natarajan, Dwelling temperatures and comfort dur-ing the August 2003 heat wave, Building Services Engineering Research andTechnology 26 (4) (2005) 285–300.
31] A. Sakka, M. Santamouris, I. Livada, F. Nicol, M. Wilson, On the thermal per-formance of low income housing during heat waves, Energy and Buildings 49(2012) 69–77.
32] ASHRAE, ASHRAE Handbook: Fundamentals (I-P Edition), American Society ofHeating, Refrigerating and Air-Conditioning Engineers, Inc., Atlanta, 2009.
33] J.L. Threlkeld, Thermal Environmental Engineering, Prentice-Hall, 1970.34] J. Han, L. Lu, H. Yang, Investigation on the thermal performance of different
lightweight roofing structures and its effect on space cooling load, AppliedThermal Engineering 29 (11–12) (2009) 2491–2499.
35] M. Yazdanian, J.H. Klems, Measurement of the exterior convective film coeffi-cient for windows in low-rise buildings, ASHRAE Transactions 100 (1) (1994)1087–1096.
36] GANA, Specifiers Guide to Architectural Glass, 2005 Edition.37] R.K. MacGregor, A.F. Emery, Free convection through vertical plane
layers—moderate and high Prandtl number fluids, Journal of Heat Transfer 91(3) (1969) 391–401.
38] CIBSE, CIBSE Guide A: Environmental Design, Chartered Institution of Building
Services Engineers, 2006.39] A.M. Coutts, J. Beringer, N.J. Tapper, Investigating the climatic impact of urbanplanning strategies through the use of regional climate modelling: a case studyfor Melbourne, Australia, International Journal of Climatology 28 (14) (2008)1943–1957.
Related Documents