Journal of Mining and Geology Vol. 45(1) 2009, pp. 13–20 © Nigerian Mining and Geosciences Society (NMGS) - Printed in Nigeria 1116-2775 13 Multi-attributes prediction of lithology and porosity from seismic data over Tomboy Field, Niger Delta M. B. Aminu and M. A. Olorunniwo Department of Applied Geophysics, Obafemi Awolowo University, Ile-Ife, Nigeria Abstract Reservoir characterization using 3D seismic data has advanced from conventional mapping of reservoir horizons to attempts at predicting subsurface reservoir properties away from well control using seismic data volumes. The need to process and screen large volumes of data, optimize field-development, reduce exploration risks and ensure economic success of exploration objectives has driven the development and application of a host of methodologies. These usually exploit the possibility of extracting new dimensionality of data (attributes), and processing same multi-variate framework. Each technique, attempts to take advantage of new and viable discriminant information provided by additional data components. In this study, multi-variate linear transforms have been used to predict reservoir properties for the Agbada Formation of the Tomboy Field, Niger delta. The technology, though not new, requires cautious engagement due to inherent pitfalls. Petrophysical analysis over a horizon of the Agbada Formation shows that well B1, B4 and B5 encounter clean hydrocarbon-bearing sand at the target Salafi horizon, with shale volume ranging from 12-22%, porosity from 20-25% and average hydrocarbon saturation of 77%. Petrophysical studies indicate that the lithofacies are distinguishable from their physical properties (namely: P-wave impedance, porosity, shale volume and water saturation). The multi-variate log transforms from seismic data result in reasonable and geologically feasible imaging of subsurface reservoir property distribution. Within the reservoir region, predicted shale volume ranges from 8-24% and porosity from 20-27%. These predictions correlate well with well data. Depositional environment features inferred from resulting lithology and porosity maps include several meandering sand-filled river channels, a major lobe system with clean sands interspaced with dirty sands and small sand bars. Introduction The Lower Eocene to Pleistocene Agbada Formation is a paralic sequence of alternating sandstones and sand bodies with shale intercalations and is the primary target of exploration in the Niger Delta. The alternations of sand and shale are the results of differential subsidence, variations in the sediment supply and shifts of the delta depositional axes resulting in local transgressions and regressions (Short and Stauble, 1967). Vertical and lateral variability of sand/shale ratio demands that exploration objectives be thoroughly understood. This requires having log property information over the entire field. This study attempts at achieving field- wide log property prediction from seismic attributes via multi-variate linear transforms. It will also present the concept and logic, and point out some potential pitfalls. The target horizon is the top of Salafi sand horizon (Fig. 1) and is penetrated by six wells which test a contour closure against an east-west trending growth fault. The fault compartmentalizes the horizon into northern and southern blocks. Wells B1, B4 and B5 encountered low porosity (20 - 25%) sands with average hydrocarbon saturation of 77%. Fig. 1. Isochron map of Salafi sand horizon. The major structure building growth fault (in red) compartmentalizes the horizon into two major block: north and south. The blocks are down thrown towards the south-west.

Welcome message from author
This document is posted to help you gain knowledge. Please leave a comment to let me know what you think about it! Share it to your friends and learn new things together.
Transcript
Journal of Mining and Geology Vol. 45(1) 2009, pp. 13–20© Nigerian Mining and Geosciences Society (NMGS) - Printed in Nigeria
1116-2775
13
Multi-attributes prediction of lithology and porosity from seismic dataover Tomboy Field, Niger Delta
M. B. Aminu and M. A. OlorunniwoDepartment of Applied Geophysics, Obafemi Awolowo University, Ile-Ife, Nigeria
Abstract
Reservoir characterization using 3D seismic data has advanced from conventional mapping of reservoir horizons to attempts atpredicting subsurface reservoir properties away from well control using seismic data volumes. The need to process and screen largevolumes of data, optimize field-development, reduce exploration risks and ensure economic success of exploration objectives hasdriven the development and application of a host of methodologies. These usually exploit the possibility of extracting newdimensionality of data (attributes), and processing same multi-variate framework. Each technique, attempts to take advantage ofnew and viable discriminant information provided by additional data components.
In this study, multi-variate linear transforms have been used to predict reservoir properties for the Agbada Formation of theTomboy Field, Niger delta. The technology, though not new, requires cautious engagement due to inherent pitfalls. Petrophysicalanalysis over a horizon of the Agbada Formation shows that well B1, B4 and B5 encounter clean hydrocarbon-bearing sand at thetarget Salafi horizon, with shale volume ranging from 12-22%, porosity from 20-25% and average hydrocarbon saturation of 77%.Petrophysical studies indicate that the lithofacies are distinguishable from their physical properties (namely: P-wave impedance,porosity, shale volume and water saturation). The multi-variate log transforms from seismic data result in reasonable andgeologically feasible imaging of subsurface reservoir property distribution. Within the reservoir region, predicted shale volumeranges from 8-24% and porosity from 20-27%. These predictions correlate well with well data. Depositional environment featuresinferred from resulting lithology and porosity maps include several meandering sand-filled river channels, a major lobe system withclean sands interspaced with dirty sands and small sand bars.
IntroductionThe Lower Eocene to Pleistocene Agbada Formation is aparalic sequence of alternating sandstones and sand bodieswith shale intercalations and is the primary target ofexploration in the Niger Delta. The alternations of sand andshale are the results of differential subsidence, variations inthe sediment supply and shifts of the delta depositional axesresulting in local transgressions and regressions (Short andStauble, 1967). Vertical and lateral variability of sand/shaleratio demands that exploration objectives be thoroughlyunderstood. This requires having log property information
over the entire field. This study attempts at achieving field-wide log property prediction from seismic attributes viamulti-variate linear transforms. It will also present theconcept and logic, and point out some potential pitfalls.
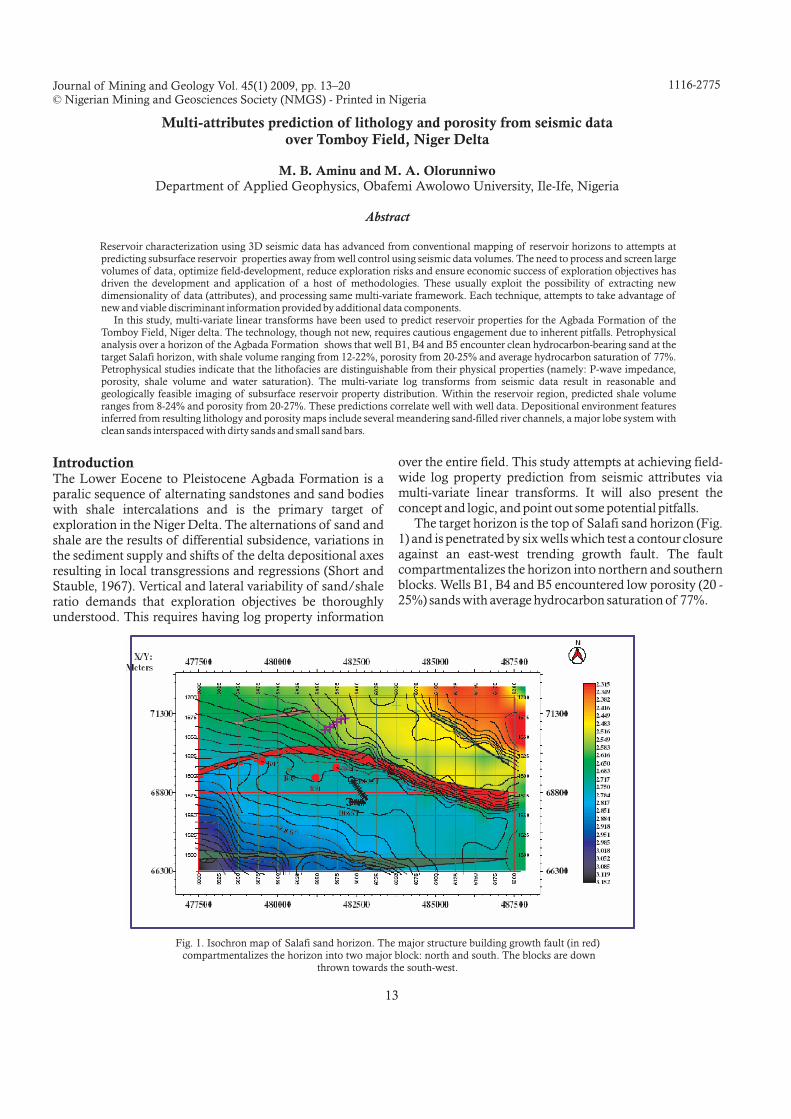
The target horizon is the top of Salafi sand horizon (Fig.1) and is penetrated by six wells which test a contour closureagainst an east-west trending growth fault. The faultcompartmentalizes the horizon into northern and southernblocks. Wells B1, B4 and B5 encountered low porosity (20 -25%) sands with average hydrocarbon saturation of 77%.
Fig. 1. Isochron map of Salafi sand horizon. The major structure building growth fault (in red)compartmentalizes the horizon into two major block: north and south. The blocks are down
thrown towards the south-west.
14
Petrophysical trend analysisIn order to determine the governing rock-physicsrelationships for the study area, tri-variate plots ofelastic/petrophysical parameters of subsurface reservoirzones in the Agbada Formation, Tomboy Field were made.This calibration provides insights into the possibility ofdistinguishing various lithofacies populations of theformation, based on their physical properties and sets abasis for the interpretation of prediction results.
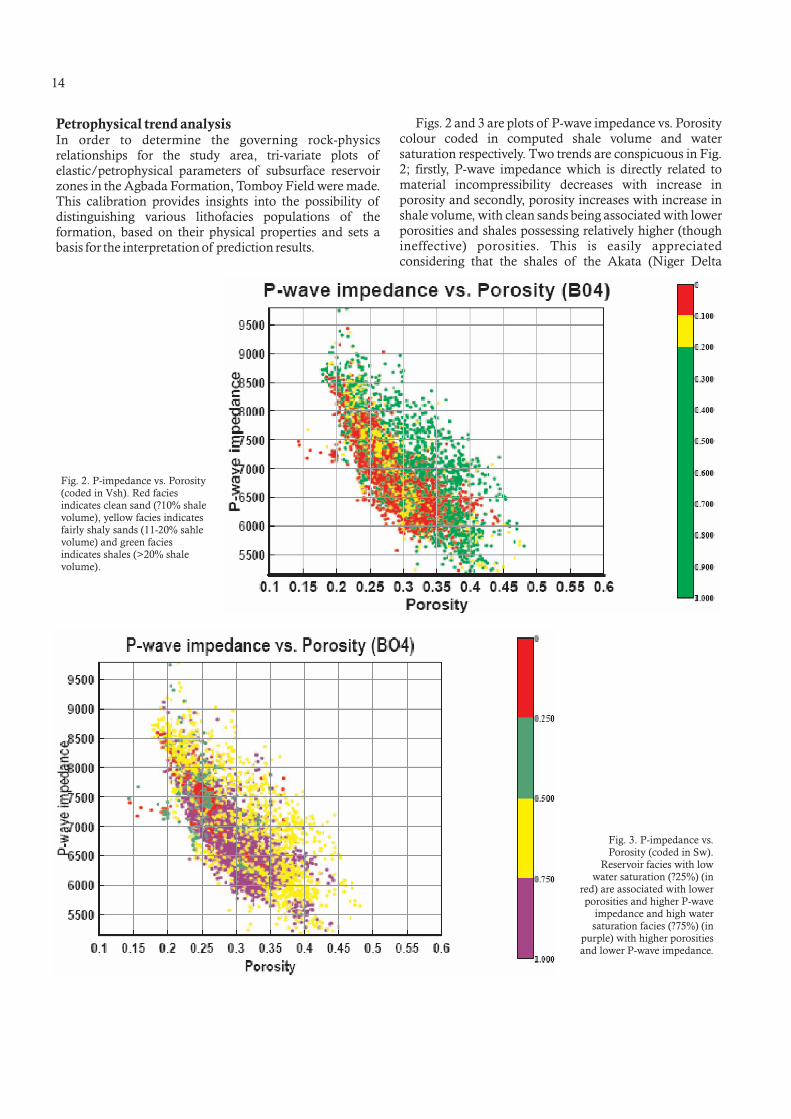
Figs. 2 and 3 are plots of P-wave impedance vs. Porositycolour coded in computed shale volume and watersaturation respectively. Two trends are conspicuous in Fig.2; firstly, P-wave impedance which is directly related tomaterial incompressibility decreases with increase inporosity and secondly, porosity increases with increase inshale volume, with clean sands being associated with lowerporosities and shales possessing relatively higher (thoughineffective) porosities. This is easily appreciatedconsidering that the shales of the Akata (Niger Delta
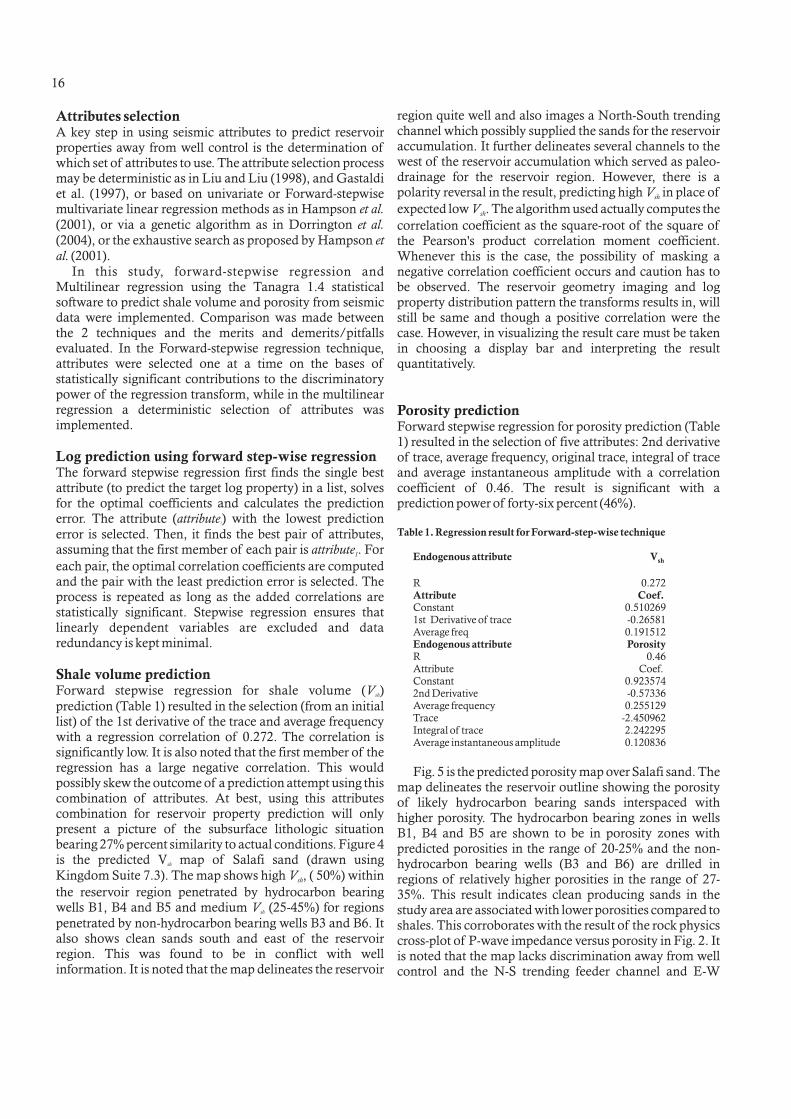
Fig. 3. P-impedance vs.Porosity (coded in Sw).
Reservoir facies with lowwater saturation (?25%) (in
red) are associated with lowerporosities and higher P-wave
impedance and high watersaturation facies (?75%) (in
purple) with higher porositiesand lower P-wave impedance.
Fig. 2. P-impedance vs. Porosity(coded in Vsh). Red faciesindicates clean sand (?10% shalevolume), yellow facies indicatesfairly shaly sands (11-20% sahlevolume) and green faciesindicates shales (>20% shalevolume).

15
source rock) and Agbada Formations of the Niger delta areknown to be undercompacted and overpressured as noted byEkweozor . (1984). The platy nature of clay minerals
ensures that inter-granular pores are large. With Fig. 2 in thebackground, three lithofacies can be observed in Figure 3:hydrocarbons-bearing sands with high P-wave impedanceand lower porosities (23-27%), water-bearing sands with lowP-wave impedance and medium porosities (25-35%) andshales associated with low-to-medium P-wave impedancesand high porosities (30-42%). The plot demonstrates goodlithofacies discrimination based on P-wave impedance andporosity. It is therefore interpreted that these lithofaciespopulations are discriminable from seismic data usingappropriate data transform techniques.
Conventional 2D seismic data is defined by at least 3parameters; vertical reflection time ( ) axis, horizontal axis
of common midpoints (x ) and a measured seismic responseamplitude ( ).
2 : ( , , )
Likewise 3D seismic data volume is defined using four (4)parameters: vertical reflection time ( ), inline coordinate ( ),
cross-line coordinate ( ) and response amplitude ( ).
3 : ( , , , )
Thus conventional 2D and 3D seismic data inherentlypossess 3 and 4 components (is other terms 3 and 4dimensions) respectively.
Taner (1979) mathematical formulation of the
complex trace elicited the rapid generation of several seismicattributes, resulting in data volume and dimensionalityproliferation. The Complex analytical signal is written as:
( ) = ( ) + ( ) (1)
Where ( ) is the complex analytical signal, ( ) is the
primary seismogram, ( ) is the Hilbert transform of ( ) and
i= -1.This enables the computation of 3 fundamental
attributes:
( ) = (2)
( ) = tan (3)
( ) (4)
et al
t
A
D t x A
t x
ym A
D t x y A
et al.,
F t f t ig t
F t f t
g t f t
a t
a t
freq t =
Data dimensionality and attributes extraction
n
m
i
n m 1
m
ij
n m m ij
i
1
Ö
i
-1
Where , and are the instantaneous amplitude,
phase and frequency of the complex analytical signalrespectively. From these fundamental instantaneousattributes and other geometric and dynamic operations e.g.summations, averages, differentials, integrals etc.,numerous other attributes are computed. Each of these newattributes represents another dimension or view of theseismic response, providing new and possibly statisticallysignificant discriminant information between subsurfacegeologic lithofacies. Theoretically, there is no limit to thenumber of such new attributes (perspectives of the seismicresponse) that can be generated. The only concern is in thesignificance of the information they provide.
In Multilinear regression techniques as applied in logproperty prediction from seismic attributes, the goal is toobtain linear transforms which relate well logs to seismicattributes in the vicinity of wells, such that they are used aspredictive tool of log properties across the entire field,where there exists no well control. For a singe attribute, ifthe relationship between the target log and the attribute
can be written as:
(5)
Where the coefficients a and b are obtained byminimizing the mean-squared prediction error:
(6)
Then the multivariate case is written as given inHampson (2001):
( ) = + ( ) + ( ) + ... + ( ) (7)
Where ( ) represents the log sample, ( ) are the
corresponding seismic attributes and … are the
coefficients of the linear transform. If the log consists of nsamples then the equation is written as:
= + + + ... +
= + + + ... +
= + + + ... + (10)
Where is the sample of the attribute
(Hampson 2001).
Where is the sample of the attribute (Hampson
, 2001).
a freq
L A
L = a + bA
et al.
L t w w A t w A t w A t
L t A t
w w
L w w A w A w A
L w w A w A w A
L w w A w A w A
A j i
et al.,
A j i et
al
ii iq
Multivariate Linear regression techniques
o 1 1 2 2 m m
m
1 o 1 11 2 21 m m1
2 o 1 12 2 22 m m2
n o 1 1n 2 2n m mn
m
ij
ij
0
. . . . .
. . . . .m
th
th th
th
( ) ( ) ( )[ ]tgtftai
22 +=
( )( )ú
û
ùêë
é= -
tf
tg1tan
( )( )t
ttfreqi
¶=
p
q
2
( )å=
--=N
i
ii bAaLN
E1
22 1
16
Attributes selection
Log prediction using forward step-wise regression
Shale volume prediction
A key step in using seismic attributes to predict reservoirproperties away from well control is the determination ofwhich set of attributes to use. The attribute selection processmay be deterministic as in Liu and Liu (1998), and Gastaldiet al. (1997), or based on univariate or Forward-stepwisemultivariate linear regression methods as in Hampson
(2001), or via a genetic algorithm as in Dorrington
(2004), or the exhaustive search as proposed by Hampson
(2001).
In this study, forward-stepwise regression andMultilinear regression using the Tanagra 1.4 statisticalsoftware to predict shale volume and porosity from seismicdata were implemented. Comparison was made betweenthe 2 techniques and the merits and demerits/pitfallsevaluated. In the Forward-stepwise regression technique,attributes were selected one at a time on the bases ofstatistically significant contributions to the discriminatorypower of the regression transform, while in the multilinearregression a deterministic selection of attributes wasimplemented.
The forward stepwise regression first finds the single bestattribute (to predict the target log property) in a list, solvesfor the optimal coefficients and calculates the predictionerror. The attribute ( ) with the lowest prediction
error is selected. Then, it finds the best pair of attributes,assuming that the first member of each pair is . For
each pair, the optimal correlation coefficients are computedand the pair with the least prediction error is selected. Theprocess is repeated as long as the added correlations arestatistically significant. Stepwise regression ensures thatlinearly dependent variables are excluded and dataredundancy is kept minimal.
Forward stepwise regression for shale volume ( )
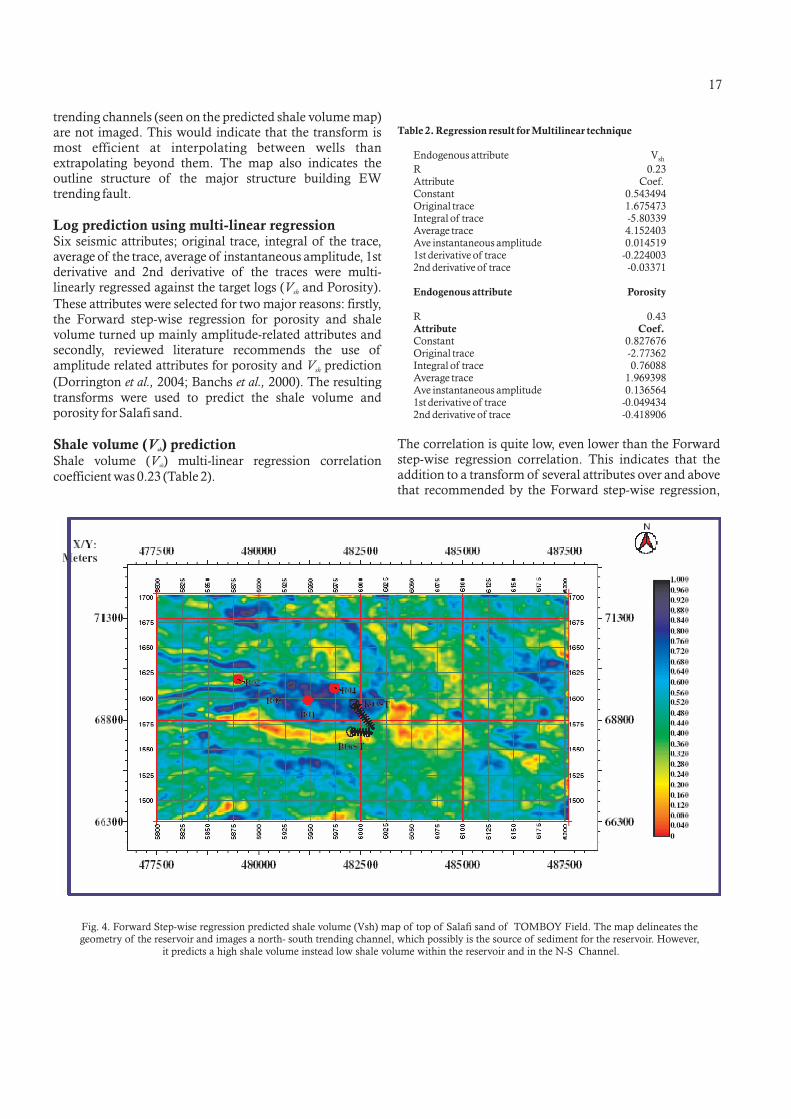
prediction (Table 1) resulted in the selection (from an initiallist) of the 1st derivative of the trace and average frequencywith a regression correlation of 0.272. The correlation issignificantly low. It is also noted that the first member of theregression has a large negative correlation. This wouldpossibly skew the outcome of a prediction attempt using thiscombination of attributes. At best, using this attributescombination for reservoir property prediction will onlypresent a picture of the subsurface lithologic situationbearing 27% percent similarity to actual conditions. Figure 4is the predicted V map of Salafi sand (drawn using
Kingdom Suite 7.3). The map shows high , ( 50%) within
the reservoir region penetrated by hydrocarbon bearingwells B1, B4 and B5 and medium (25-45%) for regions
penetrated by non-hydrocarbon bearing wells B3 and B6. Italso shows clean sands south and east of the reservoirregion. This was found to be in conflict with wellinformation. It is noted that the map delineates the reservoir
et al.
et al.
et
al.
attribute
attribute
V
V
V
1
1
sh
sh
sh
sh
region quite well and also images a North-South trendingchannel which possibly supplied the sands for the reservoiraccumulation. It further delineates several channels to thewest of the reservoir accumulation which served as paleo-drainage for the reservoir region. However, there is apolarity reversal in the result, predicting high in place of
expected low . The algorithm used actually computes the
correlation coefficient as the square-root of the square ofthe Pearson's product correlation moment coefficient.Whenever this is the case, the possibility of masking anegative correlation coefficient occurs and caution has tobe observed. The reservoir geometry imaging and logproperty distribution pattern the transforms results in, willstill be same and though a positive correlation were thecase. However, in visualizing the result care must be takenin choosing a display bar and interpreting the resultquantitatively.
Forward stepwise regression for porosity prediction (Table1) resulted in the selection of five attributes: 2nd derivativeof trace, average frequency, original trace, integral of traceand average instantaneous amplitude with a correlationcoefficient of 0.46. The result is significant with aprediction power of forty-six percent (46%).
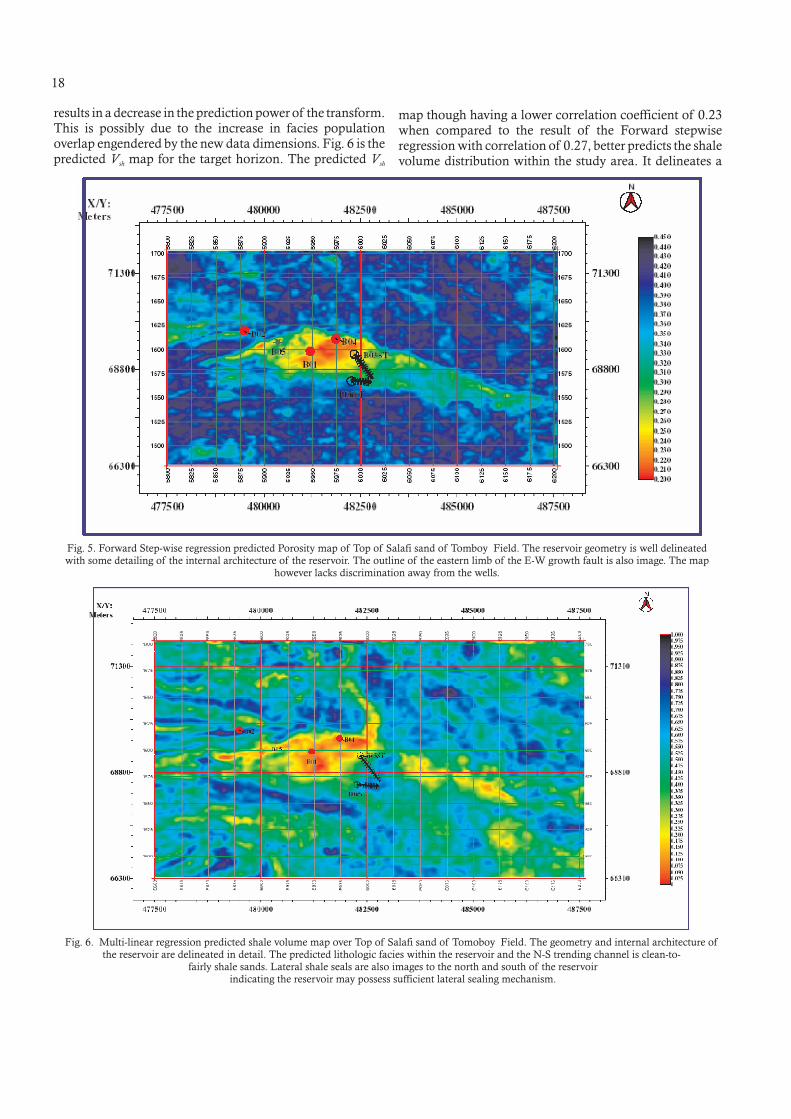
Fig. 5 is the predicted porosity map over Salafi sand. Themap delineates the reservoir outline showing the porosityof likely hydrocarbon bearing sands interspaced withhigher porosity. The hydrocarbon bearing zones in wellsB1, B4 and B5 are shown to be in porosity zones withpredicted porosities in the range of 20-25% and the non-hydrocarbon bearing wells (B3 and B6) are drilled inregions of relatively higher porosities in the range of 27-35%. This result indicates clean producing sands in thestudy area are associated with lower porosities compared toshales. This corroborates with the result of the rock physicscross-plot of P-wave impedance versus porosity in Fig. 2. Itis noted that the map lacks discrimination away from wellcontrol and the N-S trending feeder channel and E-W
V
Vsh
sh
Porosity prediction
Table 1. Regression result for Forward-step-wise technique
Endogenous attribute V
Attribute Coef.
Endogenous attribute Porosity
sh
R 0.272
Constant 0.5102691st Derivative of trace -0.26581Average freq 0.191512
R 0.46Attribute Coef.Constant 0.9235742nd Derivative -0.57336Average frequency 0.255129Trace -2.450962Integral of trace 2.242295Average instantaneous amplitude 0.120836
17
trending channels (seen on the predicted shale volume map)are not imaged. This would indicate that the transform ismost efficient at interpolating between wells thanextrapolating beyond them. The map also indicates theoutline structure of the major structure building EWtrending fault.
Six seismic attributes; original trace, integral of the trace,average of the trace, average of instantaneous amplitude, 1stderivative and 2nd derivative of the traces were multi-linearly regressed against the target logs ( and Porosity).
These attributes were selected for two major reasons: firstly,the Forward step-wise regression for porosity and shalevolume turned up mainly amplitude-related attributes andsecondly, reviewed literature recommends the use ofamplitude related attributes for porosity and prediction
(Dorrington 2004; Banchs 2000). The resulting
transforms were used to predict the shale volume andporosity for Salafi sand.
Shale volume ( ) multi-linear regression correlation
coefficient was 0.23 (Table 2).
Log prediction using multi-linear regression
Shale volume ( ) prediction
V
V
et al., et al.,
V
sh
sh
Vsh
sh
Table 2. Regression result for Multilinear technique
Endogenous attribute Porosity
Attribute Coef.
Endogenous attribute V
R 0.23Attribute Coef.Constant 0.543494Original trace 1.675473Integral of trace -5.80339Average trace 4.152403Ave instantaneous amplitude 0.0145191st derivative of trace -0.2240032nd derivative of trace -0.03371
R 0.43
Constant 0.827676Original trace -2.77362Integral of trace 0.76088Average trace 1.969398Ave instantaneous amplitude 0.1365641st derivative of trace -0.0494342nd derivative of trace -0.418906
sh
The correlation is quite low, even lower than the Forwardstep-wise regression correlation. This indicates that theaddition to a transform of several attributes over and abovethat recommended by the Forward step-wise regression,
Fig. 4. Forward Step-wise regression predicted shale volume (Vsh) map of top of Salafi sand of TOMBOY Field. The map delineates thegeometry of the reservoir and images a north- south trending channel, which possibly is the source of sediment for the reservoir. However,
it predicts a high shale volume instead low shale volume within the reservoir and in the N-S Channel.
18
Fig. 5. Forward Step-wise regression predicted Porosity map of Top of Salafi sand of Tomboy Field. The reservoir geometry is well delineatedwith some detailing of the internal architecture of the reservoir. The outline of the eastern limb of the E-W growth fault is also image. The map
however lacks discrimination away from the wells.
Fig. 6. Multi-linear regression predicted shale volume map over Top of Salafi sand of Tomoboy Field. The geometry and internal architecture ofthe reservoir are delineated in detail. The predicted lithologic facies within the reservoir and the N-S trending channel is clean-to-
fairly shale sands. Lateral shale seals are also images to the north and south of the reservoirindicating the reservoir may possess sufficient lateral sealing mechanism.
results in a decrease in the prediction power of the transform.This is possibly due to the increase in facies populationoverlap engendered by the new data dimensions. Fig. 6 is thepredicted map for the target horizon. The predictedV Vsh sh
map though having a lower correlation coefficient of 0.23when compared to the result of the Forward stepwiseregression with correlation of 0.27, better predicts the shalevolume distribution within the study area. It delineates a
19
reservoir geometry and horizon lithologic distributionpattern which is more geologically valid. The reservoir isdelineated as consisting of fairly clean to shaly sands. It alsodelineates a N-S trending clean sand-filled channel whichpossibly is the source of sediment fill for the reservoir andanother channel draining the reservoir, running in awestward direction. It also indicates other though smallerclean sand regions not tested by wells to the east of thereservoir region and lateral shale seals north and south of theknown reservoir. These predicted seals suggest that thereservoir possesses sufficient lateral sealing mechanisms.The map also shows the hydrocarbon-bearing wellspenetrate the reservoir regions with low shale volume (cleansands) of generally less than 20% and that the non-
hydrocarbon wells penetrate regions of high . Lithologic
discrimination away from the well region is improvedconsiderably compared to the Forward step-wise regression
map.
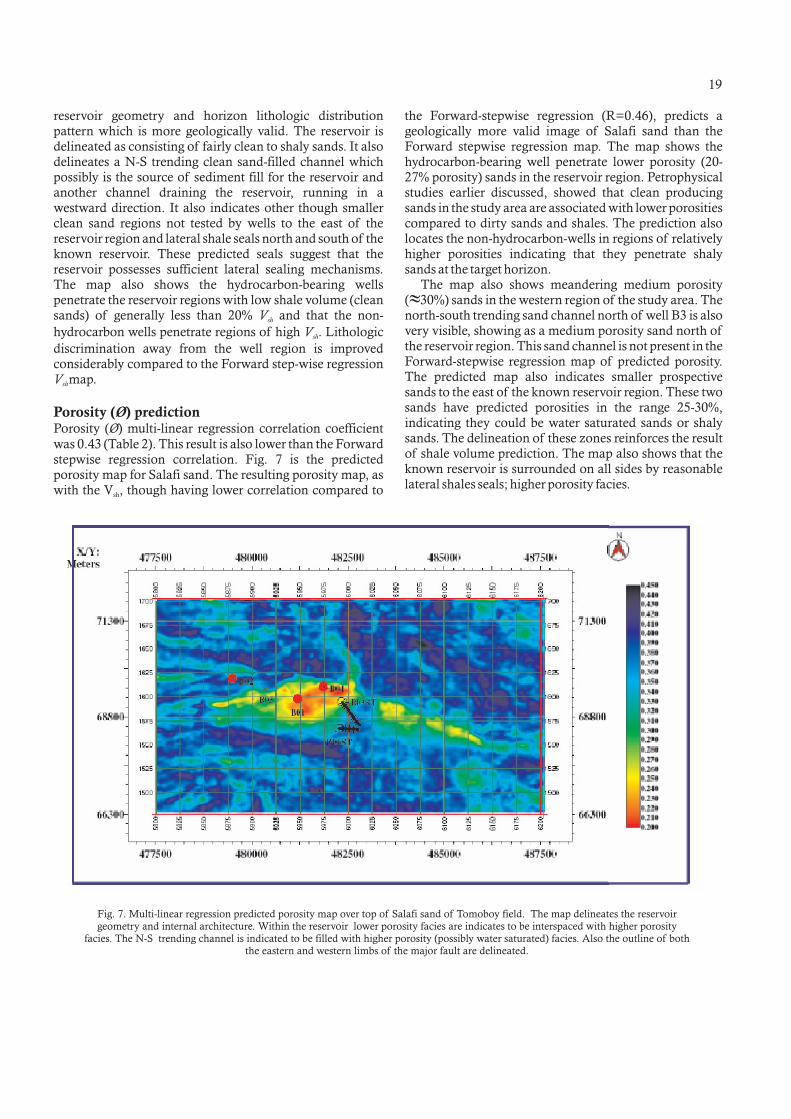
Porosity ( ) multi-linear regression correlation coefficient
was 0.43 (Table 2). This result is also lower than the Forwardstepwise regression correlation. Fig. 7 is the predictedporosity map for Salafi sand. The resulting porosity map, aswith the V , though having lower correlation compared to
V
V
V
Ø
sh
sh
sh
Porosity ( ) predictionØ
sh
the Forward-stepwise regression (R=0.46), predicts ageologically more valid image of Salafi sand than theForward stepwise regression map. The map shows thehydrocarbon-bearing well penetrate lower porosity (20-27% porosity) sands in the reservoir region. Petrophysicalstudies earlier discussed, showed that clean producingsands in the study area are associated with lower porositiescompared to dirty sands and shales. The prediction alsolocates the non-hydrocarbon-wells in regions of relativelyhigher porosities indicating that they penetrate shalysands at the target horizon.
The map also shows meandering medium porosity( 30%) sands in the western region of the study area. Thenorth-south trending sand channel north of well B3 is alsovery visible, showing as a medium porosity sand north ofthe reservoir region. This sand channel is not present in theForward-stepwise regression map of predicted porosity.The predicted map also indicates smaller prospectivesands to the east of the known reservoir region. These twosands have predicted porosities in the range 25-30%,indicating they could be water saturated sands or shalysands. The delineation of these zones reinforces the resultof shale volume prediction. The map also shows that theknown reservoir is surrounded on all sides by reasonablelateral shales seals; higher porosity facies.
»
Fig. 7. Multi-linear regression predicted porosity map over top of Salafi sand of Tomoboy field. The map delineates the reservoirgeometry and internal architecture. Within the reservoir lower porosity facies are indicates to be interspaced with higher porosity
facies. The N-S trending channel is indicated to be filled with higher porosity (possibly water saturated) facies. Also the outline of boththe eastern and western limbs of the major fault are delineated.
20
A striking feature about the multilinear regression maps( and porosity) is that the delineated reservoir geometry
and lithofacies distribution are very similar and thusengender greater confidence in the stability of theprediction. As earlier noted, shale volume and porosity arewell correlated in this Field. The eastern limb of the majorstructure building fault is also well imaged.
Multi-attributes transforms have been used for thepropagation of log properties across the whole field usingseismic data volume. The methodology proved to be a viabletool for achieving reasonable field-wide imaging of thedistribution of lithofacies of the Salafi sand of the TomboyField.
Multilinear regression transforms proved more efficientat achieving stable and geologically reasonable imaging of
Vsh
Conclusions
reservoir architecture and horizon lithofacies distributionpattern compared to Forward step-wise regressiontransforms. The step-wise regression achieved greaterstatistical correlation but the predictions are less stable duepossibly to the fewer resources (attributes) at its disposal.
Geologic validity needs be a pre-requisite for evaluatingthe accuracy or otherwise of any prediction result in orderto preclude spurious statistical correlations.
We appreciate Ricco Rakotomalala Lyon for the provisionof Tanagra 1.4 for research and teaching purposes and theOffice of the Shell Professor of Geophysics, ObafemiAwolowo University, Ile-Ife, for providing the KingdomSuite 7.3 used for this study.
Acknowledgements
BANCHS, R, E. and MICHELENA, R, J., 2002. From 3D seismicattributes to pseudo-well-log volumes using neural networks:Practical considerations. The Leading Edge, v. 21, No. 10, p. 996-1001.
DORRINGTON, K. P. and LINK, C. A., 2004. Genetic-algorithm/ neuralnetwork approach to seismic attribute selection for well-logprediction. Geophysics, v. 69, no. 1, p. 212-221.
EKWEOZOR, C. M. and DAUKORU, E. M., 1984. Petroleum source bedevaluation of Tertiary Niger Delta. American Association ofPetroleum Geologists Bulletin, v. 70, p.48-55.
GASTALDI, C., BIGUENET, J, P. and DE PAZZIS, L., 1997. Reservoircharacterization from seismic attributes: An example from PecikoField (Indonesia). The Leading Edge, v. 16, No. 03, p. 263-266.
HAMPSON, D. P., SCHUELKE, J. S. and QUIREIN, J. A., 2001 Use ofmultiattribute transforms to predict log properties from seismicdata. Geophysics, v. 66, no. 1, p. 220-236.
LIU, Z. and LIU, J., 1998. Seismic-controlled nonlinear extrapolation ofwell parameters using neural networks. Geophysics, v. 63, no. 6, p.2035-2041.
SHORT, K.C., and STAUBLE, A. J., 1967. Outline of geology of NigerDelta. American Association of Petroleum Geologist Bulletin,v.51, p 761-799.
TANER, M. T., KOEHLER, F. and SHERIFF, R. E., 1979. Complextrace analysis. Geophysics, v. 44, No. 06, p. 1041-1063.
References
Received 21 January, 2008; Revision accepted 2 January, 2009

Related Documents