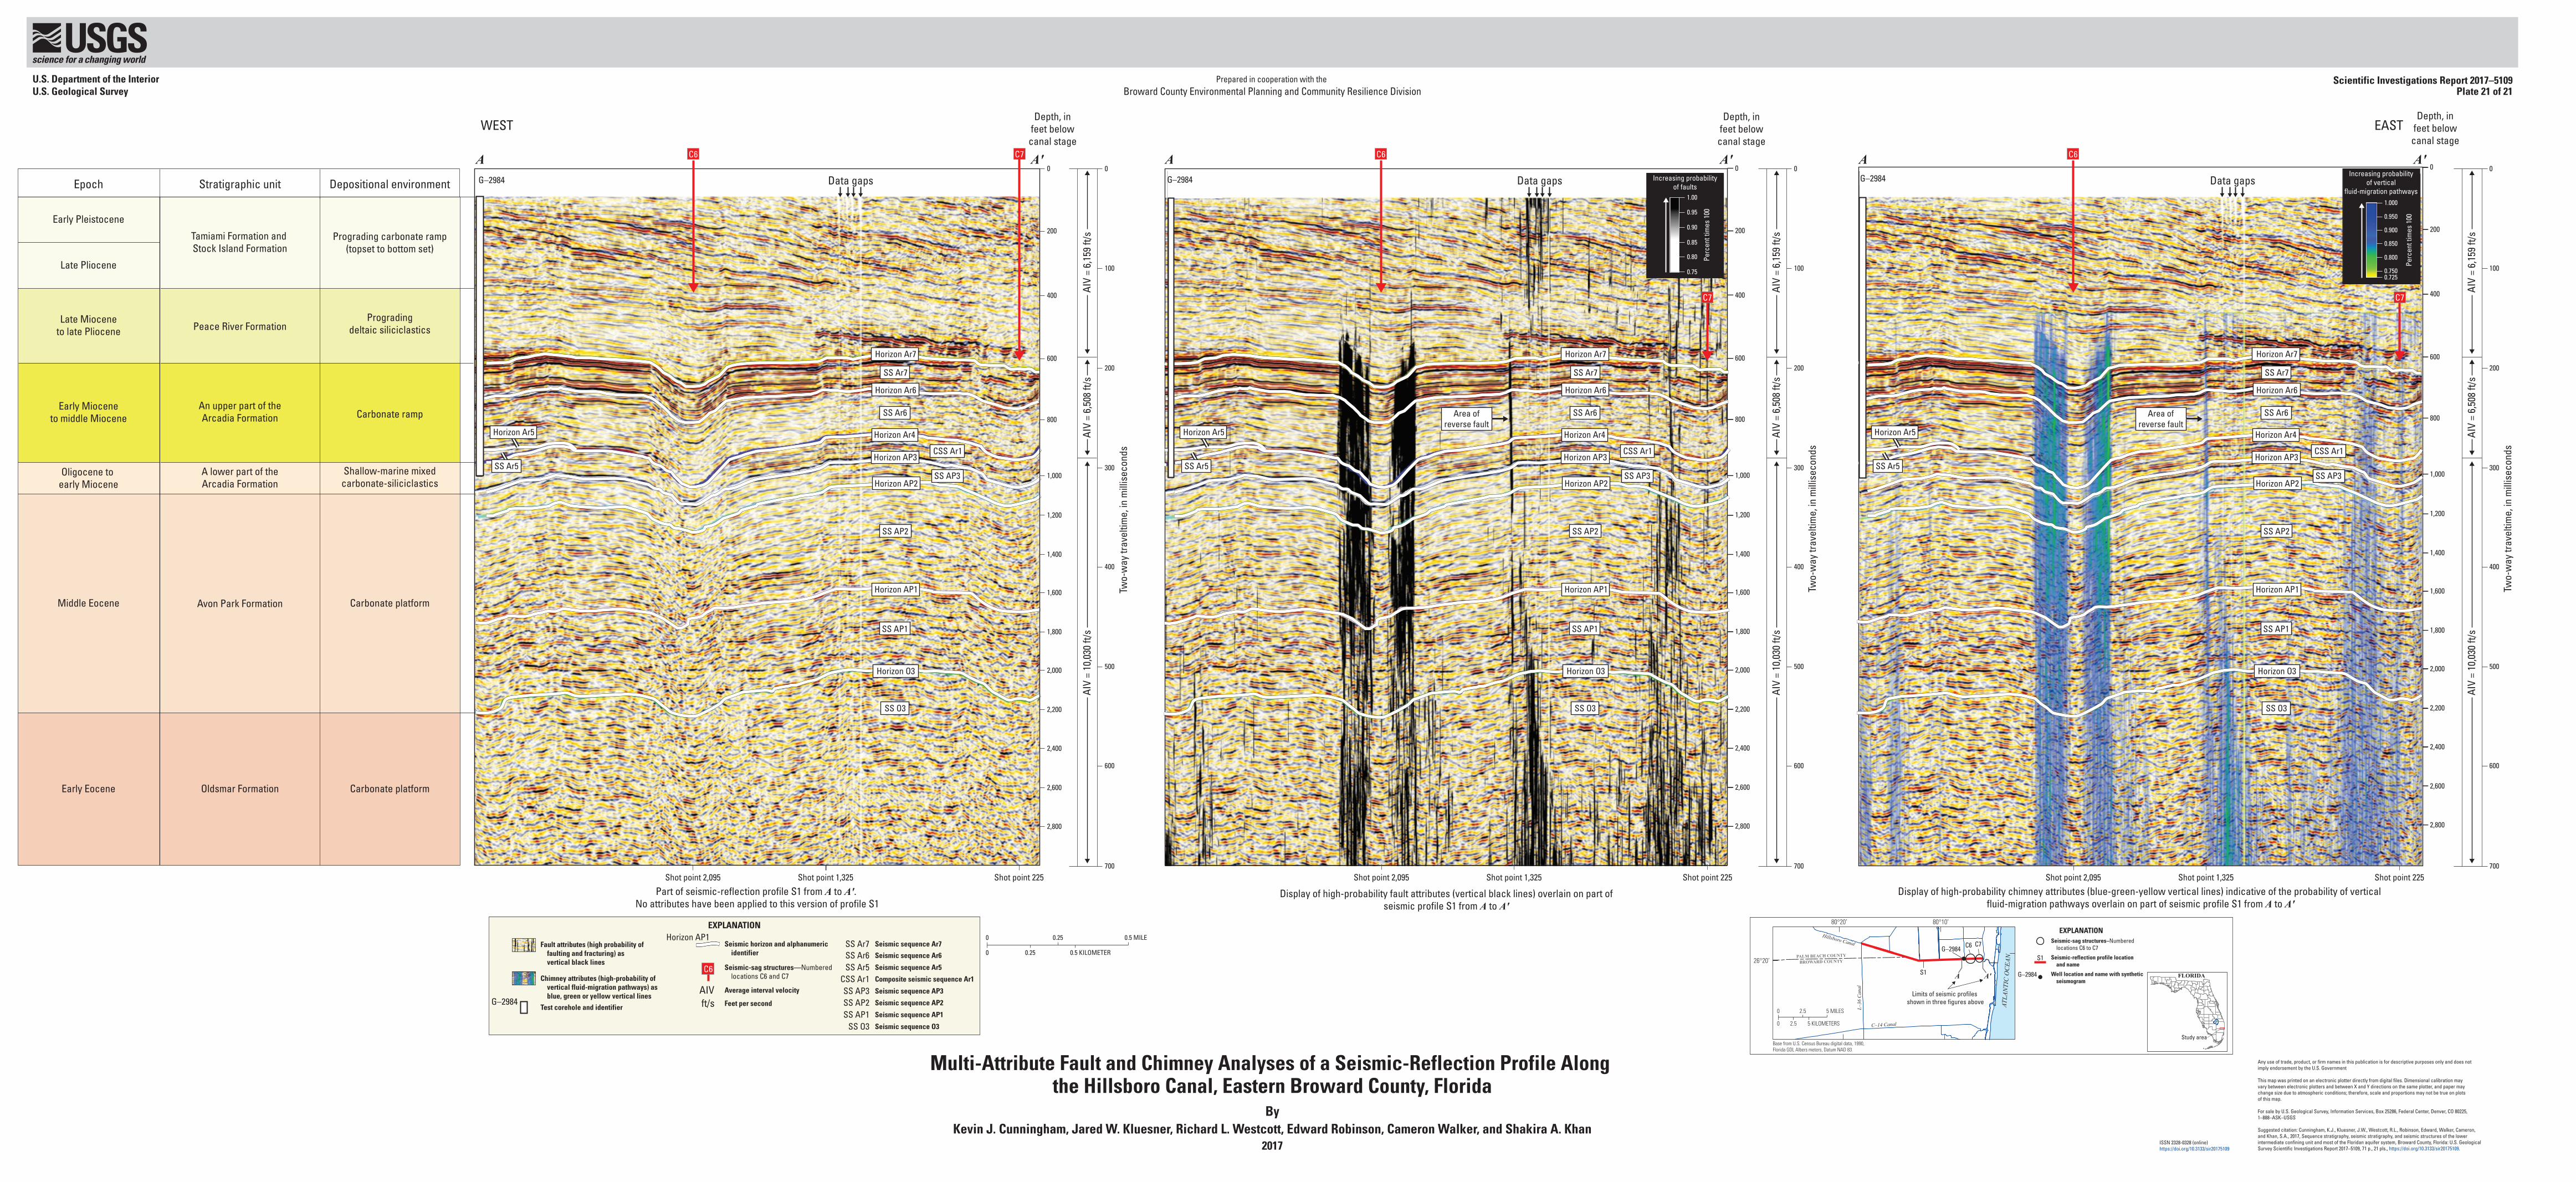
0.950 0.900 0.850 0.800 0.750 0.725 1.000 G–2984 0 0 100 200 300 400 500 600 700 200 Percent times 100 Percent times 100 400 600 800 1,000 1,200 1,400 1,600 1,800 2,000 2,200 2,400 2,600 2,800 AIV = 6,159 ft/s AIV = 6,508 ft/s AIV = 10,030 ft/s Depth, in feet below canal stage Data gaps Increasing probability of faults 1.00 0.95 0.90 0.85 0.80 0.75 C7 Increasing probability of vertical fluid-migration pathways G–2984 0 0 100 200 300 400 500 600 700 200 400 600 800 1,000 1,200 1,400 1,600 1,800 2,000 2,200 2,400 2,600 2,800 Depth, in feet below canal stage Two-way traveltime, in milliseconds AIV = 6,159 ft/s AIV = 6,508 ft/s AIV = 10,030 ft/s Data gaps G–2984 0 0 100 200 300 400 500 600 700 200 400 600 800 1,000 1,200 1,400 1,600 1,800 2,000 2,200 2,400 2,600 2,800 Two-way traveltime, in milliseconds Two-way traveltime, in milliseconds Data gaps AIV = 6,159 ft/s AIV = 6,508 ft/s AIV = 10,030 ft/s Middle Eocene Carbonate platform Carbonate platform Oldsmar Formation Early Eocene Tamiami Formation and Stock Island Formation Stratigraphic unit Early Pleistocene Epoch Prograding carbonate ramp (topset to bottom set) Depositional environment Prograding deltaic siliciclastics Late Miocene to late Pliocene Peace River Formation An upper part of the Arcadia Formation Early Miocene to middle Miocene Carbonate ramp Shallow-marine mixed carbonate-siliciclastics Oligocene to early Miocene A lower part of the Arcadia Formation Avon Park Formation Late Pliocene Horizon Ar7 Horizon Ar6 Horizon AP3 Horizon AP2 Horizon AP1 Horizon O3 Horizon Ar4 Area of reverse fault Area of reverse fault Horizon Ar5 SS Ar7 SS Ar6 SS AP3 SS AP2 SS AP1 SS O3 CSS Ar1 SS Ar5 Horizon Ar7 Horizon Ar6 Horizon AP3 Horizon AP2 Horizon AP1 Horizon O3 Horizon Ar4 Horizon Ar5 SS Ar7 SS Ar6 SS AP3 SS AP2 SS AP1 SS O3 CSS Ar1 SS Ar5 Horizon Ar7 Horizon Ar6 Horizon AP3 Horizon AP2 Horizon AP1 Horizon O3 Horizon Ar4 Horizon Ar5 SS Ar7 SS Ar6 SS AP3 SS AP2 SS AP1 SS O3 CSS Ar1 SS Ar5 C6 C7 C7 C6 C6 WEST Display of high-probability fault attributes (vertical black lines) overlain on part of seismic profile S1 from A to A' Display of high-probability chimney attributes (blue-green-yellow vertical lines) indicative of the probability of vertical fluid-migration pathways overlain on part of seismic profile S1 from A to A' A A' A A' A A' EAST Part of seismic-reflection profile S1 from A to A'. No attributes have been applied to this version of profile S1 Depth, in feet below canal stage Shot point 1,325 Shot point 2,095 Shot point 225 Shot point 1,325 Shot point 2,095 Shot point 225 Shot point 1,325 Shot point 2,095 Shot point 225 ATLANTIC OCEAN BROWARD COUNTY PALM BEACH COUNTY Hillsboro Canal C–14 Canal L–36 Canal G–2984 A A' 0 5 MILES 0 2.5 2.5 5 KILOMETERS C6 S1 C7 Limits of seismic profiles shown in three figures above 80°20’ 80°10’ 26°20’ FLORIDA Study area EXPLANATION Seismic-sag structures–Numbered locations C6 to C7 S1 Seismic-reflection profile location and name Well location and name with synthetic seismogram G–2984 Base from U.S. Census Bureau digital data, 1990, Florida GDL Albers meters, Datum NAD 83 Scientific Investigations Report 2017–5109 Plate 21 of 21 U.S. Department of the Interior U.S. Geological Survey Prepared in cooperation with the Broward County Environmental Planning and Community Resilience Division Multi-Attribute Fault and Chimney Analyses of a Seismic-Reflection Profile Along the Hillsboro Canal, Eastern Broward County, Florida By Kevin J. Cunningham, Jared W. Kluesner, Richard L. Westcott, Edward Robinson, Cameron Walker, and Shakira A. Khan 2017 Any use of trade, product, or firm names in this publication is for descriptive purposes only and does not imply endorsement by the U.S. Government This map was printed on an electronic plotter directly from digital files. Dimensional calibration may vary between electronic plotters and between X and Y directions on the same plotter, and paper may change size due to atmospheric conditions; therefore, scale and proportions may not be true on plots of this map. For sale by U.S. Geological Survey, Information Services, Box 25286, Federal Center, Denver, CO 80225, 1–888–ASK–USGS Suggested citation: Cunningham, K.J., Kluesner, J.W., Westcott, R.L., Robinson, Edward, Walker, Cameron, and Khan, S.A., 2017, Sequence stratigraphy, seismic stratigraphy, and seismic structures of the lower intermediate confining unit and most of the Floridan aquifer system, Broward County, Florida: U.S. Geological Survey Scientific Investigations Report 2017–5109, 71 p., 21 pls., https://doi.org/10.3133/sir20175109. Seismic sequence AP3 Seismic sequence AP2 Seismic sequence AP1 SS AP3 SS AP2 SS AP1 Seismic sequence O3 SS O3 SS Ar7 Composite seismic sequence Ar1 Seismic sequence Ar7 SS Ar6 Seismic sequence Ar6 SS Ar5 Seismic sequence Ar5 CSS Ar1 Fault attributes (high probability of faulting and fracturing) as vertical black lines Chimney attributes (high-probability of vertical fluid-migration pathways) as blue, green or yellow vertical lines EXPLANATION AIV Average interval velocity ft/s Feet per second Test corehole and identifier Seismic-sag structures—Numbered locations C6 and C7 C6 0 0.5 MILE 0 0.5 KILOMETER 0.25 0.25 Seismic horizon and alphanumeric identifier Horizon AP1 G–2984 ISSN 2328-0328 (online) https://doi.org/10.3133/sir20175109

Welcome message from author
This document is posted to help you gain knowledge. Please leave a comment to let me know what you think about it! Share it to your friends and learn new things together.
Transcript
0.950
0.900
0.850
0.800
0.7500.725
1.000
G–29840 0
100
200
300
400
500
600
700
200
Perc
ent t
imes
100
Perc
ent t
imes
100
400
600
800
1,000
1,200
1,400
1,600
1,800
2,000
2,200
2,400
2,600
2,800
AIV
= 6,
159
ft/s
AIV
= 6,
508
ft/s
AIV
= 10
,030
ft/s
Depth, infeet belowcanal stage
Data gaps Increasing probabilityof faults
1.00
0.95
0.90
0.85
0.80
0.75
C7
Increasing probability of vertical
fluid-migration pathways G–2984
0 0
100
200
300
400
500
600
700
200
400
600
800
1,000
1,200
1,400
1,600
1,800
2,000
2,200
2,400
2,600
2,800
Depth, infeet below
canal stage
Two-
way
trav
eltim
e, in
mill
isec
onds
AIV
= 6,
159
ft/s
AIV
= 6,
508
ft/s
AIV
= 10
,030
ft/s
Data gaps G–29840 0
100
200
300
400
500
600
700
200
400
600
800
1,000
1,200
1,400
1,600
1,800
2,000
2,200
2,400
2,600
2,800
Two-
way
trav
eltim
e, in
mill
isec
onds
Two-
way
trav
eltim
e, in
mill
isec
onds
Data gaps
AIV
= 6,
159
ft/s
AIV
= 6,
508
ft/s
AIV
= 10
,030
ft/s
Middle Eocene Carbonate platform
Carbonate platformOldsmar FormationEarly Eocene
Tamiami Formation and Stock Island Formation
Stratigraphic unit
Early Pleistocene
Epoch
Prograding carbonate ramp(topset to bottom set)
Depositional environment
Progradingdeltaic siliciclastics
Late Mioceneto late Pliocene Peace River Formation
An upper part of theArcadia Formation
Early Mioceneto middle Miocene Carbonate ramp
Shallow-marine mixedcarbonate-siliciclastics
Oligocene to early Miocene
A lower part of theArcadia Formation
Avon Park Formation
Late Pliocene
Horizon Ar7
Horizon Ar6
Horizon AP3
Horizon AP2
Horizon AP1
Horizon O3
Horizon Ar4
Area ofreverse fault
Area ofreverse fault
Horizon Ar5
SS Ar7
SS Ar6
SS AP3
SS AP2
SS AP1
SS O3
CSS Ar1
SS Ar5
Horizon Ar7
Horizon Ar6
Horizon AP3
Horizon AP2
Horizon AP1
Horizon O3
Horizon Ar4Horizon Ar5
SS Ar7
SS Ar6
SS AP3
SS AP2
SS AP1
SS O3
CSS Ar1
SS Ar5
Horizon Ar7
Horizon Ar6
Horizon AP3
Horizon AP2
Horizon AP1
Horizon O3
Horizon Ar4Horizon Ar5
SS Ar7
SS Ar6
SS AP3
SS AP2
SS AP1
SS O3
CSS Ar1
SS Ar5
C6 C7
C7
C6 C6
WEST
Display of high-probability fault attributes (vertical black lines) overlain on part ofseismic profile S1 from A to A'
Display of high-probability chimney attributes (blue-green-yellow vertical lines) indicative of the probability of vertical fluid-migration pathways overlain on part of seismic profile S1 from A to A'
A A' A A' A A'
EAST
Part of seismic-reflection profile S1 from A to A'. No attributes have been applied to this version of profile S1
Depth, infeet belowcanal stage
Shot point 1,325Shot point 2,095 Shot point 225Shot point 1,325Shot point 2,095Shot point 225Shot point 1,325Shot point 2,095 Shot point 225
ATLA
NTI
C O
CEA
N
BROWARD COUNTYPALM BEACH COUNTY
Hillsboro Canal
C–14 Canal
L–36
Can
al
SUN-I3
G–2984
A A'
0 5 MILES
0 2.5
2.5
5 KILOMETERS
C6
S1
C7
Limits of seismic profiles shown in three figures above
80°20’ 80°10’
26°20’
FLORIDA
Study area
EXPLANATIONSeismic-sag structures–Numbered locations C6 to C7
S1 Seismic-reflection profile location and name
Well location and name with synthetic seismogram
G–2984
Base from U.S. Census Bureau digital data, 1990, Florida GDL Albers meters, Datum NAD 83
Scientific Investigations Report 2017–5109Plate 21 of 21
U.S. Department of the InteriorU.S. Geological Survey
Prepared in cooperation with the Broward County Environmental Planning and Community Resilience Division
Multi-Attribute Fault and Chimney Analyses of a Seismic-Reflection Profile Along the Hillsboro Canal, Eastern Broward County, Florida
ByKevin J. Cunningham, Jared W. Kluesner, Richard L. Westcott, Edward Robinson, Cameron Walker, and Shakira A. Khan
2017
Any use of trade, product, or firm names in this publication is for descriptive purposes only and does not imply endorsement by the U.S. Government
This map was printed on an electronic plotter directly from digital files. Dimensional calibration may vary between electronic plotters and between X and Y directions on the same plotter, and paper may change size due to atmospheric conditions; therefore, scale and proportions may not be true on plots of this map.
For sale by U.S. Geological Survey, Information Services, Box 25286, Federal Center, Denver, CO 80225, 1–888–ASK–USGS
Suggested citation: Cunningham, K.J., Kluesner, J.W., Westcott, R.L., Robinson, Edward, Walker, Cameron, and Khan, S.A., 2017, Sequence stratigraphy, seismic stratigraphy, and seismic structures of the lower intermediate confining unit and most of the Floridan aquifer system, Broward County, Florida: U.S. Geological Survey Scientific Investigations Report 2017–5109, 71 p., 21 pls., https://doi.org/10.3133/sir20175109.
Seismic sequence AP3
Seismic sequence AP2
Seismic sequence AP1
SS AP3SS AP2SS AP1
Seismic sequence O3SS O3
SS Ar7
Composite seismic sequence Ar1
Seismic sequence Ar7
SS Ar6 Seismic sequence Ar6
SS Ar5 Seismic sequence Ar5
CSS Ar1
Fault attributes (high probability of faulting and fracturing) as vertical black lines
Chimney attributes (high-probability of vertical fluid-migration pathways) as blue, green or yellow vertical lines
EXPLANATION
AIV Average interval velocity
ft/s Feet per secondTest corehole and identifier
Seismic-sag structures—Numbered locations C6 and C7
C6
0 0.5 MILE
0 0.5 KILOMETER0.25
0.25Seismic horizon and alphanumeric identifier
Horizon AP1
G–2984
ISSN 2328-0328 (online)https://doi.org/10.3133/sir20175109
Related Documents