1 MU AND KAPPA OPIOIDS INDUCE THE DIFFERENTIATION OF EMBRYONIC STEM CELLS TO NEURAL PROGENITORS* Eunhae Kim ‡ , Amy L. Clark ‡ , Alexi Kiss ‡ , Jason W. Hahn ‡ , Robin Wesselschmidt † , Carmine J. Coscia ‡ and Mariana M. Belcheva ‡ From the ‡ E. A. Doisy Department of Biochemistry and Molecular Biology, Saint Louis University School of Medicine, St. Louis, MO, 63104 and † Primogenix, Inc., Los Angeles, CA, 90033 Running title: Opioids induce ES cell differentiation Address correspondence to: Mariana M. Belcheva, Department of Biochemistry and Molecular Biology, St. Louis University School of Medicine, 1402 S. Grand Blvd., St. Louis, MO, 63104; Tel. 314-977-9256; Fax. 314-977-9205; E-mail: [email protected] Growth factors, hormones and neurotransmitters have been implicated in the regulation of stem cell fate. Since various neural precursors express functional neurotransmitter receptors, which include G protein coupled receptors (GPCRs), it is anticipated that they are involved in cell fate decisions. We detected μ opioid receptor (MOR-1) and κ opioid receptor (KOR-1) expression and immunoreactivity in embryonic stem (ES) cells and in retinoic acid induced ES cell-derived, nestin-positive, neural progenitors. Moreover, these GPCRs are functional as [D-ala 2 ,mephe 4 ,gly-ol 5 ] enkephalin, (DAMGO) a MOR selective agonist and U69,593, a KOR selective agonist induce a sustained activation of extracellular signal-regulated kinase (ERK) signaling throughout a 24 h treatment period in undifferentiated, self-renewing ES cells. Both opioids promote limited proliferation of undifferentiated ES cells via the ERK/MAP kinase signaling pathway. Importantly, biochemical and immunofluorescence data suggest that DAMGO and U69, 593 divert ES cells from self-renewal and coax the cells to differentiate. In retinoic acid-differentiated ES cells, opioid-induced signaling features a biphasic ERK activation profile and an opioid- induced, ERK independent inhibition of proliferation in these neural progenitors. Collectively, the data suggest that opioids may have opposite effects on ES cell self-renewal and ES cell differentiation and ERK activation is only required by the latter. Finally, opioid modulation of ERK activity may play an important role in ES cell fate decisions by directing the cells to specific lineages. The maintenance of ES cells in an undifferentiated state in vitro is dependent on self- renewing cell division in the presence of leukemia inhibitory factor (LIF) 1 , which signals through various receptor complexes (reviewed in 1-3, see also 4, 5). Mouse ES cells can be induced to differentiate into neural cells in the presence of retinoic acid (RA) in vitro (reviewed in 6, 7). During this induction, ES cells undergo a series of steps that resemble key stages in the early mouse embryo, supporting the hypothesis that the in vitro pathway represents the normal developmental pathway (8, 9). Considerable effort has been recently devoted to characterizing intrinsic, extrinsic factors and signaling pathways regulating proliferation and differentiation of stem cells. The ERK/MAP kinase signaling pathway has been implicated in both proliferation and differentiation of many cell types, including stem cells (10). In several studies ERK activation had a negative influence on self-renewal/proliferation in murine ES cells (4, 11-14). Moreover, LIF-dependent activation of STAT3 was not mediated by ERK activity (15). However, a dual role for the Ras/ERK pathway was proposed for ES cells, affecting both their division and differentiation (16). Ras activation down-regulated levels of Nanog, a protein that is normally expressed in high amounts in self-renewing ES cells (17). A functional role for ERK was proposed in the PI3K dependent regulation of ES cell self-renewal (18). The importance of ERK activation and its duration for cell differentiation has been investigated in various cells (19-22). Some evidence suggests that RA-induced inhibition of LIF signaling in ES cells is ERK independent (23). However, a specific requirement of the ERK pathway was reported for RA-dependent commitment of murine ES cells http://www.jbc.org/cgi/doi/10.1074/jbc.M603862200 The latest version is at JBC Papers in Press. Published on September 1, 2006 as Manuscript M603862200 Copyright 2006 by The American Society for Biochemistry and Molecular Biology, Inc. by guest on April 5, 2020 http://www.jbc.org/ Downloaded from

Welcome message from author
This document is posted to help you gain knowledge. Please leave a comment to let me know what you think about it! Share it to your friends and learn new things together.
Transcript

1
MU AND KAPPA OPIOIDS INDUCE THE DIFFERENTIATION OF
EMBRYONIC STEM CELLS TO NEURAL PROGENITORS* Eunhae Kim
‡, Amy L. Clark
‡, Alexi Kiss
‡, Jason W. Hahn
‡, Robin Wesselschmidt
†, Carmine J.
Coscia‡ and Mariana M. Belcheva
‡
From the ‡E. A. Doisy Department of Biochemistry and Molecular Biology, Saint Louis University
School of Medicine, St. Louis, MO, 63104 and †Primogenix, Inc., Los Angeles, CA, 90033
Running title: Opioids induce ES cell differentiation
Address correspondence to: Mariana M. Belcheva, Department of Biochemistry and Molecular Biology, St.
Louis University School of Medicine, 1402 S. Grand Blvd., St. Louis, MO, 63104; Tel. 314-977-9256; Fax.
314-977-9205; E-mail: [email protected]
Growth factors, hormones and
neurotransmitters have been implicated in the
regulation of stem cell fate. Since various
neural precursors express functional
neurotransmitter receptors, which include G
protein coupled receptors (GPCRs), it is
anticipated that they are involved in cell fate
decisions. We detected µ opioid receptor
(MOR-1) and κ opioid receptor (KOR-1)
expression and immunoreactivity in embryonic
stem (ES) cells and in retinoic acid induced ES
cell-derived, nestin-positive, neural progenitors.
Moreover, these GPCRs are functional as
[D-ala2,mephe
4,gly-ol
5] enkephalin, (DAMGO)
a MOR selective agonist and U69,593, a KOR
selective agonist induce a sustained activation
of extracellular signal-regulated kinase (ERK)
signaling throughout a 24 h treatment period in
undifferentiated, self-renewing ES cells. Both
opioids promote limited proliferation of
undifferentiated ES cells via the ERK/MAP
kinase signaling pathway. Importantly,
biochemical and immunofluorescence data
suggest that DAMGO and U69, 593 divert ES
cells from self-renewal and coax the cells to
differentiate. In retinoic acid-differentiated ES
cells, opioid-induced signaling features a
biphasic ERK activation profile and an opioid-
induced, ERK independent inhibition of
proliferation in these neural progenitors.
Collectively, the data suggest that opioids may
have opposite effects on ES cell self-renewal
and ES cell differentiation and ERK activation
is only required by the latter. Finally, opioid
modulation of ERK activity may play an
important role in ES cell fate decisions by
directing the cells to specific lineages.
The maintenance of ES cells in an
undifferentiated state in vitro is dependent on self-
renewing cell division in the presence of leukemia
inhibitory factor (LIF)1, which signals through
various receptor complexes (reviewed in 1-3, see
also 4, 5). Mouse ES cells can be induced to
differentiate into neural cells in the presence of
retinoic acid (RA) in vitro (reviewed in 6, 7).
During this induction, ES cells undergo a series of
steps that resemble key stages in the early mouse
embryo, supporting the hypothesis that the in vitro
pathway represents the normal developmental
pathway (8, 9).
Considerable effort has been recently
devoted to characterizing intrinsic, extrinsic
factors and signaling pathways regulating
proliferation and differentiation of stem cells. The
ERK/MAP kinase signaling pathway has been
implicated in both proliferation and differentiation
of many cell types, including stem cells (10). In
several studies ERK activation had a negative
influence on self-renewal/proliferation in murine
ES cells (4, 11-14). Moreover, LIF-dependent
activation of STAT3 was not mediated by ERK
activity (15). However, a dual role for the
Ras/ERK pathway was proposed for ES cells,
affecting both their division and differentiation
(16). Ras activation down-regulated levels of
Nanog, a protein that is normally expressed in
high amounts in self-renewing ES cells (17). A
functional role for ERK was proposed in the PI3K
dependent regulation of ES cell self-renewal (18).
The importance of ERK activation and its duration
for cell differentiation has been investigated in
various cells (19-22). Some evidence suggests that
RA-induced inhibition of LIF signaling in ES cells
is ERK independent (23). However, a specific
requirement of the ERK pathway was reported for
RA-dependent commitment of murine ES cells
http://www.jbc.org/cgi/doi/10.1074/jbc.M603862200The latest version is at JBC Papers in Press. Published on September 1, 2006 as Manuscript M603862200
Copyright 2006 by The American Society for Biochemistry and Molecular Biology, Inc.
by guest on April 5, 2020
http://ww
w.jbc.org/
Dow
nloaded from

2
(24). Crosstalk may occur by non-cannonical
actions of RA with the MAP kinase
phosphorylation cascade. RA-induced
differentiation of ES cells may be achieved by
restricting nuclear entry of activated ERK (25).
ERK activation is required for regulation of cyclin
D1 levels, the increase of which parallels ES cell
differentiation (26, 27).
Neurotransmitters as well as growth factors
and hormones can influence cell division and
differentiation of self-renewing stem cells and
neural progenitors (NPs) via ERK in some cases
(28, 29). For example, stimulation of the
muscarinic acetylcholine receptor, a GPCR,
induces DNA synthesis in rat cortical
neuroepithelium progenitors via stimulation of
PI3K and ERK (30). The activated CB1 receptor
inhibits neuronal progenitor differentiation via
attenuation of ERK signaling in E17 cortical
cultures and in adult dentate gyrus (31). This
endocannabinoid system was also found to
promote astroglial differentiation by acting on
neural progenitor cells (32). Glutamate activates
NMDA receptors and promotes proliferation of
E15 precursors derived from the germinal zone of
the ventral telencephalon in vivo and in vitro (33).
Haloperidol acting via dopamine D2 receptors
increases the number of NPs, neurons and glia in
adult rat brain (34). G protein βγ subunits of
heterotrimeric G proteins are required for proper
mitotic-spindle orientation and asymmetric cell
fate decisions of cerebral cortical progenitors (35).
These studies were performed with brain derived
stem cells or NPs, but little is known about the
consequences of GPCR-ERK crosstalk in
blastocyst-derived ES cells or their NPs. Since the plasticity of uncommitted stem cells
has opened new perspectives in tissue
regeneration, recent research has been directed to
understand the signaling mechanisms that control
proliferation and/or differentiation of ES cells.
Here, we detected µ and κ ORs in ES cells and in
ES cell-derived NPs. More importantly, we found
that both opioids induced ES cell differentiation
via ERK and an ERK independent attenuation of
proliferation in RA-driven NPs
EXPERIMENTAL PROCEDURES
Mouse ES cells and their growth conditions: D3 (ATCC) and PRX-129/S6 # 7 ES cells
(Primogenix, Inc.) were used. PRX-129/S6 # 7 ES
cells were isolated from the inner cell mass of day
3.5 129/S6/SvEv mouse blastocyst. Cells have a
normal male karyotype and are specific pathogen-
free. They were injected into blastocysts and
produced chimeras at a high rate (first injection:
10/15 pups, no perinatal death). PRX-129/S6 # 7
cells were grown on mouse embryonic fibroblasts
(MEFs) in the presence of LIF, passage 10 cells
were propagated 2-3 times on gelatin-coated flasks
and these cells are currently used in the laboratory.
Quality control and characterization of the D3 ES
cells is documented by their depositor (36). D3
ES cells were propagated on irradiated STO cell
feeders (ATCC) for several passages before they
were transferred to gelatin-coated flasks.
D3 and PRX-129/S6 # 7 ES cells were
maintained in Dulbecco’s modified Eagles
medium (DMEM) containing 10% fetal calf
serum, LIF (100 ng/ml) and 0.1 mM 2-
mercaptoethanol (ME) on gelatin-coated dishes.
These growth conditions are known to prevent ES
cells from differentiating (6, 37, 38). Here, cells
grown under these conditions will be described as
“undifferentiated, self-renewing ES cells”.
The neural induction of ES cells entails the
“4-/4+ protocol” which has two phases (8, 39). In
the first phase, cells are cultured in non-adhesive,
bacterial grade Petri dishes in serum containing
media (without LIF and ME) in the absence of RA
for 4 days. During this phase, EBs of different
sizes appear. In the second phase, cells are grown
in RA (1 µM) and serum containing media for an
additional 4 days. Differentiation of these cells is
also a two-phase process: early differentiation,
during which nestin-positive cells develop and
their terminal differentiation is the final step in ES
cell growth. For this purpose, EBs are dissociated
and cultured on tissue culture plates in serum
containing DMEM for an additional 2-5 days
(short-term differentiation) or for 5-12 days (long-
term differentiation). The RA induced, short-term
differentiated cells are referred to as NPs.
Opioid treatments: ES cells or ES cell-
derived progenitors are maintained in their
corresponding growth media. Opioid agonists
(0.1-1 µM, DAMGO, a MOR selective agonist or
U69,593, a KOR selective agonist) were added for
various times (up to 24 h). In some experiments,
cells were pre-incubated with opioid antagonists (1
µM, 60 min, CTAP, MOR selective or nor-BNI,
by guest on April 5, 2020
http://ww
w.jbc.org/
Dow
nloaded from

3
KOR selective) and then treated with the
corresponding opioid agonist (0.1 µM) for a given
time.
Measurement of ERK activity: For these
experiments, cells were grown in six-well plates.
In most cases, ES cells were maintained in serum-
containing media upon opioid treatment. In
contrast, ES cell-derived NPs were grown in
media deprived of serum for 24 h before treatment
with opioids. ERK phosphorylation was measured
by performing immunoblotting experiments with a
phospho-ERK Ab that recognizes the active form
of ERK (40-42). Cells were washed with PBS,
lysed with buffer: 20 mM HEPES, 10 mM EGTA,
40 mM β-glycerophosphate, 2.5 mM MgCl2, 2
mM sodium vanadate, 1% Nonidet-40, 1 mM
PMSF, 20 µg/ml aprotinin and 20 µg/ml leupeptin,
spun at 14,000 g and protein concentration of the
supernatants was determined. Cell lysates (10-20
µg protein/lane) were separated by 10% SDS-
PAGE. Proteins were blotted on Immobilon
membranes. Nonspecific sites were blocked with
5% milk in Tris-buffered saline + 0.2% Tween 20.
Blots were incubated with monoclonal phospho-
ERK Ab (1:2000, Cell Signaling) for at least 15 h
at 4°C, followed by incubation with a HRP
conjugated IgG (1:2000, Sigma) for 1 h at room
temperature. Bands were visualized with an ECL
chemiluminescence detection system (GE
Healthcare) and exposure to Classic Blue sensitive
X-ray film. Band intensities were determined by
densitometry with a Kodak DC120 digital camera,
Kodak ds 1D version 3.0.2 (Scientific Imaging
Systems) and NIH Image ImageJ version 1.32
sofware. ERK stimulation in opioid-treated cells
was expressed as fold change over basal levels in
control cells.
OR and nestin immunofluorescence microscopy: ES cells or ES cell-derived NPs were
grown in glass chamber slides (Nunc). The cells
were fixed in 4% PA for 20 min at room
temperature and permeabilized in 0.1%
Triton/PBS for 5 min. Cells were then incubated
in PBS containing 0.5% BSA and 0.1% Tween 20
for 30 min to reduce nonspecific binding, followed
by overnight incubation at 4°C with the following
rabbit polyclonal OR Abs: MOR-1 raised against
C-terminus (Neuromics, 1:2500); MOR-1 raised
against N-terminus (Santa Cruz, 1:50); KOR-1
(Santa Cruz, 1:50). In some cases, a mouse
monoclonal nestin Ab (Chemicon, 1:1000) was
added together with the OR Abs. After washing,
Alexa Fluor 594 (red) and/or Alexa Fluor 488
(green) conjugated secondary Abs (1:1000) were
applied for 1 h at room temperature. DAPI
(1:200) was added together with the secondary
Abs. The slides were treated with anti-fade
reagent (Molecular Probes) and examined for
immunofluorescence with NIKON-OPTIPHOT-2
or OLYMPUS AH3 microscopes with
simultaneous recording of dual fluorescence label
images.
Real-time quantitative (q)RT-PCR: Total
RNA from ES cells and RA-induced NPs was
isolated using Qiagen’s RNeasy Mini Kit (Qiagen,
Valencia, CA) according to the manufacturer’s
instructions. cDNA was generated from 1 µg total
RNA using the High Capacity cDNA Archive Kit
from Applied Biosystems (ABI, Foster City, CA)
with random primers as described by the
manufacturer. qRT-PCR was performed with
SYBR green chemistry on an ABI 7500
instrument. The primers were designed using
Primer Express (ABI) and supplied by Integrated
DNA Technologies (Coralville, IA). Primer
sequences for MOR-1 were: forward, 5’-
CCACTAGCACGCTGCCCTT-3’; reverse, 5’-
GCCACGTTCCCATCAGGTAG-3’. Primer
sequences for ΚOR-1 were: forward, 5’-
AGAGAGAGAAGCGGCAAGCA-3’; reverse,
5’- GCCAAGGCTCACTAACTCCAA-3’. The
cDNA templates for qRT-PCR were diluted 1:10
and the 50 µl SYBR-green reaction consisted of 1
x SYBR-green Master Mix (ABI), 300 nM
forward and reverse primers, and 5 µl of diluted
cDNA. Four replicates of each qRT-PCR reaction
were run on 96-well plates. The amplification
efficiencies of MOR-1 and KOR-1 were consistent
with those of the endogenous control, GAPDH.
Relative quantification measurements were made
as described (43) by using the comparative CT
Method (∆∆CT Method) in which the gene CT
values are normalized by subtracting GAPDH CT.
Immunoblotting with MOR-1 and KOR-1
specific Abs: For detection of receptor protein
levels in ES cells or ES cell-derived NPs,
immunoblotting with MOR-1 and KOR-1 specific
Abs was adopted. For this purpose, cells were
lysed in a modified RIPA buffer: 50 mM Tris-
HCl, pH 7.4; 1% NP40; 0.25% sodium
deoxycholate; 150 mM NaCl; 1 mM EGTA; 1 mM
PMSF; 1 µg/ml leupeptin; 1 µg/ml aprotinin; 1
by guest on April 5, 2020
http://ww
w.jbc.org/
Dow
nloaded from

4
mM Na3VO4; 1 mM NaF and samples containing
20-50 µg protein were loaded on 10 % SDS gels.
Receptor band(s) were detected using two rabbit
polyclonal MOR-1 Abs: C-terminus MOR-1 Ab
(1:2000, Neuromics) and N-terminus MOR-1 Ab
(1: 200, Santa Cruz). KOR-1 immunoreactivity
was detected with a rabbit polyclonal KOR-1
specific Ab (1:50, Santa Cruz). Horseradish
peroxidase linked IgGs were applied as secondary
Abs. Bands were visualized by
chemiluminescence detection as described for
ERK.
SOX-1 immunostaining and counting: D3
ES cells were grown in chamber slides, in
serum/LIF/ME containing media and were treated
with 1 µM DAMGO or U69, 593 for 24 h. In
some cases, cells were pretreated for 1 h either
with MOR antagonist (CTAP, 1 µM) or KOR
antagonist (nor-BNI, 1 µM) before addition of
opioid agonists for 24 h. Control and opioid-
treated ES cells were washed with PBS and fixed
with 2% PA for 10 min at room temperature.
Cells were then permeabilized with 0.4%
Triton/PBS for 5 min and incubated in PBS
containing 10% FCS and 0.4% Triton X-100 for
30 min to reduce nonspecific binding, followed by
incubation with chicken polyclonal SOX-1 Ab
(1:500, Chemicon) overnight at 4°C. After
washing, Alexa Fluor 594 (red) conjugated anti-
chicken secondary Ab (1:1000, Molecular Probes)
was applied for 1 h at room temperature. Cells
were counterstained with DAPI (1:200) to
visualize nuclei for cell counts. Chamber slides
were treated with anti-fade reagent (Molecular
Probes) and examined for immunofluorescence as
described above. NIH Image J version 1.32
sofware was used to count cells. The % of SOX-1
positive cells was estimated from the ratio
between the total number of cells (DAPI stained)
and the number of SOX-1 stained cells. Cells
from 3-5 fields per slide were counted and 3-4
slides per treatment group were used for the
counting. The total number of counted cells was
500-800/treatment group.
Cell proliferation assays: For these studies,
equal numbers of cells were seeded per well in
twelve-well dishes. Cell numbers were estimated
by serial dilutions and counting cells (volume of
10 µl) in several visual fields using a Bright-Line
Hemacytometer and light microscopy. Basal
levels or opioid-induced changes in DNA
synthesis were assessed by measuring the rate of
[methyl-3H] thymidine incorporation into cells.
Cells were grown in media ± opioids for 24 h. In
some experiments, the MEK-selective inhibitor
U0126 (1 µM) was present for 28 h, while opioid
agonists were added for 24 h and [methyl-3H]
thymidine (0.02 µCi/ml) was present for the last 4
h. [methyl-3H]Thymidine incorporation was
measured as described in our previous studies with
some modifications (44). Briefly, cells are washed
with PBS, followed by incubation with 5%
trichloroacetic acid at 4º C for 30 min. Then cells
were collected in 2% NaHCO3/0.1 N NaOH and
[methyl-3H] thymidine incorporation was
determined by liquid scintillation counting.
BrdU labeling of cells: D3 ES cells or RA-
induced NPs were grown until they reached about
50% confluency. They were then treated with
either 1 µM DAMGO or U69, 593 for 24 h. In
some cases, cells were pretreated with inhibitors or
opioid antagonists as described in the figure
legends. At the end of the treatment, media was
replaced with BrdU labeling medium (10 µM,
Molecular Probes, BrdU detection kit I) and cells
were incubated for 20-30 min. After several
washes, cultures were fixed with ethanol fixative
for 20 min at -20º C. For nestin co-labeling, cells
were incubated together with a monoclonal BrdU
Ab (1:10, Roche kit) and polyclonal nestin Ab
(1:1000, Covance) at 37° C for 30 min. For Sox-1
co-labeling, cells were first incubated with a
monoclonal BrdU Ab (1:10, Roche kit) at 37° C
for 30 min, then incubated in PBS containing 10%
FCS and 0.4% Triton X-100 for 30 min to reduce
nonspecific binding, followed by counter-staining
with a chicken Sox-1 polyclonal Ab (1:500,
Chemicon) overnight at 4° C. After washing, cells
were treated with fluorescein conjugated anti-
mouse IgG (green, 1:10, Roche kit) together with
Alexa Fluor 594 (red) conjugated anti-chicken or
anti-rabbit secondary Abs (1:1000, Molecular
Probes) for 1 h at room temperature. Slides were
examined for immunofluorescence as described
above.
RESULTS
Characterization of ES cells and ES cell-derived NPs: The state of differentiation of D3 or
PRX ES cells and RA-induced ES cell-derived
NPs was characterized by immunocytochemistry
by guest on April 5, 2020
http://ww
w.jbc.org/
Dow
nloaded from
5
and immunoblotting. For this purpose, D3 and
PRX ES cells were maintained under
serum/LIF/ME induced self-renewal conditions or
they were differentiated in the presence of RA.
For the immunocytochemistry experiments,
cultures were stained with nestin (a neural
progenitor marker) Ab and DAPI (a nuclear
marker). As seen in double DAPI/nestin images
(Fig.1, D3 and PRX), there were no nestin (red)
stained cells among the undifferentiated ES cells,
whereas RA-induced NPs show heavy staining
with nestin (Fig.1, dD3 & dPRX).
Since the transcription factor Oct4 has been
demonstrated to be vital for the formation of self-
renewing pluripotent ES cells, cell lysates from
undifferentiated D3 ES cells or RA-induced NPs
were probed with an Oct4 Ab (Chemicon, 1:100)
as presented in Fig.1B. The densitometry data
from the Oct4 immunoblots suggest that there is
about a 50% reduction in Oct4 protein levels in D3
ES cell-derived NPs (3767 ± 85, n=3) in
comparison to the levels of this transcription factor
in undifferentiated ES cells (6954 ± 463, n=4).
MOR-1 and KOR-1 gene expression and
immunoreactivity was detected in ES cells and in ES cell-derived NPs: Three independent
approaches were taken to determine the presence
of MOR-1 and KOR-1 in undifferentiated D3 ES
cells and RA-induced ES cell-derived NPs: qRT-
PCR, immunoblot analysis of cell lysates and
immunofluorescence microscopy of cells at
different stages of development. In qRT-PCR
experiments, we found that in comparison with ES
cells, NPs have 1.37 and 2-fold increases in MOR-
1 and KOR-1 gene expression, respectively (n=3).
As shown in figure 2, immunoblotting performed
with polyclonal MOR-1 (C-terminus, Neuromics),
MOR-1 (N-terminus, Santa Cruz) and KOR-1
(Santa Cruz) specific Abs shows the presence of
major 50 and 55 kDA bands that correspond to the
expected molecular weights for MOR-1 and KOR-
1, respectively. In addition to the 50 kDa band,
the N-terminus MOR-1 Ab reveals the existence
of higher molecular weight bands (Fig. 2, lanes 6&
7), which were suggested to correspond to the
glycosylated form(s) of the receptor by several
groups (45-47). Both MOR-1 and KOR-1 bands
were detected in cell lysates, obtained from D3 ES
cells maintained under self-renewal conditions
(serum/LIF/ME). RA treatment does not appear to
induce significant changes in MOR-1 or KOR-1
gene expression or protein levels (Fig. 2) in D3
NPs. Brain homogenate was used as a positive
control and lysates from late passage immortalized
rat astrocytes were used as negative controls
because these cells lose detectable amounts of
ORs with passaging (42 and unpublished
observations).
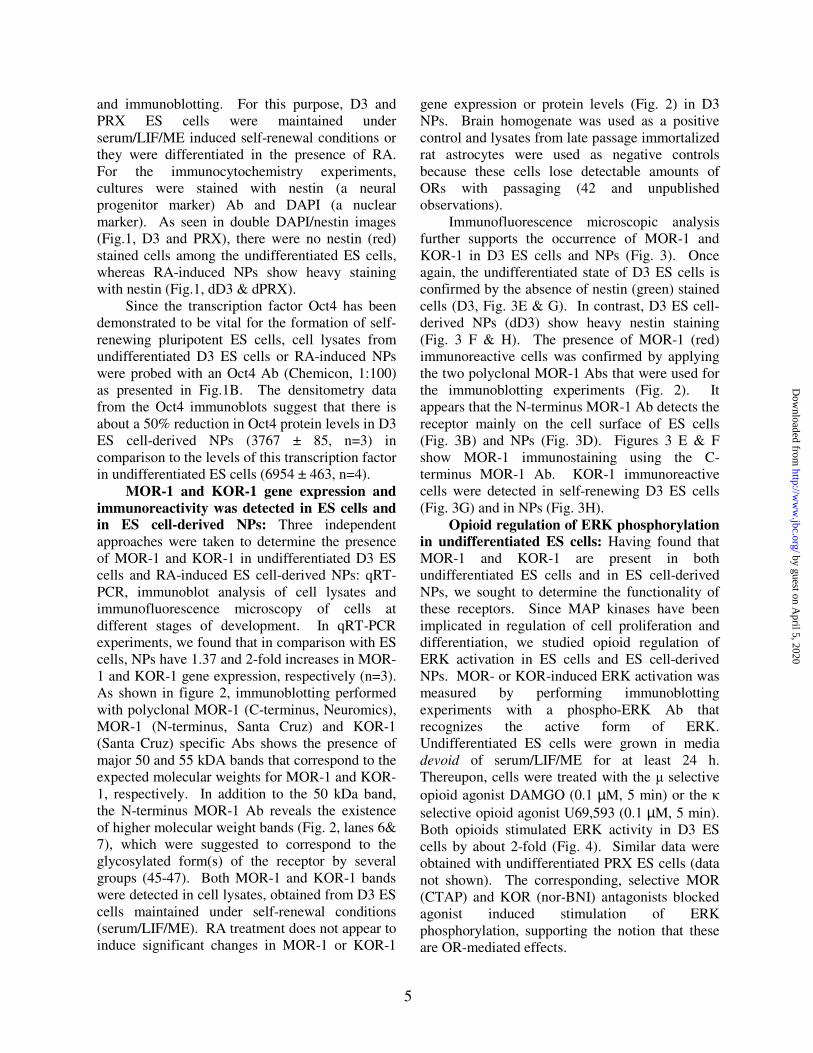
Immunofluorescence microscopic analysis
further supports the occurrence of MOR-1 and
KOR-1 in D3 ES cells and NPs (Fig. 3). Once
again, the undifferentiated state of D3 ES cells is
confirmed by the absence of nestin (green) stained
cells (D3, Fig. 3E & G). In contrast, D3 ES cell-
derived NPs (dD3) show heavy nestin staining
(Fig. 3 F & H). The presence of MOR-1 (red)
immunoreactive cells was confirmed by applying
the two polyclonal MOR-1 Abs that were used for
the immunoblotting experiments (Fig. 2). It
appears that the N-terminus MOR-1 Ab detects the
receptor mainly on the cell surface of ES cells
(Fig. 3B) and NPs (Fig. 3D). Figures 3 E & F
show MOR-1 immunostaining using the C-
terminus MOR-1 Ab. KOR-1 immunoreactive
cells were detected in self-renewing D3 ES cells
(Fig. 3G) and in NPs (Fig. 3H).
Opioid regulation of ERK phosphorylation
in undifferentiated ES cells: Having found that
MOR-1 and KOR-1 are present in both
undifferentiated ES cells and in ES cell-derived
NPs, we sought to determine the functionality of
these receptors. Since MAP kinases have been
implicated in regulation of cell proliferation and
differentiation, we studied opioid regulation of
ERK activation in ES cells and ES cell-derived
NPs. MOR- or KOR-induced ERK activation was
measured by performing immunoblotting
experiments with a phospho-ERK Ab that
recognizes the active form of ERK.
Undifferentiated ES cells were grown in media
devoid of serum/LIF/ME for at least 24 h.
Thereupon, cells were treated with the µ selective
opioid agonist DAMGO (0.1 µM, 5 min) or the κ
selective opioid agonist U69,593 (0.1 µM, 5 min).
Both opioids stimulated ERK activity in D3 ES
cells by about 2-fold (Fig. 4). Similar data were
obtained with undifferentiated PRX ES cells (data
not shown). The corresponding, selective MOR
(CTAP) and KOR (nor-BNI) antagonists blocked
agonist induced stimulation of ERK
phosphorylation, supporting the notion that these
are OR-mediated effects.
by guest on April 5, 2020
http://ww
w.jbc.org/
Dow
nloaded from

6
Opioid effects on ERK signaling were also
evaluated in cells grown in serum/LIF/ME
containing media, conditions that are expected to
maintain D3 ES cells in an undifferentiated, self-
renewing state. Under these conditions, both
DAMGO and U69,593 induced a sustained
activation of ERK signaling throughout the 24 h
treatment period (Fig. 5). For DAMGO, there was
2-fold or greater activation of ERK at all time
points (Fig. 5B). Maximal phosphorylation was
seen at 5 min and 12 h with each having greater
than 4-fold stimulation of ERK. The ERK
activation observed with U69,593 was also
sustained for all time points (Fig. 5C). This
activation was slightly less all overall, although
the greatest phosphorylation seen was over 6-fold
at 5 min.
Although serum induces high basal levels of
phosphorylated ERK in many cell types, ERK
basal levels were low in ES cells grown in serum
containing media (Fig. 5A). The low basal levels
of ERK phosphorylation in these cells support the
notion that ERK activity may not be required for
self-renewal of ES cells as recently reported (see
Introduction).
Opioids induce limited proliferation of
undifferentiated ES cells via the ERK pathway: To correlate the ERK data with cell proliferation,
we studied opioid regulation of ES cell growth.
In undifferentiated D3 ES cells, the findings are
that DAMGO, U69,593, and morphine all induced
limited proliferation. Specifically, DAMGO and
morphine caused a 40% rise in proliferation over
basal levels, whereas U69,593 caused a 30%
increase (Fig. 6). The mitogen, EGF (10 ng/ml)
induced about a 100% increase in ES cell
proliferation (N=3, P<0.05). EGF stimulates ES
cell proliferation via the ERK/MAP kinase
signaling pathway (48). Since ERK mediates
mitogen-induced cell proliferation, the MEK-
selective inhibitor U0126 was added to determine
the role of ERK in opioid enhanced cell
proliferation. Pretreatment of ES cells with U0126
blocked the opioid-induced increase of
proliferation seen in the absence of the inhibitor,
suggesting that opioids act through ERK/MAP
kinase to increase proliferation in D3 ES cells
(Fig. 6). In PRX ES cells, morphine also induced
a 30% increase in cell proliferation over basal
levels (data not shown). U0126 abolished this
increase, suggesting that ERK is responsible for
opioid-enhanced proliferation in undifferentiated
PRX ES cells as well.
Although basal levels of proliferation in the
presence and absence of U0126 were set at one to
simplify the estimation of opioid effects (controls
in Fig. 6), we found that U0126 pretreatment
enhanced basal levels of D3 ES cell proliferation
by about 40% (basal levels in dpms: 8726 ± 1168
vs basal in the presence of U0126: 12005 ± 1225).
This finding supports the notion that
undifferentiated ES cells (in the absence of
opioids) can proliferate even when ERK signaling
is blocked and suggest that the ERK/MAP kinase
signaling pathway may not be involved in ES cell
self-renewal.
Evidence for opioid-induced D3 ES cell
differentiation: To determine whether the opioid-
induced proliferation of ES cells is due to an
increase in self-renewal or asymmetric cell
division to form NPs, we examined the phenotype
of the opioid-induced “newly formed” cells.
Undifferentiated ES cells were treated with
opioids, labeled with BrdU, followed by staining
with nestin and BrdU Abs. The
immunofluorescence analysis raises the possibility
that DAMGO and U69, 593 induce the appearance
of nestin-positive cells that may be NPs derived
from ES cells (Fig. 7A). The representative
double images of control cells show mainly BrdU
(green) staining and only a few nestin (red) stained
cells.
To determine further the nature of opioid-
induced cells, we performed a quantitative
analysis of Sox-1 immunostained, control and
opioid-treated ES cells (Fig. 7 B-D). Sox-1 is a
selective marker of proliferating NPs; it belongs to
a family of transcription factors that are expressed
in ectodermal cells upon acquisition of neural
progenitor identity (49, 50). By counting cells (≥
1,000 cells/treatment group), we estimated that
only a few of the control cells (4 ± 1.1%, n=8)
were Sox-1 positive. Exposure of undifferentiated
ES cells to 1 µM MOR (Fig. 7B) or KOR (Fig.
7C) opioids for 24 h initiated the appearance of
about 7-8 fold more Sox-1 positive cells than in
control cells (Fig. 7D&E). The corresponding,
selective MOR (CTAP) and KOR (nor-BNI)
antagonists blocked agonist induced appearance of
Sox-1 positive cells, suggesting that this is an OR-
mediated process. CTAP (10 ± 2.6%, n=4) and
by guest on April 5, 2020
http://ww
w.jbc.org/
Dow
nloaded from

7
nor-BNI (2 ± 0.5%, n=4), alone had no significant
effect on the number of Sox-1 labeled cells.
Opioid regulation of ERK phosphorylation in RA-induced ES cell-derived NPs: To
investigate opioid modulation of ERK activity
upon RA-induced differentiation of ES cells, RA-
induced EBs were dissociated and plated in serum
containing DMEM for an additional 2-5 days
(short-term differentiation) or for 5-12 days (long-
term differentiation). After growing in serum-
deprived media for 24 h, these cells were treated
with opioids for various times and ERK
phosphorylation was measured by immunoblotting
(Fig. 8). The results support the following
conclusions: a) basal levels of ERK
phosphorylation in long-term differentiated cells
were significantly higher (2.2±0.2, n=9, P < 0.05)
than basal levels of ERK activation in short-term
differentiated cells (NPs), suggesting that terminal
differentiation of these cells may require activated
ERK; b) MOR and KOR agonists elicit similar
effects on ERK activation in short- and long-term
differentiated cells (Figs. 8&9).
More detailed time course experiments with
DAMGO and U69, 593 were also conducted (Fig.
9). These data further confirm that the two opioids
induce a similar biphasic ERK activation profile
with peaks occurring at 2-15 min and at about 2-6
h in short-and long-term differentiated ES cells
(Fig. 9A-D). Thus, the opioid-induced sustained
ERK activation seen in undifferentiated ES cells
changes in differentiated cells to a biphasic ERK
activation profile.
Opioids inhibit NP proliferation: To
evaluate opioid effects on RA-induced NP
proliferation, we performed a quantitative analysis
of Sox-1/BrdU double labeled, control and opioid-
treated NPs (Fig. 10). Since Sox-1 is a selective
marker of proliferating NPs, we counted the BrdU
labeled cells among the Sox-1 positive cells and
thus estimated the changes in NP proliferation
upon treatment with opioids. The data presented
in figure 10 indicate that 1 µM DAMGO or
U69,593 decreased proliferation of NPs by 50-
60% in 24 h. The inhibitory effect of both opioid
agonists was reversed by the corresponding MOR
(CTAP) and KOR (NorBNI) antagonists,
indicating that DAMGO and U69,593 were acting
via their respective receptors. Interestingly,
norBNI alone induced a 27% increase (59 ± 4.7%,
n = 4, P = 0.0149) in cell proliferation over basal
levels. This finding may be due to the possibility
that NPs secrete endogenous κ opioid peptides that
may have inhibitory effects on basal levels of cell
division. Upon addition of KOR antagonist, the
effects of both endogenous and exogenous KOR
ligands were suppressed, resulting in an increase
in proliferation over basal levels. In contrast, in
the presence of CTAP alone, NP proliferation was
similar to basal levels (34 ± 5.4%, n=4, P = 0.168).
The involvement of the ERK signaling
pathway in opioid regulation of NP proliferation
was evaluated by treatment of the cells with the
MEK inhibitor, U0126 for 1 h before opioid
agonist exposure (Fig. 10). U0126 alone did not
significantly affect basal levels of NP proliferation
(44 ± 3.2%, n=4, P = 0.832 vs controls of 43 ±
4.1%, n=6). Interestingly, administration of
U0126 in the presence of DAMGO did not reverse
the inhibitory effect induced by the MOR agonist
alone suggesting that MOR regulation of NP
proliferation is independent of the ERK signaling
pathway. Furthermore, the inhibitory effect of
U69,593 was only partially reversed upon
blockade of the ERK signaling by U0126.
DISCUSSION
The analysis of our data reveals several
important findings: 1. MOR-1 and KOR-1 gene
expression and immunoreactivity was detected in
undifferentiated ES cells and in ES cell-derived
NPs. This is the first evidence of the occurrence of
MOR-1 and KOR-1 in blastocyst-derived ES cells.
2. MOR-1 and KOR-1 that occur in ES cells and
NPs, show functionality as established by the
detection of opioid-induced temporal regulation of
ERK/MAP kinase signaling. A sustained
activation of ERK was characteristic for the opioid
treated undifferentiated ES cells, whereas the RA-
induced NPs showed a biphasic profile of opioid
induced ERK activity. 3. The ERK signaling
pathway mediated µ- and κ-opioid-induced limited
proliferation in undifferentiated D3 ES cells, even
though in the absence of opioids, these cells may
not require ERK activation for their self-renewal.
More importantly, opioids induced ES cell
asymmetric division to generate nestin/SOX1-
positive NPs and reduced the self-renewal of ES
cells. Thus, a novel finding here is that opioid-
induced sustained activation of ERK may play a
by guest on April 5, 2020
http://ww
w.jbc.org/
Dow
nloaded from

8
role in the initial differentiation of ES cells. 4.
Opioids attenuated proliferation of the population
of NPs that were generated upon differentiation of
ES cells with RA. This inhibitory effect is ERK
independent for DAMGO and partially for
U69,593 and correlated with MOR and KOR
agonist induction of a biphasic rather than a
sustained ERK activation profile in NPs.
In prior studies, KOR was found in P19
embryonic carcinoma cell line, which contains
pluripotent stem cells (51-53). Although these
cells are similar to ES cells derived from 4-5 day
old mouse embryos, they are transformed cells and
therefore capable of overexpressing genes not
expressed in their parent cell. RA promoted
expression of MOR gene, while KOR gene was
first suppressed and then reactivated in P19 cells
(54-56). KOR was also found on cell surface and
nuclear fractions of GTR1 ES cells (57-59). In
addition, MOR and δ opioid receptor (DOR), but
not KOR are expressed in adult hippocampal
progenitors and opioid peptides such as β-
endorphin can regulate proliferation of these
progenitor cells via ERK (60). Reduced ERK
signaling via MOR decreases proliferation, of
these progenitors, increases the number of in vitro
generated neurons and reduces the number of
astrocytes and oligodendrocytes. Finally, opiates
were found to inhibit neurogenesis in the adult rat
hippocampus (61).
We have characterized the mechanism of
ERK activation by ORs and demonstrated that
opioids either enhanced or inhibited DNA
synthesis in several types of primary cultures and
cell culture model systems (40-42, 44, 62, 63). In
most of these cases, opioids inhibited mitogen
stimulated proliferation as seen here (Fig. 10). It
was important to determine how opioids regulate
the ERK signaling pathways in ES cells and in ES
cell-derived NPs. As discussed in the
Introduction, several studies suggest that ERK
activation may not be required for ES cell self-
renewal (4, 11-14). Our thymidine incorporation
results further support this hypothesis. For
example, the finding that MEK inhibitor, U0126
alone enhanced basal levels of ES cell
proliferation by about 40% supports the notion
that undifferentiated ES cells can proliferate when
ERK signaling is blocked and suggest that ERK
activity may not be necessary for ES cell self-
renewal. Moreover, our U0126 data on basal
levels of ERK suggest that activation of this kinase
may have inhibitory effects on ES cell self-
renewal. In addition, under self-renewal
conditions (serum/LIF/ME), ES cells maintain low
basal ERK activity, data that further support the
lack of requirement for ERK activity by these cells
(Fig. 5). In contrast, the results also suggest that
opioid regulation of ES cell asymmetric cell
division in undifferentiated ES cells is ERK
dependent. Therefore, we propose that in
undifferentiated ES cells, two processes take
place: there is an ongoing ERK-independent,
symmetric cell division leading possibly to ES cell
self-renewal and an opioid-induced ERK-
dependent, asymmetric cell division leading to ES
cell differentiation (Fig. 11). Thus, both µ and κ
opioids promote ES asymmetric cell division at a
slightly more rapid rate than that of
serum/ME/LIF-induced self-renewal of ES cells.
The above findings raise the following
questions: If ERK signaling is not the regulator of
ES cell division/self-renewal than what is the
signaling pathway that modulates this process? It
was proposed that mouse ES cells utilize PI3K to
progress through the G1 phase and to avoid
differentiation (18, 27). What is the mechanism of
opioid induction of NP appearance? It has been
suggested that Sox proteins might contribute to the
transcriptional activation of the MOR gene and
that MOR could mediate some Sox regulated
developmental processes (64).
ERK signal duration impacts different
cellular responses in many cells and may produce
different outcomes in the same cells, such as
proliferation, differentiation or apoptosis (10, 26,
44, 65-68). In some cells, sustained but not
transient activation of ERK is required to initiate
proliferation (41, 65, 69, 70, McLennan, Kiss et
al., 2006 manuscript in preparation). Sustained
ERK activity appears to be required by many cells
to pass the G1 restriction point and to enter S
phase, in which cellular DNA is replicated (65,
71). In contrast, other studies have shown that
Ras/Raf mediated a transient EGF-induced ERK
activation that leads to proliferation, whereas
Rap/Raf mediated sustained activation of ERK is
required for PC12 cell differentiation (22, 72).
Our data suggest that the opioid induced sustained
activation of ERK triggers ES asymmetric cell
division and the “newly” formed cells appear to be
ES cell-derived NPs.
by guest on April 5, 2020
http://ww
w.jbc.org/
Dow
nloaded from

9
The important role of the ERK signaling
pathway in neural differentiation has been well-
established. While some reports indicate that ERK
signaling inhibits differentiation of some types of
cells (73, 74), other studies support the idea that
the ERK signaling may be a positive regulator of
this process (75). A recent paper discusses the
existence of a biphasic regulation of ERK activity
during myogenic differentiation and suggests that
the signaling pathway(s) may play a dual role in
this multi-step process, wherein the late phase is
responsible for the formation of postmitotic
myotubes (76). A similar study shows that an
early stimulation and late inhibition of ERK
activity by IGF mediates the switch in IGF action
from inhibition to stimulation of skeletal muscle
cell differentiation (77). Finally, it was found that
the early stage of neuronal differentiation of
mouse ES cell line P19 triggered by aggregation of
the cells and RA treatment is accompanied by
biphasic activation of ERK signaling: a transient
phase and a second, sustained ERK activation that
is maintained until the appearance of neural
phenotype (78).
Here, we propose that opioid-induced
sustained activation of ERK may be a required
step for the development of ES cell-derived NPs
and opioid-induced biphasic ERK phosphorylation
may play a supporting role in the increased
differentiation rate during the generation and
maturation of NPs. This hypothesis is based on
the following findings: As seen in figure 7, basal
levels of ERK activity are higher in long-term
differentiated ES cells than in short-term
differentiated cells (NPs). In addition, µ- and κ-
opioids induce a moderate, biphasic activation of
ERK signaling in short- and long-term
differentiated ES cells. More importantly, we
found that the biphasic stimulation of ERK
phosphorylation by opioids accompanies the
opioid-induced inhibition of proliferation in NPs.
Although MOR regulation of NP proliferation was
independent of the ERK signaling pathway, the
inhibitory effect of U69,593 was only partially
reversed upon blockade of the ERK signaling by
U0126. This finding may be explained by the
involvement of dual signaling pathways in KOR
modulation of NP proliferation. In addition to
ERK signaling, p38/MAP kinase is a candidate for
a second signaling pathway that could be required
for KOR inhibition of NP proliferation.
The absence of a developmental phenotype in
opioid receptor knock out mice has been reported
(79). This is not uncommon given the functional
redundancies that cells display after targeted gene
disruption of critical signaling molecules such as
GPCRs. There are numerous accounts in the
literature regarding the absence of alteration of
function after the loss of GPCR gene expression
due to redundant or compensatory signaling
mechanisms (80, 81). In some instances,
developmental phenotypic changes are subtle after
gene disruption and only seen when the organism
is stressed as it is in its natural environment (82).
Alternatively, MOR and/or KOR may be
dispensable for development and the observations
made here may be only of relevance to maternal
opiate abuse.
In conclusion, our studies suggest that MOR-
1, KOR-1 and their exogenous ligands are able to
modulate ES cell proliferation and differentiation.
Thus, opioids and opioid-induced ERK signaling
may play an important role in ES cell fate
decisions by directing the cells to specific
lineages.
by guest on April 5, 2020
http://ww
w.jbc.org/
Dow
nloaded from

10
REFERENCES
1. Stavridis, M. P., and Smith, A. G. (2003) Biochem. Soc. Trans 31, 45-49.
2. Cartwright, P., McLean, C., Sheppard, A., Rivett, D., Jones, K., and Dalton, S. (2005) Development
132, 885-896.
3. Wobus, A. M., and Boheler, K. R. (2005) Physiol. Rev. 85, 635-678.
4. Matsuda, T., Nakamura, T., Nakao, K., Arai, T., Katsuki, M., Heike, T., and Yokota, T. (1999) EMBO
J. 18, 4261-4269.
5. Ying, Q. L., Nichols, J., Chambers, I., and Smith, A. (2003) Cell 115, 281-292.
6. Gottlieb, D. I. (2002) Annu. Rev. Neurosci. 25, 381-407.
7. Keller, G. (2005) Genes Dev. 19, 1129-1155.
8. Bain, G., Kitchens, D., Yao, M., Huettner, J. E., and Gottlieb, D. I. (1995) Dev. Biol. 168, 342-357.
9. Gottlieb, D. I., and Huettner, J. E. (1999) Cells Tissues Organs 165, 165-172.
10. Boulton, T. G., Nye, S.H., Robbins, D. J., Ip, N.Y., Radziejewska, E., Morgenbesser, S.
D., DePinho, R.A., Panayotatos, N., Cobb, M.H., Yancopoulos, G.D. (1991) Cell 65,
663-675.
11. Burdon, T., Stracey, C., Chambers, I., Nichols, J., and Smith A. (1999) Dev. Biol. 210, 30-43.
12. Aubert, J., Dessolin, S., Belmonte, N., Li, M., McKenzie, F. R., Staccini, L., Villageois, P., Barhanin,
B., Vernallis, A., Smith, A. G., Ailhaud, G., and Dani, C. (1999) J. Biol. Chem. 274, 24965-24972.
13. Qi, X., Li, T. -G., Hao, J., Hu, J., Wang, J., Simmons, H., Miura, S., Mishina, Y., and Zhao, G. -Q.
(2004) Proc. Natl. Acad. Sci. U S A 101, 6027-6032.
14. Prudhomme, W., Daley, G. Q., Zandstra, P., and Lauffenburger, D. A. (2004) Proc. Natl. Acad. Sci. U
S A 101, 2900-2905.
15. Boeuf, H., Merienne, K., Jacquot, S., Duval, D., Zeniou, M., Hauss, C., Reinhardt, B., Huss-Garcia,
Y., Dierich, A., Frank, D. A., Hanauer, A., and Kedinger C. (2001) J. Biol. Chem. 276, 46204-46211.
16. Ernst, M., Oates, A., and Dunn, A. R. (1996) J. Biol. Chem. 271, 30136-30143.
17. Yoshida-Koide, U., Matsuda, T., Saikawa, K., Nakanuma, Y., Yokota, T., Asashima, M., and Koide,
H. (2004) Biochem. Biophy. Res. Comm. 313, 475-481.
18. Paling, N. R. D., Wheadon, H., Bone, H. K., and Welham, M. J. (2004) J. Biol. Chem. 279,
48063-48070.
19. Qui, M. S., and Green, S. H. (1992) Neuron 9, 705-717.
by guest on April 5, 2020
http://ww
w.jbc.org/
Dow
nloaded from

11
20. Cowley, S., Paterson, H., Kemp, P., and Marshall, C. J. (1994) Cell 77, 841-852.
21. Fukuda, M., Gotoh, Y., Tachibana, T., Dell, K., Hattori, S., Yoneda, Y., and Nishida, E. (1995)
Oncogene 11, 239-244.
22. York, R. D., Yao, H., Dillon, T., Ellig, C. L., Eckert, S. P., McCleskey, E. W., and Stork P. J. (1998)
Nature 392, 622-626.
23. Tighe, A. P., and Gudas, L. J. (2004) J. Cell Physiol. 198, 223-229.
24. Bost, F., Caron, L., Marchetti, I., Dani, C., Le Marchand-Brustel, Y., and Binetruy, B. (2002)
Biochem. J. 361, 621-627.
25. Smith, E. R., Smedberg, J. L., Rula, M., and Xu, X. -X. (2004) J. Cell Biol. 164, 689-699.
26. Weber, J. D., Raben, D. M. Phillips, P. J., and Baldassare, J. J. (1997) Biochem. J. 326, 61-68.
27. Jirmanova, L., Afanassieff, M., Gobert-Gosse, S., Markossian,S., and Savatier, P. (2002) Oncogene
21, 5515-5528.
28. Cameron, H. A., Hazel, T. G., and McKay, R. D. (1998) J. Neurobiol. 36, 287-306.
29. Nguyen, L., Rigo, J. M., Rocher, V., Belachew, S., Malgrange, B., Rogister, B., Leprince, P., and
Moonen, G. (2001) Cell Tissue Res. 305, 187-202.
30. Li, B. -H., Ma, W., Zhang, L., Barker, J. L., Stenger, D., and Pant, H. C. (2001) J. Neurosci. 21, 1569-
1579.
31. Rueda, D., Navarro, B., Martinez-Serrano, A., Guzman, M., and Galve-Roperh, I. (2002) J. Biol.
Chem. 277, 46645-46650.
32. Aguado T, Palazuelos J, Monory K, Stella N, Cravatt B, Lutz B, Marsicano G, Kokaia Z, Guzmán M,
and Galve-Roperh I. (2006) J. Neurosci. 26, 1551 - 1561.
33. Luk, K. C., Kennedy, T. E., and Sadikot, A. F. (2003) J. Neurosci. 23, 2239-2250.
34. Kippin, T. E., Kapur, S., and van der Kooy, D. (2005) J. Neurosci. 25, 5815-5823.
35. Sanada, K. and Tsai, L. -H. (2005) Cell 122, 119-131.
36. Doetschman, T. C., Eistetter, H., Katz, M., Schmidt, W., and Kemler, R. (1985) J. Embryol. Exp.
Morphol. 87, 27-45.
37. Williams, R. L., Hilton ,D. J., Pease, S., Willson, T. A., Stewart, C. L., Gearing, D. P., Wagner, E. F.,
Metcalf, D., Nicola, N. A., and Gough, N. M. (1988) Nature 336, 684-687.
38. Smith, A. G., Heath, J. K., Donaldson, D. D., Wong, G. G., Moreau, J., Stahl, M., and Rogers, D.
(1988) Nature 336, 688-690.
by guest on April 5, 2020
http://ww
w.jbc.org/
Dow
nloaded from

12
39. Finley, M. F., Devata, S., and Huettner, J. E. (1999) J. Neurobiol. 40, 271-287.
40. Belcheva, M. M., Szűcs, M., Wang, D. X., Sadee, W., and Coscia, C. J. (2001) J. Biol. Chem. 276,
33847-33853.
41. Belcheva, M. M., Tan, Y., Heaton, V. M., Clark, A. L., and Coscia, C. J. (2003) Mol. Pharmacol. 64,
1391-1401.
42. Belcheva, M. M., Clark, A. L., Haas, P. D., Serna, J. S., Hahn, J. W., Kiss, A., and Coscia, C. J.
(2005) J. Biol. Chem. 280, 27662-27669.
43. Livak, K. J., and Schmittgen, T. D. (2001) Methods 25, 402-408
44. Bohn, L. M., Belcheva, M. M., and Coscia, C. J. (2000) J. Neurochem. 74, 574-581.
45. Garzon, J., Juarros, J.L., Castro, M.A., and Sanchez-Blazquez, P. (1995) Mol. Pharmacol. 47, 738-
744.
46. Liu-Chen, L. Y., Chen, C., and Phillips, C. A. (1993) Mol. Pharmacol. 44, 749-756.
47. Chakrabarti, S., Regec, A, and Gintzler, A. R. (2005) Brain Res. Mol. Brain Res. 135, 217-224.
48. Heo J.S., Lee Y.J., and Han H.J. (2006) Am. J. Physiol. Cell Physiol. 290, 123-133.
49. Wegner, M., and Stolt, C. C. (2005) Trends Neurosci. 28, 583-588.
50. Pevny, L., and Placzek, M. (2005) Cur. Opin. Neurobiol. 15, 7-13.
51. Chen, H. C., Wei, L. N., and Loh, H. H. (1999) Neuroscience 92, 1143-1155.
52. Wei, L. N., Hu, X., Bi, J., and Loh, H. (2000) Mol. Pharmacol. 57, 401-408.
53. Ventura, C., and Maioli, M. (2000) Cir. Res. 87, 189-194.
54. Bi, J., Hu, X., Loh, H. H., and Wei, L. N. (2001) J. Neurosci. 21, 1590-1599.
55. Hu, X., Bi, J., Loh, H. H., and Wei, L. N. (2002) Mol. Pharmacol. 62, 881-887.
56. Park, S. W., Mostaqul Huq, M. D., Loh, H. H., and Wei, L. N. (2005) J. Neurosci. 25, 3350-
3357.
57. Ventura, C., Zinellu, E., Maninchedda, E., Fadda, M., and Maioli, M. (2003) Cir. Res. 92, 617-622.
58. Ventura, C., Zinellu, E., Maninchedda, E., and Maioli, M. (2003) Cir. Res. 92, 623-629.
59. Ventura, C. (2005) Evid. Based Complement. Altern. Med. 2, 277-283.
60. Persson, P. A., Thorlin, T., Ronnback, L., Hansson, E., and Eriksson, P. S. (2000) J. Neurosci. Res.
61, 371-375.
by guest on April 5, 2020
http://ww
w.jbc.org/
Dow
nloaded from

13
61. Eisch, A. J., Barrot, M., Schad, C. A., Self, D. W., and Nestler, E. J. (2000) Proc. Natl. Acad. Sci.
USA 97, 7579-7584.
62. Barg, J., Belcheva, M. M., and Coscia, C. J. (1992) J. Neurochem. 59, 1145-1152.
63. Barg, J., Belcheva, M. M., Rowinski, J., and Coscia C. J. (1993) J. Neurochem. 60, 1505-1511.
64. Hwang, C. K., Wu, X., Kim, C. S., Loh, H. H. (2003) J. Biol. Chem. 278, 3742-3750.
65. Vouret-Craviari, V., Van Obberghen-Schilling, E., Scimeca, J.C., Van Obberghen, E.,
Pouyssegur, J, (1993) Biochem. J. 289, 209-214.
66. Assoian, R. K. (2002) Nat. Cell. Biol. 4, E187-E188.
67. Ebisuya, M., Kondoh, K., and Nishida, E. (2005) J. Cell Science 118, 2997-3002.
68. Chen, J. -R., Plotkin, L. I., Aguirre, J. I., Han, L., Jilka, R. L., Kousteni, S., Bellido, T., and
Manolagas, S. C. (2005) J. Biol. Chem. 280, 4632-4638.
69. Murphy, L. O., Smith, S., Chen, R. H., Fingar, D. C., and Blenis, J. (2002) Nat. Cell Biol. 4, 556-564.
70. Murphy, L. O., MacKeigan, J. P., and Blenis, J. (2004) Mol. Cell Biol. 27, 144-153.
71. Marshall, C. J. (1995) Cell 80, 179-185.
72. Kao, S.-C., Jaiswal, R.K., Kolch, W., and Landreth, G. E. (2001) J. Biol. Chem. 276, 18169-18177.
73. Bennett, A. M., and Tonks, N. K. (1997) Science 278, 1288-1291.
74. Coolican, S. A., Samuel, D. S., Ewton, D. Z., McWade, F. J., and Florini, J. R. (1997) J. Biol. Chem.
272, 6653-6662
75. Gredinger, E., Gerber, A. N., Tamir, Y., Tapscott, S. J., and Bengal, E. (1998) J. Biol. Chem. 273,
10436-10444.
76. Wu, Z., Woodring, P. J., Bhakta, K. S., Tamura, K., Wen, F., Feramisco, J. R., Karin, M., Wang J. Y.
J., and Puri P. L. (2000) Mol. Cell Biol. 20, 3951-3964.
77. Adi, S., Bin-Abbas, B., Wu, N. -Y., and Rosenthal S. M. (2002) Endocrinology 143, 511-516.
78. Reffas, S., and Schlegel, W. (2000) Biochem. J. 352, 701-708.
79 Matthes, H.W.D., Maldonado, R., Simonin, F., Valverde, O., Slowe, S., Kitchen, I., Befort, K.,
Dierich, A., Le Meur, M., Dolle, P., Tzavara, E., Hanoune, J., Roques, B.P., and Kieffer, B.L. (1996)
Nature 383, 819
80. Rohrer, D.K., and Kobilka, B.K. (1998) Annu. Rev. Pharmacol. Toxicol. 38, 351-373.
by guest on April 5, 2020
http://ww
w.jbc.org/
Dow
nloaded from

14
81. Jin, X., von Gall, C., Pieschl, R.L., Gribkoff, V.K., Stehle, J.H., Reppert, S.M., and Weaver, D.R.
(2003) Mol. Cell Biol. 23, 1054-1060
82. Ponte, E., Bracco, E., Faix, J., and Bozzaro, S. (1998) Proc. Natl. Acad. Sci. USA 95, 9360-9365
by guest on April 5, 2020
http://ww
w.jbc.org/
Dow
nloaded from

15
FOOTNOTES
*Supported in part by grants from the National Institutes
of Health DA-05412 to CJC and American
Parapalegia Society and the Pediatrics Research Institute of St. Louis University School of Medicine to
MMB. We thank Dr. Michael Green and Akbar Siddiqui of the Department of Molecular Microbiology and
Immunology for their assistance with the qRT-PCR experiments. 1Abbreviations: Ab, antibody; BMP, bone morphogenic factor; DAMGO, [D-ala
2,mephe
4,gly-ol
5]
enkephalin; DMEM, Dulbecco’s Modified Eagle’s Medium; DOR, δ opioid receptor; EB, embryoid
body; EGF, epidermal growth factor; ES cells, embryonic stem cells; ERK, extracellular signal regulated
protein kinase; GPCR, G protein coupled receptor; ICM, inner cell mass; KOR, κ opioid receptors; LIF,
leukemia inhibitory factor; MAP, mitogen-activated protein; ME, 2-mercaptoethanol; MOR, µ opioid
receptor; nor-BNI, nor-binaltorphimine; NP, neural progenitor; OR, opioid receptor; PA,
paraformaldehyde; PI3K, phosphatidyl inositol 3 kinase; RA, retinoic acid.
by guest on April 5, 2020
http://ww
w.jbc.org/
Dow
nloaded from

16
FIGURE LEGENDS
Fig. 1 Characterization of undifferentiated ES cells and ES cell-derived RA-induced NPs. (A)
Immunofluorescence microscopic analysis. D3 and PRX ES cells were maintained under
serum/LIF/ME induced self-renewal conditions (undifferentiated cells). Upon treatment with 1 µM RA,
cells undergo differentiation (dD3 and dPRX). Cells were grown in 8 well slide chambers for 2 days,
washed with PBS and fixed with 4% PA for 20 min at room temperature. Cells were then permeabilized
in 0.1% Triton/PBS for 5 min and incubated in PBS containing 0.5% BSA and 0.1% Tween 20 for 30 min
to reduce nonspecific binding, followed by incubation with mouse monoclonal nestin Ab (1:1000)
overnight at 4° C. After washing, Alexa Fluor 594 (red) conjugated anti-mouse secondary Ab (1:1000)
was applied for 1 h at room temperature. DAPI (1:200) was added together with the secondary Ab
Representative images show DAPI (blue), Nestin (red) and double DAPI/Nestin staining in short-term (2-
5 days) RA differentiated cells (dD3 and dPRX). Only DAPI staining is present on the double
DAPI/Nestin images from undifferentiated cells (D3 and PRX). Magnification X 20-40. (B)
Immunoblot analysis. D3 ES cells were maintained in serum/LIF/ME containing media or they were
differentiated with 1 µM RA (short-term differentiated D3 ES cells) and grown for additional 2-3 days
before use. Cell lysates (40 µg protein) were run on 10% SDS-PAGE and immunoblotting was
performed with an Oct4 Ab (Chemicon, 1:100). Shown is a representative immunoblot from 3-4
experiments.
Fig. 2 Immunoblot analysis of MOR-1 and KOR-1 in D3 ES cells and in NPs. D3 ES cells were
grown in serum/LIF/ME containing media (undifferentiated cells: D3 ES cells) or they were differentiated
with 1 µM RA (short-term differentiation: dD3 ES cells). Cell lysates (20-50 µg protein) were run on
10% SDS-PAGE and immunoblotting was carried with MOR-1 (C-terminus, Neuromics, 1:2000), MOR-
1 (N-terminus, Santa Cruz, 1:200) or KOR-1 (Santa Cruz, 1:50) Abs. Shown are representative
immunoblots from 4-8 experiments: C-terminus MOR-1 Ab: 1. D3 ES cells; 2. immortalized rat
astrocytes stably transfected with MOR-1; 3. rat brain membrane; 4. late passage immortalized rat
astrocytes (negative control); 5. dD3 ES cells; N-terminus MOR-1 Ab: 6. D3 ES cells; 7. dD3 ES cells;
KOR Ab: 1. D3 ES cells; 2. late passage immortalized rat astrocytes (negative control); 3. dD3 ES cells.
Fig. 3 Immunofluorescence microscopic detection of MOR-1 and KOR-1 in undifferentiated D3 ES cells and in RA-induced NPs. D3 ES cells were maintained in serum/LIF/ME induced self-renewal
conditions (undifferentiated cells, D3). Upon treatment with 1 µM RA they undergo differentiation
(dD3). Cells were fixed and permeabilized as in Fig. 1. Treatments were followed by overnight
incubation with polyclonal MOR-1 (C-terminus, 1:2500, A-D and N-terminus, 1:50, E&F) or KOR (1:50)
Abs at 4° C. Mouse monoclonal nestin Ab (1:1000) was added to E-H slides. After washing, Alexa
Fluor 594 (red) or Alexa Fluor 488 (green) conjugated secondary Abs (1:1000) were applied for 1 h at
room temperature. In some cases, DAPI (1:200) was added together with the secondary Ab (A-D).
Immunofluorescence in cells was examined as described in Experimental. Appropriate controls, such as
omission of primary Ab, have been run to confirm the specificity of the Abs (A&C). Representative
images show MOR-1 (B&E) or KOR-1 (G) (red) staining in undifferentiated (D3) cells or in short-term
differentiated ES cells (dD3, D). Double images of MOR-1/Nestin (F) or KOR-1/Nestin (H) staining in
short-term differentiated ES cells (dD3) are also presented. Magnification X 20-40.
Fig. 4 Opioid stimulation of ERK phosphorylation in ES cells. D3 ES cells grown in serum/LIF/ME-
free media were treated with vehicle, DAMGO (0.1 µM) or U69, 593 (0.1 µM ) for 5 min. In some
cases, cells were pretreated for 1 h either with MOR antagonist (CTAP, 1 µM) or KOR antagonist (nor-
BNI, 1 µM) before addition of opioid agonists for 5 min. ERK phosphorylation was measured by
by guest on April 5, 2020
http://ww
w.jbc.org/
Dow
nloaded from

17
immunoblotting with a p-ERK Ab, directed against phospho Thr202/Tyr204. N = 3-4. *Significantly >
controls, #Significantly < agonist alone, P<0.05.
Fig. 5 Time course of opioid stimulation of ERK phosphorylation in undifferentiated ES cells. D3
ES cells grown in serum/LIF/ME containing media were treated at different time points with opioids (1
µM). (A) Representative gels of ERK phosphorylation. (B&C) Curves of quantified ERK
phosphorylation. N = 3-12. *Significantly > controls, P<0.05; **
Significantly > controls, P<0.01.
Fig. 6 Opioids induce limited proliferation in undifferentiated D3 ES cells. Proliferation was
measured by methyl-[3H] thymidine incorporation into ES cells. D3 ES cells grown in serum/LIF/ME
containing media were treated with either vehicle (Con), morphine (0.5 µM), DAMGO (1 µM), or
U69,593 (1 µM) for 24 h and 0.02 µCi/ml [methyl-3H] thymidine was added for the last 4 h. In some
experiments, the MEK-selective inhibitor U0126 (1 µM) was present for 28 h, while opioid agonists were
added for 24 h and [methyl-3H] thymidine was present for the last 4 h. N=3-5. **P<0.01.
Fig. 7 Evidence for opioid-induced neural differentiation of ES cells (A) BrdU and nestin
immunostaining. D3 ES cells grown in chamber slides and in serum/LIF/ME containing media were
treated with vehicle, DAMGO (1 µM) or U69,593 (1 µM) for 24 h. Then cells were incubated with BrdU
(10 µM, BrdU labeling and detection kit, Roche) in media at 37° C for 20 min and fixed in ethanol
fixative at -20° C for 20 min. After washing, monoclonal BrdU Ab (1:10, Roche kit) and polyclonal
nestin Ab (1:1000, Covance) were added together to the cells and then incubated at 37° C for 30 min.
After washing, fluorescein conjugated anti-mouse IgG (green, 1:10, Roche kit) and Alexa Fluor 594
conjugated anti-rabbit IgG (red, 1:1000) were applied at 37° C for 30 min. Representative double images
show BrdU (green) and nestin (red) stained cells. (B&C) Sox-1 immunostaining. Cells were grown and
treated with opioids as described in (A). In some cases, cells were pretreated for 1 h either with MOR
antagonist (CTAP, 1 µM, B) or KOR antagonist (nor-BNI, 1 µM, C) before addition of opioid agonists
for 24 h. After washing, cells were fixed with 2% PA for 10 min at room temperature. Cells were then
permeabilized in 0.4% Triton/PBS for 5 min and incubated in PBS containing 10% FCS and 0.4% Triton
X-100 for 30 min to reduce nonspecific binding, followed by incubation with chicken Sox-1 polyclonal
Ab (1:500, Chemicon) overnight at 4° C. After washing, Alexa Fluor 594 (red) conjugated anti-chicken
secondary Ab (1:1000, Molecular Probes) was applied for 1 h at room temperature. DAPI (1:200) was
added together with the secondary Ab. Representative double DAPI (blue)/Sox-1 (red) images are shown
in control and opioid-treated cells. N= 4-8. Magnification X 20-40. Bar graphs (D&E) show the
quantification of the Sox-1 counting data. The total number of cells was determined by counting DAPI
stained cells (≥ 1,000 cells/treatment group). Sox-1 positive cells are expressed as % of the total number
of cells. N=4-8. *Significantly > controls, #Significantly < agonist alone, P<0.0001
Fig. 8 Representative gels of opioid stimulation of ERK phosphorylation in RA-induced differentiated D3 ES cells. Upon differentiation of D3 ES cells with 1 µM RA, cells were grown for
additional 2-5 days (short-term differentiation) or for 5-12 days (long-term differentiation). Cells were
serum starved for 24 h and treated with DAMGO (0.1 µM) or U69, 593 (0.1 µM) for different time
intervals and ERK phosphorylation experiments were carried out. N = 3-11.
Fig. 9 Opioid stimulation of ERK phosphorylation in RA-induced D3 ES cell-derived short- and long-term differentiated cells. D3 ES cells were differentiated with 1 µM RA as in Fig. 8. (A&B)
Short-term differentiated cells were treated with either 1 µM DAMGO (A) or 1 µM U69,593 (B) for
different time intervals. N = 3-10. *Significantly different from controls, P<0.05. **
Significantly >
controls, P<0.001. (C&D) Long-term differentiated ES cells were treated with either 1 µM DAMGO (C)
or 1 µM U69,593 (D) for different time intervals. N = 3-11. *Significantly different from controls,
P<0.05. **
Significantly > controls, P<0.001.
by guest on April 5, 2020
http://ww
w.jbc.org/
Dow
nloaded from

18
Fig.10 Opioids inhibit proliferation of ES cell-derived, RA differentiated NPs. Sox-1 and BrdU
immunocytochemistry. (A) D3 ES cell-derived, RA-induced NPs were grown in chamber slides in
DMEM containing FCS for 2 days. Cells were serum starved for 24 h and treated with vehicle, DAMGO
(1 µM) or U69,593 (1 µM) for an additional 24 h. In some cases, cells were pretreated for 1 h either with
MOR antagonist (CTAP, 1 µM), KOR antagonist (nor-BNI, 1 µM) or the MEK-selective inhibitor U0126
(1 µM), followed by opioid agonist treatment. Cells were then incubated with BrdU and co-labeled with
monoclonal BrdU and chicken Sox-1 polyclonal Abs as described in Experimental. Representative
double BrdU (green)/Sox-1 (red) images are shown in control and opioid-treated cells. Magnification X
20. (B) Quantification of BrdU/Sox-1 counting data. NIH ImageJ version 1.32 sofware was used to
count cells. Cells from > 5 fields per well were counted (>1,000 cells/treatment group). The total number
of NPs was estimated by counting Sox-1 stained cells. BrdU positive cells were expressed as % total
number of Sox-1 labeled NPs. N=3-7. *Significantly < controls, p ≤ 0.0004; #Significantly > agonist
alone, p ≤ 0.0281.
Fig. 11 Hypothetical model of ES cell division upon opioid treatment. (A) The symmetrical ES cell
division is ERK independent in the absence of opioids. (B) Opioids initiate asymmetrical cell division in
ES cells: ES cell self-renewal is ERK independent but may be reduced upon sustained activation of ERK;
the appearance of NPs is due to an ERK dependent cell division.
by guest on April 5, 2020
http://ww
w.jbc.org/
Dow
nloaded from

19
Fig. 1
PRX
DAPI/ Nestin DAPI Nestin DAPI/ Nestin
dPRX dPRX dPRX
dD
D3 dD3 dD3 dD3
DAPI/ Nestin DAPI Nestin DAPI/ Nestin
A
B
ES NPs
by guest on April 5, 2020
http://ww
w.jbc.org/
Dow
nloaded from

20
Fig. 2
MOR
50 kDa 1 2 3 4 5 6 7
98 kDa
KOR
1 2 3 kDa55
by guest on April 5, 2020
http://ww
w.jbc.org/
Dow
nloaded from

21
Fig. 3
dD3 H
Nestin/ KOR
D3 G
Nestin/ KOR
D3 A D3 B dD3 C dD3 D
F D3
Nestin/ MOR
Nestin/ MOR
DAPI DAPI/ MOR DAPI DAPI/ MOR
E dD3
by guest on April 5, 2020
http://ww
w.jbc.org/
Dow
nloaded from

22
Fig. 4
1.0
2.0
Control DAMGO CTAP+DAMGO U69,593 NorBNI+U69,593
**
# #ER
K P
ho
sph
ory
latio
n
(Fo
ld o
ve
r C
on
trol)
Control DAMGO
**
# #
by guest on April 5, 2020
http://ww
w.jbc.org/
Dow
nloaded from

23
Fig. 5
Phosphory
lation
Min
ER
K P
hosphory
lation
DAMGO
**
** *
*
*
*
*
2 5 1
3
6
2 4 6 1
1
2
Time
1.0
4.0 2.0 3.0 5.0 6.0 7.0 U69,593
*
**
* * **
** * * * (F
old
over
Contr
ol) C
** **
1.
2.0 3.0 4.0 5.0 6.0
1.
1.0
1
3
6
4 6 1
1
2
15 30 60 4 6 12 18 24 Min Hours
B
2 5 1 3 6 2 4 6 12 18 24 Hours
5 15 30 60 Time
(Fold
over
Contr
ol)
ER
K
**
*
A
Con
trol
U 2
min
U 5
min
U 1
h
U 2
h
U 4
h
U 6
h
U69,593 (U)
DAMGO (D)
Con
trol
D 2
min
D 5
min
D 1
h
D 2
h
D 6
h
D 1
2h
D 1
8h
D 4
h
D 2
4h
U 1
2h
U 1
8h
U 2
4h
A
Con
trol
U 2
min
U 5
min
U 1
h
U 2
h
U 4
h
U 6
h
U69,593 (U)
DAMGO (D)
Con
trol
D 2
min
D 5
min
D 1
h
D 2
h
D 6
h
D 1
2h
D 1
8h
D 4
h
D 2
4h
U 1
2h
U 1
8h
U 2
4h
by guest on April 5, 2020
http://ww
w.jbc.org/
Dow
nloaded from

24
Fig. 6
Morphine Con DAMGO U69
** ** **
U0126 absent
U0126 present
Ce
ll P
rolif
era
tion
(Fo
ld o
ve
r C
on
trol)
0.4
0.8
1.2
1.6
by guest on April 5, 2020
http://ww
w.jbc.org/
Dow
nloaded from

25
Fig. 7
A
BrdU/ Nestin BrdU/ Nestin BrdU/ Nestin
Control
Control
DAMGO B
C
Control DAMGO
U69,593
CTAP +DAMGO
Control nor-BNI +U69,593
DAPI/ SOX-1 DAPI/ SOX-1 DAPI/ SOX-1
DAPI/ SOX-1 DAPI/ SOX-1 DAPI/ SOX-1
U69,593
0 10 20 30 40
% S
OX
-1 L
abelle
d C
ells
#
nor-BNI+ U69,593
0
10
20
30
% S
OX
-1 L
abelle
d C
ells
CTAP+ DAMGO
D
E
#
by guest on April 5, 2020
http://ww
w.jbc.org/
Dow
nloaded from

26
Fig. 8
DAMGO(D)short-term long-term
long-termshort-term
U69,593(U)
Contr
ol
D 5
min
D 3
0m
in
D 2
4h
D 1
h
Contr
ol
D 5
min
D 3
0m
in
D 2
4h
D 1
h
Contr
ol
U 5
min
U 3
0m
in
U 2
4h
U 1
h
Contr
ol
U 5
min
U 3
0m
in
U 2
4h
U 1
h
DAMGO(D)short-term long-term
long-termshort-term
U69,593(U)
Contr
ol
D 5
min
D 3
0m
in
D 2
4h
D 1
h
Contr
ol
D 5
min
D 3
0m
in
D 2
4h
D 1
h
Contr
ol
U 5
min
U 3
0m
in
U 2
4h
U 1
h
Contr
ol
U 5
min
U 3
0m
in
U 2
4h
U 1
h
DAMGO(D)short-term long-term
DAMGO(D)short-term long-term
long-termshort-termshort-term
U69,593(U)
Contr
ol
D 5
min
D 3
0m
in
D 2
4h
D 1
h
Contr
ol
D 5
min
D 3
0m
in
D 2
4h
D 1
h
Contr
ol
U 5
min
U 3
0m
in
U 2
4h
U 1
h
Contr
ol
U 5
min
U 3
0m
in
U 2
4h
U 1
h
DAMGO(D)short-term long-term
DAMGO(D)short-term long-term
long-termshort-termshort-term
U69,593(U)
Contr
ol
D 5
min
D 3
0m
in
D 2
4h
D 1
h
Contr
ol
D 5
min
D 3
0m
in
D 2
4h
D 1
h
Contr
ol
U 5
min
U 3
0m
in
U 2
4h
U 1
h
Contr
ol
U 5
min
U 3
0m
in
U 2
4h
U 1
h
DAMGO(D)short-term long-term
DAMGO(D)short-term long-term
long-termshort-termshort-term
U69,593(U)
Contr
ol
D 5
min
D 3
0m
in
D 2
4h
D 1
h
Contr
ol
D 5
min
D 3
0m
in
D 2
4h
D 1
h
Contr
ol
U 5
min
U 3
0m
in
U 2
4h
U 1
h
Contr
ol
U 5
min
U 3
0m
in
U 2
4h
U 1
h
by guest on April 5, 2020
http://ww
w.jbc.org/
Dow
nloaded from

27
24 2 5 15 30 60 2 4 6 12 18
Time Min Hours
1.0 2.0 3.0 4.0 5.0
*
*
** *
ER
K Ph
osp
ho
ryla
tio
n
(Fo
ld o
ve
r C
on
tro
l)
C DAMGO
0.5 1.0 1.5 2.0 2.5 3.0
2 5 15 30 60 2 4 6 12 18 24
Time Min Hours
** ** **
* **
ER
K P
ho
sp
ho
ryla
tio
n
(Fo
ld o
ve
r C
on
tro
l)
A
** **
* ** DAMGO
ER
K Ph
osp
ho
ryla
tio
n
(Fo
ld o
ve
r C
on
tro
l)
D
0.5 1.0 1.5 2.0 2.5 3.0 3.5
** *
*
* U69,593
2 5 15 30 60 2 4 6 12 24
Time Min Hours
ER
K Ph
osp
ho
ryla
tio
n
(Fo
ld O
ver
Co
ntr
ol)
0.5 1.5 1.0 2.0 2.5 3.0 3.5 4.0
Time
2 5 15 30 60 2 4 6 12 18 24 Hours Min
U69,593
* ** *
*
*
B *
Fig. 9
by guest on April 5, 2020
http://ww
w.jbc.org/
Dow
nloaded from

28
Fig. 10
Control
Control
DAMGO CTAP + DAMGO
U69,593 Nor-BNI + U69,593 U0126 + U69,593
U0126 + DAMGO
50
60
70
Control
DAMGO
CTAP +
DAMGO
U0126 +
DAMGO
*
#
% B
rdU
posi
tive C
ells
% B
rdU
posi
tive C
ells
10
20
30
40
50
60
70
Control
U69
norBNI
*
#
#*
*
40
% B
rdU
posi
tive C
ells
% B
rdU
posi
tive C
ells
*
10
20
30 *
#
% B
rdU
posi
tive C
ells
% B
rdU
posi
tive C
ells
Control
U69
norBNI +
U69,593
U0126 + U69,593
*
#
#*
*
% B
rdU
posi
tive C
ells
% B
rdU
posi
tive C
ells
*
50
60
70
Control
DAMGO
CTAP +
DAMGO
U0126 +
DAMGO
*
#
% B
rdU
posi
tive C
ells
% B
rdU
posi
tive C
ells
10
20
30
40
50
60
70
Control
U69
norBNI
*
#
#*
*
40
% B
rdU
posi
tive C
ells
% B
rdU
posi
tive C
ells
*
10
20
30 *
#
% B
rdU
posi
tive C
ells
% B
rdU
posi
tive C
ells
Control
U69
norBNI +
U69,593
U0126 + U69,593
*
#
#*
*
% B
rdU
posi
tive C
ells
% B
rdU
posi
tive C
ells
*
A B
by guest on April 5, 2020
http://ww
w.jbc.org/
Dow
nloaded from


Coscia and Mariana M. BelchevaEunhae Kim, Amy L. Clark, Alexi Kiss, Jason W. Hahn, Robin Wesselschmidt, Carmine J.
progenitorsMu and kappa opioids induce the differentiation of embryonic stem cells to neural
published online September 1, 2006J. Biol. Chem.
10.1074/jbc.M603862200Access the most updated version of this article at doi:
Alerts:
When a correction for this article is posted•
When this article is cited•
to choose from all of JBC's e-mail alertsClick here
by guest on April 5, 2020
http://ww
w.jbc.org/
Dow
nloaded from
Related Documents