msci.co m ©2012. All rights reserved. msci.c om Presentation to the 32 nd Annual William Blair Growth Conference June 12, 2012 Not for Redistribution

Msci.com ©2012. All rights reserved. msci.com Presentation to the 32 nd Annual William Blair Growth Conference June 12, 2012 Not for Redistribution.
Dec 24, 2015
Welcome message from author
This document is posted to help you gain knowledge. Please leave a comment to let me know what you think about it! Share it to your friends and learn new things together.
Transcript
msci.com©2012. All rights reserved. msci.com
Presentation to the 32nd Annual William Blair Growth ConferenceJune 12, 2012
Not for Redistribution
msci.com©2012. All rights reserved. 2msci.com
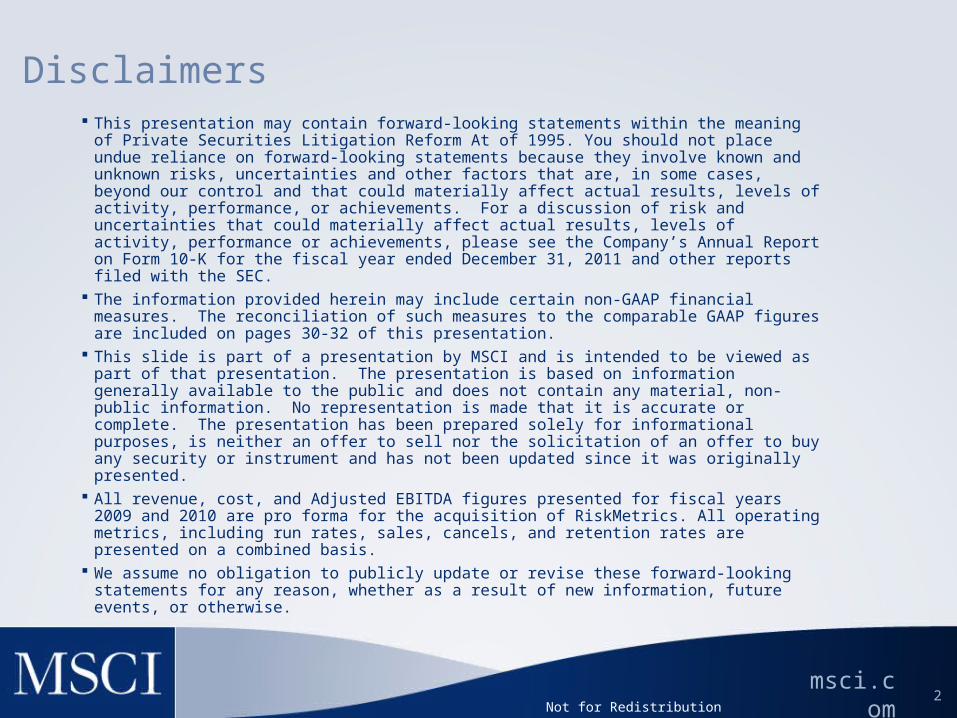
Disclaimers This presentation may contain forward-looking statements within the meaning of Private
Securities Litigation Reform At of 1995. You should not place undue reliance on forward-looking statements because they involve known and unknown risks, uncertainties and other factors that are, in some cases, beyond our control and that could materially affect actual results, levels of activity, performance, or achievements. For a discussion of risk and uncertainties that could materially affect actual results, levels of activity, performance or achievements, please see the Company’s Annual Report on Form 10-K for the fiscal year ended December 31, 2011 and other reports filed with the SEC.
The information provided herein may include certain non-GAAP financial measures. The reconciliation of such measures to the comparable GAAP figures are included on pages 30-32 of this presentation.
This slide is part of a presentation by MSCI and is intended to be viewed as part of that presentation. The presentation is based on information generally available to the public and does not contain any material, non-public information. No representation is made that it is accurate or complete. The presentation has been prepared solely for informational purposes, is neither an offer to sell nor the solicitation of an offer to buy any security or instrument and has not been updated since it was originally presented.
All revenue, cost, and Adjusted EBITDA figures presented for fiscal years 2009 and 2010 are pro forma for the acquisition of RiskMetrics. All operating metrics, including run rates, sales, cancels, and retention rates are presented on a combined basis.
We assume no obligation to publicly update or revise these forward-looking statements for any reason, whether as a result of new information, future events, or otherwise.
Not for Redistribution

msci.com©2012. All rights reserved. 3
Overview of MSCI
MSCI Index Products
MSCI Risk Management Analytics Products
Financial Overview
Q&A
Agenda
Not for Redistribution
msci.com©2012. All rights reserved. 4
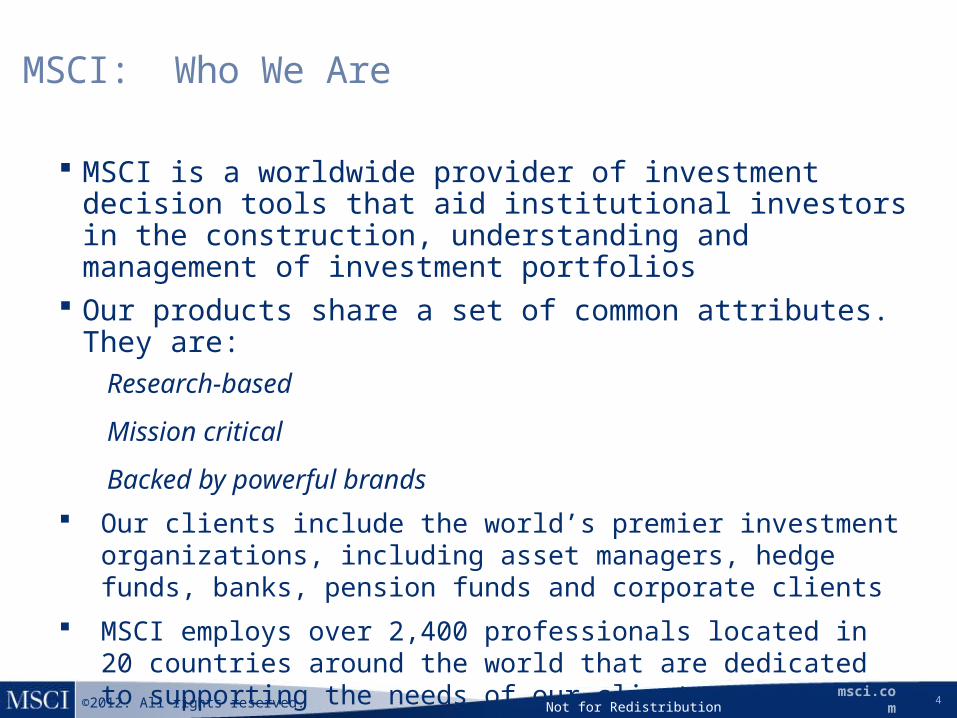
MSCI is a worldwide provider of investment decision tools that aid institutional investors in the construction, understanding and management of investment portfolios
Our products share a set of common attributes. They are:Research-based
Mission critical
Backed by powerful brands Our clients include the world’s premier investment organizations, including
asset managers, hedge funds, banks, pension funds and corporate clients MSCI employs over 2,400 professionals located in 20 countries around the
world that are dedicated to supporting the needs of our clients
MSCI: Who We Are
Not for Redistribution
msci.com©2012. All rights reserved.
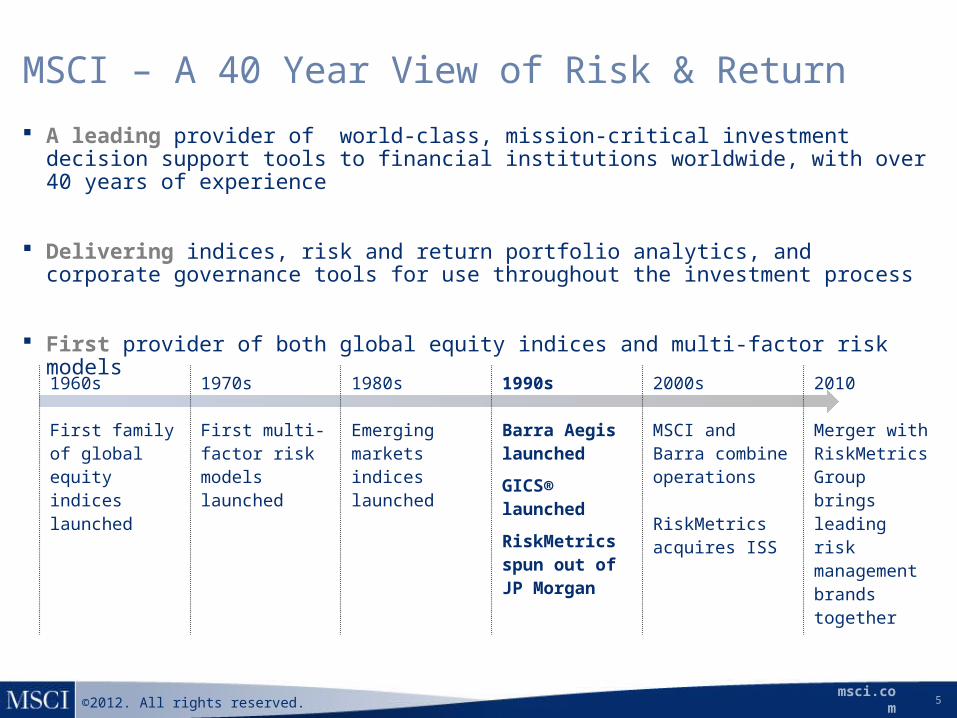
MSCI – A 40 Year View of Risk & Return
A leading provider of world-class, mission-critical investment decision support tools to financial institutions worldwide, with over 40 years of experience
Delivering indices, risk and return portfolio analytics, and corporate governance tools for use throughout the investment process
First provider of both global equity indices and multi-factor risk models
5
1960s
First family of global equity indices launched
1970s
First multi-factor risk models launched
1980s
Emerging markets indices launched
1990s
Barra Aegis launched
GICS® launched
RiskMetrics spun out of JP Morgan
2000s
MSCI and Barra combine operations
RiskMetrics acquires ISS
2010
Merger with RiskMetrics Group brings leading risk management brands together
msci.com©2012. All rights reserved. 6
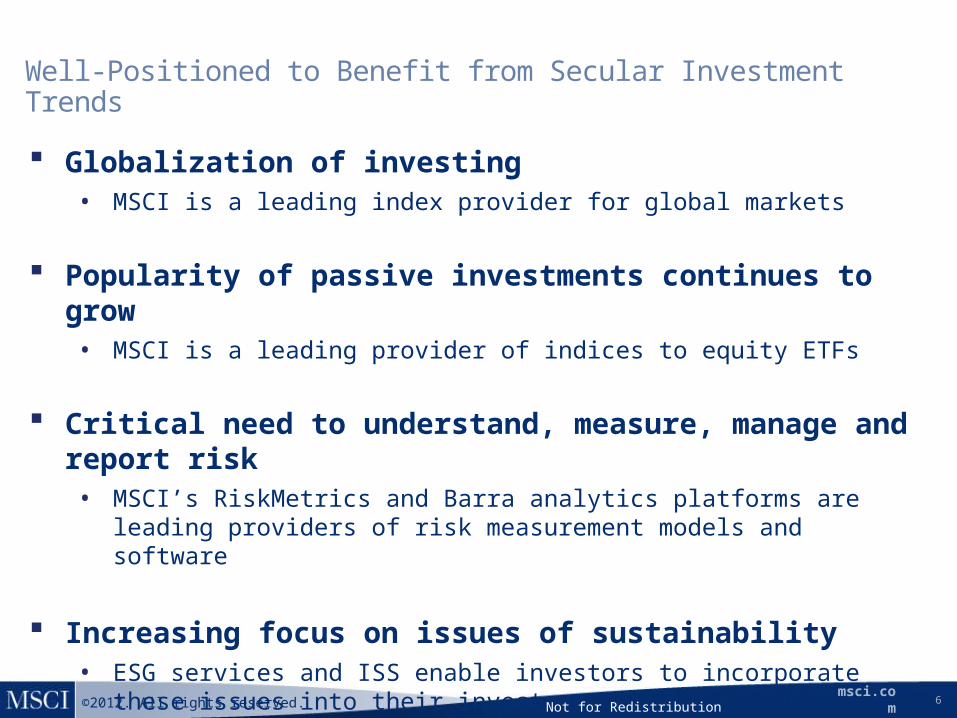
Well-Positioned to Benefit from Secular Investment Trends
Globalization of investing• MSCI is a leading index provider for global markets
Popularity of passive investments continues to grow• MSCI is a leading provider of indices to equity ETFs
Critical need to understand, measure, manage and report risk• MSCI’s RiskMetrics and Barra analytics platforms are leading providers of risk
measurement models and software
Increasing focus on issues of sustainability• ESG services and ISS enable investors to incorporate these issues into their
investment processes and proxy voting decisions
Not for Redistribution
msci.com©2012. All rights reserved. 7
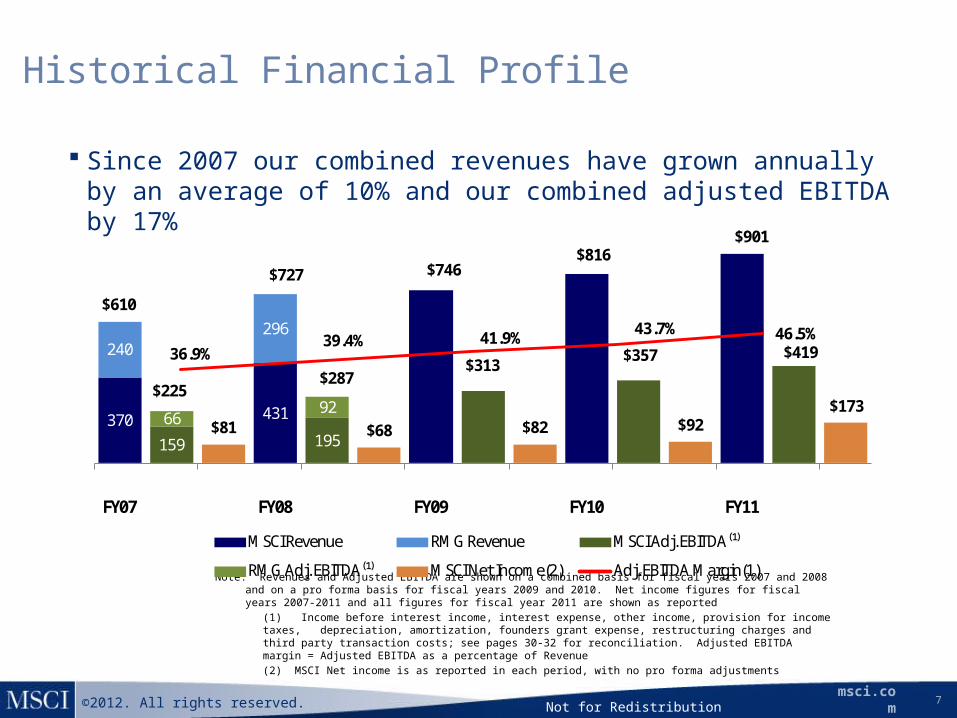
Historical Financial Profile
Note: Revenues and Adjusted EBITDA are shown on a combined basis for fiscal years 2007 and 2008 and on a pro forma basis for fiscal years 2009 and 2010. Net income figures for fiscal years 2007-2011 and all figures for fiscal year 2011 are shown as reported
(1) Income before interest income, interest expense, other income, provision for income taxes, depreciation, amortization, founders grant expense, restructuring charges and third party transaction costs; see pages 30-32 for reconciliation. Adjusted EBITDA margin = Adjusted EBITDA as a percentage of Revenue(2) MSCI Net income is as reported in each period, with no pro forma adjustments
Since 2007 our combined revenues have grown annually by an average of 10% and our combined adjusted EBITDA by 17%
Not for Redistribution
370 431
240 296
159 19566
92$81 $68 $82 $92
$173
FY07 FY08 FY09 FY10 FY11
MSCI Revenue RMG Revenue MSCI Adj. EBITDA⁽¹⁾
RMG Adj. EBITDA⁽¹⁾ MSCI Net Income(2) Adj. EBITDA Margin(1)
$610
$727 $746$816
$287$225
$313$357
$901
$41936.9%39.4% 41.9% 43.7% 46.5%

msci.com©2012. All rights reserved.
Overview of MSCI: Diverse and Global Client Base
8
Breakdown of Client Type
Note: Based on Q4 2011 run rate
Client Concentration
Note: Based on Q4 2011 run rate
Not for Redistribution
Geographic Composition of Run Rate
Employees by LocationNote: Based on Q4 2011 run rate

msci.com©2012. All rights reserved. 9
$119MM13%
MSCI Overview2011 Revenue of $901MM
Global equity indices to help measure equity performance and aid in the construction of equity portfolios and environmental, social and governance (“ESG”) investment tools
Models and software and managed services to help asset managers and owners measure and manage risk across multiple asset classes
Risk Management Analytics
Portfolio Management Analytics
Models and software to help asset managers construct and manage portfolios
Energy and commodity models and software to help measure, manage and price risk
Index and ESG$405MM
45%
$244MM27%
$14MM1%
$119MM13%
Governance
Proxy advisory services including global proxy research and outsourced voting solutions as well as governance advisory services to corporations
Energy and Commodity Analytics
Not for Redistribution

msci.com©2012. All rights reserved. 10
Overview of MSCI
MSCI Index Products
MSCI Risk Management Analytics Products
Financial Overview
Q&A
Agenda
Not for Redistribution
msci.com©2012. All rights reserved. 11
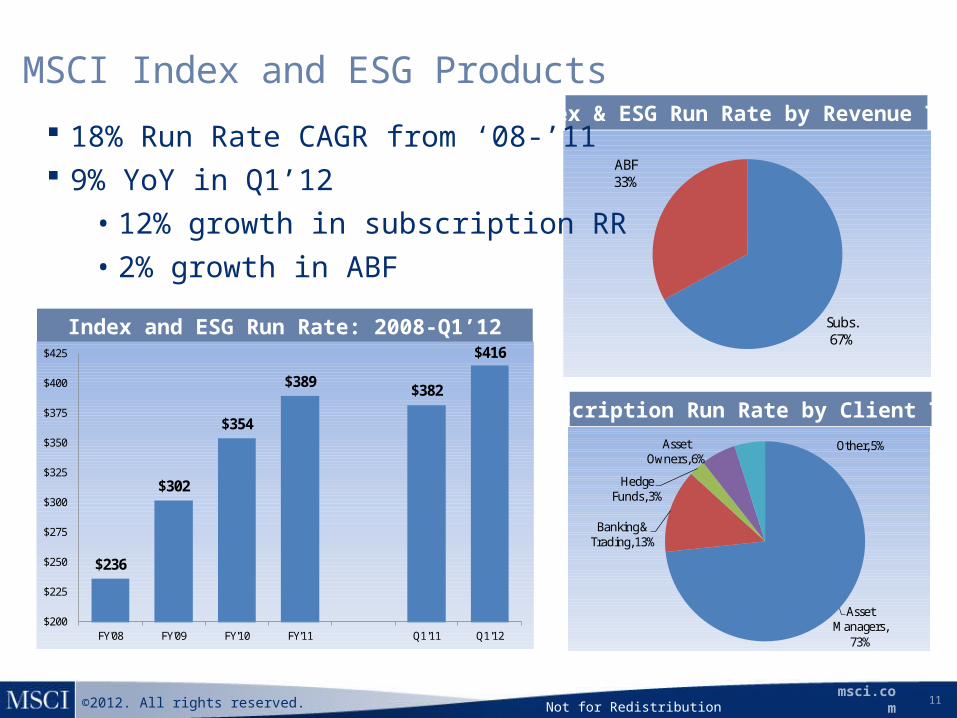
MSCI Index and ESG Products
Not for Redistribution
Subscription Run Rate by Client Type
Index & ESG Run Rate by Revenue Type
Index and ESG Run Rate: 2008-Q1’12
Asset Managers,
73%
Banking & Trading, 13%
Hedge Funds, 3%
Asset Owners, 6%
Other, 5%
Subs.67%
ABF33%
$236
$302
$354
$389 $382
$416
$200
$225
$250
$275
$300
$325
$350
$375
$400
$425
FY'08 FY'09 FY'10 FY'11 Q1'11 Q1'12
18% Run Rate CAGR from ‘08-’11 9% YoY in Q1’12
• 12% growth in subscription RR• 2% growth in ABF
msci.com©2012. All rights reserved.
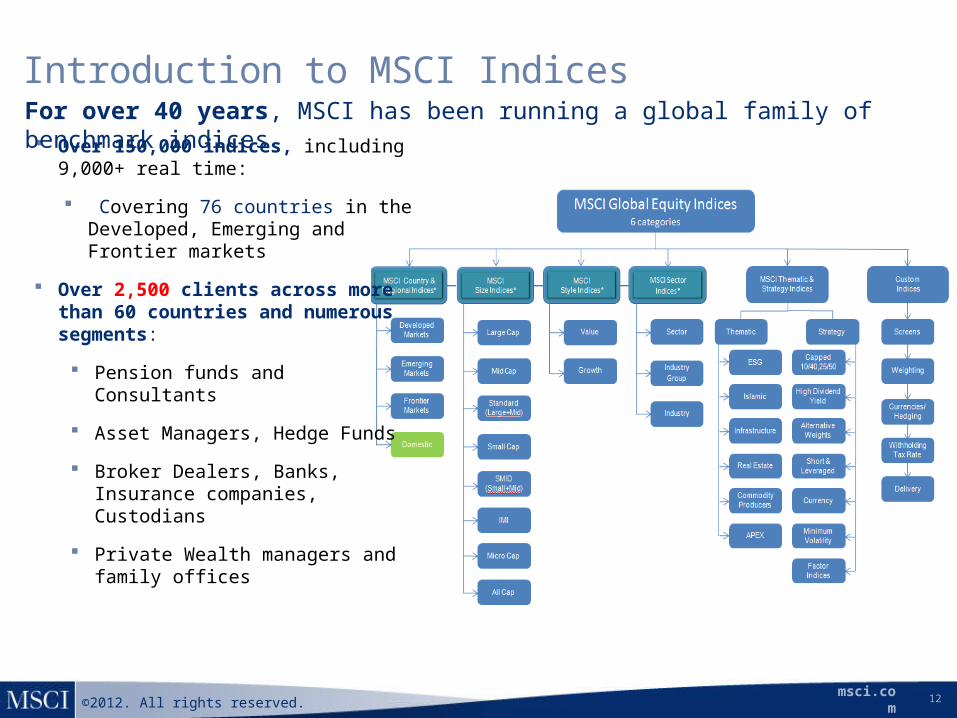
Introduction to MSCI Indices
12
Over 150,000 indices, including 9,000+ real time:
Covering 76 countries in the Developed, Emerging and Frontier markets
Over 2,500 clients across more than 60 countries and numerous segments:
Pension funds and Consultants
Asset Managers, Hedge Funds
Broker Dealers, Banks, Insurance companies, Custodians
Private Wealth managers and family offices
For over 40 years, MSCI has been running a global family of benchmark indices
msci.com©2012. All rights reserved. 13
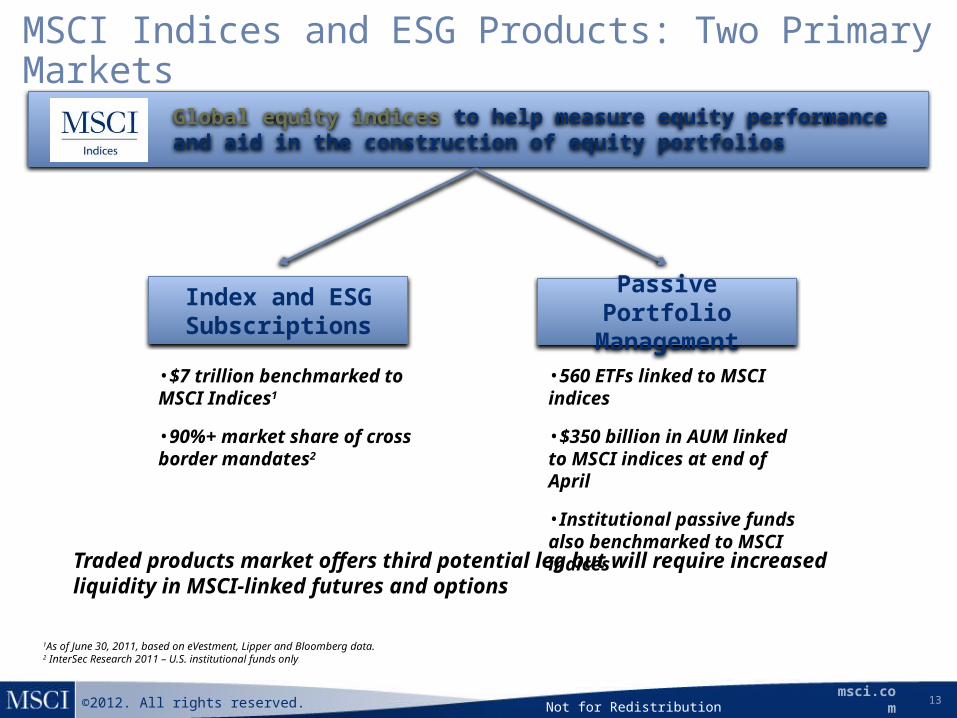
MSCI Indices and ESG Products: Two Primary Markets
Not for Redistribution
Global equity indices to help measure equity performance and aid in the construction of equity portfolios
Index and ESG Subscriptions
Passive Portfolio Management
•$7 trillion benchmarked to MSCI Indices1
•90%+ market share of cross border mandates2
•560 ETFs linked to MSCI indices
•$350 billion in AUM linked to MSCI indices at end of April
•Institutional passive funds also benchmarked to MSCI indices
Traded products market offers third potential leg but will require increased liquidity in MSCI-linked futures and options
1As of June 30, 2011, based on eVestment, Lipper and Bloomberg data.2 InterSec Research 2011 – U.S. institutional funds only

msci.com©2012. All rights reserved. 14
Continue to grow the core benchmark business• More modules, more users and more locations
• Selective fee increases
• Seek out new clients
Encourage use of MSCI ACWI as key policy benchmark for asset owners
Expand offering of MSCI Investment Strategy Indices• Supplements our core market benchmark business
• Relationships with asset owners are critical
• Support new ETF launches based on these products
Expand usage by non-asset management clients• Expand use case for hedge funds
• Enhance focus on traded products markets
Not for Redistribution
Index Growth Strategy

msci.com©2012. All rights reserved. 15
Overview of MSCI
MSCI Index Products
MSCI Risk Management Analytics Products
Financial Overview
Q&A
Agenda
Not for Redistribution
msci.com©2012. All rights reserved. 16
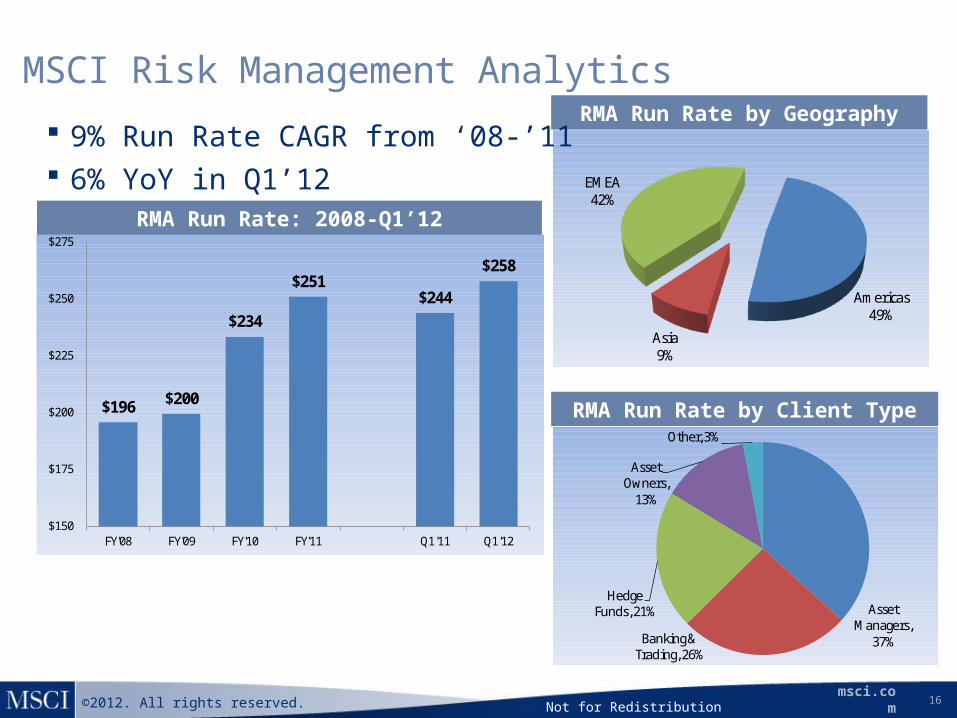
MSCI Risk Management Analytics
Not for Redistribution
RMA Run Rate by Client Type
RMA Run Rate by Geography
Americas49%
Asia9%
EMEA42%
Asset Managers,
37%Banking & Trading, 26%
Hedge Funds, 21%
Asset Owners,
13%
Other, 3%
RMA Run Rate: 2008-Q1’12
9% Run Rate CAGR from ‘08-’11 6% YoY in Q1’12
$196 $200
$234
$251 $244
$258
$150
$175
$200
$225
$250
$275
FY'08 FY'09 FY'10 FY'11 Q1'11 Q1'12
msci.com©2012. All rights reserved. 17
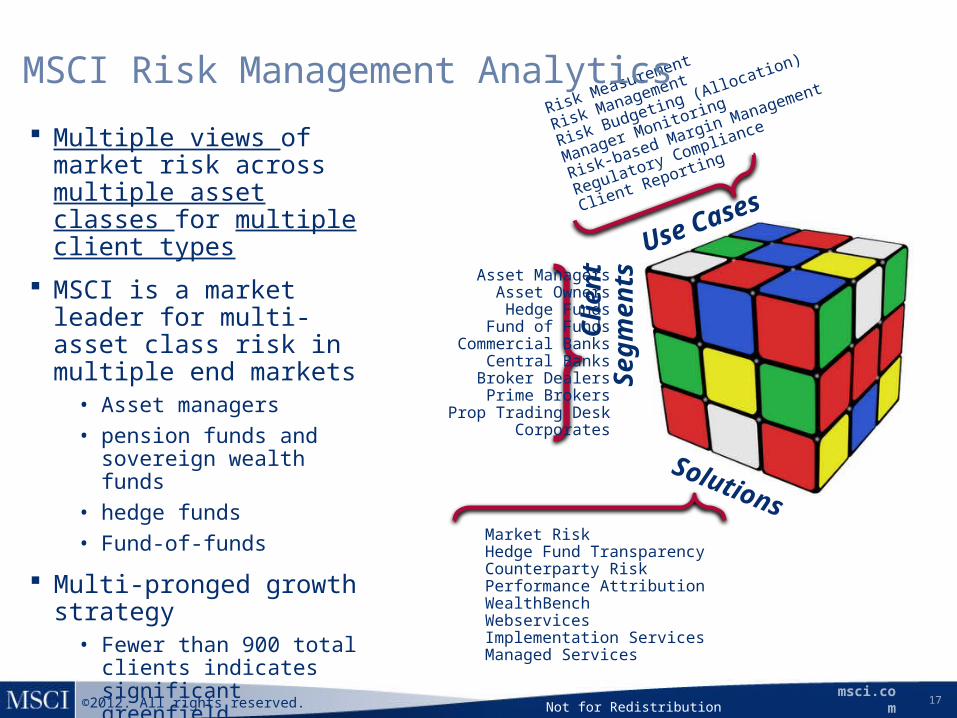
Multiple views of market risk across multiple asset classes for multiple client types
MSCI is a market leader for multi-asset class risk in multiple end markets
• Asset managers• pension funds and sovereign
wealth funds• hedge funds• Fund-of-funds
Multi-pronged growth strategy• Fewer than 900 total clients
indicates significant greenfield opportunity
• Broaden risk coverage to drive upsells
Not for Redistribution
Use Cases
Clie
ntSe
gmen
ts
Solutions
Risk Measurement
Risk Management
Risk Budgeting (Allocation)
Manager Monitoring
Risk-based Margin Management
Regulatory Compliance
Client Reporting
Asset ManagersAsset OwnersHedge Funds
Fund of FundsCommercial Banks
Central BanksBroker DealersPrime Brokers
Prop Trading DeskCorporates
Market Risk Hedge Fund TransparencyCounterparty RiskPerformance AttributionWealthBenchWebservicesImplementation ServicesManaged Services
MSCI Risk Management Analytics
msci.com©2012. All rights reserved. 18
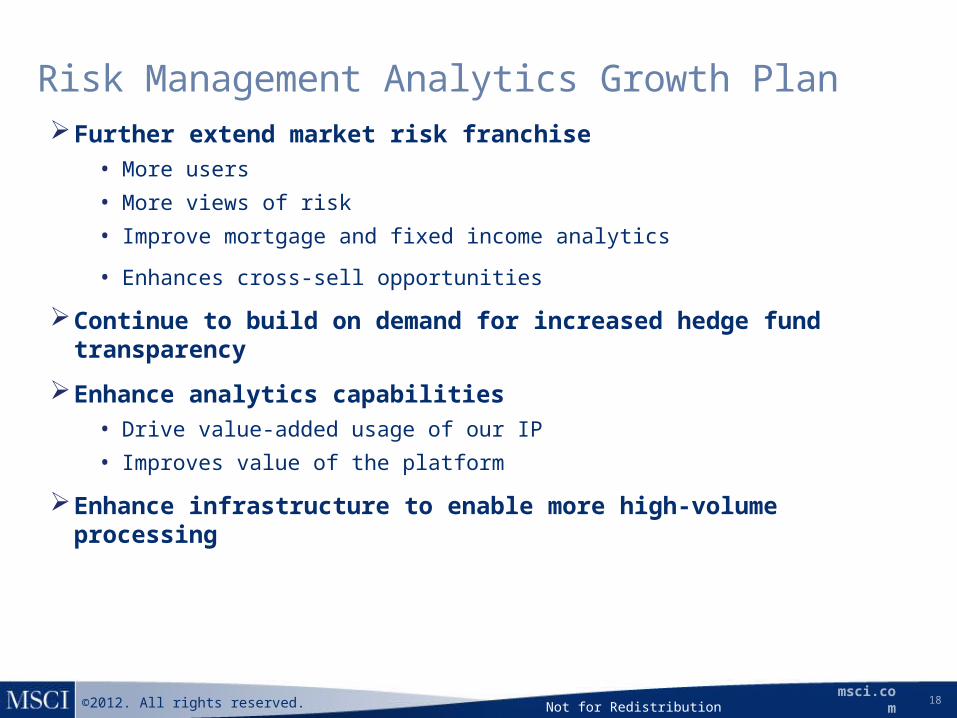
Risk Management Analytics Growth Plan
Further extend market risk franchise• More users
• More views of risk
• Improve mortgage and fixed income analytics
• Enhances cross-sell opportunities
Continue to build on demand for increased hedge fund transparency
Enhance analytics capabilities• Drive value-added usage of our IP
• Improves value of the platform
Enhance infrastructure to enable more high-volume processing
2010 New Recurring Subscription Sales
Not for Redistribution
msci.com©2012. All rights reserved. 19
Overview of MSCI
MSCI Index Products
MSCI Risk Management Analytics Products
Financial Overview
Q&A
Agenda
Not for Redistribution
msci.com©2012. All rights reserved. 20
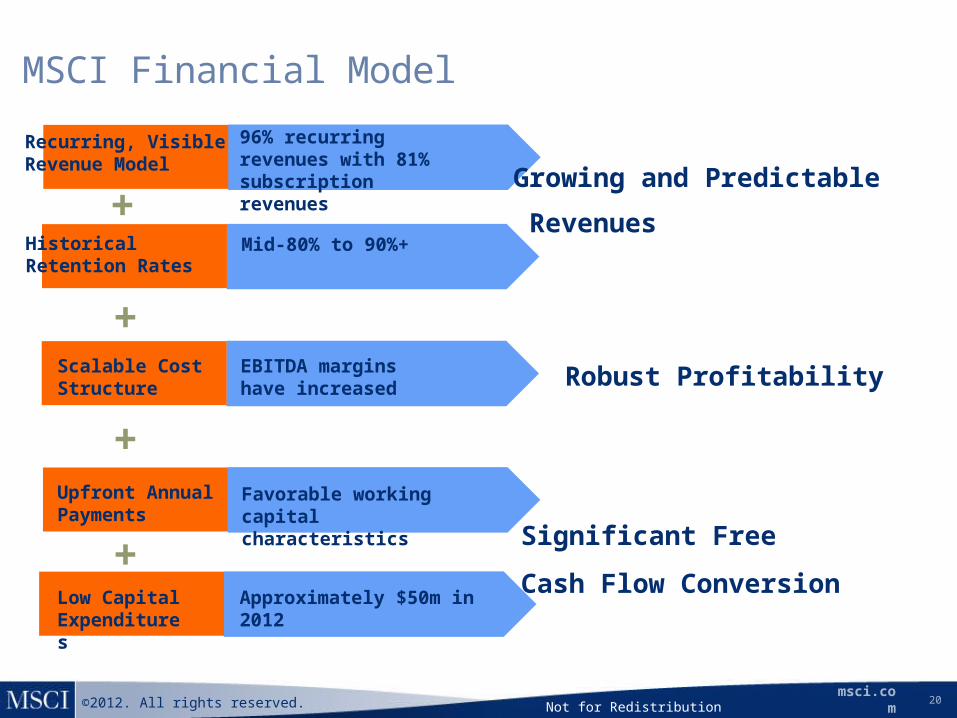
Recurring, VisibleRevenue Model
HistoricalRetention Rates
Scalable Cost Structure
Upfront Annual Payments
Low Capital Expenditures
EBITDA margins have increased
Favorable working capital characteristics
Approximately $50m in 2012
+
+
+
+
Robust Profitability
Growing and Predictable
Revenues
96% recurring revenues with 81% subscription revenues
Mid-80% to 90%+
Significant Free
Cash Flow Conversion
MSCI Financial Model
Not for Redistribution
msci.com©2012. All rights reserved. 21
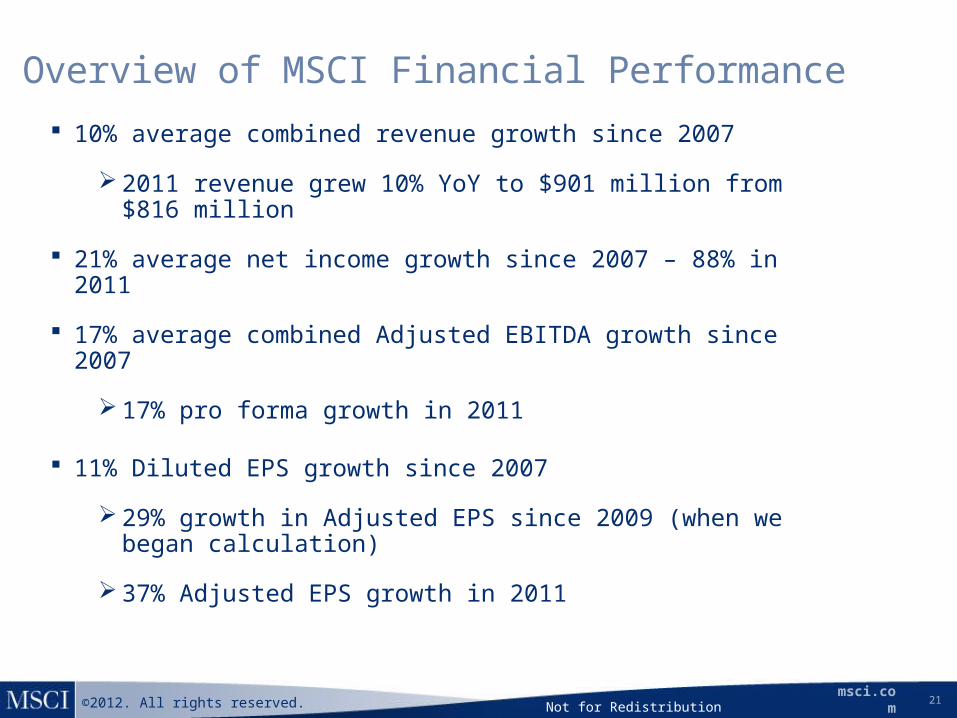
Overview of MSCI Financial Performance 10% average combined revenue growth since 2007
2011 revenue grew 10% YoY to $901 million from $816 million
21% average net income growth since 2007 – 88% in 2011
17% average combined Adjusted EBITDA growth since 2007
17% pro forma growth in 2011
11% Diluted EPS growth since 2007
29% growth in Adjusted EPS since 2009 (when we began calculation)
37% Adjusted EPS growth in 2011
Not for Redistribution

msci.com©2012. All rights reserved. 22
$729 $782
$134
$137
$550
$650
$750
$850
$950
Q1 2011 Q1 2012
ABF Subscription
ABF RR Growth: 2%
Subscription RR Growth: 7%
Summary of First Quarter 2012 Operating ResultsTotal YoY Run Rate Growth of 6%
Total Sales1 and Retention
Q1’12 run rate (RR) grew YoY by 6% to $919 million
Subscription run rate grew by 7%Asset-based fee (ABF) run rate
grew by 2%
Total sales1 of $43 million in Q1’12 -down 11% from Q1’11
Q1’12 sales down 3% excluding impact of a single $4.2 million non-recurring ABF sale in Q1’11
Q1’12 Recurring subscription sales of $34 million down 3% from Q1’11
Retention rates steady at 93% for Q1’12
New office opened in Seoul, Korea
($ in millions)
(1) Includes recurring subscription sales and non-recurring sales
Q1'11 Q1'12 ChangeRecurring Subcription Sales 35$ 34$ -3%Non-recurring sales ex ABF 9 9 -1%Non-Recurring ABF Sale 4 - n/a
Total Sales 48$ 43$ -11%
Aggregate Retention Rate 92% 93% 1%
msci.com©2012. All rights reserved. 23
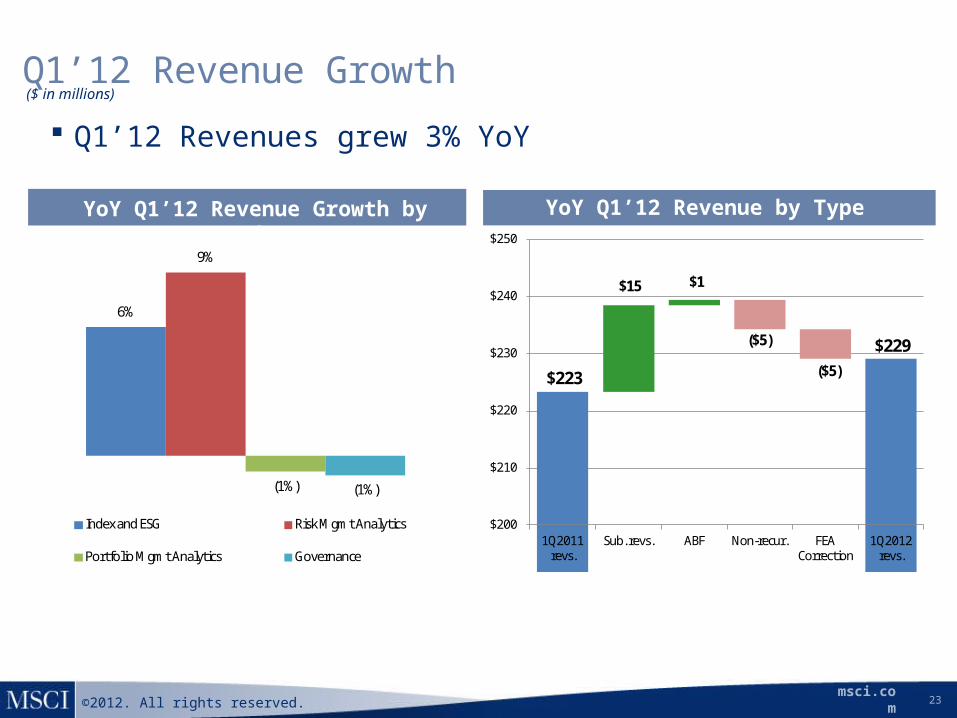
Q1’12 Revenue Growth($ in millions)
YoY Q1’12 Revenue by TypeYoY Q1’12 Revenue Growth by Product
$223
$229
$15 $1
$200
$210
$220
$230
$240
$250
1Q2011 revs.
Sub. revs. ABF Non-recur. FEA Correction
1Q2012 revs.
($5)
($5)
6%
9%
(1%) (1%)
Index and ESG Risk Mgmt Analytics
Portfolio Mgmt Analytics Governance
Q1’12 Revenues grew 3% YoY
msci.com©2012. All rights reserved. 24
$0
$25
$50
$75
$100
Q1'11 Q1'12
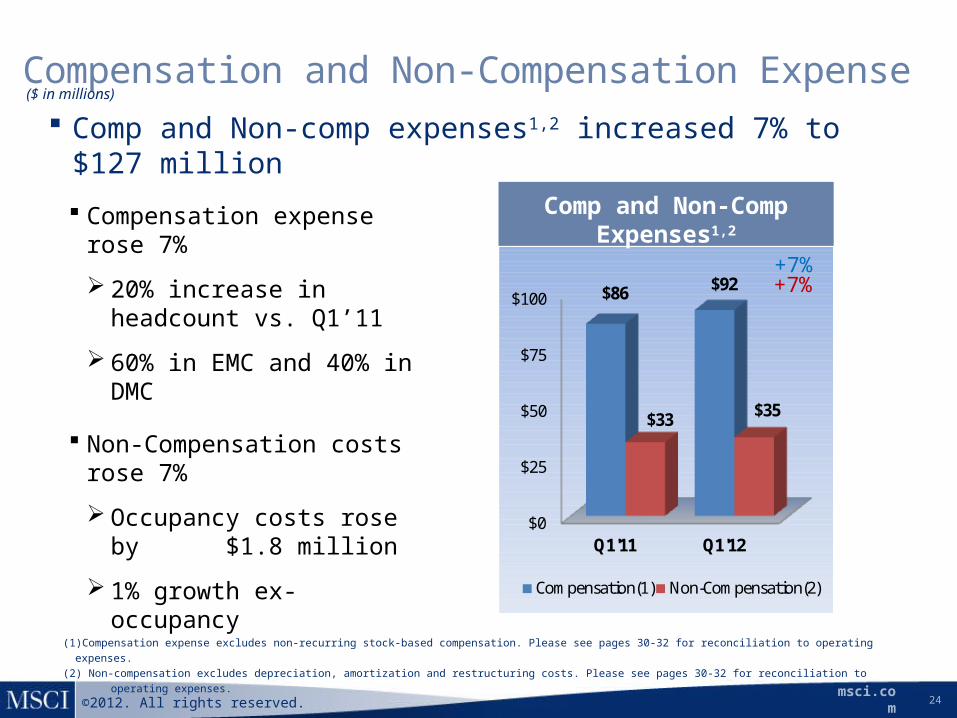
$86 $92
$33 $35
Compensation(1) Non-Compensation(2)
Compensation and Non-Compensation Expense
Comp and Non-Comp Expenses1,2
+7%
($ in millions)
(1)Compensation expense excludes non-recurring stock-based compensation. Please see pages 30-32 for reconciliation to operating expenses.(2) Non-compensation excludes depreciation, amortization and restructuring costs. Please see pages 30-32 for reconciliation to operating expenses.
+7%
Comp and Non-comp expenses1,2 increased 7% to $127 million
Compensation expense rose 7%
20% increase in headcount vs. Q1’11
60% in EMC and 40% in DMC
Non-Compensation costs rose 7%
Occupancy costs rose by $1.8 million
1% growth ex-occupancy

msci.com©2012. All rights reserved. 25
$0.00
$0.10
$0.20
$0.30
$0.40
$0.50
Q1'11 Q1'12
$0.27
$0.35
$0.43 $0.44
Diluted EPS Adjusted EPS
Summary of Profitability Metrics: Net Income, EPS and Adjusted EBITDA1
$ per share +2%+30%
Diluted and Adjusted 2 EPS
Net Income rose 30% Adjusted EBITDA1 was
$102 million Excluding correction,
Adj. EBITDA was $107 million, up 3% YoY
Diluted EPS rose 30% Adjusted EPS2 rose 2%
YoY to $0.44 Excluding correction,
Adj. EPS was $0.47, up 9% YoY
$0
$50
$100
$150
Q1'11 Q1'12
$34 $44
$104 $102
Net Income Adj. EBITDA
Net Income and Adj. EBITDA1
+31%-2%
(1) Net income before provision for income taxes, depreciation and amortization, other net expense and income, non-recurring stock-based compensation and restructuring costs. Please see pages 30-32 for reconciliation.
(2) For the purpose of calculating Adjusted EPS, the after-tax impact of non-recurring stock-based compensation, amortization of intangible assets, debt repayment expenses and restructuring costs are excluded from the calculation of EPS; see pages 30-32 for reconciliation.
msci.com©2012. All rights reserved. 26
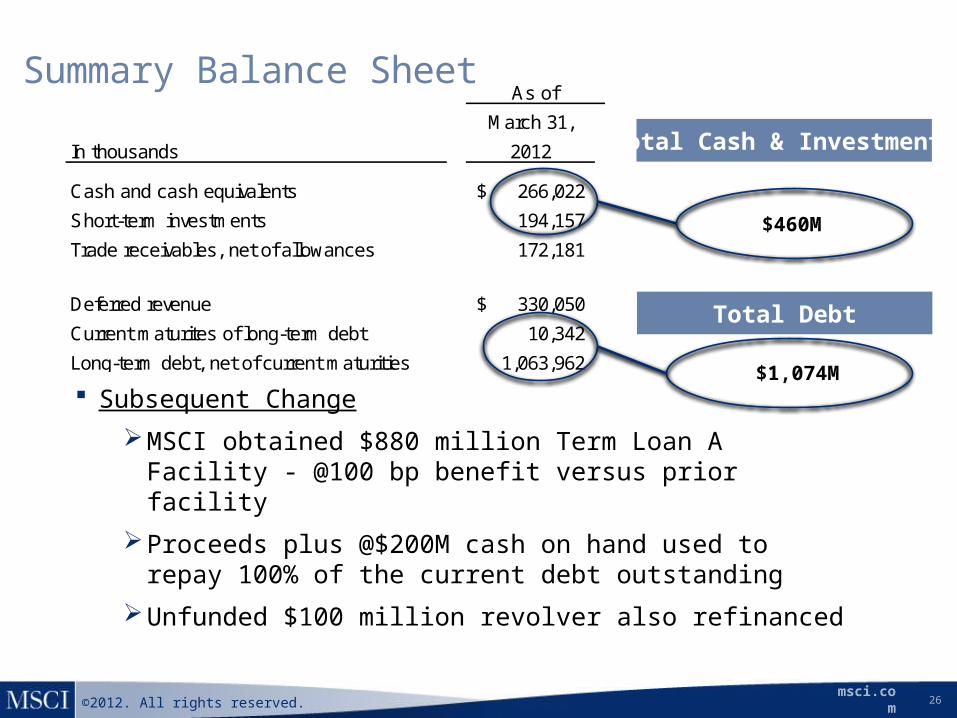
March 31,
In thousands 2012
Cash and cash equivalents 266,022$
Short-term investments 194,157
Trade receivables, net of allowances 172,181
Deferred revenue 330,050$
Current maturites of long-term debt 10,342
Long-term debt, net of current maturities 1,063,962
As of
$1,074M
Summary Balance Sheet
$460M
Subsequent ChangeMSCI obtained $880 million Term Loan A Facility - @100 bp benefit
versus prior facilityProceeds plus @$200M cash on hand used to repay 100% of the
current debt outstandingUnfunded $100 million revolver also refinanced
Total Cash & Investments
Total Debt
msci.com©2012. All rights reserved. 27
MSCI: Who we are
Focused. MSCI is focused on providing highly scalable, mission-critical investment decision support tools to investors worldwide.
Scalable. MSCI seeks to build investment decision tools that leverage common data sources and can be used by multiple investors worldwide, generating incremental profits that MSCI can invest to develop additional tools and services.
Growth-oriented. MSCI is a growth company, committed to delivering attractive top- and bottom-line growth over cycles. We believe our growth is supported by long-term, secular trends.
Not for Redistribution
msci.com©2012. All rights reserved. 28
Overview of MSCI
MSCI Index Products
MSCI Risk Management Analytics Products
Financial Overview
Q&A
Agenda
Not for Redistribution
msci.com©2012. All rights reserved. 29
Use of Non-GAAP Financial Measures MSCI has presented supplemental non-GAAP financial measures as part of this presentation. A reconciliation is provided that reconciles each
non-GAAP financial measure with the most comparable GAAP measure. The presentation of non-GAAP financial measures should not be considered as alternative measures for the most directly comparable GAAP financial measures. These measures are used by management to monitor the financial performance of the business, inform business decision making and forecast future results.
Adjusted EBITDA is defined as net income before provision for income taxes, other net expense and income, depreciation and amortization, non-recurring stock-based compensation and restructuring costs .
Adjusted Net Income and Adjusted EPS are defined as net income and EPS, respectively, before provision for non-recurring stock-based compensation expenses, amortization of intangible assets, restructuring costs and the accelerated interest expense resulting from the termination of an interest rate swap and the accelerated amortization of deferred financing and debt discount costs (debt repayment expenses and refinancing expenses), as well as for any related tax effects.
We believe that adjustments related to restructuring costs and debt repayment and refinancing expenses are useful to management and investors because it allows for an evaluation of MSCI’s underlying operating performance by excluding the costs incurred in connection with the acquisition of RiskMetrics. Additionally, we believe that adjusting for non-recurring stock-based compensation and amortization of intangible assets may help investors compare our performance to that of other companies in our industry as we do not believe that other companies in our industry have as significant a portion of their operating expenses represented by non-recurring stock-based compensation and amortization of intangible assets. We believe that the non-GAAP financial measures presented in this presentation facilitate meaningful period-to-period comparisons and provide a baseline for the evaluation of future results.
Adjusted EBITDA and Adjusted EPS are not defined in the same manner by all companies and may not be comparable to other similarly titled measures of other companies.
During first quarter 2012, MSCI recorded a non-cash $5.2 million cumulative revenue reduction to correct an error related to energy and commodity analytics revenues previously reported prior to January 1, 2012. Because the revenue that was corrected as part of this adjustment is a non-recurring charge related to prior periods, we believe that excluding it from revenue may support a more comprehensive understanding of MSCI’s underlying operating performance for the current period. Adjusted EBITDA and Adjusted EPS calculations excluding the impact of this non-recurring non-cash correction are also presented herein.
msci.com©2012. All rights reserved. 30
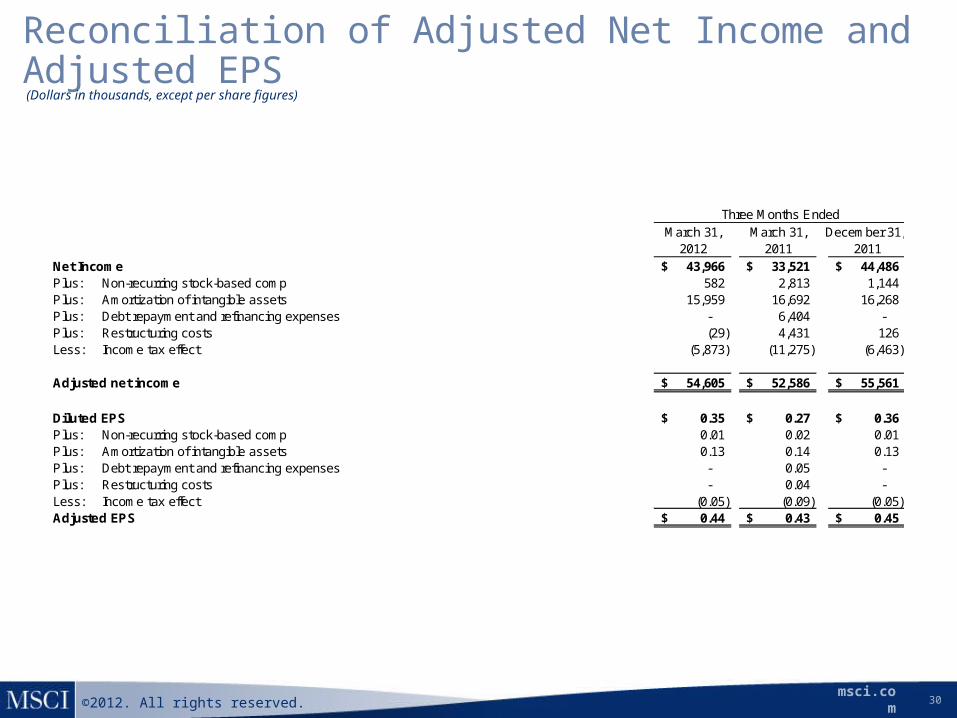
Reconciliation of Adjusted Net Income and Adjusted EPS(Dollars in thousands, except per share figures)
March 31, March 31, December 31, 2012 2011 2011
Net Income 43,966$ 33,521$ 44,486$ Plus: Non-recurring stock-based comp 582 2,813 1,144 Plus: Amortization of intangible assets 15,959 16,692 16,268 Plus: Debt repayment and refinancing expenses - 6,404 - Plus: Restructuring costs (29) 4,431 126 Less: Income tax effect (5,873) (11,275) (6,463)
Adjusted net income 54,605$ 52,586$ 55,561$
Diluted EPS 0.35$ 0.27$ 0.36$ Plus: Non-recurring stock-based comp 0.01 0.02 0.01 Plus: Amortization of intangible assets 0.13 0.14 0.13 Plus: Debt repayment and refinancing expenses - 0.05 - Plus: Restructuring costs - 0.04 - Less: Income tax effect (0.05) (0.09) (0.05) Adjusted EPS 0.44$ 0.43$ 0.45$
Three Months Ended
msci.com©2012. All rights reserved. 31
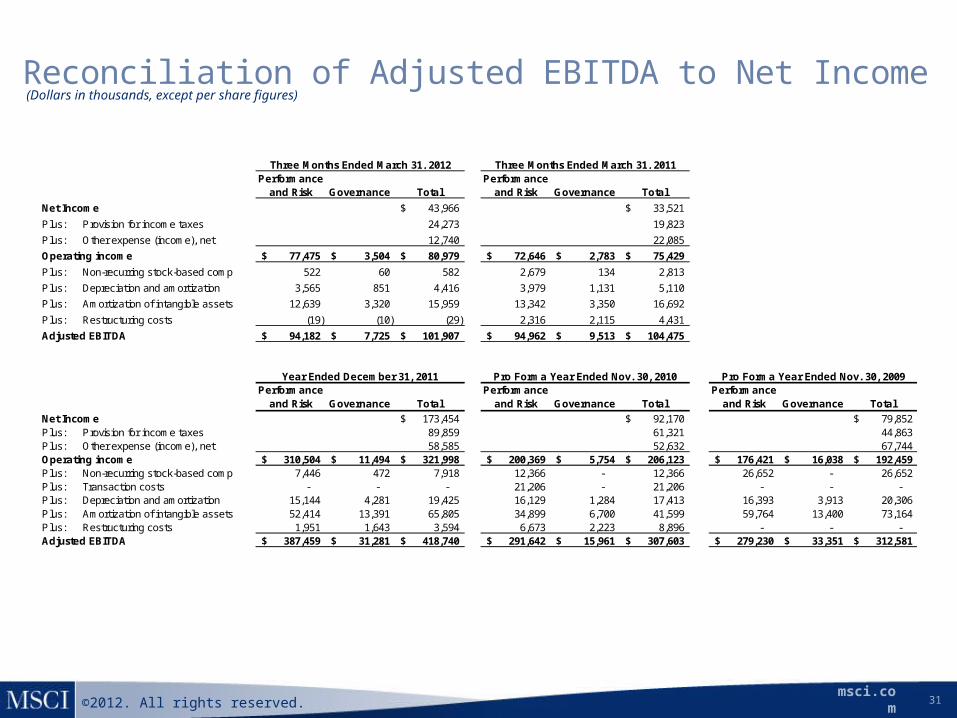
Reconciliation of Adjusted EBITDA to Net Income(Dollars in thousands, except per share figures)
Performance and Risk Governance Total
Performance and Risk Governance Total
Net Income 43,966$ 33,521$
Plus: Provision for income taxes 24,273 19,823
Plus: Other expense (income), net 12,740 22,085
Operating income 77,475$ 3,504$ 80,979$ 72,646$ 2,783$ 75,429$
Plus: Non-recurring stock-based comp 522 60 582 2,679 134 2,813
Plus: Depreciation and amortization 3,565 851 4,416 3,979 1,131 5,110
Plus: Amortization of intangible assets 12,639 3,320 15,959 13,342 3,350 16,692
Plus: Restructuring costs (19) (10) (29) 2,316 2,115 4,431
Adjusted EBITDA 94,182$ 7,725$ 101,907$ 94,962$ 9,513$ 104,475$
Performance and Risk Governance Total
Performance and Risk Governance Total
Performance and Risk Governance Total
Net Income 173,454$ 92,170$ 79,852$ Plus: Provision for income taxes 89,859 61,321 44,863 Plus: Other expense (income), net 58,585 52,632 67,744 Operating income 310,504$ 11,494$ 321,998$ 200,369$ 5,754$ 206,123$ 176,421$ 16,038$ 192,459$ Plus: Non-recurring stock-based comp 7,446 472 7,918 12,366 - 12,366 26,652 - 26,652 Plus: Transaction costs - - - 21,206 - 21,206 - - - Plus: Depreciation and amortization 15,144 4,281 19,425 16,129 1,284 17,413 16,393 3,913 20,306 Plus: Amortization of intangible assets 52,414 13,391 65,805 34,899 6,700 41,599 59,764 13,400 73,164 Plus: Restructuring costs 1,951 1,643 3,594 6,673 2,223 8,896 - - - Adjusted EBITDA 387,459$ 31,281$ 418,740$ 291,642$ 15,961$ 307,603$ 279,230$ 33,351$ 312,581$
Three Months Ended March 31, 2012 Three Months Ended March 31, 2011
Year Ended December 31, 2011 Pro Forma Year Ended Nov. 30, 2010 Pro Forma Year Ended Nov. 30, 2009

msci.com©2012. All rights reserved. 32
Reconciliation of Operating Expenses
March 31, March 31, March 31,
In thousands 2012 2011 2011
Cost of services
Compensation 53,549$ 51,082$ 4.8%
Non-recurring stock based comp 268 1,130 (76.3%)
Total compensation 53,817$ 52,212$ 3.1%
Non-compensation 18,474 18,006 2.6%
Total cost of services 72,291$ 70,218$ 3.0%
Selling, general and administrative
Compensation 38,492$ 34,805$ 10.6%
Non-recurring stock based comp 314 1,683 (81.3%)
Total compensation 38,806$ 36,488$ 6.4%
Non-compensation 16,630 14,930 11.4%
Total selling, general and administrative 55,436$ 51,418$ 7.8%
Restructuring costs (29) 4,431 (100.7%)
Amortization of intangibles 15,959 16,692 (4.4%)
Depreciation and amortization 4,416 5,110 (13.6%)
Total operating expenses 148,073$ 147,869$ 0.1%
In thousands
Total non-recurring stock-based compensation 582$ 2,813$ (79.3%)
Compensation excluding non-recurring comp 92,041 85,887 7.2%
Non-compensation expenses 35,104 32,936 6.6%
Restructuring costs (29) 4,431 (100.7%)
Amortization of intangibles 15,959 16,692 (4.4%)
Depreciation and amortization 4,416 5,110 (13.6%)
Total operation expensesTotal operating expenses 148,073$ 147,869$ 0.1%
Three Months Ended % Change from
(Dollars in thousands, except per share figures)
Related Documents