Prevalence of Severe Childhood Obesity in England: 2006-2013 TeesRep - Teesside's Research Repository Item type Article Authors Ells, L. J. (Louisa) Publisher BMJ Publishing Group Journal Archives of Disease in Childhood Rights Author can archive post-print (ie final draft post- refereeing). For full details see http://www.sherpa.ac.uk/romeo [Accessed: 22/12/2014] Downloaded 29-Jun-2018 11:04:11 Link to item http://hdl.handle.net/10149/337502 TeesRep - Teesside University's Research Repository - https://tees.openrepository.com/tees

Welcome message from author
This document is posted to help you gain knowledge. Please leave a comment to let me know what you think about it! Share it to your friends and learn new things together.
Transcript
Prevalence of Severe Childhood Obesity in England: 2006-2013
TeesRep - Teesside'sResearch Repository
Item type Article
Authors Ells, L. J. (Louisa)
Publisher BMJ Publishing Group
Journal Archives of Disease in Childhood
Rights Author can archive post-print (ie final draft post-refereeing). For full details seehttp://www.sherpa.ac.uk/romeo [Accessed: 22/12/2014]
Downloaded 29-Jun-2018 11:04:11
Link to item http://hdl.handle.net/10149/337502
TeesRep - Teesside University's Research Repository - https://tees.openrepository.com/tees
1
Original Research Report for Archives of diseases in childhood - Title Page:
Title: Prevalence of Severe Childhood Obesity in England: 2006-2013.
Running Title: Prevalence of Severe Childhood Obesity in England
Authors
*Louisa J. Ells1,2, Reader in Public Health and Obesity, PhD
Caroline Hancock2, Senior Analyst, MSc
Vicky R Copley2, Principal analyst, PhD
Emma Mead1, PhD student, MSc
Hywell Dinsdale2, Senior Analyst, MSc
Sanjay Kinra3, Senior Lecturer in Non-Communicable Disease Epidemiology, PhD
Russell M. Viner4, Professor in Adolescent Health, PhD
Harry Rutter5, Senior Clinical Research Fellow, MB BChir
1 Health and Social Care Institute, Teesside University, Borough Road, Middlesbrough, TS1 3BA
2 Public Health England, 4150 Chancellor Court, Oxford, OX4 2GX
3 Dept of non communicable disease epidemiology, London School of Hygiene and Tropical
Medicine, Keppel Street, London, WC1E 7HT
4 Institute of Child Health, University College London, Gower Street, London, WC1E 6BT
5 ECOHOST, Department of Health Services Research and Policy, London School of Hygiene and
Tropical Medicine, 15-17 Tavistock Place, London, WC1H 9SH
* Corresponding author: email: [email protected], tel: 01642 342936, fax: 01642 342067
2
Abstract:
Background: International evidence shows that severe paediatric obesity results in an increased risk
of ill health, and may require specialised weight management strategies, yet there remains a lack of
data on the extent of the problem.
Objective: To examine the prevalence of severe obesity in children aged 4-5 and 10-11 years, attending
English schools between 2006/07 and 2012/13.
Design: A retrospective analysis of National Child Measurement Programme (NCMP) data.
Setting: Maintained schools in England.
Participants: All children aged 4-5 and 10-11 years included in the NCMP dataset.
Main outcome measures: Prevalence of severe childhood obesity, defined using the 99.6th centile of
the UK90 growth reference for BMI, analysed by sex; geography; ethnic group; and deprivation.
Results: The key findings show that in 2012/13, severe obesity (BMI ≥UK90 99.6th centile) was found
in 1.9% of girls and 2.3% of boys aged 4-5 years, and 2.9% of girls and 3.9% of boys aged 10-11 years.
Severe obesity prevalence varies geographically and is more prevalent in children from deprived areas,
and among those from Black ethnic groups.
Conclusions: The findings from this study should help to raise awareness of the prevalence of severe
obesity and support the provision of adequate treatment and prevention services both to support
children who are already severely obese, and reduce the prevalence of extreme weight in the future.
Key Words: severe obesity, child, prevalence, England
3
Introduction:
In children the relation between body mass index (BMI) and adiposity varies with age and sex, so BMI
thresholds are usually defined in terms of specific centiles on a growth reference. There is, however,
currently no universal definition of severe paediatric obesity. In England the British 1990 (UK90)
growth charts for BMI are frequently used to define paediatric weight status according to age and sex,
with the highest centile shown on the charts being the 99.6th [1]. The International Obesity Task Force
(IOTF) has recently published a definition for ‘morbid obesity’ in children, which they define as
corresponding to a BMI value of 35kg/m2 at age 18 [2]. In the United States (US), an expert committee
proposed a classification of severe childhood obesity in 2007 as a BMI greater than or equal to the
99th centile of the Centers for Disease Control (CDC) growth reference [3]. This classification has
subsequently been challenged and a new classification of BMI greater than or equal to 120% of the
95% centile proposed [4-6]. Using the new definition, analysis of the US National Health and Nutrition
Examination Survey (NHANES) 1999-2012 identified an upward trend in the rates of severe obesity
over time, with the latest 2011-2012 data showing a prevalence of 5.9% in children aged 2-19 years
[7]. This study also demonstrated that severe obesity prevalence was highest amongst older children,
and those from Hispanic and non-Hispanic Black populations. These data complement an earlier study
which also reported an association between severe obesity and the development of hypertension [8].
Further US studies show that severe obesity is associated both with increased paediatric
cardiovascular risk factors, and risk of severe obesity in adulthood [9][10]. These studies complement
similar findings from a Dutch paediatric surveillance survey [11], which found that two out of three
severely obese children (defined using the Dutch age and sex specific cut points corresponding to an
adult BMI of 35 or more) have cardiovascular risk factors.
A 2013 scientific statement from the American Heart Association [6] highlighted the associated
immediate and long term cardiovascular, metabolic and other health consequences (obstructive sleep
4
apnoea, non alcoholic fatty liver disease, muscular-skeletal and psychological problems) of severe
paediatric obesity, suggesting the need for specialised treatment services. As these children may
require a range of interventions, accurate prevalence data are essential to inform the appropriate
planning, delivery and commissioning of such services. These data are also valuable for international
comparisons. This paper builds on analyses conducted for the recent Chief Medical Officer’s report
[12], and provides the first detailed description of the prevalence of severe obesity in children in
England.
Methods:
Objective
To examine the prevalence and trends for severe obesity in children aged 4-5 and 10-11 years,
attending English schools between 2006/07 and 2012/13.
Study design
A retrospective analysis of the National Child Measurement Programme (NCMP) was performed for
school years 2006/07-2012/13. The NCMP data were analysed in Microsoft Access, Excel and R, with
95% confidence intervals (CI) for the prevalence estimates calculated using the Newcombe method
[13]. When analysing severe obesity prevalence within ethnic groups and at Local Authority (LA) level,
the last three years of data were combined for the LA analysis, and the last four years combined for
the ethnic group analysis, to avoid any small number disclosure and improve statistical strength.
Binary logistic regression was used to assess the relation between NCMP year of measurement and
Index of Multiple Deprivation (IMD)1 decile, and the probability of being severely obese. Four separate
models were produced, one for each of the school year and sex combinations. The Generalised Linear
1 1https://www.gov.uk/government/publications/english-indices-of-deprivation-2010
5
Models (GLM) function in the statistical software R2 was used to fit the models. The models are based
on the assumption that the log of the odds of being severely obese is linearly related to the two
explanatory variables: year of measurement and IMD decile. IMD decile was considered as a
categorical variable. The variables were assessed for significance using the chi-square test. Significance
in other data presented was assessed using 95% confidence intervals, with significant differences
assumed when intervals did not overlap.
Setting
The NCMP was established in 2006 and annually collects measured height and weight, sex, age,
ethnicity and postcode data from all children in Reception (ages 4-5 years) and Year 6 (ages 10-11
years), from every maintained (state funded) school across England. Data collection at privately
funded and special needs schools is not mandatory. Because coverage of data collection in these
schools is low, data from them have been excluded from this analysis. A full description of the methods
for the NCMP has been previously published [14]. The programme is co-ordinated by Public Health
England and is used to inform local planning and delivery of children’s services, gather population level
surveillance data, and increase awareness of weight issues in children.
Participants
Participants are school children in the Reception year (aged 4-5) and year 6 (aged 10-11). The numbers
measured in previous years were: n=873,584 in 2006/07 (80% participation); n=972,479 in 2007/08
(88% participation); n=1,003,866 in 2008/09 (90% participation); n=1,026,368 in 2009/10 (91%
2 R Core Team (2014). R: A language and environment for statistical computing. R Foundation for
Statistical Computing, Vienna, Austria. URL http://www.R-project.org/.
6
participation); n=1,036,608 in 2010/11 (93% participation), n=1,056,780 in 2011/12 (93%
participation); n=1,076,824 in 2012/13 (93% participation).3
Main outcome measures
The primary outcome of this study was the prevalence of severe childhood obesity, defined using the
99.6th centile of the UK90 Body Mass Index growth reference charts (this equates to a BMI at age 18
of approximately 31.93 for boys and 32.6 for girls4). Prevalence was also analysed by sex; geography;
ethnic group; and deprivation (calculated IMD 2010). As commissioners often rely on higher
thresholds to define the need for highly specialised service such as bariatric surgery, two further
categories for very severe obesity are also presented, based on the 99.87th (which equates to an adult
BMI of approximately 34.46 for boys and 35.09 for girls) and 99.98th (which equates to an adult BMI
of approximately 39.38 for boys and 39.73 for girls) centiles of the UK90 growth charts. To facilitate
international comparisons International Obesity Task Force thresholds [2] were also applied to these
data.
Ethical approval for this study was not required as it involved the secondary analysis of routinely
collected and anonymised public health data.
Results:
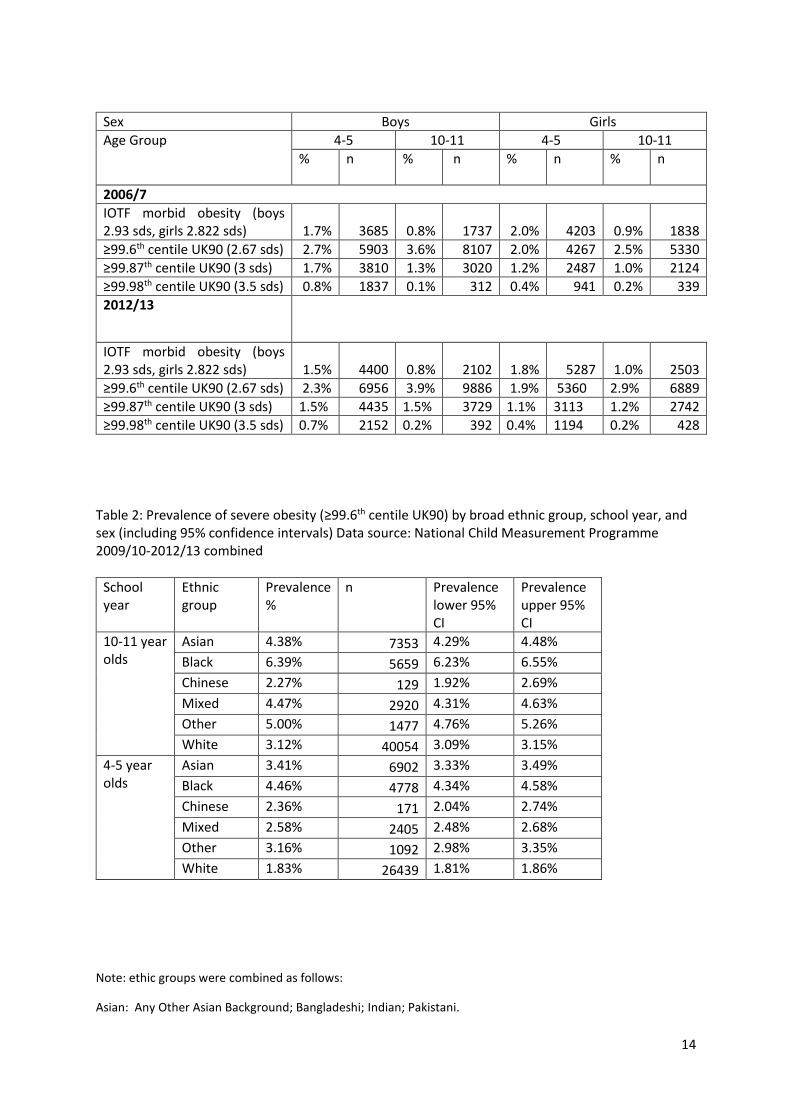
Table 1 presents the first (2006/07) and last available (2012/13) years of prevalence figures for English
school children who fell on or above the 99.6th centile of the UK90 growth charts, and met the new
IOTF morbid obesity classification.
3 NB due to additional data cleaning these figures may differ slightly from figures previously published by the Health and Social Care Information Centre. 4 Analysis utilised LMSgrowth program version 2.77. 2012. Huiqi Pan and Tim Cole. Available as a download from http://www.healthforallchildren.com
7
Severe obesity prevalence classified using the IOTF definition aligns most closely to the prevalence
defined using the 99.87th centile of the UK90 reference. For the remainder of this paper, the 99.6th
centile of the UK90 reference will be used to define severe obesity. This represents the highest centile
line marked on the growth charts, and is thus easily distinguishable by both lay and clinical personnel
using the charts with children in the UK.
The latest available measurement year (2012/13), shows a prevalence of severe obesity of 1.9% (95%
CI: 1.81 to 1.92%) for girls and 2.3% (95% CI: 2.26 to 2.37%) for boys aged 4-5, and 2.9% (95% CI: 2.82
to 2.95%) for girls and 3.9% (95% CI: 3.86 to 4.01%) for boys aged 10-11. This equates to a total of
12,316 of 4-5 year olds and 16,775 of 10-11 year olds children with severe obesity at the time of
measurement in 2012/13. In addition to the differences in severe obesity between age and sex, there
is also significant variation by geography (Figure 1). Using combined data from the last three years,
the prevalence of severe obesity across English local authorities varies from 0.7 to 4.3% for the
younger age group and 0.4 to 7.5% for the older children. Furthermore, there is also significant
variation in severe obesity prevalence among ethnic groups (Figure 2). Data from the last four years
combined show that the Black ethnic group has higher prevalence than White, Mixed, Asian, Chinese
and Other ethnic groups. The highest prevalence levels are seen in 10-11 year old Black Caribbean
children, whilst the lowest rates are seen in Chinese girls of both age groups (Table 2).
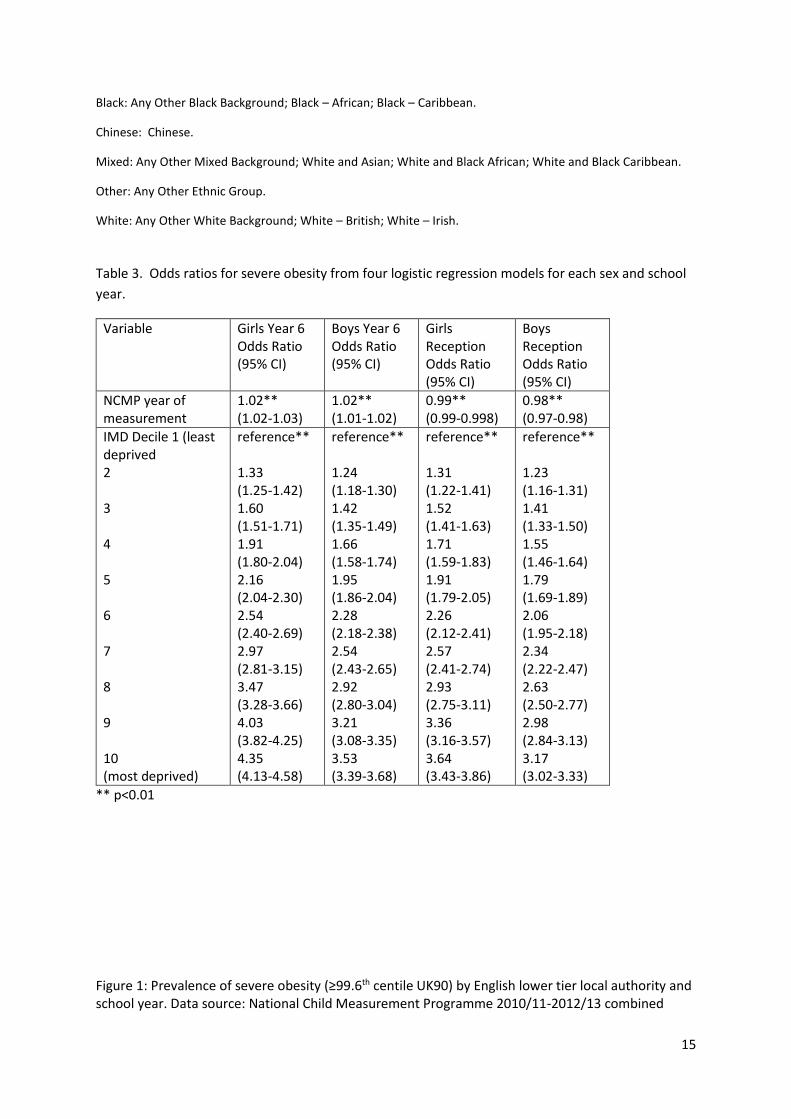
Prevalence of severe obesity by sex, age group and Index of Multiple Deprivation 2010 decile over
time is shown in Figure 3, with the supporting logistic regression analysis shown in Table 3. These
results indicate that both year of measurement and deprivation decile are significant predictors of
severe obesity. Table 3 shows that after adjustment for IMD decile the odds of being severely obese
have on average increased over time for the older girls and boys, by 1.02 times for each additional
8
year of measurement. In contrast the odds of being severely obese have decreased over time for
younger girls and boys, with odds ratios of 0.99 (95% CI 0.99-0.998) and 0.98 (95% CI 0.97-0.98)
respectively. The 10-11 year old girls in the most deprived IMD decile have odds of being severely
obese which are 4.35 times those in the least deprived reference category (95% CI 4.13-4.58) (Table
3). The difference in severe obesity prevalence between the least deprived and most deprived IMD
deciles is less marked for the other age and sex groups (older boys, younger girls and boys), with odds
of severe obesity of between 3.17 and 3.64 times those in the least deprived decile. It was not possible
to examine yearly trends by ethnic group, as ethnicity reporting was poor in the first few years of the
programme and several years of data need to be aggregated to avoid small number disclosure.
Discussion:
This study provides the first detailed analysis of the measured prevalence of severe obesity in school
children across England. Severely obese children are at risk of developing a number of serious acute
and chronic health problems [6]. These children therefore pose a significant concern in terms of their
health and wellbeing, and may require the provision of specialist services.
Nearly 30,000 severely obese (≥99.6th UK90 centile) children in the two primary school year groups
were identified in 2012/13. This is an order of magnitude greater than the number of children falling
within the very thin category (<0.4th UK90 centile) (in 2012/13, 2860 [children aged 4-5: 1311, 0.2%.
children aged 10-11: 1549, 0.3%] were classified as very thin). Whilst the strength of this study is the
large population size and high participation rate, it is worth noting that the presented figures may
underestimate the prevalence of severe obesity, for two main reasons: 1) a small number of children
with severe obesity may also have other conditions, such as Prader Willi syndrome, that may lead to
them attending schools for children with special needs, most of which do not submit measurements
9
to the NCMP; 2) analysis of previous years’ data, and extensive anecdotal evidence, suggest that
heavier children are more likely to opt out of the measurement programme, especially in the older
age group. This is not possible to quantify accurately, and it is possible that some of the increase noted
in severe obesity over time is a consequence of the commensurate rise in response rate.
When compared to data from the US, [7] English school children showed similar severe obesity
prevalence patterns, with higher rates in boys, older children and Black ethnic groups. However, the
use of different thresholds, reference populations, and age groups in the two countries makes direct
comparisons difficult [15]. Wider use of the new IOTF classification could avoid this problem. A higher
prevalence in the younger age group is also observed when the very high 99.98th centile cut point is
applied. The reasons for this remain unknown, although it might result from elevated opt out rates in
very overweight older children, who may be more sensitive to the risks of obesity-related stigma than
their younger counterparts. Whilst it would be very interesting to formally assess the impact of opt
out, unfortunately the data that would be required for this analysis are not available.
Although in relative terms the prevalence of severe obesity remains low, in absolute terms this
represents a very large number of children across the country, many of whom might benefit from top
tier service provision. This is a particularly important service consideration when over 4,000 children
in just the two school years measured by the NCMP in 2012/13, had a BMI falling on or above the
exceptionally high 99.98th centile. Whilst the NCMP only provides data on two year groups, simple
extrapolation of these findings to all school age children would suggest that tens of thousands of
children may potentially be suffering from severe obesity.
When examining prevalence using the 99.6th centile the observed higher prevalence in boys and older
children echoes the raised prevalence of general obesity in these groups: in 2012/13, 20.4% of boys
and 17.4% of girls aged 10-11 were classified as obese (≥95th centile of the UK90 reference), compared
10
to 9.7% of boys and 8.8% of girls aged 4-5 [14]. Severe obesity prevalence patterns also mirror the
prevalence patterns for general obesity in the correlation with health inequalities. As reported for
general obesity [14], severe obesity prevalence varies significantly by geography, and is highest in the
most deprived children and those from Black ethnic groups. Therefore suggesting a need for the
development and evaluation of more targeted interventions.
The findings from this study should help to raise awareness of the prevalence of severe obesity and
support the provision of adequate treatment and prevention services both to support children who
are already severely obese, and reduce the prevalence of extreme weight in the future. However there
remain several gaps which would benefit from future research: 1) further investigation of the role of
the disproportionate drivers of severe obesity in deprived and ethnic minority groups; 2) linkage to
other health outcome data to assess short and long term health impacts; 3) longitudinal analyses
tracking individual children over time, to further understanding of the natural history of this condition
and identify any potential predictive factors; and 4) exploration of other international data sources
using the new IOTF definition of morbid obesity, to support international data comparisons.
What is already known on this topic
Severe paediatric obesity is associated with a number of serious immediate and long term
health problems.
Prevalence of severe paediatric obesity has increased in the United States over time.
Data from the United States demonstrate inequalities in the prevalence of severe paediatric
obesity, with significant socio demographic variation.
What this study adds
This is the first detailed analysis of severe paediatric obesity prevalence in English school
children.

11
1.9% of girls and 2.3% of boys aged 4-5; and 2.9% of girls and 3.9% of boys aged 10-11 were
classified as severely obese (falling on or above the 99.6th centile of the UK90 growth charts)
in England in 2012/13.
In England, prevalence of severe obesity varies significantly across the country and is highest
in children living in the most deprived areas, and from Black ethnic groups.
References:
1. Cole TJ. Growth monitoring with the British 1990 growth reference. Arch Dis Child 1997; 76:
47-49
2. Cole TJ, Lobstein T. Extended international (IOTF) body mass index cut offs for thinness,
overweight and obesity. Pediatric Obesity 2012; 7: 284-294
3. Barlow SE, Expert Committee. Expert committee recommendation regarding the prevention,
assessment and treatment of child and adolescent overweight and obesity: summary report.
Pediatrics 2007; 120: S164-S192
4. Flegel KM, Wei R, Ogden CL, et al Characterizing extreme values of body mass index–for-age
by using the 2000 Centers for Disease Control and Prevention growth charts. Am J Clin Nutr
2009;90:1314–20.
5. Gulati AK, Kaplan DW, Daniels SR, Clinical Tracking of Severely Obese Children: A New Growth
Chart. Pediatrics 2012 DOI: 10.1542/peds.2012-0596
6. Kelly AS, Barlow SE, Rao G, et al Treatment Approaches: A Scientific Statement From the
American Heart Association Severe Obesity in Children and Adolescents: Identification,
Associated Health Risks, and Treatment Approaches: A Scientific Statement From the
American Heart Association Circulation. 2013;128:1689-1712
7. Skinner AC, Skelton JA, Prevalence and Trends in Obesity and Severe Obesity Among Children
in the United States, 1999-2012 JAMA Pediatr. doi:10.1001/jamapediatrics.2014.21
12
8. Lo JC, Chandra M, Sinaiko A et al Severe obesity in children: prevalence, persistence and
relation to hypertension International Journal of Pediatric Endocrinology 2014, 3
9. Freedman DS, Mei Z, Srinivasan SR, Berenson GS, Dietz WH. Cardiovascular risk factors and
excess adiposity among overweight children and adolescents: the Bogalusa Heart Study. J
Pediatr 2007; 150: 12-7
10. Ice CL, Murphy E, Cottrell L, Neal WA. Morbidly obese diagnosis as an indicator of
cardiovascular disease risk in children: results from the CARDIAC Project. Int J Pediatr Obes.
2011 ; 6(2):113-9.
11. Van Emmerik NMA, Redners CM, van de Veer M, van Buuren S, van der Baan-Slootweg OH,
Holthe JEK, et al. High cardiovascular risk in severely obese young children and adolescents.
Arch Dis Child 2012; 97(9): 818-21
12. CMO. Annual report of the Chief Medical Officer: surveillance volume 2012 on the state of the
Public’s health. 2014, chapter 5, p68
13. Newcombe RG. Two-sided confidence intervals for the single proportion: comparison of seven
methods. Stat Med 1998; 17: 857-72
14. Information Centre for health and social care. National Child measurement Programme:
England, 2012/13 school year. Health and Social Care Information Centre: Leeds 2012
15. Dinsdale H, Ridler C, Ells LJ. A simple guide to classifying body mass index in children. National
Obesity Observatory: Oxford 2011
Acknowledgements:
Data access for this analysis was granted to Public Health England.
Competing interests:
None declared.
13
Funding statement:
This research received no specific grant from any funding agency in the public, commercial or not-
for-profit sectors.
Contributorship statement:
This paper was conceived by Ells, Mead, Viner, Kinra, and Rutter. The analyses were carried out by
Hancock, Copley and Dinsdale. All authors contributed to the paper design, data interpretation, revisions
and final approval for publication. All authors are therefore accountable for the work presented.
Licence for publication statement:
The Corresponding Author has the right to grant on behalf of all authors and does grant on behalf of
all authors, an exclusive licence (or non-exclusive for government employees) on a worldwide basis to
the BMJ Group and co-owners or contracting owning societies (where published by the BMJ Group on
their behalf), and its Licensees to permit this article (if accepted) to be published in Archives of Disease
in Childhood and any other BMJ Group products and to exploit all subsidiary rights, as set out in our
licence.
Table 1: Prevalence of severe obesity by international and UK90 proposed definitions. Data source: National Child Measurement Programme 2006/07 and 2012/13
14
Sex Boys Girls
Age Group
4-5 10-11 4-5 10-11
% n % n % n % n
2006/7
IOTF morbid obesity (boys 2.93 sds, girls 2.822 sds) 1.7% 3685 0.8% 1737 2.0% 4203 0.9% 1838
≥99.6th centile UK90 (2.67 sds) 2.7% 5903 3.6% 8107 2.0% 4267 2.5% 5330
≥99.87th centile UK90 (3 sds) 1.7% 3810 1.3% 3020 1.2% 2487 1.0% 2124
≥99.98th centile UK90 (3.5 sds) 0.8% 1837 0.1% 312 0.4% 941 0.2% 339
2012/13
IOTF morbid obesity (boys 2.93 sds, girls 2.822 sds) 1.5% 4400 0.8% 2102 1.8% 5287 1.0% 2503
≥99.6th centile UK90 (2.67 sds) 2.3% 6956 3.9% 9886 1.9% 5360 2.9% 6889
≥99.87th centile UK90 (3 sds) 1.5% 4435 1.5% 3729 1.1% 3113 1.2% 2742
≥99.98th centile UK90 (3.5 sds) 0.7% 2152 0.2% 392 0.4% 1194 0.2% 428
Table 2: Prevalence of severe obesity (≥99.6th centile UK90) by broad ethnic group, school year, and sex (including 95% confidence intervals) Data source: National Child Measurement Programme 2009/10-2012/13 combined
School year
Ethnic group
Prevalence %
n Prevalence lower 95% CI
Prevalence upper 95% CI
10-11 year olds
Asian 4.38% 7353 4.29% 4.48%
Black 6.39% 5659 6.23% 6.55%
Chinese 2.27% 129 1.92% 2.69%
Mixed 4.47% 2920 4.31% 4.63%
Other 5.00% 1477 4.76% 5.26%
White 3.12% 40054 3.09% 3.15%
4-5 year olds
Asian 3.41% 6902 3.33% 3.49%
Black 4.46% 4778 4.34% 4.58%
Chinese 2.36% 171 2.04% 2.74%
Mixed 2.58% 2405 2.48% 2.68%
Other 3.16% 1092 2.98% 3.35%
White 1.83% 26439 1.81% 1.86%
Note: ethic groups were combined as follows:
Asian: Any Other Asian Background; Bangladeshi; Indian; Pakistani.
15
Black: Any Other Black Background; Black – African; Black – Caribbean.
Chinese: Chinese.
Mixed: Any Other Mixed Background; White and Asian; White and Black African; White and Black Caribbean.
Other: Any Other Ethnic Group.
White: Any Other White Background; White – British; White – Irish.
Table 3. Odds ratios for severe obesity from four logistic regression models for each sex and school
year.
Variable Girls Year 6 Odds Ratio (95% CI)
Boys Year 6 Odds Ratio (95% CI)
Girls Reception Odds Ratio (95% CI)
Boys Reception Odds Ratio (95% CI)
NCMP year of measurement
1.02** (1.02-1.03)
1.02** (1.01-1.02)
0.99** (0.99-0.998)
0.98** (0.97-0.98)
IMD Decile 1 (least deprived 2 3 4 5 6 7 8 9 10 (most deprived)
reference** 1.33 (1.25-1.42) 1.60 (1.51-1.71) 1.91 (1.80-2.04) 2.16 (2.04-2.30) 2.54 (2.40-2.69) 2.97 (2.81-3.15) 3.47 (3.28-3.66) 4.03 (3.82-4.25) 4.35 (4.13-4.58)
reference** 1.24 (1.18-1.30) 1.42 (1.35-1.49) 1.66 (1.58-1.74) 1.95 (1.86-2.04) 2.28 (2.18-2.38) 2.54 (2.43-2.65) 2.92 (2.80-3.04) 3.21 (3.08-3.35) 3.53 (3.39-3.68)
reference** 1.31 (1.22-1.41) 1.52 (1.41-1.63) 1.71 (1.59-1.83) 1.91 (1.79-2.05) 2.26 (2.12-2.41) 2.57 (2.41-2.74) 2.93 (2.75-3.11) 3.36 (3.16-3.57) 3.64 (3.43-3.86)
reference** 1.23 (1.16-1.31) 1.41 (1.33-1.50) 1.55 (1.46-1.64) 1.79 (1.69-1.89) 2.06 (1.95-2.18) 2.34 (2.22-2.47) 2.63 (2.50-2.77) 2.98 (2.84-3.13) 3.17 (3.02-3.33)
** p<0.01
Figure 1: Prevalence of severe obesity (≥99.6th centile UK90) by English lower tier local authority and school year. Data source: National Child Measurement Programme 2010/11-2012/13 combined

16
© Crown copyright and database rights 2014 Ordnance Survey 100016969
Figure 2: Prevalence of severe obesity (≥99.6th centile UK90) by ethnic group, school year, and sex (including 95% confidence intervals) Data source: National Child Measurement Programme 2009/10-2012/13 combined Figure 3: Trend in severe obesity (≥99.6th centile UK90) prevalence by school year, sex and deprivation decile (including 95% confidence intervals). Data source: National Child Measurement Programme 2006/07-2012/13
Related Documents