MSc SELECT is a cooperation between KTH-Royal Institute of Technology, Sweden │ Aalto University, Finland │ Universitat Politècnica de Catalunya, Spain │ Eindhoven University of Technology, Netherlands │Politecnico di Torino, Italy │ AGH University of Science and Technology, Poland │ Instituto Superior Técnico, Portugal MSc Environomical Pathways for Sustainable Energy Systems - SELECT MSc Thesis From Diesel to Solar: A Franchise Model for the Replacement of Diesel Generators with Solar PV systems for Micro-grids in Rural India Author: Maria Fernanda Barrera Ortiz Supervisors: Principal supervisor: Enrique Velo /Universitat Politécnica de Catalunya Industrial supervisor: Upendra Bhatt /cKinetics Session: July 2014

Welcome message from author
This document is posted to help you gain knowledge. Please leave a comment to let me know what you think about it! Share it to your friends and learn new things together.
Transcript

MSc SELECT is a cooperation between
KTH-Royal Institute of Technology, Sweden │ Aalto University, Finland │ Universitat Politècnica de Catalunya, Spain │
Eindhoven University of Technology, Netherlands │Politecnico di Torino, Italy │ AGH University of Science and Technology,
Poland │ Instituto Superior Técnico, Portugal
MSc Environomical Pathways for
Sustainable Energy Systems - SELECT
MSc Thesis
From Diesel to Solar:
A Franchise Model for the Replacement of
Diesel Generators with Solar PV systems for Micro-grids
in Rural India
Author: Maria Fernanda Barrera Ortiz
Supervisors:
Principal supervisor: Enrique Velo /Universitat Politécnica de Catalunya
Industrial supervisor: Upendra Bhatt /cKinetics
Session: July 2014


From diesel to solar: A franchise model for the replacement of diesel generators with solar PV systems for micro-grids in rural
India Page 1
Abstract
India has the highest population without access to electricity. To tackle the problem, the
Government of India has been focusing on the extension of the national grid. However, the
generation capacity remains insufficient providing low quantum and quality of electricity.
Rural areas are the most affected by this problem. Most of the villages suffer from power
outages of 14 to 20 hours per day. Local entrepreneurs have found an opportunity in this
gap. They build their own grids and supply electricity to households or markets running a
diesel generator (DG).
Renewable energy systems, like solar photovoltaic (PV) systems, are not sensitive to the
change in fuels price and are more environmentally friendly than DG. Nevertheless, DG
operators can’t afford these systems and can’t get finance. Therefore, this thesis proposes a
franchise model to allow the conversion of DGs to solar PV systems. Data from surveys
about electrification status and demographics done in the state of Bihar was used to
understand the characteristics of the villages where DG operators exist. Additionally, ten DG
operators were interviewed to better understand their business model. From the data
collected, two standardized solar PV system designs were proposed, one for villages (4.2
KW) and one for markets (6.72 KW). The cash flows for the franchisees and the franchiser
were forecasted, showing that the business is profitable for both. The Internal Rates of
Return (IRR) for the franchisee were 52% for the households’ system and 35% for the
markets’ system. Furthermore, the IRR for the franchiser were 17% for the households’
system and 35% for the markets’ system. The roles and responsibilities for each stakeholder
were defined and a risk analysis was performed.
This franchise model provides a scalable solution for the implementation of solar PV systems
for rural electrification. The problem of lack of finance is being addressed and the technical
risks are diminished by having a standardized system design and operation. To prove the
viability of the model 5 pilot plants will be installed during the next year, after which the model
will be refined and scale up.

Page 2 Thesis Report

From diesel to solar: A franchise model for the replacement of diesel generators with solar PV systems for micro-grids in rural
India Page 3
Table of Contents
1. GLOSSARY ______________________________________________ 7
2. INTRODUCTION ___________________________________________ 9
3. THEORETICAL FRAMEWORK ______________________________ 11
3.1. Rural Electrification Status in India ............................................................... 11
3.1.1. Electrification Coverage .................................................................................. 11
3.1.2. Quantum and Quality of Electricity Supplied to Rural Households .................. 13
3.1.3. Current Policies for Rural Electrification and Renewable Energies ................. 14
3.2. Rural India Villagers: The Customer ............................................................ 14
3.2.1. Current Sources of Lighting and Power .......................................................... 14
3.2.2. Ability and Willingness to Pay ......................................................................... 16
3.2.3. Electricity Requirements ................................................................................. 17
3.3. Technologies for Decentralized Rural Electrification .................................... 18
3.3.1. Diesel Generators ........................................................................................... 18
3.3.2. Solar PV .......................................................................................................... 19
3.3.3. Micro- grids ..................................................................................................... 21
3.4. Current Challenges for Rural Electrification with Renewable Energies ........ 22
3.4.1. Financing Renewable Energies for Rural Electrification .................................. 23
3.5. Business models for Rural Electrification ..................................................... 23
3.6. Sustainability of Renewable Energy Projects for Rural Electrification .......... 24
3.7. SPEED programme ...................................................................................... 25
4. DIESEL GENERATOR OPERATORS _________________________ 26
4.1. Current Status .............................................................................................. 26
4.2. Study Cases ................................................................................................. 31
4.2.1. Chakkai ........................................................................................................... 31
4.2.2. Matehari .......................................................................................................... 33
4.2.3. Hardiya............................................................................................................ 35
4.2.4. Lokhariya ........................................................................................................ 36
4.2.5. Mahdopur and Harihalpur ............................................................................... 37
4.3. Key findings .................................................................................................. 39
5. PROPOSED SYSTEM’S DESIGN ____________________________ 45
5.1. Solar Irradiation ............................................................................................ 45
5.2. Load Model ................................................................................................... 46
5.2.1. Households’ Load ........................................................................................... 46
5.2.2. Markets’ load ................................................................................................... 47

Page 4 Thesis Report
5.3. Components Specifications and Cost .......................................................... 49
5.4. Simulation Results ....................................................................................... 52
5.4.1. Households’ System ........................................................................................ 54
5.4.2. Markets’ System .............................................................................................. 57
5.5. Micro-grid Design and Costing ..................................................................... 59
6. BUSINESS MODEL AND ANALYSIS _________________________ 62
6.1. Vision and Mission ....................................................................................... 63
6.1.1. Vision ............................................................................................................... 63
6.1.2. Mission ............................................................................................................. 63
6.2. Business Model Canvas .............................................................................. 63
6.2.1. Customer Segment .......................................................................................... 63
6.2.2. Value Proposition ............................................................................................. 64
6.2.3. Channels and Customer Relations .................................................................. 64
6.2.4. Value Chain and Key Activities ........................................................................ 64
6.2.5. Key Resources and Logistics ........................................................................... 65
6.2.6. Key partnerships .............................................................................................. 66
6.2.7. Cost Structure and Revenue Streams ............................................................. 66
6.3. Porter’s Five Forces Analysis ...................................................................... 69
6.3.1. Threat of New Competition .............................................................................. 69
6.3.2. Threat of Substitute Products or Services ........................................................ 69
6.3.3. Bargaining Power of Customers ...................................................................... 69
6.3.4. Bargaining Power of Suppliers ......................................................................... 69
6.3.5. Intensity of Competitive Rivalry ........................................................................ 70
6.4. SWOT analysis ............................................................................................ 70
6.5. Risk Analysis ................................................................................................ 71
7. FINANCIAL MODEL _______________________________________ 74
7.1. The Model .................................................................................................... 74
7.2. Assumptions ................................................................................................ 75
7.3. Households’ System Package ..................................................................... 78
7.3.1. Franchisee Business Case .............................................................................. 78
7.3.2. Franchiser Business Case ............................................................................... 82
7.3.3. Sensitivity Analysis........................................................................................... 84
7.4. Markets’ System Package ........................................................................... 86
7.4.1. Franchisee Business Case .............................................................................. 86
7.4.2. Franchiser Business Case ............................................................................... 90
7.4.3. Sensitivity Analysis........................................................................................... 93
8. CONCLUSIONS __________________________________________ 96

From diesel to solar: A franchise model for the replacement of diesel generators with solar PV systems for micro-grids in rural
India Page 5
9. ACKNOWLEDGEMENTS ___________________________________ 97
10. REFERENCES ___________________________________________ 99
11. APPENDIX _____________________________________________ 101
11.1. Diesel Generator Operators ....................................................................... 101
11.1.1. Interview content ........................................................................................... 101
11.2. Proposed Systems’ design ......................................................................... 104
11.2.1. Voltage drops in micro-grid ........................................................................... 104
11.2.2. Solar PV system components’ data sheets ................................................... 105
11.2.3. Micro-grid components quotation .................................................................. 109
11.3. Financial Model .......................................................................................... 110
11.3.1. Yearly diesel price increase calculation ......................................................... 110
11.3.2. LED specifications......................................................................................... 111
11.3.3. Diesel consumption for serving markets ....................................................... 111


From diesel to solar: A franchise model for the replacement of diesel generators with solar PV systems for micro-grids in rural
India Page 7
1. Glossary
AC Alternative current
B2B Business to Business
BAU Business as usual
BPL Below Poverty Line
CAPEX Capital Expenditure
CFL Compact Fluorescent Lamp
CO2e Equivalent Carbon Dioxide
DB Distribution box
DC Direct current
DG Diesel Generator set
ESCO Energy Service Company
GDP Gross Domestic Product
GW Gigawatt
INR Indian Rupees
IRR Internal rate of return
JNNSM Jawaharlal Nehru National Solar Mission
KWh Kilowatt-hour
LEC Levelized electricity cost
LED Light Emitting Diode
MCB Miniature circuit braker
ME Micro-enterprise
mL Mililitres
MT Megaton
NPV Net present value
PPE Power Plant Economics
PV Photovoltaic
RGGVY Rajiv Gandhi Grameen Vidyutikaran Yojana
ROI Return on Investment
SPEED Smart Power for Environnmentally-sound Economic Development
TARA Technology and Action for Rural Advancement
W Watt


From diesel to solar: A franchise model for the replacement of diesel generators with solar PV systems for micro-grids in rural
India Page 9
2. Introduction
The lack of access to electricity is one of the major problems of India, linked to health issues
and a deficient education. India has the largest population without electricity access. Rural
areas are the most affected, with less than 50% of the households electrified [1]. To increase
the electrification rates, the Government of India has created many policies in the last years,
focusing mainly in the national grid extension. Nevertheless, the problem roots in the deficit
of generation capacity. Therefore, many households connected to the national grid suffer
from frequent shortages [2]. This gap has been perceived as opportunity by local
entrepreneurs who build micro-grids and generate electricity with DG (Diesel Generator
Sets).
This project studies the possibility of exchanging the DG’s used by the DG operators with
solar PV systems through a franchise model. It was done with the support of cKinetics, a
specialized sustainability advisory firm working with investors and business in emerging
markets. At the moment, DG operators are not considered bankable; besides renewable
energy projects require high initial investments and have long payback periods. Therefore,
the franchise model proposed allows the current DG operator to hire a solar PV system and
own it after a period of time. In this way, DG operators provide the “last mile connectivity”,
being in charge of the operation, distribution and collection of revenues. Furthermore, this
model would contribute to reduce the use and dependence on fossil fuels and can provide
more availability and quality of the service.
To make the model feasible, the solution should be scalable and should mimic the current
cash flows of the DG operator. Therefore, this thesis proposes a standardized product and
the business and financial model required to make the retrofit profitable for the franchiser and
the franchisee (DG operator).
cKinetics is also a partner of the SPEED (Smart Power for Environmentally-sound Economic
Development) project. SPEED project has been working for the electrification of Bihar for two
years. They have been collecting data about demographic characteristics and grid
connectivity status of rural settlements. During the development of this thesis, Gopalganj,
Araria and Supaul districts were visited and 10 DG operators were interviewed. This allowed
a better understanding of their current business model and be able to compare it with the
proposed one. This model will be applied to 5 pilot plants financed by the Climate and
Development Knowledge Network (CDKN), where cKinetics will act as the franchiser. After
one year, the outcomes of the testing will be used to refine the model and roll-out the
business.


From diesel to solar: A franchise model for the replacement of diesel generators with solar PV systems for micro-grids in rural India
Page 11
3. Theoretical Framework
3.1. Rural Electrification Status in India
3.1.1. Electrification Coverage
India has one of the fastest growing economies of the last decade, increasing at an average of
8% per annually since 2006 [3]. The Gross Domestic Product (GDP) growth is closely linked to an
increase in electricity consumption; however, this has not been the case for India since there is a
lack of resources to ensure the supply and distribution to meet the growing demand.
Almost 50% of the total households in India (around 400 million people) don’t have access to
modern electricity; most of them in the rural areas. Just seven out of India’s 27 states have all its
villages electrified; in the majority of the other states more than 40% of the villages remain un-
electrified. Nevertheless, it is important to remark that declaring a village electrified doesn’t mean
that 100% of its households have access to electricity. According to Indian regulations, if basic
infrastructure, such as distribution transformer, is established and electricity is provided to public
buildings and at least 10% of its households, a village is considered to be electrified. There are no
other criteria related to the quantum or quality of the provided electricity or specifications of whether
the electricity should be for lighting or should supply other needs. In most villages the supply is
single phase and is just enough to provide lighting and some fans. Therefore, even if seven states
have declared that all its villages are electrified, four of these states have more than 25% of its rural
households un-electrified. Furthermore, even if just 140 000 villages out of 600 000 (23%) are
remaining to be electrified, 55% of rural households are not electrified [3] [4].

Page 12 Thesis Report
Figure 1. Electrified rural households per district [5]
Figure 1 shows the household electrification rates in India. It can be seen that the problem is
more acute in the northeast region of the country where less than 25% of the rural households are
electrified. From these states the ones with the largest populations and the lowest electrification
rates are presented below, in Table 1.
Shortlisted
states
Total
population (in
millions)
% of rural
population
BPL
% of rural
households
having
electricity
access
Annual per capita
electricity
consumption (KWh)
Bihar 103.8 55.3% 10% 117.5
Uttar Pradesh 199.6 39.4% 24% 386.9
Jharkhand 33.0 41.6% 32% 750.5
Odisha 41.9 39.2% 36% 837.5
National Average 55% 778.6
Table 1. Current electrification status and consumption of electricity in selected states [6]

From diesel to solar: A franchise model for the replacement of diesel generators with solar PV systems for micro-grids in rural India
Page 13
It can be seen that Bihar is the state with the lowest percentage of electrified rural households;
therefore, it also has the lowest annual electricity consumption per capita. Besides, Bihar is one of
the poorest states, with more than half of its population below poverty line. It can be concluded that
Bihar is the state with the highest need of electrification and economic development.
As mentioned previously the lack of supply is one of the main causes for the low electrification
rates. India has a total power generation capacity of about 245 Giga-watt (GW) (April 2014).
However, there is a deficit of 12% on average and progressive states see a gap of up to 15% [7].
Every year this insufficiency gets higher since the generation sector grows around 4% per annum,
while the demand increases at a faster rate of 6 to 7%. Therefore, even if the government has
been struggling to extend the grid there is not enough power to meet the demand. On the other
hand, the transmission and distribution losses in the Indian grid of about 30% are 5 to 6 times
higher than the global average, enhancing the power deficit problem. These losses are due to theft,
old and poor infrastructure, lack of proper metering and bill collection system, among others [3].
It is important to remark that although India suffers from a deficit of power supply, the gap
should be met with clean energy power plants, even if it requires more time and money. India is
currently the fourth largest carbon emitter in the world with a total emission of around 1900 Mega-
Tons (MT) of CO2e (Equivalent Carbon Dioxide). The energy sector contributes to 67% of these
emissions, amounting to 1260 MT CO2e. Therefore, it is crucial that this country adopts and
pursues energy policies which reduce its dependence on fossil fuel and provide green and clean
energy as far as possible [3]. At the moment, thermal power (coal, gas, and diesel) still dominates
the Indian power sector with installed capacity of 114GW (65.1%) followed by hydro power (38GW,
21.6%), nuclear power (5GW, 2.7%), and renewable energy (18.5GW, 10.6%) [4].
3.1.2. Quantum and Quality of Electricity Supplied to Rural Households
Due to the lack of supply of electricity, even if a rural household is grid connected, a 24 hours
provision of electricity is not ensured and the power received is usually just for lighting purposes.
All Indian consumers face frequent power disruptions and power cuts that range from 2 to 20 hours
on a daily basis and the rural areas are the most affected because priority is always given to the
energy demand of the urban areas. Power outages of around 14 to 20 hours per day are the
standard in rural areas. Since having power is the exception and not the rule, the villagers count
the hours of electricity they get instead of the hours of power shortage. In addition, some villages
receive electricity during the night or daytime, when electricity just for lighting purposes is useless.
[3]
As mentioned before, the definition of electricity access, especially in the rural context, is
reduced to access to electric lighting. Nevertheless, this hinders the contact to a myriad of other
energy services, ranging from milling, water pumping for irrigation, drinking and sanitation, and

Page 14 Thesis Report
other enterprises. In the current definition of electrification provided for the government, even if the
100% villages and 100% household electrification is met, all the energy requirements, besides
lighting, will remain unmet. [3]. This leads to a dependence on kerosene and diesel to provide all
the energy services remaining at a higher economic, environmental and social price [4].
3.1.3. Current Policies for Rural Electrification and Renewable Energies
The Indian Energy Act of 2003 includes various sections to encourage rural electrification and
to promote the use of renewable energies. From these, the Indian government launched in 2005
the Rajiv Gandhi Grameen Vidyutikaran Yojana (RGGVY) programme, which aimed to electrify
100% Indian villages by 2009 and 100% households by 2012 [3]. The programme also includes the
provision of free electricity connection to 23 400 000 people below the poverty line in more than
100 000 un-electrified villages through the extension of the existing grid and augmenting the
infrastructure [4]. Even if the timeframe wasn’t met, the programme is still running.
The same act establishes the regulation for the distribution of electricity from off-grid renewable
energy systems in rural areas, specifying that these type of systems don’t require any license and
the charged tariff would be the result of the mutual agreement between the generator and the
consumer. Nevertheless, if any subsidy from the Government or other agencies is received, the
benefit must be fully passed on to the consumer [4].
Another programme that emerged from this act is the Jawaharlal Nehru National Solar Mission
(JNNSM). This programme promotes the off-grid application of Solar Energy, including hybrid
systems to meet lighting, electricity and heating/cooling requirements. For this the Ministry of New
and Renewable India would provide financial support through a combination of 30% subsidy and/or
5% interest bearing loans. [4]
However, even though many programmes and schemes have been launched by the
government to promote rural electrification in the last decades, they don’t provide enough clarity to
the participants and entities in order to bring the off-grid renewable energy generation for rural
electrification into mainstream [4]. Another issue is that these policies focus only on creating
infrastructure for rural electrification, but don’t address the issue of enhancing access to electricity,
providing a service of good quality or enough quantity [8].
3.2. Rural India Villagers: The Customer
3.2.1. Current Sources of Lighting and Power
Kerosene is the preferred source for lighting in rural households of India. The monthly kerosene
consumption per households ranges from 3 to 9 litres of kerosene, with an average of 4.5. The

From diesel to solar: A franchise model for the replacement of diesel generators with solar PV systems for micro-grids in rural India
Page 15
price per litre of kerosene ranges from Indian Rupees (INR) 20 per litre, the subsidized price for
Below Poverty Line (BPL) households, to INR 40. These prices can differ in different states
depending on the existing taxes and surcharges [4]. The next figure shows the percentage of
households using kerosene as the main source of lighting in each state of India.
Figure 2. Percentage of households using kerosene as the main source of lighting in each
state of India [9]
For commercial loads, portable generators using diesel or kerosene are often used to meet the
power demand for electrical or mechanical power applications, like in flour mills and irrigation
pumps. The efficiency of these machines is very low due to their small capacity and part load
operations, consuming around 300 to 500 millilitres (mL) per KWh, which is almost 5 times the grid
price. These portable generators are not only for private use; many local entrepreneurs are using
their generators to provide lighting and other energy services through pico-grids to households and
small businesses, charging fixed rates per day or month. Approximately INR 85 to 90 per month
per household is charged for 3 hours of electricity with which the user gets lighting using an 8 to 10
watt (W) Compact Fluorescent Lamp (CFL). Other services, like powering television, computers
and printing machines, are also provided in some cases [4].
Due to the low quantity and quality of electricity received in most rural areas, the use of
kerosene and portable generators is also common in already electrified villages, where their
dwellers have to rely in these other sources of energy as a backup. Thus, the cost of lighting for a
rural electrified household includes the cost of grid supply and kerosene or diesel [8].

Page 16 Thesis Report
3.2.2. Ability and Willingness to Pay
Nowadays, to get grid connected, villagers have to pay a onetime charge of INR 1500 for non-
metered connections and INR 2000 for metered connections. Afterwards, non-metered
connections have flat rates that vary from INR 75 to INR 100 per month and metered connection
pay between INR 2 to INR 3 per kilowatt-hour (KWh), depending on the state, region and season.
This tariff is highly subsidized; it is just one third of the urban domestic tariff and one sixth of the
urban commercial one. Nevertheless, despite the high subsidies, the erratic and poor quality
supply of electricity causes the average rate that a rural household pays for the service to be
almost the same as what an urban household pays [3].
Several surveys report that Indian rural villagers are willing to pay up to INR 40 per KWh. An
interesting remark is that the customer is willing to pay more when a fixed tariff per period of
service is presented, rather than when the cost is a function of the electricity units consumed.
Therefore, villagers are willing to spend between INR 100 to INR 120 per month, usually getting
just 2 to 3 kWh for lighting [10]. The willingness to pay also varies across regions and people living
in villages where a diesel generator is already providing the lighting have higher willingness to pay
for the service [4].
Due to the poor quality and quantity of grid electricity, villagers are usually willing to pay more
for less outages and better quality of the service. This is supported by the fact that people is
currently paying high tariffs to get electricity from diesel generators (Bose and Shukla 2001; Barnes
and Sen 2002; Mukhopadhyay 2004). A higher quality and quantity of electricity supply can have a
positive impact on rural incomes, which can balance the cost of the service. If electricity supply is
provided to income generating activities, the ability to pay for the service is further improved [10].
From diesel to solar: A franchise model for the replacement of diesel generators with solar PV systems for micro-grids in rural India
Page 17
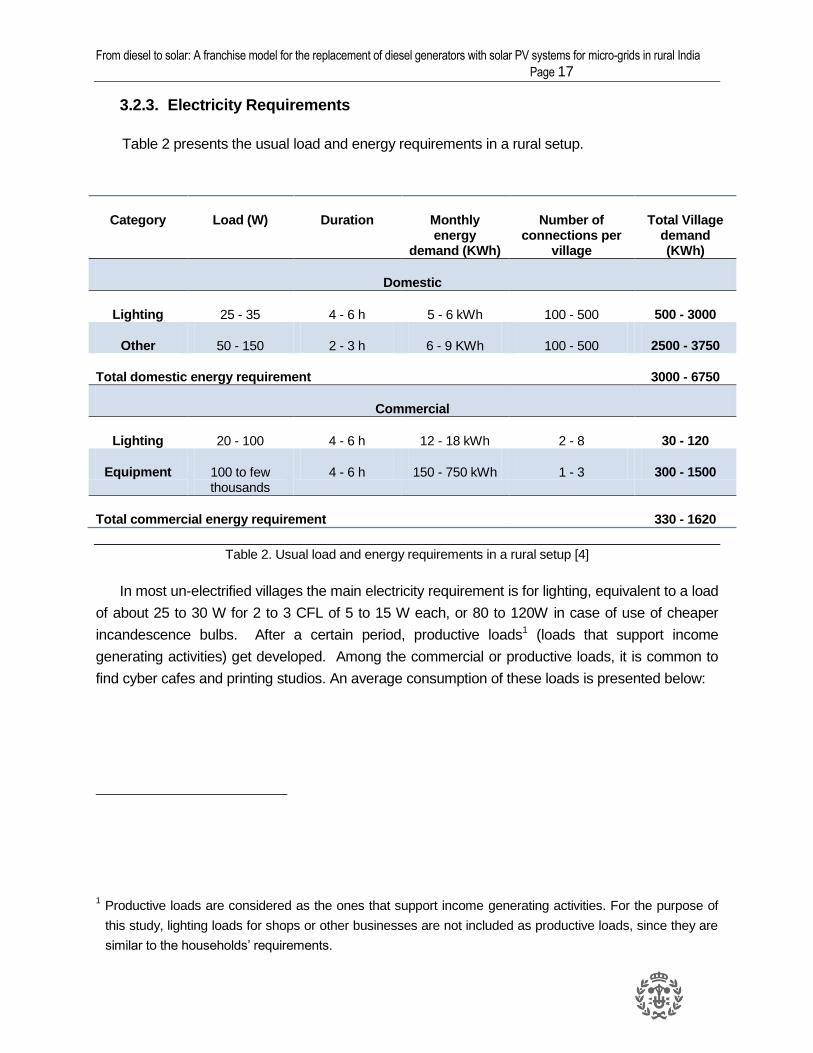
3.2.3. Electricity Requirements
Table 2 presents the usual load and energy requirements in a rural setup.
Category Load (W) Duration Monthly energy
demand (KWh)
Number of connections per
village
Total Village demand (KWh)
Domestic
Lighting 25 - 35 4 - 6 h 5 - 6 kWh 100 - 500 500 - 3000
Other 50 - 150 2 - 3 h 6 - 9 KWh 100 - 500 2500 - 3750
Total domestic energy requirement 3000 - 6750
Commercial
Lighting 20 - 100 4 - 6 h 12 - 18 kWh 2 - 8 30 - 120
Equipment 100 to few thousands
4 - 6 h 150 - 750 kWh 1 - 3 300 - 1500
Total commercial energy requirement 330 - 1620
Table 2. Usual load and energy requirements in a rural setup [4]
In most un-electrified villages the main electricity requirement is for lighting, equivalent to a load
of about 25 to 30 W for 2 to 3 CFL of 5 to 15 W each, or 80 to 120W in case of use of cheaper
incandescence bulbs. After a certain period, productive loads1 (loads that support income
generating activities) get developed. Among the commercial or productive loads, it is common to
find cyber cafes and printing studios. An average consumption of these loads is presented below:
1 Productive loads are considered as the ones that support income generating activities. For the purpose of
this study, lighting loads for shops or other businesses are not included as productive loads, since they are
similar to the households’ requirements.

Page 18 Thesis Report
Product (Stand-by mode) Average (W)
Computer Display (LCD) 27.61
Computer (desktop) 73.97
Multi-function Device (inkjet) 9.16
Printer (inkjet) 4.93
Fridge (130 L) 300
Table 3. Electricity consumption of some productive loads
[11]
Other typical household and productive loads in Indian rural villages are:
Cell phone charging (5 to 10 W)
Fan (50 to 60 W)
Grinding (0.5 to 3.5 kW)
Oil expelling (5 to 15 kW)
Refrigeration and ice making (1 to 10 kW).
[4]
3.3. Technologies for Decentralized Rural Electrification
3.3.1. Diesel Generators
Diesel generators sets (DG) are cheap and easy to install and run technology for decentralized
distributed generation. In India they are quite popular in off-grid areas, supplying individuals,
businesses and micro-grids; while in grid connected areas they are used as backup. Around 10
GW of diesel generator sets are installed in India, most of them operating at very low load factors
[10].
Due to the low electrification rates and quality of grid electricity supply in rural India, many
entrepreneurs are providing electricity using DGs. They are known as DG operators and serve
households and marketplaces with electricity for lighting at around INR 4 per day for 3 to 4 hours
during the evenings [1]. They can also provide electricity to power appliances with higher demands
and productive loads in markets during the day. Besides, they build their own grid using local
materials, like bamboo sticks, and wires. At the moment, there are no regulations regarding
pricing, quality of service or safety issues applicable to the DG operators and their grids.

From diesel to solar: A franchise model for the replacement of diesel generators with solar PV systems for micro-grids in rural India
Page 19
The cost of diesel generators’ installation and operation is highly dependent on the size of the
system and on the power demand. The following table presents the average operation and
maintenance cost of a 10 KVA diesel generator.
Particular Consumption per Hour (L/h)
Consumption per Year (L/y)
Cost per Unit (INR/L)
Amount Per Year (INR)
Diesel (HSD)
2 5760 60 345,600
Mobil-Oil 117 175 20,440
O&M 86,000
Total 452,040
Table 4. Average operation and Maintenance costs of a 10 KVA diesel generator [7]
The total output of an 8-kW system is approximated at 20,700 KWh per year, assuming a 90%
capacity factor. The total cost of power is therefore INR 21.80/kWh. [7]
In contrast to solar photovoltaic (PV) systems, diesel generators have a very low initial capital
investment and can provide energy on demand. Besides they supply Alternative Current (AC), not
requiring the use of an inverter. On the other hand, the annual operating costs of DGs are much
higher due to fuel price (which is increasing every year) and the provision of fuels can be an
arduous task in rural areas. Furthermore, the DGs have a shorter lifetime (3 to 5 years) compared
to solar PV systems (up to 20 years). It is also important to consider the great amount of carbon
emissions from diesel (2.64 kg/L diesel) which contribute to global warming and produce
respiratory diseases [12].
3.3.2. Solar PV
Solar energy has become a very popular renewable energy technology in the last decade,
mainly because the drop of its prices and the simplicity of its installation and maintenance. Solar
photovoltaic panels convert the radiant energy of the sun into electricity using semiconductor-
based materials (solar cells). The amount of electric current generated depends on many factors
such as solar material of fabrication, exposed area, ambient temperature, and others.
India, located in a tropical region, receives a great amount of solar irradiation throughout the
year, having the potential to offer an improver power supply and enhance energy security. Most
parts of India has around 250–300 sunny days in a year and receive about 4–6.5 kWh (kilowatt-
hour) of solar radiation per square meter per day.

Page 20 Thesis Report
The PV manufacturing capacity of India increased from less than 60 MW to more than 1 GW
from 2005 to 2009, setting India as a possible global leader in the market. This was a first step
towards investments along the PV value chain: silicon wafers, PV modules and cells, and balance
of system components [13]. To boost the investment and push the solar market in order to reduce
the power deficit in the country, the Indian Government has launched the Jawaharlal Nehru
National Solar Mission (JNNSM) in 2010. The programme should be implemented in 3 phases
resulting on an installed capacity of 20 GW connected to the grid and 2 GW of off-grid solar
applications, plus 20 million square meters of solar thermal collector area and solar lighting for 20
million households by 2022 [14]. Figure 3 depicts the implementation plan of the JNNSM.
Figure 3. JNNSM (© Solarishi / Wikimedia Commons / CC-BY-SA-3.0)
India’s solar installed capacity was 17.8 MW before 2010. After the announcement of the
JNNSM, this value increased to 506.9 MW by the end of phase 1 in March 2012. Competitive
bidding for grid-tied project under the mission led the prices as low as INR 7.49 per kWh,
approaching grid parity with fossil fuel powered electricity. Phase 1 also brought new players into
the Indian solar market [15] and increased the module manufacturing capacity to 2 GW [16].

From diesel to solar: A franchise model for the replacement of diesel generators with solar PV systems for micro-grids in rural India
Page 21
Regardless of the government support, the market is struggling due to the high capital
requirements, the low bankability and the lack for grid parity. Besides, the high transmission and
distribution losses are a challenge for remotely located solar plants [13]. The manufacturing
ecosystem is still weak. It lacks scale, vertical integration and research and development of
technology. Furthermore, the land scarcity due to the low per capita land availability and the lack of
industry-government cooperation are other challenges faces by the PV market in India [16].
3.3.3. Micro- grids
When it comes to the electrification of an isolated village, grid extension can be too expensive,
unless the village has enough demand to reach critical mass. In these cases, micro-grids are an
ideal alternative. These are independent entities that can be controlled and managed without
presenting threats to the conventional grid, providing more reliable electricity as any outages or
interruptions to electricity supply can be quickly identified and corrected. Furthermore, having the
site of power generation closer to the load also reduces transmission and distribution losses [12].
Micro-grids comprise three subsystems: the production, the distribution, and demand
subsystems.
1. Production: This subsystem includes the generation equipment (could be a diesel generator,
solar panels, wind turbine, among others), converters (rectifiers or inverters), storage system
(batteries) and control components. This subsystem determines the capacity of the system and
connects all the components through the bus bar at the required voltage for the distribution
subsystem.
2. Distribution: This subsystem includes all the components to distribute the electricity to the
users by means of the micro-grid. The distribution system can be based on Direct Current (DC) or
Alternative Current (AC) and single or three phase. This decision affects on the cost of the project
and will mainly determinate the devices which can be used. The choice of AC or DC mostly
depends on the technologies to be coupled in the system as well as whether batteries will be used
in the system. Single-phase distribution grids are cheaper than three-phase ones, but the later
allow greater opportunity for commercial enterprises to obtain power and the possibility of future
inter-connection to the national grid.
3. Demand subsystem. This subsystem includes all the components on the end-user side of
the system, such as meters, internal wiring, grounding, and the devices that will use the electricity
generated by the hybrid power plant.
Each subsystem can vary greatly in its components and architecture according to the
availability of resources, desired services to provide, and user characteristics [12].

Page 22 Thesis Report
3.4. Current Challenges for Rural Electrification with Renewable
Energies
Technology is no longer a challenge when it comes to micro-grids. Most of the challenges are
related to the political, financial and social environment around the project and that affects its long
term sustainability.
The low load and energy requirements of the off-grid rural electrification projects cause a lack
of interest from the distribution utilities. They involve large capital investment and therefore higher
cost of electricity generation that usually is not compensated due the low collection efficiency. If the
project is commissioned, the maintenance of operation of the project is another challenge; people
are not trained to undertake simple care and maintenance of the equipment and if there is no
sense of ownership from the users they tend to treat the systems as temporary solutions [4] [3].
Therefore, even consumers show a high ability and willingness to pay; credit constraints, lack of
technical capacity, lack of awareness and under-developed market distribution all contribute to
limited deployment of renewables for rural electricity [10].
The next table, Table 5, shows the PEEST (Political, Economic, Environmental, Social and
Technical) factors that affect the success and sustainability of renewable energy micro-grids for
rural electrification in India.
Political Lack of clarity on government’s policies.
Difficult land acquisition process and ownership.
Economic The funding process is not clear.
Lack of consumer subsidies.
Unknown cost to user over time.
Environmental Lack of land banks.
Complicated permitting process.
Social Lack of consumer awareness and education.
Household energy use patterns and behaviours.
Workforce readiness, local employment and training capacity.
Technical Unbalanced distribution systems.
Future integration to the grid.
Lack of training.
Table 5. PEEST factors of the implementation of renewable energy micro-grids for rural electrification in India
[7]

From diesel to solar: A franchise model for the replacement of diesel generators with solar PV systems for micro-grids in rural India
Page 23
3.4.1. Financing Renewable Energies for Rural Electrification
Project financing is one of the biggest challenges for renewable energy projects. Domestic
banks still perceive significant risks in this kind of projects and have high interest rates.
Furthermore, international lending institutions have more rigorous selection requirements. These
obstacles increase the dependency on grants for the deployment of the renewable energy projects
[15].
Regarding renewable energy projects for rural micro-grids, around USD 82 million is available
in the form of technical assistance, subsidies, commercial loans, subsidized loans, equipment
finance, and equity investment. From this, 87% is donor capital and just 13% is returnable capital.
This shows the low interest from private investors in this kind of projects. Furthermore, the amount
of debt available is limited and just accessible by established firms. New companies trying to enter
the market are more likely to get equity, since financing institutions are not aware of the risks
associated with the sector, related to technology, business model and regulations. According to
the report developed by cKinetics, Financing Decentralized Renewable Energy Mini-Grids in India,
there is a mismatch between the accessible capital and what is needed. The available capital is
meant for low-risk and low-return capital, or high-risk and high-return capital business models. The
high-risk and low-return capital required for the deployment of distributed renewable energy mini-
grids is missing [6].
3.5. Business models for Rural Electrification
According to Thirumurthy and Harrington, the following business models can work well in a
rural community setting and can provide a good overview to what is being employed under JNNSM
across India [7]:
1. Community-based model, where the renewable energy system is owned and operated by
the local community
2. Private sector-based model, where the system or many of the components of the system are
owned by a private entity
3. Utility-based model, where the utility owns and operates the system
4. Hybrid model, in which there is a combination of community, private, and utility ownership.
All of the models have advantages and disadvantages that make them more or less suitable for
different locations. The current study focuses on a private sector based business model. This one
is the most efficient model for providing electricity, ensuring the long-term operation and

Page 24 Thesis Report
maintenance through technical ability to address problems. Nevertheless, the lack of funding can
be the main flaw of this approach.
3.6. Sustainability of Renewable Energy Projects for Rural
Electrification
To ensure the long term sustainability of the project, there are many technical and social
considerations to be made. Local conditions should shape the project, respecting local traditions
and leadership structures, instead of the local people adapting to the project. Local participation is
essential. The involvement of local leaders and other stakeholders in the decision making process
can ensure the users’ satisfaction. They can help to assess electricity needs, monitor the project,
organize the community, enforce the rules, help to develop local productive enterprises, among
others [12]. The participation of the community can provide a better suited tariff system and
demand side management. On the other hand, training of local operators and users is required to
ensure the correct operation of the system and in order to give maintenance and troubleshooting
as fast as possible and provide a reliable service [3].
From a technical perspective it is important that the system supports the creation of productive
services and businesses; this enhances the local economy and ensures stable revenues. It is
remarkable that businesses fed by small diesel generators indicate significant potential for
utilization and the willingness to pay for electricity service. In addition, the over sizing of the system
to allow for future demand growth is essential, since the number of user connections can be low at
the beginning, especially in regions where no other projects have been installed previously, but it
can grow fast due to the change in social dynamics one the village is electrified. Over-sizing some
components, such as the wiring and the converters, by 30% can be a good practice [12].
Other business approaches to increase the sustainability of these projects are the
development of turnkey systems and bundling projects. Standardized systems and clusters of
projects can catalyze micro-grid development, making it easier for taking advantage of economies
of scale, financing structures, reducing overheads and making the human building capacity easier
[7]
The high upfront cost of renewable energy technologies can be a risk for the development of rural
electrification projects. Therefore, the implementation of energy efficiency practices can be useful
to reduce the size of the system and consequently the investment costs. Nevertheless, this can be
a difficult task in rural areas, where their situation pushes for technology choices with a short term
and least cost basis in mind. For example, they would rather buy an incandescent bulb, instead of
a CFL; which increases the overall demand and the size of the system. The energy efficiency
measures (demand side management measures) to reduce the anticipated energy demand require

From diesel to solar: A franchise model for the replacement of diesel generators with solar PV systems for micro-grids in rural India
Page 25
intensive and sustained interaction with the users; it is an issue that involves capacity building and
training, more than technical skills [12].
3.7. SPEED programme
“Smart Power for Environmentally-Sound Economic Development (SPEED) seeks to identify
and showcase scalable business models and implementation plans for addressing energy access
and triggering economic activities in underprivileged areas of the developing world, while
simultaneously providing diesel-replacement opportunities to telecom towers and farmers who still
use diesel-driven pumps and lighting” [17]. This project started in 2009 with the support of
Rockefeller Foundation, and executed by several partners in India, like cKinetics and Technology
and Action for Rural Advancement (TARA). It is one of the many projects in India that aim to
overcome the current challenges for rural electrification using renewable energy powered mini-
grids.
Engaging the telecom tower industry and Energy Service Companies (ESCOs), SPEED
intends to deliver clean electricity to not electrified or under electrified communities in India. Using
the telecom towers as anchor loads, reliable electricity supply will be provided to micro enterprises,
in order to trigger economic development. The first phase of the SPEED programme (2009 –
2010) aimed to formulate the concept and assess the gap. During the second phase (2011 –
2014), pilot projects to validate the model are being established. To achieve this, many on-ground
data about the demographics, electrification status, economic activities, and natural resources of
the villages has been collected. From the outcomes of phase 2, the goal is to scale up for 1 000
villages in a time frame of three years (2015 -2018), and to 100 000 in ten years [17].

Page 26 Thesis Report
4. Diesel Generator Operators
Due to the low electrification rates and the low quality and quantum of electricity provided to
rural households connected to the national grid, local entrepreneurs have built their own grids to
provide the service. These micro-grids are built from local materials, like bamboo sticks, and are
powered with DGs. These local entrepreneurs are known as DG operators and provide electricity
for lighting to households and sometimes for running productive loads in markets. This chapter
intends to give an overview of the current situation of DG operators in rural India, their
characteristics, business models and major challenges.
4.1. Current Status
As part of the SPEED project, more than a hundred villages in the northeast of India were
surveyed to evaluate their need and potential for electrification with renewable energy powered
mini-grids. The evaluation included different parameters related to demographics, as the number of
households, average income and occupation of the villagers; and electrification status, as the
number of hours that they get the service and the alternatives for the grid electricity they currently
use.
This thesis focuses on the state of Bihar; therefore only the villages located in this state were
studied. The following table shows the number of villages surveyed in each of the districts under
study. These districts were selected due to the already existence of ESCOs working in the district
or willing to work in it.
District Number of villages surveyed
Araria 15
Bhojpur 3
Gopalganj 35
Purnia 1
Saran 9
Supaul 15
Vaishali 17
Total 95
Table 6. Number of villages surveyed in each district under study (2014)

From diesel to solar: A franchise model for the replacement of diesel generators with solar PV systems for micro-grids in rural India
Page 27
The 95 villages under study have been classified depending on the reported average amount
of electricity supply: less than 5 hours, less than 10 hours and more than 10 hours. If none of the
households was grid connected, it was classified as not electrified.
Number of villages Percentage
More than 10 hours of electricity 8 8%
Less than 10 hours of electricity 13 14%
Less than 5 hours of electricity 39 41%
Not electrified 35 37%
Total villages 95 100%
Table 7. Electricity supply status of the surveyed villages (2014)
Table 7 shows the result of the mentioned classification. It can be noticed that most of the
surveyed villages were not electrified or were getting less than 5 hours of electricity supply. Both
these categories summed up 78% of the total villages.
Figure 4. Electricity supply status of the surveyed villages (2014)
It is important to remark that the classification was made according to the information provided
by the villagers and their perception of the amount of hours that they get electricity. Furthermore,
this is an average value that varies from day to day and also depends on the season (since the
presence of rains influences the availability of power). Not just the amount of hours of service are
irregular, the timings are not certain either. There is no official data regarding the amount of hours
of supply each village gets or load shedding schedule for the state of Bihar. On the other hand,
mentioning that a village gets a certain amount of hours of electricity does not mean that 100% of
the households of the village are getting the same amount of electricity or that they are grid
8%
14%
41%
37%
More than 10 hours of electricity
Less than 10 hours of electricity
Less than 5 hours of electricity
Not electrified

Page 28 Thesis Report
connected. In most of the cases, not all the households of one particular village are connected to
the grid.
The presence of DG operators was also surveyed as part of the SPEED program, as this is an
important parameter to measure the villager’s willingness to pay for reliable power sources and
their behaviour towards it. These DG operators are local entrepreneurs that provide electricity
through self-made micro grids to households or shops in rural communities. The data collected
regarding the DG operators was related to the amount of electricity each village gets. Table 8
shows the number of villages having a DG operator and their electrification status. It can be seen
that 49 (52%) out of the 95 surveyed villages have at least one DG operator. It is also noticeable
that the presence of DG operators is most common in villages getting less than 5 hours of
electricity supply – 69% of these villages have at least one DG operator.
Electrification status of villages where DG operators exist
Number of villages having a DG operator
Percentage having a DG operator
Total villages having a DG operator 49 52%
More than 10 hours of electricity 4 50%
Less than 10 hours of electricity 5 38%
Less than 5 hours of electricity 27 69%
Not electrified 13 37%
Table 8. Electrification status of villages where DG operators exist (2014)
It is interesting to see that the existence of DG operators is more common in villages that are
already grid connected than in not electrified villages. This can be due to the changes in social
behaviour that the access of electricity creates – people that get access to electricity tend to get
used to the comfort that it provides and increase their use of electrical devices. Therefore, 50% of
the villages getting more than 10 hours of electricity supply have a DG operator. In their case, even
if they are getting many hours of electricity supply, the irregularity on the timings and the fact that
not 100% of the households are grid connected make them require a DG operator to use their
electrical appliances, as they are used to.
Another parameter evaluated was whether the DG operator was serving households or shops.
During the surveys it was noticed that when the customers were households, the DG operator was
generally providing electricity only for lighting purposes; whilst, when the customers were shops,
the DG operator can provide electricity for lighting or for other appliances, for example computers,
printers, small welding machines, fans and others. The next table shows the division of the DG
operators depending on the loads they serve.
From diesel to solar: A franchise model for the replacement of diesel generators with solar PV systems for micro-grids in rural India
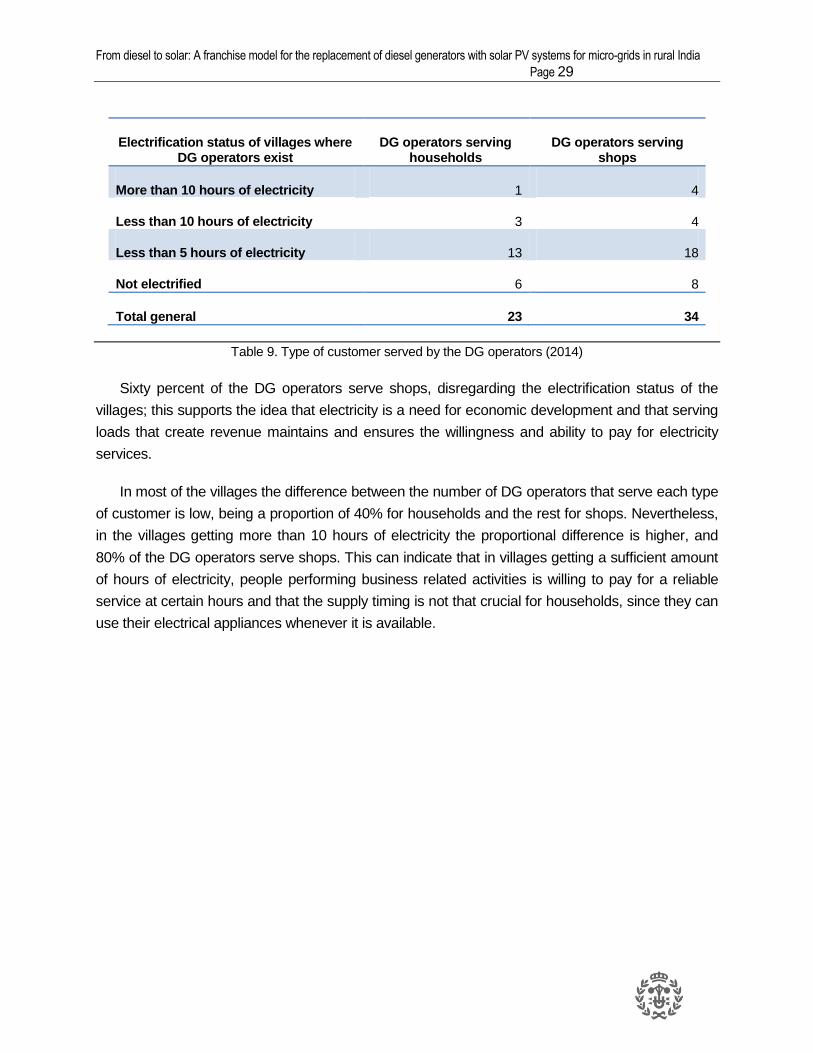
Page 29
Electrification status of villages where DG operators exist
DG operators serving households
DG operators serving shops
More than 10 hours of electricity 1 4
Less than 10 hours of electricity 3 4
Less than 5 hours of electricity 13 18
Not electrified 6 8
Total general 23 34
Table 9. Type of customer served by the DG operators (2014)
Sixty percent of the DG operators serve shops, disregarding the electrification status of the
villages; this supports the idea that electricity is a need for economic development and that serving
loads that create revenue maintains and ensures the willingness and ability to pay for electricity
services.
In most of the villages the difference between the number of DG operators that serve each type
of customer is low, being a proportion of 40% for households and the rest for shops. Nevertheless,
in the villages getting more than 10 hours of electricity the proportional difference is higher, and
80% of the DG operators serve shops. This can indicate that in villages getting a sufficient amount
of hours of electricity, people performing business related activities is willing to pay for a reliable
service at certain hours and that the supply timing is not that crucial for households, since they can
use their electrical appliances whenever it is available.

Page 30 Thesis Report
Figure 5. Type of customer of the DG operators in the surveyed villages (2014)
Regarding the type of costumer, it was found that the DG operators serving households have
around 300 connections, while the ones that serve shops have approximately 150. It is important to
mention that this information was the result of the perception of the villagers or the DG operators,
who were willing to provide just an estimate number of their served customers, but not the exact
value. During the surveys, it was also noticed that most of the DG operators charge a daily tariff
that can range from INR 3 to INR 5, from households where they mostly provide just electricity for
lighting; and from INR 5 to INR 25 for shops, where sometimes they provide electricity for the use
of fans. The tariff for shops can be even higher (up to INR 100) if the loads served include
computers, printers or others.
Households Shops
Average number of connections 302 146
Average charge per day 4 7
Table 10. Average number of connections and daily charge for households and shops (2014)
It was also found out that the DGs operate mostly in the evenings for 2.5 to 4 hours, when they
provide mostly lighting. If they provide electricity to power computers or other productive loads,
they can them up to 8 hours.
0
10
20
30
40
50
60
More than 10 hours of
electricity
Less than 10 hours of
electricity
Less than 5 hours of
electricity
Not electrified
Total general
DG operators serving shops
DG operators serving households

From diesel to solar: A franchise model for the replacement of diesel generators with solar PV systems for micro-grids in rural India
Page 31
4.2. Study Cases
A detailed interview was designed to better understand the business model of the DG
operators. It was intended to find more information about the technology being used for generation
and distribution of electricity, the current related costs, the number of customers and their payment
modality, their revenues, among other data. The specific questions asked can be found in the
Appendix (11.1.1Interview content). As part of the interview, some questions about their
willingness to get a solar PV system through a franchisee model were asked; people were offered
the option to operate the system and get a percentage of the revenue, or pay upfront 30% of the
total cost of the system and pay a monthly fee to owe the system in 5 years. It is important to
remark that the values gotten are average figures provided by the DG operators; thus to validate
the accuracy of the values, further studies should be made. Furthermore, it was noticed that
sometimes the DG operators were not willing to share exact details of their business model for
being afraid of getting in trouble with the electricity authorities or getting competitors into their
businesses. A total of 10 interviews were performed, from which 5 were selected and presented
here. These were selected for being the ones that provided the biggest amount of information due
to the willingness of the DG operators of sharing their numbers.
4.2.1. Chakkai
Chakkai is a village in the Araria district with more than 1000 households; most of the villagers
are farmers. The village was electrified some years back; nevertheless, people are still relying on
the DG operator for lighting during the evenings.
Sanjay Kumar Biswas started his business as
a DG operator in 2011. He got an old and ruined
genset as a present from his family and spent INR
5000 to fix it. He decided to serve households with
electricity for lighting. In the beginning he got 300
customers; when the grid came 2 years ago, he
lost about 25% of his customers. However, some
months ago the transformer of the village broke
down and he got even more clients than in the
beginning. At the moment he serves around 325
households with one lighting point during 3.5 hours
in the evening; he asks his clients to use an 11 W
CFL and they can also connect a device to charge
their mobile phones, making their allocated load of
about 20 W. He charges INR 100 per month at the
beginning of the month to avoid the trouble due to delays of payment.
Figure 7. DG operator of Chakkai Figure 6. DG operator of Chakkai

Page 32 Thesis Report
Type of load Number of connections
Power (KW) Hours of service
Price (INR)
Frequency of payment
Households 325 11 W + charging point (up to 20 W)
3.50 100.00 Monthly
Table 11. Connection characteristics of the Chakkai DG operator (2014)
Sanjay uses kerosene instead of diesel to run his genset, thereby reducing its operational
costs. He buys kerosene at around INR 40 per litre and uses 1.5 litres per hour. Regarding other
costs, he does not pay anyone to maintain his engine, he does it by himself and spends about INR
3 500 per month in oil.
Cost of fuel (INR) INR 7 000 per month
Maintenance cost (INR) He changes the oil
Oil for genset (INR) INR 3500 per month
Table 12. Operation and maintenance costs of the DG operator of Chakkai (2014)
The 325 connections are equally divided into the three phases provided by the generator. He
controls the load in each of the phases checking their amperage so he can notice if any of his
clients is connecting more than the allowable load.
Figure 8. Voltage and amperage board and CFL and lighting point allowed
Regarding his revenues, he charges an INR 100 connection fee and he is getting a profit of
around INR 30 000 to INR 35 0000 per month.

From diesel to solar: A franchise model for the replacement of diesel generators with solar PV systems for micro-grids in rural India
Page 33
4.2.2. Matehari
This is a village in Araria, with around 250 households. It is currently grid connected, but the
villagers just get around 2 to 3 hours of electricity. Matehari is next to a national highway, which
makes its market very busy and always crowded; to keep the business activities running even
during the evening hours and when the electricity supply is not there they are connected to a DG
operator.
The DG operator of Matehari is Sakar Hussain. He provides electricity for lighting to shops in
the market area and to households around it. He has around 225 connections in total, charging
INR 125 per month or 2 L of kerosene for 3 hours of service. His customers must use an 11 W CFL
and can connect a mobile phone charging point to it.
The payment with kerosene is a practice that is widespread in other villages in Araria. BPL
people have access to subsidized kerosene, paying just INR 20 per litre instead of INR 40; the DG
operators accept two litres of kerosene in exchange for the electricity for lighting, and can use the
kerosene to run their gensets or resell it at least at the normal price (INR 40). This is an issue that
modifies the awareness of the amount paid by the end consumer, since he or she perceives to be
paying INR 40 per month (2 litres of kerosene at INR 20 each), while the actual price is higher; and
in the case of the removal of this payment scheme, it is possible that they won’t be willing to pay
more than the INR 40 that they are currently paying.
Type of load Number of connections
Power (KW) Hours of service
Price (INR)
Frequency of payment
Households 95 11 W + charging point (up to 20 W)
3 125 or 2 L of
kerosene
Month
Shops 130
Table 13. Connection characteristics of the Matehari DG operator (2014)
Out of his 225 connections, 200 pay regularly; the ones that don’t pay are disconnected from
his mini-grid. He spent INR 12 000 in wiring for the deployment of the mini grid. He has one
employee who helps him to collect the money, run the genset and in other duties of his auto
mechanic workshop; his monthly salary is INR 2000. Even though he accepts kerosene as
payment for the electricity he provides, he doesn’t use it to run his engine since he says that there
is enough demand for the kerosene and he gets more revenue from selling it than from using it. He
uses 160 L of diesel per month, spending around INR 10 000. Since he is a mechanic, he provides
maintenance for the genset himself and he uses the remaining oil from the cars to which he
provides maintenance at his workshop.

Page 34 Thesis Report
Litres of diesel per month (L/month) 160 (INR 10 000)
Maintenance cost (INR) He changes the oil
Oil for generator (INR) He uses the oil from the cars he maintains
Table 14. Operation and maintenance costs of the DG operator of Matehari (2014)
He divides the 225 connections in three phases. He can check the balance of the loads, and
supply and demand from the sound of the rotation of the motor. When the demand increases the
motor runs slower, making a specific sound, then he disconnects each of the three phases to
determine in which of the phases the problem is.
Figure 9. DG operator of Matehari checking the load balance (2014)
He commented that his monthly profit is around INR 15 000. When he was asked about his
willingness to get a solar PV system, he showed to be interested; besides, he mentioned that he
would be willing to make the upfront payment and pay a monthly fee in order to own the system
after some time.

From diesel to solar: A franchise model for the replacement of diesel generators with solar PV systems for micro-grids in rural India
Page 35
4.2.3. Hardiya
The market of Hardiya is a village in Gopalganj, having around 100 households. Around 35
households and 45 shops are grid connected, but they are only getting 2 to 3 hours of electricity
per day.
Ophra Kish is the DG operator of the market; he started his business 10 years back. He
provides electricity for lighting to shops. At the beginning he wasn’t willing to share too many
details about his business; later he informed that he has around 70 shops connected, and that he
provides them with one lighting point of around 15 W, he charges them INR 6 per day. He doesn’t
have a disconnection policy; he thinks trust is very important, so even if they customers get
delayed he doesn’t disconnect them.
Type of load Number of connections
Power (KW) Hours of service
Price (INR) Frequency of payment
Shops 70 Up to 15 W 3 6.00 Daily
Table 15. Connection characteristics of the Hardiya DG operator (2014)
He provides one phase connection to each of his customers and checks the load in each
line with an ampere meter. He provides the maintenance to his genset himself, spending INR 600
for 3.5 litres of oil every 100 h. He uses around 1.25 litres of fuel per hour; as fuel he adds
kerosene to diesel getting a mixture of 30% kerosene and 70% diesel, this lowers his operational
costs.
Litres of fuel per day (L/day) 3.75 (70% diesel, 30% kerosene)
Maintenance cost (INR) He changes the oil himself
Oil for generator (INR) INR 600 (3.5 L) every 100 h
Table 16. Operation and maintenance costs of the Haridya DG operator (2014)
When he was asked about his willingness to get a solar PV system, he said he would like to
get one; nevertheless he pointed out that the decision of just operating it or owning it would depend
on the amount that should be paid up front. He would like to go for a hire-to-own scheme, but he is
worried that he won’t be able to get the upfront payment.

Page 36 Thesis Report
4.2.4. Lokhariya
Lokhariya is an un-electrified village of the Araria district with around 500 households. To
supply their lighting needs during the evening they rely on a DG operator. The mini-grid has around
250 households connected. The customers are allowed to use an 11 W CFL and a mobile phone
charging point for 3 hours, and pay 2 litres of kerosene or INR 100 per month for this service.
Type of load Number of connections
Power (KW) Hours of service
Price (INR) Frequency of payment
Households 250 11 W + charging point (up to 20 W)
3 100 or 2 litres of kerosene
Monthly
Table 17. Connection characteristics of the Lokhariya DG operator (2014)
Naran Daaz is the DG operator of Lokhariya. He gets approximately 450 litres of kerosene per
month, since 25% of his clients usually don’t pay on time. He uses approximately 200 L of
kerosene per month to run his genset, and sells the rest at INR 50 in the nearest market.
He and his family check the lines every day, to make sure that anyone is connecting more than
the load allowed. If this happens he disconnects the user. He also checks the load connected
measuring the current delivered to each of the lines at any time. Besides his operational and
maintenance costs for oil changes, he also spends INR 4000 every six months to replace the grid.
Cost of fuel (INR) 200 L of kerosene per month
Maintenance cost (INR) INR 1 000 every 4 months
Oil for genset (INR) INR 700 (3.5 L of oil) every 100 hours
Other costs (INR) INR 4000 every six months, for grid replacement
Table 18. Operation and maintenance costs of the DG operator of Lokhariya (2014)

From diesel to solar: A franchise model for the replacement of diesel generators with solar PV systems for micro-grids in rural India
Page 37
4.2.5. Mahdopur and Harihalpur
Mahdopur and Harihalpur are neighbouring villages in Chattapur block of Supaul. Both of
them are un-electrified and share the same marketplace. There are four DG operators serving
these villages: one for the market, one for the local bank and two for the households in each
village. The shops in the market served by the DG operator were surveyed in order to have a better
understanding of their loads; nevertheless it was not possible to interview the DG operator.
The market has more than 100
shops, 90 of them are shops that only
require lighting. They pay INR 7.00 for 4
hours of lighting using an 11 W to 18 W
CFL; the usage of a mobile charging
device is also allowed. Among these
types of shops are tailoring shops,
general stores and sweet shops.
There are also stores having higher
loads, like printers, computers, fridges,
mobile phone charging service and small
soldering machines. To these stores, 12
hours of electricity per day is supplied
and different tariffs apply.
The following tables summarize the loads and tariffs for these shops.
Figure 10. Tailoring shop requiring just lighting

Page 38 Thesis Report
No Hours of
supply
Computerand LCD monitor (100 W)
Printer (100 W peak and 10 W stand
by)
Small soldering
machine (500 W peak)
Mobile phone
charging (100 W)
Fan (60 W)
CFL (30 W)
Fridge (300 W)
1 12 1 1 1 1 1
2 12 1 3 1 1 1
3 12 1 1 2 2
4 12 1 2 1 1
5 12 1 1
6 12 1 2 1 1 1
7 12 1 1 1 1 1
Table 19. Shops loads in Mahdopur and Harihalpur market (2014)
The peak load and energy consumption for each electrical appliance was obtained from the
Lawrance Berkeley National Laboratory data, and presented on the first section of this report.
No Daily payment (INR/ day)
Monthly payment (INR
per month)
Total peak load (KW)
Average daily units consumed
(KWh)
Unit cost (INR per KWh)
1 3,000.00 0.39 3.65 ₹ 27.40
2 3,000.00 0.54 2.84 ₹ 35.21
3 3,000.00 0.38 3.53 ₹ 28.33
4 3,000.00 0.39 2.62 ₹ 38.17
5 60.00 0.2 2.4 ₹ 25.00
6 90.00 0.44 2.67 ₹ 33.71
7 90.00 0.29 3.48 ₹ 25.86
Table 20. Shops tariff in Mahdopur and Harihalur market (2014)
From this data and knowing the amount paid by the shop owners, the cost per KWh of
electricity was obtained for each case. On average, each shop pays INR 30.53 per KWh.
Nonetheless, the shop owners are not aware of the unit price, since a packaged and affordable

From diesel to solar: A franchise model for the replacement of diesel generators with solar PV systems for micro-grids in rural India
Page 39
service is presented to them. Another important remark is that the DG operator charges the same
amount for different loads, and cross subsidizes them in order to obtain a profit.
These types of customers can be
considered as productive loads, since
business are being served and can exist
thanks to the electricity provided. Since
they are generating an income from the
electricity consumed, they have the
willingness to pay for it and also the
ability. This creates a sustainable
business for the consumer and the
provider of electricity.
The market on Mahdopur and
Harihalpur is a clear example of how
electricity boosts and sustains economic
activities.
4.3. Key findings
A total of ten interviews were performed to DG operators for households and market areas in
Araria, Gopalganj and Supaul. The summary of those interviews can be found below.
Figure 11. Studio and mobile phone repairing in Mahdopur
and Harihalpur market (2014)

Page 40 Thesis Report
Village Mahmudpur Reotith Hardiya Kiratpura Matiyari H
H
Connections 0 0 0 0 95
Load provided (W) 0 0 0 0 Up to 20 W
Hours of service 0 0 0 0 3
Payment (INR) 0 0 0 0 125
Electricity price (INR/KWh)
₹ - ₹ - ₹ - ₹ - ₹ 69.44
Sh
op
s
Number of connections
45 120 70 35 130
Load provided (W) 15 W CFL plus fan 15 W CFL 15 W CFL 15 W CFL Up to 20 W
Hours of service 7 2.5 3 3 3
Payment (INR) 25 per day 6 per day 6 per day 7 per day 125 or 2 L of kerosene
Electricity price (INR/KWh)
₹ 47.62 ₹ 160.00 ₹ 133.33 ₹ 155.56 ₹ 69.44
Pro
du
cti
ve lo
ad
s
Number of connections
12 0 0 0 0
Load provided (W) Up to 500 W 0 0 0 0
Hours of service 7 0 0 0 0
Payment (INR) 100 per day 0 0 0 0
Electricity price (INR/KWh)
₹ 28.57 ₹ - ₹ - ₹ - ₹ -
Oth
er
Number of connections
2 20 0 0 0
Load provided (W) Up to 2.5 KW Up to 100 W 0 0 0
Hours of service 6.5 2.5 0 0 0
Payment (INR) 12500 per month 10 0 0 0
Electricity price (INR/KWh)
₹ 25.64 ₹ 40.00 ₹ - ₹ - ₹ -
Total Load served (KW) 14.375 3.8 1.05 0.525 4.5
Total KWh provided (KWh/day) 98.125 9.5 3.15 1.575 13.5
Total income per month ₹ 94,750.00 ₹ 27,600.00 ₹ 12,600.00 ₹ 7,350.00 ₹ 28,125.00
Weighted Average selling Price (INR/KWh)
₹ 43.61 ₹ 142.86 ₹ 133.33 ₹ 155.56 ₹ 69.44
Table 21. Load, way of charging, electricity price and energy provided by the DG operators serving markets (2014)

From diesel to solar: A franchise model for the replacement of diesel generators with solar PV systems for micro-grids in rural India
Page 41
Regarding markets, Table 21 shows the size and type of loads served by each DG operator.
Most of them provide just lighting, like the ones in Hardiya, Kiratpura and Matiyari; this service has
an average price of INR 5.80 per day or INR 130 per KWh. Besides lighting, the use of fan is also
on demand in the markets of Reotith and Mahmudpur, having an average price of INR 43.81 per
kWh. The operator of Mahmudpur has higher loads connected, including photo and printing
studios, mobile phone repairing shops, fridges, and even banks, having an weighted average
selling price of INR 43.61 per kWh, the lowest price found on markets. It can be noted that the DG
operators that provide lighting have very similar selling prices per kWh and tariffs; the price per
kWh is reduced when productive loads are served.
Village Mahmudpur Reotith Hardiya Kiratpura Matiyari
Fuel used Diesel Diesel Kerosene and
diesel (30/70 mix) Diesel Diesel
Fuel consumption per month (L)
1075 240 112.5 90 160
Cost of fuel (INR/L) ₹ 60.00 ₹ 61.00 ₹ 54.70 ₹ 61.00 ₹ 62.50
Total expenditure on fuel (INR/month)
₹ 64,500.00 ₹ 14,640.00 ₹ 6,153.75 ₹ 5,490.00 ₹ 10,000.00
Maintenance cost (INR/month)
₹ 1,875.00 ₹ 450.00 ₹ - Unknown ₹ -
Expenditure on oil (INR/month)
Included in maintenance
₹ 1,200.00 ₹ 600.00 Unknown ₹ -
Number of employees 0 0 0 0 1
Salary for employees (INR/month)
₹ - ₹ - ₹ - ₹ - ₹ 2,000.00
Total expenses (INR/month)
₹ 66,375.00 ₹ 15,090.00 ₹ 6,153.75 ₹ 5,490.00 ₹ 12,000.00
Total profit (INR/month) ₹ 28,375.00 ₹ 12,510.00 ₹ 6,446.25 ₹ 1,860.00 ₹ 16,125.00
Expenses/revenue 70% 55% 49% 75% 43%
Generation cost (INR/KWh)
₹ 22.55 ₹ 52.95 ₹ 65.12 ₹ 116.19 ₹ 29.63
Margin (INR/KWh) ₹ 21.06 ₹ 89.91 ₹ 68.21 ₹ 39.37 ₹ 39.81
Connection fee (INR) ₹ - ₹ - ₹ - ₹ - ₹ -
CAPEX on grid (INR) Unknown Unknown Unknown Unknown Unknown
Size of DG (KVA) 62.5 15 6 5 5
CAPEX for DG ₹ 830,000.00 ₹ 60,000.00 ₹ 15,500.00 ₹ 35,000.00 ₹ 50,000.00
Table 22. Expenses and profit for each of the DG operators serving markets (2014)

Page 42 Thesis Report
It can be noticed in Table 22 that most of the DG operators in markets use diesel as a fuel, with
the one in Hardiya as an example, who uses a 30/70 mix of kerosene and diesel. The maintenance
costs are very different among them; most of them claim that they handle maintenance of the
machines themselves and just the cost of oil is accounted. Their generation cost is also very
variable since they run their gensets at different loads, and because their tariff is very similar, their
margin ranges from INR 21 to INR 90 per kWh. Thus, providing an average of these values would
provide the wrong idea. Notwithstanding, the relationship between expenses and income can be
averaged to 58% showing that the operators are not aware of their generation or selling price,
while they provide a competitive and affordable tariff and they collect the amount of money
expected at the end of the day. This will just be affected by the number of loads. With more loads
connected the higher income.
Village Bheldi Chakkai 1 Lahtora Lokhariya Mahdopur
HH
Number of connections
325 300 150 250 250
Load provided (W)
Up to 15 W CFL
11 W CFL plus mobile charging point (up to 20
W)
Up to 12 W CFL
11 W CFL plus mobile charging
point (up to 20 W)
5 W to 35 W CFL (20 W on
average)
Hours of service
3.5 3.5 3.5 3 4
Payment 100 per month 100 per month 2 L of kerosene per month
100 or 2 L of kerosene per
month
80 or 2 L of kerosene per
month
Electricity price
(INR/KWh)
₹ 63.49 ₹ 47.62 ₹ 63.49 ₹ 55.56 ₹ 33.33
Total Load served (KW)
4.875 6 1.8 5 5
Total KWh provided (KWh/day)
17.06 21 6.3 15 20
Total income per month
₹ 32,500.00 ₹ 30,000.00 ₹ 12,000.00 ₹ 25,000.00 ₹ 20,000.00
Weighted Average selling Price (INR/KWh)
₹ 63.49 ₹ 47.62 ₹ 63.49 ₹ 55.56 ₹ 33.33
Table 23. Load, way of charging, electricity price and energy provided by the DG operators serving
households (2014)

From diesel to solar: A franchise model for the replacement of diesel generators with solar PV systems for micro-grids in rural India
Page 43
Table 23 shows the number of households served and the loads provided by each DG
operator. All of the DG operators charge on a monthly basis and accept cash or kerosene at an
equivalent of INR 94, on average. They provide lighting for typically 3.5 hours and usually allow the
use of a mobile phone charging device at an average electricity price of INR 52.70. The DG
operator of Mahdopur has the lowest selling price, since he provides more hours of electricity and
charges less. Their monthly income is mostly dependant on the number of connections, since they
charge very similar rates.
Village Bheldi Chakkai 1 Lahtora Lokhariya Mahdopur
Fuel used Diesel Kerosene Kerosene Kerosene Kerosene and diesel
Fuel consumption per month (L)
315 168 157.5 180 180
Cost of fuel (INR/L) ₹ 61.00 ₹ 40.00 ₹ 45.00 ₹ 50.00 ₹ 50.00
Total expenditure on fuel (INR/month)
₹ 19,215.00 ₹ 6,720.00 ₹ 7,087.50 ₹ 9,000.00 ₹ 9,000.00
Maintenance cost (INR/month)
₹ 1,000.00 ₹ 3,360.00 ₹ 500.00 ₹ 250.00 ₹ 500.00
Expenditure on oil (INR/month)
₹ 1,800.00 Included in maintenance
Included in maintenance
₹ 595.00 ₹ 750.00
Number of employees 0 0 0 0 0
Total expenses (INR/month)
₹ 20,215.00 ₹ 10,080.00 ₹ 7,587.50 ₹ 9,845.00 ₹ 10,250.00
Total profit (INR/month)
₹ 12,285.00 ₹ 19,920.00 ₹ 4,412.50 ₹ 15,155.00 ₹ 9,750.00
Expenses/revenue 62% 34% 63% 39% 51%
Generation cost (INR/KWh)
₹ 39.49 ₹ 16.00 ₹ 40.15 ₹ 21.88 ₹ 17.08
Margin (INR/KWh) ₹ 24.00 ₹ 31.62 ₹ 23.35 ₹ 33.68 ₹ 16.25
Connection fee (INR) ₹ - ₹ 100.00 ₹ - ₹ - ₹ -
CAPEX on grid (INR) Unknown Unknown Unknown ₹ 4,000.00 ₹ 12,250.00
Size of DG (KVA) 8 5 6 6 8
CAPEX for DG ₹ 35,000.00 ₹ 5,000.00 ₹ 8,000.00 Unknown ₹ 10,000.00
Table 24. Expenses and profit for each of the DG operators serving households (2014)

Page 44 Thesis Report
Most of the DG operators serving households use kerosene as fuel to run their gensets. In the
case that they accept kerosene as payment, they use this to power their DG and reduce their fuel
expenditure. The expenditure on fuel is linked to the size of the DG, bigger systems require more
fuel. In spite of that, the load served is not related – in some cases more households are served
with smaller gensets, resulting in the differences in generation costs. This means that the
economics of the DG operators serving households is highly affected by the number of
connections. The lowest ratios for expenses into revenues are found in Chakkai and Lokhariya,
where the number of connections is high and the maintenance cost is low, since they do it on their
own. On average, DG operators serving households get a margin of INR 25 per kWh.
For both types of electricity consumers (shops and households), it can be seen that neither the
DG operator nor the customer is aware of the generation or selling price of electricity. The DG
operator just makes sure that he is providing an affordable price and that he gets some profit at the
end of the month. The amount of the expected profit is variable, and they see it as an extra income,
since this is just a side business for them. The DG operators for markets are usually also the
owners of one of the shops, and the ones for households are usually farmers. On the other hand,
the customers are just expecting to get the service offered on the package and a tariff they can
afford. They are not aware that they pay up to 30 times the price for grid electricity per kWh.
Other key findings from the interviews highlighted the lack of robustness of the grids used. The
absence of regulations over the quality and safety of the grid built by the DG operator has resulted
in lack of reliability and accidents that had endangered the villagers’ life. When this occurs, the DG
operator is obliged to stop providing the service. On the other hand, some DG operators have to
rebuild the grid regularly due to weather conditions, increasing their cost and forcing them to leave
the business. These two problems emphasize the need for a safer and more robust grid in order to
serve the end consumers properly.

From diesel to solar: A franchise model for the replacement of diesel generators with solar PV systems for micro-grids in rural India
Page 45
5. Proposed System’s Design
First, a study of the solar irradiation in Bihar is presented which is required to design the solar
PV systems. It was found out during the surveys that the DG operators are currently serving two
types of loads (households’ loads and markets’ loads). Therefore, two different load models were
proposed and a solar PV system to cater each one was designed (households’ system and
markets’ system). Later, a package to estimate the costs and income for each type of load is
presented in the Financial Model chapter.
5.1. Solar Irradiation
Since a standardized system is required, meteorological data that suits most of the locations is
required. As known, solar irradiation, temperature, wind speed, and other parameters vary
depending on location. Nevertheless, for this project one particular district of India was chosen –
Bihar, so the area was determined and it limits the variability of weather data. To ensure this, five
villages from the 95 surveyed were chosen randomly and their irradiation values were compared.
Month Rajapatti (kWh/m²)
Matiari (kWh/m²)
Sukha Nagar
(kWh/m²)
Itahara (kWh/m²)
Darhua (kWh/m²)
Average (kWh/m²)
Difference to mean (%)
Minimum (kWh/m²)
January 100.4 109.4 108.6 108.6 103.4 106.08 4% 100.4
February 136.4 133.1 133.1 133.1 133.1 133.76 1% 133.1
March 192 174.1 180 180 185.3 182.28 4% 174.1
April 198 172.1 182.2 182.2 190.8 185.06 5% 172.1
May 215 192.7 197.9 197.9 205.3 201.76 4% 192.7
June 172.8 146.9 156.2 156.2 160.6 158.54 6% 146.9
July 144.3 142.1 143.6 143.6 145.1 143.74 1% 142.1
August 143.6 140.6 145.1 145.1 142.1 143.3 1% 140.6
September 144 141.8 143.3 143.3 142.6 143 1% 141.8
October 151 139.9 145.1 145.1 147.3 145.68 3% 139.9
November 127.4 129.6 131 131 124.6 128.72 2% 124.6
December 115.3 130.2 130.2 130.2 120.5 125.28 6% 115.3
Yearly 1840.3 1752.4 1796.3 1796.3 1800.6 1797.18 2% 1752.4
Table 25. Solar irradiation for different villages in Bihar (2014) [18]

Page 46 Thesis Report
It can be seen that the percentage of standard deviation among the different locations is very
low, with 6% as the maximum value. This means that solar irradiation is not that variable across
Bihar, and a standardized system can be proposed. The minimum value for solar irradiation was
also identified, for ensuring a reliable service the system was designed for the lowest values. It
can be seen that during most of the year, Matiari has the lowest solar irradiation. Therefore, the
design and simulation will be performed for this location.
5.2. Load Model
5.2.1. Households’ Load
From the interviews made, it was concluded that villagers are willing to pay for lighting and
mobile phone charging, and that the DG operators have around 250 connections. Usually, DG
operators provide 3 to 3.5 hours of service, but in order to give an added value to the service, 4
hours of lighting will be offered. Therefore, the system for serving households considers the
following load.
Load definition Load size
Lighting (1 Light Emitting Diode (LED) bulb) 5 W
Mobile phone charging 5 W
Total load per household 10 W
Number of connections 250
Total load 2 500 W
Hours of service per day 4 h
Total energy supplied per day 10 000 Wh
Table 26. Loads and total energy supplied for households (2014)

From diesel to solar: A franchise model for the replacement of diesel generators with solar PV systems for micro-grids in rural India
Page 47
5.2.2. Markets’ load
In markets, lighting is required for the evening hours. One lighting point and mobile charging is
proposed to be given for each shop.
Load definition Load size
Lighting (1 LED bulb) 5 W
Mobile phone charging 5 W
Total load per shop 10 W
Number of connections 50
Total load 500 W
Hours of service per day 4 h
Total energy supplied per day 2 000 Wh
Table 27. Lighting load and energy supplied for shops (2014)
In addition, since productive loads want to be served, the system for serving markets includes
the possibility to power printing studios, mobile repairing shops or shops with fridges. Table 19
shows that the typical load in this kind of micro-enterprises (MEs)2 was 300 W (not considering
lighting and fan). Therefore, the system was designed to provide a peak load of 300 W for each
ME. The next table presents different options of the loads that could be connected for different
types of businesses.
2 For the purpose of this study, the businesses requiring just lighting loads are called shops and the ones
requiring power for productive loads are called micro-enterprises (MEs).

Page 48 Thesis Report
Load definition Load size
Option 1
One desktop with LCD monitor 100 W
One printer 100 W
Mobile phone charging3 100 W
Option 2
One desktop with LCD monitor 100 W
Two printers 200 W
Option 3
One desktop with LCD monitor 100 W
One printer 100 W
Soldering machine 50 W
Fan 50 W
Option 4
Fridge 300 W
Total load per shop 300 W
Number of connections 5
Total load 1 500 W
Hours of service per day 12 h
Total energy supplied per day 18 000 Wh
Table 28. Loads served and total energy supplied for micro enterprises (2014)
3 Assuming that they provide the service of charging mobile phones to up to 20 customers at a time.

From diesel to solar: A franchise model for the replacement of diesel generators with solar PV systems for micro-grids in rural India
Page 49
Therefore, the markets’ system should supply 20 000 Wh per day to comply with the shops’
and MEs’ demand.
No transmission losses were considered in the calculation of the loads. As shown in the
Appendix (11.2.1), the voltage drops are around 1%, which is considered negligible. Furthermore,
these loads are peak values estimated from the surveys and what was seen on ground. The exact
consumption over time is not known.
5.3. Components Specifications and Cost
The components’ specifications and cost were obtained from the Technology and procurement
guide realized by the SPEED technology team of cKinetics. This document provides the required
information about products available in India with up to date prices. The data sheets with the
specifications can be found in the Appendix (11.2.2).
The sizing of the system was done using PVsyst 6.2.2., a software available online that
includes a big database of meteorological records for various locations and technical specifications
of different components. In this case, the meteorological data of Matiari, the loads described in the
previous section and the components from the Technology and procurement guide were used as
input data. The software allows making simulations of the performance of the system over one
year, for stand-alone, grid tied, DG grids and solar pumping projects. The option of modelling an
AC stand-alone micro-grid was not available, so the stand-alone option was chosen and the
inverter was considered separately. The following figure shows a simplified model of stand-alone
systems.

Page 50 Thesis Report
Figure 12. Simplified model for stand-alone PV systems (PVsyst)
The results from the sizing of the system for each package are presented on the next tables
and figures.
Component Model Manufacturer Rated capacity
Quantity required
Price per unit Total price
Solar panel ELV 280 Vikram solar 280 W 15 ₹ 10,920.00 ₹ 163,800.00
Batteries Quanta 12 V 100 Ah 32 ₹ 6,700.00 ₹ 214,400.00
Charge controller
FM 60 Outback 60 A 1 ₹ 29,185.00 ₹ 29,185.00
Inverter GFX 3048E
Outback 3.5 KW 1 ₹ 85,800.00 ₹ 85,800.00
Total 4.2 KW ₹ 493,185.00
Table 29. Households’ system sizing and pricing (2014)
The households’ system requires 15 panels (2 in series and 6 in parallel) for a total peak
capacity of 4.2 KW. It requires 800 Ah of storage at a 48 V (32 batteries, 4 in series and 8 in
parallel). The system was modelled in order to have the lowest loss of supply probability, which led
to an over sizing of the system in order to serve the demand even during July and August, when
the availability of solar energy is at its lowest. The other option was to increase the storage

From diesel to solar: A franchise model for the replacement of diesel generators with solar PV systems for micro-grids in rural India
Page 51
capacity, but after some tryouts it became clear that it was more expensive and less efficient than
increasing the size of the PV system. Having more storage and less PV capacity had a price of
around INR 140 per W and a loss of load probability of up to 15% during June, July and August;
while a bigger PV system and less storage has a cost of INR 117 per W and a loss of load
probability around 10% during August and 2% in July. Another important remark is that the
inverter seems undersized; however, when talking to the providers they stated that the inverter
capacity can be even 80% of the PV array capacity.
Component Model Manufacturer Rated capacity
Quantity required
Price per unit Total price
Solar panel ELV 280 Vikram solar 280 W 24 ₹ 10,920.00 ₹ 262,080.00
Batteries Quanta 12 V 100 Ah
40 ₹ 6,700.00 ₹ 268,000.00
Charge controller
FM 80 Outback 80 A 1 ₹ 66,170.00 ₹ 66,170.00
Inverter GFS 7048E
Outback 7 KW 1 ₹ 214,305.00 ₹ 214,305.00
Total 6.72 KW ₹ 810,555.00
Table 30. Markets' system sizing and pricing (2014)
The markets’ system requires 24 panels (4 in series and 6 in parallel) for a total peak capacity
of 6.72 KW. It requires 1000 Ah of storage at 48 V (40 batteries, 4 in series and 10 in parallel). This
design has a loss of load probability of 15% during August and 7% in July. Also for this system, it
was trialled what is more economically feasible, increasing the capacity of the PV system or
storage. As in the previous case, reducing the size of the system and increasing the storage (5.6
kW and 1200 Ah) augmented the missing energy to up to 19% in August, 18% in July and 8% in
June without reducing the price.

Page 52 Thesis Report
Figure 13. Cost break-up for each system (2014)
The previous figure shows the cost break-up for each system, the analysis was done using
percentages to make it easier to compare. For the households’ system, the batteries are the most
expensive components –up to 43% of the total cost. The households’ system requires a higher
storage capacity per KW installed, since its demand is during the evening hours. On the other
hand, the electronic components (inverter and charge controller) represent a higher cost per watt to
the markets’ system than to the households’ system.
5.4. Simulation Results
A one year simulation (year 1991) with hourly meteorological data from Matiari was made using
PVsyst. The most important results of the simulation, regarding energy use and efficiency of the
systems, will be discussed.
Figure 12 shows the available solar energy for Matiari, it can be seen that it is very variable
along the year. Table 25 presented the values for horizontal global irradiation for the same village,
showing that the values are higher from March to May, which doesn’t match with the trend for the
available solar energy presented below.
0%
20%
40%
60%
80%
100%
120%
Households Markets
Inverter
Charge controller
Batteries
Solar panel

From diesel to solar: A franchise model for the replacement of diesel generators with solar PV systems for micro-grids in rural India
Page 53
Figure 14. Available solar energy in Matiari [18]
The difference in the trends can be explained looking at Figure 15. It shows the horizontal
beam and diffuse irradiation along the year. The global irradiation is the sum of the beam and
diffuse irradiation. Therefore, even though the beam irradiation is low during April and May, the
diffuse irradiation is high, making the global irradiation high. However, since PV systems use
primarily beam irradiation for generating electricity, the available solar energy is lower than
expected for those months. The same happens during June, July and August, when the diffuse
irradiation is higher due to the rainy season (monsoon). This reduces significantly the available
solar energy.

Page 54 Thesis Report
Figure 15. Horizontal diffuse and beam irradiation along the year [18]
5.4.1. Households’ System
Table 31 summarizes the results of the simulation for the households’ system. The high
variation of the amount of available solar energy led to the over sizing of the system in order to
supply all of the demand, and therefore the amount of unused energy is high (2599.1 KWh per
year); almost 70% of the energy required by the user (3617.9 KWh per year). Due to the poor
efficiency and high price of current storage technology, over sizing the system is the most
economical solution, at the cost of more unused energy along the year. In an off-grid system as
this, where the reliability has to be maintained in order to keep the trust of the end consumer, the
demand should be met at all time, even at a higher cost. As a second phase of this project, new
loads that can be served during the day could be found in order to reduce the amount of unused
energy and increase the revenues.
Regarding the missing energy, the demand is not completely met during July and August,
having 2.78 and 29.28 KWh of missing energy respectively. For these months, instead of
increasing the size of the system or storage, it is recommended to implement some demand side
management strategies to cope with the demand, since the amount of missing energy is very low.
Reaching agreements with the customer in order to reduce the consumption during July and
August in exchange of extra energy in other months, could be one alternative. Furthermore, it is
important to remark that this simulation was performed using the meteorological data for a
particular year (1991) and thus can vary from year to year. The last column shows the solar
fraction that is the ratio of the energy required by the user into the energy provided by the solar PV

From diesel to solar: A franchise model for the replacement of diesel generators with solar PV systems for micro-grids in rural India
Page 55
system. It can be seen that in all the months, except from July and August, all the demand can be
supplied by the solar PV system.
Available solar energy
Unused energy
Missing energy
Energy provided to the
user
Energy required by the user
Solar fraction
kWh kWh kWh kWh kWh
January 574.5 208.5 0 310 310 1
February 613.4 276.4 0 280 280 1
March 694.7 320.1 0 310 310 1
April 594.9 234.2 0 300 300 1
May 609.3 237.6 0 310 310 1
June 450.1 95.3 0 300 300 1
July 439.3 87 2.78 307.2 310 0.991
August 452.9 115.6 29.28 280.7 310 0.906
September 515.3 159.8 0 300 300 1
October 572.3 213.5 0 310 310 1
November 643.4 274.1 0 300 300 1
December 749.5 377.1 0 310 310 1
Year 6909.6 2599.1 32.06 3617.9 3650 0.991
Table 31. Households' system simulation results (2014)
Figure 16 shows the comparison between the energy need of the user and energy supplied to
the user in a graphic way for easier understanding.

Page 56 Thesis Report
Figure 16. Energy need and supplied to the user along the year for the households' system (PVsyst)
The state of charge of the batteries was also simulated; it is between 65% and 85% most of the
year, except in July and August, when the available solar energy is less and therefore the batteries
are deeper discharged. The fact that the batteries are not deeply discharged the rest of the year
enlarges their useful life.
Figure 17. Average batteries’ state of charge for the households' system (PVsyst)

From diesel to solar: A franchise model for the replacement of diesel generators with solar PV systems for micro-grids in rural India
Page 57
5.4.2. Markets’ System
The following table provides a summary of the markets’ system simulation results.
Available solar energy
Unused energy
Missing energy
Energy provided to the user
Energy required by the user
Solar fraction
kWh kWh kWh kWh kWh
January 888 210.4 0 620 620 1
February 1075 461.2 0 560 560 1
March 1309 626.4 0 620 620 1
April 1104 447.2 0 600 600 1
May 1147 473.4 0 620 620 1
June 723 76.8 0 600 600 1
July 734 103.1 27.72 592.3 620 0.955
August 810 225.2 84.23 535.8 620 0.864
September 908 270.3 0 600 600 1
October 1064 406.8 0 620 620 1
November 1166 486.7 0 600 600 1
December 1295 611.5 0 620 620 1
Year 12224 4399.1 111.94 7188.1 7300 0.985
Table 32. Markets’ system simulation results (PVsyst)
In this case, the energy provided to the user is more than the unused energy since there are
loads being served during the day and thus taking advantage of the solar energy while it is
available. Therefore neither the PV system nor the storage capacity has to be greatly over size like
in the households’ case. However, some energy is missing to serve all the loads, due to the low
solar energy available in July and August. Since increasing the size of the system or the storage
capacity is not economical, demand side management strategies should be implemented. On the
other hand, as in the households’ system, new loads that can be served during the day should be
found to reduce the amount of unused energy.
The next figure, Figure 18, shows the mismatch between energy required and supplied to the
user by the system along the year.

Page 58 Thesis Report
Figure 18. Energy needed and supplied to the user by the markets' system (PVsyst)
As in the previous case, the batteries are deeper discharged during July and August due to the
lesser amount of solar energy available. Nevertheless, for this system the surge on state of charge
is not only in those months. This demonstrates that the system is not highly oversized just to cope
with the July’s and August’s demand.
Figure 19. Average batteries state of charge for the markets' system (PVsyst)

From diesel to solar: A franchise model for the replacement of diesel generators with solar PV systems for micro-grids in rural India
Page 59
Other costs for the commissioning and operation of each system are:
Description Cost per KW (INR)
Engineer, procurement and construction (Civil & Electrical) ₹ 21,000.00
Structure cost ₹ 8,000.00
Land lease per year ₹ 792.00
Equipment maintenance per year ₹ 2,000.00
Table 33. Other costs for the commissioning and operation of solar PV systems [19]
Battery replacement is another cost that should be bared during the lifetime of the system. In
the Financial Model Chapter it is shown that batteries will be replaced every 4 years.
5.5. Micro-grid Design and Costing
For the micro-grid design and costing, the data and model of the Power Plant Economics
(PPE) Tool realized by the SPEED technology team of cKinetics was used. The table below shows
the characteristics and quantity of the components required. The cost of each component was
provided by TARA (2014), one of the SPEED partners; the quotations are attached in the Appendix
section (11.2.3). It is important to remark that this design and costing does not include the wiring
and installations inside the households or shops, and should be done by the end-user.

Page 60 Thesis Report
Specifications/Description Unit of Measure Rate per Unit
Poles Each at a distance of 40 meters 1,800.00 ₹
3 core x 25 mm2
XLPE Coated Aluminium Cables
40 meters per pole plus 5% extra Meter 79.05 ₹
2 Core x 2.5 mm2 XLPE Coated
Aluminium Cables 20 meters per connection Meter 7.08 ₹
Distribution Boxes One per pole 868.54 ₹
MCB's and accessories One per pole 116.03 ₹
Labour Charge:
Erection, support and connection One per pole 1,300.00 ₹
Earthing
Per micro-grid 1,100.00 ₹
Clamp and Miscellaneous:
I-Bolt
One per pole Piece 68.25 ₹
Dead End Clamp
Five per project Piece 78.75 ₹
Suspension Clamp
One per pole Piece 57.75 ₹
Piercing Connector
One per pole Piece 47.25 ₹
Stay Wire
10 meters per project Per meter 50.00 ₹
DB Clamp
One per pole Piece 60.00 ₹
Connector
Two per DB Piece 12.00 ₹
Connection wire
One meter per DB 15.00 ₹
Miscellaneous Items
Per pole 20.00 ₹
Table 34. Components' specifications and cost for micro-grid design (2014)
Assuming that the villages or markets are dense and that 10 connections can be done per pole, the
total micro-grid cost for each system was calculated and is presented in Table 35.
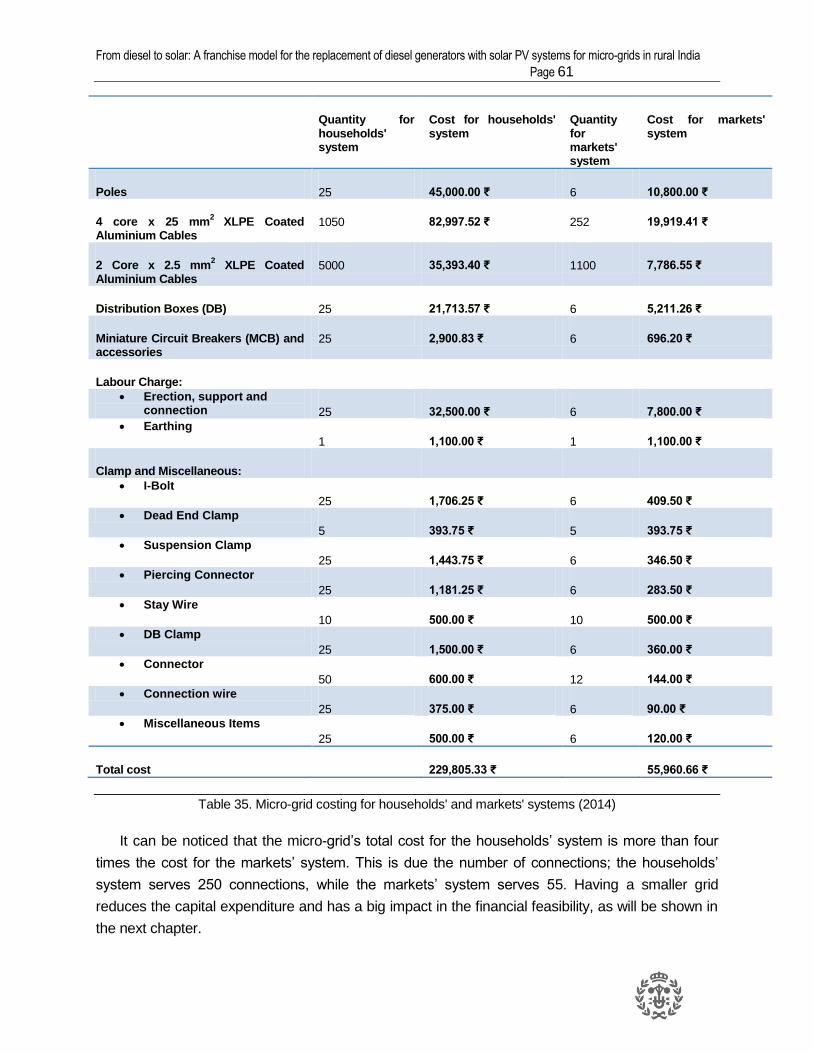
From diesel to solar: A franchise model for the replacement of diesel generators with solar PV systems for micro-grids in rural India
Page 61
Quantity for households' system
Cost for households' system
Quantity for markets' system
Cost for markets' system
Poles 25 45,000.00 ₹ 6 10,800.00 ₹
4 core x 25 mm2
XLPE Coated Aluminium Cables
1050 82,997.52 ₹ 252 19,919.41 ₹
2 Core x 2.5 mm2 XLPE Coated
Aluminium Cables 5000 35,393.40 ₹ 1100 7,786.55 ₹
Distribution Boxes (DB) 25 21,713.57 ₹ 6 5,211.26 ₹
Miniature Circuit Breakers (MCB) and accessories
25 2,900.83 ₹ 6 696.20 ₹
Labour Charge:
Erection, support and connection 25 32,500.00 ₹ 6 7,800.00 ₹
Earthing
1 1,100.00 ₹ 1 1,100.00 ₹
Clamp and Miscellaneous:
I-Bolt
25 1,706.25 ₹ 6 409.50 ₹
Dead End Clamp
5 393.75 ₹ 5 393.75 ₹
Suspension Clamp
25 1,443.75 ₹ 6 346.50 ₹
Piercing Connector
25 1,181.25 ₹ 6 283.50 ₹
Stay Wire
10 500.00 ₹ 10 500.00 ₹
DB Clamp
25 1,500.00 ₹ 6 360.00 ₹
Connector
50 600.00 ₹ 12 144.00 ₹
Connection wire
25 375.00 ₹ 6 90.00 ₹
Miscellaneous Items
25 500.00 ₹ 6 120.00 ₹
Total cost 229,805.33 ₹ 55,960.66 ₹
Table 35. Micro-grid costing for households' and markets' systems (2014)
It can be noticed that the micro-grid’s total cost for the households’ system is more than four
times the cost for the markets’ system. This is due the number of connections; the households’
system serves 250 connections, while the markets’ system serves 55. Having a smaller grid
reduces the capital expenditure and has a big impact in the financial feasibility, as will be shown in
the next chapter.

Page 62 Thesis Report
6. Business Model and Analysis
The franchising model proposed by cKinetics is based in a Business to Business (B2B)
concept. It intends to support local entrepreneurs currently providing electricity through micro-grids
to provide a more reliable, safe and clean service using solar PV systems.
In order to scale the market and overcome the current challenges being faced by renewable
energy powered micro-grids, this model considers financial innovation and a standardized
operating and technical model. The financial innovation would enable the conversion through the
access to credit, since current DGs lack funds and bankability to afford a solar PV system. The
standardization of the operating and technical construct would mitigate the operational risks and
reduce the cost of components, attracting more investors [6].
The proposed franchise includes the following stakeholders:
Master franchiser: Provides a hire-to-own facility to the franchisee and ensures the
reliability of the system. For the pilot project, ckinetics will play the role of the franchiser.
Franchisee: For the first stage of the project, the franchisee is the current DG operator.
At a later stage, it could be a developer or ESCO managing a cluster of power plants.
Plant operations
Figure 20. Stakeholders involved in cKinetics' franchising model [6]
The roles and responsibilities of each of the stakeholders should be clear and enforced in order
to ensure the feasibility of the model.
Master Franchiser
Franchisee 1
Plant 1 Plant 2 Plant 3
Franchisee 2
Plant 4 Plant 5
Franchisee 3
Plant 6 Plant 7

From diesel to solar: A franchise model for the replacement of diesel generators with solar PV systems for micro-grids in rural India
Page 63
Master franchiser Franchisee
Provides a standardized system design and business model
Operates the plant
Provides training to the operator and maintains the system
Hires the asset paying a franchisee fee and owns it after 5 years
Enables access to debt and finance Has a predefined revenue and operations model
Purchases the asset and lease it to the franchisee
Contributes equity capital
Table 36. Relationship between Master Franchiser and Franchisee (2014)
In the proposed model the franchiser acquires a debt to purchase the assets and lease them to
the franchisee in exchange of a franchise fee. The franchisee should cover part of the investment
(30%) and will be able to own the asset after 5 years. The franchiser should also provide
operational handholding to the franchisee and maintenance to the system during the duration of
the agreement. One important principle of this model is that it mimics the existing cash flows of the
DG operators to ease their transition to solar PV systems.
6.1. Vision and Mission
6.1.1. Vision
“To be a trusted franchise for rural electrification that provides a reliable and affordable service
at the same time that contributes to diminish carbon emissions and dependence on fossil fuels”.
6.1.2. Mission
“Provide franchises that support local entrepreneurs to afford, operate and maintain solar PV
systems in order to replace DGs currently serving micro grids in rural villages.”
6.2. Business Model Canvas
6.2.1. Customer Segment
The customers for the franchisee model are DG operators that currently serve their own micro
grid in rural villages of Bihar. They provide between 3 and 4 hours of electricity to approximately
250 households for lighting and mobile phone charging, or bigger loads for longer hours for shops
in markets. They are entrepreneurs, aware of the advantages of solar PV systems and willing to
take debt in order to own one. The customer has a regular monthly income and his current

Page 64 Thesis Report
expenditure on fuel is higher than 6 liters per day for serving households or 9 liters for serving
markets.
6.2.2. Value Proposition
Lower operation costs: The fuel cost of a solar PV system is zero. Additionally, the
maintenance costs are lower than the ones for a DG. After paying the system, the profits
therefore increase substantially for the operator.
Simplicity: A solar PV system is easier to operate than a DG. Furthermore, having the
support from skilled technicians ensures that maintenance and any technical problem
are solved in a simpler, faster and easier way.
Reliability: Any technical problems can be solved fast and easy by the technicians that
will be assigned for each site, this ensures the reliability of the supply for the end
consumer and therefore the revenue streams for the franchisee. Furthermore, a more
robust grid will be built to ensure the supply and its safety.
Access to credit: The operator would be able to get finance to obtain ownership of an
asset that otherwise would be out of reach for him. This increase in capital can support
future entrepreneurial ideas.
6.2.3. Channels and Customer Relations
To have a first approach to the customer, engineers and consultants will meet DG operators
and propose the franchisee scheme, explaining in detail all the aspects, advantages and risks
included. If the deal is closed they will provide training to the operator (franchisee) on how to
operate the system and troubleshooting. To ensure the reliability of the system, correct
maintenance and fast technical problem solving, one technician will be assigned for each cluster of
15 franchisees. Each technician will be visiting regularly each of the sites of his cluster to
guarantee good communication with the franchisee and correct operation of the system.
Furthermore, there will be one engineer per 45 franchisees to supervise the technicians, solve
major technical problems and commissioning of new sites. This ensures the reliability of the
system and maintains the trust of the franchisee holders.
6.2.4. Value Chain and Key Activities
The franchiser will be the link between the suppliers, manufacturers, financial institutions and
the local franchisee holders. The latter is the one providing the service to the end consumer. The
franchiser will ensure the assembly and commissioning of the system, maintenance and technical
problem solving. Additionally, financial support will be provided to each of its franchisee holders.

From diesel to solar: A franchise model for the replacement of diesel generators with solar PV systems for micro-grids in rural India
Page 65
Figure 21. Supply chain (2014)
From the value chain, the key activities and the value to the local franchisee holder
(customer)are derived and further explained below.
Key activities Value added to franchisee holder
Standardised turn-key
system design
Lower cost of components due to economy of scale. Simpler and faster
assembly, operation and maintenance.
Contact to suppliers and
manufacturers
Attain lower costs, higher quality, guarantee, reliability, and fast
replacement of spare parts or other components.
Access to finance Opportunity to afford the solar PV system and ensure financial feasibility of
the project.
Assembly and
commissioning on site
Ensure that the system is assembled in the right way and that is working
properly from the beginning.
Training of operators Fast problem solving, increased reliability of supply to ensure satisfaction
and payment from the end consumer. Ability to exploit all the features of
the product.
Continuous maintenance Increased reliability, functionality, and quality of the service. Prevent extra
costs for major problem fixing.
Provide personalized
service to each franchisee
through technicians
Continuous learning and support. Get information in a fast and direct way
from franchiser and provide feedback, suggestions and complaints. Fast
major technical problems solving.
Table 37. Key activities and value to customers (2014)
6.2.5. Key Resources and Logistics
Having a standardized solar PV system design is an important resource that can help to
reduce the capital investment. The components and spare parts for maintenance, or in case of any
technical problems, are easily available through the suppliers or in stock. This ensures fast problem
solving and maintains the reliability of the system. Trained and skilled personnel (technicians and
Suppliers + manufacturers
+ Financial institutions
Franchiser Local
franchisee End consumer

Page 66 Thesis Report
engineers) that provide close assistance to the franchisee holders will guarantee good
communication and the satisfactions of the customer. The technicians should be staying near the
surroundings of his cluster in case of any emergency. Furthermore, having the access to
investment capital is required to afford the upfront payment of the systems and run the business.
6.2.6. Key partnerships
Manufacturers and suppliers are key partners to ensure the availability of spare parts in case
repairing or replacing is needed. They should also maintain components of the solar PV system in
stock for the assembly of new power plants. The good relationship with these partners would
guarantee lower prices and better quality of components. At the moment, a first approach to SMA,
Outback, Vikram Solar, Hi-power and other local manufacturers and suppliers has been made.
Access to finance is a major challenge for renewable energy projects. Thereafter, banks and
financing institutions are important partners. The franchiser needs to acquire a debt to be able to
purchase the assets and roll-out the business. As a result, access to funds with low interest rates
and long tenure periods are pursuit. These partners have already been identified. CDKN will fund
the pilot project and Rockefeller Foundation, through the catalytic facility managed by cKinetics, will
ensure the funds to roll-out the business.
6.2.7. Cost Structure and Revenue Streams
The capital costs for the franchiser are the ones related to the system components (solar
panels, grid, batteries, and inverters, among others) and the man power to assemble it. For running
the business, salaries, travelling costs of the technicians and engineers to the different sites where
the operators are located, maintenance of the systems and the loan interest should be paid.
To afford these costs, the franchiser gets the monthly franchisee fee from each operator and a
balloon payment at the end of the five years contract, if that is the case.

From diesel to solar: A franchise model for the replacement of diesel generators with solar PV systems for micro-grids in rural India Page 67
Figure 22. Business model canvas (2014)


From diesel to solar: A franchise model for the replacement of diesel generators with solar PV systems for micro-grids in rural India
Page 69
6.3. Porter’s Five Forces Analysis
6.3.1. Threat of New Competition
At the moment there are many players entering the rural electrification market. Nevertheless,
they perceive the current DG operators as competitors and none of them are focusing on diesel
replacement with solar PV systems. Therefore, the likelihood of new competition seems very low.
Being the firsts to enter the market also provides first mover advantages.
6.3.2. Threat of Substitute Products or Services
Grid extension and micro grids set up by private companies can replace DG operators. The
Government is extending the grid in a fast pace, offering free connections and supply to BPL
consumers. Bihar is proposed to be completely electrified by 2015. Nevertheless, grid supply is not
reliable, the service is erratic and a village can be declared electrified with only 10% of households
connected. Additionally, many private companies are entering the rural electrification market.
However, they are just nascent companies, growing at a small pace and struggling to get bigger
market shares. These leave a potential market for the conversion of DG operators to solar PV
systems. Furthermore, the replacement of DG with solar PV systems has the advantage that
doesn’t need to get consumers, since those were already attained by the DG operator and will
have an added value by the improvement of the current micro-grid. A big threat however is the
existence of subsidies for the price of kerosene and diesel, which lowers the operative costs of the
DG and makes it harder to compete with from a financial point of view. Other substitute products
include solar home systems and rechargeable lanterns that can be used for lighting during the
evening.
6.3.3. Bargaining Power of Customers
Since the customer already has a source of electricity, his bargaining power is high. The DG
operators are asked to make an upfront payment that can be seen as unnecessary if they already
have a system and don’t perceive the advantages of solar PV systems.
6.3.4. Bargaining Power of Suppliers
The market of solar PV systems is growing fast, having many suppliers entering the market.
Therefore, the prices are decreasing and manufacturers and suppliers are competing hard to
acquire bigger market shares. The solar PV system does not rely on specific suppliers, giving the
flexibility to change from one supplier to another while the technical specifications are met; this
reduces the bargaining power of suppliers.

Page 70 Thesis Report
6.3.5. Intensity of Competitive Rivalry
Since the market for rural electrification in India is big, the intensity of competitive rivalry is low.
In contrast, rural electrification companies are working together and sharing learning experiences
through programs like SPEED.
6.4. SWOT analysis
Figure 23. SWOT analysis (2014)
Strengths
•Standardised product
•Cero fuel cost
•Easy to maintain
•Access to finance
•Safer grid
•Fast technical problems solving
Weaknesses
•High capital investment
•Battery and inverter replacement is needed
•High number of franchisees needed to cover overheads
•More space is required as compared to DG.
Opportunities
•Existence of governemental subsidies for Solar Systems CAPEX
•Area with high solar irradiation
•Customers are already acquired by the DG operator
•Diesel price is increasing each year
•Unreliable grid supply
Threats
•Government is setting up fast electrification infraestructure
•Unknown willingness of the DG operators to get debt

From diesel to solar: A franchise model for the replacement of diesel generators with solar PV systems for micro-grids in rural India
Page 71
6.5. Risk Analysis
It is of upmost importance to acknowledge the risks that can be found during the
establishment and running of the business. These were identified and are listed below. Each risk
has been analyzed and ranked according to its probability of occurring and its consequence in
case of happening. Table 38provides a clearer explanation of the ranking system.
Table 38. Risk ranking system [20]
Besides analyzing and ranking the risks, mitigation strategies for each risk consequence. Table 39
summarizes the risk assessment realized and the mitigation strategies proposed.
Description of risk
Risk assessment
Impact or consequence
Mitigation strategy
Lik
elih
oo
d
Co
nseq
uen
c
e
Ris
k level
Low technical capability for
installation of the system
B 5
Loss of credibility
· Skilled technicians will install the system and trained engineers will commission the plants.
· Provide regular training to technical personnel.
Wrong operation of the system
C 5 Loss of
credibility
· Trained technicians will visit the plants regularly and provide maintenance.
· The operators will be trained on basic operation and troubleshooting.
Lack of access to finance
B 5
Financial unfeasibility
of the business
model
· Banks and financial institutions as key partners.
· Franchiser has debt capability.
· Franchiser is a well established company.

Page 72 Thesis Report
Description of risk
Risk assessment
Impact or consequence
Mitigation strategy
Lik
elih
oo
d
Co
nseq
uen
ce
Ris
k level
Electrification by the
government B 4
Small market share
· Provide a reliable service to the end consumer
· Ensure supply hours to keep the trust of the end consumer
Subsidy and political
framework changes
C 2 Lost of
liquidity
· Make a financial plan that does not relies on subsidies
· Procure a fast payback time
Government subsidies on
fuel (kerosene or diesel)
C 4
Financial unfeasibility
of the business
model
· Strong value proposition
· Awareness raising on the advantages of the technology
· Remark the fact that after the owning the system, the expenses are lower than kerosene or diesel cost
Unwillingness of the DG
operators to get debt
A 5
Small market share
· Remark the opportunity to acquire a valuable asset
· Provide financial advisory so they can evaluate their ability to get debt
Inability of the operator to
pay the replacement
cost
C 3
Small market share
· Access to micro finance
· Close relationship with manufacturers and providers to get lower prices
Inability to meet a fast
demand increase
C 5
Loss of credibility
· Availability of technicians to increase the size of the system as required
· Close relationship with manufacturers and providers to get fast the required components
Standardized system not meeting the
specific requirements
of certain sites
C 5
Small market share /
Financial unfeasibility
of the business
model
· Availability of technicians to increase or decrease the size of the system as required
· Having different standardized system sizes to meet different demands.
Table 39. Risk assessment and mitigation strategies (2014)

From diesel to solar: A franchise model for the replacement of diesel generators with solar PV systems for micro-grids in rural India
Page 73
It can be seen that the most likely risks are related to the unknown willingness of conversion of
the operator due the high upfront cost to be covered, the need to obtain debt, as well as the lack of
awareness of the advantages of solar PV systems against DG. The DG operators interviewed
showed to be entrepreneurs willing to invest. Nonetheless, some of them added that even if they
are willing to invest, they currently don’t have the capital to do it. This is why personal financial
advisory is needed to help them evaluate their risks and their ability to incur debt. Awareness rising
about the benefits of solar PV systems is also needed to encourage the DG operator to convert.
The lack of access to finance is another risk that should be considered. Access to funds is
needed for feasibility of the financial model. Therefore, banks and financial institutions should be
key partners and the franchiser has to be a well established company with debt capability.
Risks regarding governmental policies are also high. The Bihar government is setting up fast
electrification infrastructure. Notwithstanding, the grid is not reliable, and so the trust of the
consumer should be gained through a robust system and reliable service. The subsidies on diesel
were just removed so prices are expected to hike. However, kerosene is still subsidized which
lowers the operational costs of the DG operators and sustains the payment through kerosene.
Awareness rising of the benefits of solar PV system and the opportunity of getting a valuable asset
through this scheme is highly required to mitigate the latter risk. The change of policies can also
affect the access to subsidies; thus the financial plan presented in the next chapter does not rely on
the availability of subsidies.
Regarding technical risks, the over-sizing or sub-sizing of the system was identified. This is a
possible risk with severe impact, principally for the financial analysis. Solar PV systems are
modular as panels can be added or removed to meet the existing demand. Additionally, it is
necessary to have a flexible financial plan and to evaluate before giving the franchisee to the
operator, if the site demand can be supplied by the standardized system. Furthermore, it would be
advantageous to have different standardized system sizes to meet different demands. Other
technical risks are related to the wrong installation and operation of the solar PV plants. This can
lead to the loss of credibility from the franchisee holder because the expected power would not be
delivered. To reduce this risk, technicians and engineers will be hired and trained. As said before,
engineers would be responsible for the commissioning of the power plants and solving major
technical problems. Besides, one technician will be assigned to every 15 sites to provide
maintenance. Furthermore, the operators will be trained on trouble shooting and operation of the
system.

Page 74 Thesis Report
7. Financial Model
Apart from the technical feasibility of the project, the financial likelihood has also been
evaluated. The components quantity and cost were input in the financial model to obtain the cash
flows for the franchiser and the owner of the franchisee (operator). Additionally, a comparison
between the conversion to solar and a business as usual case was realized.
7.1. The Model
Even though the prices for solar PV panels are decreasing and the operation and
maintenance costs are low, the investment cost is still high when compared to a DG. Therefore, it
is very unlikely that a small entrepreneur is willing to take such a risk and that a financial institution
grants them the loan. This model presents a solution for the lack of capital of rural entrepreneurs,
providing a financial plan to enable them to afford the system. This model supports the franchise
model proposed in the previous chapter. The financial parameters to be included in the franchise
agreement are listed below.
Financial parameters
Percentage of CAPEX covered by operator 30%
Interest rate for operator 15%
Margin for franchiser 20%
Years to own the system 5
Table 40. Franchisee financial parameters (2014)
From Table 40 it can be understood that the DG operator should pay a 30% of the capital cost
of the solar PV system in order to obtain the franchisee. The remaining 70% of the CAPEX turns
into a debt that will be paid over a 5 year time frame, with a 15% interest rate and adding a 30%
that is the margin for the franchiser. The total amount of the repayment of the debt, the interests
and the margin for the franchiser conform the franchisee fee that gives to the operator the right to
obtained free maintenance, technical problem solving and financing for the replacement of
batteries while the debt is being repaid. After the debt is covered, the operator owns the system.
The franchisee package is designed in a way that the operator will never pay more for the
franchisee fee than what he would pay on diesel. Therefore, if the franchisee fee is higher than the
diesel expenditure, he will disburse the same amount that he was supposed to pay for diesel, and
the rest would be compensated at the end of the five years agreement.

From diesel to solar: A franchise model for the replacement of diesel generators with solar PV systems for micro-grids in rural India
Page 75
Financial parameters
Interest rate 15%
Leverage ratio 0.7
Years of loan 6
Years of moratorium 3
Number of franchisees 45
Table 41. Financial parameters for franchiser (2014)
To be able to afford the CAPEX of the solar PV systems, the franchiser has to obtain a loan for
a timeframe of 6 years, with a 15% interest rate. It is assumed that the bank will provide 3 years of
moratorium. The franchiser should be an institution with debt capacity and able to afford the 30% of
the CAPEX of all the power plants to be built CAPEX. As a first tryout it was suggested to have 45
franchisees, a value that seems feasible and very conservative in a market of 140 000 un-
electrified villages. It was assumed that one third of the solar PV systems will be commissioned
during the first year and the rest during the second year.
7.2. Assumptions
To model the financial performance of the proposed solution, some general assumptions were made. The following tables present these assumptions; the support of each one can be found in the References section or the Appendix (11.3.1) section.

Page 76 Thesis Report
General assumptions
Yearly diesel price increase 10%
Inflation rate [21] 9.62%
Maintenance cost of generator (Rs) ₹ 13,200.004
Diesel price (INR/L) ₹ 61.555
Daily diesel consumption for serving households (L/day)
6.46
Daily diesel consumption for serving markets (L/day)
9.77
LED bulbs per household 1
LED per shop 1
Price per LED bulb (INR) [22] ₹ 300
Table 42. General assumptions for the financial model (2014)
The previous table includes the inflation rate and the yearly diesel price increase, which is a
basis for the future projections. The daily diesel consumption and its price is important to
understand how much the DG operator is spending at the moment, and therefore how much it is
able to save in case of conversion. It is important to remark that the diesel price is a conservative
value. Usually the diesel price in villages is higher than in cities due to transportation and handling
costs. Since energy efficiency is of upmost importance to reduce the size of the solar PV system
and reduce the CAPEX, one LED is assumed to be purchased for each of the end consumers.
4 Average maintenance expenditure of the DG operators interviewed.
5 Average diesel price for June [25].
6 Average diesel consumption of the DG operators serving households.
7 See Appendix for calculations.

From diesel to solar: A franchise model for the replacement of diesel generators with solar PV systems for micro-grids in rural India
Page 77
To model the franchiser cash flows the following assumptions regarding costs were made.
They are presented as percentages of the revenue. Besides, as said before, it is expected that
forming clusters will provide a reduced investment cost of components due economy of scale. This
CAPEX discount, as well as the expected expenses, is shown in the following table.
Assumptions Value
Miscellaneous expenses 2%
Travel costs 2%
CAPEX discount 5%
Table 43. Costs and discounts assumed for cluster (2014)
Human resources will also be required to run the business, design and commission the plants,
provide maintenance and solve technical problems. It is assumed that the franchiser is a branch
from a bigger company, not a nascent one; therefore, no administrative positions are considered.
Further description of each of the positions can be found in the Business Model and Analysis
.
Man power Salary (INR/Month)
8
No. of Plants assigned
Man power required
INR/year
Technician 6,000.00 ₹ 15 3 216,000.00 ₹
Engineer 30,000.00 ₹ 45 1 360,000.00 ₹
Total man power expense 576,000.00 ₹
Table 44. Human resources required per cluster
8 From conversations with one of the SPEED ESCO’s.

Page 78 Thesis Report
7.3. Households’ System Package
To model the households’ system package cash flows the following assumption of demand
served and charge per customer were made. It can be seen that for modelling the Business as
Usual (BAU) case, it was assumed a higher load, as CFL of around 11 W to 15 W are being used
at the moment. Besides, from the interviews performed it is known that DG operators provide the
service for around 3.5 hours, while it is proposed to give 4 hours of electricity supply in order to
offer an added value for the end-consumer.
Load variables Solar BAU
Number of households served 250 250
KW provided per household 0.01 0.02
Hours of electricity provided 4.00 3.50
Price per charging point (INR) ₹ 3.33 ₹ 3.33
Table 45. Load and pricing variables for households' system package (2014)
7.3.1. Franchisee Business Case
Based on the previously mentioned assumptions, the calculations for revenues and expenses
for each of the systems was performed and compared in order to demonstrate the franchisee
holder’s financial viability. The figure below shows the cash inflows and outflows for both cases. In
the first year, the operator should cover the upfront investment for the solar PV system, while there
are no outflows for the DG operator. In the following years the cash inflows are similar for both
cases. The outflows are different since for the solar PV system the expenses are just the
franchisee fee, land lease and a percentage of battery replacement in year 4, while for the BAU
case the expenditure on diesel is increasing every year. After year 5, the outflows for the solar PV
system are smaller because the system is already paid, thus increasing the cumulative cash flow
value and reaching the one for the BAU case in year 7.

From diesel to solar: A franchise model for the replacement of diesel generators with solar PV systems for micro-grids in rural India
Page 79
Figure 24. Cash flow comparison for the BAU and solar case for the households' package (2014)
The following table presents a comparison between the Net Present Value (NPV) for both
cases in the fifth and tenth year, in order to realize how the NPV boosts after acquiring the
ownership of the system. A comparison between the Levelized Electricity Cost (LEC) is also
presented. The price per KWh for the solar PV system is very high since only the energy delivered
was accounted and, as previously shown in the System Design chapter, a high amount of energy
remains unused. Therefore, as said before, new customers that can make use of the surplus
energy should be found. Even though the LEC for the solar PV system is higher than the one for
the BAU case, the proposed system is competitive since it is energy efficient, providing less energy
but generating the same revenue. Because the income for the solar PV system is so high after the
complete payment of the system, the average monthly income after 10 years is 70% higher than
the one for the BAU case.
Results Solar PV BAU
NPV 10 years 1,520,230.17 ₹ 1,241,880.68 ₹
NPV 5 years 368,563.02 ₹ 631,729.32 ₹
LEC (INR/KWh) 94.12 ₹ 21.29 ₹
Average monthly income (INR) 31,194.12 ₹ 18,045.40 ₹
Table 46. Financial results of the solar PV and BAU for the households' package (2014)
-500,000
0
500,000
1,000,000
1,500,000
2,000,000
0 1 2 3 4 5 6 7 8 9 10
INR
Year
Cash Inflows solar
Cash outflows solar
Cash Inflows BAU
Cash outflows BAU
Cumulative Cash flow solar
Cumulative cash flows BAU

Page 80 Thesis Report
From the next table, Table 47, it can be seen that the Capital Expenditures (CAPEX) that
should be affordable to the local entrepreneur seems relatively high. This can be a risk for the
business, as discussed in the previous chapter, since the operator might not have the required
amount of money available or not be willing to invest it. The high amount of debt that is needed is
one of the reasons why local entrepreneurs need this type of franchisee in order to have access to
credit. The expected monthly franchisee fee is around INR 19 000; nevertheless, as mentioned
before, this value is not the one paid, since it is higher than the current expenses of the BAU case.
The Internal Rate of Return (IRR) after 5 years is of 52% and the Return on Investment (ROI) after
5 years is 134%, demonstrating that the conversion from diesel to solar is profitable for the
franchisee holder. These values were calculated after five years, as the financial indicators
become more evident after that, because the franchisee fee is no longer being paid and most of
the income turns into profit.
CAPEX 275,937.10 ₹
Debt 671,450.63 ₹
Franchisee fee (INR/month) 18,930.18 ₹
Balloon payment 211,631.17 ₹
IRR after 5 years 52%
ROI9 after 5 years 134%
Table 47. Financial indicators for the households' package franchisee (2014)
The ten year cash flow for the proposed system is presented below. The values marked in
yellow are just for comparisons and accounted for the cash flows. They show the assumed
franchisee fee to be paid and the forecasted expenditure on diesel and maintenance of the DG,
and the calculation of a viability gap, that is the difference between both. If the viability gap is
negative the franchisee fee is higher than the expected expenditure on diesel and maintenance,
therefore the amount paid to the franchiser would be equal to the diesel cost. If the value paid is
less than the franchisee fee expected, the difference will be accounted and paid at the end of the 5
years period as a balloon payment. In this case, a balloon payment should be paid, which is even
less than the monthly franchisee fee and the diesel and maintenance cost forecasted for that year.
9 Calculated as NPV/ CAPEX

From diesel to solar: A franchise model for the replacement of diesel generators with solar PV systems for micro-grids in rural India Page 81
Table 48. Households' package franchisee’s cash flows (2014)
It is important to notice that no interest is consider, since the loan repayment and the interest associated is embedded in the franchisee
fee. Furthermore, solar projects are not subject of taxation in India. [23]

Page 82 Thesis Report
7.3.2. Franchiser Business Case
CAPEX 2,459,696 ₹
Debt 18,447,720 ₹
IRR after 5 years 17%
ROI after 5 years -109%
ROI after 10 years 53%
Table 49. Financial indicators for the households' package franchiser (2014)
The cash flows for the franchiser were also forecasted. The franchiser has to pay INR 2.5
million up front as a capital investment, and a debt of around INR 18 million should be acquired.
The IRR is relatively high, indicating that the business is feasible. Regarding the return on
investment, it can be seen that after 5 years the investment has not been recovered, but after this
time frame, when the debt is paid and the balloon payment is received, the ROI increases fast to
up to 53% after 7 years. As can be seen in the cash flow presented below, the franchiser doesn’t
have any more cash flows after year 7, since all the franchisees will have had paid their debt by
that time and no more maintenance should be provided.
It can be seen in the cash flow how the ramp-up of the number of power plants is made,
commissioning 14 during the first year and 31 the next one. The franchisee fee expected to be
received per month is variable, since it is dependent on the operators forecasted diesel
expenditure.
The maintenance cost is covered by the franchiser during the 5 years period of debt of the
franchisee. Other expenses are related to travel, since the sites where the systems are located
should be visited, and the salaries of the engineers and technicians. The loan is received in two
instalments, linked to the number of systems commissioned each year. The financing institution is
expected to provide a 3 years moratorium, after that the debt is covered in 4 more years. In this
case, the franchiser provides finance for the replacement of batteries (70% of CAPEX); the money
is equity since no other loan is requested. The total debt acquired by each franchisee considers
this amount of money; therefore it is repaid during the five years loan.
As a next phase of the project, the possibility of setting up more plants to keep on running the
business for longer, or to continue providing maintenance after the debt of the franchisee is paid in
exchange of a franchisee fee, can be evaluated.

From diesel to solar: A franchise model for the replacement of diesel generators with solar PV systems for micro-grids in rural India Page 83
Table 50. Households' package franchiser’s cash flows (2014)

Page 84 Thesis Report
7.3.3. Sensitivity Analysis
To verify how the financial model is affected by some of the assumptions made, a sensitivity
analysis was carried out. The next graph, Figure 25, illustrates the variation of the IRR for the
franchisee holder and for the franchiser with the number of households served, considering a solar
PV system of the same specifications. The returns of the franchiser are diminishing with the
increasing number of households. This is mainly because as more households are connected,
therefore the CAPEX for the micro-grid is increased, and the franchisee fee is not getting higher
than the expected expenditure on diesel. On the other hand, with more households served, the
IRR for the franchisee is incremented, since more revenue is earned and the franchisee fee is not
augmented. It has to be considered that the current PV system was designed to serve 250
households. More households can be connected and served during most of the months, but not
during the months of low irradiation, like July and August.
Figure 25. Franchisee’s and franchiser’s IRR for different number of households served (2014)
The daily diesel consumption of the operator was also varied to observe its effect on the IRR of
both the franchiser and the franchisee holder. The IRR for the franchiser increases with increasing
daily diesel consumption and is negative if the daily diesel consumption is less than 6 litres per day.
For the franchisee holder is the opposite, while the daily diesel consumption augments, the IRR
diminishes. This is because the franchisee fee to be paid is dependent on the diesel consumption –
if it is low the franchiser will have less income and the franchisee will have higher earnings.
Nevertheless, if the franchisee fee is lower, the franchisee holder will have to afford a higher
balloon payment that was not considered in this analysis. It can be concluded that the franchiser
should aim to convert DG operators that have a current diesel consumption of more than 6 litres
per day in order to be profitable.
-20%
0%
20%
40%
60%
80%
100%
120%
140%
160%
0 100 200 300 400 500 600
IRR
Number of households served
Franchisee's IRR
Franchisers' IRR

From diesel to solar: A franchise model for the replacement of diesel generators with solar PV systems for micro-grids in rural India
Page 85
Figure 26. Franchisee’s and franchiser’s IRR for different daily diesel consumption for the households'
package (2014)
The franchisers’ IRR is also dependant on the number of franchisees served – with an
increasing number of franchisees the IRR has a tendency to augment. Nevertheless, it fluctuates
for certain values, since the number of employees required is dependent on the number of
franchisees – every 15 franchisees require one technician and every 45 require one engineer.
Therefore, when the number of franchisees is a multiple of 45 the IRR is higher, since the
expenditure in human resources is better distributed among the customers.
-20%
0%
20%
40%
60%
80%
100%
0 2 4 6 8 10
IRR
Litres of diesel per day
Franchisee's IRR
Franchisers' IRR
0%
2%
4%
6%
8%
10%
12%
14%
16%
18%
0 50 100 150 200 250 300 350
IRR
Number of franchisees
Franchisers' IRR
Figure 27. Franchiser’s IRR for different number of franchisee for the households' package (2014)

Page 86 Thesis Report
7.4. Markets’ System Package
In order to model the markets’ system package, the demand to be served as well as the prices
charged per customer per day was assumed as follows. As in the households’ package case, a
lower load for lighting was assumed compared to the BAU case, since LED lamps will be provided.
The other loads and charges are alike for both cases.
Load variables Solar BAU
Shops 50 50
MEs 5 5
KW per shop 0.01 0.02
KW per ME 0.30 0.30
Hours of electricity for shop 4.00 4.00
Hours of electricity for ME 12.00 12.00
Price per charging point for shops (INR/day) ₹ 7.00 ₹ 7.00
Price per charging point for MEs (INR/day) ₹ 100.00 ₹ 100.00
Table 51. Load and pricing variables for the markets' system package (2014)
7.4.1. Franchisee Business Case
The following figure shows the yearly cash inflows and outflows, and the cumulative cash flows
for each case. The inflows are similar for both cases at all time, but the outflows are smaller for the
solar case, since it is not dependant on the fuel price. It is noticeable that in year 6 the cumulative
cash flows are equal in both cases. After that the solar PV system is more profitable, since just
maintenance and land lease cost should be afforded.

From diesel to solar: A franchise model for the replacement of diesel generators with solar PV systems for micro-grids in rural India
Page 87
Figure 28. Cash flow comparison for the BAU and solar case for the markets' package (2014)
The next table presents the financial results for both cases. The trend is similar to the one of
the households’ package: The solar PV system has a lower NPV after 5 years, but after the
payment of the system the profit boosts doubling the NPV of the BAU case. The LEC for solar PV
in the markets’ package is lower than the one for households’ since less energy remains unused
due to the existence of loads during the daylight hours. The average monthly income for the 10
years of analysis is more than 100% higher for the solar PV system than for the DG. These values
demonstrate that the proposed solar PV system is competitive compared to the current DG.
Results Solar PV BAU
NPV 10 years 1,466,634.35 ₹ 648,163.77 ₹
NPV 5 years 233,735.69 ₹ 335,095.94 ₹
LEC (Rs/KWh) 52.80 ₹ 24.98 ₹
Average monthly income 23,896.43 ₹ 9,369.57 ₹
Table 52. Financial results of the solar PV and BAU for the markets' package (2014)
-1,000,000
-500,000
0
500,000
1,000,000
1,500,000
2,000,000
0 1 2 3 4 5 6 7 8 9 10
INR
Year
Cash Inflows solar
Cash outflows solar
Cash Inflows BAU
Cash outflows BAU
Cumulative Cash flow solar
Cumulative cash flows BAU

Page 88 Thesis Report
From the 10 years cash flows forecast various financial indicators were calculated. The CAPEX
required for the markets’ package is very similar to the one for the households’ package; even if the
solar PV system has a bigger capacity, the micro-grid has fewer connections and is therefore
cheaper. Again, it is questionable if the local entrepreneurs will be capable and willing to afford the
CAPEX and undertake the debt. The franchisee fee is around INR 19 500 per month and it is
expected to be less than the current expenditure on diesel; therefore, it will be paid completely
every month and no balloon payment will be required at the end of the 5 years period. From the
ROI value it can be seen that the investment in CAPEX is almost doubled after five years. The high
value of IRR demonstrates that the business is feasible and profitable.
CAPEX 273,271.70 ₹
Debt 691,009.87 ₹
Franchisee fee (INR/month) 19,481.62 ₹
Balloon payment - ₹
IRR 35%
ROI after 5 years 86%
Table 53. Financial indicators for the markets' package franchisee (2014)
In the following table, the values marked in yellow are just for comparisons and not included in
the cash flows. They show the assumed franchisee fee to be paid, the forecasted expenditure on
diesel and maintenance of the DG, and the calculation of a viability gap, that is the difference
between both. In this case, since the expenditure on fuel and maintenance is higher than the
expected franchisee fee, no balloon payment is required at the end of the 5 year agreement. In
year 4, a 30% of the batteries’ replacement price should be afforded and after the repayment of the
system, the operator should pay for the maintenance of the solar PV system and the replacement
of batteries.

From diesel to solar: A franchise model for the replacement of diesel generators with solar PV systems for micro-grids in rural India Page 89
Table 54. Markets' package franchisee’s cash flows (2014)

Page 90 Thesis Report
7.4.2. Franchiser Business Case
The cash flows for the franchiser of this type of package were also calculated. The franchiser
has to afford around INR 2.5 million and acquire a debt of more than INR 18 million in exchange for
an IRR of 35%, which is relatively high. In this case, since no balloon payment is perceived in year
6 and no maintenance should be provided after the finalization of the 5 year agreement, the
franchiser doesn’t have any cash flows after year 6; therefore, the ROI after 5 years and after 10
years is very similar.
CAPEX 2,451,746
Debt 18,388,092.43 ₹
IRR 35%
ROI after 5 years 46%
ROI after 10 years 50%
Table 55. Financial indicators for the markets' package franchiser (2014)
Table 40 presents the cash flows for the franchiser for a time period of 10 years. The income
earned is due to the franchisee fee that is always lower than the expected expenditure on diesel
and maintenance of the DG. The operative costs incurred are maintenance, travels to commission
and maintain the solar PV plants, salaries of technicians and engineers, and other miscellaneous
costs. The loan is perceived in two instalments, which value depends on the number of systems
commissioned each year. The bank is expected to provide a moratorium of 3 years and a total
timeframe of 6 years to pay the debt. The franchiser should provide financing for the replacement
of batteries (70% of CAPEX); to afford this no other loan is requested. The total debt acquired by
each franchisee includes this amount of money; therefore it is repaid during the five years loan.
As a next phase of the project, the possibility of setting up more plants to keep on running the
business for longer, or to continue providing maintenance after the debt of the franchisee is paid in
exchange of a franchisee fee can be evaluated.
When comparing the markets’ package with the households’ package it is noticed that the first
one is more profitable for both the franchiser and the franchisee holder. Even if both require the
same CAPEX, the current diesel consumption of DG operators serving households is lower and
therefore the capability of paying the complete franchisee fee is affected.

From diesel to solar: A franchise model for the replacement of diesel generators with solar PV systems for micro-grids in rural India Page 91
Table 56. Markets' package franchiser’s cash flows (2014)


From diesel to solar: A franchise model for the replacement of diesel generators with solar PV systems for micro-grids in rural
India Page 93
7.4.3. Sensitivity Analysis
Since some variables are just assumed values, a sensitivity analysis was performed to
assess how a change in these parameters will affect the financial plan. For the franchisee it
can be seen that the number of MEs served has a higher effect on the IRR than the number
of shops served. This can be explained by the fact that MEs are served mostly during
daylight hours, so no extra storage is required. Besides, they provide higher income to the
franchisee holder with the same CAPEX on micro-grid construction – each ME provides INR
3 000 per month, while 10 shops provide INR 2 100. With the proposed size of the system
more MEs could be served and use the extra energy at a certain extent during the daylight
hours in order to don’t increase the storage size; this would boost the IRR.
Figure 29. Franchisee's IRR for different number of shops and MEs served (2014)
For the franchiser the situation is different: The IRR is more dependent on the number of
shops than in the number of MEs, this could be explained by the fact that the margin for the
franchiser is accounted over the total debt. Therefore, a higher debt leads to a higher
franchisee fee. In this case a higher number of shops require a higher CAPEX because of
the augmented amount of connections required, and this increases the debt of the
franchisee.
10
20
30
40
50
60
70
80
90
100
1 2 3 4 5 6 7 8 9 10 11 12
Nu
mb
er
of
sho
ps
serv
ed
Number of MEs served
150%-200%
100%-150%
50%-100%
0%-50%
-50%-0%

Page 94 Thesis Report
Figure 30. Franchiser's IRR for different number of shops and MEs served (2014)
Regarding the current daily diesel consumption of the DG operators, the trend is very
similar to the one of the households’ package. Higher diesel consumption leads to an
increase of the franchiser’s IRR and a decrease in the one of the franchiser. If the daily diesel
consumption is below 8 litres per day, the IRR of the franchiser is too low and therefore the
business is not feasible. It can be seen that both trends stabilize at a value of around 9 litres
of diesel per day, meaning that at that point the franchisee can be fully covered by the
expected diesel expenditure. Therefore, no viability gap is needed and the franchisee fee is
fixed, maintaining the income for the franchiser and cost of the franchisee without change.
20
40
60
80
100
120
140
160
1 2 3 4 5 6 7 8 9 10 11 12
Nu
mb
er
of
sho
ps
serv
ed
Number of MEs served
36%-38%
34%-36%
32%-34%
30%-32%
28%-30%

From diesel to solar: A franchise model for the replacement of diesel generators with solar PV systems for micro-grids in rural
India Page 95
Figure 31. Franchisee’s and franchiser’s IRR for different daily diesel consumption for the markets'
package (2014)
As in the households’ package, it can be seen that the IRR varies with the number of
franchisees granted, presenting peaks when the number of franchisees is a multiple of 45,
due to the expenses in human resources.
Figure 32. Franchiser’s IRR for different number of franchisee for the markets' package (2014)
-10%
0%
10%
20%
30%
40%
50%
60%
0 2 4 6 8 10 12 14
IRR
Litres of diesel per day
Franchisee's IRR
Franchisers' IRR
0%
5%
10%
15%
20%
25%
30%
35%
40%
0 50 100 150 200 250 300 350
IRR
Number of franchisees
Franchisers' IRR

Page 96 Thesis Report
8. Conclusions
This report presented the current rural electrification status in India. Even the grid seems to
be extending fast, the quality and quantum of electricity that the villagers get is low. Besides,
villages declared electrified don’t necessarily have 100% of its households electrified. From
these, DG operators exist.
DG operators are local entrepreneurs that provide electricity to households or market through
micro-grids. They charge fixed tariffs to their customers irrespective of their electricity
consumption, resulting in high tariffs.
Therefore, a franchise model to convert DG to solar PV system was proposed. Two
standardized solar PV systems (one to serve households and one to serve markets) were
designed attempting to minimize the loss of load probability and the cost. The
standardization of the technical system and the operative model is a key factor to ensure the
easy scalability of the system.
The franchise model proposes that the franchiser purchases the power plant and leases it to
the franchisee, who can own it after 5 years. The financial model shows that the business is
profitable if the DG operator has a current expenditure on fuel is higher than 6 litres per day
for serving households or 9 litres for serving markets since the franchisee fee should not be
higher than the current DG operator’s expenditure on diesel. Furthermore, the revenue of the
franchiser is highly dependent on the number of franchisees.
Various risks to the business were identified, including the unwillingness of the DG operator
to get debt and the low technical capability for the installation, maintenance and operation of
the system. Thus mitigation strategies, like training and hiring skilled manpower, were
proposed.
As next steps, five pilot plants will be tested in Bihar. DG operators will be selected and
trained in order to trial the model, refine it and scale it up.

From diesel to solar: A franchise model for the replacement of diesel generators with solar PV systems for micro-grids in rural
India Page 97
9. Acknowledgements
It is difficult to mention all the people that contributed, directly or indirectly, to the finalization
of this Master’s Thesis. For me, it was not just a six month project, but the achievement of a
life goal.
First, I want to thank God for amazing me every day and take me through paths and places I
would never imagine.
I thank my parents, my brother, my grandmother, my aunts, uncles and cousins for their
trust, their love and for being my “safety net”. This thesis is especially for my grandfather,
whose advice I’ll always keep in my heart and who taught me to love the fields, the sea and
the rain.
Thanks to my friends: Mariana and Wicho, who always believed in me and never let me feel
alone; Judith, Simone, Iliana and Till, for sharing the dream with me; Caro and Arjun for their
advice at all times of crisis; and my flatmates in India for accompanying me in this life
changing experience, specially Mari and Blake for their help to write this report.
I also want to acknowledge the cKinetics team, especially Abishek and Vikas for sharing their
knowledge and support me during the field work.


From diesel to solar: A franchise model for the replacement of diesel generators with solar PV systems for micro-grids in rural
India Page 99
10. References
[1] S. Krishnaswamy, “Shifting of Goas Posts; Rural Electrification in India: A Progress
Report,” Vasudha Foundation, Bangalore, India, 2010.
[2] SEDC, Synovate, “Study to understand ability and willingness to pay for energy
services,” Vasudha Foundation, Bangalore, India.
[3] Vasudha Foundation, “Shifting of Goal Posts; Rural Electrification in India: A Progress
Report,” Vasudha Foundation, Bangalore, 2010.
[4] ABPS Infrastructure Advisory PVT. LTD., “Policy and regulatory interventions to
support community level Off-grid projects,” India, 2011.
[5] E. Bast and S. Krishnaswamy, “Access to Energy for the poor: the Clean energy
option,” Rockefeller Foundation, Delhi, 2011.
[6] cKinetics, “Financing Decentralized Renewable Energy Mini-Grids in India:
Opportunities, Gaps and Directions,” cKinetics, New Delhi, 2013.
[7] N. Thirumurthy, L. Harrington and e. al., “Opportunities and Challenges for Solar
Minigrid Development in Rural India,” National Renewable Energy Laboratory,
Colorado, 2012.
[8] South Asia Energy Unit (Sustainable Development Department), “Empowering Rural
India: Exanding electricity access by mobilizing local resources,” World Bank, India,
2010.
[9] CENSUS OF INDIA, “Source of lighting,” Government of India, New Delhi, 2011.
[10] J. S. A. Cust and N. Karsten, “Rural Electrification in India: Economic and Institutional
aspects of Renewables,” University of Cambridge, Cambridge, 2007.
[11] Lawrance Berkeley National Laboratory, “Standby Power summary table,” [Online].
Available: http://standby.lbl.gov/summary-table.html. [Accessed 16 June 2014].
[12] S. Rolland and G. Glania, “Hybrid mini-grids for rural electrification: Lessons learned,”
Alliance for Rural Electrification, Brussels, 2011.

Page 100 Thesis Report
[13] Research and Markets, “India Solar Photovoltaic Market,” 2012. [Online]. Available:
http://www.researchandmarkets.com/reports/1205499/. [Accessed 30 June 2014].
[14] Ministry of New and Renewable Energy, “Jawaharlal Nehru National Solar Mission:
Building Solar India,” Governement of India, New Delhi, 2010.
[15] Natural Resources Defence Council and The Council on Energy, Environment and
Water, “Laying the foundation for a Bright future,” Natural Resources Defence Council
and The Council on Energy, Environment and Water, New Delhi, 2012.
[16] Energy Alternatives India, “Key Callenges in the Growth of Solar PV,” January 2014.
[Online]. Available:
http://www.eai.in/ref/ae/sol/cs/spi/kc/key_challenges_in_the_growth_of_solar_pv_tech
nology_in_india.html. [Accessed 30 June 2014].
[17] cKinetics, “Smart Power for Environmentally-sound Economic Development: An
agenda for action,” The Rockefeller Foundation, New York, 2011.
[18] MeteoNorm 6.1, “Weather data,” 1990.
[19] SPEED Technology Team, “Technology and procurement guide: Solar Photovoltaics,”
cKinetics, New Delhi, 2014.
[20] OpsCentre, “What are the Risks that every organisation must assess?,” 2012. [Online].
Available: http://www.opscentre.com/services-risk_management.htm. [Accessed 09
July 2014].
[21] Trading Economics, “Trading Economics,” May 2014. [Online]. Available:
http://www.tradingeconomics.com/india/inflation-cpi. [Accessed 17 June 2014].
[22] N. Saun, Interviewee, LED quotations. [Interview]. 30 April 2014.
[23] Overseas Indian Facilitation Centre, “Overseas Indian Facilitation Centre,” 1 July 2014.
[Online]. Available: http://www.oifc.in/Uploads/MediaTypes/Documents/Incentives-and-
tax-exemptions.pdf. [Accessed 2 July 2014].
[24] International Energy Agency, “Financing Electricity Access for the Poor,” in Energy
Outlook 2012, 2012.

From diesel to solar: A franchise model for the replacement of diesel generators with solar PV systems for micro-grids in rural
India Page 101
11. Appendix
11.1. Diesel Generator Operators
11.1.1. Interview content
Date
Person interviewed
Village
Is it grid connected?
Average income
Number of total HH
Number of total shops
Number of total ME (productive loads)
Position (GPS)
How many years have you had this business?
How many employees do you have?
Do you have competitors? Which? How many?
What is the greatest problem that your company faces?
o From a technical perspective?
o From a business perspective?
o From a market perspective?
How many of these systems do you operate? Just in this village?
Market related
1. What is the main interest of the people you are targeting?
a. Lighting
b. mobile phone charging
c. TV
d. Radio
e. Productive loads
f. Others

Page 102 Thesis Report
Connections
Type of load Amount Load (KW) or (A) Hours of
service
Payment
HH
Shops
Productive loads
Other
1. How do you collect the money?
2. How would you describe the growth of the business? How many connections did
you have the first, second, third month?
3. How many new connections do you have per month?
4. How many disconnections do you have per month?
5. What happens if people do not pay?
6. Do you charge a connection fee?
7. Does the price of diesel affect their business?
8. Has he heard about solar? Biomass? Wind?
Technology related
1. How many diesel generators do you have? Size?
2. Where did he get it from? Is it new or refurbished?
3. How much do you know about diesel generators? Did you have any training?
4. How did they get into the business?
5. By which means are you proving it?
a. AC/DC?
b. One phase/three phase?
6. How long does it take you to build a system?
7. How do you build your micro grid? Expenses?
8. Is there inside wiring? Who does it?
9. How do you measure consumption?
a. Meter?
b. Fixed load?
10. How do you manage technical problems?

From diesel to solar: A franchise model for the replacement of diesel generators with solar PV systems for micro-grids in rural
India Page 103
11. How does maintenance work?
12. Do they measure current or power? How?
13. How do they size the system? How do they know how many loads they can
connect?
14. How do they measure drops?
Business case related
Expenses on diesel INR/month
Cost of diesel INR/ L
Maintenance costs (INR/year)
Litres of oil per year
How much do they want to earn per
month?
CAPEX spent on diesel generator
How many years have the DG been
running
Operative hours per week
Expected lifetime
Would he be willing to convert to solar?
Would he be willing to operate or to hire to
purchase?
In the case of hire to purchase, would he
be willing to pay 30% of investment cost?

Page 104 Thesis Report
11.2. Proposed Systems’ design
11.2.1. Voltage drops in micro-grid
The voltage drops for 25 mm2 aluminium conductor, XPLE insulated cable are 2.40
mV/Amp/m [24].
For the households’ system, it is assumed that the micro-grid will have a maximum radius of
250 meters. From the inverter characteristics, the maximum amperage per phase is 4.3 A.
Therefore the maximum voltage drop is:
That is equal to 1.1% voltage drop for a 230 V grid.
The same way, for the markets’ system, it is assumed that the micro-grid will have a
maximum radius of 150 meters. From the inverter characteristics, the maximum amperage
per phase is 1o A. Therefore the maximum voltage drop is:
That is equal to 1.5% voltage drop for a 230 V grid.

From diesel to solar: A franchise model for the replacement of diesel generators with solar PV systems for micro-grids in rural
India Page 105
11.2.2. Solar PV system components’ data sheets
Figure 33. Technical specifications of VikramSolar ELV 280
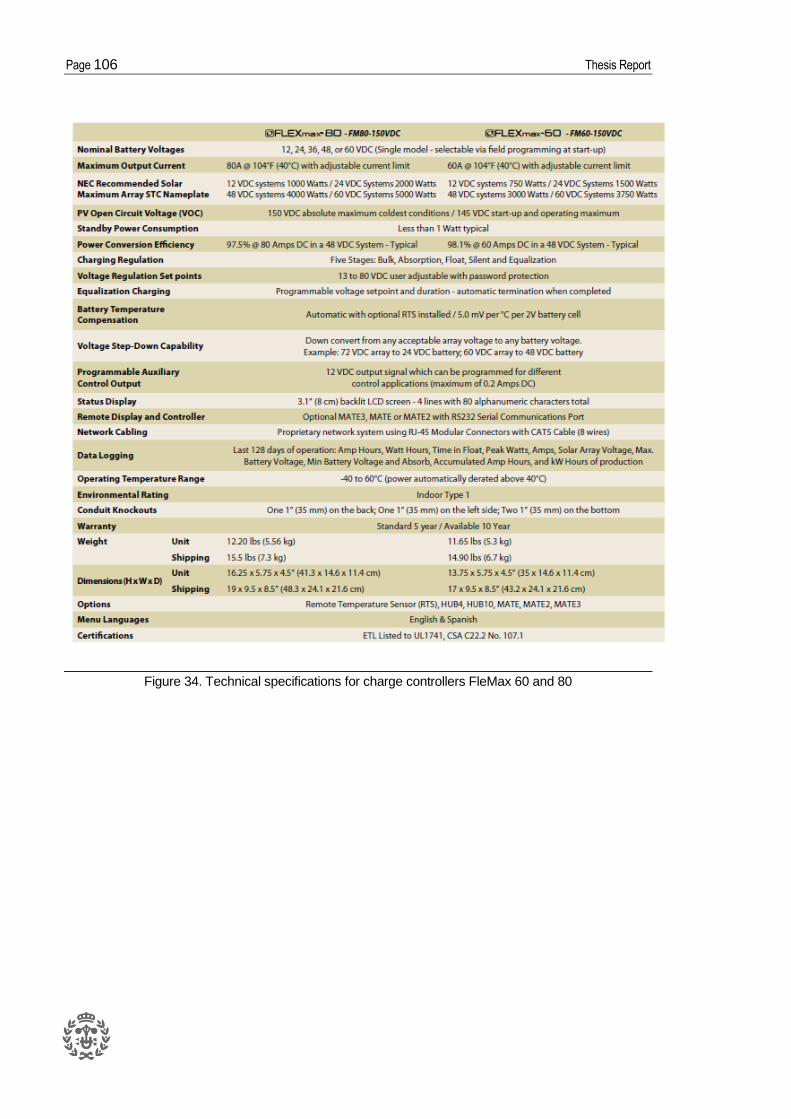
Page 106 Thesis Report
Figure 34. Technical specifications for charge controllers FleMax 60 and 80

From diesel to solar: A franchise model for the replacement of diesel generators with solar PV systems for micro-grids in rural
India Page 107
Figure 35. Technical specifications of Outback 3.5 kW inverter (VFX3048E)

Page 108 Thesis Report
Figure 36. Technical specifications of Outback 7 kW inverter

From diesel to solar: A franchise model for the replacement of diesel generators with solar PV systems for micro-grids in rural
India Page 109
11.2.3. Micro-grid components quotation
The cost in this quotation are updated to June 2014, the ones used were the values available
during the realization of the financial model. Nevertheless, the costs are very similar.
Figure 37. Quotation for micro-grid components provided by TARA

Page 110 Thesis Report
11.3. Financial Model
11.3.1. Yearly diesel price increase calculation
The following table shows the monthly prices for diesel in major cities of India 2013 and
2014.
Month Delhi
(INR/L) Kolkata (INR/L)
Mumbai (INR/L)
Chennai (INR/L)
Average (INR/L)
1-June-14 57.28 61.97 65.84 61.12 61.55
13-May-14 56.71 61.38 65.21 60.5 60.95
1-Apr-14 55.49 60.11 63.86 59.18 59.66
1-Mar-14 55.48 60.09 63.86 59.17 59.65
1-Feb-14 54.91 59.5 63.23 58.56 59.05
4-Jan-14 54.34 58.91 62.6 57.95 58.45
21-Dec-13 53.78 58.18 60.8 57.32 57.52
1-Dec-13 53.67 58.08 60.7 57.23 57.42
1-Nov-13 53.1 57.49 60.08 56.61 56.82
1-Oct-13 52.54 56.9 59.46 56.01 56.23
1-Sep-13 51.97 56.33 58.86 55.37 55.63
1-Aug-13 51.4 55.74 58.23 54.76 55.03
2-Jul-13 50.84 55.16 57.61 54.15 54.44
1-Jul-13 50.26 54.57 56.99 53.54 53.84
1-Jun-13 50.25 54.56 57.79 53.53 54.03
23-May-13 49.69 53.97 57.17 52.92 53.44
11-May-13 49.69 53.97 56.04 52.92 53.16
16-Apr-13 48.67 52.91 54.92 51.82 52.08
1-Apr-13 48.63 52.86 54.87 51.78 52.04
22-Mar-13 48.67 52.57 54.83 51.78 51.96
16-Feb-13 48.16 52.04 54.26 51.23 51.42
17-Jan-13 47.65 51.51 53.71 50.68 50.89
Table 57. Diesel prices in major cities of India during 2013 and 2014 (2014) [25]

From diesel to solar: A franchise model for the replacement of diesel generators with solar PV systems for micro-grids in rural
India Page 111
From these data, the yearly diesel price increase was calculated, being 14% for 2013 and
5% during half a year of 2014. These values were averaged, obtaining the 10% yearly
increase that was used in the financial model.
11.3.2. LED specifications
The prices and specifications of different LED’s were provided by HAVELLS through an
email conversation.
Power
(W)PF Ra CCT/K
Total
Flux(lm)
A60 5W 200-240V 6500K B22D 5.00 0.97 76 6500 400.0 80.0 50-60HZ 220-240V "=-15 C-+ 50 C" 104 MM 60 MM
A60 5W 200-240V 3000K B22D 5.00 0.97 71 3000 380.0 76.0 50-60HZ 220-240V "=-15 C-+ 50 C" 104 MM 60 MM
A60 7W 200-240V 6500K B22D 7.00 0.97 75 6500 500.0 71.4 50-60HZ 220-240V "=-15 C-+ 50 C" 117 MM 60 MM
A60 7W 200-240V 3000K B22D 7.00 0.97 70 3000 480.0 68.6 50-60HZ 220-240V "=-15 C-+ 50 C" 117 MM 60 MM
LED CANDLE 3W 6500K B22D 3.00 0.50 70 6500 200.0 66.7 50-60HZ 220-240V "=-15 C-+ 50 C" 105 MM 37 MM
LED CANDLE 3W 3000K B22D 3.00 0.50 70 3000 170.0 56.7 50-60HZ 220-240V "=-15 C-+ 50 C" 105 MM 37 MM
DescriptionLAMP
VOLTAGE
OPERATING
TEMP
TECHINCAL SPECIFICATION
LENGTHMAXIMUM
DIA
ElectricRATED
FREQUENCY
Total Eff.
(lm/W)
Figure 38. Technical specification for HAVELLS LED [22]
11.3.3. Diesel consumption for serving markets
Since no DG operator that serves the exact load proposed for the markets’ package was
interviewed, the daily diesel consumption was calculated as using the specific diesel
consumption for a 5 KVA generator and the energy to be supplied to the market per day.
Parameters Values Units
Diesel density 832 g/L
Specific diesel consumption for a 5 KVA generator [26]
275 g/KWh
Diesel consumption per KWh 0.331 L/kWh
Energy supplied to the market per day 22 KWh/day
Efficiency at part load 75%
Diesel consumption per day 9.7 L/day
Table 58. Values for the calculation of daily diesel consumption (2014)
Related Documents