University of Cape Town MSc (Clinical Immunology) Vaginal microbial diversity of the genital tract of South African adolescent females AERIN OLIVIA BREETZKE BRTAER001 Supervisor: Associate Professor Jo-Ann Passmore Co-supervisor: Dr. Heather Jaspan Co-supervisor: Dr. Katie Lennard Department of Clinical Immunology Division of Pathology Faculty of Health Sciences University of Cape Town South Africa

Welcome message from author
This document is posted to help you gain knowledge. Please leave a comment to let me know what you think about it! Share it to your friends and learn new things together.
Transcript

Univers
ity of
Cap
e Tow
n
MSc (Clinical Immunology)
Vaginal microbial diversity of the genital tract of South
African adolescent females
AERIN OLIVIA BREETZKE
BRTAER001
Supervisor: Associate Professor Jo-Ann Passmore
Co-supervisor: Dr. Heather Jaspan
Co-supervisor: Dr. Katie Lennard
Department of Clinical Immunology
Division of Pathology
Faculty of Health Sciences
University of Cape Town
South Africa

Univers
ity of
Cap
e Tow
n
The copyright of this thesis vests in the author. No quotation from it or information derived from it is to be published without full acknowledgement of the source. The thesis is to be used for private study or non-commercial research purposes only.
Published by the University of Cape Town (UCT) in terms of the non-exclusive license granted to UCT by the author.

Plagiarism Declaration
I, Aerin Olivia Breetzke, hereby declare that the work on which this dissertation/thesis is based is
my original work (except where acknowledgements indicate otherwise) and that neither the
whole work nor any part of it has been, is being, or is to be submitted for another degree in this
or any other university.
I empower the university to reproduce for the purpose of research either the whole or any portion
of the contents in any manner whatsoever.
Signature: ______________________________
Date: 10/11/2016
Signature Removed
Masters of Science Degree – Clinical Immunology
Vaginal microbial diversity of the genital tract of South
African adolescent females
By
Aerin Olivia Breetzke
BRTAER001
Dissertation submitted in fulfillment for the requirements of the degree in Medical
Masters in Clinical Immunology.

Table of Contents Page
Acknowledgements ………………………………………………………….…………...……... i
List of Tables ...…………………………………………………................................................. ii
List of Figures………………………………………………………………….…………...…... iv
List of Abbreviations …………………………………………………………….……….…... xv
List of Units …………………………………………………………………………….......… xvi
Abstract …………………………………………………………………………………………. 1
Chapter 1: Literature Review ………………………………………………………….…….... 3
1.1 Human-Immunodeficiency Virus in South Africa ……………………………….. 3
1.2 The female genital tract (FGT) immune response ……………………………….. 4
1.3 FGT Microbiota ……………………………………………………...…………….. 7
1.4 Bacterial vaginosis (BV) ………………………………………..………………….. 9
1.5 Sexually Transmitted Infections (STIs) ……………………...………………….. 11
1.6 Hormonal Contraceptives ……………………………………………….……….. 12
1.7 Technical analysis of FGT bacteria …………………………..………………….. 15
1.8 Aims of this Study …………………………………………………………..…….. 16
1.9 Objectives of this Study ………………………………………….……………….. 17
1.10 Hypothesis …………………………………………………………….………….. 17
Chapter 2: ……………………………………………………………………………………... 18
2.1 Study Design ………………………………………………………………………. 18
2.2 Recruitment of participants ……………………………………………………… 18
2.3 Exclusion criteria …………………………………………………………………. 18
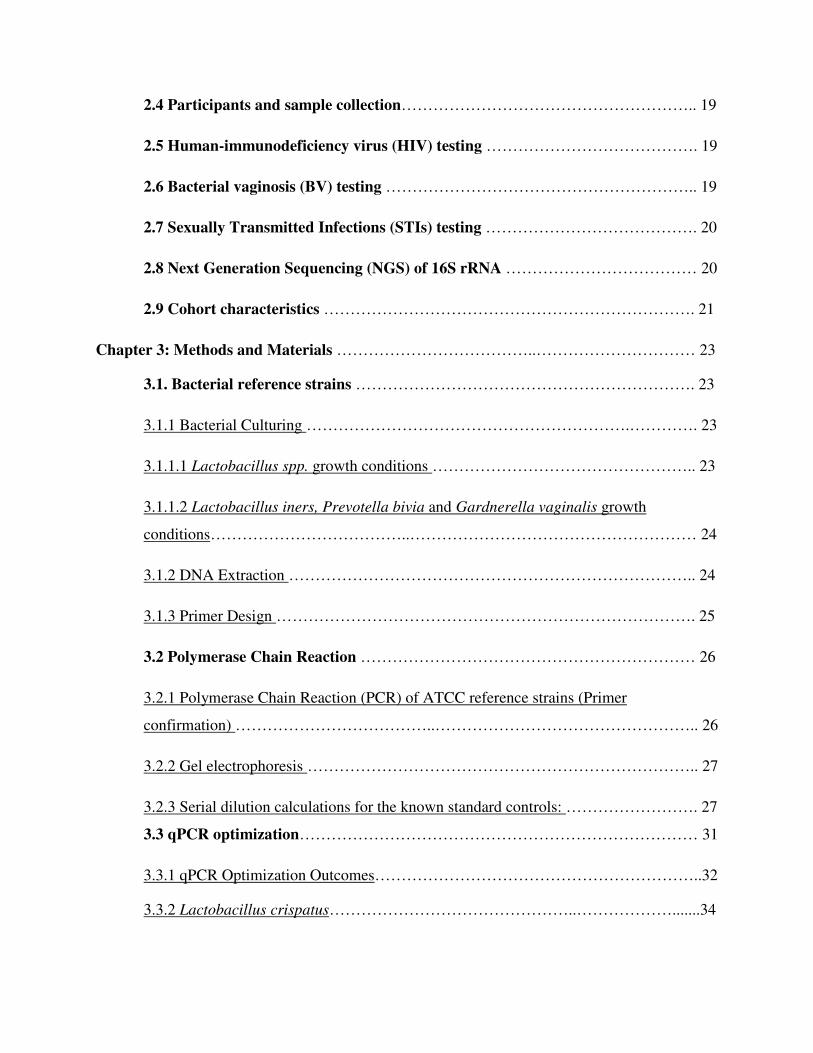
2.4 Participants and sample collection……………………………………………….. 19
2.5 Human-immunodeficiency virus (HIV) testing …………………………………. 19
2.6 Bacterial vaginosis (BV) testing ………………………………………………….. 19
2.7 Sexually Transmitted Infections (STIs) testing …………………………………. 20
2.8 Next Generation Sequencing (NGS) of 16S rRNA ……………………………… 20
2.9 Cohort characteristics ……………………………………………………………. 21
Chapter 3: Methods and Materials ………………………………..………………………… 23
3.1. Bacterial reference strains ………………………………………………………. 23
3.1.1 Bacterial Culturing …………………………………………………….…………. 23
3.1.1.1 Lactobacillus spp. growth conditions ………………………………………….. 23
3.1.1.2 Lactobacillus iners, Prevotella bivia and Gardnerella vaginalis growth
conditions………………………………..……………………………………………… 24
3.1.2 DNA Extraction ………………………………………………………………….. 24
3.1.3 Primer Design ……………………………………………………………………. 25
3.2 Polymerase Chain Reaction ……………………………………………………… 26
3.2.1 Polymerase Chain Reaction (PCR) of ATCC reference strains (Primer
confirmation) ………………………………..………………………………………….. 26
3.2.2 Gel electrophoresis ……………………………………………………………….. 27
3.2.3 Serial dilution calculations for the known standard controls: ……………………. 27
3.3 qPCR optimization………………………………………………………………… 31
3.3.1 qPCR Optimization Outcomes……………………………………………………..32
3.3.2 Lactobacillus crispatus………………………………………..……………….......34

3.3.3 Gardnerella vaginalis ..............................................................................................39
3.3.4 Prevotella bivia ……………………………………………………..……………..41
3.4 Real-Time PCR (qPCR) Protocol………………………………………………….47
3.5 Analysis ………………………………………………………………….……….... 49
3.6 Statistical considerations ………………………………..………………………... 51
3.6.1 Statistical software used for data analysis ……………………………………..… 51
3.6.2 Statistical tests used for data analysis in this study ……………………………….51
3.6.3 Conceptual Framework ………………………………………….………..………54
3.7 Sequencing and Analysis………………………………………………………….. 54
Chapter 4: Results ………………………………..…………………………………………… 56
4.1 P. bivia Sequencing ……………………………………………………………….. 56
4.1.1 NCBI Blast Analysis …………………………………………………………….. 57
4.1.2 Sequence Alignment ……………………………………………………….…….. 61
4.2 Real-Time PCR (qPCR) Results ………………………………………………… 71
4.2.1 Descriptive statistics ……………………………………………………………... 72
4.3 Comparison of absolute bacterial quantities to BV status, inflammation levels,
age, hormonal contraceptive and STI status, bacterial versus viral STIs and
HPV………………………………..…………………………………………………… 74
4.3.1 Association between the quantities of the bacteria of interest and BV status …… 74
4.3.2 Association between bacteria of interest and inflammatory immunological
factor levels ………………………………..…………………………………………… 83
4.3.3 Association between the quantities (copies/ng) of bacteria of interest and
age ………………………………..………………………………..…………………… 92

4.3.4 Association between the quantities (copies/ng) of vaginal bacteria and
hormonal contraceptives …………………………………………………………….. 100
4.3.5 Association between the quantities (copies/ng) of the bacteria of interest
and the absence or presence of any one STI in the WISH cohort ……………….…… 109
4.3.6 Association between the quantities (copies/ng) of the bacteria of interest
and the presence of bacterial or viral STIs in the WISH cohort ……………………… 117
4.3.7 Association between the quantities (copies/ng) of bacteria of interest and the
absence or presence of low and high risk HPV subtypes in the WISH cohort ……….. 123
4.5 Overview …………………………………………………………………………. 132
Chapter 5: Discussion ………………………………………………………………….……. 134
Chapter 6: Conclusion ………………………………………………………………………. 141
References ………………………………..…………………………………………………... 142
Appendix A ………………………………..…………………………………………………. 163
Appendix B ………………………………..…………………………………………………. 167
Appendix C ………………………………..…………………………………………………. 168
Appendix D ………………………………..…………………………………………………. 173
Appendix E …………………………………………………………………………….…….. 188

i
A. O. Breetzke
Acknowledgements
First and foremost I would like to thank Dr. Heather Jaspan, Department of Clinical
Immunology, Pathology, for her supervision and encouragement throughout the entire process of
my MSc project.
I would like to thank Assistant Professor Jo-Ann Passmore and Dr. Katie Lennard for all of their
assistance and guidance throughout my laboratory work and write up.
My gratitude goes to both the Clinical Immunology staff and students for their guidance and help
throughout my work, and for the constant support during my write up. Further thanks to
everyone who helped and guided me with learning new laboratory techniques and equipment.
Thanks to the Clinical Virology staff and students, for their help and encouragement during this
project.
Thank you to the UCT Clinical Immunology, Department of Pathology for the funding
laboratory framework and the opportunity to work on the WISH samples and study this
interesting topic in relation to adolescent health in South Africa.
Jake my love, my family, and friends, thank you for consistently supporting and holding me
throughout the last two years, and for being there for me through the good days and the bad!

ii
A. O. Breetzke
List of Tables
Chapter 1: Literature Review
Table 1.1: Nugent scoring system for Gram-stained vaginal smears
Chapter 2: Cohort Characteristics
Table 2.9: Summarized characteristics of the WISH cohort according to the following categories
Chapter 3: Laboratory Methods and Materials
Table 3.1.3: Primers of the target genes for detection of bacteria of interest and protocol source
of PCR and qPCR.
Table 3.2.1: PCR mixture components.
Table 3.2.2: PCR conditions and amplicon size of the target gene for the six bacteria of interest.
Table 3.2.3: Serial dilution calculation summary table.
Table 3.2.4: Calculation and source for the whole genome size for each bacterium.
Table 3.3.1: Summary table for the optimization statistics for the following bacteria.
Table 3.4.1: qPCR mixture components.
Table 3.4.2: qPCR Cycle Conditions after optimization.
Table 3.5.1 Illustration of the replacement of the zero values with the replacement of half the
lowest positive quantified value (copies/ng) for each bacterium.
Table 3.6.1: Statistical software used in this study.
Chapter 4: Results
Table 4.1.1: NCBI BLASTN results for the seven samples sequenced.
Table 4.1.2.1: Emboss Needle nucleotide alignment results using the ATCC P. bivia reference
strain DNF00188 (138593 bp).

iii
A. O. Breetzke
Table 4.1.2.2: Emboss Needle nucleotide alignment results using the NCBI Primer BLAST Hit
P. bivia strain DSM 20514 (139516 bp).
Table 4.2.1: Descriptive statistics for each bacterial species, quantified from DNA extracted from
the WISH lateral wall swab for each participant.

iv
A. O. Breetzke
List of Figures
Chapter 1: Literature Review
Figure 1.1: Adaptation from Reproductive Health and Research (WHO) sites of infection in the
FGT and the associated STIs and other infections with associated symptoms (Reis Machado et
al. 2014; Chinsembu 2009; Reproductive Health and Research & Who 2005; Minnesota 2005;
CDC 2014a; CDC 2014b; CDC 2014c; CDC 2014d).
Chapter 3: Laboratory Methods and Materials
Figure 3.3.2.1: Roche LightCycler® 480 absolute quantitative derivative max amplification
curve for each of the seven L. crispatus optimization plates (V1.1-V1.7). Red and brown indicate
positive amplification in the unknown sample and the positive control standards respectively,
and green indicates negative amplification in the wells.
Figure 3.3.2.2: Roche LightCycler® 480 melt curve for each of the seven L. crispatus
optimization plates (V1.1-V1.7). Red indicates a single peak (product), green indicates two peaks
and blue indicates no peak for each well.
Figure 3.3.3.1: Roche LightCycler® 480 absolute quantitative derivative max amplification
curve for each of the six G. vaginalis optimization plates (V1.1-V1.6). Red and brown indicate
positive amplification in the unknown sample and the positive control standards respectively,
and green indicates negative amplification in the wells.
Figure 3.3.3.2: Roche LightCycler® 480 melt curve for each of the six G. vaginalis optimization
plates (V1.1-V1.6). Red indicates a single peak (product), green indicates two peaks and blue
indicates no peak for each well.
Figure 3.3.4.1: Roche LightCycler® 480 absolute quantitative derivative max amplification
curve for each of the thirteen P. bivia optimization plates (V1.1-V1.13). Red and brown indicate
positive amplification in the unknown sample and the positive control standards respectively,
and green indicates negative amplification in the wells.
Figure 3.3.4.2: Roche LightCycler® 480 melt curve for each of the thirteen P. bivia
optimization plates (V1.1-V1.13). Red indicates a single peak (product), green indicates two
peaks and blue indicates no peak for each well.
Figure 3.5.1: Example of a multi-well qPCR plate set out. Each non-template control (NTC),
Standards diluted from 106
copies/µL down to 100
copies/µL and the WISH participant vaginal
DNA are run in triplicate and the resulting value is the mean value of the three replicates.

v
A. O. Breetzke
Chapter 4: Results
Figure 4.1.1.1: NCBI BLASTN hit results for the 147 bp forward (top) and 116 bp reverse
compliment (bottom) sequences of the positive control sample 10^5 A5 V2.1
Figure 4.1.1.2: NCBI BLASTN hit results for the 114 bp forward (top) and 427 bp reverse
compliment (bottom) sequences for sample W012 C8 V2.0.
Figure 4.1.1.3: NCBI BLASTN hit results for the 428 bp forward sequences for sample W125 E4
V2.3.
Figure 4.1.1.4: NCBI BLASTN hit results for the 116 bp forward (top) and 412 bp reverse
compliment (bottom) sequences for sample W174 F11 V2.4.
Figure 4.1.2.1: Comparison of the forward (top __ and …) and reverse compliment (bottom _ _
and __) sequence alignments for sample NTC A1 V2.0 against the ATCC P. bivia reference
strain DNF00188 (left) and the NCBI Primer BLAST Hit P. bivia strain DSM 20514 (right).
Figure 4.1.2.2: Comparison of the forward (top __ and …) and reverse compliment (bottom _ _
and __) sequence alignments for sample NTC A3 V2.2 against the ATCC P. bivia reference
strain DNF00188 (left) and the NCBI Primer BLAST Hit P. bivia strain DSM 20514 (right).
Figure 4.1.2.3: Comparison of the forward (top __ and …) and reverse compliment (bottom _ _
and __) sequence alignments for sample NTC A2 V2.4 against the ATCC P. bivia reference
strain DNF00188 (left) and the NCBI Primer BLAST Hit P. bivia strain DSM 20514 (right).
Figure 4.1.2.4: Comparison of the forward (top __ and …) and reverse compliment (bottom _ _
and __) sequence alignments for the positive standard control 105 copies/ng A5 V2.1 against the
ATCC P. bivia reference strain DNF00188 (left) and the NCBI Primer BLAST Hit P. bivia
strain DSM 20514 (right).
Figure 4.1.2.5: Comparison of the forward (top __ and …) and reverse compliment (bottom _ _
and __) sequence alignments for W012 C8 V2.0 against the ATCC P. bivia reference strain
DNF00188 (left) and the NCBI Primer BLAST Hit P. bivia strain DSM 20514 (right).
Figure 4.1.2.6: Comparison of the forward (top __ and …) and reverse compliment (bottom _ _
and __) sequence alignments for W125 E4 V2.3 against the ATCC P. bivia reference strain
DNF00188 (left) and the NCBI Primer BLAST Hit P. bivia strain DSM 20514 (right).
Figure 4.1.2.7: Comparison of the forward (top __ and …) and reverse compliment (bottom _ _
and __) sequence alignments for W174 F11 V2.4 against the ATCC P. bivia reference strain
DNF00188 (left) and the NCBI Primer BLAST Hit P. bivia strain DSM 20514 (right).
Figure 4.2: Example of an amplification and standard curve run with the WISH samples.
Amplification and standard curves of L. iners qPCR Plate V2.5 generated based on all wells and

vi
A. O. Breetzke
the standard curve is generated based on the amplification curve of the standard positive controls
ranging from 106 to 10
0 copies/µL. Red and brown indicate positive amplification in the
unknown samples and the positive control standards respectively, blue indicates uncertainty and
green indicates negative amplification in the wells.
Figure 4.2.1: Box plot comparison of the copies of each bacterial species of interest quantified in
the DNA extracted from WISH participants’ lateral wall swabs; showing the entire cohort
reported as copies/ng total DNA for L. gasseri (red), L. jensenii (orange), L. crispatus (green), L.
iners (blue), and G. vaginalis (purple) and P. bivia (pink). The ‘box’ component of each plot
indicates the interquartile range (IQR) of the data set and the ‘whiskers’ which are the two lines
(bottom and top) extending from the box component of each block that end with a horizontal
stroke, indicate the range from the smallest and largest non-outliers to the 25% and 75%
percentile components, respectively. The middle line indicates the median value for each data
set.
Figure 4.3.1A: Box-plot of L. gasseri (red), L. jensenii (orange), L. crispatus (green), L. iners
(blue), and G. vaginalis (purple) quantities for BV positive participants. The ‘box’ component of
each plot indicates the interquartile range (IQR) of the data set and the ‘whiskers’ which are the
two lines (bottom and top) extending from the box component of each block that end with a
horizontal stroke, indicate the range from the smallest and largest non-outliers to the 25% and
75% percentile components, respectively. The middle line indicates the median value for each
data set.
Figure 4.3.1B: Box-plot of L. gasseri (red), L. jensenii (orange), L. crispatus (green), L. iners
(blue), and G. vaginalis (purple) quantities for BV intermediate participants. The ‘box’
component of each plot indicates the interquartile range (IQR) of the data set and the ‘whiskers’
which are the two lines (bottom and top) extending from the box component of each block that
end with a horizontal stroke, indicate the range from the smallest and largest non-outliers to the
25% and 75% percentile components, respectively. The middle line indicates the median value
for each data set.
Figure 4.3.1C: Box-plot of L. gasseri (red), L. jensenii (orange), L. crispatus (green), L. iners
(blue), and G. vaginalis (purple) quantities for BV negative participants. The ‘box’ component of
each plot indicates the interquartile range (IQR) of the data set and the ‘whiskers’ which are the
two lines (bottom and top) extending from the box component of each block that end with a
horizontal stroke, indicate the range from the smallest and largest non-outliers to the 25% and
75% percentile components, respectively. The middle line indicates the median value for each
data set.
Figure 4.3.1.1: Comparison of the quantities of L. crispatus (copies/ng DNA) measured in the
DNA extracted from vaginal lateral wall swabs from participants in the WISH study, between
BV positive, intermediate and negative groups. All p-value comparisons were based on an

vii
A. O. Breetzke
unpaired, non-parametric Dunn’s Multiple Comparison test. Each point in the figure represents
an individual participant. The three horizontal bars represent the median value (middle bar),
upper interquartile range (top bar) and lower interquartile range (bottom bar).
Figure 4.3.1.2: Comparison of the quantities of L. gasseri (copies/ng DNA) measured in the
DNA extracted from vaginal lateral wall swabs from participants in the WISH study, between
BV positive, intermediate and negative groups. All p-value comparisons were based on an
unpaired, non-parametric Dunn’s Multiple Comparison test. Each point in the figure represents
an individual participant. The three horizontal bars represent the median value (middle bar),
upper interquartile range (top bar) and lower interquartile range (bottom bar).
Figure 4.3.1.3: Comparison of the quantities of L. jensenii (copies/ng DNA) measured in the
DNA extracted from vaginal lateral wall swabs from participants in the WISH study, between
BV positive, intermediate and negative groups. All p-value comparisons were based on an
unpaired, non-parametric Dunn’s Multiple Comparison test. Each point in the figure represents
an individual participant. The three horizontal bars represent the median value (middle bar),
upper interquartile range (top bar) and lower interquartile range (bottom bar).
Figure 4.3.1.4: Comparison of the quantities of L. iners (copies/ng DNA) measured in the DNA
extracted from vaginal lateral wall swabs from participants in the WISH study, between BV
positive, intermediate and negative groups. All p-value comparisons were based on an unpaired,
non-parametric Dunn’s Multiple Comparison test. Each point in the figure represents an
individual participant. The three horizontal bars represent the median value (middle bar), upper
interquartile range (top bar) and lower interquartile range (bottom bar).
Figure 4.3.1.5: Comparison of the quantities of G. vaginalis (copies/ng DNA) measured in the
DNA extracted from vaginal lateral wall swabs from participants in the WISH study, between
BV positive, intermediate and negative groups. All p-value comparisons were based on an
unpaired, non-parametric Dunn’s Multiple Comparison test. Each point in the figure represents
an individual participant. The three horizontal bars represent the median value (middle bar),
upper interquartile range (top bar) and lower interquartile range (bottom bar).
Figure 4.3.2A: Box-plot of the low inflammation for L. gasseri (red), L. jensenii (orange), L.
crispatus (green), L. iners (blue), and G. vaginalis (purple). The ‘box’ component of each plot
indicates the interquartile range (IQR) of the data set and the ‘whiskers’ which are the two lines
(bottom and top) extending from the box component of each block that end with a horizontal
stroke, indicate the range from the smallest and largest non-outliers to the 25% and 75%
percentile components, respectively. The middle line indicates the median value for each data
set.
Figure 4.3.2B: Box-plot of the high inflammation for L. gasseri (red), L. jensenii (orange), L.
crispatus (green), L. iners (blue), and G. vaginalis (purple). The ‘box’ component of each plot
indicates the interquartile range (IQR) of the data set and the ‘whiskers’ which are the two lines

viii
A. O. Breetzke
(bottom and top) extending from the box component of each block that end with a horizontal
stroke, indicate the range from the smallest and largest non-outliers to the 25% and 75%
percentile components, respectively. The middle line indicates the median value for each data
set.
Figure 4.3.2.1: Comparison of the quantities of L. crispatus (copies/ng DNA) measured in the
DNA extracted from vaginal lateral wall swabs from participants in the WISH study, between
women with high and low genital inflammation. All p-value comparisons were based on an
unpaired, non-parametric Mann-Whitney t-test statistic. Each point in the figure represents an
individual participant. The three horizontal bars represent the median value (middle bar), upper
interquartile range (top bar) and lower interquartile range (bottom bar).
Figure 4.3.2.2: Comparison of the quantities of L. gasseri (copies/ng DNA) measured in the
DNA extracted from vaginal lateral wall swabs from participants in the WISH study, between
women with high and low genital inflammation. All p-value comparisons were based on an
unpaired, non-parametric Mann-Whitney t-test statistic. Each point in the figure represents an
individual participant. The three horizontal bars represent the median value (middle bar), upper
interquartile range (top bar) and lower interquartile range (bottom bar).
Figure 4.3.2.3: Comparison of the quantities of L. jensenii (copies/ng DNA) measured in the
DNA extracted from vaginal lateral wall swabs from participants in the WISH study, between
women with high and low genital inflammation. All p-value comparisons were based on an
unpaired, non-parametric Mann-Whitney t-test statistic. Each point in the figure represents an
individual participant. The three horizontal bars represent the median value (middle bar), upper
interquartile range (top bar) and lower interquartile range (bottom bar).
Figure 4.3.2.4: Comparison of the quantities of L. iners (copies/ng DNA) measured in the DNA
extracted from vaginal lateral wall swabs from participants in the WISH study, women with high
and low genital inflammation. All p-value comparisons were based on an unpaired, non-
parametric Mann-Whitney t-test statistic. Each point in the figure represents an individual
participant. The three horizontal bars represent the median value (middle bar), upper interquartile
range (top bar) and lower interquartile range (bottom bar).
Figure 4.3.2.5: Comparison of the quantities of G. vaginalis (copies/ng DNA) measured in the
DNA extracted from vaginal lateral wall swabs from participants in the WISH study, between
women with high and low genital inflammation. All p-value comparisons were based on an
unpaired, non-parametric Mann-Whitney t-test statistic. Each point in the figure represents an
individual participant. The three horizontal bars represent the median value (middle bar), upper
interquartile range (top bar) and lower interquartile range (bottom bar).
Figure 4.3.3A: Box-plot of the 16-18 years for L. gasseri (red), L. jensenii (orange), L. crispatus
(green), L. iners (blue), and G. vaginalis (purple). The ‘box’ component of each plot indicates
the interquartile range (IQR) of the data set and the ‘whiskers’ which are the two lines (bottom

ix
A. O. Breetzke
and top) extending from the box component of each block that end with a horizontal stroke,
indicate the range from the smallest and largest non-outliers to the 25% and 75% percentile
components, respectively. The middle line indicates the median value for each data set.
Figure 4.3.3B: Box-plot of the 19-22 years for L. gasseri (red), L. jensenii (orange), L. crispatus
(green), L. iners (blue), and G. vaginalis (purple). The ‘box’ component of each plot indicates
the interquartile range (IQR) of the data set and the ‘whiskers’ which are the two lines (bottom
and top) extending from the box component of each block that end with a horizontal stroke,
indicate the range from the smallest and largest non-outliers to the 25% and 75% percentile
components, respectively. The middle line indicates the median value for each data set.
Figure 4.3.3.1: Comparison of the quantities of L. crispatus (copies/ng DNA) measured in the
DNA extracted from vaginal lateral wall swabs from participants in the WISH study, between
the two 16-18 years old and 19-22 years old age groups. All p-value comparisons were based on
an unpaired, non-parametric Mann-Whitney t-test statistic. Each point in the figure represents an
individual participant. The three horizontal bars represent the median value (middle bar), upper
interquartile range (top bar) and lower interquartile range (bottom bar).
Figure 4.3.3.2: Comparison of the quantities of L. gasseri (copies/ng DNA) measured in the
DNA extracted from vaginal lateral wall swabs from participants in the WISH study, between
the two 16-18 years old and 19-22 years old age groups. All p-value comparisons were based on
an unpaired, non-parametric Mann-Whitney t-test statistic. Each point in the figure represents an
individual participant. The three horizontal bars represent the median value (middle bar), upper
interquartile range (top bar) and lower interquartile range (bottom bar).
Figure 4.3.3.3: Comparison of the quantities of L. jensenii (copies/ng DNA) measured in the
DNA extracted from vaginal lateral wall swabs from participants in the WISH study, between
the two 16-18 years old and 19-22 years old age groups. All p-value comparisons were based on
an unpaired, non-parametric Mann-Whitney t-test statistic. Each point in the figure represents an
individual participant. The three horizontal bars represent the median value (middle bar), upper
interquartile range (top bar) and lower interquartile range (bottom bar).
Figure 4.3.3.4: Comparison of the quantities of L. iners (copies/ng DNA) measured in the DNA
extracted from vaginal lateral wall swabs from participants in the WISH study, between the two
16-18 years old and 19-22 years old age groups. All p-value comparisons were based on an
unpaired, non-parametric Mann-Whitney t-test statistic. Each point in the figure represents an
individual participant. The three horizontal bars represent the median value (middle bar), upper
interquartile range (top bar) and lower interquartile range (bottom bar).
Figure 4.3.3.5: Comparison of the quantities of G. vaginalis (copies/ng DNA) measured in the
DNA extracted from vaginal lateral wall swabs from participants in the WISH study, between
the two 16-18 years old and 19-22 years old age groups. All p-value comparisons were based on
an unpaired, non-parametric Mann-Whitney t-test statistic. Each point in the figure represents an

x
A. O. Breetzke
individual participant. The three horizontal bars represent the median value (middle bar), upper
interquartile range (top bar) and lower interquartile range (bottom bar).
Figure 4.3.4A: Box-plot of hormonal contraceptive use of DMPA for L. gasseri (red), L. jensenii
(orange), L. crispatus (green), L. iners (blue), and G. vaginalis (purple). The ‘box’ component of
each plot indicates the interquartile range (IQR) of the data set and the ‘whiskers’ which are the
two lines (bottom and top) extending from the box component of each block that end with a
horizontal stroke, indicate the range from the smallest and largest non-outliers to the 25% and
75% percentile components, respectively. The middle line indicates the median value for each
data set.
Figure 4.3.4B: Box-plot of hormonal contraceptive use of the Implanon for L. gasseri (red), L.
jensenii (orange), L. crispatus (green), L. iners (blue), and G. vaginalis (purple). The ‘box’
component of each plot indicates the interquartile range (IQR) of the data set and the ‘whiskers’
which are the two lines (bottom and top) extending from the box component of each block that
end with a horizontal stroke, indicate the range from the smallest and largest non-outliers to the
25% and 75% percentile components, respectively. The middle line indicates the median value
for each data set.
Figure 4.3.4C: Box-plot of hormonal contraceptive use of Nur Isterate for L. gasseri (red), L.
jensenii (orange), L. crispatus (green), L. iners (blue), and G. vaginalis (purple). The ‘box’
component of each plot indicates the interquartile range (IQR) of the data set and the ‘whiskers’
which are the two lines (bottom and top) extending from the box component of each block that
end with a horizontal stroke, indicate the range from the smallest and largest non-outliers to the
25% and 75% percentile components, respectively. The middle line indicates the median value
for each data set.
Figure 4.3.4.1: Comparison of the quantities of L. crispatus (copies/ng DNA) measured in the
DNA extracted from vaginal lateral wall swabs from participants in the WISH study, between
the hormonal contraceptives DMPA, Nur Isterate and the Implanon. All p-value comparisons
were based on an unpaired, non-parametric Dunn’s Multiple Comparison test. Each point in the
figure represents an individual participant. The three horizontal bars represent the median value
(middle bar), upper interquartile range (top bar) and lower interquartile range (bottom bar).
Figure 4.3.4.2: Comparison of the quantities of L. gasseri (copies/ng DNA) measured in the
DNA extracted from vaginal lateral wall swabs from participants in the WISH study, between
hormonal contraceptives DMPA, Nur Isterate and the Implanon. All p-value comparisons were
based on an unpaired, non-parametric Dunn’s Multiple Comparison test. Each point in the figure
represents an individual participant. The three horizontal bars represent the median value (middle
bar), upper interquartile range (top bar) and lower interquartile range (bottom bar).
Figure 4.3.4.3: Comparison of the quantities of L. jensenii (copies/ng DNA) measured in the
DNA extracted from vaginal lateral wall swabs from participants in the WISH study, between

xi
A. O. Breetzke
hormonal contraceptives DMPA, Nur Isterate and the Implanon. All p-value comparisons were
based on an unpaired, non-parametric Dunn’s Multiple Comparison test. Each point in the figure
represents an individual participant. The three horizontal bars represent the median value (middle
bar), upper interquartile range (top bar) and lower interquartile range (bottom bar).
Figure 4.3.4.4: Comparison of the quantities of L. iners (copies/ng DNA) measured in the DNA
extracted from vaginal lateral wall swabs from participants in the WISH study, between
hormonal contraceptives DMPA, Nur Isterate and the Implanon. All p-value comparisons were
based on an unpaired, non-parametric Dunn’s Multiple Comparison test. Each point in the figure
represents an individual participant. The three horizontal bars represent the median value (middle
bar), upper interquartile range (top bar) and lower interquartile range (bottom bar).
Figure 4.3.4.5: Comparison of the quantities of G. vaginalis (copies/ng DNA) measured in the
DNA extracted from vaginal lateral wall swabs from participants in the WISH study, between
the hormonal contraceptives DMPA, Nur Isterate and the Implanon. All p-value comparisons
were based on an unpaired, non-parametric Dunn’s Multiple Comparison test. Each point in the
figure represents an individual participant. The three horizontal bars represent the median value
(middle bar), upper interquartile range (top bar) and lower interquartile range (bottom bar).
Figure 4.3.5A: Box-plot of the absence of any one STI for L. gasseri (red), L. jensenii (orange),
L. crispatus (green), L. iners (blue), and G. vaginalis (purple). The ‘box’ component of each plot
indicates the interquartile range (IQR) of the data set and the ‘whiskers’ which are the two lines
(bottom and top) extending from the box component of each block that end with a horizontal
stroke, indicate the range from the smallest and largest non-outliers to the 25% and 75%
percentile components, respectively. The middle line indicates the median value for each data
set.
Figure 4.3.5B: Box-plot of the presence of any one STI for L. gasseri (red), L. jensenii (orange),
L. crispatus (green), L. iners (blue), and G. vaginalis (purple). The ‘box’ component of each plot
indicates the interquartile range (IQR) of the data set and the ‘whiskers’ which are the two lines
(bottom and top) extending from the box component of each block that end with a horizontal
stroke, indicate the range from the smallest and largest non-outliers to the 25% and 75%
percentile components, respectively. The middle line indicates the median value for each data
set.
Figure 4.3.5.1: Comparison of the quantities of L. crispatus (copies/ng DNA) measured in the
DNA extracted from vaginal lateral wall swabs from participants in the WISH study, where the
samples have been separated based on absence or presence of any one of the WISH cohort STIs
present. All p-value comparisons were based on an unpaired, non-parametric Mann-Whitney t-
test statistic. Each point in the figure represents an individual participant. The three horizontal
bars represent the median value (middle bar), upper interquartile range (top bar) and lower
interquartile range (bottom bar).

xii
A. O. Breetzke
Figure 4.3.5.2: Comparison of the quantities of L. gasseri (copies/ng DNA) measured in the
DNA extracted from vaginal lateral wall swabs from participants in the WISH study, where the
samples have been separated based on absence or presence of any one of the WISH cohort STIs
present. All p-value comparisons were based on an unpaired, non-parametric Mann-Whitney t-
test statistic. Each point in the figure represents an individual participant. The three horizontal
bars represent the median value (middle bar), upper interquartile range (top bar) and lower
interquartile range (bottom bar).
Figure 4.3.5.3: Comparison of the quantities of L. jensenii (copies/ng DNA) measured in the
DNA extracted from vaginal lateral wall swabs from participants in the WISH study, where the
samples have been separated based on absence or presence of any one of the WISH cohort STIs
present. All p-value comparisons were based on an unpaired, non-parametric Mann-Whitney t-
test statistic. Each point in the figure represents an individual participant. The three horizontal
bars represent the median value (middle bar), upper interquartile range (top bar) and lower
interquartile range (bottom bar).
Figure 4.3.5.4: Comparison of the quantities of L. iners (copies/ng DNA) measured in the DNA
extracted from vaginal lateral wall swabs from participants in the WISH study, where the
samples have been separated based on absence or presence of any one of the WISH cohort STIs
present. All p-value comparisons were based on an unpaired, non-parametric Mann-Whitney t-
test statistic. Each point in the figure represents an individual participant. The three horizontal
bars represent the median value (middle bar), upper interquartile range (top bar) and lower
interquartile range (bottom bar).
Figure 4.3.5.5: Comparison of the quantities of G. vaginalis (copies/ng DNA) measured in the
DNA extracted from vaginal lateral wall swabs from participants in the WISH study, where the
samples have been separated based on absence or presence of any one of the WISH cohort STIs
present. All p-value comparisons were based on an unpaired, non-parametric Mann-Whitney t-
test statistic. Each point in the figure represents an individual participant. The three horizontal
bars represent the median value (middle bar), upper interquartile range (top bar) and lower
interquartile range (bottom bar).
Figure 4.3.6.1: Comparison of the quantities of L. crispatus (copies/ng DNA) measured in the
DNA extracted from vaginal lateral wall swabs from participants in the WISH study, where the
samples have been separated based on none, one, two (or more <) of the WISH cohort Bacterial
(B) versus Viral (V) STIs being present. All p-value comparisons were based on an unpaired,
non-parametric Dunn’s Multiple Comparison test. Each point in the figure represents an
individual participant. The three horizontal bars represent the median value (middle bar), upper
interquartile range (top bar) and lower interquartile range (bottom bar).
Figure 4.3.6.2: Comparison of the quantities of L. gasseri (copies/ng DNA) measured in the
DNA extracted from vaginal lateral wall swabs from participants in the WISH study, where the

xiii
A. O. Breetzke
samples have been separated based on none, one, two (or more <) of the WISH cohort Bacterial
(B) versus Viral (V) STIs being present. All p-value comparisons were based on an unpaired,
non-parametric Dunn’s Multiple Comparison test. Each point in the figure represents an
individual participant. The three horizontal bars represent the median value (middle bar), upper
interquartile range (top bar) and lower interquartile range (bottom bar).
Figure 4.3.6.3: Comparison of the quantities of L. jensenii (copies/ng DNA) measured in the
DNA extracted from vaginal lateral wall swabs from participants in the WISH study, where the
samples have been separated based on none, one, two (or more <) of the WISH cohort Bacterial
(B) versus Viral (V) STIs being present. All p-value comparisons were based on an unpaired,
non-parametric Dunn’s Multiple Comparison test. Each point in the figure represents an
individual participant. The three horizontal bars represent the median value (middle bar), upper
interquartile range (top bar) and lower interquartile range (bottom bar).
Figure 4.3.6.4: Comparison of the quantities of L. iners (copies/ng DNA) measured in the DNA
extracted from vaginal lateral wall swabs from participants in the WISH study, where the
samples have been separated based on none, one, two (or more <) of the WISH cohort Bacterial
(B) versus Viral (V) STIs being present. All p-value comparisons were based on an unpaired,
non-parametric Dunn’s Multiple Comparison test. Each point in the figure represents an
individual participant. The three horizontal bars represent the median value (middle bar), upper
interquartile range (top bar) and lower interquartile range (bottom bar).
Figure 4.3.6.5: Comparison of the quantities of G. vaginalis (copies/ng DNA) measured in the
DNA extracted from vaginal lateral wall swabs from participants in the WISH study, where the
samples have been separated based on none, one, two (or more <) of the WISH cohort Bacterial
(B) versus Viral (V) STIs being present. All p-value comparisons were based on an unpaired,
non-parametric Dunn’s Multiple Comparison test. Each point in the figure represents an
individual participant. The three horizontal bars represent the median value (middle bar), upper
interquartile range (top bar) and lower interquartile range (bottom bar).
Figure 4.3.7A: Box-plot of the negative HPV group for L. gasseri (red), L. jensenii (orange), L.
crispatus (green), L. iners (blue), and G. vaginalis (purple). The ‘box’ component of each plot
indicates the interquartile range (IQR) of the data set and the ‘whiskers’ which are the two lines
(bottom and top) extending from the box component of each block that end with a horizontal
stroke, indicate the range from the smallest and largest non-outliers to the 25% and 75%
percentile components, respectively. The middle line indicates the median value for each data
set.
Figure 4.3.7B: Box-plot of the low risk HPV group for L. gasseri (red), L. jensenii (orange), L.
crispatus (green), L. iners (blue), and G. vaginalis (purple). The ‘box’ component of each plot
indicates the interquartile range (IQR) of the data set and the ‘whiskers’ which are the two lines
(bottom and top) extending from the box component of each block that end with a horizontal

xiv
A. O. Breetzke
stroke, indicate the range from the smallest and largest non-outliers to the 25% and 75%
percentile components, respectively. The middle line indicates the median value for each data
set.
Figure 4.3.7C: Box-plot of the high risk HPV group for L. gasseri (red), L. jensenii (orange), L.
crispatus (green), L. iners (blue), and G. vaginalis (purple). The ‘box’ component of each plot
indicates the interquartile range (IQR) of the data set and the ‘whiskers’ which are the two lines
(bottom and top) extending from the box component of each block that end with a horizontal
stroke, indicate the range from the smallest and largest non-outliers to the 25% and 75%
percentile components, respectively. The middle line indicates the median value for each data
set.
Figure 4.3.7.1: Comparison of the quantities of L. crispatus (copies/ng DNA) measured in the
DNA extracted from vaginal lateral wall swabs from participants in the WISH study, between
the negative, low risk and high risk HPV groups. All p-value comparisons were based on an
unpaired, non-parametric Dunn’s Multiple Comparison test. Each point in the figure represents
an individual participant. The three horizontal bars represent the median value (middle bar),
upper interquartile range (top bar) and lower interquartile range (bottom bar).
Figure 4.3.7.2: Comparison of the quantities of L. gasseri (copies/ng DNA) measured in the
DNA extracted from vaginal lateral wall swabs from participants in the WISH study, between
the negative, low risk and high risk HPV groups. All p-value comparisons were based on an
unpaired, non-parametric Dunn’s Multiple Comparison test. Each point in the figure represents
an individual participant. The three horizontal bars represent the median value (middle bar),
upper interquartile range (top bar) and lower interquartile range (bottom bar).
Figure 4.3.7.3: Comparison of the quantities of L. jensenii (copies/ng DNA) measured in the
DNA extracted from vaginal lateral wall swabs from participants in the WISH study, between
the negative, low risk and high risk HPV groups. All p-value comparisons were based on an
unpaired, non-parametric Dunn’s Multiple Comparison test. Each point in the figure represents
an individual participant. The three horizontal bars represent the median value (middle bar),
upper interquartile range (top bar) and lower interquartile range (bottom bar).
Figure 4.3.7.4: Comparison of the quantities of L. iners (copies/ng DNA) measured in the DNA
extracted from vaginal lateral wall swabs from participants in the WISH study, between the
negative, low risk and high risk HPV groups. All p-value comparisons were based on an
unpaired, non-parametric Dunn’s Multiple Comparison test. Each point in the figure represents
an individual participant. The three horizontal bars represent the median value (middle bar),
upper interquartile range (top bar) and lower interquartile range (bottom bar).
Figure 4.3.7.5: Comparison of the quantities of G. vaginalis (copies/ng DNA) measured in the
DNA extracted from vaginal lateral wall swabs from participants in the WISH study, between
the negative, low risk and high risk HPV groups. All p-value comparisons were based on an

xv
A. O. Breetzke
unpaired, non-parametric Dunn’s Multiple Comparison test. Each point in the figure represents
an individual participant. The three horizontal bars represent the median value (middle bar),
upper interquartile range (top bar) and lower interquartile range (bottom bar).
List of Abbreviations
C Degrees Celsius
AIDS Acquired Immune Deficiency Syndrome
ANOVA Analysis of Variance
ATCC American Type Culture Collection
BLAST Basic Local Alignment Search Tool
Bp Base pairs
BV Bacterial Vaginosis
BVAB BV associated bacteria
COC Combined oral contraceptive pill
DMPA Depot Medroxyprogesterone Acetate
DNA Deoxyribonucleic Acid
dsDNA Double stranded DNA
FGT DNA Female Genital Tract
gDNA Genomic DNA
GM-CSF Granulocyte-macrophage colony stimulating factor
HC Hormonal contraceptive
HIV Human Immunodeficiency Virus
HPV Human Papilloma Virus
IFN Interferon
IL Interleukin
IL-1ra IL-1 receptor antagonist
IP-10 IFN-gamma inducible protein 10
IQR Interquartile Range
IUD Intra-Uterine Device
LTR Long terminal repeats
MD-2 Myeloid differentiation factor 2
MIP Macrophage inflammatory protein
MIQE Minimum Information for Publication of Quantitative Real-Time PCR Experiments
NCBI National Center for Biotechnology Information
NFW Nuclease Free Water
NGS Next Generation Sequencing
NOD Nucleotide Oligomerization Domain
NTC None Template Control
PAM Partitioning Around Medoids
PCR Polymerase Chain Reaction
pDC’s Plasmacytoid dendritic cells
POP Progestin-only contraceptive pill
PSA Prostate-specific antigen

xvi
A. O. Breetzke
rDNA Ribosomal DNA
RICK Receptor-Interacting serine/threonine protein Kinase 2
RNA Ribonucleic Acid
rRNA Ribosomal RNA
SNP Single nucleotide polymorphism
SSU Small Subunit
STI Sexually Transmitted Infection
TGF Transforming growth factor
TLR Toll-like Receptor
TNF Tumor necrosis factor
QIIME Quantitative Inference In Microbial Ecology
qPCR Quantitative Real-Time Polymerase Chain Reaction
WISH Women’s Initiative in Sexual Health
List of Units
C Degrees Celsius
sec Seconds
min Minutes
h Hour
RPM Revolutions per minute
v/v Volume per volume
V Volts
bp Base pair
µL Microliter
mg/L Milligrams per liter
g/L Grams per liter
mL Milliliter
µM Micromole
pg Pico-gram
ng/µL Nano-gram per microliter
copies/µL Copies of bacteria per microliter
copies/ng Copies of bacteria per nano-gram

1
A. O. Breetzke
Abstract
Young, reproductive-aged women are at highest risk of acquiring human-immunodeficiency
virus (HIV). The Women’s Initiative in Sexual Health (WISH) study was designed to investigate
potential biological reasons for this high risk in HIV negative, South African adolescent females.
Little is known about the ‘normal’ microbiome of this population. As such, the aim of this sub-
study was to quantify specific bacterial species (L. crispatus, L. jensenii, L. gasseri, L. iners, G.
vaginalis and P. bivia) by quantitative real time PCR (qPCR) from adolescent female lateral
vaginal wall swabs, and to assess associations between the quantities of these bacteria and
bacterial vaginosis (BV) status, inflammation levels, age, hormonal contraceptive usage, and
sexually transmitted infections (STIs). Samples were collected from 143 participant adolescent
females in total, aged between 16 and 22 years of age, with a median of 18 years of age, from the
Masiphumelele Youth Clinic in Cape Town, South Africa.
Bacterial DNA was extracted from lateral vaginal wall swabs using the MoBio Powersoil® DNA
Isolation Kit after enzymatic digestion. Positive bacterial reference strains were cultured in MRS
buffer and Schwedler’s broth, after which the DNA was extracted using the Qiagen Blood and
Tissue DNA Maxi Extraction Kit. The quality and concentration of the DNA was confirmed
using Qubit technology. The positive control DNA was amplified with PCR using species
specific primers and the product run on an agarose gel to confirm primer specificity. The positive
control DNA was serially diluted from 106 to 10
-2 copies/µL to form a standard curve for
absolute quantification through qPCR. Multiple steps were taken in order to optimize the qPCR
experiments in terms of protocols, initial denaturation and annealing temperatures, cycle length
and number, primers, and serial dilutions of the positive control DNA. The optimization for the
P. bivia qPCR protocol presented the most issues, with the final quantification results being
unreliable and requiring further work. Once the qPCR conditions were optimized for each
bacterium; all samples, non-template control and standards were run in triplicate to quantify the
number of bacterial copies per ng of DNA for each participant. The average of the three values
were used as the final quantities and then used for downstream analyses.
The bacterium L. crispatus, L. jensenii and L. gasseri, had median readings of 3.957 copies/ng,
1.568 copies/ng, and 17.58 copies/ng, respectively, with increased L. iners (2807 copies/ng) and
G. vaginalis (8540 copies/ng). BV negative participants had increased levels of L. crispatus

2
A. O. Breetzke
(p=0.0004, p=0.0002) and L. gasseri (p=0.0016, p<0.0001) in comparison to both BV
intermediate and BV positive participants. L. jensenii (p<0.0001) and L. iners (p=0.0461)
readings were increased in BV negative participants compared with BV positive and BV
intermediate participants, respectively. BV positive participants had increased levels of G.
vaginalis in comparison with both BV intermediate (p=0.0059) and BV negative (p<0.0001)
adolescents. The 47 immunological factors, assessed via luminex, were categorized into high and
low genital inflammation based on the unsupervised analysis by partitioning around medoids
(PAM) using an R package ‘cluster’ with a k-value of 2. The inflammation-low group had
increased levels of L. crispatus (p=0.0005), L. gasseri (p=0.033) and L. jensenii (p=0.0046) in
comparison to the genital inflammation-high group.
In participants with two viral STIs (Herpes Simplex Virus 2 and Human Papilloma Virus), there
were increased copies/ng of G. vaginalis in comparison with participants with none (p=0.0098)
or one viral STI (p=0.0324). Participants with high-risk HPV subtypes had significantly higher
copy numbers of L. crispatus in comparison to the participants with low risk HPV subtypes
(p=0.0181). Further, the only association demonstrated between the qPCR-based bacterial levels
and the hormonal contraceptive prescribed was indicated by L. jensenii (ANOVA p=0.0222),
possibly due to the low copy number readings.
In conclusion, BV status, low levels of genital inflammation and the presence of two viral STIs
indicate an association with bacterial copy numbers reported in this study, with increased median
levels of L. iners and G. vaginalis across all adolescent participants compared to the other
reported bacterial copy numbers. This indicates a possible alternate ‘normal’ microbiota profile
of the FGT in adolescents in Masiphumelele.

3
A. O. Breetzke
Chapter 1: Literature Review
1.1 Human-Immunodeficiency Virus in South Africa
In sub-Saharan Africa, the Human immunodeficiency virus (HIV) is an epidemic (Byrne et al.
2016; Cohen et al. 2012; Mitchell & Marrazzo 2014; Murphy et al. 2014; Roberts et al. 2012).
Within the high risk reproductive-age adolescent population, there are approximately 7000
young women infected weekly in sub-Saharan Africa (Roxby et al. 2016). In South Africa in
2015, an estimated 7 million people were living with HIV, of which 4 million were women aged
15 years and over, with 180 000 Acquired Immune Deficiency Syndrome (AIDS) related deaths
(UNAIDS 2015). Such high numbers have been attributed to poverty, as well as the lower status
of women in some cultures, social instability and inequality, high levels of sexually transmitted
infections (STIs), limited access to medical care, and sexual violence (AFSA 2011). These
factors are further aggravated by the limited knowledge surrounding HIV infection and
transmission in a large proportion of the population (AFSA 2011). South Africa has one of the
highest rates of HIV with 15% of the young women and close to 5% of young men between the
ages of 15-24 years infected. Females aged between 18 and 24 years are at highest risk of HIV
acquisition which can be attributed to sexual activity and associated factors such as either heavier
or thin vaginal discharge, thought to be in conjunction with the use of hormonal contraceptives,
older male sexual partners as well as high numbers of sexual partners and inconsistent condom
use (Pettifor et al. 2005; Seutlwadi et al 2012). Programs such as the loveLife campaign are
designed to incorporated education, multi-media awareness, sexual health and outreach services
for adolescents in order to lower HIV prevalence and related risk behaviors (loveLife 1999). Due
to multiple factors such as socio-economic variables and potentially biological factors, black
South African women have an increased risk of HIV acquisition in comparison to other races
(Pettifor et al. 2005).
HIV infects and dysregulates multiple key innate and adaptive immune cell populations.
Infection results in severe damage to mucosal barriers within the female genital tract (FGT) and
leads to infiltration of symbiotic bacteria present within the FGT into the tissue, which could
potentially cause opportunistic infections and activation of the systemic immune system (Reis
Machado et al. 2014). The induction of an inflammatory response results in spreading of the
virus to specific HIV target cells, such as activated CD4+
T-cells expressing CXCR4 and CCR5

4
A. O. Breetzke
HIV co-receptors, which promote viral infection. In addition to activated T cells, HIV can also
infect proliferating and resting T cells (Reis Machado et al. 2014; Xu et al. 2013; Zhang et al.
2004).
Antigen presenting CD4+
T-cells present a particular challenge as their preferential targeting by
HIV results in their possible impairment or elimination from the immune response. Increased
levels of inflammatory cytokines that promote CD4+
T-cell activation result in increased sources
of target cells for HIV. This results in the hyper-activation of CD8+ T cells and over production
of antibodies which can lead to a poor specific antibody response, lack of cytotoxic T
lymphocytes and an overall impairment of the immune system. High levels of these activated
CD4+
T-cells within the FGT mucosa further facilitate shedding of HI-virus and overall depletion
of CD4+
T-cells. HIV infection is further facilitated by Langerhans cells which act as
transmission channels for the HI-virus within the FGT (Jaspan et al. 2011; Riou et al. 2012; Xu
et al. 2013).
1.2 The female genital tract (FGT) immune response
The FGT is comprised of the upper and lower FGT, with the upper FGT including the uterus
body, fallopian tubes, endocervix, which are lined by type I mucosa with columnar epithelial
cells, while the lower FGT includes the ectocervix, vagina and type II mucosa with squamous
epithelial cells (Xu et al. 2013; Reis Machado et al. 2014). The FGT immune system includes all
cell types associated with innate and adaptive immune functions (Xu et al. 2013). The activity
and numbers of T cells, B cells, neutrophils, monocytes, macrophages, dendritic and other
antigen presenting cells, along with other components of the mucosal immune system, is
hormonally controlled with oestradiol and progesterone. These two hormones are involved in the
regulation of cytokine levels, cell population distributions, immunoglobulin transport and antigen
presentation and production during immune response (Beagley & Gockel 2003; Mestecky &
Fultz 1999; Wira, Fahey, et al. 2005). FGT hormones further regulate the immune system in such
a way as to favour optimal conditions and functions for fecundity, such as sperm migration and
implantation (Reis Machado et al. 2014).

5
A. O. Breetzke
Columnar epithelial cells play an important role in innate and adaptive immunity by forming a
physical barrier and, through the secretion of specific cytokines and chemokines which link the
adaptive immune system, are antimicrobial and play a role in tissue physiology and
differentiation for support of the fetus during gestation (Wira, Grant-Tschudy, et al. 2005).
Epithelial cells further prevent pathogenic and opportunistic bacteria from entering the body
through the secretion of mucus which lines the cervix and vagina, trapping any unwanted
pathogenic microbes. The mucus which contains antimicrobial defensin proteins, in conjunction
with the epithelial cells which express TLRs, myeloid differentiation factor 2 (MD-2) and major
histocompatibility complex molecules, ensures the innate and adaptive immune systems are fully
functional and efficient within the FGT (Wira, Fahey, et al. 2005; Mirmonsef et al. 2011).
The FGT has a multi-layered immune defense system composed of mucus lining, antimicrobial
peptide secretions, tight epithelial barriers, and cytokines monitored by innate and epithelial
immune cells, which bridge the gap of cell-mediated and pathogen-specific humoral adaptive
immunity (Hickey et al. 2011; Reis Machado et al. 2014; Ochiel et al. 2008). Mucosal immunity
plays a specific role in female reproductive organ functioning and embryonic development
during pregnancy. Mucosal immunity is specifically active against the multitude of
microorganisms that access the FGT and that can cause dysbiosis and infection while
maintaining a balance with commensal bacteria, preventing unnecessary inflammation. The FGT
defends against microorganisms via toll-like receptors (TLRs) such as TLRs 7-9 in the uterine
and fallopian tubes, ectocervix and cervix as well as Nucleotide Oligomerization Domain (NOD)
like receptors such as NOD1 and NOD2 along with Receptor-Interacting serine/threonine protein
Kinase 2 (RICK) which are all expressed within the FGT tissues. These receptors induce pro-
inflammatory CXCL8 and aid in the removal of pathogens (Reis Machado et al. 2014; Xu et al.
2013). Additionally the squamous epithelium forms a physical barrier of defense as a result of
tight junctions, desmosome proteins, and adherens junctions to reduce permeability to the HI-
virus (Reis Machado et al. 2014; Mestecky & Fultz 1999; Xu et al. 2013).
The release and concentration of pro-inflammatory and anti-inflammatory cytokines secreted by
the cellular components of the FGT affects the functionality of the immune-competent tissues
which comprise the mucosal immune defense system (Anjuère et al. 2012). Cytokines are
signaling molecules that allow information exchange between the immune system and tissue

6
A. O. Breetzke
network. Cytokines bind to their cognate receptors, which results in a change in function or
phenotype of the recipient cell upon acceptance of the antigen signal through antigen receptors
(Firestein et al. 2013; Su et al. 2012). Cytokines can be anti- or pro-inflammatory, potentially
modulating multiple pathways throughout the immune system. Common anti-inflammatory
cytokines include interleukin-4 (IL-4), IL-6, IL-10, IL-11, IL-13, alpha-interferon (IFN-α),
Transforming growth factor-beta (TGF-β), and IL-1 receptor antagonist (IL-1ra). Anti-
inflammatory cytokines act through various pathways in order to combat infections, such as IL-
4, IL-10 and IL-13 which activate B lymphocytes during infection (Dinarello 2000). Common
pro-inflammatory cytokines include IL-7, tumor necrosis factor alpha (TNF-α), IFN-γ, IL-12, IL-
18, granulocyte-macrophage stimulating factor (MG-CSF), IL-23/17, and IL-1β (Arnold et al.
2015; Cavaillon 2000; Jung et al. 1995; Su et al. 2012; Sultani et al. 2012). In addition to the role
of cytokines, the inflammatory response may be further modulated by the nature and quantity of
target cells and cytokine activating signals, the timing, sequence of cytokine action, as well as
cytokine polymorphisms, which can have a further impact on the magnitude of the response
(Cavaillon 2000). Chemokines control the differentiation and development of immune precursor
cells in the thymus and bone marrow as they are chemotactic cytokines which influence the
positioning and migratory patterns of the immune cells. Common cytokines include IFN-gamma
inducible protein 10 (IP-10) involved in TH1 response and natural killer cell trafficking,
RANTES, MIP-1α and MIP-1β which play a role in the migration of macrophage and natural
killer cells, as well as interactions between dendritic cells and T cells (Griffith et al. 2014).
Several pro-inflammatory cytokines have been associated with STIs in high-risk HIV uninfected
adult women and can therefore be used as a possible indicator of infection and HIV susceptibility
(Mlisana et al. 2012). Increased levels of Th17 cells (CD3+ CD4
+ IL-17
+) have been associated
with chlamydia and gonorrhea (Masson et al. 2015). Inflammatory cytokines can inhibit HIV
replication and disease progression and as such play an important role in disease prevention
(Breen 2002), with certain cytokines, including IFN-γ, IL-2, IL-4 and IL-5 predominantly
associated with T-cell effector function which direct participation in the immune response to
foreign bodies (Firestein et al. 2013). Inflammatory cytokines such as IL-10, have been
associated with the inhibition of long terminal repeats (LTR)-directed HIV gene expression
through cyclin T1 proteolyis induction in human macrophages (Wang & Rice 2006), while IL-16
is associated with inhibition of HIV replication in acutely infected T cells and the suppression of

7
A. O. Breetzke
lymphocyte activation (Idziorek et al. 1998). Circulating T-lymphocytes, bone marrow and
thymus T-cell precursors, macrophages and monocytes, eosinophils, dendritic and microglial
cells have been identified as targets for HIV replication and their increased levels with STI
infections have been associated with increased activation of target cells and susceptibility to HIV
acquisition (Fanales-Belasio et al. 2010; Hunt et al. 2011; Masson et al. 2015). The possible
cause of this susceptibility is the decreased production of IL-21, IL-22, IL-1β, IL-17, IL-18 and
Macrophage inflammatory protein-3α (MIP-3α), which is associated with the promotion of tight
junctions, barrier functions, proteases and production of mucin by the mucosal epithelial cells of
the FGT. The interruption of the FGT epithelial cell wall functions results in mechanical errors
leading to the entry of HIV across the cellular barrier. A possible mechanism for the entry of,
and efficient infection by, HIV, could be the increase in the frequency of endocervical CD4+ T-
cells upon any mechanical damage within the FGT mucosal lining (Arnold et al. 2015).
The FGT is equipped to remove foreign substances and microbes such as fungi, viruses, parasites
and bacteria, but is also colonized by commensal bacteria, predominantly Lactobacillus species,
which aid in its immune defense (Mirmonsef et al. 2011). The innate and adaptive immune
systems interact with uterine epithelial cells and microbiota to optimize the FGT health through
the removal of harmful infections while maintaining inflammation to prevent self- responses
(Mirmonsef et al. 2011). Thus the FGT microbiota, in conjunction with the immune system and
vaginal environment as a whole, plays a major role in women's health (Jespers et al. 2016a;
Ravel et al. 2011; Anahtar et al. 2015), which also has important implications for fetal and
neonatal health (Srinivasan et al. 2010; Srinivasan et al. 2012).
1.3 FGT Microbiota
The FGT microbiota is a combined community of commensal microbes co-existing together,
with changes within the balance resulting in changes in health which occur due to colonization
with pathogenic microbes (Salipante et al. 2013; Srinivasan & Fredricks 2008). A ‘healthy’
microbiome is dominated by Gram-positive bacteria such as the commensal Lactobacillus
species (Selle et al. 2014), that play an important role in the FGT due to their numerical
dominance (Lamont et al. 2011), production of lactic acid and hydrogen peroxide which reduce

8
A. O. Breetzke
the pH of the genital tract to maintain the optimal conditions for commensal bacteria.
Furthermore, lactobacilli prevent the growth of pathogens, compete for adherence to the vaginal
epithelium and for nutrients, thus making the vagina less hospitable to pathogens (Vitali et al.
2007; Mirmonsef et al. 2011), STIs, yeast, and urinary tract infections (Balkus et al. 2012). The
reduction of lactobacilli present within the FGT, and the increase in BV associated anaerobes has
been associated with increased risk of HIV acquisition and seroconversion (Atashili et al. 2008;
Myer et al. 2005). Lactobacilli influence HIV by playing a role in the control in the genital
shedding of newly reproduced HIV to another part of the body or another person (Balkus et al.
2012). Lactobacilli species further maintain an inhospitable environment for pathogenic bacteria
by acting as probiotics, producing bacteriocins and antibiotic toxic hydroxyl radicals (Lamont et
al. 2011). The loss of lactobacilli species results in the overgrowth of anaerobic and facultative
bacteria which can lead to dysbiosis of the FGT microbiome (Jespers et al. 2012; Lopes dos
Santos Santiago et al. 2012; Srinivasan et al. 2012; Ravel et al. 2011). Although it is understood
that a ‘healthy’ microbiome is lactobacilli -dominated, the microbiome diversity and structure is
strongly influenced by geographical location, ethnicity, age and culture (Ravel et al. 2011;
Jespers et al. 2012).
Common lactobacilli found within the FGT include L. crispatus, L. gasseri, L. jensenii, as well
as L. iners; however, L. iners has been shown to be present during the intermediate phase
between dysbiosis and a healthy microbiome within the FGT and thus is not as strongly
associated with what is considered to be a ‘healthy’ FGT microbiome (Jespers et al. 2012; Mayer
et al. 2015; Macklaim et al. 2013; Roxby et al. 2016; Srinivasan & Fredricks 2008). In contrast,
common facultative and anaerobic bacterial species associated with the loss of lactic acid
producing bacteria include Gardnerella vaginalis and Prevotella bivia, whose presence within
the FGT microbiome is concomitant with Bacterial Vaginosis (BV), which is the dysbiosis of the
FGT microbiome and considered to be ‘unhealthy’ (Mayer et al. 2015; Fredricks et al. 2007;
Fredricks et al. 2015; Lopes dos Santos Santiago et al. 2012; Saito et al. 2006). Some bacteria
present within the FGT associated with BV are further associated with the change in vaginal pH
and influence the inflammatory status of the FGT mucosa (Roy et al. 2006). This is achieved
through the production of microbial products such as short chain fatty acids, which can inhibit
pro-inflammatory cytokines secretion, affect phagocytosis and migration of immune cells
(Mirmonsef et al. 2011).

9
A. O. Breetzke
Although the exact protective mechanisms of lactobacilli are partially unknown, H2O2
production creates a hostile acidic environment, which inhibits the growth of many harmful
micro-organisms (Jespers et al. 2012). There is much debate about what constitutes a ‘normal’
FGT microbiome, as different cultures and races such as Hispanic, black, white and Asian
populations have been found to have different predominant species present depending on BV
status as well as pH (Ravel et al. 2011).
1.4 Bacterial vaginosis (BV)
Bacterial vaginosis (BV) is an alteration within the vaginal flora, with an increase in anaerobic
and facultative bacteria, and overall diversity, and a concomitant decrease in the relative
abundance of Lactobacilli. The most common bacteria associated with BV include Gardnerella
vaginalis, Prevotella bivia, Atopobium vaginae, Shuttleworthia sp., BV associated bacteria 2
(BVAB2), BVAB3, Sneathia sp., Megasphaera sp. Phylotype 1, and Leptotrichia sp. (Jespers et
al. 2012; Lopes dos Santos Santiago et al. 2012; Srinivasan et al. 2010; Srinivasan et al. 2012). In
healthy, BV-negative women, lactobacilli predominate the FGT microbiome, with a distinct
reduction in their colonization upon the initiation of BV (Fredricks et al. 2007; Srinivasan et al.
2012).
BV is commonly diagnosed based on Amsel’s clinical criteria, which include the presence of
clue cells, vaginal fluid pH of greater than 4.5, a positive amine odor whiff test and a thin,
homogenous milky discharge. A woman is classified as being BV positive if at least three of
these four criteria are positive (Amsel et al. 1983; Eschenbach et al. 1988). BV can also be
classified by Nugent scoring, which is based on the presence of specific morphotypes with
different associated scores where the Lactobacillus morphotypes have a score of 4-0 (large gram-
positive rods), the G. vaginalis and Bacteroides spp. morphotypes have a score of 0-4 (small
gram-variable and gram negative rods) and Mobiluncus spp. morphotypes are scored 0-2 (curved
gram-variable rods) (see Table 1.1 for scoring system) (Gad et al. 2014; Nugent et al. 1991;
Spiegel et al. 1983). The vaginal smear is graded according to the presence of each morphotype
to calculate the final Nugent score. A Nugent score of 0-3 is considered BV negative, a score of
4-6 is considered BV intermediate and a Nugent score between 7-10 is considered BV positive

10
A. O. Breetzke
(Srinivasan et al. 2010; Lopes dos Santos Santiago et al. 2012; Jespers et al. 2012; Srinivasan &
Fredricks 2008).
Table 1.1: Nugent scoring system for Gram-stained vaginal smears
Scoreª
Lactobacillus
morphotypes
G. vaginalis and Bacteroides
spp. morphotypes
Mobiluncus spp.
morphotypes
0 4+ 0 0
1 3+ 1+ 1+ or 2+
2 2+ 2+ 3+ or 4+
3 1+ 3+
4 0 4+
ª0 - no morphotypes present; 1 - <1 morphotype present; 2 – 1 to 4 morphotypes present; 3 – 5 to
30 morphotypes present; 4 – 30 or more morphotypes present.
Risk factors for BV include new and multiple sexual partners, vaginal douching, as well as a
slight association with wearing tight trousers more than once a week. BV incidence and recurring
infection could be reduced by decreasing unprotected sexual encounters and increased in condom
use (Chiaffarino et al. 2004; Fethers et al. 2008). Further factors, such as the presence of
Prostate-specific antigen (PSA), age, sexual preference or point in the menstrual cycle have yet
to be successfully associated with BV status (Jespers et al. 2012). BV has been associated with
increased risk of pelvic inflammatory disease and acquisition of HIV (Fredricks et al. 2007;
Fredricks et al. 2009). In pregnancy specifically it has been associated with the multiple
complications such as early and late miscarriage, recurrent abortion, post-abortal sepsis, preterm
pre-labor rupture of membranes, spontaneous preterm labor, preterm birth, postpartum
endometriosis and histological chorioamnionitis (Lamont et al. 2011; Malaguti et al. 2015). In a
study performed by Petricevic et al. (2014), it was shown that most Lactobacillus species were
associated with full term gestation periods in healthy pregnant women, whereas L. iners
specifically was shown to be present in 85% of the women who delivered preterm.
The dysbiosis and increase in diversity of the FGT microbiome, change in pH and loss of
defensive lactobacilli due to the onset of BV have been associated with an increased risk of
sexually transmitted and upper genital tract infections. Further, BV has been associated with HIV
(Lamont et al. 2011; Srinivasan et al. 2010; Srinivasan et al. 2012).

11
A. O. Breetzke
1.5 Sexually Transmitted Infections (STIs)
There multiple different types of STIs with the most infamous viral STI being HIV (Hunt et al.
2011; Patterson et al. 2002; O’Farrell 2008). Common bacterial sexually transmitted infections
include Mycoplasma genitalium, Chlamydia caused by Chlamydia trachomatis, Gonorrhea
caused by Neisseria gonorrhea, and Syphilis caused by Treponema pallidum. Parasitic infections
such as Trichomoniasis are caused by Trichomonas vaginalis, while the human papilloma virus
(HPV) and herpes simplex virus (HSV-2) are two of the most common viral infections.
Candidiasis is a yeast overgrowth that is not sexually transmitted, yet often co-occurs with other
STIs (Reproductive Health and Research & Who 2005; Reis Machado et al. 2014; Anahtar et al.
2015; Chinsembu 2009; Ohene & Akoto 2008).
Figure 1.1: Adaptation from Reproductive Health and Research (WHO) sites of infection in the
FGT and the associated STIs and other infections with associated sequela (Reis Machado et al.
2014; Chinsembu 2009; Reproductive Health and Research & Who 2005; Minnesota 2005; CDC
2014a; CDC 2014b; CDC 2014c; CDC 2014d).
CERVIX
Gonorrhoea – vaginal discharge,
inflammation
Chlamydia – infertility, chronic
pelvic pain, ectopic pregnancy,
vaginal discharge
M. genitalium – cervicitis, urethritis,
pelvic inflammatory disease
VULVAL, LABIA, VAGINA
HSV-2 – inflammation, genital
ulcers
Human Papilloma Virus – genital
warts, cervical cancer
VAGINA
Bacterial Vaginosis (non STI)– milky
discharge, amine odor, increase in
vaginal pH
Candidiasis (non STI) – loss of normal
vaginal flora, reduction in pH, germ
tube formation, inflammation, vaginal
discharge
Trichomoniasis – premature birth and
membrane rupture, infertility, cervical
cancer, vaginal discharge
UTERUS
Vaginal bacteria – Anaerobic, non
H2O
2 producing bacteria
12
A. O. Breetzke
Adolescents in particular are at higher risk of STI acquisition, with a ratio of 2:1 adolescent
females to their male counterparts (Chinsembu 2009). This increased ratio is thought to be
partially due to increased cervical ectopy, cognitive, biological and socio-cultural factors. STIs
can be asymptomatic or symptomatic in adolescents, and can further cause tubal pregnancy,
infertility, and cervical cancer (Chinsembu 2009; Ohene & Akoto 2008). Further factors
associated with the acquisition of STIs in adolescents include drug and alcohol use,
unavailability and lack of condom use, as well as an early initiation age of sexual activity and
multiple sexual partners (Ohene & Akoto 2008; Reproductive Health and Research & Who
2005).
Importantly, STIs have been shown to increase the risk of HIV acquisition by three fold or more
(Mlisana et al. 2012; Newman et al. 2013; Ohene & Akoto 2008) with 16.3% co-infection
between genital inflammatory diseases and HIV (Reis Machado et al. 2014). HIV positive
individuals have reduced immune function and favor the colonization of STIs as local infections
within the FGT. This facilitates local replication of HIV within the FGT through HIV shedding
(Reis Machado et al. 2014). One important issue in Southern Africa is that STIs are treated by
the syndromic approach, yet up to 50% of the women infected with an STI are asymptomatic and
therefore remain untreated. STIs may have subclinical manifestations such as elevated cytokines
due to genital tract inflammation. However, due to the lack of diagnosis, under- and over-
treatment of STIs is common, further increasing adolescent HIV risk (Mlisana et al. 2012).
1.6 Hormonal Contraceptives
Several different types of contraceptives are currently licensed, including Intra-Uterine Devices
(IUD’s), barrier methods, hormonal contraception, spermicides and operative sterilization, with
other methods including fertility cycle awareness methods, situational methods such as coitus
interruptus, douching and abstinence (Draper 2006; Mitchell 2008). Hormonal contraception
and condom use are two of the most commonly used methods (Smit et al. 2002).
The two hormones oestradiol and progesterone play a major role in the regulation and defensive
immunity of the FGT, along with controlling the monthly menstrual cycle. Synthetic version of
these two hormones are used in contraceptives, administered as a daily oral pill, injection, patch,

13
A. O. Breetzke
or inserted in the form of a rod to adjust the monthly menses and FGT conditions in order to
prevent pregnancy (Murphy et al. 2014; van de Wijgert et al. 2013). Hormonal contraceptives
can contain one or a combination of hormones in various doses, and usually suppress ovulation,
increase the viscosity of cervical mucus to impair sperm movement, or induce morphological
changes to the endometrium lining to prevent nidation of the egg in the cervix (Family Planning
Western Australia 2012; Murphy et al. 2014; Organon Pharmaceuticals USA 2011; Pfizer 2011;
Pharmaceutical/Industry 2005).
In Sub-Saharan Africa, the three hormonal contraceptives (HCs) Depo-Provera, Implanon and
Nur-Isterate are particularly popular as they do not require daily administration, can go unnoticed
due to the manner and frequency in which they are administered, as well as do not require coital-
dependent insertion or use (Organon Pharmaceuticals USA 2011; Pharmaceutical/Industry 2005;
Pfizer 2011). These three HCs contain progestogens only with the active agents of Depot
Medroxyprogesterone acetate (DMPA), Norethisterone Enantate and Progestin Etonogestrel in
Depo-Provera, Nur-Isterate and Implanon respectively. Depo-Provera lasts for 12 weeks, Nur-
Isterate are injections for 8 weeks, while Implanon is an ethylene vinyl acetate rod that is
inserted under the subdermal connective tissue in the arm and can remain for up to three years.
The three HCs have similar side effects, such as irregular or prolonged bleeding as well as heavy
bleeding or amenorrhea, weight gain, headaches and mood changes. They differ in that Depo-
Provera can cause an allergic reaction, albeit rare, as well as loss of bone density. Nur-Isterate
can cause dizziness and loss of glucose tolerance while the Implanon can cause bruising, breast
pain and acne (Mitchell 2008; Organon Pharmaceuticals USA 2011; Pharmaceutical/Industry
2005; Pfizer 2011).
Progestin-only hormonal contraceptives are favoured in Sub-Saharan Africa due to their privacy,
convenience, low cost and efficacy. They were used by an estimated 8 million women in 2015,
with specific popularity in South Africa (Byrne et al. 2016; Murphy et al. 2014; Smit et al. 2002;
van de Wijgert et al. 2013). In South Africa, male and female condoms, hormone patches,
intrauterine devices, sterilization, hormonal pills and contraception injections are available.
There are two combined oral contraceptive (COC) and progestin-only contraceptive pills (POP),
as well as two progestin only contraceptive injections Nur-Isterate and Depo Provera (DMPA)

14
A. O. Breetzke
(Department of Health 2012; Dr Manto Tshabalala-Msimang 2013; Western Cape Government
2015).
Much observational and pre-clinical research has been conducted to determine the relationship
between progestin-only hormonal contraceptives and HIV acquisition (Smit et al. 2002; van de
Wijgert et al. 2013). Exogenous progestin’s found in hormonal contraceptive injections such as
DMPA reportedly could accelerate CD4+ T cell depletion in HIV positive women through the
physiological functions of the glucocorticoid receptor within the immune system and apoptosis
(Govender et al. 2014; Tomasicchio et al. 2013). Increased progestin levels have been linked to
an increased frequency of activated CCR5+ CD4 T cells within the cervix, which are HIV target
cells, illustrating a link between the contraceptives and HIV acquisition (Byrne et al. 2016).
Further research, originally performed on macaques, indicates that hormonal contraceptives may
interfere with cervical cellular immune function by thinning the vaginal epithelial cell layers,
which exposes the vaginal junctions to disruption and may therefore allow access to pathogenic
bacteria and STIs (Murphy et al. 2014).
Further, HIV acquisition has been linked to progestin-only contraceptives due to their proposed
inhibition of TLR-9-induced Interferon (IFN) production by plasmacytoid dendritic cells
(pDC’s) along with other innate and adaptive soluble factors, potentially hampering immune
responses within the cervix against HIV infection (Murphy et al. 2014). A specific association
has been indicated with the active agent of Depo-Provera, DMPA and the sustained decrease in
Interleukin-8 (IL-8), Interleukin-6 (IL-6), and the Interleukin-1a receptor antagonist (IL-1a)
within women over a prolonged period of Depo-Provera use (Borgdorff et al. 2015). Further
studies have been conducted to determine if there is a link between the FGT microbiome,
progestin-only contraceptives, and HIV within African women given the widespread
contraceptive use and HIV acquisition (FSRH Clinical Effectivesness Unit 2017; Polis et al.
2016; World Health Organization 2017). The use of injectable hormonal contraceptives have
been implicated in the increased risk of STI acquisition, which are further associated with
increased HIV acquisition (Grabowski et al. 2015; Noguchi et al. 2015). The prolonged use of
DMPA resulted in a 100 fold decrease in G. vaginalis in the vaginal fluid in a study by Roxby et
al. (2016), with the suggested explanation linking amenorrhea and the requisite for iron for G.
vaginalis growth. The bacterial species L. crispatus and L. jensenii were below detection level
15
A. O. Breetzke
for most participants on DMPA with little or no change to L. iners. The total bacterial load was
further shown to decrease over time with DMPA administration, with no correlation indicated
with BV in vaginal health (Borgdorff et al. 2015; Roxby et al. 2016).
1.7 Technical analysis of FGT bacteria
Several techniques exist to quantify bacteria in a diverse range of samples. Although growth
media has been used to culture many organisms within the FGT, some are more difficult to
cultivate and therefore Polymerase chain reaction (PCR) is one of the most commonly used
techniques for quantifying target DNA that does not depend on the culturability of the bacteria.
The DNA is amplified through the use of primers, which can be custom designed and species-
specific or universal, for instance targeting all bacteria via genes targeting the hypervariable
regions of the 16S rRNA gene. The DNA goes through an initial denaturation cycle most
commonly at 95 C, followed by a number of cycles of denaturation, annealing and extension
after which the DNA product is run on an agarose gel with a DNA size marker to confirm
expected amplicon size. PCR is a rapid, automated and when performed in a 384 well qPCR
plate- high throughput quantitative technology used as an important tool for basic research
(Lambert et al. 2013; Pabinger et al. 2014).
Real-time quantitative PCR (qPCR) is an advancement of PCR where simultaneous
amplification and quantitation of a target gene is possible. The initial amount of template DNA
can be quantified based on the relationship between cycle number and fluorescent threshold
signal level where the higher the initial DNA concentration, the fewer cycles required to reach
the threshold level (Pabinger et al. 2014; Pfaffl 2004; Pfaffl & Wittwer 2015). qPCR can be
used for relative quantitation of bacteria through the use universal bacterial 16S rRNA primers,
followed by sequencing in order to identify the species present. qPCR can be used for absolute
quantification through the use of species specific primers in relation to a standard curve
constructed through serial dilution of DNA extracted from a positive control reference
bacterium. This technique allows absolute quantification of the bacteria of interest (copies/µL),
which can be converted to bacterial copy numbers based on the reference bacteria’s genome size
(see Methods Chapter 3 for details) (Grunenwald & Kramer n.d.; Hermann-bank et al. 2013;
16
A. O. Breetzke
Roche 2003; Smith & Osborn 2009). With the increased use of this technique as a tool for gene
expression, pathogen detection and biomolecular diagnostics, it is important to have stringent
quality control measures in place. As such the Minimum Information for Publication of
Quantitative Real-Time PCR Experiments (MIQE) has been established in order to maintain the
standard of qPCR for all research (Bustin 2010; Pabinger et al. 2014).
Next Generation Sequencing (NGS) is used for 16S rRNA, small subunit rRNA, hypervariable
regions, rDNA, and metagenomics sequencing. NGS has multiple clinical applications such as
forensic genetics, infectious disease surveillance, pathogen outbreaks and is in the early stages of
clinical diagnostics (Jones et al. 2015; Illumina 2013; Voelkerding et al. 2010). NGS involves
the sequencing of stretches of target DNA in order to identify the relative abundance of bacteria
present. Sanger sequencing was the first form of sequencing and since, the advent of NGS has
progressed to 454 pyrosequencing, Illumina MiSeq, Illumina HiSeq and Ion Torrent sequencing
(Tan et al. 2015). NGS is a high throughput analysis technique which has a diverse set of
applications above DNA sequencing such as re-sequencing, microsatellite analysis and Single
nucleotide polymorphism (SNP) genotyping, multiplexing and whole-genome sequencing with
tunable resolution, target sequencing and enrichment (Czerniecki & Wołczyński 2011; Illumina
2013; Wienkoop & Weckwerth 2006).
In this study, we aimed to compliment Illumina MiSeq relative abundance analysis of the vaginal
microbiota of adolescent females by development and application of qPCR. This study aimed to
identify the presence of a relationship between the factors such as high risk HPV subtypes, high
genital inflammation BV positive, older adolescent age groups, DMPA hormonal contraceptives
and the presence of an STI in relation to increased quantities of the key bacterial species which
may influence HIV acquisition as discussed in the literature review.
1.8 Aims of this Study
1. To develop an assay for absolute quantitation of L. jensenii, L. gasseri, L. crispatus L.
iners, G. vaginalis and P. bivia in adolescent genital tract in HIV negative South African
adolescent females.

17
A. O. Breetzke
2. To analyze relationships between the copies/ng of the bacteria, and relate the absolute
quantities to BV status, inflammation, age, hormonal contraceptive and STIs.
1.9 Objectives of this Study
1. In HIV negative adolescent females in South Africa, to asses any associations between
the copies/ng of bacterial species of interest L. jensenii, L. gasseri, L. crispatus L. iners,
G. vaginalis and P. bivia and;
a. High and Low Inflammatory cytokine levels,
b. BV Positive, Intermediate and Negative based on Nugent scores,
c. Age (stratified as 16-18 years old vs 19-22 years old),
d. DMPA, Nur Isterate, and Implanon hormonal contraceptives,
e. The presence or absence of STIs (N. gonorrhea, C. trachomatis, HSV-2, T.
vaginalis, M. genitalium, T. pallidum, H. ducreyi)
1.10 Hypothesis
We hypothesize that L. jensenii, L. gasseri, and L. crispatus will be more abundant in HIV
negative female adolescent vaginal samples that contain low levels of inflammatory cytokines
and/or are BV negative and/or have no STI, and/or are using the hormonal contraceptives Nur
Isterate or Implanon between the ages of 16-18 years old.
We further hypothesized that L. iners, G. vaginalis and P. bivia will be more abundant in HIV
negative adolescent female vaginal samples that contain high levels of inflammatory cytokines
and/or are BV positive and/or have one or more STIs and/or using the hormonal contraceptive
DMPA between the ages of 19-22 years old.

18
A. O. Breetzke
Chapter 2: Cohort Characteristics
2.1 Study Design
The research group working under the Women’s Initiative in Sexual Health (WISH) cohort
(HREC REF 267/2013) aimed to look at the relationship between inflammatory cytokines, BV,
STI’s and genital tract microbiome in the FGT in HIV negative adolescent females in South
Africa at high risk for HIV. The ethical approval of this MSc project (HREC REF: 678/2015)
was granted on the 17 September 2015 as part of the WISH cohort ethical approval. Here, we
aimed to identify the composition of the vaginal microbiome in the mucosa of the female genital
tract, and to relate these to the composition of cervical target cells for HIV infection and levels of
inflammation in the cervix. Next Generation Sequencing of 16S rRNA was previously performed
by our group for this cohort to profile the FGT microbiome – mostly to genus level, with some
species level identification (Lennard, manuscript in preparation). Participants were drawn from
the Masiphumelele Youth Centre based in Masiphumelele, Cape Town, Western Cape.
Participants were chosen from this area since there is a high HIV prevalence (21.9% in 2004
(Lawn et al. 2006)) and thus an applicable population to assess adolescent HIV risk.
2.2 Recruitment of participants
HIV-negative, sexually active, adolescent females aged 16-22 years were recruited from the
Masiphumelele Youth Centre. Participants provided written consent if >= 18 years old, or for
participants < 18 years old, their guardians provided written consent while the adolescent
provided signed assent.
2.3 Exclusion criteria
Participants were excluded according to the following criteria:
1. Participants younger than 16 years or older than 22 years old.
2. Participants who had a positive pregnancy test or had used anything that contained
spermicide within 48 hours prior to sampling.
3. Participants were excluded if they had inserted anything in their vagina within 24 hours
before sampling (including but not limited to protected or unprotected vaginal
intercourse).

19
A. O. Breetzke
4. Participants who had douched within 48 hours before sample collect, or were
menstruating.
5. Participants were excluded if they had taken antibiotics within the two weeks prior to
sampling.
6. HIV positive participants were excluded and referred for care.
2.4 Participants and sample collection
The cohort participants were sexually active female adolescents between the ages of 16 and 22
who were enrolled in the WISH study at the Masiphumelele Youth Centre. A detailed
questionnaire was completed by each participant in order to establish sexual practices,
demographics, menstrual cycle, antibiotic used, STI symptoms and adherence in terms of
condom and contraceptive use for the study. Samples were collected in the luteal phase of the
menses cycle from participants taking no HC. A physical exam was performed and the following
vaginal specimens were collected;
1. A softcup to collect vaginal secretions for measurement of cytokines,
2. A lateral wall swab for 16S microbiome profiling,
3. An endocervical swabs or cervical mucous plug for HPV testing,
4. A vulvovaginal swab for STI’s and BV testing
5. Two Digene cervical cytobrushes for cervical immune and epithelial cells.
2.5 Human-immunodeficiency virus (HIV) testing
HIV testing was performed using a Rapid assay on a blood sample retrieved through a prick to a
finger, the result of which was verified using a second, Rapid test for positive samples.
Intermediate results were sent for ELISA confirmation.
2.6 Bacterial vaginosis (BV) testing
BV was diagnosed based on Nugent Scoring on a vaginal swab slide where a Nugent score of 0-
3 and was considered BV-negative, a Nugent score of 4-6 BV-intermediate and a Nugent score
of 7-10 BV-positive. The pH was noted during the sampling process, as well as symptoms such
as the presence of heavy discharge and the colour of the patients discharge. The presence of

20
A. O. Breetzke
“Clue” cells were taken into account when determining Nugent Scores. All symptomatic BV
cases were treated through the Masiphumelele Youth Centre.
2.7 Sexually Transmitted Infections (STIs) testing
All female participants who consented to this study provided vulvovaginal swabs, which were
tested for N. gonorrhea, C. trachomatis, HSV-1, HSV-2, T. vaginalis, M. genitalium, T.
pallidum, and H. ducreyi at the mucosal sampling visit. The results of the tested samples were
made available for all participants who tested positive for one or more of the infections. These
participants were prescribed treatment as well as counseling on site. T. pallidum was not
included in the categorization of viral versus bacterial STI comparisons as there were no positive
results.
STI screening was performed by multiplex PCR on the DNA extracted from vulvovaginal swabs
(Lewis 2000). HSV-1, HSV-2, T. pallidum, and H. ducreyi were identified through M-PCR using
targeted gene primers. Physical exams were performed as part of the identification of T. pallidum
and no ulcers were present. Overall there were no T. pallidum results. HSV-1 and HSV-2 were
identified as a result of both the serology and M-PCR positive results, however, only PCR results
were used for this analysis (i.e. only active shedding was taken into account). The serology
results for HSV-1 and HSV-2 were not incorporated into the results such that analyses were
performed based on the presence of absence HSV-1 and HSV-2 alone. Slides were prepared to
identify candida hyphae and spores.
2.8 Next Generation Sequencing (NGS) of 16S rRNA
NGS was carried out through the extraction of microbial DNA using a MoBio Ultraclean
microbial DNA extraction kit from cervical swabs in order to identify the bacteria present within
the female genital tract. The following universal primers were used to amplify the SSU rRNA
gene;
515F 5’-GTGCCAGCMGCCGCGGTAA-3’ and 907R 5’- CCGTCAATTCCTTTRAGTTT-3’.
These universal primers allow identification of bacteria present within the participant samples by
Illumina Miseq (V3 chemistry 300 bp paired end).

21
A. O. Breetzke
The data analysis was performed by Katie Lennard (PhD) using UPARSE, Quantitative
Inference In Microbial Ecology (QIIME) and custom R scripts.
2.9 Cohort characteristics
Cohort characteristics are summarized in Table 2.9.
Table 2.9: Summarized characteristics of the WISH cohort according to the following categories.
Category Sample
Size
Classification type Score Groups Participants
(%)
BV 143 Nugent Scoring 0-3 Positive 56 (39.16)
4-6 Intermediate 17 (11.89)
7-10 Negative 70(48.95)
Inflammation 140 Unsupervised
hierarchical
clustering analysis
Partitioning
around medoids
(PAM) using an R
package ‘cluster’
with a k-value of 2
Low 42 (30)
High 98 (70)
Age 143 Age in years Years 16-18 75 (52.45)
19-22 68 (47.55)
Hormonal
Contraceptives
136 Type Prescribed DMPA 25 (18.38)
Nur Isterate 102 (75)
Implanon 9 (6.62)
STI 140 Presence/absence
of any one STI
N. gonorrhea, C.
trachomatis, HSV-
2, HPV, T.
vaginalis, M.
genitalium
None 62 (44.29)
Present 78 (55.71)
Bacterial STI 143 Absence, presence
of one, presence of
two or more
Chlamydia
trachomatis,
Neisseria
gonorrhea,
None 77 (53.85)
One 51 (35.66)
Two< 15 (10.49)

22
A. O. Breetzke
Mycoplasma
genitalium
Viral STI 143 Absence, presence
of one, presence of
two
HSV-2, HPV None 46 (32.17)
One 91 (63.63)
Two 6 (4.20)
HPV 90 Absence, presence
of low or high risk
subtypes
None 29 (32.22)
6, 11, 40, 42, 54,
55, 61, 62, 64, 67,
69, 70, 71, 72, 81,
83, 84, 89
(CP6109), IS39
Low Risk 27 (30)
16, 18, 26, 31, 33,
35, 39, 45, 51, 52,
53, 56, 58, 59, 66,
68, 73, 82
High Risk 34 (37.78)

23
A. O. Breetzke
Chapter 3: Laboratory Methods and Materials
In this chapter, the protocols used in laboratory for processing and analysis of the WISH vaginal
samples will be discussed.
We used qPCR to quantify the presence of six microbes in the genital tract of South African
adolescents. In addition to providing absolute quantitative data, the qPCR-based data
complements the 16S rRNA-based microbiome data previously generated for this cohort by
providing data on species-level taxonomic annotation for specific bacteria of interest that were
only identified to genus level via 16S sequencing.
3.1. Bacterial reference strains
The ATCC reference strains Lactobacillus gasseri (ATCC 9857), Lactobacillus crispatus
(ATCC 33197), and Lactobacillus jensenii (ATCC 25258) were kindly provided by Remy
Froissart PhD., from the Division of Virology, University of Cape Town. The ATCC reference
strains Lactobacillus iners Strain UPII 143-D (Product sheet HM-126), Gardnerella vaginalis
Strain UPII 315-A (Product sheet HM-133) and Prevotella bivia Strain DNF00188 (Product
sheet HM-1088) were obtained from BEI Resources, Manassas USA.
The bacterial reference strains were used as positive controls and to perform absolute
quantification by constructing standard curves with genomic DNA extracted from there strains.
3.1.1 Bacterial Culturing
3.1.1.1 Lactobacillus spp. growth conditions
Lactobacillus gasseri (ATCC 9857), L. jensenii (ATCC 25258) and L. crispatus (ATCC 33197)
were cultured in a sterile broth composed of 51 g/L of De Man, Rogosa, Sharpe broth (MRS,
Sigma), 50 mg/l of L-Cysteine (Merck) and 1 ml of Tween 80 (Sigma) for a minimum of 48
hours at 37°C. The ATCC Lactobacillus strains were allowed to thaw for 20 minutes on ice, after
which a sterile tooth pick was used to culture 1.4 mL of MRS Broth in a 1.5 mL Eppendorf Tube
and incubated at 37°C. After 48 h of growth, the 1.5 mL Eppendorf with cultured MRS Broth
were vortexed briefly and transferred to a sterile 50 mL Falcon tube, which was topped up with

24
A. O. Breetzke
additional MRS Broth. The 50 mL Falcon tube was vortexed briefly and incubated at 37°C to be
used for DNA extraction.
A 1.5 mL Eppendorf Tube containing 1.4 mL cultured broth was centrifuged at 5500 RPM for 5
minutes and 900 µL of supernatant was discarded. After vortexing the pellet, 250 μl of 60%
glycerol (v/v) was added and vortexed briefly three times and subsequently stored at -80°C for
future use.
3.1.1.2 Lactobacillus iners, Prevotella bivia and Gardnerella vaginalis. growth conditions
Lactobacillus iners (UPII 143-D), Prevotella bivia (DNF00188) and Gardnerella vaginalis
(UPII 315-A) were cultured individually in reduced Schaedler Broth with 5% horse blood for a
minimum of 48 hours at 37°C. The three strains were allowed to thaw for 20 minutes on ice,
after which a sterile tooth pick was used to collect bacterial stock and culture 1.4 mL Schaedler
Broth with 5% horse blood in a 1.5 mL Eppendorf tube and incubated at 37°C for 48 h, followed
by brief vortexing and transferred to a sterile 50 mL Falcon tube which was topped up with
additional Schaedler Broth with 5% horse blood. The 50 mL Falcon tube was vortexed briefly
and incubated for a minimum of 48 hours at 37°C to be used for DNA extraction.
3.1.2 DNA Extraction
DNA was extracted from vaginal lateral wall swabs and bacterial cultures using two different
kits, both designed to lyse the cell walls of Gram positive and Gram negative bacterium.
The MoBio Powersoil® DNA Isolation Kit (MoBio Laboratories, Inc., USA, Biocom Biotech,
SA) was used to extract bacterial DNA from the vaginal lateral wall swabs. Briefly, bacterial cell
walls were lysed with buffer C1 which contains sodium dodecyl sulfate (SDS) detergent that
breaks down fatty acids and disrupts the bacterial cell walls, and by mechanical disruption (bead
beating). Buffers C2 and C3 contain inhibitors that remove sample contaminants including non-
DNA organic and inorganic material and proteins. Buffer C4 selectively binds DNA to the silica
filters thus further excluding contaminants during the wash step. The final ethanol-based wash
buffer C5 is the final step in removing any excess contaminants within the sample DNA.
The Qiagen Blood and Tissue DNA Maxi Extraction Kit with buffers B1 and B2 (Whitehead
Scientific (Pty) Ltd, Cape Town), was used to extract DNA from bacterial cultures. Proteinase

25
A. O. Breetzke
K, which cleaves peptide bonds, was used to digest proteins, and RNase A to digest RNA (at the
C and U residues). Lysozyme was used to lyse bacterial cell walls – more specifically
peptidoglycan, which is found in both Gram-negative and –positive bacteria, but is most
effective against the latter. Buffer B1 contains Tween 20 and Triton X-100, which are
polyethylene and polyethylene oxide surfactants respectively, which act in conjunction with
lysozyme to lyse bacterial cell walls. Buffer B2 contains Tween 20 and guanidine hydrochloride,
a chaotropic agent that denatures proteins.
The quality and concentration of the DNA was confirmed with Qubit Fluorometric Quantitation
(ThermoFisher Scientic Inc, 200 Smit Street, Fairland, 2195 Johannesburg, South Africa), using
the Picogreen target-specific fluorescent dye, High Sensitivity dsDNA assay as per the user
manual.
3.1.3 Primer Design
The species-specific primers used for the detection of each of the bacterial species of interest
within this study were either sourced from the literature or designed de novo (Table 3.1.1). The
specificity for all primers was confirmed using NCBI Primer BLAST website (National Center of
Biotechnology Information, National Institute of Health, Bethesda, MD), Ribosomal Database
Project Probe Design (http:// www.rdp.cme.msu.edu/) and PriSM Primer Designing Tool. All
primers were obtained from Integrated DNA Technologies Inc., Coralville, IA.
Table 3.1.3: Primers of the target genes for detection of bacteria of interest and protocol source
of PCR and qPCR.
Bacteria
Primers
Reference
Forward (5’-3’) Reverse (5’-3’)
Lactobacillus
crispatus
TGCGACGCAAAG
CTGAAACA
AATGCTTCACGCG
CAAGGTT
(Byun et al. 2004; Jespers et
al. 2012)
Lactobacillus
jensenii
AAGTCGAGCGAG
CTTGCCTATAGA
CTTCTTTCATGCGA
AAGTAGC
(Jespers et al. 2012;
Tamrakar et al. 2007)
Lactobacillus GTCTGCCTTGAA ACAGTTGATAGGC (De Backer et al. 2007;
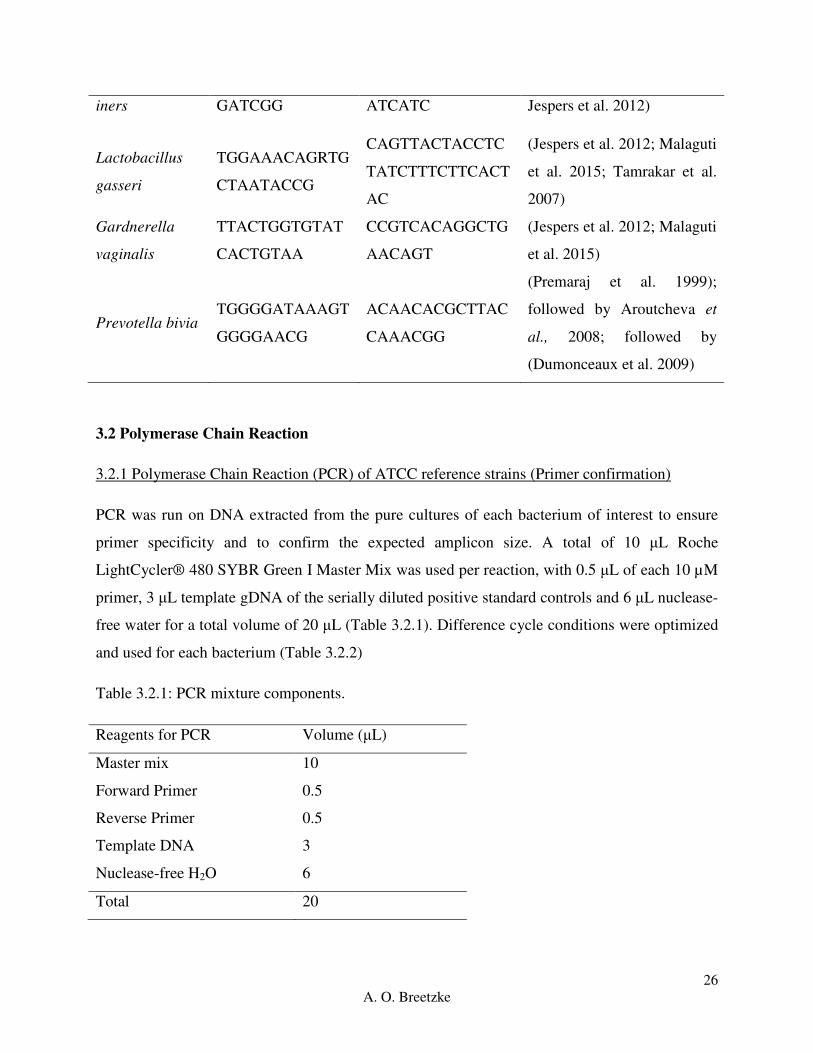
26
A. O. Breetzke
iners GATCGG ATCATC Jespers et al. 2012)
Lactobacillus
gasseri
TGGAAACAGRTG
CTAATACCG
CAGTTACTACCTC
TATCTTTCTTCACT
AC
(Jespers et al. 2012; Malaguti
et al. 2015; Tamrakar et al.
2007)
Gardnerella
vaginalis
TTACTGGTGTAT
CACTGTAA
CCGTCACAGGCTG
AACAGT
(Jespers et al. 2012; Malaguti
et al. 2015)
Prevotella bivia TGGGGATAAAGT
GGGGAACG
ACAACACGCTTAC
CAAACGG
(Premaraj et al. 1999);
followed by Aroutcheva et
al., 2008; followed by
(Dumonceaux et al. 2009)
3.2 Polymerase Chain Reaction
3.2.1 Polymerase Chain Reaction (PCR) of ATCC reference strains (Primer confirmation)
PCR was run on DNA extracted from the pure cultures of each bacterium of interest to ensure
primer specificity and to confirm the expected amplicon size. A total of 10 μL Roche
LightCycler® 480 SYBR Green I Master Mix was used per reaction, with 0.5 μL of each 10 µM
primer, 3 μL template gDNA of the serially diluted positive standard controls and 6 μL nuclease-
free water for a total volume of 20 μL (Table 3.2.1). Difference cycle conditions were optimized
and used for each bacterium (Table 3.2.2)
Table 3.2.1: PCR mixture components.
Reagents for PCR Volume (μL)
Master mix 10
Forward Primer 0.5
Reverse Primer 0.5
Template DNA 3
Nuclease-free H2O 6
Total 20

27
A. O. Breetzke
Table 3.2.2: PCR conditions and amplicon size of the target gene for the six bacteria of interest.
Bacteria Initial
Denaturation
Denaturation Annealing Extension Cycles Amplicon
size (bp)
Time
(min)
Temp
( C)
Time
(sec)
Temp
( C)
Time
(sec)
Temp
( C)
Time
(sec)
Temp
( C)
Lactobacillus
crispatus 15 95 15 95 60 60 20 72 45 172
Lactobacillus
jensenii 15 95 15 95 55 60 60 72 40 160
Lactobacillus
iners 15 95 15 95 55 60 60 65 35 158
Lactobacillus
gasseri 15 95 15 95 60 57 60 65 40 322
Gardnerella
vaginalis 15 95 45 95 45 55 45 72 50 330
Prevotella
bivia 5 95 20 95 120 60 300 74 35 156
3.2.2 Gel electrophoresis
Gel electrophoresis was used to confirm accuracy of the primers based on the size of the PCR
product and the presence of a single band. Amplified DNA (4 μL) was separated on 1.6%
agarose gel (Whitehead Scientific Agarose, #D1-LE) by electrophoresis in 1X TAE buffer (40
min, at 120 V). DNA was visualized with GelRed and viewed under a UV-Trans-illuminator. A
ThermoFisher O’Gene Ruler® 100 bp ladder was used for sizing of the PCR amplicon bands.
3.2.3 Serial dilution calculations for the known standard controls
In order to calculate the number of copies/µL of bacteria present in the extracted DNA for each
standard control, the method described by Dolezel et al., (2003) was used. Briefly, the
assumptions made are that the average weights for the nucleotide pairs AT and GC are 615.3830
and 616.3711 respectively, which can be converted to an absolute value through the

28
A. O. Breetzke
multiplication by the atomic mass unit (1 u) which is the equivalent of 12
C (1.660539x10⁻²⁷
kg).
Thus, the average weight of a single nucleotide pair can be calculated at 1.023x10⁻⁹
pg, where a
single picogram of DNA would be equivalent to 0.978x10⁹ base pairs.
Genome size (bp) = (0.978x10⁹
bp) x DNA content (pg)
DNA content (pg) = Genome size (bp) / (0.978x10⁹
bp)
Therefore, as an example, for L. crispatus the complete genome size is 2195108.667 bp (Table
3.2.5) DNA content (pg) = 2195108.667 bp / (0.978x10⁹
bp)
= 0.002244487 pg
1 ng DNA from L. crispatus contains = 1000 pg / DNA content (pg)
= 1000 pg / 0.002244487 pg
= 445,536.0296 copies
L. crispatus DNA concentration = 290 ng/µL
The number of copies of DNA per µL = Number of copies DNA x DNA concentration (ng/µL)
= 445,536.0296 copies x 290 ng/µL
= 129 205 448.6 copies/µL
C1V1 = C2V2
(129 205 448.6 copies/µL) x V1 = (106 copies/µL)x(1000 µL)
V1 = ((106 copies/µL) x (1000 µL)) / (129 205 448.6 copies/µL)
V1 = 7.739 µL
Therefore 7.739 µL of L. crispatus DNA was added to 992.261 µL distilled water to dilute it to
106 copies/µL. From there the DNA was serially diluted from 10
6 copies/µL down to 10
-2
copies/µL.

29
A. O. Breetzke
The calculations for the six bacterial reference strains can be seen below in Table 3.2.3. See table
3.5.2 for data transformation software.
Table 3.2.3: Serial dilution calculation summary table.
Bacteria ID Code [DNA]
(ng/µL)
DNA content
(pg)
Copies in 1
ng DNA
Copies of
DNA/µL
Volume of DNA into 1
mL for 10^6 copies/µL
L. crispatus 33820 290 0.00224449 445536.030 129205449 7.739611688
L. jensenii 25258 870.6 0.00169902 588576.408 512414620 1.951544629
L. gasseri 9857 321 0.00201423 496468.302 159366325 6.274851359
L. iners UPII
143-D 19.72 0.00132327 755703.271 14902469 67.10297695
G. vaginalis UPII
315-A 4.28 0.00163010 613458.066 2625600.5 380.8652505
Volume of DNA into 40
µL for 10^6 copies/µL
P. bivia DNF00188 2.773 0.00254910 392295.603 1087966.47 36.7658
*For all calculations, 1 pg of DNA was considered to have 0.97x10
9 bp as per the explanation
above in 3.2.3. See table 3.5.2 for data transformation software.
Table 3.2.4: Calculation and source for the whole genome size for each bacterium.
Bacteria Source NCBI Accession Number Number of
sources
Average
whole
genome size
(bp)
L.
crispatus
ATCC PRJNA30641, PRJNA37951, PRJNA38361,
PRJNA38513, PRJNA36325, PRJNA42533,
PRJNA52107, PRJNA52105, PRJNA222257,
PRJNA200566,PRJNA267549, PRJNA213996,
PRJDB800, PRJEA46813, PRJNA40665,
15 2195108.67
L.
jensenii
ATCC PRJNA31205, PRJNA37953, PRJNA38515,
PRJNA38645,PRJNA231005,PRJNA231005,PRJNA
231005,PRJNA231005, PRJNA231005,
14 1661636.43

30
A. O. Breetzke
PRJNA231005, PRJNA222257,PRJNA34097,
PRJNA213997, PRJNA31493, PRJNA219715,
PRJNA31487,
L.
gasseri
ATCC PRJNA42535, PRJNA42543, PRJNA203137,
PRJNA36379, PRJNA163367,PRJNA208361,
PRJDB635, PRJNA267549, PRJNA267549,
PRJNA31203, PRJNA40683, PRJNA84,
PRJNA53061, PRJNA52039, PRJNA52037,
14 1969914.29
L. iners BEI PRJNA52035, PRJNA52033, PRJNA52031,
PRJNA43549, PRJNA52041, PRJNA52043,
PRJNA52045, PRJNA52047, PRJNA60373,
PRJNA60375, PRJNA222257,PRJNA288563,
16 1294158.75
G.
vaginalis
BEI PRJNA31001, PRJNA51067, PRJDB63,
PRJNA52029,PRJNA181326,PRJNA181325,
PRJNA181324,PRJNA181323,PRJNA181322,
PRJNA181321,PRJNA181320,PRJNA181319,
PRJNA181318,PRJNA181317,PRJNA181316,
PRJNA181315, PRJNA181314,PRJNA181313,
PRJNA181312, PRJNA53359, PRJNA53893,
PRJNA40893, PRJNA40895, PRJNA52049,
PRJNA42431, PRJNA42443, PRJNA42445,
PRJNA42451, PRJNA42435, PRJNA42437,
PRJNA42441,
PRJNA42447,PRJNA42449,PRJNA42453,
PRJNA42455,PRJNA267549, PRJNA294071,
PRJNA46675, PRJNA267549,PRJNA267549,
PRJNA267549, PRJNA42439
43 1594241
P. bivia BEI PRJNA31377, PRJNA187523, PRJNA219670,
PRJNA219665, PRJNA50753
5 2493018

31
A. O. Breetzke
3.3 qPCR Optimization
Optimization was undertaking by adjusting the following parameters of the previously published
qPCR protocols (Table 3.1.3):
1. Protocol
Protocols- for each bacterial species of interest were found in the literature and run as
published for the first trial run. Thereafter, parameters were manipulated; including
primer concentration, annealing temperature, cycle number and sequence as a last step in
order to achieve acceptable standard curves with low levels of primer dimers, error values
and high efficiency values, as outlined below. If the protocol could not be improved upon
by manipulating these parameters, a new protocol from another published article was
used and the same steps followed as mentioned below to optimize.
2. Primer optimization
Prior to use in the wet lab, primers were first tested in silico using NCBI Primer BLAST
to ensure primer specificity and a low level of self-complementarity. Thereafter, a PCR
trial run was performed. If the primers amplified the correct product size in a PCR trial
run they were kept for further qPCR optimization. If the primers were found to be
consistent and sensitive, they were used to construct a standard curve.
The primer concentration was further optimized by applying different starting
concentrations. The optimum primer concentration was determined based on lower error
and higher efficiency values in the standard curves.
3. Annealing temperature optimization
The annealing temperature used in the literature was used for the first qPCR trial run. If
the DNA started amplifying at a later cycle number than anticipated, the temperature was
then increased slightly to try and improve on protocol sensitivity.

32
A. O. Breetzke
4. Cycle number optimization
The first trial run qPCR was run with the number of cycles specified in the literature. If
the DNA amplified at a later cycle number than anticipated, of which a possible cause is
low DNA concentration, the cycle number was increased to by no more than 20 cycles to
ensure complete amplification of the sample and standard DNA.
5. Initial denaturation
The initial denaturing temperature was found to be 95 C in all protocols used. The
temperature was kept the same when optimizing, however, the time the denaturation
cycle ran was adjusted when it was found the DNA did not amplify sufficiently after the
initial and cycle denaturation.
6. Serially diluted standards
Positive controls (DNA extracted from each reference strain) were diluted to 106
copies/µL from the stock DNA and then serially diluted down to 100
copies/µL. If there
were issues with the precision or accuracy of the standard replicates, the DNA was re-
serially diluted in order to improve the standard curve error and efficiency. The goal error
and efficiency values were <0.05 and 2, respectively.
After optimization for each bacterium, the final qPCR cycle conditions were determined (Table
3.2.7).
3.3.1 qPCR Optimization Outcomes
Multiple plates were run with different conditions until the error and efficiency values were as
close to 0.05 and 2 respectively, as could be optimized. A summary of the plate errors and
efficiencies for each step in the optimization process can be found in Table 3.3.1. All
optimization plates are named as V1 with the point number indicating the number of plate
replicate for each bacterium.

33
A. O. Breetzke
Table 3.3.1: Summary table for the optimization statistics for the following bacteria.
Bacteria qPCR Plate Error Efficiency
L. crispatus V1.1 0.565 1.705
V1.2 2.322 0.00
V1.3 1.141 1.717
V1.4 (750 nM) 1.301 1.358
(500 nM) 0.221 1.628
(250 nM) 0.223 1.985
V1.5 0.219 1.783
V1.6 0.731 1.699
V1.7 0.177 1.890
L. gasseri V1.1 0.0223 1.828
V1.2 0.0436 1.851
V1.3 0.0442 1.839
L. jensenii V1.1 0.312 1.864
V1.2 0.0210 1.921
L. iners V1.1 0.0335 2.022
V1.2 0.0805 1.953
G. vaginalis V1.1 0.370 1.835
V1.2 0.248 1.733
V1.3 0.351 1.671
V1.4 0.242 1.719
V1.5 0.157 1.875
V1.6 0.204 1.766
P. bivia V1.1 1.191 0.997
V1.2 0.306 2.393
V1.3 0.823 1.714
V1.4 0.589 1.765
V1.5 0.283 1.983
V1.6 0.0376 1.904
V1.7 0.210 2.089
V1.8 0.419 2.294
V1.9 0.393 2.049
V1.10 0.628 1.550
V1.11 0.618 2.922
V1.12 0.0830 2.039
V1.13 0.0608 1.993

34
A. O. Breetzke
The qPCR optimization process outcomes for the three bacterium L. crispatus, G. vaginalis and
P. bivia have been included as an example. The optimization process outcomes for the other
bacterium have been recorded in Appendix C, qPCR Optimization.
3.3.2 Lactobacillus crispatus
A total of seven qPCR plates were run in order to optimize the cycle conditions for L. crispatus
to get the error close to 0.05, the efficiency to 2.00, single melt curve peaks and clear
amplification curves for the standard control. The first trial plate run for L. crispatus (V1.1)
contained 10 µL SYBR Green I master mix, 1.5 µL of both the forward and reverse 10 µM
primers to give a final concentration of 750 nM, 5 µL for each positive controls and
corresponding amounts of Nuclease Free Water (NFW) to make up the total volume to 20 µL.
The positive control was diluted from 106 copies/µL to 10
-2 copies/µL. Each sample was run in
triplicate, with the NTC containing all the reagents minus the template gDNA or the known
standard DNA. The participant sample W132 V1 A was run in triplicate of initial concentrations
of 10 ng/µL, 7 ng/µL, 5 ng/µL, 2.5 ng/µL and 1 ng/µL. The following qPCR conditions were
followed, 95 C for 15 min initial denaturation, followed by 40 cycles of 95 C for 15 s, 60 C for 1
min and 72 for 20 s (Figure 3.3.2.1 A, Figure 3.3.2.2 A). However, the error and efficiency
values for the standard curve were not specific enough and the triplicates of the positive control
DNA did not amplify neatly where the replicates started amplifying at different cycles.
Therefore a few changes were made to the second trial plate for L. crispatus (V1.2) which was
run with the same volumes and concentrations of reagents, standard control dilutions and
participant sample W132 V1 A as mentioned in V1.1 except for the standard positive controls
which were run in triplicate, but two of the triplicates had gDNA that had gone through PCR
amplification using the same primers prior to qPCR and one replicate had gDNA that had not
gone through qPCR prior to amplification in order to ensure the starting concentrations were
sufficient. Furthermore, two different primer concentrations were run, 3 µM and 0.5 µM which
resulted in final primer concentrations of 225 nM and 37.5 nM respectively to determine the
ideal concentration of primer for amplification. The following qPCR conditions were followed,
95 C for 5 min initial denaturation, followed by 40 cycles of 95 C for 20 s, 60 C for 45 s and 72

35
A. O. Breetzke
for 15 s (Figure 3.3.2.1 B, Figure 3.3.2.2 B). This resulted in the positive control DNA forming
odd amplification curves with only the two highest dilutions amplifying sufficiently, as well as a
standard curve with poor error and efficiency values.
The third trial plate for L. crispatus (V1.3) contained the same reagent conditions as V1.1,
except for the use of 1 µL of each primer, 3 µL of the standard control and sampled DNA was
used. The participant sample W132 V1 A DNA concentrations were also varied; 1 ng/µL and 0.5
ng/µL to determine the minimum concentration for amplification. The ATCC positive bacterial
control standards included dilutions from 106 copies/µL to 10
1 copies/µL. The following qPCR
conditions were followed, 95 C for 5 min initial denaturation, followed by 40 cycles of 95 C for
15 s, 60 C for 20 s and 72 C for 10 s (Figure 3.3.2.1 C, Figure 3.3.2.2 C). This led to a high error
rate and differences in the replicates for the positive control dilutions. The fourth trial plate for L.
crispatus (V1.4) had the same cycle conditions and reagent volumes as V1.3 with some changes.
Varying volumes of both the forward and reverse 10 µM primers, 0.5 µL, 1 µL and 1.5 µL were
used to give a final concentration of 250 nM, 500 nM and 750 nM, in order to determine the
most ideal primer concentration as well as the inclusion of sample W037 V1 which had high
levels of lactobacilli bacteria present with 16S sequencing (Figure 3.3.2.1 D, Figure 3.3.2.2 D).
The dilution of the primers to 250 nM resulted in the best error and efficiency readings for the
standard curve.
For the fifth trial plate for L. crispatus (V1.5), the same cycle conditions were used as in V1.4
with 0.5 µL of both the forward and reverse 10 µM primers, positive controls diluted from 106
copies/ L to 10-2
copies/µL and the annealing temperature was reduced from 60 C to 58 C to try
reduce the formation of primer dimers with the remaining conditions the same as V1.4 (Figure
3.3.2.1 E, Figure 3.3.2.2 E). The error value was higher than ideal with the replicates of the
standards failing to amplify at concurrent cycles. The sixth trial plate for L. crispatus (V1.6) was
run with the same reagent concentration and volumes, as well as the conditions with the adjusted
annealing temperature as were used for V1.5. The positive control DNA was re-diluted to try
improve accuracy and prevent the delay in the amplification between 105
copies/µL and 104
copies/µL (Figure 3.3.2.1 F, Figure 3.3.2.2 F). The second dilution did not improve replicate
accuracy, and resulted in an increase in the standard curve error value. The seventh and final trial
plate for L. crispatus (V1.7) used the same reagents and DNA in the same concentrations as used

36
A. O. Breetzke
in V1.6 with the standard control dilutions from 106 copies/µL to 10
0 copies/µL. New species
specific primers for L. crispatus were designed targeting the transcription start site, tested with a
PCR by running the product on a gel and confirming the product size and presence of a single
band (Figure 3.3.2.1 G, Figure 3.3.2.2 G). This resulted in error and efficiency values of
sufficient readings with the replicates of the positive control dilutions amplifying more
accurately.
B – Plate V1.2
Error: 2.322
Efficiency: 0.00
C – Plate V1.3
Error: 1.141
Efficiency: 1.717
D – Plate V1.4
750 nM
Error: 1.301
Efficiency: 1.358
500 nM
Error: 0.221
Efficiency: 1.628
250 nM
Error: 0.223
Efficiency: 1.985
A – Plate V1.1
Error: 0.565
Efficiency: 1.705
E – Plate V1.5
Error: 0.219
Efficiency: 1.783
F – Plate V1.6
Error: 0.731
Efficiency: 1.699
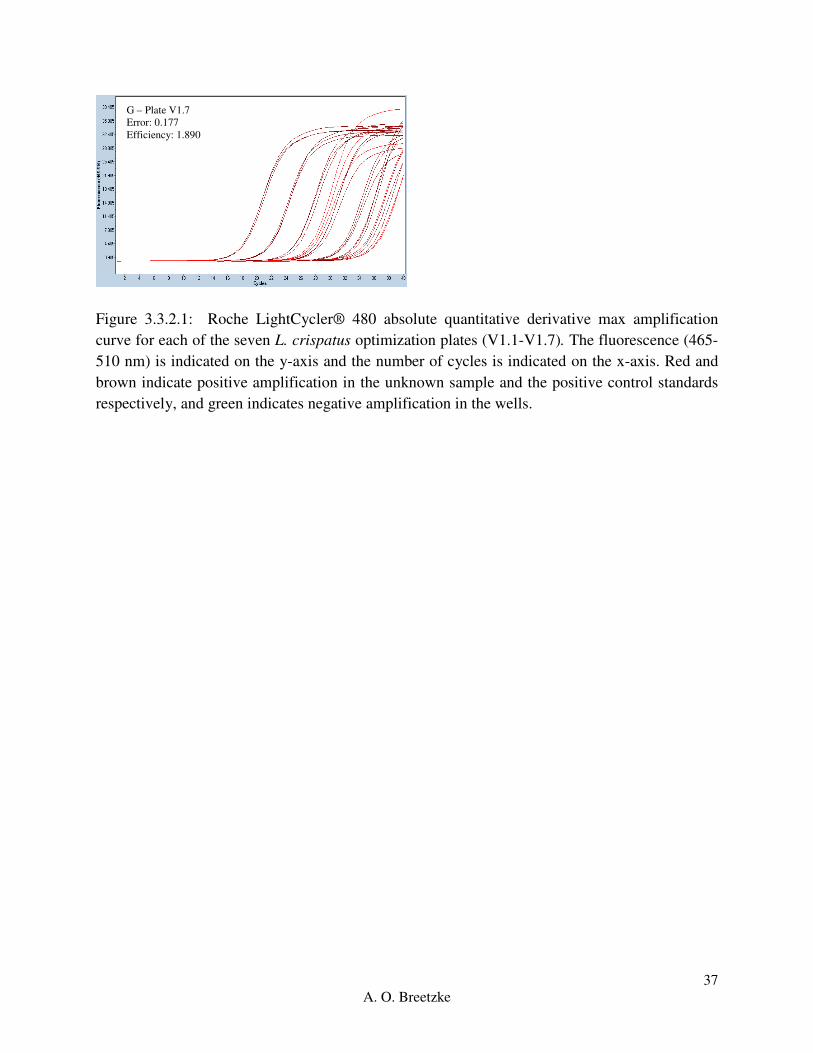
37
A. O. Breetzke
Figure 3.3.2.1: Roche LightCycler® 480 absolute quantitative derivative max amplification
curve for each of the seven L. crispatus optimization plates (V1.1-V1.7). The fluorescence (465-
510 nm) is indicated on the y-axis and the number of cycles is indicated on the x-axis. Red and
brown indicate positive amplification in the unknown sample and the positive control standards
respectively, and green indicates negative amplification in the wells.
G – Plate V1.7
Error: 0.177
Efficiency: 1.890

38
A. O. Breetzke
Figure 3.3.2.2: Roche LightCycler® 480 melt curve for each of the seven L. crispatus
optimization plates (V1.1-V1.7). The –d/dT fluorescence (465-510 nm) is indicated on the y-axis
and the temperature ( C) is indicated on the x-axis. Red indicates a single peak (product), green
indicates two peaks and blue indicates no peak for each well.
A similar process was followed for L. gasseri, L. jensenii and L. iners. The first optimization
plate for L. gasseri, L. jensenii and L. iners was run using the final reagent concentration and
A – Plate V1.1
B – Plate V1.2
D – Plate V1.4
C – Plate V1.3
G – Plate V1.7
F – Plate V1.6
E – Plate V1.5

39
A. O. Breetzke
volumes as those in the seventh plate of L. crispatus V1.7 as the lactobacilli species have very
similar optimal qPCR conditions. Optimization for the other lactobacilli species required far less
trouble-shooting. (See appendix C, qPCR Optimization).
3.3.3 Gardnerella vaginalis
In order for the qPCR conditions of G. vaginalis to be optimized, six different trial plates were
run to get the best error and efficiency values. The first trial plate for G. vaginalis (V1.1) was run
using the same reagent and DNA volumes and concentrations as used in the L. crispatus final
trial plate (V1.7) with the following qPCR conditions; 95 C for 15 min for the initial
denaturation of the DNA followed by 50 cycles if 95 C for 45 s, 55 C for 45 s, and 65 C for 45 s
(Figure 3.3.3.1 A, Figure 3.3.3.2 A). The first six serial dilutions of the positive control amplified
well, however the lower dilutions did not reach the same amplification and the replicates did not
at consistent cycles. The second trial plate (V1.2) was run with a final extension temperature of
72 C for 45 s in order to try improve primer specificity (Figure 3.3.3.1 B, Figure 3.3.3.2 B) with
little improvement and high levels of primer dimerization, while the third trial plate (V1.3) was
run using the same conditions as the previous trial plate (V1.2), but for 40 cycles in an attempt to
accurately amplify the lower dilutions of the positive control DNA (Figure 3.3.3.1 C, Figure
3.3.3.2 C). Since tis did not seem sufficient, the fourth trial plate (V1.4) was run using the same
conditions for 60 cycles (Figure 3.3.3.1 D, Figure 3.3.3.2 D). The increase in cycle number did
not amplify the low dilutions of the positive control DNA to the same degree as the higher
dilutions with an increase in primer dimers and thus the fifth trial plate (V1.5) was run using the
same conditions as used in the first trial plate (V1.1), with a change in cycle conditions. The
following qPCR conditions were followed, 95 C for 15 min for the initial denaturation of the
DNA followed by 50 cycles if 95 C for 30 s, 60 C for 1 min, and 72 C for 45 s (Figure 3.3.3.1 E,
Figure 3.3.3.2 E). This change improved the height of the amplification curves for the lower
dilutions, but not the accuracy of replicate starting cycle number. The sixth trial plate (V1.6)
served as a repeat for the fifth trial plate (V1.5) to confirm the error and efficiency values (Figure
3.3.3.1 F, Figure 3.3.3.2 F). The error and efficiency values were the most consistent and as close
to the ideal conditions as possible with a decent standard curve.

40
A. O. Breetzke
Figure 3.3.3.1: Roche LightCycler® 480 absolute quantitative derivative max amplification
curve for each of the six G. vaginalis optimization plates (V1.1-V1.6). The fluorescence (465-
510 nm) is indicated on the y-axis and the number of cycles is indicated on the x-axis. Red and
brown indicate positive amplification in the unknown sample and the positive control standards
respectively, and green indicates negative amplification in the wells.
A – Plate V1.1
Error: 0.370
Efficiency: 1.835
B – Plate V1.2
Error: 0.248
Efficiency: 1.733
F – Plate V1.6
Error: 0.204
Efficiency: 1.766
E – Plate V1.5
Error: 0.157
Efficiency: 1.875
D – Plate V1.4
Error: 0.242
Efficiency: 1.719
C – Plate V1.3
Error: 0.351
Efficiency: 1.671

41
A. O. Breetzke
Figure 3.3.3.2: Roche LightCycler® 480 melt curve for each of the six G. vaginalis optimization
plates (V1.1-V1.6). The –d/dT fluorescence (465-510 nm) is indicated on the y-axis and the
temperature ( C) is indicated on the x-axis. Red indicates a single peak (product), green indicates
two peaks and blue indicates no peak for each well.
3.3.4 Prevotella bivia
A total of thirteen trial plates were necessary to optimize the cycle conditions for P. bivia. The
first trial plate for P. bivia (V1.1) was consistent with the other five bacterium in that it was run
using the same reagent volumes and concentrations as the final trial plate for L. crispatus (V1.7)
with the adjusted qPCR cycles conditions of 95 C for 15 min as the initial denaturation of the
DNA followed by 35 cycles of 95 C for 20 s, 60 C for 2 min and 74 C for 5 min using the first
set of primers F 5’ GAACGATTTAGAGATAATGAGGTCC 3’ and R 5’
A – Plate V1.1
B – Plate V1.2
D – Plate V1.4
C – Plate V1.3
F – Plate V1.6 E – Plate V1.5
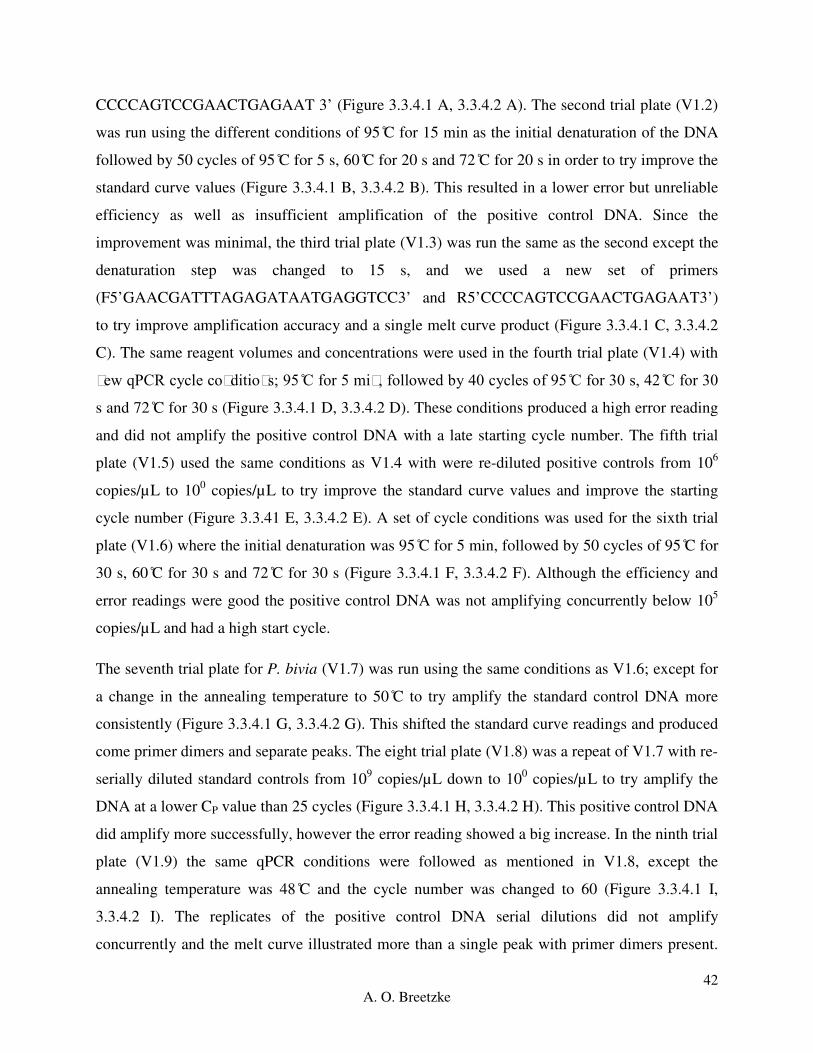
42
A. O. Breetzke
CCCCAGTCCGAACTGAGAAT 3’ (Figure 3.3.4.1 A, 3.3.4.2 A). The second trial plate (V1.2)
was run using the different conditions of 95 C for 15 min as the initial denaturation of the DNA
followed by 50 cycles of 95 C for 5 s, 60 C for 20 s and 72 C for 20 s in order to try improve the
standard curve values (Figure 3.3.4.1 B, 3.3.4.2 B). This resulted in a lower error but unreliable
efficiency as well as insufficient amplification of the positive control DNA. Since the
improvement was minimal, the third trial plate (V1.3) was run the same as the second except the
denaturation step was changed to 15 s, and we used a new set of primers
(F5’GAACGATTTAGAGATAATGAGGTCC3’ and R5’CCCCAGTCCGAACTGAGAAT3’)
to try improve amplification accuracy and a single melt curve product (Figure 3.3.4.1 C, 3.3.4.2
C). The same reagent volumes and concentrations were used in the fourth trial plate (V1.4) with
new qPCR cycle conditions; 95 C for 5 min, followed by 40 cycles of 95 C for 30 s, 42 C for 30
s and 72 C for 30 s (Figure 3.3.4.1 D, 3.3.4.2 D). These conditions produced a high error reading
and did not amplify the positive control DNA with a late starting cycle number. The fifth trial
plate (V1.5) used the same conditions as V1.4 with were re-diluted positive controls from 106
copies/µL to 100 copies/µL to try improve the standard curve values and improve the starting
cycle number (Figure 3.3.41 E, 3.3.4.2 E). A set of cycle conditions was used for the sixth trial
plate (V1.6) where the initial denaturation was 95 C for 5 min, followed by 50 cycles of 95 C for
30 s, 60 C for 30 s and 72 C for 30 s (Figure 3.3.4.1 F, 3.3.4.2 F). Although the efficiency and
error readings were good the positive control DNA was not amplifying concurrently below 105
copies/µL and had a high start cycle.
The seventh trial plate for P. bivia (V1.7) was run using the same conditions as V1.6; except for
a change in the annealing temperature to 50 C to try amplify the standard control DNA more
consistently (Figure 3.3.4.1 G, 3.3.4.2 G). This shifted the standard curve readings and produced
come primer dimers and separate peaks. The eight trial plate (V1.8) was a repeat of V1.7 with re-
serially diluted standard controls from 109 copies/µL down to 10
0 copies/µL to try amplify the
DNA at a lower CP value than 25 cycles (Figure 3.3.4.1 H, 3.3.4.2 H). This positive control DNA
did amplify more successfully, however the error reading showed a big increase. In the ninth trial
plate (V1.9) the same qPCR conditions were followed as mentioned in V1.8, except the
annealing temperature was 48 C and the cycle number was changed to 60 (Figure 3.3.4.1 I,
3.3.4.2 I). The replicates of the positive control DNA serial dilutions did not amplify
concurrently and the melt curve illustrated more than a single peak with primer dimers present.

43
A. O. Breetzke
The tenth trial plate (V1.10) was a repeat of V1.9 with the alteration of the annealing temperature
to 46 C (Figure 3.3.4.1 J, 3.3.4.2 J) which resulted in a slight improvement in replicate accuracy
but not in the primer dimers and separate peaks within the melt curve. The eleventh trial plate
(V1.11) is a further repeat of V1.9 with newly designed primers F 5’
TGGGGATAAAGTGGGGAACG 3’ and R 5’ ACAACACGCTTACCAA 3’ (Figure 3.3.4.1 K,
3.3.4.2 K). This lead to the positive control DNA serial dilutions amplifying closer to each other
and the production of two distinct peaks in the melt curve. For the twelfth trial plate (V1.12)
same qPCR conditions as V1.9 were used, with the change of the annealing temperature to 48 C,
and two sets of serially diluted standard DNA were run. P. bivia was re-cultured, DNA extracted
and serially diluted as well as the standards from 109 copies/µL were diluted down to 10
0 copies/
µL (Figure 3.3.4.1 L, 3.3.4.2 L), resulting in acceptable error and efficiency values and a single
main melt curve peak with a lower abundance peak slightly shift. The thirteenth trial plate
(V1.13) was a repeat of V1.12 with the serially diluted standard DNA run from 106 copies/µL to
100
copies/ µL (Figure 3.3.4.1 M, 3.3.4.2 M). This final plate had sufficient error and efficiency
readings with neat positive control replicates.
A – Plate V1.1
Error: 1.191
Efficiency: 0.997
B – Plate V1.2
Error: 0.306
Efficiency: 2.393
D – Plate V1.4
Error: 0.589
Efficiency: 1.765
C – Plate V1.3
Error: 0.823
Efficiency: 1.714
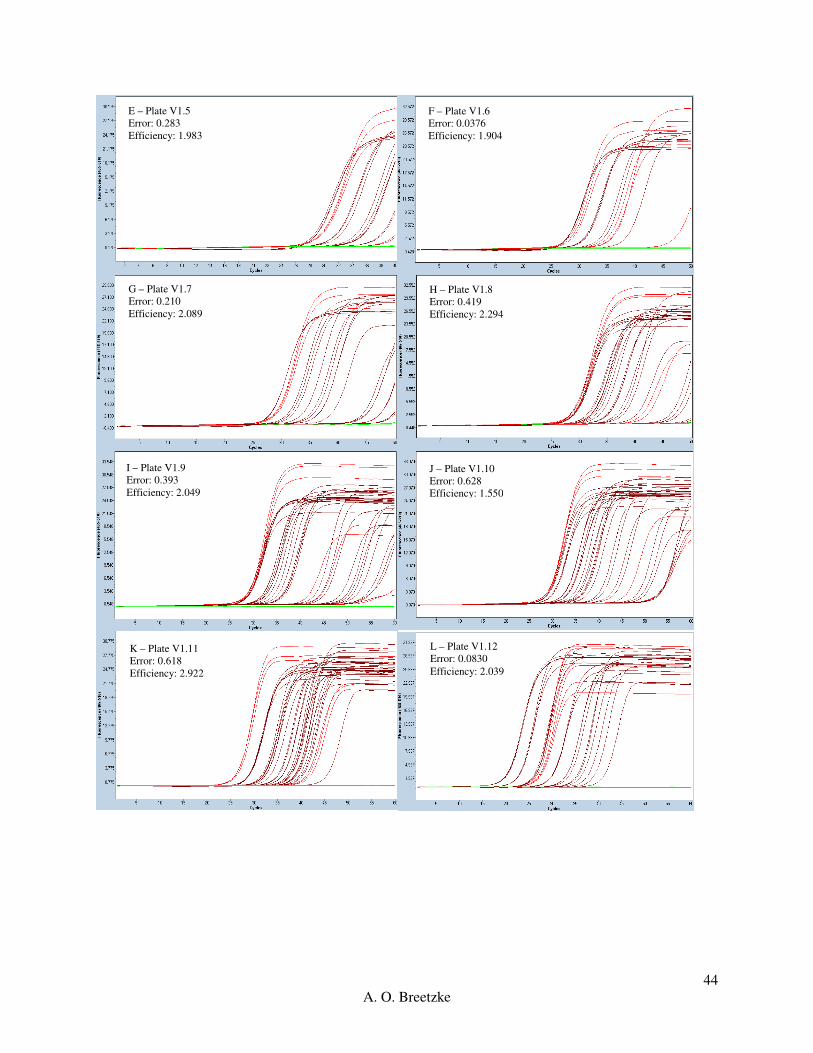
44
A. O. Breetzke
F – Plate V1.6
Error: 0.0376
Efficiency: 1.904
E – Plate V1.5
Error: 0.283
Efficiency: 1.983
G – Plate V1.7
Error: 0.210
Efficiency: 2.089
H – Plate V1.8
Error: 0.419
Efficiency: 2.294
I – Plate V1.9
Error: 0.393
Efficiency: 2.049
J – Plate V1.10
Error: 0.628
Efficiency: 1.550
L – Plate V1.12
Error: 0.0830
Efficiency: 2.039
K – Plate V1.11
Error: 0.618
Efficiency: 2.922

45
A. O. Breetzke
Figure 3.3.4.1: Roche LightCycler® 480 absolute quantitative derivative max amplification
curve for each of the thirteen P. bivia optimization plates (V1.1-V1.13). The fluorescence (465-
510 nm) is indicated on the y-axis and the number of cycles is indicated on the x-axis. Red and
brown indicate positive amplification in the unknown sample and the positive control standards
respectively, and green indicates negative amplification in the wells.
M – Plate V1.13
Error: 0.0608
Efficiency: 1.993
A – Plate V1.1 B – Plate V1.2
F – Plate V1.6 E – Plate V1.5
D – Plate V1.4 C – Plate V1.3

46
A. O. Breetzke
Figure 3.3.4.2: Roche LightCycler® 480 melt curve for each of the thirteen P. bivia optimization
plates (V1.1-V1.13). The –d/dT fluorescence (465-510 nm) is indicated on the y-axis and the
temperature ( C) is indicated on the x-axis. Red indicates a single peak (product), green indicates
two peaks and blue indicates no peak for each well.
M – Plate V1.13
G – Plate V1.7 H – Plate V1.8
I – Plate V1.9 J – Plate V1.10
L – Plate V1.12 K – Plate V1.11

47
A. O. Breetzke
It should be noted that there were major limitations with the accurate amplification of P. bivia
DNA due to the qPCR conditions coupled with inaccurate primers. The results were included in
this thesis, however, they cannot be relied upon and further work and experiments will need to be
run and optimized in future.
3.4 Real-Time PCR (qPCR) Protocol
Prior to PCR the laminar flow hood and pipettes were exposed to UV light to crosslink any
contaminant DNA, and the master mix was kept away from any light and DNA. The qPCR
master mix was prepared on ice in a 2 mL reaction tube by pipetting 10 μl of the LightCycler®
480 SYBR Green I Master Mix into each well of the LightCycler® 480 Multiwell Plate, along
with the relative amounts of PCR-grade water, forward primer and reverse primer (Table 3.4.1).
Reactions were mixed by aspiration.
Refer to Tables 3.1.3, 3.4.1 and 3.4.2 for qPCR conditions and primer sequences.
A 1 in 10 serial dilution of the gDNA isolated from each of the positive control reference ATCC
strains was prepared, ranging from 1x10⁶ copies/µL to 1x10
0 copies/µL. A volume of 9 μl
nuclease free water for the negative control, 3 µL gDNA template standard for the positive
control was added to the appropriate wells. The participant sample DNA was diluted to 0.5
ng/µL with TE Buffer, unless the DNA concentration was lower than 1 ng/µL, in which case
samples were used as is. Once the master mix, positive standard control and sample DNA, and
PCR-grade water had been added to the white multiwell plate, it was sealed with LightCycler®
480 Multiwell Sealing Foil. All non-template controls, positive controls and samples were run in
triplicate. The Multiwell Plate was placed in the centrifuge and centrifuged at 2500 x g for 2
minutes.
After the Multiwell Plate has been spun down, the qPCR cycle is run using the Roche
LightCycler® 480 based on the final conditions seen in Table 3.4.2, after optimization had been
completed.

48
A. O. Breetzke
Table 3.4.1: qPCR mixture components.
Component Final Concentration 1 reaction (μl)
Nuclease Free Water - 6
2X Master Mix 1x 10
10 μM Forward Primer 0.25 μM 0.5
10 μM Reverse Primer 0.25 μM 0.5
Template DNA 0.075 ng/µL 3
Total - 20
Table 3.4.2: qPCR Cycle Conditions after optimization.
Step Cycles Temperature (C) Time (sec)
Pre-incubation 1 95 5 min
Denaturation
L. crispatus
L. gasseri
L. jensenni
L. iners
G. vaginalis
P. bivia
Primer Annealing
L. crispatus
L. gasseri
L. jensenni
L. iners
G. vaginalis
P. bivia
Extension
L. crispatus
L. gasseri
45
40
40
40
50
60
95
95
95
95
95
95
60
57
60
60
60
48
72
65
15
15
15
15
30
30
20
60
55
55
60
30
10
60

49
A. O. Breetzke
L. jensenni
L. iners
G. vaginalis
P. bivia
Acquire data
72
65
72
72
80
60
60
45
30
1
Melting Curve Analysis
Denaturation
Re-Annealing
Melting
1
95
65
97
5
1 min
0.11 oC/second
Cooling 1 40 30 sec
3.5 Analysis
Triplicate values of the quantified unknown bacterial quantities (copies/µL) from the Roche
LightCycler® 480 output were averaged to get a single value. Vaginal DNA samples that had
one or two negative amplification readings in a triplicate, had primer dimers or showed separate
peaks on the melt curve analysis (indicating more than a single product), were re-run in a qPCR
through the Roche LightCycler II 480 ® to confirm the results (Table 3.5.1 and Table 3.5.2). All
of the triplicate samples that were re-run were averaged again and incorporated into the results as
replacement values. After the second set of qPCR, there were no further ambiguous results.
The below figure (Figure 3.5.1) illustrates an example of how the Non-Template Control,
Positive reference dilutions and WISH vaginal DNA samples were set up on a 96 Multiwell
plate.
1 2 3 4 5 6 7 8 9 10 11 12
A NTC NTC NTC 10^6 10^6 10^6 10^5 10^5 10^5 10^4 10^4 10^4
B 10^3 10^3 10^3 10^2 10^2 10^2 10^1 10^1 10^1 10^0 10^0 10^0
C W002
V1
W002
V1
W002
V1
W004
V1
W004
V1
W004
V1
W006
V1
W006
V1
W006
V1
W007
V1
W007
V1
W007
V1
D W008
V1
W008
V1
W008
V1
W009
V1
W009
V1
W009
V1
W010
V1
W010
V1
W010
V1
W011
V1
W011
V1
W011
V1

50
A. O. Breetzke
E W012
V1
W012
V1
W012
V1
W013
V1
W013
V1
W013
V1
W015
V1
W015
V1
W015
V1
W016
V1
W016
V1
W016
V1
F W017
V1
W017
V1
W017
V1
W021
V1
W021
V1
W021
V1
W022
V1
W022
V1
W022
V1
W023
V1
W023
V1
W023
V1
G W024
V1
W024
V1
W024
V1
W025
V1
W025
V1
W025
V1
W026
V1
W026
V1
W026
V1
W027
V1
W027
V1
W027
V1
H W028
V1
W028
V1
W028
V1
W030
V1
W030
V1
W030
V1
W031
V1
W031
V1
W031
V1
W032
V1
W032
V1
W032
V1
Figure 3.5.1: Example of a multi-well qPCR plate set out. Each non-template control (NTC),
Standards diluted from 106
copies/µL down to 100
copies/µL and the WISH participant vaginal
DNA are run in triplicate and the resulting value is the mean value of the three replicates.
The Roche LightCycler® quantified readings per bacteria were measured in copies/µL. The
average for each triplicate was calculated, followed by the conversion to copies/ng. The WISH
samples of a concentration higher than 0.5 ng/µL were standardized and diluted to 0.5 ng/µL,
while any samples of a lower concentration than 1 ng/µL were used as is.
For all statistical analyses, the raw values were used. For the bacterium that had zero quantified
values, half the lowest value was taken for each to replace the zero values for figure
representation (Table 3.4.1), after which the data was log10 transformed for analysis for
comparison between bacterial species with contrasting median values (copies/ng). The lowest
values for L. iners (copies/ng), G. vaginalis (copies/ng), and P. bivia (copies/ng) were above
zero and thus were not altered.
Table 3.5.1 Illustration of the replacement of the zero values with the replacement of half the
lowest positive quantified value (copies/ng) for each bacterium.
Quantified values (copies/ng) L. gasseri L. jensenii L. crispatus
Positive lowest value 0.052 0.00116 0.000297334
Copies/ng = copies/µL (Roche LightCycler reading) ÷ ng/µL (WISH participant reading)
= copies/µL x µL/ng
= copies/ng

51
A. O. Breetzke
Half positive lowest value 0.026 0.00058 0.000148667
*See table 3.6.2 for data transformation software.
The following comparisons were made in terms of the bacterial quantities (copies/ng) measured
in each WISH participant sample and the following cohort characteristics: BV (positive,
intermediate, negative); Inflammation (high, low); Age (16-18 years old, 19-22 years old);
Hormonal contraceptive (DMPA, Implanon, Nur Isterate), and STI (none, any one), Bacterial
(none, one two or more), Viral STI (none, one, two), HPV (none, low risk, high risk) (Table
3.6.2).
3.6 Statistical considerations
Three different statistical software programs were used to perform the data the data analyses as
mentioned above in 3.5 Analysis.
3.6.1 Statistical software used for data analysis
Table 3.6.1: Statistical software used in this study.
Software Objective
Roche LightCycler II 480 ® Data acquisition
Microsoft Excel 2010 Data cleaning
STATA® Version 12 (for Windows StataCorp
LP, College Station, TX77845, USA)
Inferential statistical analyses between the
bacteria quantities, cytokines and level of
inflammation
GraphPad Prism V5 (for Windows, GraphPad
Software, San Diego California USA)
Comparison of bacterial quantities between BV
groups, age groups and hormonal
contraceptives
3.6.2 Statistical tests used for data analysis in this study
The software Microsoft Excel was used to calculate the triplicate average of the raw quantified
data readings (copies/ng ) for all participant samples as measured for each of the bacterium.
52
A. O. Breetzke
These average values were then used in all downstream analyses and the log-transformed data
used to form figures.
The software STATA® V12 was used to perform a Shapiro-Wilk test to test if averaged
triplicate data was normally distributed or not. The data was log transformed when not normally
distributed (this was done to all the data as none of the data sets were normally distributed).
STATA® V12 was used to perform Two-sample Wilcoxon rank-sum (Mann-Whitney) tests in
order to compare the difference in bacterial quantities between the two group readings for each
inflammation (low and high), and age (16-18 and 19-22 years). STATA® V12 was used to
calculate the Spearman Rank correlation coefficient (rho) to determine if there was a correlation
between bacterial quantities and the 47 immunological factors, as well as to calculate the Beta-
coefficient Regression in order to determine if there was regression between bacterial quantity
and cytokines.
The software GraphPad Prism V5 was used to calculate the paired, non-parametric Friedman’s
ANOVA statistical test to compare the distribution of bacterial quantities across each category
group measured for the BV, hormonal contraceptive, bacterial and viral STI categories.
GraphPad Prism V5 was used to calculate the unpaired, non-parametric Kruskal-Wallis ANOVA
statistical test to compare the distribution of each bacterium across the three groups in the BV
(positive, intermediate, negative), hormonal contraceptive (Implanon, DMPA, Nur Isterate),
HPV (negative, low risk, high risk), bacterial (none, one, two or more) and viral STI (none, one,
two) categories.

53
A. O. Breetzke
3.6.3 Conceptual Framework:
This framework has been established as a visual representation of the hypothesis studied in this
thesis. As part of the first hypothesis, the green category groups on the left have been associated
with a healthy/normal FGT microbiome, while the red/orange category groups have been
associated with dysbiosis and an unhealthy FGT microbiome in the second hypothesis. The
orange intermediate and L. iners groups have been associated with dysbiosis and an unhealthy
FGT microbiome to a lesser degree than the other groups. These associations have been
hypothesize through the knowledge provided by published literature articles.
3.7 Sequencing and Analysis
Full Service sequencing was performed by Inqaba Biotechnical Industries (Pty) Ltd. PO Box
14356, Hatfield 0028, Pretoria, South Africa (http://www.inqababiotec.co.za/).
The sequences were visualized and the reverse compliment sequences formed using SnapGene
V3.2, GSL Biotech LLC (http://www.snapgene.com/).

54
A. O. Breetzke
The National Centre for Biotechnology Information (NCBI), U.S. National Library of Medicine,
8600 Rockville Pike, Bethesda MD, 20894 USA was used for two functions:
1. To Nucleotide BLAST (BLASTN) the sequences samples to determine what species
they are most related to (percentage identity)
(http://blast.ncbi.nlm.nih.gov/Blast.cgi?PAGE_TYPE=BlastSearch&BLAST_SPEC=
MicrobialGenomes).
2. To retrieve the reference strains used for alignment using the Nucleotide search
function through ( http://www.ncbi.nlm.nih.gov/nucleotide).
The samples sequenced were aligned using the EMBOSS Needle Nucleotide program and the
Primer BLAST program, run through European Molecular Biology Laboratory Bioinformatics
Institute (EMBL-EBI), Wellcome Genome Campus, Hinxton, Cambridgeshire, CB10 1SD, UK
(http://www.ebi.ac.uk/Tools/psa/emboss_needle/nucleotide.html).

55
A. O. Breetzke
Chapter 4: Results
This chapter serves as a summary of the optimization of the qPCR absolute quantification of the
key species of interest namely; L. crispatus, L. gasseri, L. jensenii, L. iners, G. vaginalis and P.
bivia and the subsequent results in relation to the BV status, inflammation levels, age, hormonal
contraceptive and STI status, bacterial versus viral STIs and HPV. Due to the fact that not all
samples had complete data, these results are based on varying samples sizes: n= 90 participants
for HPV, n=140 participants for inflammation levels and STI status, n=136 participants for
hormonal contraceptive, n=143 participants for BV, age, bacterial vs viral STIs and HPV
adolescent female participants from the Masiphumelele Desmond Tutu Youth Centre,
Masiphumelele.
The bacterium P. bivia could not accurately be identified at species level in this study. As such,
the following section indicates the steps taken in order to analyze the results. The log
transformed copies/ng readings for P. bivia have been included as a possible reference to the
other bacterium; however, they should not be relied upon.
4.1 P. bivia Sequencing
The qPCR products that were formed run across the five qPCR multiwall plates using the final
pair of P. bivia optimized primers showed increased levels of primer dimers and different
products present within the melt curves. As such, a set of 7 samples in total were sent for
sequencing with Inqaba Biotech in order to determine the cause of such high levels of variability.
Three NTC controls, a standard positive control sample and three random samples were taken in
a random selection of plates, rows, and replicate wells indicated by the number and letter
combination, and version (V2.) in the sample names, respectively.

56
A. O. Breetzke
4.1.1 NCBI Blast Analysis
The first step was to perform a nucleotide NCBI BLASTN 2.5.0 using a representative genome
reference sequence database for the forward and reverse compliment sequence for each sample
to identify what species the primer products are most closely related to (Table 4.1.1).
Table 4.1.1: NCBI BLASTN results for the seven samples sequenced.
Sample Sequence Base
Pairs
Number of
BLASTN hits
Top two BLASTN hits Percentage
Identity
(%)
Accession
Number
(NZ)
NTC A1
V2.0
Forward 499 NSSF - - -
Reverse
Compliment
496 NSSF - - -
NTC A3
V2.2
Forward 54 NSSF - - -
Reverse
Compliment
36 NSSF - - -
NTC A2
V2.4
Forward 156 NSSF - - -
Reverse
Compliment
130 NSSF - - -
10^5 A5
V2.1
Forward 147 188 P. bivia DSM 20514
Scfld 1
P. bivia DSM 20514
Scfld 3
99
99
JH660658.1
JH660660.1
Reverse
Compliment
116 178 P. bivia DSM 20514
Scfld 1
P. bivia DSM 20514
Scfld 3
100
100
JH660658.1
JH660660.1
W012 C8
V2.0
Forward 114 5 P. bivia DSM 20514
Scfld 3
P. bivia DSM 20514
Scfld 1
100
100
JH660660.1
JH660658.1
Reverse
Compliment
427 4 P. bivia DSM 20514
Scfld 1
P. bivia DSM 20514
Scfld 3
92
92
JH660658.1
JH660660.1
W125 E4
V2.3
Forward 428 12 P. stercorea
DSM18206 Scfld41
P. bivia DSM 20514
Scfld 1
100
100
Jh379355.1
JH660658.1
Reverse
Compliment
426 NSSF - - -

57
A. O. Breetzke
W174 F11
V2.4
Forward 116 5 P. bivia DSM 20514
Scfld 3
P. bivia DSM 20514
Scfld 1
94
94
JH660660.1
JH660658.1
Reverse
Compliment
412 4 P. bivia DSM 20514
Scfld 1
P. bivia DSM 20514
Scfld 3
90
90
JH660658.1
JH660660.1
*Scfld – Scaffold, NSSF – No significant similarities found.
The presence of amplification peaks within the NTC of the qPCR multiwall plates indicated
contamination. The contamination peaks amplified later between 40-50 cycles whereas the
sample DNA amplified between 10-35 cycles on average. It can be tentatively said that there was
no specific contaminating bacterial DNA amplifying within the NTC wells due to the peaks
having no identity with any bacterial species with the NCBI BLASTN. Further, there are large
differences in size (base pairs) between the three sets of forward and reverse compliment
sequences amplified by the primers, illustrating a strong lack of specificity. This could indicate
that the primer set designed was not accurate enough with non-specific products.
There was a common top hit of P. bivia strain DSM 20514 Scaffolds 1 and 3 as seen with the
forward and reverse compliment sequence of the standard control sample 10^5 A5 V2.1 with
99% and 100% percent respectively. However, only three of the hits for the forward sequence
had an alignment score above 200 with + 120 base pairs (bp) while the rest of the hits were a
combination of + 100 bp and + 120 bp with alignment scores between 80-200. The reverse
compliment sequence differed in that the top two hits had a + 120 bp alignment with a score
above 200 while the rest were a combination of + 120 and + 90 bp with scores between 80 and
200. These alignments are unlikely since both the forward and reverse sequences are smaller
than the primer product of 156 bp.
The forward sequence for ample W125 E4 V2.3 had 100% identity with two different Prevotella
species, P. stercorea commonly associated with the human fecal microbiome (Hayashi et al.
2007), and P. bivia DSM 20514 Scaffold 1, similar to the standard control sample. However,
only one alignment had a score above 200 with an alignment of + 410 bp, far above the primer
product size, with the rest of the alignments ranging from + 40 bp to + 230 bp with scores
between 50-80 and 80-200. The forward and reverse compliment sequences were far larger than
the expected primer product size. Both samples W012 C8 V2.0 and W174 F11 V2.4 had the

58
A. O. Breetzke
same top two hits of P. bivia DSM 20514 Scaffold 3 with a higher percentage identity for the
forward sequences, 100% and 94% respectively, and P. bivia DSM 20514 Scaffold 1 for the
reverse compliment sequences with 92% and 90% respectively. The two samples had smaller
forward sequences with much larger reverse compliment sequences, with alignments between +
40-55 bp long and scores of 50-80 and a single 80-200. The high percentage identity could be
due to the small-aligned sequences.
These percentage identity differences between the different samples and the forward and reverse
compliment sequences, as well the diverse set of alignment scores and sequence sizes (bp)
further indicates the non-specificity of the P. bivia primers that were designed and further
research should be done into more accurate and reliable species specific primers.

59
A. O. Breetzke
Figure 4.1.1.1: NCBI BLASTN hit results for the 147 bp forward (top) and 116 bp reverse
compliment (bottom) sequences of the positive control sample 10^5 A5 V2.1
Figure 4.1.1.2: NCBI BLASTN hit results for the 114 bp forward (top) and 427 bp reverse
compliment (bottom) sequences for sample W012 C8 V2.0.
Figure 4.1.1.3: NCBI BLASTN hit results for the 428 bp forward sequences for sample W125 E4
V2.3.
Figure 4.1.1.4: NCBI BLASTN hit results for the 116 bp forward (top) and 412 bp reverse
compliment (bottom) sequences for sample W174 F11 V2.4.
Since the NTC samples did not identify with any species, no figures have been illustrated for the
negative BLASTN hit results. The positive control sample 10^5 A5 V2.1 had the most diverse
set of results due to such a high number of BLASTN hits, with the forward and reverse
compliment sequences indicating identity with P. bivia as well as P. stercorea, P. oulorum, P.
buccalis, P. saccharolytica, P. marshi, P. pallens, P. dentalis, P. copro, P. oralis, P. scopos, P.
melaninogenica, P. multiformis, P. denticola, and P. ruminicola to name a few, with the majority
being associated with the oral, gut and faecal human microbiomes (Faust et al. 2012; Filippo et
al. 2010; Gupta et al. 2015; Hayashi et al. 2007; Kolenbrander et al. 2002; Scher et al. 2013; Wu
et al. 2011). A single BLASTN hit was associated with the vaginal microbiome; Prevotella sp.
S7 MS 2 contig097, since it has not been identified to species level no specificity is possible

60
A. O. Breetzke
(Figure 4.1.1.1). Both the forward and reverse compliment sequences for sample W012 C9 V2.0
showed high percentage identification with P. bivia DSM 20514 Scaffold 3 and P. bivia DSM
20514 Scaffold 1, with the forward sequence showing 100% identification with P. stercorea
DSM 18206 Scaffold41(Figure 4.1.1.2) indicating possible higher levels of specificity for the
sequences with P. bivia. Sample W125 E4 V2.3 has an increased number of BLASTN hits for
the forward sequence versus the reverse compliment sequence, which had no significant
similarities with any species. The forward sequence showed 100% identity with P. stercorea
Scaffold41, P. bivia DSM 20514 Scaffold 1 and 3, as well as a combination of
Rhodospeudomonas sp. B29, Alcanivorax hongdengensis A-11-13 contigs 94 and 71,
Stenotrophomonas panacihumi, and Nocardia brevicatena identifying from 99% to 83% (Figure
4.1.1.3). The last sample that was sequenced showed similar results with similar percentage
identities for the forward and reverse compliment sequences with the forward sequence showing
94% identity with P. bivia DSM 20514 Scaffold 1 and 3 and P. stercorea Scaffold41, while the
reverse compliment sequence showed 90% for P. bivia DSM 20514 Scaffold 1 and 3 (Figure
4.1.1.4).
4.1.2 Sequence Alignment
The forward and reverse compliment sequences for each sample were then aligned to the ATCC
P. bivia reference strain DNF00188 contig005 sequence (NCBI NZ_JRNF01000005.1) (Table
4.1.2.1) and the NCBI Primer BLAST Hit P. bivia strain DSM 20514 genomic scaffold
Prebiscaffold_1, whole genome shotgun sequence (NCBI NZ_JH660658.1) (Table 4.1.2.2) for
comparison using the EMBOSS Needle nucleotide alignment search tool with a gap penalty of
10.0 and an extension penalty of 0.5.
Table 4.1.2.1: Emboss Needle nucleotide alignment results using the ATCC P. bivia reference
strain DNF00188 (138593 bp).
Sample Sequence Identity
(%)
Similarity
(%) Gaps (%) Score Alignment (bp)
NTC A1
V2.0
Forward 336 (0.2)
348 (0.3) 138171
(99.7) 580 5301-6123
Reverse 340* (0.2) 352 (0.3) 138188 577.5 6401-7316

61
A. O. Breetzke
Compliment (99.7)
NTC A3
V2.2
Forward 34 (0.0) 42 (0.0) 138466
(100) 98.0 68151-68298
Reverse
Compliment 27
* (0.0) 29
* (0.0)
138486
(100) 71.5 32701-32797
NTC A2
V2.4
Forward 118 (0.1) 120 (0.1) 1383670
(99.9) 211.0
* 126051-126345
Reverse
Compliment 98 (0.1) 101 (0.1)
138416
(99.9) 191.5 73051-73335
10^5 A5
V2.1
Forward 90 (0.1) 97 (0.1) 138421
(99.9) 165.5 34301-34574
Reverse
Compliment 82 (0.1) 82 (0.1)
138424
(9909) 171.5 77501-77738
W012
C8 V2.0
Forward 80 (0.1) 80 (0.1) 138532
(99.9) 171.5 112251-112484
Reverse
Compliment 284 (0.2) 301 (0.2)
138195
(99.7) 466.5 54851-55547
W125
E4 V2.3
Forward 312 (0.2) 319 (0.2) 138142
(99.7) 514.0 135201-136023
Reverse
Compliment 291 (0.2) 313 (0.2)
1381674
(99.7) 450.5 75101-75958
W174
F11
V2.4
Forward 76 (0.1) 78 (0.1) 1384150
(99.9) 185.5 72301-72475
Reverse
Compliment 268 (0.2) 274 (0.2)
138232
(99.7) 477.5 114851-115436
* Values that are the concurrent as the alignment in Table 4.1.2.2.
Table 4.1.2.2: Emboss Needle nucleotide alignment results using the NCBI Primer BLAST Hit
P. bivia strain DSM 20514 (139516 bp).
Sample Sequence Identity
(%)
Similarity
(%) Gaps (%) Score Alignment (bp)
NTC A1
V2.0
Forward 348 (0.2) 366 (0.3) 139067
(99.7) 580.5 119051-119940
Reverse
Compliment 340
* (0.2) 353 (0.3)
139090
(99.7) 566.5 126651-127480
NTC A3
V2.2
Forward 37 (0.0) 47 (0.0) 139392
(100) 84 13301-13500
Reverse
Compliment 27
* (0.0) 29 (0.0)
139412
(100) 72.5 134301-134449
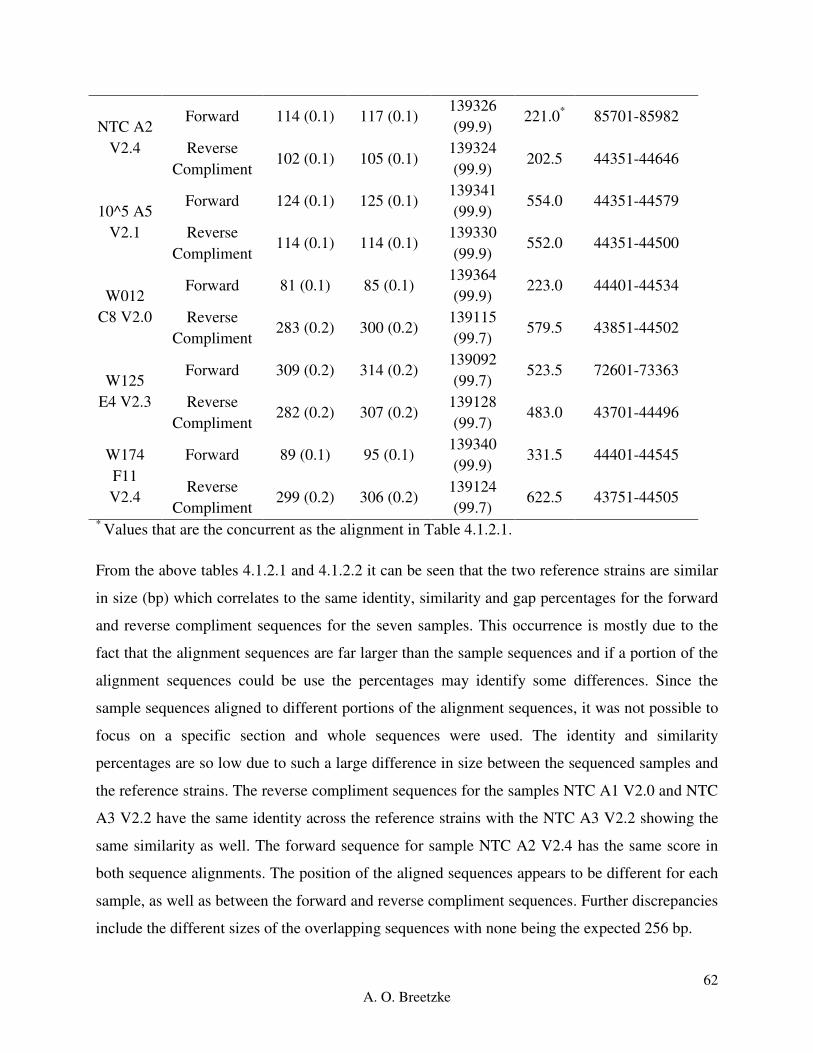
62
A. O. Breetzke
NTC A2
V2.4
Forward 114 (0.1) 117 (0.1) 139326
(99.9) 221.0
* 85701-85982
Reverse
Compliment 102 (0.1) 105 (0.1)
139324
(99.9) 202.5 44351-44646
10^5 A5
V2.1
Forward 124 (0.1) 125 (0.1) 139341
(99.9) 554.0 44351-44579
Reverse
Compliment 114 (0.1) 114 (0.1)
139330
(99.9) 552.0 44351-44500
W012
C8 V2.0
Forward 81 (0.1) 85 (0.1) 139364
(99.9) 223.0 44401-44534
Reverse
Compliment 283 (0.2) 300 (0.2)
139115
(99.7) 579.5 43851-44502
W125
E4 V2.3
Forward 309 (0.2) 314 (0.2) 139092
(99.7) 523.5 72601-73363
Reverse
Compliment 282 (0.2) 307 (0.2)
139128
(99.7) 483.0 43701-44496
W174
F11
V2.4
Forward 89 (0.1) 95 (0.1) 139340
(99.9) 331.5 44401-44545
Reverse
Compliment 299 (0.2) 306 (0.2)
139124
(99.7) 622.5 43751-44505
* Values that are the concurrent as the alignment in Table 4.1.2.1.
From the above tables 4.1.2.1 and 4.1.2.2 it can be seen that the two reference strains are similar
in size (bp) which correlates to the same identity, similarity and gap percentages for the forward
and reverse compliment sequences for the seven samples. This occurrence is mostly due to the
fact that the alignment sequences are far larger than the sample sequences and if a portion of the
alignment sequences could be use the percentages may identify some differences. Since the
sample sequences aligned to different portions of the alignment sequences, it was not possible to
focus on a specific section and whole sequences were used. The identity and similarity
percentages are so low due to such a large difference in size between the sequenced samples and
the reference strains. The reverse compliment sequences for the samples NTC A1 V2.0 and NTC
A3 V2.2 have the same identity across the reference strains with the NTC A3 V2.2 showing the
same similarity as well. The forward sequence for sample NTC A2 V2.4 has the same score in
both sequence alignments. The position of the aligned sequences appears to be different for each
sample, as well as between the forward and reverse compliment sequences. Further discrepancies
include the different sizes of the overlapping sequences with none being the expected 256 bp.

63
A. O. Breetzke
The alignment score for each sequence indicates the quality of the samples sequences against the
alignment strains, with a higher score indicating a stronger alignment. The forward and reverse
compliment sequences for samples NTC A1 V2.0, NTC A3 V2.2 and NTC A2 V2.4 show
similar score results, which is to be expected as they do not correlate with any species
specifically. The largest difference can be seen with the positive control sample 10^5 A5 V2.1
which has scores of 165.5 and 171.5 aligned with P. bivia reference strain NDF00188 versus
554.0 and 552.0 with NCBI Primer Blast Hit P. bivia strain DSM 20514 for the forward and
reverse compliment sequences respectively (Figure 4.1.2.1). The scores for the sample sequences
could be skewed based on the distinct difference in size (bp) between the alignment strains and
the sample sequences.

64
A. O. Breetzke
Figure 4.1.2.1: Comparison of the forward (top __ and …) and reverse compliment (bottom _ _
and __) sequence alignments for sample NTC A1 V2.0 against the ATCC P. bivia reference
strain DNF00188 (left) and the NCBI Primer BLAST Hit P. bivia strain DSM 20514 (right).
Figure 4.1.2.2: Comparison of the forward (top __ and …) and reverse compliment (bottom _ _
and __) sequence alignments for sample NTC A3 V2.2 against the ATCC P. bivia reference
strain DNF00188 (left) and the NCBI Primer BLAST Hit P. bivia strain DSM 20514 (right).

65
A. O. Breetzke
Figure 4.1.2.3: Comparison of the forward (top __ and …) and reverse compliment (bottom _ _
and __) sequence alignments for sample NTC A2 V2.4 against the ATCC P. bivia reference
strain DNF00188 (left) and the NCBI Primer BLAST Hit P. bivia strain DSM 20514 (right).
The NTC samples sequences aligned against P. bivia reference strain NDF00188 and NCBI
Primer Blast Hit P. bivia strain DSM 20514 show poor alignment for both the forward and
reverse compliment sequences as seen for NTC A1 V2.0 (Figure 4.2.2.1), NTC A3 V2.2 (Figure
4.2.2.2) and NTC A2 V2.4 (Figure 4.2.2.3) where there are very little solid alignment stretches
against the alignment sequences regardless of the length and direction.

66
A. O. Breetzke
Figure 4.1.2.4: Comparison of the forward (top __ and …) and reverse compliment (bottom _ _
and __) sequence alignments for the positive standard control 105 copies/ng A5 V2.1 against the
ATCC P. bivia reference strain DNF00188 (left) and the NCBI Primer BLAST Hit P. bivia
strain DSM 20514 (right).
When the forward and reverse compliment positive standard control 105 copies/ng sequences
were aligned against the P. bivia reference strain NDF00188 and NCBI Primer Blast Hit P. bivia
strain DSM 20514, the forward and reverse compliment sequences had the same identity,
similarity and gap percentages, based on different sequence lengths and alignments. The
differences came through in the number of gaps in relation to the two alignment strains lengths
(bp) and the position that the forward and reverse compliment sequences aligned. The forward
sequence aligned between base pairs 34 301 and 34 574 of the P. bivia reference strain
NDF00188 and aligned between base pairs 44 351 and 44 579 of the NCBI Primer Blast Hit P.
bivia strain DSM 20514, while the reverse compliment aligned between 77 501 - 77 738 base
pairs and 44 351 – 44 500 base pairs, respectively. From Figure 4.1.2.4 it can be quite clearly
seen that both the forward and reverse compliment sequences of the positive standard control 105
copies/ng aligned better to the NCBI Primer Blast Hit P. bivia strain DSM 20514, which is
further emphasized by alignment scores of 554.0 and 552.0 respectively, as well as a product size
of 149 bp, similar to the expected size of 156 bp. In contrast, the forward and reverse
compliment sequences had reasonably smaller alignment scores of 165.5 and 171.5 respectively,
as illustrated by the poor alignment in Figure 4.1.2.4.

67
A. O. Breetzke
Figure 4.1.2.5: Comparison of the forward (top __ and …) and reverse compliment (bottom _ _
and __) sequence alignments for W012 C8 V2.0 against the ATCC P. bivia reference strain
DNF00188 (left) and the NCBI Primer BLAST Hit P. bivia strain DSM 20514 (right).
The forward and the reverse compliment sequence of W012 C8 V2.0 when aligned against NCBI
Primer BLAST Hit P. bivia strain DSM 20514 show improved alignment in comparison to when
the sequences are aligned against ATCC P. bivia reference strain DNF00188 (Figure 4.1.2.5)
with larger stretches of concurrent base pair alignments. Despite the increased length of the
reverse compliment sequence, the alignment quality does not improve in comparison to the
shorter forward sequence.

68
A. O. Breetzke
Figure 4.1.2.6: Comparison of the forward (top __ and …) and reverse compliment (bottom _ _
and __) sequence alignments for W125 E4 V2.3 against the ATCC P. bivia reference strain
DNF00188 (left) and the NCBI Primer BLAST Hit P. bivia strain DSM 20514 (right).

69
A. O. Breetzke
A similar alignment pattern can be seen for sample W125 E4 V2 as W012 C8 V2.0 where the
quality of alignment of both the forward and reverse compliment sequences to the NCBI Primer
BLAST Hit P. bivia strain DSM 20514 show slightly improved alignment in comparison to
when the sequences are aligned against ATCC P. bivia reference strain DNF00188 with little
difference between the direction of the sequences.
Figure 4.1.2.7: Comparison of the forward (top __ and …) and reverse compliment (bottom _ _
and __) sequence alignments for W174 F11 V2.4 against the ATCC P. bivia reference strain
DNF00188 (left) and the NCBI Primer BLAST Hit P. bivia strain DSM 20514 (right).
The last sample analyzed showed improved alignment to both alignment sequences with
improved alignment to NCBI Primer BLAST Hit P. bivia strain DSM 20514 in comparison to
when the sequences are aligned against ATCC P. bivia reference strain DNF00188 for both the
forward and reverse compliment sequences. This indicates the primers have a higher specificity
for the P. bivia strain DSM 20514, to which the samples should be compared to.

70
A. O. Breetzke
From the above data, it can be seen that there are multiple products and sizes that are amplified
by the set of primers that were eventually used to assess the WISH samples, which indicates their
non-specificity, as indicated by the poor alignments. This means that the primers are not reliable
and should not be used for future research, with further effort going into designing species
specific primers. This variability of the primers can be seen in the high readings of quantified P.
bivia (copies/ng) indicated by the lack of significant difference in any of the above associations.
As such, the P. bivia results have not been included in the category figures for comparison
between the bacterium. The individual figures for the P. bivia results for each category have
been included for referral, but should be interpreted with strong criticism and not compared to
the other bacterium figures, with any future progress involving optimized primers.
4.2 Real-Time PCR (qPCR) Results
For all amplification, standard and melt curves for qPCR results see appendix D qPCR Results.
Figure 4.2: Example of an amplification and standard curve run with the WISH samples.
Amplification and standard curves of L. iners qPCR Plate V2.5 generated based on all wells and
the standard curve is generated based on the amplification curve of the standard positive controls
ranging from 106 to 10
0 copies/µL. Red and brown indicate positive amplification in the

71
A. O. Breetzke
unknown samples and the positive control standards respectively, blue indicates uncertainty and
green indicates negative amplification in the wells.
4.2.1 Descriptive statistics
All six bacterial species DNA quantities in the WISH samples had a p<0.0001 for the Shapiro-
Wilk normality test, indicating none of the bacterial species were normally distributed across the
participant samples, which can be seen by the large discrepancies between the mean and median
values across the bacteria (Table 4.2.1). The box plots in the figure below illustrate the log10-
transformed values for copies/ng DNA of each of the bacteria. As illustrated below, the medians
of L. iners, G. vaginalis copies/ng are consistently higher and more evenly distributed than L.
crispatus, L. jensenii and L. gasseri, which are skewed left towards the lower range of copies/ng,
except for L. gasseri. This shows a distinct separation of the bacteria into two different groups of
low and high quantity, further associated with a ‘healthy’ or dysbiotic vaginal microbiome,
respectively.
L. g
asse
ri
L. je
nsen
ii
L. c
risp
atus
L. in
ers
G. v
aginalis
1.0×10-04
1.0×10-02
1.0×1000
1.0×1002
1.0×1004
1.0×1006
1.0×1008
Bacteria
log tra
nsfo
rmed c
opie
s/n
g
Figure 4.2.1: Box plot comparison of the copies of each bacterial species of interest quantified in
the DNA extracted from WISH participants’ lateral wall swabs; showing the entire cohort
reported as log transformed copies/ng total DNA for L. gasseri (red), L. jensenii (orange), L.
crispatus (green), L. iners (blue), and G. vaginalis (purple). The ‘box’ component of each plot

72
A. O. Breetzke
indicates the interquartile range (IQR) of the data set and the ‘whiskers’ which are the two lines
(bottom and top) extending from the box component of each block that end with a horizontal
stroke, indicate the range from the smallest and largest non-outliers to the 25% and 75%
percentile components, respectively. The middle line indicates the median value for each data
set.
Table 4.2.1: Descriptive statistics for each bacterial species, quantified from DNA extracted from
the WISH lateral wall swab for each participant.
Bacteria
L. crispatus L. gasseri L. jensenii L. iners G. vaginalis P. bivia
Min 0.0 0.0 0.0 1.034 1.738 1.738
25% Percentile 0.0 1.976 1.570e-016 266.7 1015 3667
Median 3.957 17.58 1.568 2807 8540 11073
75% Percentile 4980 64.67 59.00 18727 49867 75533
Max 7.113e+007 320000 5.440e+006 4.167e+007 3.033e+006 2.553e+007
Mean 858412 3327 48743 337988 151382 750128
Std. Deviation 7.157e+006 27908 462042 3.485e+006 414156 3.405e+006
Std. Error 598472 2334 38638 291468 34633 284714
Although we only measured the most common vagina-associated bacteria, using these as
markers for total lactobacillus bacterial load we can assume this cohort of adolescent females had
predominantly non-lactobacillus species dominating their vaginal microbiome, indicating a shift
in what is considered the ‘normal’ vaginal microbiome in terms of the standard ‘healthy’
Lactobacillus dominated microbiome.
Due to the data set being non-parametric, all figures below represent the log10 transformed values
for each area of comparison. The comparisons were considered statistically significantly
different if the p-values were lower than 0.05; medians and 95% confidence intervals are
reported.
For all of the following analyses, the same shapes have been used for each bacterium; L
crispatus (equilateral triangle), L. gasseri (square), L. jensenii (circle), L. iners (square balanced
at 45 angle) G. vaginalis (isosceles right triangle) and P. bivia (square with an x through the
center).

73
A. O. Breetzke
4.3 Comparison of absolute bacterial quantities to BV status, inflammation levels, age,
hormonal contraceptive and STI status, bacterial versus viral STIs and HPV
4.3.1 Association between the quantities of the bacteria of interest and BV status
Participants were categorized as being BV positive, intermediate or negative based on Nugent
scoring. A Nugent score of 0-3 is BV negative, a score of 4-6 is BV intermediate and a score of
7-10 is BV positive.
The median copies/ng for each bacterium were compared using a Friedman’s ANOVA with a
Dunn’s Multiple Comparison test for BV positive (n=56, 39.16%), BV intermediate (n=17,
11.89%) and BV negative (n=70, 48.95%) groups. All ANOVA tests were statistically
significant (p<0.0001) indicating an overall significant difference between the copies/ng of the
bacteria in each BV group. For the p-values of the Friedman’s ANOVA test with a Dunn’s
Multiple Comparison test run across all BV groups, see Appendix D qPCR results, Section 2.1.
Asterisk stars were used in the following figures where one start (*) indicates a p-value lower
than 0.05, two stars (**) indicate a p-value lower than 0.01 and three stars (***) indicate a p-
value lower than 0.001.
Within the BV positive group (Figure 4.3.1A), L. iners and G. vaginalis both showed
significantly higher copies/ng in comparison to L. gasseri (p<0.0001), L. jensenii (p<0.0001) and
L. crispatus (p<0.0001). G. vaginalis was significantly more abundant than L. iners (p=0.007)
and L. gasseri was more abundant than L. jensenii (p=0.0157). G. vaginalis had significantly
higher copies/ng within the BV intermediate group (Figure 4.3.1B), with higher copies/ng in
comparison to L. gasseri (p=0.0123), and L. jensenii (p=0.0074), with both G. vaginalis and L.
iners being significantly greater than L. crispatus (p=0.0001, p=0.0044). The BV negative group
(Figure 4.3.1C) had greater copies/ng of L. crispatus, L. iners and G. vaginalis in comparison to
L. gasseri (p=0.0009, p<0.0001, p=0.0002 respectively). L. crispatus, L. iners and G. vaginalis
had higher median copies/ng with a significant difference of p<0.0001 in comparison to L.
jensenii. Overall, the greatest differences occurred between the high median copies/ng of G.
vaginalis in comparison to L. gasseri, L. jensenii, and L. crispatus, with L. iners to varying
degrees across the BV positive, intermediate and negative groups. The increased copies/ng of L.
crispatus within the BV negative group follows the literature of a ‘healthy’ FGT microbiome.

74
A. O. Breetzke
Interestingly, L. crispatus and L. iners were the most prevalent of the lactobacilli species we
quantified in the BV negative group, however this trend is further followed by L. iners and G.
vaginalis across all three BV groups which differs strongly from the general lactobacilli
dominated FGT within a ‘healthy’ FGT microbiome. This could indicate a difference in what is
considered the ‘normal’ microbiome within this adolescent population.
L. g
asse
ri
L. jen
senii
L. c
risp
atus
L. ine
rs
G. v
aginalis
1.0×10 -04
1.0×10 -02
1.0×1000
1.0×1002
1.0×1004
1.0×1006
1.0×1008
***
******
******
**
***
*
Bacteria
log tra
nsfo
rmed c
opie
s/n
g
Figure 4.3.1A: Box-plot of L. gasseri (red), L. jensenii (orange), L. crispatus (green), L. iners
(blue), and G. vaginalis (purple) quantities for BV positive participants reported as log
transformed copies/ng total DNA. The ‘box’ component of each plot indicates the interquartile
range (IQR) of the data set and the ‘whiskers’ which are the two lines (bottom and top)
extending from the box component of each block that end with a horizontal stroke, indicate the
range from the smallest and largest non-outliers to the 25% and 75% percentile components,
respectively. The middle line indicates the median value for each data set.

75
A. O. Breetzke
L. g
asse
ri
L. jen
senii
L. c
risp
atus
L. ine
rs
G. v
aginalis
1.0×10-04
1.0×10-02
1.0×1000
1.0×1002
1.0×1004
1.0×1006
*****
**
*
Bacteria
log tra
nsfo
rmed c
opie
s/n
g
Figure 4.3.1B: Box-plot of L. gasseri (red), L. jensenii (orange), L. crispatus (green), L. iners
(blue), and G. vaginalis (purple) quantities for BV intermediate participants reported as log
transformed copies/ng total DNA. The ‘box’ component of each plot indicates the interquartile
range (IQR) of the data set and the ‘whiskers’ which are the two lines (bottom and top)
extending from the box component of each block that end with a horizontal stroke, indicate the
range from the smallest and largest non-outliers to the 25% and 75% percentile components,
respectively. The middle line indicates the median value for each data set.

76
A. O. Breetzke
L. g
asse
ri
L. jen
senii
L. c
risp
atus
L. in
ers
G. v
agin
alis
1.0×10-04
1.0×10-02
1.0×1000
1.0×1002
1.0×1004
1.0×1006
1.0×1008
***
******
***
***
***
Bacteria
log tra
nsfo
rmed c
opie
s/n
g
Figure 4.3.1C: Box-plot of L. gasseri (red), L. jensenii (orange), L. crispatus (green), L. iners
(blue), and G. vaginalis (purple) quantities for BV negative participants reported as log
transformed copies/ng total DNA. The ‘box’ component of each plot indicates the interquartile
range (IQR) of the data set and the ‘whiskers’ which are the two lines (bottom and top)
extending from the box component of each block that end with a horizontal stroke, indicate the
range from the smallest and largest non-outliers to the 25% and 75% percentile components,
respectively. The middle line indicates the median value for each data set.

77
A. O. Breetzke
4.3.1.1 Lactobacillus crispatus
We compared the quantified log copies/ng of L. crispatus between the BV groups. BV negative
participants had a significantly higher median value of L. crispatus (copies/ng) compared to
those in the BV intermediate (p=0.0004) and BV positive (p=0.0002) participant groups. There
was an overall significant difference in L. crispatus between the BV groups (Kruskal-Wallis
ANOVA p<0.0001) (Figure 4.3.1.1).
Pos Int
Neg
1.0×10-04
1.0×10-02
1.0×1000
1.0×1002
1.0×1004
1.0×1006
1.0×1008
1.0×10¹⁰
p=0.6054
p=0.0002
p=0.0004
BV Status
log
tra
nsfo
rmed
co
pie
s/n
g
Figure 4.3.1.1: Comparison of the quantities of L. crispatus (log transformed copies/ng DNA)
measured in the DNA extracted from vaginal lateral wall swabs from participants in the WISH
study, between BV positive, intermediate and negative groups. All p-value comparisons were
based on an unpaired, non-parametric Dunn’s Multiple Comparison test. Each point in the figure
represents an individual participant. The three horizontal bars represent the median value (middle
bar), upper interquartile range (top bar) and lower interquartile range (bottom bar).

78
A. O. Breetzke
4.3.1.2 Lactobacillus gasseri
We compared the quantified log copies/ng of L. gasseri between the BV groups. The BV
negative participants had a significantly higher median value of L. gasseri (copies/ng) compared
to those in the BV intermediate (p=0.0016) and BV positive (p<0.0001) participant groups.
There was an overall significant difference between the BV groups (Kruskal-Wallis ANOVA
p<0.0001) (Figure 4.3.1.2).
Pos Int
Neg
1.0×10-02
1.0×1000
1.0×1002
1.0×1004
1.0×1006
1.0×1008 p>0.9999
p=0.0016
p<0.0001
BV Status
log
tra
nsfo
rmed
co
pie
s/n
g
Figure 4.3.1.2: Comparison of the quantities of L. gasseri (log transformed copies/ng DNA)
measured in the DNA extracted from vaginal lateral wall swabs from participants in the WISH
study, between BV positive, intermediate and negative groups. All p-value comparisons were
based on an unpaired, non-parametric Dunn’s Multiple Comparison test. Each point in the figure
represents an individual participant. The three horizontal bars represent the median value (middle
bar), upper interquartile range (top bar) and lower interquartile range (bottom bar).

79
A. O. Breetzke
4.3.1.3 Lactobacillus jensenii
We compared the quantified log copies/ng of L. jensenii between the BV groups. BV negative
participants had a significantly higher median value of L. jensenii (copies/ng) compared to those
in the BV positive (p<0.0001) participant group. There was an overall significant difference in L.
jensenii between the BV groups (Kruskal-Wallis ANOVA p<0.0001) (Figure 4.3.1.3).
Pos Int
Neg
1.0×10-04
1.0×10-02
1.0×1000
1.0×1002
1.0×1004
1.0×1006
1.0×1008
p=0.3988
p<0.0001
p=0.5547
BV Status
log
tra
nsfo
rmed
co
pie
s/n
g
Figure 4.3.1.3: Comparison of the quantities of L. jensenii (log transformed copies/ng DNA)
measured in the DNA extracted from vaginal lateral wall swabs from participants in the WISH
study, between BV positive, intermediate and negative groups. All p-value comparisons were
based on an unpaired, non-parametric Dunn’s Multiple Comparison test. Each point in the figure
represents an individual participant. The three horizontal bars represent the median value (middle
bar), upper interquartile range (top bar) and lower interquartile range (bottom bar).
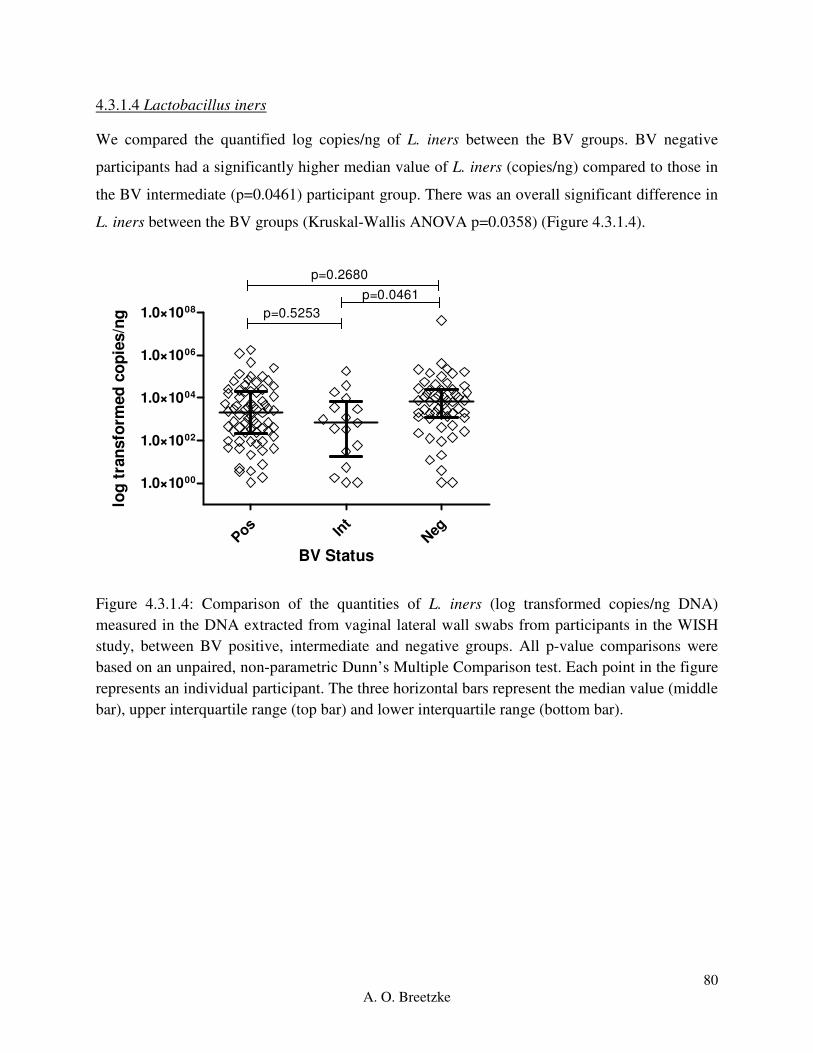
80
A. O. Breetzke
4.3.1.4 Lactobacillus iners
We compared the quantified log copies/ng of L. iners between the BV groups. BV negative
participants had a significantly higher median value of L. iners (copies/ng) compared to those in
the BV intermediate (p=0.0461) participant group. There was an overall significant difference in
L. iners between the BV groups (Kruskal-Wallis ANOVA p=0.0358) (Figure 4.3.1.4).
Pos Int
Neg
1.0×1000
1.0×1002
1.0×1004
1.0×1006
1.0×1008 p=0.5253
p=0.0461
p=0.2680
BV Status
log
tra
nsfo
rmed
co
pie
s/n
g
Figure 4.3.1.4: Comparison of the quantities of L. iners (log transformed copies/ng DNA)
measured in the DNA extracted from vaginal lateral wall swabs from participants in the WISH
study, between BV positive, intermediate and negative groups. All p-value comparisons were
based on an unpaired, non-parametric Dunn’s Multiple Comparison test. Each point in the figure
represents an individual participant. The three horizontal bars represent the median value (middle
bar), upper interquartile range (top bar) and lower interquartile range (bottom bar).

81
A. O. Breetzke
4.3.1.5 Gardnerella vaginalis
We compared the quantified log copies/ng of G. vaginalis between the BV groups. BV positive
participants had significantly higher copies/ng of G. vaginalis compared to those in the BV
intermediate (p=0.0059) and BV negative (p<0.0001) participant groups. There was an overall
significant difference in G. vaginalis between the BV groups (Kruskal-Wallis ANOVA
p<0.0001) (Figure 4.3.1.5).
Pos Int
Neg
1.0×1000
1.0×1002
1.0×1004
1.0×1006
1.0×1008
p=0.0059
p<0.0001
p>0.9999
BV Status
log
tra
nsfo
rmed
co
pie
s/n
g
Figure 4.3.1.5: Comparison of the quantities of G. vaginalis (log transformed copies/ng DNA)
measured in the DNA extracted from vaginal lateral wall swabs from participants in the WISH
study, between BV positive, intermediate and negative groups. All p-value comparisons were
based on an unpaired, non-parametric Dunn’s Multiple Comparison test. Each point in the figure
represents an individual participant. The three horizontal bars represent the median value (middle
bar), upper interquartile range (top bar) and lower interquartile range (bottom bar).
Therefore, we can conclude than women without BV had higher median levels of L. crispatus
(copies/ng) and L. gasseri (copies/ng) compared to those in the BV intermediate and BV positive
groups. Further, the BV negative group had higher median levels of L. jensenii (copies/ng) and
L. iners (copies/ng) compared to the BV positive and intermediate groups, respectively. Overall,
L. crispatus, L. iners and G. vaginalis, which are associated with both dysbiosis and a ‘healthy’
vaginal microbiome, dominated the BV negative group. The BV positive group had higher
median levels of G. vaginalis (copies/ng) compared to those in the BV intermediate and BV

82
A. O. Breetzke
positive groups, with none of the BV groups having any difference in the median levels of P.
bivia (copies/ng) present. This follows the expected trend of association between the presence of
increased G. vaginalis copies/ng with BV positive literature and increased L. crispatus, L.
gasseri and L. jensenii and BV negative literature.
Due to the unreliability of the qPCR amplification results, the P. bivia data regarding BV has not
been included and can be found in Appendix E: Results, page 186.
4.3.2 Association between bacteria of interest and inflammatory immunological factor levels
The two inflammatory groups were defined based on the unsupervised analysis of the 47
immunological factors of interest in the cervicovaginal fluid of women in the WISH cohort.
These immunological factors were categorized into high and low inflammation by partitioning
around medoids (PAM) using an R package ‘cluster’ with a k-value of 2. The samples were
originally separated into high and low inflammation based on the levels of only the pro-
inflammatory and chemokine factors measured. However, the inflammation separation of the
participant samples showed little difference between the two pro-inflammatory and chemokine
groups of immunological factor analysis in comparison to using all of the factors to determine
high and low inflammation. Thus the final inflammation categorization was done using all 47
immunological factors.
The immunological factors measured in this study can be generally grouped into five different
categories. The immunological factors considered as pro-inflammatory were IL-1a, IL-1b, IL-6,
IL-12p40, IL-12(p70), IL-18, MIF, TNF-a, TNF-b and TRAIL. The immunological factors
considered chemokines were CTACK, Eotaxin, GROa, IL-8, IL-16, IP-10, MCP-1, MCP-3,
MIG, MIP-1a, MIP-1b, IFN-a2, and RANTES. The immunological factors considered growth
factors were b-NGF, FGF basic, G-CSF, GM-CSF, HGF, IL-3, IL-7, IL-9, LIF, M-CSF, PDGF-
bb, SCF, SCGF-b, SDF-1a and VEGF. The immunological factors considered adaptive were
IFN-g, IL-4, IL-13, IL-17, IL-2Ra, IL-2, and IL-5. The immunological factors considered
regulatory were IL-10 and IL-1ra.
The median log transformed copies/ng for each bacterium were compared using a Friedman’s
ANOVA with a Dunn’s Multiple Comparison test for high (n=98, 70%) and low (n=42, 30%)

83
A. O. Breetzke
inflammation groups. Both ANOVA tests were significant (p<0.0001) indicating statistically
different median values for the bacterial copies/ng in the low and high genital inflammation
groups. For the p-values of the Friedman’s ANOVA test with a Dunn’s Multiple Comparison test
run across the inflammation groups, see Appendix D qPCR results, Section 2.2. Asterisk stars
were used in the following figures where one start (*) indicates a p-value lower than 0.05, two
stars (**) indicate a p-value lower than 0.01 and three stars (***) indicate a p-value lower than
0.001.
In the women with low levels of inflammation, both G. vaginalis and L. iners were significantly
higher compared to L. gasseri and L. jensenii (p<0.0001) (Figure 4.3.2A), L. crispatus copies/ng
were also significantly higher than L. gasseri and L. jensenii (p=0.0097 and p=0.0005,
respectively). There were no differences between L. iners, L. crispatus and G. vaginalis in the
low inflammation group. The high inflammation group (Figure 4.3.2B) also had the significantly
higher copies/ng of G. vaginalis and L. iners compared to L. gasseri (p<0.0001), L. jensenii
(p<0.0001), and L. crispatus (p<0.0001). L. gasseri had higher copies/ng compared to L. jensenii
(p=0.0463). Regardless of inflammatory factor level, copies/ng of G. vaginalis and L. iners were
high. However, the low inflammation group had equivalent copies/ng of L. crispatus and the
high inflammation group had increased copies/ng of L. gasseri.

84
A. O. Breetzke
L. g
asse
ri
L. jen
senii
L. c
risp
atus
L. ine
rs
G. v
aginalis
1.0×10-04
1.0×10-02
1.0×1000
1.0×1002
1.0×1004
1.0×1006
***
******
***
***
**
Bacteria
log tra
nsfo
rmed c
opie
s/n
g
Figure 4.3.2A: Box-plot of the low inflammation for L. gasseri (red), L. jensenii (orange), L.
crispatus (green), L. iners (blue), and G. vaginalis (purple) reported as log transformed copies/ng
total DNA. The ‘box’ component of each plot indicates the interquartile range (IQR) of the data
set and the ‘whiskers’ which are the two lines (bottom and top) extending from the box
component of each block that end with a horizontal stroke, indicate the range from the smallest
and largest non-outliers to the 25% and 75% percentile components, respectively. The middle
line indicates the median value for each data set.

85
A. O. Breetzke
L. g
asse
ri
L. jen
senii
L. c
risp
atus
L. iner
s
G. v
aginalis
1.0×10-04
1.0×10-02
1.0×1000
1.0×1002
1.0×1004
1.0×1006
1.0×1008
***
******
******
**
***
*
Bacteria
log tra
nsfo
rmed c
opie
s/n
g
Figure 4.3.2B: Box-plot of the high inflammation for L. gasseri (red), L. jensenii (orange), L.
crispatus (green), L. iners (blue), and G. vaginalis (purple) reported as log transformed copies/ng
total DNA. The ‘box’ component of each plot indicates the interquartile range (IQR) of the data
set and the ‘whiskers’ which are the two lines (bottom and top) extending from the box
component of each block that end with a horizontal stroke, indicate the range from the smallest
and largest non-outliers to the 25% and 75% percentile components, respectively. The middle
line indicates the median value for each data set.

86
A. O. Breetzke
4.3.2.1 Lactobacillus crispatus
We compared the quantified log copies/ng of L. crispatus between the inflammation groups. The
low inflammation group had significantly higher copies/ng compared to those in the high
inflammation group (p=0.0005) (Figure 4.3.2.1).
LowHig
h
1.0×10-04
1.0×10-02
1.0×1000
1.0×1002
1.0×1004
1.0×1006
1.0×1008
p=0.0005
Inflammation
log
tra
nsfo
rmed
co
pie
s/n
g
Figure 4.3.2.1: Comparison of the quantities of L. crispatus (log transformed copies/ng DNA)
measured in the DNA extracted from vaginal lateral wall swabs from participants in the WISH
study, between women with high and low genital inflammation. All p-value comparisons were
based on an unpaired, non-parametric Mann-Whitney t-test statistic. Each point in the figure
represents an individual participant. The three horizontal bars represent the median value (middle
bar), upper interquartile range (top bar) and lower interquartile range (bottom bar).

87
A. O. Breetzke
4.3.2.2 Lactobacillus gasseri
We compared the quantified log copies/ng of L. gasseri between the inflammation groups. The
low inflammation group had significantly higher copies/ng of L. gasseri compared to those in the
high inflammation group (p=0.033) (Figure 4.3.2.2).
LowHig
h
1.0×1000
1.0×1002
1.0×1004
1.0×1006
1.0×1008p=0.033
Inflammation
log
tra
nsfo
rmed
co
pie
s/n
g
Figure 4.3.2.2: Comparison of the quantities of L. gasseri (log transformed copies/ng DNA)
measured in the DNA extracted from vaginal lateral wall swabs from participants in the WISH
study, between women with high and low genital inflammation. All p-value comparisons were
based on an unpaired, non-parametric Mann-Whitney t-test statistic. Each point in the figure
represents an individual participant. The three horizontal bars represent the median value (middle
bar), upper interquartile range (top bar) and lower interquartile range (bottom bar).

88
A. O. Breetzke
4.3.2.3 Lactobacillus jensenii
We compared the quantified log copies/ng of L. jensenii between the inflammation groups. The
low inflammation group had significantly higher copies/ng compared to those in the high
inflammation group (p=0.0046) (Figure 4.3.2.3).
LowHig
h
1.0×10-04
1.0×10-02
1.0×1000
1.0×1002
1.0×1004
1.0×1006
p=0.0046
Inflammation
log
tra
nsfo
rmed
co
pie
s/n
g
Figure 4.3.2.3: Comparison of the quantities of L. jensenii (log transformed copies/ng DNA)
measured in the DNA extracted from vaginal lateral wall swabs from participants in the WISH
study, between women with high and low genital inflammation. All p-value comparisons were
based on an unpaired, non-parametric Mann-Whitney t-test statistic. Each point in the figure
represents an individual participant. The three horizontal bars represent the median value (middle
bar), upper interquartile range (top bar) and lower interquartile range (bottom bar).
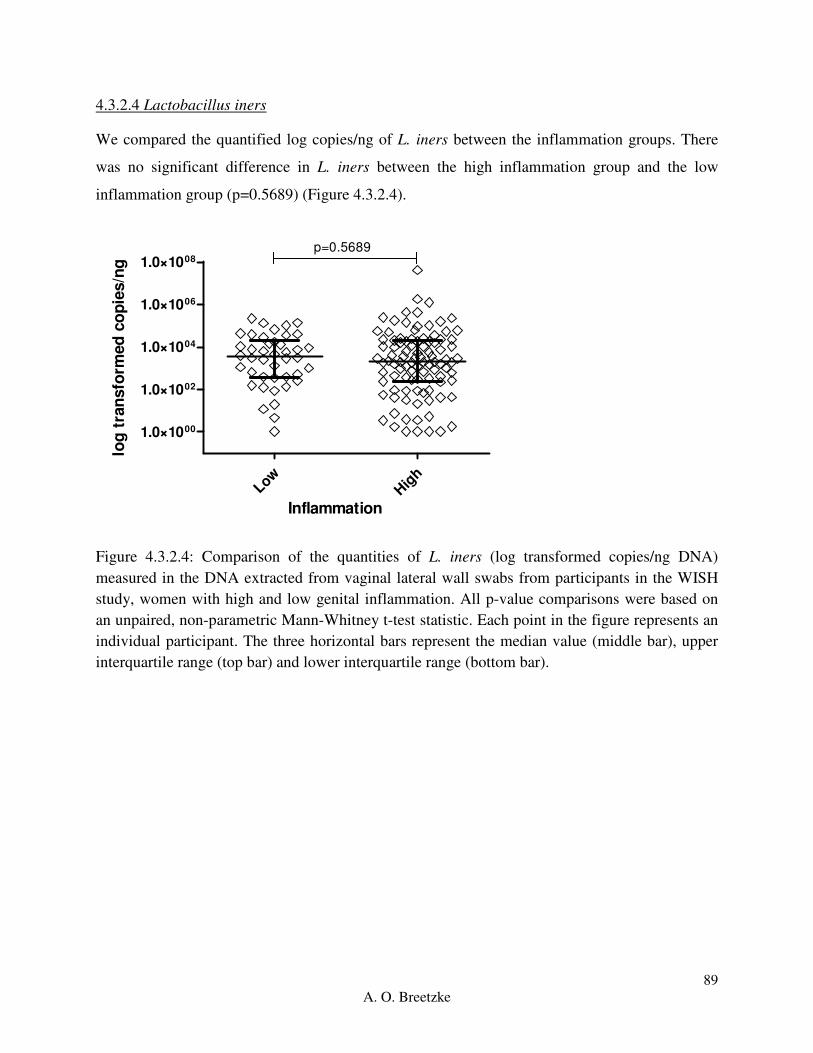
89
A. O. Breetzke
4.3.2.4 Lactobacillus iners
We compared the quantified log copies/ng of L. iners between the inflammation groups. There
was no significant difference in L. iners between the high inflammation group and the low
inflammation group (p=0.5689) (Figure 4.3.2.4).
LowHig
h
1.0×1000
1.0×1002
1.0×1004
1.0×1006
1.0×1008p=0.5689
Inflammation
log
tra
nsfo
rmed
co
pie
s/n
g
Figure 4.3.2.4: Comparison of the quantities of L. iners (log transformed copies/ng DNA)
measured in the DNA extracted from vaginal lateral wall swabs from participants in the WISH
study, women with high and low genital inflammation. All p-value comparisons were based on
an unpaired, non-parametric Mann-Whitney t-test statistic. Each point in the figure represents an
individual participant. The three horizontal bars represent the median value (middle bar), upper
interquartile range (top bar) and lower interquartile range (bottom bar).

90
A. O. Breetzke
4.3.2.5 Gardnerella vaginalis
We compared the quantified log copies/ng of G. vaginalis between the inflammation groups. The
high inflammation group and the low inflammation group had no significant difference
(p=0.1227) (Figure 4.3.2.5).
LowHig
h
1.0×1000
1.0×1002
1.0×1004
1.0×1006
p=0.1227
Inflammation
log
tra
nsfo
rmed
co
pie
s/n
g
Figure 4.3.2.5: Comparison of the quantities of G. vaginalis (log transformed copies/ng DNA)
measured in the DNA extracted from vaginal lateral wall swabs from participants in the WISH
study, between women with high and low genital inflammation. All p-value comparisons were
based on an unpaired, non-parametric Mann-Whitney t-test statistic. Each point in the figure
represents an individual participant. The three horizontal bars represent the median value (middle
bar), upper interquartile range (top bar) and lower interquartile range (bottom bar).
In summary, consistent with our hypothesis, participants with low inflammation in their genital
tract fluid had significantly higher copies/ng of L. crispatus, L. gasseri, and L. jensenii compared
to those present in the high inflammation group. Conversely, there were no significant
differences in the copies/ng for L. iners or G. vaginalis between women with high or low
inflammation. Thus there is an association with the presence of lactobacilli and low
inflammation. This begs the question of whether the presence of bacteria such as G. vaginalis,
versus the absence of lactobacilli bacterium playing any role in high genital inflammation

91
A. O. Breetzke
Due to the unreliability of the qPCR amplification results, the P. bivia data regarding
Inflammation has not been included and can be found in Appendix E: Results, page 189.
4.3.3 Association between the quantities (copies/ng) of bacteria of interest and age
The age of all participants was recorded upon screening for participation within the study. For
this analysis, age was binarised into 16-18 years of age versus 19-22 years of age.
The median copies/ng for each bacterium were compared using a Friedman’s ANOVA with a
Dunn’s Multiple Comparison test for the two age groups 16-18 years (n=75, 52.45%) and 19-22
years (n=68, 47.55%). Both ANOVA tests were significant (p<0.0001), indicating the bacterial
copies/ng in each age group were statistically different from each other. For the p-values of the
Friedman’s ANOVA test with a Dunn’s Multiple Comparison test run across the inflammation
groups, see Appendix D qPCR results, Section 2.2.3. Asterisk stars were used in the following
figures where one start (*) indicates a p-value lower than 0.05, two stars (**) indicate a p-value
lower than 0.01 and three stars (***) indicate a p-value lower than 0.001.
In both the 16-18 years (Figure 4.3.3A) and 19-22 years (Figure 4.3.3B) age groups, G. vaginalis
and L. iners were significantly higher compared to L. gasseri (p<0.0001), L. jensenii (p<0.0001)
and L. crispatus (p<0.0001). L. crispatus was significantly higher to L. jensenii (p=0.0419) in the
16-18 years’ group. This data set is similar to the study cohort as a whole.

92
A. O. Breetzke
L. gas
seri
L. jen
seni
i
L. c
risp
atus
L. ine
rs
G. v
agin
alis
1.0×10-04
1.0×10-02
1.0×1000
1.0×1002
1.0×1004
1.0×1006
1.0×1008
***
******
******
*
***
Bacteria
log tra
nsfo
rmed c
opie
s/n
g
Figure 4.3.3A: Box-plot of the 16-18 years for L. gasseri (red), L. jensenii (orange), L. crispatus
(green), L. iners (blue), and G. vaginalis (purple) reported as log transformed copies/ng total
DNA. The ‘box’ component of each plot indicates the interquartile range (IQR) of the data set
and the ‘whiskers’ which are the two lines (bottom and top) extending from the box component
of each block that end with a horizontal stroke, indicate the range from the smallest and largest
non-outliers to the 25% and 75% percentile components, respectively. The middle line indicates
the median value for each data set.

93
A. O. Breetzke
L. gas
seri
L. jen
senii
L. crisp
atus
L. in
ers
G. v
aginalis
1.0×10 -04
1.0×10 -02
1.0×1000
1.0×1002
1.0×1004
1.0×1006
1.0×1008
***
******
******
***
Bacteria
log tra
nsfo
rmed c
opie
s/n
g
Figure 4.3.3B: Box-plot of the 19-22 years for L. gasseri (red), L. jensenii (orange), L. crispatus
(green), L. iners (blue), and G. vaginalis (purple) reported as log transformed copies/ng total
DNA. The ‘box’ component of each plot indicates the interquartile range (IQR) of the data set
and the ‘whiskers’ which are the two lines (bottom and top) extending from the box component
of each block that end with a horizontal stroke, indicate the range from the smallest and largest
non-outliers to the 25% and 75% percentile components, respectively. The middle line indicates
the median value for each data set.

94
A. O. Breetzke
4.3.3.1 Lactobacillus crispatus
The 16-18 years old age group and the 19-22 years old age group had no significant difference in
log copies/ng (p=0.6861) (Figure 4.3.3.1).
16-1
8
19-2
2
1.0×10-04
1.0×10-02
1.0×1000
1.0×1002
1.0×1004
1.0×1006
p=0.6861
Age Group (years)
log
tra
nsfo
rmed
co
pie
s/n
g
Figure 4.3.3.1: Comparison of the quantities of L. crispatus (log transformed copies/ng DNA)
measured in the DNA extracted from vaginal lateral wall swabs from participants in the WISH
study, between the two 16-18 years old and 19-22 years old age groups. All p-value comparisons
were based on an unpaired, non-parametric Mann-Whitney t-test statistic. Each point in the
figure represents an individual participant. The three horizontal bars represent the median value
(middle bar), upper interquartile range (top bar) and lower interquartile range (bottom bar).

95
A. O. Breetzke
4.3.3.2 Lactobacillus gasseri
We compared the quantified copies/ng of L. gasseri between the age groups. The 16-18 years old
age group and the 19-22 years old age group had no significant difference in log copies/ng
(p=0.2991) (Figure 4.3.3.2).
16-1
8
19-2
2
1.0×10-02
1.0×1000
1.0×1002
1.0×1004
1.0×1006
1.0×1008
p=0.2991
Age Group (years)
log
tra
nsfo
rmed
co
pie
s/n
g
Figure 4.3.3.2: Comparison of the quantities of L. gasseri (log transformed copies/ng DNA)
measured in the DNA extracted from vaginal lateral wall swabs from participants in the WISH
study, between the two 16-18 years old and 19-22 years old age groups. All p-value comparisons
were based on an unpaired, non-parametric Mann-Whitney t-test statistic. Each point in the
figure represents an individual participant. The three horizontal bars represent the median value
(middle bar), upper interquartile range (top bar) and lower interquartile range (bottom bar).

96
A. O. Breetzke
4.3.3.3 Lactobacillus jensenii
The 16-18 years old age group and the 19-22 years old age group had no significant difference in
log copies/ng (p=0.7909) (Figure 4.3.3.3).
16-1
8
19-2
2
1.0×10-04
1.0×10-02
1.0×1000
1.0×1002
1.0×1004
1.0×1006
p=0.7909
Age Group (years)
log
tra
nsfo
rmed
co
pie
s/n
g
Figure 4.3.3.3: Comparison of the quantities of L. jensenii (log transformed copies/ng DNA)
measured in the DNA extracted from vaginal lateral wall swabs from participants in the WISH
study, between the two 16-18 years old and 19-22 years old age groups. All p-value comparisons
were based on an unpaired, non-parametric Mann-Whitney t-test statistic. Each point in the
figure represents an individual participant. The three horizontal bars represent the median value
(middle bar), upper interquartile range (top bar) and lower interquartile range (bottom bar).

97
A. O. Breetzke
4.3.3.4 Lactobacillus iners
We compared the quantified copies/ng of L. iners between the age groups. The 16-18 years old
age group and the 19-22 years old age group had no significant difference in log copies/ng
(p=0.1664) (Figure 4.3.3.4).
16-1
8
19-2
2
1.0×1000
1.0×1002
1.0×1004
1.0×1006
1.0×1008
p=0.1664
Age Group (years)
log
tra
nsfo
rmed
co
pie
s/n
g
Figure 4.3.3.4: Comparison of the quantities of L. iners (log transformed copies/ng DNA)
measured in the DNA extracted from vaginal lateral wall swabs from participants in the WISH
study, between the two 16-18 years old and 19-22 years old age groups. All p-value comparisons
were based on an unpaired, non-parametric Mann-Whitney t-test statistic. Each point in the
figure represents an individual participant. The three horizontal bars represent the median value
(middle bar), upper interquartile range (top bar) and lower interquartile range (bottom bar).

98
A. O. Breetzke
4.3.3.5 Gardnerella vaginalis
We compared the quantified copies/ng of G. vaginalis between the age groups. The 16-18 years
old age group and the 19-22 years old age group had no significant difference in log copies/ng
(p=0.3788) (Figure 4.3.3.5).
16-1
8
19-2
2
1.0×1000
1.0×1002
1.0×1004
1.0×1006
p=0.3788
Age Group (years)
log
tra
nsfo
rmed
co
pie
s/n
g
Figure 4.3.3.5: Comparison of the quantities of G. vaginalis (log transformed copies/ng DNA)
measured in the DNA extracted from vaginal lateral wall swabs from participants in the WISH
study, between the two 16-18 years old and 19-22 years old age groups. All p-value comparisons
were based on an unpaired, non-parametric Mann-Whitney t-test statistic. Each point in the
figure represents an individual participant. The three horizontal bars represent the median value
(middle bar), upper interquartile range (top bar) and lower interquartile range (bottom bar).
Therefore, age did not influence the bacterial quantities (copies/ng) regardless of the species
associated with health or dysbiosis, as the comparisons between the median quantified values of
the two different age groups 16-18 years old and 19-22 years old, did not significantly differ in
any way towards a particular age set. Analyzing age as continuous variable, yielded similar
results.
Due to the unreliability of the qPCR amplification results, the P. bivia data regarding age has not
been included and can be found in Appendix E: Results, page 190.

99
A. O. Breetzke
4.3.4 Association between the quantities (copies/ng) of vaginal bacteria and hormonal
contraceptives
The hormonal contraceptive that each participant was using was recorded at the first visit of the
WISH Cohort study process. The three hormonal contraceptives of particular interest within this
study include DMPA, the Implanon and Nur Isterate.
The median copies/ng for each bacterium were compared using a Friedman’s ANOVA with a
Dunn’s Multiple Comparison test for hormonal contraceptive use of DMPA (n=25, 18.38%),
Implanon (n=9, 6.62%) and Nur Isterate (n=102, 75%). The copies/ng between the bacteria in
each hormonal contraceptive usage group were significantly different to each other (ANOVA
p<0.0001). For the p-values of the Friedman’s ANOVA test with a Dunn’s Multiple Comparison
test run across all hormonal contraceptive usage groups, see Appendix D qPCR results, Section
2.4. Asterisk stars were used in the following figures where one start (*) indicates a p-value
lower than 0.05, two stars (**) indicate a p-value lower than 0.01 and three stars (***) indicate a
p-value lower than 0.001.
The copies/ng of G. vaginalis and L. iners in the DMPA (Figure 4.3.4A) and Nur Isterate (Figure
4.3.4C) hormonal contraceptive groups were significantly higher compared to L. gasseri
(p=0.0057, p<0.0001), L. jensenii (p<0.0001, p<0.0001) and L. crispatus (p=0.0132, p<0.0001).
The Implanon hormonal contraceptive (Figure 4.3.4B) had significantly higher copies/ng of G.
vaginalis in comparison to L. gasseri (p=0.0375) L. jensenii (p<0.0001) and L. crispatus
(p=0.003) with L. iners having significantly higher copies/ng in comparison to L. jensenii
(p=0.0375). The Implanon hormonal contraceptive had the least association with the bacterial
copes/ng with DMPA and Nur Isterate having similar patterns between G. vaginalis and L. iners.
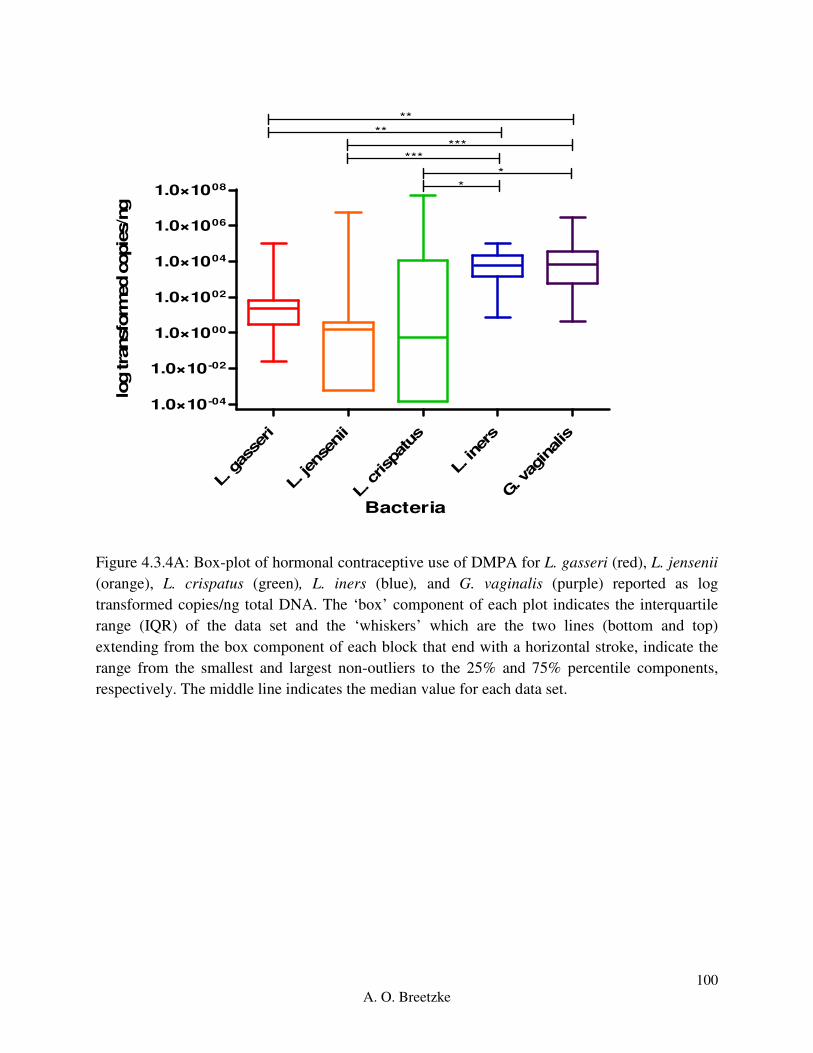
100
A. O. Breetzke
L. g
asse
ri
L. jen
senii
L. c
risp
atus
L. iner
s
G. v
aginalis
1.0×10-04
1.0×10-02
1.0×1000
1.0×1002
1.0×1004
1.0×1006
1.0×1008
**
******
**
**
Bacteria
log tra
nsfo
rmed c
opie
s/n
g
Figure 4.3.4A: Box-plot of hormonal contraceptive use of DMPA for L. gasseri (red), L. jensenii
(orange), L. crispatus (green), L. iners (blue), and G. vaginalis (purple) reported as log
transformed copies/ng total DNA. The ‘box’ component of each plot indicates the interquartile
range (IQR) of the data set and the ‘whiskers’ which are the two lines (bottom and top)
extending from the box component of each block that end with a horizontal stroke, indicate the
range from the smallest and largest non-outliers to the 25% and 75% percentile components,
respectively. The middle line indicates the median value for each data set.

101
A. O. Breetzke
L. g
asse
ri
L. jen
senii
L. c
risp
atus
L. ine
rs
G. v
aginalis
0.001
0.1
10
1000
100000
****
**
*
Bacteria
log tra
nsfo
rmed c
opie
s/n
g
Figure 4.3.4B: Box-plot of hormonal contraceptive use of the Implanon for L. gasseri (red), L.
jensenii (orange), L. crispatus (green), L. iners (blue), and G. vaginalis (purple) reported as log
transformed copies/ng total DNA. The ‘box’ component of each plot indicates the interquartile
range (IQR) of the data set and the ‘whiskers’ which are the two lines (bottom and top)
extending from the box component of each block that end with a horizontal stroke, indicate the
range from the smallest and largest non-outliers to the 25% and 75% percentile components,
respectively. The middle line indicates the median value for each data set.
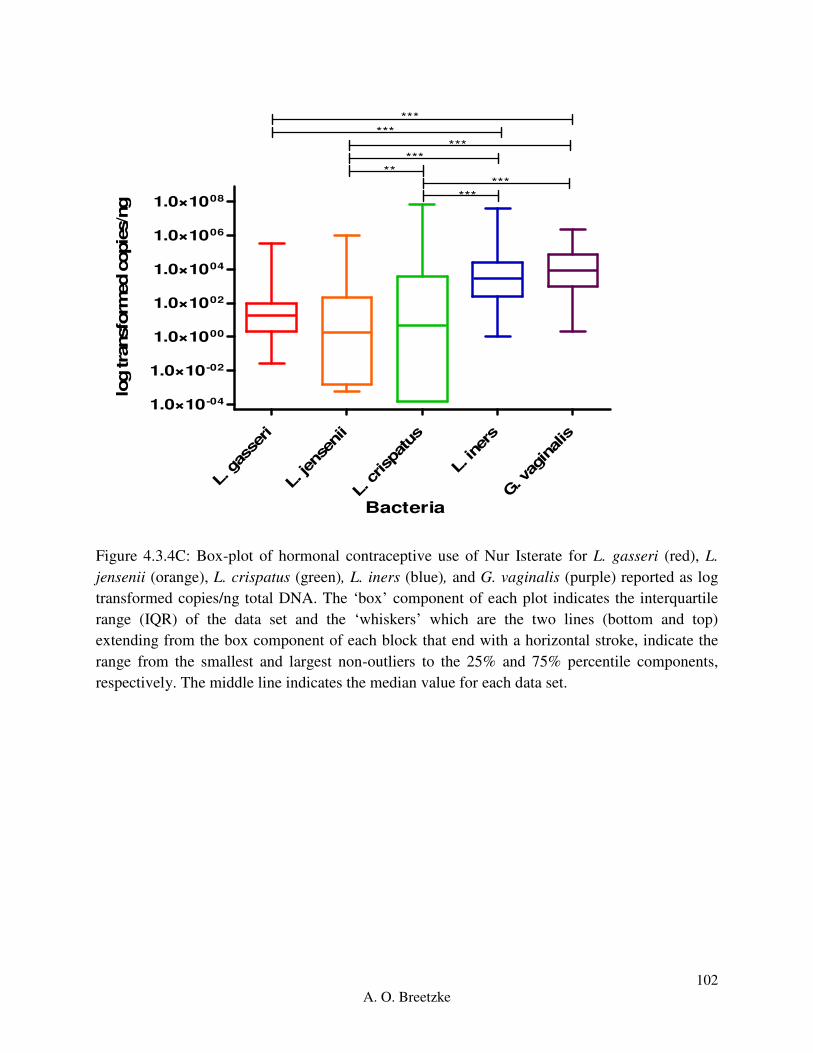
102
A. O. Breetzke
L. g
asse
ri
L. jen
senii
L. c
risp
atus
L. ine
rs
G. v
aginalis
1.0×10-04
1.0×10-02
1.0×1000
1.0×1002
1.0×1004
1.0×1006
1.0×1008
***
******
******
***
**
Bacteria
log tra
nsfo
rmed c
opie
s/n
g
Figure 4.3.4C: Box-plot of hormonal contraceptive use of Nur Isterate for L. gasseri (red), L.
jensenii (orange), L. crispatus (green), L. iners (blue), and G. vaginalis (purple) reported as log
transformed copies/ng total DNA. The ‘box’ component of each plot indicates the interquartile
range (IQR) of the data set and the ‘whiskers’ which are the two lines (bottom and top)
extending from the box component of each block that end with a horizontal stroke, indicate the
range from the smallest and largest non-outliers to the 25% and 75% percentile components,
respectively. The middle line indicates the median value for each data set.

103
A. O. Breetzke
4.3.4.1 Lactobacillus crispatus
We compared the quantified log copies/ng of L. crispatus, and found no significant differences
between the hormonal contraceptive groups (Kruskal-Wallis ANOVA p=0.276) (Figure 4.3.4.1).
DM
PA
Impla
non
Nur i
ster
ate
1.0×10-04
1.0×10-02
1.0×1000
1.0×1002
1.0×1004
1.0×1006
1.0×1008
p=0.6076
p>0.9999p=0.7778
Hormonal Contraceptive
log
tra
nsfo
rmed
co
pie
s/n
g
Figure 4.3.4.1: Comparison of the quantities of L. crispatus (log transformed copies/ng DNA)
measured in the DNA extracted from vaginal lateral wall swabs from participants in the WISH
study, between the hormonal contraceptives DMPA, Nur Isterate and the Implanon. All p-value
comparisons were based on an unpaired, non-parametric Dunn’s Multiple Comparison test. Each
point in the figure represents an individual participant. The three horizontal bars represent the
median value (middle bar), upper interquartile range (top bar) and lower interquartile range
(bottom bar).
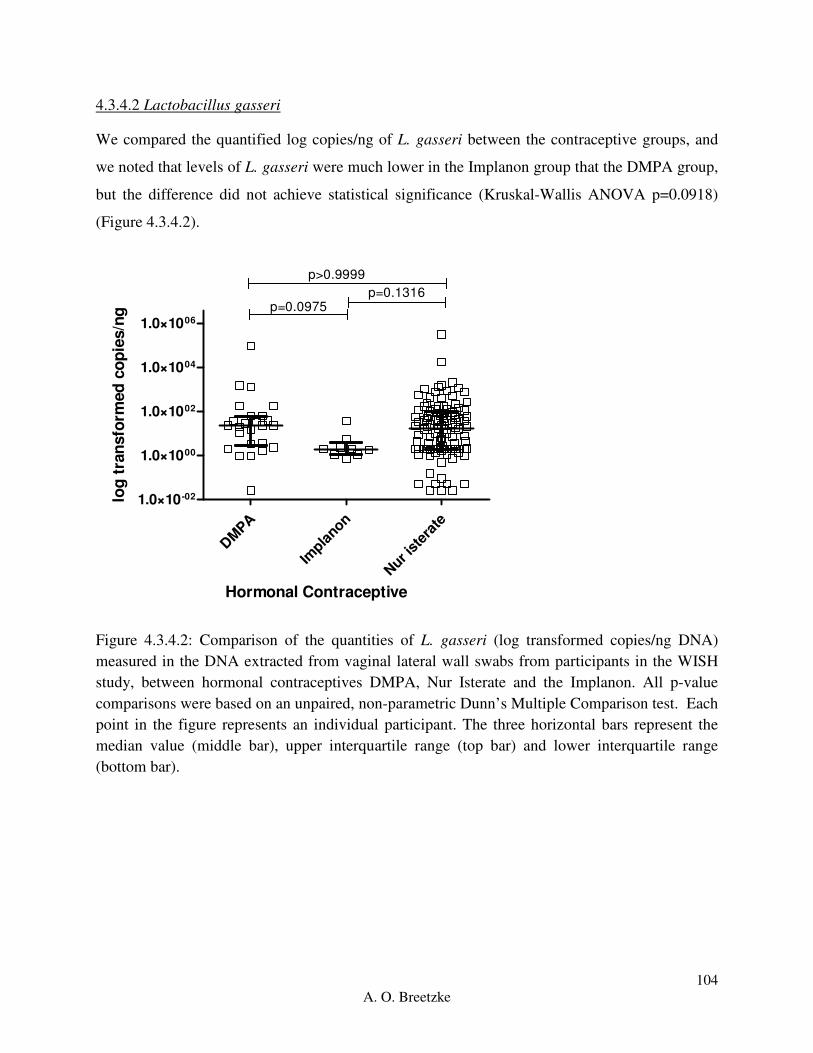
104
A. O. Breetzke
4.3.4.2 Lactobacillus gasseri
We compared the quantified log copies/ng of L. gasseri between the contraceptive groups, and
we noted that levels of L. gasseri were much lower in the Implanon group that the DMPA group,
but the difference did not achieve statistical significance (Kruskal-Wallis ANOVA p=0.0918)
(Figure 4.3.4.2).
DM
PA
Impla
non
Nur i
ster
ate
1.0×10-02
1.0×1000
1.0×1002
1.0×1004
1.0×1006
p>0.9999
p=0.0975p=0.1316
Hormonal Contraceptive
log
tra
nsfo
rmed
co
pie
s/n
g
Figure 4.3.4.2: Comparison of the quantities of L. gasseri (log transformed copies/ng DNA)
measured in the DNA extracted from vaginal lateral wall swabs from participants in the WISH
study, between hormonal contraceptives DMPA, Nur Isterate and the Implanon. All p-value
comparisons were based on an unpaired, non-parametric Dunn’s Multiple Comparison test. Each
point in the figure represents an individual participant. The three horizontal bars represent the
median value (middle bar), upper interquartile range (top bar) and lower interquartile range
(bottom bar).

105
A. O. Breetzke
4.3.4.3 Lactobacillus jensenii
We compared the quantified log copies/ng of L. jensenii between the hormonal contraceptive
groups, which had an overall significant difference (Kruskal-Wallis ANOVA p=0.0222) (Figure
4.3.4.3).
DM
PA
Impla
non
Nur i
ster
ate
1.0×10-04
1.0×10-02
1.0×1000
1.0×1002
1.0×1004
1.0×1006
1.0×1008
p=0.192
p>0.9999p=0.071
Hormonal Contraceptive
log
tra
nsfo
rmed
co
pie
s/n
g
Figure 4.3.4.3: Comparison of the quantities of L. jensenii (log transformed copies/ng DNA)
measured in the DNA extracted from vaginal lateral wall swabs from participants in the WISH
study, between hormonal contraceptives DMPA, Nur Isterate and the Implanon. All p-value
comparisons were based on an unpaired, non-parametric Dunn’s Multiple Comparison test. Each
point in the figure represents an individual participant. The three horizontal bars represent the
median value (middle bar), upper interquartile range (top bar) and lower interquartile range
(bottom bar).

106
A. O. Breetzke
4.3.4.4 Lactobacillus iners
We compared the quantified log copies/ng of L. iners and found no significant differences
between the hormonal contraceptive groups (Kruskal-Wallis ANOVA p=0.1721) (Figure
4.3.4.4).
DM
PA
Impla
non
Nur i
ster
ate
1.0×1000
1.0×1002
1.0×1004
1.0×1006
1.0×1008
p=0.9767
p=0.1841p=0.4324
Hormonal Contraceptive
log
tra
nsfo
rmed
co
pie
s/n
g
Figure 4.3.4.4: Comparison of the quantities of L. iners (log transformed copies/ng DNA)
measured in the DNA extracted from vaginal lateral wall swabs from participants in the WISH
study, between hormonal contraceptives DMPA, Nur Isterate and the Implanon. All p-value
comparisons were based on an unpaired, non-parametric Dunn’s Multiple Comparison test. Each
point in the figure represents an individual participant. The three horizontal bars represent the
median value (middle bar), upper interquartile range (top bar) and lower interquartile range
(bottom bar).

107
A. O. Breetzke
4.3.4.5 Gardnerella vaginalis
We compared the quantified log copies/ng of G. vaginalis, and found no difference between the
hormonal contraceptive groups (Kruskal-Wallis ANOVA p=0.9144) (Figure 4.3.4.5).
DM
PA
Impla
non
Nur i
ster
ate
1.0×1000
1.0×1002
1.0×1004
1.0×1006
1.0×1008p>0.9999
p>0.9999p>0.9999
Hormonal Contraceptive
log
tra
nsfo
rmed
co
pie
s/n
g
Figure 4.3.4.5: Comparison of the quantities of G. vaginalis (log transformed copies/ng DNA)
measured in the DNA extracted from vaginal lateral wall swabs from participants in the WISH
study, between the hormonal contraceptives DMPA, Nur Isterate and the Implanon. All p-value
comparisons were based on an unpaired, non-parametric Dunn’s Multiple Comparison test. Each
point in the figure represents an individual participant. The three horizontal bars represent the
median value (middle bar), upper interquartile range (top bar) and lower interquartile range
(bottom bar).
Therefore, the hormonal contraceptives DMPA, Implanon and Nur Isterate showed no patterns of
significantly different copies/ng of bacteria, except for an overall significant Kruskal-Wallis
statistic for L. jensenii (p=0.00222). There is no specific association between the hormonal
contraceptive usage and bacterial log copes/ng. However, the sample size for Implanon was
small and as such the computing power of the Kruskal-Wallis statistic could be less accurate than
with a larger sample size due to weakened statistical power. Thus it can be postulated that the

108
A. O. Breetzke
type of hormonal contraceptive used by female adolescents does not have a direct impact on the
FGT microbiota.
Due to the unreliability of the qPCR amplification results, the P. bivia data regarding hormonal
contraceptives has not been included and can be found in Appendix E: Results, page 192.
4.3.5 Association between the quantities (copies/ng) of the bacteria of interest and the absence or
presence of any one STI in the WISH cohort
The STI status was determined based on the absence or presence of any one bacterial
(Chlamydia trachomatis, Neisseria gonorrhea, and Mycoplasma genitalium), viral (Herpes
Simplex Virus 2, and Human Papilloma Virus) or parasitic (Trichomonas vaginalis) STI for each
participant.
The median copies/ng for each bacterium were compared using a Friedman’s ANOVA with a
Dunn’s Multiple Comparison test for the absence or presence of any one STI. The bacterial
copies/ng in the women with (n=78, 55.71%) and without (n=62, 44.29%) any one STI were
significantly different to each other (ANOVA p<0.0001). For the p-values of the Friedman’s
ANOVA test with a Dunn’s Multiple Comparison test run across both STI groups, see Appendix
D qPCR results, Section 2.5. Asterisk stars were used in the following figures where one start (*)
indicates a p-value lower than 0.05, two stars (**) indicate a p-value lower than 0.01 and three
stars (***) indicate a p-value lower than 0.001.
In the absence of any one STI (Figure 4.3.5A), G. vaginalis and L. iners had a significant higher
in copies/ng with a p-value of >0.0001 in comparison to L. gasseri, L. jensenii and L. crispatus.
The same pattern was followed by G. vaginalis and L. iners in the presence of any one STI
(Figure 4.3.5B), except L. iners had significantly higher p-value of 0.0002 compared to L.
crispatus, which in turn was significantly higher to L. jensenii (p=0.0079). The absence of or
presence of any one STI is similar to the overall cohort.

109
A. O. Breetzke
L. g
asse
ri
L. jen
senii
L. c
risp
atus
L. ine
rs
G. v
aginalis
1.0×10-04
1.0×10-02
1.0×1000
1.0×1002
1.0×1004
1.0×1006
1.0×1008
***
******
******
***
Bacteria
log tra
nsfo
rmed c
opie
s/n
g
Figure 4.3.5A: Box-plot of the absence of any one STI for L. gasseri (red), L. jensenii (orange),
L. crispatus (green), L. iners (blue), and G. vaginalis (purple) reported as log transformed
copies/ng total DNA. The ‘box’ component of each plot indicates the interquartile range (IQR)
of the data set and the ‘whiskers’ which are the two lines (bottom and top) extending from the
box component of each block that end with a horizontal stroke, indicate the range from the
smallest and largest non-outliers to the 25% and 75% percentile components, respectively. The
middle line indicates the median value for each data set.

110
A. O. Breetzke
L. g
asse
ri
L. jen
senii
L. c
risp
atus
L. iner
s
G. v
aginalis
1.0×10-04
1.0×10-02
1.0×1000
1.0×1002
1.0×1004
1.0×1006
1.0×1008
***
******
******
***
**
Bacteria
log tra
nsfo
rmed c
opie
s/n
g
Figure 4.3.5B: Box-plot of the presence of any one STI for L. gasseri (red), L. jensenii (orange),
L. crispatus (green), L. iners (blue), and G. vaginalis (purple) reported as log transformed
copies/ng total DNA. The ‘box’ component of each plot indicates the interquartile range (IQR)
of the data set and the ‘whiskers’ which are the two lines (bottom and top) extending from the
box component of each block that end with a horizontal stroke, indicate the range from the
smallest and largest non-outliers to the 25% and 75% percentile components, respectively. The
middle line indicates the median value for each data set.

111
A. O. Breetzke
4.3.5.1 Lactobacillus crispatus
We compared the quantified log copies/ng of L. crispatus, and found no difference between the
participants with and without any one STI (p=0.9655) (Figure 4.3.5.1).
Abse
nt
Prese
nt
1.0×10-04
1.0×10-02
1.0×1000
1.0×1002
1.0×1004
1.0×1006
1.0×1008
p=0.9655
STI Status
log
tra
nsfo
rmed
co
pie
s/n
g
Figure 4.3.5.1: Comparison of the quantities of L. crispatus (log transformed copies/ng DNA)
measured in the DNA extracted from vaginal lateral wall swabs from participants in the WISH
study, where the samples have been separated based on absence or presence of any one of the
WISH cohort STIs present. All p-value comparisons were based on an unpaired, non-parametric
Mann-Whitney t-test statistic. Each point in the figure represents an individual participant. The
three horizontal bars represent the median value (middle bar), upper interquartile range (top bar)
and lower interquartile range (bottom bar).

112
A. O. Breetzke
4.3.5.2 Lactobacillus gasseri
We compared the quantified log copies/ng of L. gasseri and found no significant differences
between the participants with and without any one STI (p=0.6386) (Figure 4.3.5.2).
Abse
nt
Prese
nt
1.0×10-01
1.0×1001
1.0×1003
1.0×1005
1.0×1007 p=0.6386
STI Status
log
tra
nsfo
rmed
co
pie
s/n
g
Figure 4.3.5.2: Comparison of the quantities of L. gasseri (log transformed copies/ng DNA)
measured in the DNA extracted from vaginal lateral wall swabs from participants in the WISH
study, where the samples have been separated based on absence or presence of any one of the
WISH cohort STIs present. All p-value comparisons were based on an unpaired, non-parametric
Mann-Whitney t-test statistic. Each point in the figure represents an individual participant. The
three horizontal bars represent the median value (middle bar), upper interquartile range (top bar)
and lower interquartile range (bottom bar).

113
A. O. Breetzke
4.3.5.3 Lactobacillus jensenii
We compared the quantified log copies/ng of L. jensenii and found no difference between the
participants with and without any one STI (p=0.735) (Figure 4.3.5.3).
Abse
nt
Prese
nt
1.0×10-04
1.0×10-02
1.0×1000
1.0×1002
1.0×1004
1.0×1006
1.0×1008
p=0.735
STI Status
log
tra
nsfo
rmed
co
pie
s/n
g
Figure 4.3.5.3: Comparison of the quantities of L. jensenii (log transformed copies/ng DNA)
measured in the DNA extracted from vaginal lateral wall swabs from participants in the WISH
study, where the samples have been separated based on absence or presence of any one of the
WISH cohort STIs present. All p-value comparisons were based on an unpaired, non-parametric
Mann-Whitney t-test statistic. Each point in the figure represents an individual participant. The
three horizontal bars represent the median value (middle bar), upper interquartile range (top bar)
and lower interquartile range (bottom bar).
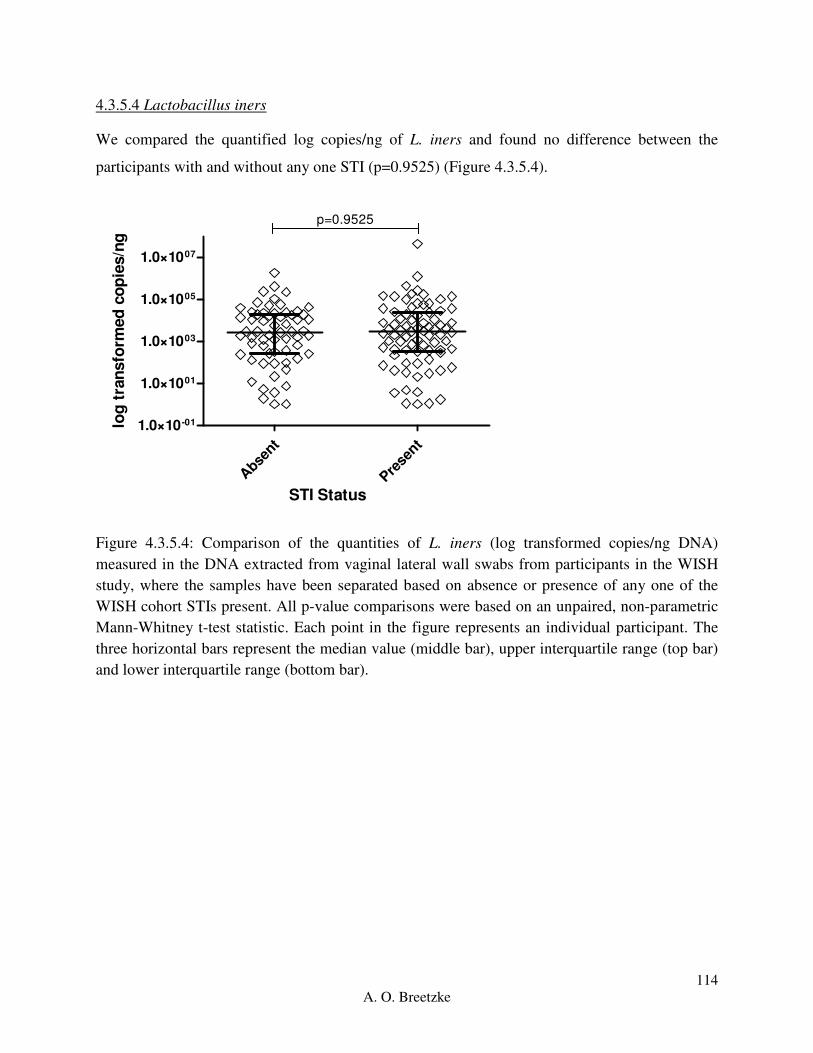
114
A. O. Breetzke
4.3.5.4 Lactobacillus iners
We compared the quantified log copies/ng of L. iners and found no difference between the
participants with and without any one STI (p=0.9525) (Figure 4.3.5.4).
Abse
nt
Prese
nt
1.0×10-01
1.0×1001
1.0×1003
1.0×1005
1.0×1007
p=0.9525
STI Status
log
tra
nsfo
rmed
co
pie
s/n
g
Figure 4.3.5.4: Comparison of the quantities of L. iners (log transformed copies/ng DNA)
measured in the DNA extracted from vaginal lateral wall swabs from participants in the WISH
study, where the samples have been separated based on absence or presence of any one of the
WISH cohort STIs present. All p-value comparisons were based on an unpaired, non-parametric
Mann-Whitney t-test statistic. Each point in the figure represents an individual participant. The
three horizontal bars represent the median value (middle bar), upper interquartile range (top bar)
and lower interquartile range (bottom bar).
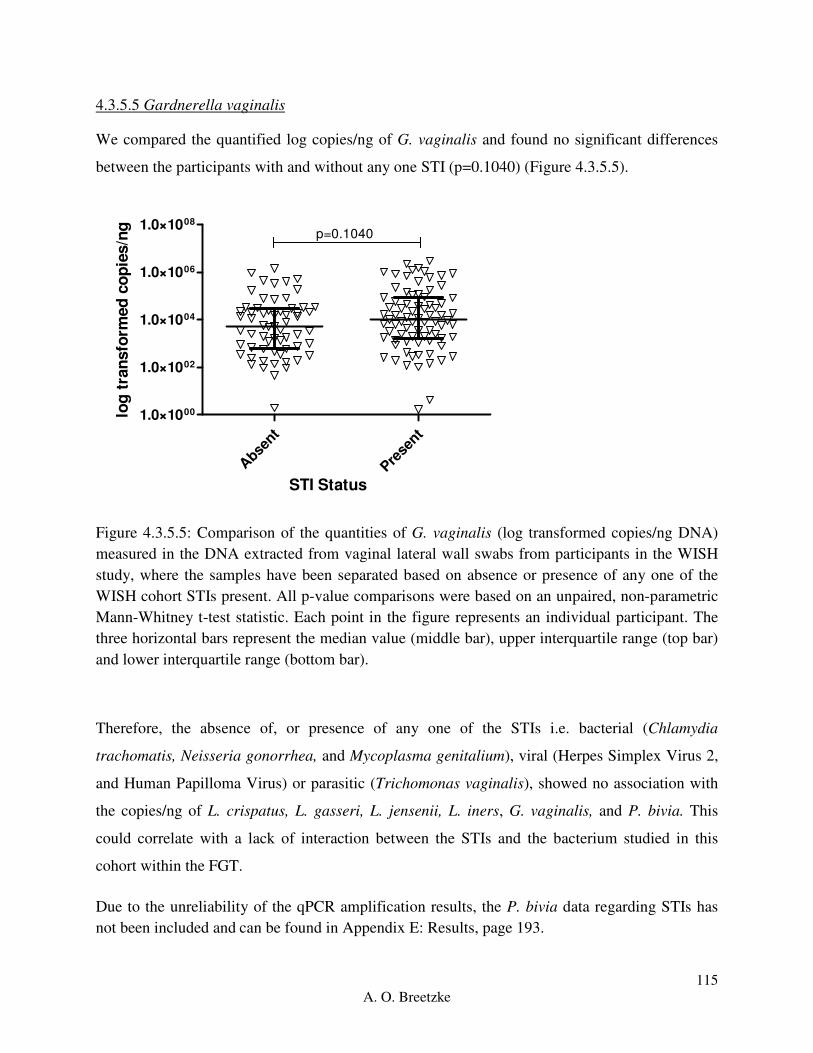
115
A. O. Breetzke
4.3.5.5 Gardnerella vaginalis
We compared the quantified log copies/ng of G. vaginalis and found no significant differences
between the participants with and without any one STI (p=0.1040) (Figure 4.3.5.5).
Abse
nt
Prese
nt
1.0×1000
1.0×1002
1.0×1004
1.0×1006
1.0×1008
p=0.1040
STI Status
log
tra
nsfo
rmed
co
pie
s/n
g
Figure 4.3.5.5: Comparison of the quantities of G. vaginalis (log transformed copies/ng DNA)
measured in the DNA extracted from vaginal lateral wall swabs from participants in the WISH
study, where the samples have been separated based on absence or presence of any one of the
WISH cohort STIs present. All p-value comparisons were based on an unpaired, non-parametric
Mann-Whitney t-test statistic. Each point in the figure represents an individual participant. The
three horizontal bars represent the median value (middle bar), upper interquartile range (top bar)
and lower interquartile range (bottom bar).
Therefore, the absence of, or presence of any one of the STIs i.e. bacterial (Chlamydia
trachomatis, Neisseria gonorrhea, and Mycoplasma genitalium), viral (Herpes Simplex Virus 2,
and Human Papilloma Virus) or parasitic (Trichomonas vaginalis), showed no association with
the copies/ng of L. crispatus, L. gasseri, L. jensenii, L. iners, G. vaginalis, and P. bivia. This
could correlate with a lack of interaction between the STIs and the bacterium studied in this
cohort within the FGT.
Due to the unreliability of the qPCR amplification results, the P. bivia data regarding STIs has
not been included and can be found in Appendix E: Results, page 193.

116
A. O. Breetzke
4.3.6 Association between the quantities (copies/ng) of the bacteria of interest and the presence
of bacterial or viral STIs in the WISH cohort
The STI status was determined based on the sum value of the presence or absence of all bacterial
(Chlamydia trachomatis, Neisseria gonorrhea, and Mycoplasma genitalium), or viral (Herpes
Simplex Virus 2, and Human Papilloma Virus) for each participant within the WISH cohort.
The median copies/ng for each bacterium were compared using a Friedman’s ANOVA with a
Dunn’s Multiple Comparison test for the absence (n=77, 53.85%), presence of one (n=51,
35.66%) or presence of two or more (n=15, 10.49%) bacterial STIs. Further, the median
copies/ng for each bacterium were compared using a Friedman’s ANOVA with a Dunn’s
Multiple Comparison test for the absence (n=46, 32.17%), presence of one (n=91, 63.63%) or
presence of two (n=6, 4.20%) viral STIs. There was an overall significant difference between the
copies/ng of the bacteria in the bacterial STI groups (ANOVA p<0.0001). The ANOVA tests
were significantly different for copies/ng of the bacteria in both the absence of and presence of
one viral STI (p<0.0001) and the presence of two viral STIs (p=0.0162). The figures comparing
the bacterium copies/ng per bacterial and viral STI group followed the same trends as the
absence or presence of any one STI as well as the overall cohort and as such have not been
included within this chapter. For the representative figures and p-values of the Friedman’s
ANOVA test with a Dunn’s Multiple Comparisons run across the bacterial and viral STI groups,
see Appendix D qPCR results, Section 2.6.

117
A. O. Breetzke
4.3.6.1 Lactobacillus crispatus
We compared log copies/ng of L. crispatus between those with none, one or two (or more)
bacterial or viral STI groups. There was no significant difference in L. crispatus between the
bacterial STI groups (Kruskal-Wallis ANOVA p=0.8469). There was no significant difference in
L. crispatus between the viral STI groups (Kruskal-Wallis ANOVA p=0.2327) (Figure 4.3.6.1)
B N
one
B O
ne
B T
wo<
V None
V One
V Two
1.0×10-04
1.0×10-02
1.0×1000
1.0×1002
1.0×1004
1.0×1006
1.0×1008
p>0.9999
p>0.9999p>0.9999
p=0.2587
p>0.9999p=0.1176
STI Type
log
tra
nsfo
rmed
co
pie
s/n
g
Figure 4.3.6.1: Comparison of the quantities of L. crispatus (log transformed copies/ng DNA)
measured in the DNA extracted from vaginal lateral wall swabs from participants in the WISH
study, where the samples have been separated based on none, one, two (or more <) of the WISH
cohort Bacterial (B) versus Viral (V) STIs being present. All p-value comparisons were based on
an unpaired, non-parametric Dunn’s Multiple Comparison test. Each point in the figure
represents an individual participant. The three horizontal bars represent the median value (middle
bar), upper interquartile range (top bar) and lower interquartile range (bottom bar).

118
A. O. Breetzke
4.3.6.2 Lactobacillus gasseri
We compared the quantified log copies/ng of L. gasseri between those with none, one or two (or
more) bacterial or viral STI groups. There was no significant difference in L. gasseri between the
bacterial STI groups (Kruskal-Wallis ANOVA p=0.8184) and the viral STI groups (Kruskal-
Wallis ANOVA p=0.2327) (Figure 4.3.6.2).
B N
one
B O
ne
B T
wo<
V None
V One
V Two
1.0×10-02
1.0×1000
1.0×1002
1.0×1004
1.0×1006
p>0.9999
p>0.9999p>0.9999
p=0.273
p>0.9999p=0.4503
STI Type
log
tra
nsfo
rmed
co
pie
s/n
g
Figure 4.3.6.2: Comparison of the quantities of L. gasseri (log transformed copies/ng DNA)
measured in the DNA extracted from vaginal lateral wall swabs from participants in the WISH
study, where the samples have been separated based on none, one, two (or more <) of the WISH
cohort Bacterial (B) versus Viral (V) STIs being present. All p-value comparisons were based on
an unpaired, non-parametric Dunn’s Multiple Comparison test. Each point in the figure
represents an individual participant. The three horizontal bars represent the median value (middle
bar), upper interquartile range (top bar) and lower interquartile range (bottom bar).

119
A. O. Breetzke
4.3.6.3 Lactobacillus jensenii
We compared the quantified log copies/ng of L. jensenii between those with none, one or two (or
more) bacterial or viral STI groups. The bacterial STI groups had no significant difference in L.
jensenii between the bacterial STI groups (Kruskal-Wallis ANOVA p=0.4743) and the viral STI
groups (Kruskal-Wallis ANOVA p=0.2219) (Figure 4.3.6.3).
B N
one
B O
ne
B T
wo<
V None
V One
V Two
1.0×10-04
1.0×10-02
1.0×1000
1.0×1002
1.0×1004
1.0×1006
1.0×1008
p=0.6678
p>0.9999p=0.925
p=0.5784
p=0.4309p>0.9999
STI Type
log
tra
nsfo
rmed
co
pie
s/n
g
Figure 4.3.6.3: Comparison of the quantities of L. jensenii (log transformed copies/ng DNA)
measured in the DNA extracted from vaginal lateral wall swabs from participants in the WISH
study, where the samples have been separated based on none, one, two (or more <) of the WISH
cohort Bacterial (B) versus Viral (V) STIs being present. All p-value comparisons were based on
an unpaired, non-parametric Dunn’s Multiple Comparison test. Each point in the figure
represents an individual participant. The three horizontal bars represent the median value (middle
bar), upper interquartile range (top bar) and lower interquartile range (bottom bar).
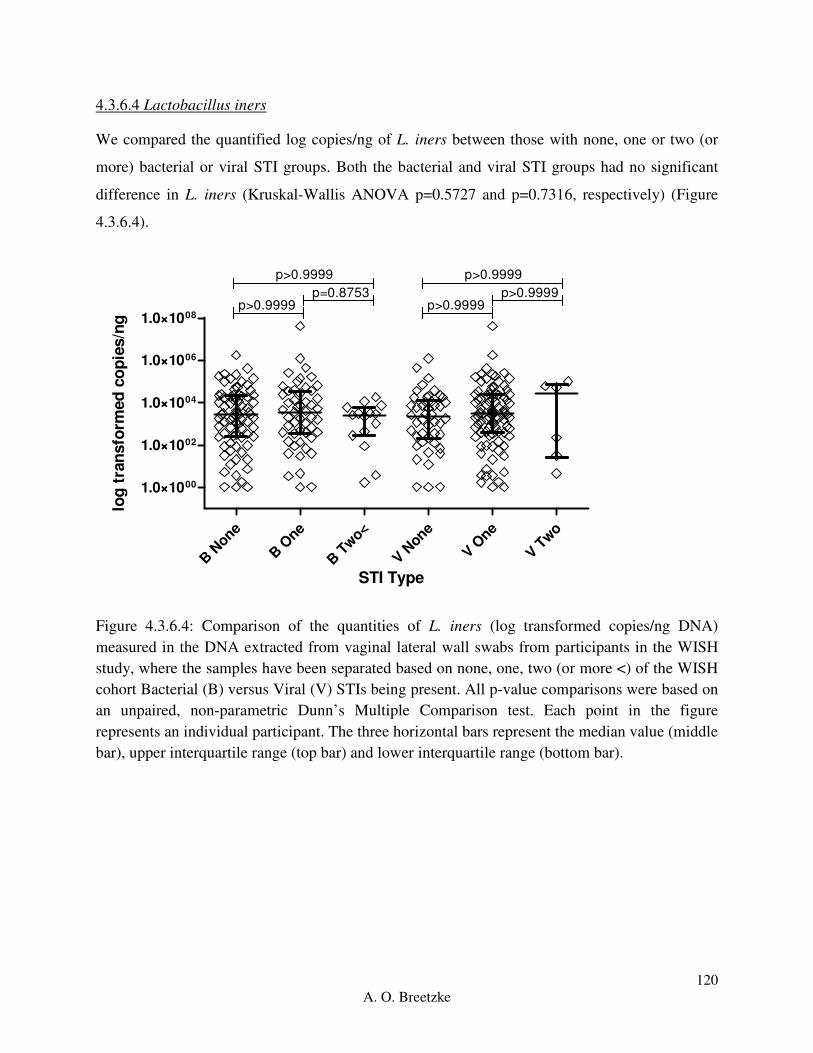
120
A. O. Breetzke
4.3.6.4 Lactobacillus iners
We compared the quantified log copies/ng of L. iners between those with none, one or two (or
more) bacterial or viral STI groups. Both the bacterial and viral STI groups had no significant
difference in L. iners (Kruskal-Wallis ANOVA p=0.5727 and p=0.7316, respectively) (Figure
4.3.6.4).
B N
one
B O
ne
B T
wo<
V N
one
V One
V Two
1.0×1000
1.0×1002
1.0×1004
1.0×1006
1.0×1008
p>0.9999
p>0.9999p=0.8753
p>0.9999
p>0.9999p>0.9999
STI Type
log
tra
nsfo
rmed
co
pie
s/n
g
Figure 4.3.6.4: Comparison of the quantities of L. iners (log transformed copies/ng DNA)
measured in the DNA extracted from vaginal lateral wall swabs from participants in the WISH
study, where the samples have been separated based on none, one, two (or more <) of the WISH
cohort Bacterial (B) versus Viral (V) STIs being present. All p-value comparisons were based on
an unpaired, non-parametric Dunn’s Multiple Comparison test. Each point in the figure
represents an individual participant. The three horizontal bars represent the median value (middle
bar), upper interquartile range (top bar) and lower interquartile range (bottom bar).

121
A. O. Breetzke
4.3.6.5 Gardnerella vaginalis
We compared the quantified log copies/ng of G. vaginalis between those with none, one or two
(or more) bacterial or viral STI groups. In the bacterial STI groups there was no significant
difference in G. vaginalis (Kruskal-Wallis ANOVA p=0.2239). The group with two viral STIs
had significantly different copies/ng of G. vaginalis compared to no viral STI (p=0.0098) and
one viral STI (p=0.0324). There was an overall significant difference in G. vaginalis between the
viral STI groups (Kruskal-Wallis ANOVA p=0.0126) (Figure 4.3.6.5). This significance could
be skewed due to the reduced participants with two viral STIs.
B N
one
B O
ne
B T
wo<
V None
V One
V Two
1.0×1000
1.0×1001
1.0×1002
1.0×1003
1.0×1004
1.0×1005
1.0×1006
1.0×1007
p>0.9999
p=0.2842p=0.9033
p=0.0098
p=0.7897p=0.0324
STI Type
log
tra
nsfo
rmed
co
pie
s/n
g
Figure 4.3.6.5: Comparison of the quantities of G. vaginalis (log transformed copies/ng DNA)
measured in the DNA extracted from vaginal lateral wall swabs from participants in the WISH
study, where the samples have been separated based on none, one, two (or more <) of the WISH
cohort Bacterial (B) versus Viral (V) STIs being present. All p-value comparisons were based on
an unpaired, non-parametric Dunn’s Multiple Comparison test. Each point in the figure
represents an individual participant. The three horizontal bars represent the median value (middle
bar), upper interquartile range (top bar) and lower interquartile range (bottom bar).
The above figures thus indicate that the presence of none, one or two or more bacterial STIs
(Chlamydia trachomatis, Neisseria gonorrhea, and Mycoplasma genitalium), have no association

122
A. O. Breetzke
with the copies/ng of L. crispatus, L. gasseri, L. jensenii, L. iners, G. vaginalis and P. bivia. The
absence or presence of one or two viral STIs (Herpes Simplex Virus 2, and Human Papilloma
Virus) showed no association with the copies/ng of L. crispatus, L. gasseri, L. jensenii, and L.
iners. There was an association between the presence of two viral STIs and the copies/ng of G.
vaginalis and P. bivia, which was not seen in the comparison of the copies/ng of the bacteria
within the group. However, this could be due to the low participant number within the group and
the statistical significance may decrease with an increase in number of participants. The bacterial
and viral STI groups had increased copies/ng of G. vaginalis and L. iners in comparison to the
other four bacteria. From this data it can be estimated that neither the absence, nor the increasing
presence of bacterial or viral STIs have any association with the copies/ng of the bacterium
quantified in this cohort.
Due to the unreliability of the qPCR amplification results, the P. bivia data regarding bacterial
and viral STIs has not been included and can be found in Appendix E: Results, page 201.
4.3.7 Association between the quantities (copies/ng) of bacteria of interest and the absence or
presence of low and high risk HPV subtypes in the WISH cohort
The HPV status was considered negative in the absence of all HPV subtypes amplified by the
Roche linear array, low risk if 6, 11, 40, 42, 54, 55, 61, 62, 64, 67, 69, 70, 71, 72, 81, 83, 84,
89(CP6109) and IS39 HPV subtypes were present, and high risk if 16, 18, 26, 31, 33, 35, 39, 45,
51, 52, 53, 56, 58, 59, 66, 68, 73 and 82 HPV subtypes were present.
The median copies/ng for each bacterium were compared using a Friedman’s ANOVA with a
Dunn’s Multiple Comparison test for the negative (n=29, 32.22%), low risk (n=27, 30%) and
high risk (n=34, 37.78%) HPV groups. The comparison of the copies/ng between the bacteria in
each category, were significantly different to each other overall (ANOVA p<0.0001). For the p-
values of the Friedman’s ANOVA test with a Dunn’s Multiple Comparison test run across the
HPV groups, see Appendix D qPCR results, Section 2.7. Asterisk stars were used in the
following figures where one start (*) indicates a p-value lower than 0.05, two stars (**) indicate
a p-value lower than 0.01 and three stars (***) indicate a p-value lower than 0.001.

123
A. O. Breetzke
Within the negative HPV group (Figure 4.3.7A), G. vaginalis and L. iners had significantly
higher copies/ng in comparison to L. gasseri (p=0.0023) and L. jensenii (p<0.0001), with L.
crispatus having a significantly higher copies/ng with p=0.0023 in comparison to L. jensenii.
Within the low risk HPV group (Figure 4.3.7B), G. vaginalis and L. iners were significantly
higher than L. jensenii (p<0.0001), L. crispatus (p<0.0001) and L. gasseri (p=0.0001, p=0.0017
respectively). G. vaginalis and L. iners were significantly higher than L. jensenii (p<0.0001) and
L. gasseri (p<0.0001) in the high risk HPV group (Figure 4.3.7C) with G. vaginalis and L.
crispatus showing significantly higher copies/ng in comparison to L. crispatus (p=0.00112) and
L. jensenii (p=0.0089) respectively. The low and high risk HPV groups showed similar trends in
the copies/ng of the bacteria with only a slight difference with L. crispatus in relation to the
negative HPV group.
L. g
asse
ri
L. jen
senii
L. c
risp
atus
L. iner
s
G. v
aginalis
1.0×10-04
1.0×10-02
1.0×1000
1.0×1002
1.0×1004
1.0×1006
1.0×1008 **
******
**
**
Bacteria
log tra
nsfo
rmed c
opie
s/n
g
Figure 4.3.7A: Box-plot of the negative HPV group for L. gasseri (red), L. jensenii (orange), L.
crispatus (green), L. iners (blue), and G. vaginalis (purple) reported as log transformed copies/ng
total DNA. The ‘box’ component of each plot indicates the interquartile range (IQR) of the data
set and the ‘whiskers’ which are the two lines (bottom and top) extending from the box
component of each block that end with a horizontal stroke, indicate the range from the smallest
and largest non-outliers to the 25% and 75% percentile components, respectively. The middle
line indicates the median value for each data set.

124
A. O. Breetzke
L. g
asse
ri
L. jen
senii
L. c
risp
atus
L. ine
rs
G. v
aginalis
1.0×10-04
1.0×10-02
1.0×1000
1.0×1002
1.0×1004
1.0×1006
1.0×1008
**
******
******
***
Bacteria
log tra
nsfo
rmed c
opie
s/n
g
Figure 4.3.7B: Box-plot of the low risk HPV group for L. gasseri (red), L. jensenii (orange), L.
crispatus (green), L. iners (blue), and G. vaginalis (purple) reported as log transformed copies/ng
total DNA. The ‘box’ component of each plot indicates the interquartile range (IQR) of the data
set and the ‘whiskers’ which are the two lines (bottom and top) extending from the box
component of each block that end with a horizontal stroke, indicate the range from the smallest
and largest non-outliers to the 25% and 75% percentile components, respectively. The middle
line indicates the median value for each data set.

125
A. O. Breetzke
L. g
asse
ri
L. jen
senii
L. c
risp
atus
L. ine
rs
G. v
aginalis
1.0×10-04
1.0×10-02
1.0×1000
1.0×1002
1.0×1004
1.0×1006
1.0×1008
***
******
*
***
**
Bacteria
log tra
nsfo
rmed c
opie
s/n
g
Figure 4.3.7C: Box-plot of the high risk HPV group for L. gasseri (red), L. jensenii (orange), L.
crispatus (green), L. iners (blue), and G. vaginalis (purple) reported as log transformed copies/ng
total DNA. The ‘box’ component of each plot indicates the interquartile range (IQR) of the data
set and the ‘whiskers’ which are the two lines (bottom and top) extending from the box
component of each block that end with a horizontal stroke, indicate the range from the smallest
and largest non-outliers to the 25% and 75% percentile components, respectively. The middle
line indicates the median value for each data set.

126
A. O. Breetzke
4.3.7.1 Lactobacillus crispatus
The log copies/ng of L. crispatus within the high risk HPV group were significantly higher than
the copies/ng in the low risk HPV group. There was an overall significant difference in L.
crispatus between the HPV groups (Kruskal-Wallis ANOVA p=0.0145) (Figure 4.3.7.1).
Neg
ativ
e
Low R
isk
Hig
h Ris
k
1.0×10-04
1.0×10-02
1.0×1000
1.0×1002
1.0×1004
1.0×1006
p>0.9999
p=0.0667p=0.0181
HPV Status
log
tra
nsfo
rmed
co
pie
s/n
g
Figure 4.3.7.1: Comparison of the quantities of L. crispatus (log transformed copies/ng DNA)
measured in the DNA extracted from vaginal lateral wall swabs from participants in the WISH
study, between the negative, low risk and high risk HPV groups. All p-value comparisons were
based on an unpaired, non-parametric Dunn’s Multiple Comparison test. Each point in the figure
represents an individual participant. The three horizontal bars represent the median value (middle
bar), upper interquartile range (top bar) and lower interquartile range (bottom bar).
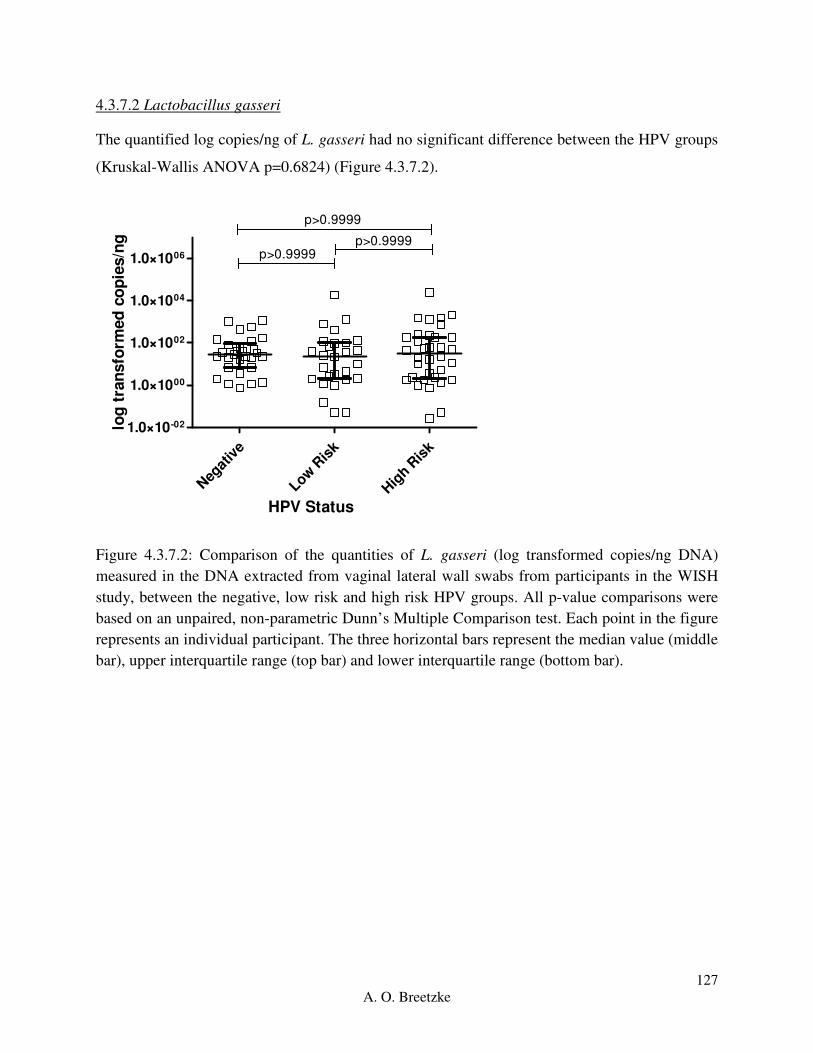
127
A. O. Breetzke
4.3.7.2 Lactobacillus gasseri
The quantified log copies/ng of L. gasseri had no significant difference between the HPV groups
(Kruskal-Wallis ANOVA p=0.6824) (Figure 4.3.7.2).
Neg
ativ
e
Low R
isk
Hig
h Ris
k
1.0×10-02
1.0×1000
1.0×1002
1.0×1004
1.0×1006
p>0.9999
p>0.9999p>0.9999
HPV Status
log
tra
nsfo
rmed
co
pie
s/n
g
Figure 4.3.7.2: Comparison of the quantities of L. gasseri (log transformed copies/ng DNA)
measured in the DNA extracted from vaginal lateral wall swabs from participants in the WISH
study, between the negative, low risk and high risk HPV groups. All p-value comparisons were
based on an unpaired, non-parametric Dunn’s Multiple Comparison test. Each point in the figure
represents an individual participant. The three horizontal bars represent the median value (middle
bar), upper interquartile range (top bar) and lower interquartile range (bottom bar).
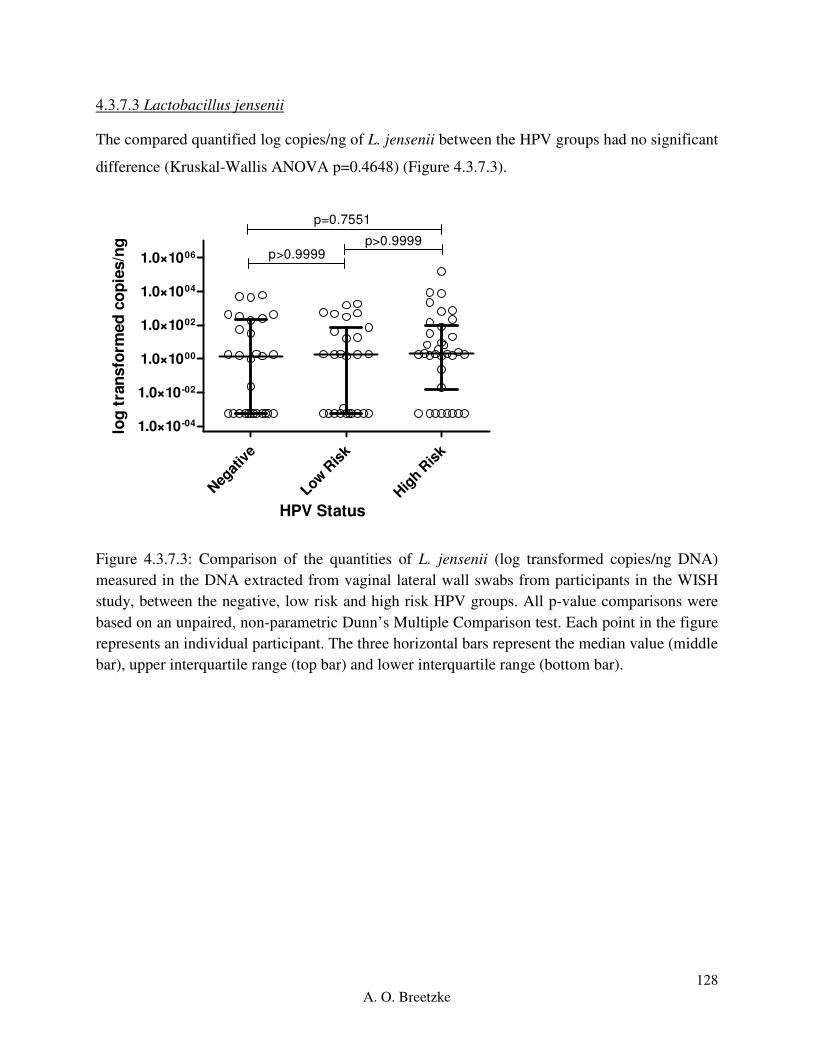
128
A. O. Breetzke
4.3.7.3 Lactobacillus jensenii
The compared quantified log copies/ng of L. jensenii between the HPV groups had no significant
difference (Kruskal-Wallis ANOVA p=0.4648) (Figure 4.3.7.3).
Neg
ativ
e
Low R
isk
Hig
h Ris
k
1.0×10-04
1.0×10-02
1.0×1000
1.0×1002
1.0×1004
1.0×1006
p=0.7551
p>0.9999p>0.9999
HPV Status
log
tra
nsfo
rmed
co
pie
s/n
g
Figure 4.3.7.3: Comparison of the quantities of L. jensenii (log transformed copies/ng DNA)
measured in the DNA extracted from vaginal lateral wall swabs from participants in the WISH
study, between the negative, low risk and high risk HPV groups. All p-value comparisons were
based on an unpaired, non-parametric Dunn’s Multiple Comparison test. Each point in the figure
represents an individual participant. The three horizontal bars represent the median value (middle
bar), upper interquartile range (top bar) and lower interquartile range (bottom bar).

129
A. O. Breetzke
4.3.7.4 Lactobacillus iners
There was no significant difference in L. iners between the HPV groups (Kruskal-Wallis
ANOVA p=0.9488) (Figure 4.3.7.4).
Neg
ativ
e
Low R
isk
Hig
h Ris
k
1.0×1000
1.0×1002
1.0×1004
1.0×1006
p>0.9999
p>0.9999p>0.9999
HPV Status
log
tra
nsfo
rmed
co
pie
s/n
g
Figure 4.3.7.4: Comparison of the quantities of L. iners (log transformed copies/ng DNA)
measured in the DNA extracted from vaginal lateral wall swabs from participants in the WISH
study, between the negative, low risk and high risk HPV groups. All p-value comparisons were
based on an unpaired, non-parametric Dunn’s Multiple Comparison test. Each point in the figure
represents an individual participant. The three horizontal bars represent the median value (middle
bar), upper interquartile range (top bar) and lower interquartile range (bottom bar).

130
A. O. Breetzke
4.3.7.5 Gardnerella vaginalis
The compared quantified log copies/ng of G. vaginalis between the HPV groups had no
significant difference (Kruskal-Wallis ANOVA p=0.1756) (Figure 4.3.7.5).
Neg
ativ
e
Low R
isk
Hig
h Ris
k
1.0×1000
1.0×1001
1.0×1002
1.0×1003
1.0×1004
1.0×1005
1.0×1006
1.0×1007
p=0.2391
p=0.447p>0.9999
HPV Status
log
tra
nsfo
rmed
co
pie
s/n
g
Figure 4.3.7.5: Comparison of the quantities of G. vaginalis (log transformed copies/ng DNA)
measured in the DNA extracted from vaginal lateral wall swabs from participants in the WISH
study, between the negative, low risk and high risk HPV groups. All p-value comparisons were
based on an unpaired, non-parametric Dunn’s Multiple Comparison test. Each point in the figure
represents an individual participant. The three horizontal bars represent the median value (middle
bar), upper interquartile range (top bar) and lower interquartile range (bottom bar).
Therefore, the absence of HPV, as well as the presence of low risk or high risk HPV sub-types
showed no association with the bacterial copies/ng of L. gasseri, L. jensenii, L. iners, G.
vaginalis, and P. bivia. There were significantly higher copies/ng of L. crispatus in the high risk
HPV in comparison to the low risk HPV group, with an overall significant difference between
the negative, low risk and high risk HPV groups (ANOVA p=0.0145). Thus high-risk HPV
subtypes indicate an association with increased L. crispatus copies/ng, with no further
associations with the other bacterium within this cohort.

131
A. O. Breetzke
Due to the unreliability of the qPCR amplification results, the P. bivia data regarding HPV has
not been included and can be found in Appendix E: Results, page 203.
4.4 Overview
Overall, within the cohort, G. vaginalis and L. iners had high copies/ng in vaginal samples in
comparison to the other bacteria. There was a diverse effect of the BV status on the quantities
(copies/ng) of bacteria measured on the adolescent female lateral wall swab DNA. As expected,
participants who were BV negative had increased levels of L. crispatus (copies/ng) and L.
gasseri (copies/ng) in comparison to both the BV intermediate and BV positive participants
while L. jensenii (copies/ng) and L. iners (copies/ng) showed increased levels in comparison to
the BV positive and BV intermediate participants, respectively. The participants in the BV
positive group showed the opposite traits with increased levels of G. vaginalis (copies/ng) in
comparison to both the BV intermediate and BV negative groups. L. iners, although significantly
higher in BV negative versus BV intermediate, did not differ between BV positive and BV
negative, and was ubiquitously present. The low inflammation group showed increased copies/ng
of L. crispatus, L. gasseri, and L. jensenii in comparison to the high inflammation group. The
two inflammatory groups indicated no association with the copies/ng of L. iners, and G.
vaginalis, within the FGT of these adolescent participants.
There was a slight association between L. jensenii and hormonal contraceptive usage, G.
vaginalis and the presence of two viral STIs in comparison to none and one, P. bivia and the
presence of two viral STIs in comparison to none present, and L. iners with the low risk and high
risk HPV groups. Furthermore, no category of interest within this study showed any impact on
with the copies/ng of P. bivia with non-significant p-values in all group comparisons, except for
the presence of the two viral STIs. From the above data, we can conclude that within this cohort,
the quantities (copies/ng DNA) of the bacteria we measured within the FGT microbiome are do
not have a distinct association with age, the absence or present of any one STI, absence or
presence of any one, two or more bacterial STIs (Chlamydia trachomatis, Neisseria gonorrhea,
and Mycoplasma genitalium) in the adolescent females based in Masiphumelele who were part
of the WISH cohort.

132
A. O. Breetzke
Finally, research should be undertaken to design and optimize primers for P. bivia that are
species specific, have low levels of self-complementarity and are reliable in order to validate the
results and allow for accurate and direct analyses.

133
A. O. Breetzke
Chapter 5: Discussion
Adolescent and young adult women are at extreme risk for HIV infection (Jaspan et al. 2011;
Seutlwadi et al. 2012), the cause of which has yet to be determined (Jaspan 2011; Pettifor et al.
2005). Within our South African cohort different factors such as BV status, genital inflammation,
age, hormonal contraceptive (HC) usage, and the absence or presence of bacterial or viral STIs
were investigated. The absolute quantified log copies/ng of L. crispatus, L. gasseri, L. jensenii,
L. iners, G. vaginalis and P. bivia were compared between the subset groups of these factors in
order to determine any associations with HIV acquisition risk. We hypothesized that individuals
with vaginal microbiota dominated by L. crispatus, L. jensenii and L. gasseri were more likely
BV negative, had low genital low inflammation, had no STIs, were using either the hormonal
contraceptive Nur Isterate or Implanon, and were between the ages of 16-18 years old. We
further hypothesized that L. iners, G. vaginalis and P. bivia would be relatively more abundant in
females with high levels of genital inflammatory cytokines, in individuals who were BV
positive, had one or more STIs, and/or were using the hormonal contraceptive DMPA and/or
were between the ages of 19-22 years old.
The most fundamental step in the development of the qPCR protocols for the six bacteria
involved was to ensure pure colonies and the correct growth conditions in order to guarantee
accurate and reliable standard curves. If the serially diluted pure positive control DNA was
incorrectly extracted from contaminated bacterial colonies, the entire standard curve which was
the basis for the bacterial quantification would have been unreliable, rendering all the results null
and void. The accuracy of the DNA extraction and quantification process further have a large
influence on the data. Errors and contamination during this stage of the assay development
would have resulted in inaccurate readings, preventing any reliable analyses of the data. The
optimization of the qPCR protocols for the first Lactobacillus spp. required the most time. Seven
optimization runs were performed in order to ensure the most accurate quantification readings of
L. crispatus, after which three were generally required for L. jensenii, L. iners and L. gasseri as
the protocol conditions were very similar. The qPCR protocols for the L. crispatus, followed by
G. vaginalis and P. bivia were optimized through single step-by-step changes. The guidance for
optimization was based on the error (< 0.05) and efficiency (2) values being as close to target as
possible. The first step take with the optimization process would be to either increase and/or

134
A. O. Breetzke
decrease the annealing temperatures by up to 5 C to improve the amplification peaks. If the
change in annealing temperature did not yield sufficient improvements, the length of the initial
denaturation step was adjusted in order to determine if the DNA was not denaturing sufficiently.
The next step would be to increase the number of cycles in the amplification step of the protocol
in order to improve the amplification curves as well as the error and efficiency value readings.
The next step would be to be to either re-dilute the serially diluted standard curves in order to
determine of the standard curve DNA was inaccurate, or to change the protocol entirely based
from published literature research. The last step in the optimization process would be to change
the primers, this was only necessary for L. crispatus, and P. bivia, after which the above steps
would need to be repeated in order to finalize the qPCR protocol. Most differences occurred
between primers, and the cycling conditions in terms of temperatures, length of and number of
cycles per step in the qPCR protocol.
In this cohort, it was established that in general, L. iners and G. vaginalis were present at
significantly higher copy numbers in comparison to the other Lactobacillus species in the
adolescent FGT. L. gasseri and L. jensenii were present at particularly low levels in the majority
of the adolescents, compared to other Lactobacilli. There were significantly higher copies/ng of
L. crispatus in participants who were BV negative, had low genital inflammation levels, were
16-18 years of age, and were using the hormonal contraceptive Nur Isterate in comparison to the
copies/ng of L. jensenii. Further, participants with no STI present, any one bacterial STI present
(N. gonorrhea, C. trachomatis, HSV-2, T. vaginalis, M. genitalium, T. pallidum, H. ducreyi), and
who were either negative or had high risk HPV subtypes present within their vaginal secretions,
had significantly higher copies/ng of L. crispatus in comparison to L. jensenii. These increased
copy numbers could be due to the dominance of L. crispatus within the FGT and its relation to
maintaining health and preventing any infections. Nevertheless, L. iners remained the dominant
lactobacilli species even in these “healthy” women. It is possible that since we only assessed four
of the main lactobacilli species from the genital tract, the ratio of increased copies/ng of L.
crispatus and the decreased copies/ng of L. gasseri and L. jensenii could change in relation to
other lactobacilli when quantified. Most publications associate lactobacilli dominance with a
healthy FGT microbiome (Jespers et al. 2015; Ravel et al. 2011; Lopes dos Santos Santiago et al.
2012).
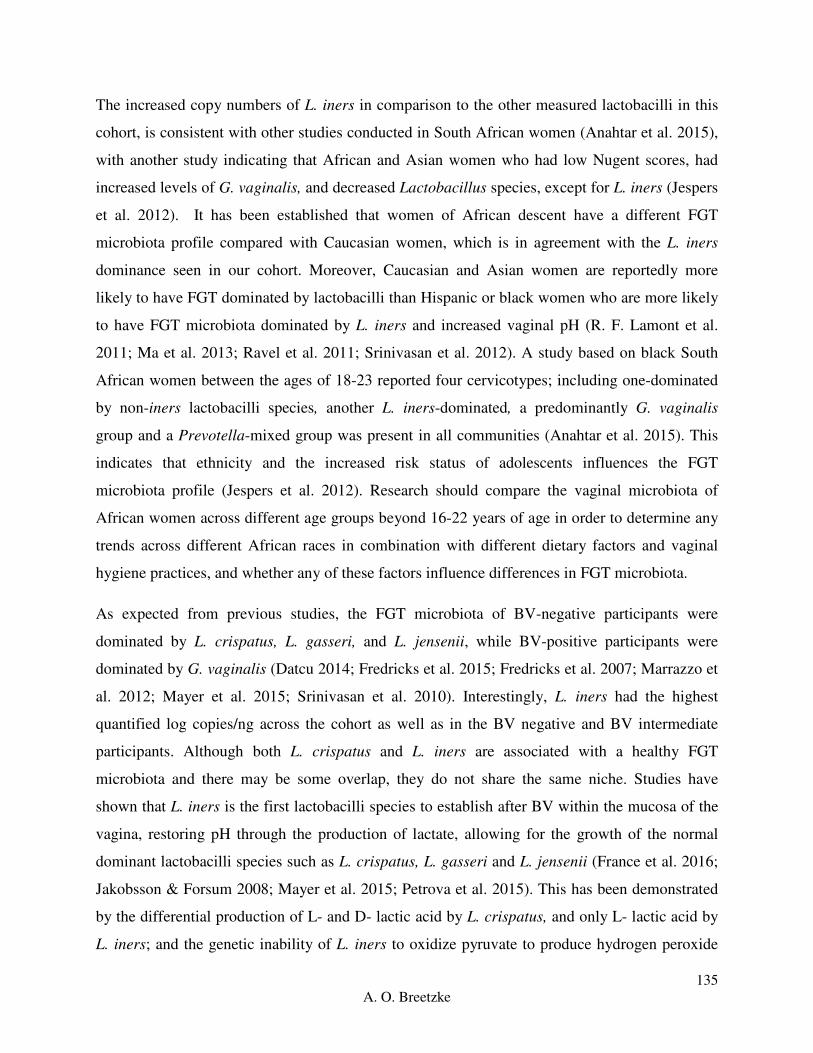
135
A. O. Breetzke
The increased copy numbers of L. iners in comparison to the other measured lactobacilli in this
cohort, is consistent with other studies conducted in South African women (Anahtar et al. 2015),
with another study indicating that African and Asian women who had low Nugent scores, had
increased levels of G. vaginalis, and decreased Lactobacillus species, except for L. iners (Jespers
et al. 2012). It has been established that women of African descent have a different FGT
microbiota profile compared with Caucasian women, which is in agreement with the L. iners
dominance seen in our cohort. Moreover, Caucasian and Asian women are reportedly more
likely to have FGT dominated by lactobacilli than Hispanic or black women who are more likely
to have FGT microbiota dominated by L. iners and increased vaginal pH (R. F. Lamont et al.
2011; Ma et al. 2013; Ravel et al. 2011; Srinivasan et al. 2012). A study based on black South
African women between the ages of 18-23 reported four cervicotypes; including one-dominated
by non-iners lactobacilli species, another L. iners-dominated, a predominantly G. vaginalis
group and a Prevotella-mixed group was present in all communities (Anahtar et al. 2015). This
indicates that ethnicity and the increased risk status of adolescents influences the FGT
microbiota profile (Jespers et al. 2012). Research should compare the vaginal microbiota of
African women across different age groups beyond 16-22 years of age in order to determine any
trends across different African races in combination with different dietary factors and vaginal
hygiene practices, and whether any of these factors influence differences in FGT microbiota.
As expected from previous studies, the FGT microbiota of BV-negative participants were
dominated by L. crispatus, L. gasseri, and L. jensenii, while BV-positive participants were
dominated by G. vaginalis (Datcu 2014; Fredricks et al. 2015; Fredricks et al. 2007; Marrazzo et
al. 2012; Mayer et al. 2015; Srinivasan et al. 2010). Interestingly, L. iners had the highest
quantified log copies/ng across the cohort as well as in the BV negative and BV intermediate
participants. Although both L. crispatus and L. iners are associated with a healthy FGT
microbiota and there may be some overlap, they do not share the same niche. Studies have
shown that L. iners is the first lactobacilli species to establish after BV within the mucosa of the
vagina, restoring pH through the production of lactate, allowing for the growth of the normal
dominant lactobacilli species such as L. crispatus, L. gasseri and L. jensenii (France et al. 2016;
Jakobsson & Forsum 2008; Mayer et al. 2015; Petrova et al. 2015). This has been demonstrated
by the differential production of L- and D- lactic acid by L. crispatus, and only L- lactic acid by
L. iners; and the genetic inability of L. iners to oxidize pyruvate to produce hydrogen peroxide

136
A. O. Breetzke
(France et al. 2016). In addition, L. crispatus contains genes for an iron transport system within
its genome while L. iners does not, while L. crispatus is able to break down putrescine, an amino
acid associated with BV. This indicates differential competition for the dominance of the shared
FGT microbiota possibly through nutrient sources, ability to respond to invading pathogens and
menses (France et al. 2016).
As hypothesized, increased log transformed copies/ng readings of L. crispatus, L. gasseri and L.
jensenii were observed in participants with low levels of genital inflammation, indicating an
inferred negative association with participants with high levels of genital inflammation.
However, there was no direct association between any log transformed copies/ng readings for the
bacteria and participants with high levels of genital inflammation, contradicting our second
hypothesis that adolescents with high levels of genital inflammation have FGT microbiota
profiles dominated by L. iners, G. vaginalis and P. bivia. This could indicate that high levels of
genital inflammation are not due to the presence of pathogenic bacteria such as BV-associated G.
vaginalis, but rather due to the absence of health-associated lactobacilli species. Further research
would be required as this does not agree with current literature.
It was hypothesized that young adolescents between the ages of 16-18years would have
increased L. jensenii, L. gasseri and L. crispatus while adolescents between the ages of 19-22
would have increased L. iners, G. vaginalis and P. bivia. However, there were no differences in
bacterial quantities when stratifying participants by age (16-18 versus 19-22 years), or when
considering age as a continuous variable (data not included). This lack of age-specific FGT
microbiota could also however, be due to the tight age range that we studied. Indeed, women 30
years and older (who are many years past menarche, are experiencing menses or have been
pregnant), reportedly have different FGT microbiota profiles compared with adolescents
(Chaban et al. 2014; Ma et al. 2013; MacIntyre et al. 2015). Studies have shown that the
presence and relative abundance of lactobacilli within the FGT microbiota profile changes with
age (Cauci et al. 2002; Madan et al. 2012; Thoma et al. 2011). A cohort involving older women
should be studied in order to determine whether the trend of fewer lactobacilli species and the
increased copies/ ng of G. vaginalis are possibly culture-dependent, due to personal hygiene and
bathing habits, or age. The point at which sexual debut occurs could further influence the FGT
microbiota through the increase in BV-associated bacteria such as G. vaginalis (Mitchell et al.

137
A. O. Breetzke
2012), however, other studies indicate that bacteria such as G. vaginalis could colonize the FGT
prior to the onset of menarche (Hickey et al. 2015). The data suggest that the driving factor for
increased HIV acquisition risk may be something age.
Progestin-only hormonal contraceptives are the most commonly prescribed hormonal
contraceptive in South Africa (Byrne et al. 2016; Murphy et al. 2014; van de Wijgert et al. 2013).
These are particularly popular among adolescents due to their long-lasting effects. However,
observational data suggest that injectable progestin-only hormonal contraceptives may increase
risk for HIV (Byrne et al. 2016; Murphy et al. 2014; Roxby et al. 2016). There are contradicting
data regarding the difference in HIV acquisition risk between DMPA and Nur Isterate, with
suggestions that the active agent of Nur Isterate is the safer alternative (Govender et al. 2014;
Tomasicchio et al. 2013). It was hypothesized that adolescents prescribed the contraceptives Nur
Isterate or Implanon would have increased levels of L. jensenii, L. gasseri, and L. crispatus,
while those prescribed DMPA would have increased levels of L. iners, G. vaginalis and P. bivia.
However, there were no significant differences in abundance for any of the bacteria studied here
between adolescents on DMPA versus those on Nur Isterate. Although the active agents are very
similar, the difference in initial dosage due to the 8 week, versus 12week activity could possibly
influence the level of association with the bacteria, as well as reduced numbers of participants
prescribed DMPA (n=25) in comparison to those prescribed Nur Isterate (n=102). There were no
differences in copy number for any of the bacteria for participants prescribed Implanon.
However, there were fewer participants within this group (n=9) than those using DMPA and Nur
Isterate which may have resulted in inaccurate differences. The only association identified was
an overall significant difference in L. jensenii copies/ng across the three hormonal contraceptive
groups; based on higher copies/ng in participants prescribed DMPA and Nur Isterate compared
to those prescribed Implanon.
A better comparison would be to compare the copies/ng of the participants using the different
hormonal contraceptives in comparison the participants who were using non-hormonal
contraceptive methods. In order to increase the reliability of the results, repeats would need to be
run, with equal numbers of participants in each three hormonal group. Further, as part of the
WISH cohort through Masiphumelele, there were no girls who were not on a form of
contraceptive. The larger study collected samples from Johannesburg where participants were

138
A. O. Breetzke
not taking any form of oral/injectable contraceptive. Further analysis could compare overall
participants taking a form of contraceptive versus those participants not taking a hormonal
contraceptive. However, this would require crossing location samples which was not a part of
this master’s thesis study and thus only inter-hormonal contraceptive comparisons could be
performed.
The copies/ng of the bacteria were compared between women with and without any one
laboratory-diagnosed STI. We hypothesized that the FGT microbiota of participants who had no
STI would be more abundant in L. jensenii, L. gasseri, and L. crispatus, while participants who
had one or more STIs would have a FGT microbiota dominated by L. iners, G. vaginalis and P.
bivia. No such association was found in relation to the absence or presence of any one STI; the
absence, presence of one, or presence of two or more bacterial STIs, or the absence or presence
of one viral STI. There was an association between increased copies/ng of G. vaginalis and the
presence of two viral STIs; however, the number of participants within this group was small.
This trend was further observed for P. bivia; however, because the primers were not reliable the
data should be interpreted with caution. The serological data for HSV-2 was not included within
the results, nor incorporated within the statistical analyses, thus further associations cannot be
conducted with the abundance of the bacteria and HSV-2. The serological status of HSV-2 is
important as studies have shown a link with BV as well as multiple immunological changes
within the immune system with further associations with HIV acquisition (Kaul et al. 2007;
Keller et al. 2012). The presence of HPV was not associated with any of the bacteria studied
here. However, participants who had high risk HPV subtypes had increased levels of L. crispatus
compared with their HPV low risk counterparts. Research has established that HPV is essentially
a marker for sexual debut, and it is unlikely to see any major difference between the bacteria for
this STI (Aujo et al. 2014; Bednarczyk et al. 2012; Houlihan et al. 2014). Validation of the STI
results would be recommended as the small sample size could possibly have influenced the
results.
Multiple factors likely drive increased risk of HIV acquisition in South African adolescent
females. Within the U.S.A, male adolescents within the same age group with the same number of
reported sexual partners have a lower risk of HIV acquisition in comparison to their South
African counterparts (Cohen et al. 2012; Jaspan 2011; Pettifor et al. 2011). The increased

139
A. O. Breetzke
copies/ng of G. vaginalis within these adolescents could indicate a shift in the FGT microbiota
profile in comparison to what is generally seen in adults as an indicator for BV (Datcu 2014;
Hickey et al. 2015). Different FGT microbiota trends can be influenced by the use of agents to
dry, tighten or warm the vagina having a possible link to vaginal health and HIV risk. The
misuse of such agents through misunderstanding, could lead to decreased vaginal health in
adolescents. Studies have shown than adolescents as well as older women, insert agents such as
ice, newspaper, snuff, menthol-based ointments, washing with sunlight soap, cleansing with
Disprin and tissues, and using traditional herbs as ointments, ingestion or smoking and douching
in order to remove any ‘excess’ vaginal wetness and increase friction and the ‘dryness’ of sexual
intercourse (Scorgie et al. 2009; Hilber et al. 2010; Jespers et al. 2016b; Mitchell et al. 2011;
Smit et al. 2002). Further factors that should be taken into consideration include the living
conditions and cultural practices within Masiphumelele (Cauci et al. 2002; Madan et al. 2012;
Thoma et al. 2011).
Limitations of this study include uneven numbers of participants for each of the factors
compared, as well large differences between group participant numbers, especially the viral
STIs. Future statistical analyses should be performed using category groups with more even
numbers of participants for comparison and validation of these results. Further, a larger age
range as well as more lactobacilli species would have benefitted the understanding of dominant
abundance. The comparison for association between bacterial copy number and HC would have
benefitted with a non-HC base group of adolescents. Finally, the P. bivia primers were not
reliable and thus the data cannot be used for comparison or association with the factors of
interest within this study. Multiple changes were implemented in order to try and optimize the
qPCR protocol for P. bivia, however, none of the changes performed resulted in sufficient
identification of the bacterium in order to produce reliable results. Any further work with P.
bivia will involve more in-depth research into more reliable primers, possibly TaqMan probes, in
order to improve specificity and reliability. Further limitations of this study include the simple
statistical analyses performed. More multivariate comparisons could have been performed in
order to better understand the relationships between the classification types and their groups,
rather than simply in direct relation to the copies/ng of the bacterium. Potential associations
could have been missed due to statistical analyses that did not take into account interrelatedness
and confounding variables.

140
A. O. Breetzke
Chapter 6: Conclusion
In conclusion, the FGT microbiota of the adolescent population of females in Masiphumelele is
dominated by L. iners relative to the other bacteria within this cohort, similar to previous studies
with black women, and G. vaginalis, which does not follow the normal ‘healthy’ microbiome.
This trend is shifted by L. crispatus, which had increased copy numbers across the different
factors such as BV status, low levels of genital inflammation and the presence of two viral STIs,
with a slight association with high risk HPV subtypes. The age of the participants, high levels of
genital inflammation, absence or presence of any one STI, the absence or presence of one, or two
or more bacterial STIs, and the absence of or presence of one viral STI do not have any
association with the copies/ng of L. crispatus, L. gasseri, L. jensenii, L. iners, and G. vaginalis.
The FGT microbiota profile is different within the Masiphumelele female adolescents in
comparison to many publications based on different ethnicities and geographical locations based
on the increased copy numbers of L. iners and G. vaginalis.

141
A. O. Breetzke
References
AFSA, 2011. HIV/AIDS in South Africa. Available at:
http://www.aids.org.za/hivaids-in-south-africa/ [Accessed August 10, 2016].
Amsel, R. et al., 1983. Nonspecific vaginitis. Diagnostic criteria and microbial and
epidemiologic associations. American Journal of Medicine, 74, pp.14–22.
Anahtar, M.N. et al., 2015. Cervicovaginal Bacteria Are a Major Modulator of
Host Inflammatory Responses in the Female Genital Tract. Immunity, 42(5),
pp.965–976. Available at: http://dx.doi.org/10.1016/j.immuni.2015.04.019.
Anjuère, F. et al., 2012. B cell and T cell immunity in the female genital tract:
Potential of distinct mucosal routes of vaccination and role of tissue-associated
dendritic cells and natural killer cells. Clinical Microbiology and Infection,
18(SUPPL. 5), pp.117–122.
Arnold, K.B. et al., 2015. Increased levels of inflammatory cytokines in the female
reproductive tract are associated with altered expression of proteases, mucosal
barrier proteins, and an influx of HIV-susceptible target cells. Mucosal
immunology, 9(February), pp.1–12. Available at:
http://www.ncbi.nlm.nih.gov/pubmed/26104913.
Atashili, J. et al., 2008. Bacterial vaginosis and HIV acquisition: a meta-analysis of
published studies. AIDS (London, England), 22(12), pp.1493–1501.
Aujo, J.C. et al., 2014. No difference in sexual behavior of adolescent girls
following Human Papilloma Virus vaccination: a case study two districts in
Uganda; Nakasongola and Luwero. BMC Public Health, 14, p.155. Available
at: internal-pdf://aujo-1346692352/Aujo.pdf.

142
A. O. Breetzke
De Backer, E. et al., 2007. Quantitative determination by real-time PCR of four
vaginal Lactobacillus species, Gardnerella vaginalis and Atopobium vaginae
indicates an inverse relationship between L. gasseri and L. iners. BMC
microbiology, 7, p.115. Available at:
http://www.ncbi.nlm.nih.gov/pubmed/18093311.
Balkus, J.E. et al., 2012. Detection of hydrogen peroxide-producing Lactobacillus
species in the vagina: a comparison of culture and quantitative PCR among
HIV-1 seropositive women. BMC infectious diseases, 12(1), p.188. Available
at: http://www.biomedcentral.com/1471-2334/12/188.
Beagley, K.W. & Gockel, C.M., 2003. Regulation of innate and adaptive immunity
by the female sex hormones oestradiol and progesterone. FEMS Immunology
and Medical Microbiology, 38(1), pp.13–22.
Bednarczyk, R.A. et al., 2012. Sexual activity-related outcomes after human
papillomavirus vaccination of 11- to 12-year-olds. Pediatrics, 130, pp.798–
805. Available at: http://internal-pdf//Bednarczyk-2012-Sexual activity-rela-
1596887809/Bednarczyk-2012-Sexual activity-
rela.pdf%5Cnhttp://pediatrics.aappublications.org/content/130/5/798.full.pdf.
Borgdorff, H. et al., 2015. The impact of hormonal contraception and pregnancy on
sexually transmitted infections and on cervicovaginal microbiota in African
sex workers. Sexually transmitted diseases, 42(5), pp.143–152.
Breen, E.C., 2002. Pro- and anti-inflammatory cytokines in human
immunodeficiency virus infection and acquired immunodeficiency syndrome.
Pharmacol.Ther., 95(3), pp.295–304. Available at:
http://www.ncbi.nlm.nih.gov/pubmed/12243799.

143
A. O. Breetzke
Bustin, S.A., 2010. Why the need for qPCR publication guidelines?-The case for
MIQE. Methods, 50(4), pp.217–226. Available at:
http://dx.doi.org/10.1016/j.ymeth.2009.12.006.
Byrne, E.H. et al., 2016. Association between injectable progestin-only
contraceptives and HIV acquisition and HIV target cell frequency in the
female genital tract in South African women: A prospective cohort study. The
Lancet Infectious Diseases, 16(4), pp.441–448. Available at:
http://dx.doi.org/10.1016/S1473-3099(15)00429-6.
Byun, R. et al., 2004. Quantitative Analysis of Diverse Lactobacillus Species
Present in Advanced Dental Caries Quantitative Analysis of Diverse
Lactobacillus Species Present in Advanced Dental Caries. J. Clin. Microbiol.,
42(7), pp.3128–3136.
Cauci, S. et al., 2002. Prevalence of Bacterial Vaginosis and Vaginal Flora
Changes in Peri- and Postmenopausal Women. JOURNAL OF CLINICAL
MICROBIOLOGY,, 40(6), pp.2147–2152.
Cavaillon, J.-M., 2000. Pro-versus Anti-inflammatory cytokines: myth or reality.
Cellular and Molecular Biology, 47(4), pp.695–702. Available at:
http://www.ncbi.nlm.nih.gov/pubmed/15237199.
CDC, 2014a. Bacterial Vaginosis – CDC Fact Sheet. Center of Disease Control
and Prevention, p.2.
CDC, 2014b. Genital HPV Infection – CDC Fact Sheet. Center of Disease Control
and Prevention, pp.1–2.
CDC, 2014c. Gonorhea – CDC Fact Sheet. Center of Disease Control and
Prevention, pp.1–2.

144
A. O. Breetzke
CDC, 2014d. Trichomoniasis Fact Sheet. Center of Disease Control and
Prevention.
Chaban, B. et al., 2014. Characterization of the vaginal microbiota of healthy
Canadian women through the menstrual cycle. Microbiome, 2(1), p.23.
Available at:
http://www.pubmedcentral.nih.gov/articlerender.fcgi?artid=4106219&tool=pm
centrez&rendertype=abstract.
Chiaffarino, F. et al., 2004. Risk factors for bacterial vaginosis. European Journal
of Obstetrics Gynecology and Reproductive Biology, 117(2), pp.222–226.
Chinsembu, K.C., 2009. Sexually transmitted infections in adolescents.
Contemporary Reviews in Obstetrics and Gynaecology, 3(1), pp.107–117.
Cohen, C.R. et al., 2012. Bacterial vaginosis associated with increased risk of
female-to-male HIV-1 transmission: A prospective cohort analysis among
african couples. PLoS Medicine, 9(6), p.18.
Czerniecki, J. & Wołczyński, S., 2011. Deep sequencing – a new method and new
requirements of gene expression analysis. STUDIES IN LOGIC, GRAMMAR
AND RHETORIC, 25(38), pp.41–48.
Datcu, R., 2014. Characterization of the vaginal microflora in health and disease.
Danish Medical Journal, 61(4), pp.1–24.
Department of Health, 2012. National Contraception Clinical Guidelines,
Dinarello, C.A., 2000. Proinflammatory cytokines. Chest, 118(2), pp.503–508.
Available at: http://dx.doi.org/10.1378/chest.118.2.503.
Dr Manto Tshabalala-Msimang, 2013. National Contraception Polivy Guidelines,

145
A. O. Breetzke
Cape Town.
Draper, L., 2006. Working women and contraception: History, health, and choices.
Aaohn J, 54(7), pp.316–317.
Dumonceaux, T.J. et al., 2009. Multiplex detection of bacteria associated with
normal microbiota and with bacterial vaginosis in vaginal swabs by use of
oligonucleotide-coupled fluorescent microspheres. Journal of Clinical
Microbiology, 47(12), pp.4067–4077.
Eschenbach, D.A. et al., 1988. Diagnosis and clinical manifestations of bacterial
vaginosis. American journal of obstetrics and gynecology, 158(4), pp.819–28.
Available at: http://www.ncbi.nlm.nih.gov/pubmed/3259075.
Family Planning Western Australia, 2012. Contraceptive Implant. , (7), pp.1–4.
Fanales-Belasio, E. et al., 2010. HIV virology and pathogenetic mechanisms of
infection: a brief overview. Ann Ist Super Sanità, 46(1), pp.5–14.
Faust, K. et al., 2012. Microbial Co-occurrence Relationships in the Human
Microbiome. PLoS Computational Biology, 8(7), pp.1–14.
Fethers, K.A. et al., 2008. Sexual Risk Factors and Bacterial Vaginosis: A
Systematic Review and Meta-Analysis. Clin. Infect. Dis., 47(11), pp.1426–
1435. Available at: http://www.ncbi.nlm.nih.gov/pubmed/18947329.
Filippo, C. De et al., 2010. Impact of diet in shaping gut microbiota revealed by a
comparative study in children from Europe and rural Africa. PNAS, 107(33),
pp.14691–14696.
Firestein, G.S. et al., 2013. Cytokines. Kelley’s Textbook of Rheumatology,
285(18), pp.367–377.
146
A. O. Breetzke
France, M.T., Mendes-Soares, H. & Forney, L.J., 2016. Genomic comparisons of
Lactobacillus crispatus and Lactobacillus iners reveal potential ecological
drivers of community composition in the vagina. Applied and Environmental
Microbiology, (September), p.AEM.02385-16. Available at:
http://aem.asm.org/lookup/doi/10.1128/AEM.02385-16.
Fredricks, D.N. et al., 2009. Changes in vaginal bacterial concentrations with
intravaginal metronidazole therapy for bacterial vaginosis as assessed by
quantitative PCR. Journal of Clinical Microbiology, 47(3), pp.721–726.
Fredricks, D.N. et al., 2007. Targeted PCR for detection of vaginal bacteria
associated with bacterial vaginosis. Journal of Clinical Microbiology, 45(10),
pp.3270–3276.
Fredricks, D.N., Fiedler, T.L. & Marrazzo, J.M., 2015. Molecular Identification of
Bacteria Associated with Bacterial Vaginosis. , pp.1899–1911.
FSRH Clinical Effectivesness Unit, 2017. CEU Statement: UK MEC 2016 Update
Change of UKMEC category for use of progestogen-only injectable
contraception by women at high risk of HIV infection from UKMEC1 to
UKMEC2 28. CEU Statement: UK MEC 2016 Update, (March), pp.28–30.
Gad, G.F.M. et al., 2014. Evaluation of different diagnostic methods of bacterial
vaginosis. IOSR Journal of Dental and Medical Sciences, 13(1), pp.15–23.
Available at: www.iosrjournals.org.
Govender, Y. et al., 2014. The injectable-only contraceptive medroxyprogesterone
acetate, unlike norethisterone acetate and progesterone, regulates inflammatory
genes in endocervical cells via the glucocorticoid receptor. PLoS ONE, 9(5).
Grabowski, M.K. et al., 2015. Use of injectable hormonal contraception and

147
A. O. Breetzke
women ’ s risk of herpes simplex virus type 2 acquisition : a prospective study
of couples in Rakai , Uganda. The Lancet Global Health, 3(8), pp.e478–e486.
Available at: http://dx.doi.org/10.1016/S2214-109X(15)00086-8.
Griffith, J.W., Sokol, C.L. & Luster, A.D., 2014. Chemokines and chemokine
receptors: positioning cells for host defense and immunity. Annual review of
immunology, 32, pp.659–702. Available at:
http://www.ncbi.nlm.nih.gov/pubmed/24655300.
Grunenwald, H. & Kramer, K., Cloning a Real-Time PCR Product ; Does SYBR ®
Green I Dye Interfere ? Epicentre, 11(4), pp.17–19.
Gupta, V.K. et al., 2015. Divergences in gene repertoire among the reference
Prevotella genomes derived from distinct body sites of human. BMC
genomics, 16(153), pp.1350–1356.
Hayashi, H. et al., 2007. Prevotella copri sp . nov . and Prevotella stercorea sp .
nov ., isolated from human faeces. International Journal of Systematic and
Evolutionary Microbiology, (57), pp.941–946.
Hermann-bank, M.L. et al., 2013. The Gut Microbiotassay : a high-throughput
qPCR approach combinable with next generation sequencing to study gut
microbial diversity. BMC Genomics, 14(788), pp.1–14.
Hickey, D.K. et al., 2011. Innate and adaptive immunity at mucosal surfaces of the
female reproductive tract: Stratification and integration of immune protection
against the transmission of sexually transmitted infections. Journal of
Reproductive Immunology, 88(2), pp.185–194.
Hickey, R.J. et al., 2015. Vaginal microbiota of adolescent girls prior to the onset
of menarche resemble those of reproductive-age women. mBio, 6(2), pp.1–14.

148
A. O. Breetzke
Hilber, M.A. et al., 2010. A cross cultural study of vaginal practices and sexuality:
Implications for sexual health. Social Science and Medicine, 70(3), pp.392–
400.
Houlihan, C.F. et al., 2014. Prevalence of human papillomavirus in adolescent girls
before reported sexual debut. Journal of Infectious Diseases, 210(6), pp.837–
845.
Hunt, P.W. et al., 2011. HIV-specific CD4+ T cells may contribute to viral
persistence in HIV controllers. Clinical Infectious Diseases, 52(5), pp.681–
687.
Idziorek, T. et al., 1998. Recombinant human IL-16 inhibits HIV-1 replication and
protects against activation-induced cell death (AICD). Clinical and
Experimental Immunology, 112(1), pp.84–91.
Illumina, 2013. An Introduction to Next-Generation Sequencing Technology
Welcome to Next-Generation Sequencing. , (Journal of Experimental Botany).
Jakobsson, T. & Forsum, U., 2008. Changes in the predominant human
Lactobacillus flora during in vitro fertilisation. Annals of Clinical
Microbiology and Antimicrobials, 7(14), pp.1–9. Available at:
http://www.embase.com/search/results?subaction=viewrecord&from=export&
id=L352069146%5Cnhttp://dx.doi.org/10.1186/1476-0711-7-16.
Jaspan, H., 2011. The wrong place at the wrong time: Geographic disparities in
young people’s HIV risk. Journal of Adolescent Health, 49(3), pp.227–229.
Available at: http://dx.doi.org/10.1016/j.jadohealth.2011.07.004.
Jaspan, H.B. et al., 2011. Immune activation in the female genital tract during HIV
infection predicts mucosal CD4 depletion and HIV shedding. Journal of

149
A. O. Breetzke
Infectious Diseases, 204(10), pp.1550–1556.
Jaspan, H.B. et al., 2011. Sexual health, HIV risk, and retention in an adolescent
HIV prevention trial preparatory cohort. J Adolesc Health, 49(1), pp.42–46.
Jespers, V. et al., 2016a. Association of Sexual Debut in Adolescents With
Microbiota and Inflammatory Markers. Obstetrics & Gynecology, 128(1),
pp.22–31. Available at:
http://content.wkhealth.com/linkback/openurl?sid=WKPTLP:landingpage&an
=00006250-201607000-00005.
Jespers, V. et al., 2016b. Association of Sexual Debut in Adolescents With
Microbiota and Inflammatory Markers. Obstetrics & Gynecology, 128(1),
pp.22–31. Available at:
http://content.wkhealth.com/linkback/openurl?sid=WKPTLP:landingpage&an
=00006250-201607000-00005.
Jespers, V. et al., 2012. Quantification of bacterial species of the vaginal
microbiome in different groups of women, using nucleic acid amplification
tests. BMC microbiology, 12(1), p.83. Available at: ???
Jespers, V. et al., 2015. The significance of Lactobacillus crispatus and L. vaginalis
for vaginal health and the negative effect of recent sex: A cross-sectional
descriptive study across groups of African women. BMC Infectious Diseases,
15(1), p.115. Available at:
http://ovidsp.ovid.com/ovidweb.cgi?T=JS&PAGE=reference&D=prem&NEW
S=N&AN=25879811%5Cnhttp://www.biomedcentral.com/bmcinfectdis/%5C
nhttp://ovidsp.ovid.com/ovidweb.cgi?T=JS&PAGE=reference&D=emed13&N
EWS=N&AN=2015001066.

150
A. O. Breetzke
Jones, M.B. et al., 2015. Library preparation methodology can influence genomic
and functional predictions in human microbiome research. Proc Natl Acad Sci
U S A, 112(45), p.1519288112-. Available at:
http://www.pnas.org/content/early/2015/10/27/1519288112.abstract.
Jung, H.C. et al., 1995. A distinct array of proinflammatory cytokines is expressed
in human colon epithelial cells in response to bacterial invasion. The Journal
of clinical investigation, 95(1), pp.55–65.
Kaul, R. et al., 2007. Prevalent herpes simplex virus type 2 infection is associated
with altered vaginal flora and an increased susceptibility to multiple sexually
transmitted infections. The Journal of infectious diseases, 196(11), pp.1692–
1697.
Keller, M.J. et al., 2012. Changes in the Soluble Mucosal Immune Environment
during Genital Herpes Outbreaks. J Acquir Immune Defic Syndr, 61(2),
pp.194–202.
Kolenbrander, P.E. et al., 2002. Communication among Oral Bacteria.
MICROBIOLOGY AND MOLECULAR BIOLOGY REVIEWS, 66(3), pp.486–
505.
Lambert, J.A. et al., 2013. Novel PCR-Based Methods Enhance Characterization
of Vaginal Microbiota in a Bacterial Vaginosis Patient before and after
Treatment. Applied and Environmental Microbiology, 79(13), pp.4181–4185.
Lamont et al., 2011. The vaginal microbiome: New information about genital tract
flora using molecular based techniques. BJOG: An International Journal of
Obstetrics and Gynaecology, 118(5), pp.533–549.
Lamont, R.F. et al., 2011. The vaginal microbiome: New information about genital

151
A. O. Breetzke
tract using molecular based techniques. Brit. J. Obstet. Gynaec., 118(5),
pp.533–549.
Lawn, S.D. et al., 2006. Impact of HIV infection on the epidemiology of
tuberculosis in a peri-urban community in South Africa: the need for age-
specific interventions. Clinical infectious diseases : an official publication of
the Infectious Diseases Society of America, 42(7), pp.1040–7. Available at:
http://www.ncbi.nlm.nih.gov/pubmed/16511773.
Lewis, D.A., 2000. Diagnostic tests for chancroid Diagnostics. Sex Transm Inf, 76,
pp.137–141.
Lopes dos Santos Santiago, G. et al., 2012. Longitudinal qPCR Study of the
Dynamics of L. crispatus, L. iners, A. vaginae, (Sialidase Positive) G.
vaginalis, and P. bivia in the Vagina. PLoS ONE, 7(9).
loveLife, 1999. loveLife. Available at: http://www.lovelife.org.za/ [Accessed
August 15, 2016].
Ma, B., Forney, L.J. & Ravel, J., 2013. The vaginal microbiome : rethinking health
and diseases. Annu Rev Microbiol, 66, pp.371–389.
MacIntyre, D.A. et al., 2015. The vaginal microbiome during pregnancy and the
postpartum period in a European population. Scientific reports, 5(Cst Iv),
p.8988. Available at:
http://www.nature.com/srep/2015/150311/srep08988/full/srep08988.html.
Macklaim, J.M. et al., 2013. Comparative meta-RNA-seq of the vaginal microbiota
and differential expression by Lactobacillus iners in health and dysbiosis.
Microbiome, 1(1), p.12. Available at:
http://www.pubmedcentral.nih.gov/articlerender.fcgi?artid=3971606&tool=pm

152
A. O. Breetzke
centrez&rendertype=abstract.
Madan, R.P. et al., 2012. Altered biomarkers of mucosal immunity and reduced
vaginal lactobacillus concentrations in sexually active female adolescents.
PLoS ONE, 7(7), pp.1–10.
Malaguti, N. et al., 2015. Sensitive Detection of Thirteen Bacterial Vaginosis-
Associated Agents Using Multiplex Polymerase Chain Reaction. , 2015.
Marrazzo, J.M. et al., 2012. Extravaginal reservoirs of vaginal bacteria as risk
factors for incident bacterial vaginosis. Journal of Infectious Diseases,
205(10), pp.1580–1588.
Masson, L. et al., 2015. Relationship between female genital tract infections,
mucosal interleukin-17 production and local T helper type 17 cells.
Immunology, 146(4), pp.557–567.
Mayer, B.T. et al., 2015. Rapid and profound shifts in the vaginal microbiota
following antibiotic treatment for bacterial vaginosis. Journal of Infectious
Diseases, 212(5), pp.793–802.
Mestecky, J. & Fultz, P.N., 1999. Mucosal Immune System of the Human Genital
Tract. The Journal of Infectious Diseases, 179(Suppl 3), pp.S470-4.
Minnesota, U. of, 2005. Web Anatomy. 14 November. Available at:
http://msjensen.cbs.umn.edu/webanatomy/image_database/Reproductive/defau
lt.htm [Accessed August 8, 2016].
Mirmonsef, P. et al., 2011. The Effects of Commensal Bacteria on Innate Immune
Responses in the Female Genital Tract. American Journal of Reproductive
Immunology, 65(3), pp.190–195.
153
A. O. Breetzke
Mitchell, C. et al., 2011. Effect of sexual activity on vaginal colonization with
hydrogenperoxide producing Lactobacilli and Gardnerella vaginalis. Sexually
Transmitted Diseases, 38(12), pp.1137–1144.
Mitchell, C.M. et al., 2012. Effect of Sexual Debut on Vaginal Microbiota in a
Cohort of Young Women. Obstet Gynecol, 120(6), pp.1306–1313.
Mitchell, C.M. & Marrazzo, J., 2014. Bacterial vaginosis and the cervicovaginal
immune system. American Journal of Reproductive Immunology, 71(6),
pp.555–563.
Mitchell, S., 2008. Contraception. , p.38.
Mlisana, K. et al., 2012. Symptomatic vaginal discharge is a poor predictor of
sexually transmitted infections and genital tract inflammation in high-risk
women in South Africa. Journal of Infectious Diseases, 206(1), pp.6–14.
Murphy, K., Irvin, S.C. & Herold, B.C., 2014. Research Gaps in Defining the
Biological Link between HIV Risk and Hormonal Contraception. , 2(72),
pp.228–235.
Myer, L. et al., 2005. Bacterial vaginosis and susceptibility to HIV infection in
South African women: A nested case-control study. Journal of Infectious
Diseases, 192(8), pp.1372–1380.
Newman, L. et al., 2013. Global Estimates of Syphilis in Pregnancy and
Associated Adverse Outcomes: Analysis of Multinational Antenatal
Surveillance Data. PLoS Medicine, 10(2).
Noguchi, L.M. et al., 2015. Risk of HIV-1 acquisition among women who use diff
erent types of injectable progestin contraception in South Africa: A

154
A. O. Breetzke
prospective cohort study. The Lancet HIV, 2(7), pp.e279–e287. Available at:
http://dx.doi.org/10.1016/S2352-3018(15)00058-2.
Nugent, R.P., Krohn, M.A. & Hillier, S.L., 1991. Reliability of diagnosing
bacterial vaginosis is improved by a standardized method of gram stain
interpretation. Journal of Clinical Microbiology, 29(2), pp.297–301.
O’Farrell, N., 2008. Control of sexually transmitted infections for HIV prevention.
The Lancet, 372(9646), p.1297. Available at: http://dx.doi.org/10.1016/S0140-
6736(08)61540-8.
Ochiel, D.O. et al., 2008. Innate Immunity in the Female Reproductive Tract: Role
of Sex Hormones in Regulating Uterine Epithelial Cell Protection Against
Pathogens. Current Womens Health Rev.iew, 4(2), pp.102–117.
Ohene, S. & Akoto, I., 2008. Factors associated with sexually transmitted
infections among young ghanaian women. Ghana medical journal, 42(3),
pp.96–100. Available at:
http://www.pubmedcentral.nih.gov/articlerender.fcgi?artid=2643428&tool=pm
centrez&rendertype=abstract.
Organon Pharmaceuticals USA, 2011. IMPLANON® (etonogestrel implant).
Available at:
https://dailymed.nlm.nih.gov/dailymed/archives/fdaDrugInfo.cfm?archiveid=6
3647 [Accessed September 6, 2016].
Pabinger, S. et al., 2014. A survey of tools for the analysis of quantitative PCR
(qPCR) data. Biomolecular Detection and Quantification, 1(1), pp.23–33.
Available at: http://dx.doi.org/10.1016/j.bdq.2014.08.002.
Patterson, B.K. et al., 2002. Susceptibility to human immunodeficiency virus-1

155
A. O. Breetzke
infection of human foreskin and cervical tissue grown in explant culture. The
American journal of pathology, 161(3), pp.867–873.
Petricevic, L. et al., 2014. Characterisation of the vaginal Lactobacillus microbiota
associated with preterm delivery. Scientific reports, 4, p.5136. Available at:
http://www.pubmedcentral.nih.gov/articlerender.fcgi?artid=4038809&tool=pm
centrez&rendertype=abstract.
Petrova, M.I. et al., 2015. Lactobacillus species as biomarkers and agents that can
promote various aspects of vaginal health. Frontiers in Physiology, 6(MAR),
pp.1–18.
Pettifor, A.E. et al., 2011. A tale of two countries: Rethinking sexual risk for HI. J
Adolesc Health, 49(3), pp.237–243.
Pettifor, A.E. et al., 2005. Young people’s sexual health in South Africa: HIV
prevalence and sexual behaviors from a nationally representative household
survey. Aids, 19(14), pp.1525–1534.
Pfaffl, M.W.., 2004. Quantification strategies in real-time PCR.
Pfaffl, M.W.. & Wittwer, C., 2015. QPCR, dPCR, NGS - A journey. Biomolecular
Detection and Quantification, 3(September 2005), pp.A1–A5.
Pfizer, 2011. Depo-Provera. , pp.1–17.
Pharmaceutical/Industry, 2005. NUR-ISTERATE. Available at:
http://home.intekom.com/pharm/schering/nur-ist.html [Accessed September 5,
2016].
Polis, C.B. et al., 2016. An updated systematic review of epidemiological evidence
on hormonal contraceptive methods and HIV acquisition in women. AIDS,
156
A. O. Breetzke
30(17), p.19.
Premaraj, T. et al., 1999. Use of PCR and sodium dodecyl sulfate-polyacrylamide
gel electrophoresis techniques for differentiation of Prevotella intermedia
sensu stricto and Prevotella nigrescens. Journal of Clinical Microbiology,
37(4), pp.1057–1061.
Ravel, J. et al., 2011. Vaginal microbiome of reproductive-age women.
Proceedings of the National Academy of Sciences, 108(Supplement_1),
pp.4680–4687. Available at:
http://www.pnas.org/cgi/doi/10.1073/pnas.1002611107.
Reis Machado, J. et al., 2014. Mucosal Immunity in the Female Genital Tract,
HIV/AIDS. BioMed Research International, 2014, p.20.
Reproductive Health and Research & Who, 2005. Sexually transmitted and other
reproductive tract infections: a guide to essential practice. World Health
Organization. Available at:
http://whqlibdoc.who.int/publications/2005/9241592656.pdf?ua=1.
Riou, C. et al., 2012. Distinct kinetics of Gag-specific CD4+ and CD8+ T cell
responses during acute HIV-1 infection. Journal of immunology (Baltimore,
Md. : 1950), 188(5), pp.2198–206. Available at:
http://www.pubmedcentral.nih.gov/articlerender.fcgi?artid=3288487&tool=pm
centrez&rendertype=abstract.
Roberts, L. et al., 2012. Vaginal microbicides to prevent human immunodeficiency
virus infection in women: Perspectives on the female genital tract, sexual
maturity and mucosal inflammation. Best Practice and Research: Clinical
Obstetrics and Gynaecology, 26(4), pp.441–449. Available at:

157
A. O. Breetzke
http://dx.doi.org/10.1016/j.bpobgyn.2012.02.002.
Roche, 2003. Creating Standard Curves with Genomic DNA or Plasmid DNA
Templates for Use in Quantitative PCR,
Roxby, A., Fredricks, D. & Odem-Davis, K., 2016. Changes in vaginal microbiota
and immune mediators in HIV-1-seronegative Kenyan Women initiating depot
medroxyprogesterone acetate. JAIDS Journal of, 71(4), pp.359–366. Available
at:
http://journals.lww.com/jaids/Abstract/2016/04010/Changes_in_Vaginal_Micr
obiota_and_Immune_Mediators.2.aspx.
Roy, C.C. et al., 2006. Short-Chain Fatty Acids: Ready for Prime Time? NCP -
Nutrition in Clinical Practice, 21(4), pp.351–366. Available at:
http://ncp.aspenjournals.org/cgi/content/abstract/21/4/351.
Saito, D. et al., 2006. Identification of bacteria in endodontic infections by
sequence analysis of 16S rDNA clone libraries. Journal of Medical
Microbiology, 55(1), pp.101–107.
Salipante, S.J. et al., 2013. Rapid 16S rRNA Next-Generation Sequencing of
Polymicrobial Clinical Samples for Diagnosis of Complex Bacterial
Infections. PLoS ONE, 8(5).
Scher, J.U. et al., 2013. Expansion of intestinal Prevotella copri correlates with
enhanced susceptibility to arthritis. eLIFE, (e01202), pp.1–20.
Scorgie, F. et al., 2009. In search of sexual pleasure and fidelity: vaginal practices
in KwaZulu-Natal, South Africa. Culture, health & sexuality, 11(3), pp.267–
283.

158
A. O. Breetzke
Selle, K. et al., 2014. Development of an integration mutagenesis system in
Lactobacillus gasseri. Gut Microbes, 5(3), pp.326–332.
Seutlwadi, L., Karl, P. & Gugu, M., 2012. Contraceptive use and associated factors
among South African youth (18 - 24 years): A population-based survey. South
African Journal of Obstetrics & Gynaecology, 18(2), pp.43–47.
Smit, J. et al., 2002. Vaginal wetness: An underestimated problem experienced by
progestogen injectable contraceptive users in South Africa. Social Science and
Medicine, 55(9), pp.1511–1522.
Smith, C.J. & Osborn, A.M., 2009. Advantages and limitations of quantitative PCR
( Q-PCR ) -based approaches in microbial ecology. FEMS Microbiological
Ecology, 67(1991), pp.6–20.
Spiegel, C.A., Amsel, R. & Holmes, K.K., 1983. Diagnosis of bacterial vaginosis
by direct gram stain of vaginal fluid . Diagnosis of Bacterial Vaginosis by
Direct Gram Stain of Vaginal Fluid. JOURNAL OF CLINICAL
MICROBIOLOGY,, 18(1), pp.170–177.
Srinivasan, S. et al., 2012. Bacterial communities in women with bacterial
vaginosis: High resolution phylogenetic analyses reveal relationships of
microbiota to clinical criteria. PLoS ONE, 7(6).
Srinivasan, S. et al., 2010. Temporal variability of human vaginal bacteria and
relationship with bacterial vaginosis. PLoS ONE, 5(4).
Srinivasan, S. & Fredricks, D.N., 2008. The human vaginal bacterial biota and
bacterial vaginosis. Interdisciplinary perspectives on infectious diseases, 2008,
p.750479. Available at:
http://www.pubmedcentral.nih.gov/articlerender.fcgi?artid=2648628&tool=pm
159
A. O. Breetzke
centrez&rendertype=abstract.
Su, D.L. et al., 2012. Roles of pro- and anti-inflammatory cytokines in the
pathogenesis of SLE. Journal of Biomedicine and Biotechnology, 2012.
Sultani, M. et al., 2012. Anti-Inflammatory Cytokines: Important
Immunoregulatory Factors Contributing to Chemotherapy-Induced
Gastrointestinal Mucositis. Chemotherapy Research and Practice, 2012, pp.1–
11.
Tamrakar, R. et al., 2007. Association between Lactobacillus species and bacterial
vaginosis-related bacteria, and bacterial vaginosis scores in pregnant Japanese
women. BMC infectious diseases, 7, p.128.
Tan, B. et al., 2015. Next-generation sequencing (NGS) for assessment of
microbial water quality: Current progress, challenges, and future opportunities.
Frontiers in Microbiology, 6(SEP).
Thoma, M.E. et al., 2011. Longitudinal changes in vaginal microbiota composition
assessed by Gram-stain among never sexually active pre- and postmenarcheal
adolescents in Rakai, Uganda. Pediatr Adolesc Gynecol., 24(1), pp.42–47.
Tomasicchio, M. et al., 2013. The Progestin-Only Contraceptive
Medroxyprogesterone Acetate, but Not Norethisterone Acetate, Enhances
HIV-1 Vpr-Mediated Apoptosis in Human CD4+ T Cells through the
Glucocorticoid Receptor. PLoS ONE, 8(5).
UNAIDS, 2015. HIV and AIDS estimates. Available at:
http://www.unaids.org/en/regionscountries/countries/southafrica [Accessed
August 10, 2016].

160
A. O. Breetzke
Vitali, B. et al., 2007. Dynamics of vaginal bacterial communities in women
developing bacterial vaginosis, candidiasis, or no infection, analyzed by PCR-
denaturing gradient gel electrophoresis and real-time PCR. Applied and
Environmental Microbiology, 73(18), pp.5731–5741.
Voelkerding, K. V, Dames, S. & Durtschi, J.D., 2010. Next Generation Sequncing
for Clinical Diagnostics - Principles and Application to Targeted
Resequencing for Hypertrophic Cardiomyopathy. The Journal of Molecular
Diagnostics, 12(5), pp.539–551. Available at:
http://dx.doi.org/10.2353/jmoldx.2010.100043.
Wang, Y. & Rice, A.P., 2006. Interleukin-10 inhibits HIV-1 LTR-directed gene
expression in human macrophages through the induction of cyclin T1
proteolysis. Virology, 352(2), pp.485–492.
Western Cape Government, 2015. Contraception (family planning). Available at:
https://www.westerncape.gov.za/service/contraception-family-planning
[Accessed October 12, 2016].
Wienkoop, S. & Weckwerth, W., 2006. Relative and absolute quantitative shotgun
proteomics : targeting low-abundance proteins in Arabidopsis thaliana. Journal
of Experimental Botany, 57(7), pp.1529–1535.
van de Wijgert, J.H.H.M. et al., 2013. Hormonal contraception decreases bacterial
vaginosis but oral contraception may increase candidiasis: implications for
HIV transmission. AIDS (London, England), 27(13), pp.2141–53.
Wira, C.R., Fahey, J. V., et al., 2005. Innate and adaptive immunity in female
genital tract: Cellular responses and interactions. Immunological Reviews, 206,
pp.306–335.

161
A. O. Breetzke
Wira, C.R., Grant-Tschudy, K.S. & Crane-Godreau, M.A., 2005. Epithelial cells in
the female reproductive tract: a central role as sentinels of immune protection.
American journal of reproductive immunology (New York, N.Y. : 1989), 53(2),
pp.65–76. Available at: http://doi.wiley.com/10.1111/j.1600-
0897.2004.00248.x%5Cnpapers3://publication/doi/10.1111/j.1600-
0897.2004.00248.x.
World Health Organization, 2017. Hormonal contraceptive eligibility for women at
high risk of HIV Guidance,
Wu, G.D. et al., 2011. Linking Long-Term Dietary Patterns with Gut Microbial
Enterotypes. Science, 334(6052), pp.105–108.
Xu, H., Wang, X. & Veazey, R.S., 2013. Mucosal immunology of HIV infection.
Immunological Reviews, 254(1), pp.10–33.
Zhang, Z.-Q. et al., 2004. Roles of substrate availability and infection of resting
and activated CD4+ T cells in transmission and acute simian
immunodeficiency virus infection. Proceedings of the National Academy of
Sciences of the United States of America, 101(15), pp.5640–5645.
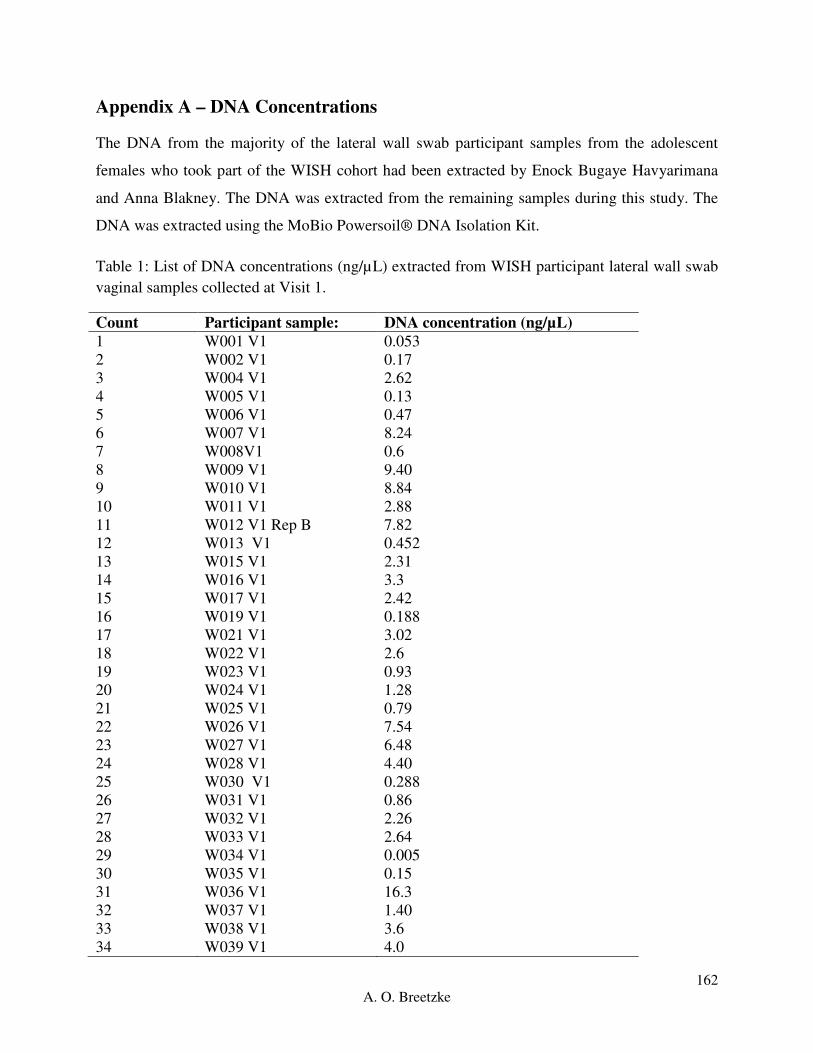
162
A. O. Breetzke
Appendix A – DNA Concentrations
The DNA from the majority of the lateral wall swab participant samples from the adolescent
females who took part of the WISH cohort had been extracted by Enock Bugaye Havyarimana
and Anna Blakney. The DNA was extracted from the remaining samples during this study. The
DNA was extracted using the MoBio Powersoil® DNA Isolation Kit.
Table 1: List of DNA concentrations (ng/µL) extracted from WISH participant lateral wall swab
vaginal samples collected at Visit 1.
Count Participant sample: DNA concentration (ng/µL)
1 W001 V1 0.053
2 W002 V1 0.17
3 W004 V1 2.62
4 W005 V1 0.13
5 W006 V1 0.47
6 W007 V1 8.24
7 W008V1 0.6
8 W009 V1 9.40
9 W010 V1 8.84
10 W011 V1 2.88
11 W012 V1 Rep B 7.82
12 W013 V1 0.452
13 W015 V1 2.31
14 W016 V1 3.3
15 W017 V1 2.42
16 W019 V1 0.188
17 W021 V1 3.02
18 W022 V1 2.6
19 W023 V1 0.93
20 W024 V1 1.28
21 W025 V1 0.79
22 W026 V1 7.54
23 W027 V1 6.48
24 W028 V1 4.40
25 W030 V1 0.288
26 W031 V1 0.86
27 W032 V1 2.26
28 W033 V1 2.64
29 W034 V1 0.005
30 W035 V1 0.15
31 W036 V1 16.3
32 W037 V1 1.40
33 W038 V1 3.6
34 W039 V1 4.0

163
A. O. Breetzke
35 W040 V1 1.7
36 W041 V1 6.06
37 W043 V1 4.20
38 W044 V1 6.32
39 W045 V1 0.22
40 W046 V1 0.005
41 W047 V1 37.2
42 W048 V1 3.76
43 W050 V1 0.17
44 W051 V1 0.68
45 W052 V1 4.08
46 W053 V1 0.80
47 W054 V1 0.25
48 W055 V1 0.53
49 W056 V1 0.80
50 W057 V1 3.48
51 W059 V1 0.64
52 W060 V1 1.79
53 W061V1 0.48
54 W062 V1 0.46
55 W063V1 0.20
56 W064 V1 0.52
57 W065 V1 0.52
58 W066 V1 2.20
59 W067 V1 2.20
60 W068 V1 2.66
61 W070 V1 10.40
62 W071 V1 1.02
63 W072 V1 1.64
64 W073 V1 10.2
65 W074 V1 0.96
66 W076 V1 8.76
67 W077 V1 5.20
68 W079 V1 1.46
69 W080 V1 0.005
70 W081 V1 1.80
71 W082 V1 6.32
72 W083 V1 Rep A 19.38
73 W084 V1 1.07
74 W085 V1 4.52
75 W086 V1 2.05
76 W087 V1 5.72
77 W088 V1 2.71
78 W089 V1 5.12
79 W091 V1 1.23
80 W092 V1 7.84

164
A. O. Breetzke
81 W094 V1 3.82
82 W095 V1 3.04
83 W096 V1 3.24
84 W097 V1 0.76
85 W098 V1 1.11
86 W099 V1 0.005
87 W100 V1 0.30
88 W101 V1 1.61
89 W102 V1 1.01
90 W104 V1 7.0
91 W105 V1 1.40
92 W106 V1 6.28
93 W107 V1 4.36
94 W108 V1 7.28
95 W110 V1 3.4
96 W112 V1 1.06
97 W113 V1 5.12
98 W114 V1 6.96
99 W115 V1 3.83
100 W116 V1 4.44
101 W117 V1 6.48
102 W118 V1 4.84
103 W119 V1 Rep A 25
104 W120 V1 8.24
105 W121 V1 1.44
106 W122 V1 1.14
107 W123 V1 0.038
108 W124 V1 1.36
109 W125 V1 0.60
110 W126 V1 9.76
111 W127 V1 5
112 W128 V1 1.38
113 W129 V1 4.68
114 W130 V1 7.24
115 W131 V1 4.68
116 W132 V1 Rep B 25.2
117 W135 V1Rep A 10.42
118 W136 V1 11.7
119 W137 V1 3.3
120 W138 V1 Rep A 88.7
121 W139 V1 7.40
122 W141 V1 1.62
123 W147 V1 9.68
124 W148 V1 Rep A 17.44
125 W149 V1 2.92
126 W150 V1 Rep B 20.8

165
A. O. Breetzke
127 W152 V1 13.2
128 W154 V1 8.4
129 W156 V1 Rep A 4.5
130 W157 V1 Rep B 30.4
131 W158 V1 Rep B 2.28
132 W159 V1 Rep A 15.56
133 W160 V1 Rep B 15.06
134 W161 V1 Rep B 5.94
135 W163 V1 Rep B 45
136 W164 V1 Rep A 9.44
137 W165 V1 Rep A 5.14
138 W166 V1 Rep A 0.1
139 W167 V1 Rep A 32.8
140 W168 V1 Rep A 3.84
141 W170 V1 Rep A 15.74
142 W171 V1 Rep B 0.78
143 W172 V1 Rep A 4.4
144 W173 V1 Rep B 7.88
145 W174 V1 Rep A 1.6
146 W176 V1 Rep A 7.06

166
A. O. Breetzke
Appendix B – Primer Confirmation
A PCR was run using the DNA extracted from the growth of each bacterial positive control in
duplicate with a Non-Template Control (NTC) (Qiagen Blood and Tissue DNA Maxi Extraction
Kit with Buffers B1 and B2). The PCR products were then run on a 1.6% agarose gel at 130V for
1 h with a 100 bp ladder to visualize the size of the bands to confirm the species specific primer
product sizes for each species.
Figure 1: Gel electrophoresis of the standard positive control species specific PCR to confirm
primer specificity and product size. 1 and 14 indicate a ThermoFisher O’Gene 100 bp ruler, lanes
2, 4, 6, 8, 10, and 12 indicates the PCR products for L. crispatus, L. gasseri, L. jensenii, L. iners,
G. vaginalis and P. bivia, and lanes 3, 5, 7, 9, and 11 indicate their respective NTC’s.
1 2 3 4 5 6 7 8 9 10 11 12 13 14
500 bp 500 bp
100 bp 100 bp

167
A. O. Breetzke
Appendix C: qPCR Optimization
For the optimization of each bacterial specific absolute qPCR, multiple plates were run with
different conditions until the error and efficiency values were as close to 0.05 and 2 respectively,
as could be optimized. The following figures illustrate each trial plate that was run for each
bacterial species, as well as the changes that were made for each plate.
The optimization figures for L. crispatus, G. vaginalis and P. bivia can be found in Chapter 4,
Results, 4.1 Real-Time PCR (qPCR) Optimization.
Real-Time PCR (qPCR) Optimization:
1 Lactobacillus gasseri
A total of three trial plates were run to finalize the optimization of L. gasseri qPCR conditions.
The first trial plate (V1.1) was run using the same reagent volumes as the finalized conditions for
L. crispatus (V1.7). The following qPCR conditions were followed, 95 C for 15 min initial
denaturation, followed by 40 cycles of 95 C for 15 s, 57 C for 1 min and 65 C for 1 min (Figure
1.1 A, Figure 1.2 A). The replicates for the positive controls showed some inaccuracies and thus
required a second run. The second trial plate for L. gasseri (1.2) was run under the same
conditions as qPCR trial plate V1.1 in order to improve efficiency and pipetting accuracy with
the exception of the initial denaturation being for 5 min (Figure 1.1 B, Figure 1.2 B). The error
and efficiency values showed good readings and the positive controls amplified well. The third
and final optimization plate for L. gasseri was run using the same conditions as V1.2 in order to
determine whether the lack of amplification in the positive controls at 10-2
copies/µL was due to
a pipetting error or the concentration threshold for amplification of the standard control DNA
(Figure 1.1 C, Figure 1.2 C). The final standard curve error and efficiency readings were good
with single peaks in the melt curves and thus accepted to run samples.
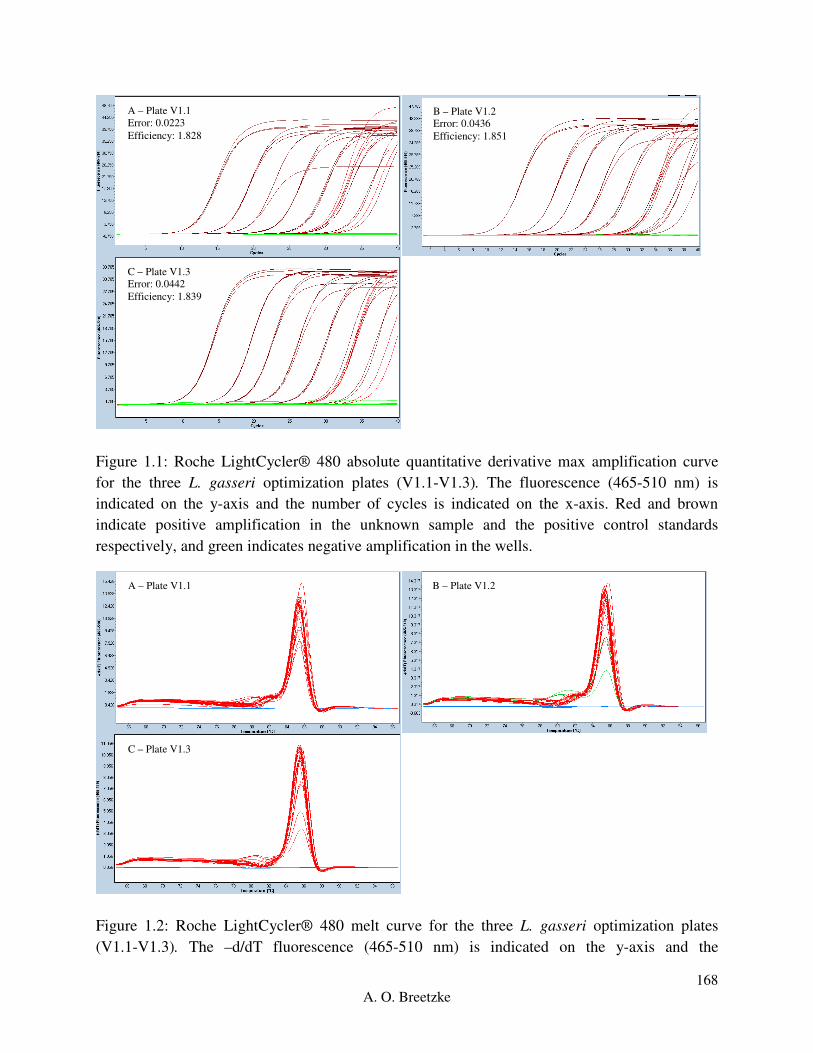
168
A. O. Breetzke
Figure 1.1: Roche LightCycler® 480 absolute quantitative derivative max amplification curve
for the three L. gasseri optimization plates (V1.1-V1.3). The fluorescence (465-510 nm) is
indicated on the y-axis and the number of cycles is indicated on the x-axis. Red and brown
indicate positive amplification in the unknown sample and the positive control standards
respectively, and green indicates negative amplification in the wells.
Figure 1.2: Roche LightCycler® 480 melt curve for the three L. gasseri optimization plates
(V1.1-V1.3). The –d/dT fluorescence (465-510 nm) is indicated on the y-axis and the
A – Plate V1.1
Error: 0.0223
Efficiency: 1.828
B – Plate V1.2
Error: 0.0436
Efficiency: 1.851
C – Plate V1.3
Error: 0.0442
Efficiency: 1.839
A – Plate V1.1 B – Plate V1.2
C – Plate V1.3

169
A. O. Breetzke
temperature (C) is indicated on the x-axis. Red indicates a single peak (product), green indicates
two peaks and blue indicates no peak for each well.
2 Lactobacillus jensenii
Two qPCR trial plates were run for L. jensenii where the first (V1.1) was run using the same
reagent volumes as the finalized conditions for L. crispatus (V1.7). The following qPCR
conditions were followed, 95 C for 5 min for initial denaturation, followed by 40 cycles of 95 C
for 15 s, 60 C for 55 s, and 72 C for 1 min (Figure 2.1 A, Figure 2.2 A). The error value was
higher than optimum despite the clean amplification curves of the positive controls. The second
L. jensenii qPCR trial plate (V1.2) was run under the same conditions as qPCR trial V1.1 to try
and improve efficiency and pipetting accuracy (Figure 2.1 B, Figure 2.2 B). The error and
efficiency values were close to optimum with a good standard curve and single melt curve peaks.
Figure 2.1: Roche LightCycler® 480 absolute quantitative derivative max amplification curve
for the two L. jensenii optimization plates (V1.1-V1.2). The fluorescence (465-510 nm) is
indicated on the y-axis and the number of cycles is indicated on the x-axis. Red and brown
indicate positive amplification in the unknown sample and the positive control standards
respectively, and green indicates negative amplification in the wells.
A – Plate V1.1
Error: 0.312
Efficiency: 1.864
B – Plate V1.2
Error: 0.0210
Efficiency: 1.921

170
A. O. Breetzke
Figure 2.2: Roche LightCycler® 480 melt curve for the two L. jensenii optimization plates
(V1.1-V1.2). The –d/dT fluorescence (465-510 nm) is indicated on the y-axis and the
temperature (C) is indicated on the x-axis. Red indicates a single peak (product), green indicates
two peaks and blue indicates no peak for each well.
3 Lactobacillus iners
As seen above for L. jensenii, L. iners was optimized with two trial plates with the first trial plate
(V1.1) being run using the same reagent volumes and concentrations as set up in the final trial
run for L. crispatus (V1.7) with the following qPCR conditions 95 C for 15 min for the initial
denaturation, followed by 40 cycles of 95 C for 15 s, 60 C for 55s and 69 C for 1 min (Figure 3.1
A, Figure 3.2 A). The efficiency was slightly higher than expected with some dimerization
present within the melt curve. The second trial plate for L. iners (V1.2) was run using the same
conditions as in V1.1 in order to confirm the error and efficiency values before running samples
(Figure 3.1 B, Figure 3.2 B). The error and efficiency were of sufficient readings with a single
melt curve peak.
A – Plate V1.1
B – Plate V1.2
A – Plate V1.1
Error: 0.0335
Efficiency: 2.022
B – Plate V1.2
Error: 0.0805
Efficiency: 1.835

171
A. O. Breetzke
Figure 3.1: Roche LightCycler® 480 absolute quantitative derivative max amplification curve
for the two L. iners optimization plates (V1.1-V1.2). The fluorescence (465-510 nm) is indicated
on the y-axis and the number of cycles is indicated on the x-axis. Red and brown indicate
positive amplification in the unknown sample and the positive control standards respectively,
and green indicates negative amplification in the wells.
Figure 3.2: Roche LightCycler® 480 melt curve for the two L. iners optimization plates (V1.1-
V1.2). The –d/dT fluorescence (465-510 nm) is indicated on the y-axis and the temperature (C)
is indicated on the x-axis. Red indicates a single peak (product), green indicates two peaks and
blue indicates no peak for each well.
For all result amplification and melt curves, see Appendix D, qPCR Results.
A – Plate V1.1
B – Plate V1.2

172
A. O. Breetzke
Appendix D: qPCR Results
Thhis appendix serves as a refrence for the raw qPCR results for the absolute quantitifcation od
each bacterial species of interest i.e. L. crispatus (copies/ng), L. gasseri (copies/ng), L. jensenii
(copies/ng), L. iners (copies/ng), G. vaginalis (copies/ng), and P. bivia (copies/ng) in the DNA
extracted from the lateral wall swabs from adolescent females who partook in the WISH Cohort
at the Masiphumelele Youth Centre.
1. Real-Time PCR (qPCR) Results:
Table 1.1: Summary table for the WISH sample run qPCR standard curve statistics for the
following bacteria of interest:
Bacteria qPCR Plate Error Efficiency
L. crispatus V2.1 0.244 1.704
V2.2 0.259 1.807
V2.3 0.0130 1.896
V2.4 0.0264 1.903
V2.5 0.488 1.521
V2.6 0.0215 1.867
V2.7 0.0393 1.819
V2.8 0.0290 1.865
L. gasseri V2.1 0.0557 1.803
V2.2 0.0672 1.741
V2.3 0.0565 1.743
V2.4 0.0592 1.691
V2.5 0.0609 1.695
V2.6 0.0511 1.701
V2.7 0.122 1.801
V2.8 0.0328 1.858
V2.9 0.0261 1.846
L. jensenii V2.1 0.0256 1.897
V2.2 0.0521 1.962
V2.3 0.0498 1.912
V2.4 0.0458 1.901
V2.5 0.0521 1.930
V2.6 0.0508 1.686
V2.7 0.0466 1.961
V2.8 0.0401 1.941
L. iners V2.1 0.0139 1.810
V2.2 0.0237 1.764
V2.3 0.0203 1.698
V2.4 0.0143 1.825
V2.5 0.0832 1.867

173
A. O. Breetzke
V2.6 0.0132 1.935
G. vaginalis V2.1 0.0252 1.895
V2.2 0.0151 1.856
V2.3 0.0375 1.902
V2.4 0.0601 1.892
V2.5 0.0255 1.901
V2.6 0.0751 1.821
V2.7 0.0805 1.835
P. bivia V2.1-V2.6 0.0608 1.993
1.1 Lactobacillus crispatus
Eight plates were run in total for the 143 samples in triplicate with the positive controls for L.
crispatus. For instances where either one or two replicates showed primer dimers, no
amplification or different values in comparison to the other replicates for the sample, the sample
was re-run on another plate to confirm the readings (Figure 1.1.1, Figure 1.1.2).
B – Plate V2.2
Error: 0.259
Efficiency: 1.807
A – Plate V2.1
Error: 0.244
Efficiency: 1.704
C – Plate V2.3
Error: 0.0130
Efficiency: 1.896
D – Plate V2.4
Error: 0.0264
Efficiency: 1.903

174
A. O. Breetzke
Figure 1.1.1: Absolute quantitative derivative max amplification curve of L. crispatus qPCR
(V2.1-V2.8) reported as log transformed copies/ng total DNA, generated based on all wells and
the standard curve is generated based on the amplification curve of the standard positive controls
ranging from 106 to 10
0 copies/µL. The fluorescence (465-510 nm) is indicated on the y-axis and
the number of cycles is indicated on the x-axis. Red and brown indicate positive amplification in
the unknown samples and the positive control standards respectively; blue indicates uncertainty
and green indicates negative amplification in the wells.
H – Plate V2.8
Error: 0.0290
Efficiency: 1.865
G – Plate V2.7
Error: 0.0393
Efficiency: 1.891
E – Plate V2.5
Error: 0.488
Efficiency: 1.521
F – Plate V2.6
Error: 0.0215
Efficiency: 1.867
B – Plate V2.2 A – Plate V2.1
C – Plate V2.3 D – Plate V2.4

175
A. O. Breetzke
Figure 1.1.2: Melt curve of L. crispatus, qPCR (V2.1-V2.8) generated based on the amplification
curve of all wells where red indicates a single product (peak) and blue indicates no product. The
–d/dT fluorescence (465-510 nm) is indicated on the y-axis and the temperature (C) is indicated
on the x-axis.
1.2 Lactobacillus gasseri
Nine plates were run in total for the 143 samples in triplicate with the positive controls for L.
gasseri due to more samples requiring confirmation of their replicate consistency. For instances
where either one or two replicates showed primer dimers, no amplification or different values in
comparison to the other replicates for the sample, the sample was re-run on another plate to
confirm the readings (Figure 1.2.1, Figure 1.2.2).
H – Plate V2.8 G – Plate V2.7
E – Plate V2.5 F – Plate V2.6

176
A. O. Breetzke
B – Plate V2.2
Error: 0.0672
Efficiency: 1.741
A – Plate V2.1
Error: 0.0557
Efficiency: 1.803
C – Plate V2.3
Error: 0.0565
Efficiency: 1.743
D – Plate V2.4
Error: 0.0592
Efficiency: 1.691
E – Plate V2.5
Error: 0.0609
Efficiency: 1.695
F – Plate V2.6
Error: 0.0511
Efficiency: 1.701
H – Plate V2.8
Error: 0.0328
Efficiency: 1.858
G – Plate V2.7
Error: 0.122
Efficiency: 1.801

177
A. O. Breetzke
Figure 1.2.1: Absolute quantitative derivative max amplification curve of L. gasseri qPCR
(V2.1-V2.9) reported as log transformed copies/ng total DNA, generated based on all wells and
the standard curve is generated based on the amplification curve of the standard positive controls
ranging from 106 to 10
0 copies/µL. The fluorescence (465-510 nm) is indicated on the y-axis and
the number of cycles is indicated on the x-axis. Red and brown indicate positive amplification in
the unknown samples and the positive control standards respectively; blue indicates uncertainty
and green indicates negative amplification in the wells.
I – Plate V2.9
Error: 0.0261
Efficiency: 1.846
B – Plate V2.2
C – Plate V2.3
A – Plate V2.1
D – Plate V2.4
F – Plate V2.6 E – Plate V2.5

178
A. O. Breetzke
Figure 1.2.2: Melt curve of L. gasseri qPCR (V2.1-V2.9) generated based on the amplification
curve of all wells where red indicates a single product (peak) and blue indicates no product. The
–d/dT fluorescence (465-510 nm) is indicated on the y-axis and the temperature (C) is indicated
on the x-axis.
1.3 Lactobacillus jensenii
Eight plates were run in total for the 143 samples in triplicate with the positive controls for L.
jensenii due to more samples requiring confirmation of their replicate consistency. For instances
where either one or two replicates showed primer dimers, no amplification or different values in
comparison to the other replicates for the sample, the sample was re-run on another plate to
confirm the readings (Figure 1.3.1, Figure 1.3.2).
H – Plate V2.8 G – Plate V2.7
I – Plate V2.9

179
A. O. Breetzke
Figure 1.3.1: Absolute quantitative derivative max amplification curve of L. jensenii qPCR
(V2.1-V2.8) reported as log transformed copies/ng total DNA, generated based on all wells and
the standard curve is generated based on the amplification curve of the standard positive controls
ranging from 106 to 10
0 copies/µL. The fluorescence (465-510 nm) is indicated on the y-axis and
the number of cycles is indicated on the x-axis. Red and brown indicate positive amplification in
the unknown samples and the positive control standards respectively; blue indicates uncertainty
and green indicates negative amplification in the wells.
E – Plate V2.5
Error: 0.0521
Efficiency: 1.930
B – Plate V2.2
Error: 0.0521
Efficiency: 1.962
F – Plate V2.6
Error: 0.0508
Efficiency: 1.686
C – Plate V2.3
Error: 0.0498
Efficiency: 1.912
D – Plate V2.4
Error: 0.0458
Efficiency: 1.901
A – Plate V2.1
Error: 0.0256
Efficiency: 1.897
G – Plate V2.7
Error: 0.0466
Efficiency: 1.961
H – Plate V2.8
Error: 0.0401
Efficiency: 1.941

180
A. O. Breetzke
Figure 1.3.2: Melt curve of L. jensenii qPCR (V2.1-V2.8) generated based on the amplification
curve of all wells where red indicates a single product (peak) and blue indicates no product. The
–d/dT fluorescence (465-510 nm) is indicated on the y-axis and the temperature (C) is indicated
on the x-axis.
G – Plate V2.7
E – Plate V2.5
B – Plate V2.2
F – Plate V2.6
C – Plate V2.3 D – Plate V2.4
A – Plate V2.1
H – Plate V2.8

181
A. O. Breetzke
1.4 Lactobacillus iners
Six plates were run in total for the 143 samples in triplicate with the positive controls for L.
iners. Repeats were not run for L. iners as it was established with the previous three bacteria that
the majority of the negatives were due to lower readings for the bacteria in comparison to L.
iners (Figure 1.4.1, Figure 1.4.2).
Figure 1.4.1: Absolute quantitative derivative max amplification curve of L. iners qPCR (V2.1-
V2.6) reported as log transformed copies/ng total DNA, generated based on all wells and the
standard curve is generated based on the amplification curve of the standard positive controls
ranging from 106 to 10
0 copies/µL. The fluorescence (465-510 nm) is indicated on the y-axis and
the number of cycles is indicated on the x-axis. Red and brown indicate positive amplification in
the unknown samples and the positive control standards respectively; blue indicates uncertainty
and green indicates negative amplification in the wells.
E – Plate V2.5
Error: 0.0832
Efficiency: 1.867
B – Plate V2.2
Error: 0.0237
Efficiency: 1.764
F – Plate V2.6
Error: 0.0132
Efficiency: 1.935
C – Plate V2.3
Error: 0.0203
Efficiency: 1.698
D – Plate V2.4
Error: 0.0143
Efficiency: 1.825
A – Plate V2.1
Error: 0.0139
Efficiency: 1.810
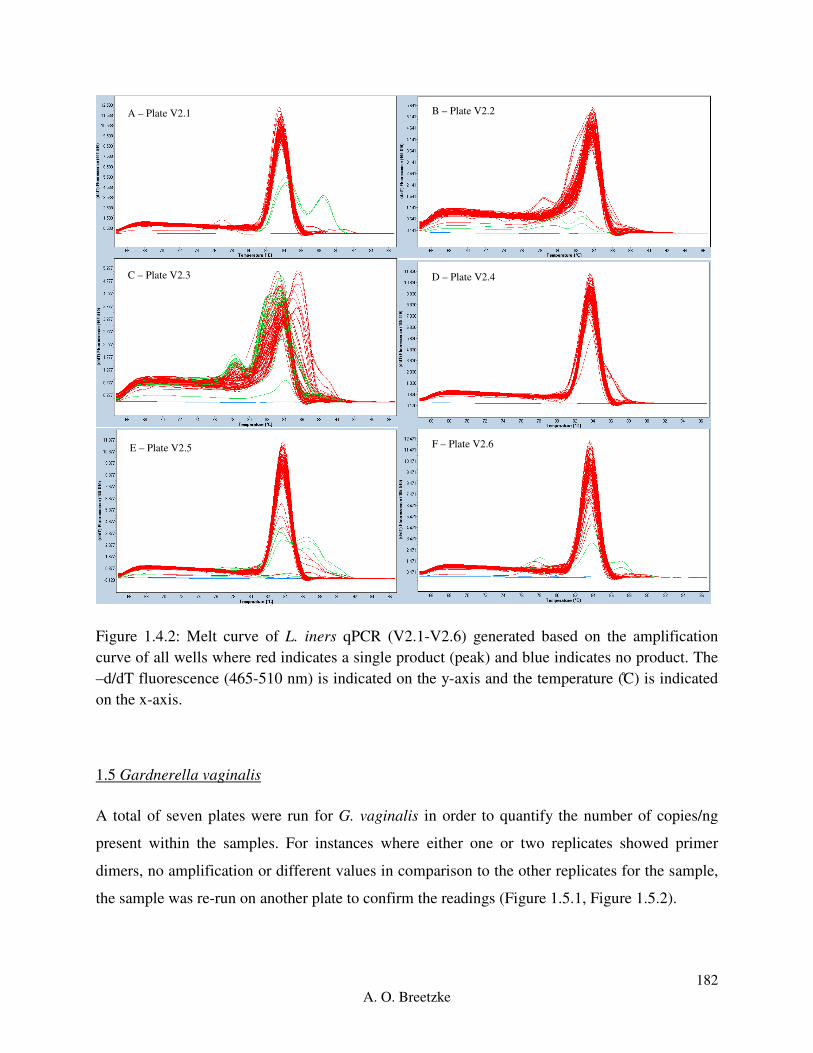
182
A. O. Breetzke
Figure 1.4.2: Melt curve of L. iners qPCR (V2.1-V2.6) generated based on the amplification
curve of all wells where red indicates a single product (peak) and blue indicates no product. The
–d/dT fluorescence (465-510 nm) is indicated on the y-axis and the temperature (C) is indicated
on the x-axis.
1.5 Gardnerella vaginalis
A total of seven plates were run for G. vaginalis in order to quantify the number of copies/ng
present within the samples. For instances where either one or two replicates showed primer
dimers, no amplification or different values in comparison to the other replicates for the sample,
the sample was re-run on another plate to confirm the readings (Figure 1.5.1, Figure 1.5.2).
E – Plate V2.5
B – Plate V2.2
F – Plate V2.6
C – Plate V2.3 D – Plate V2.4
A – Plate V2.1
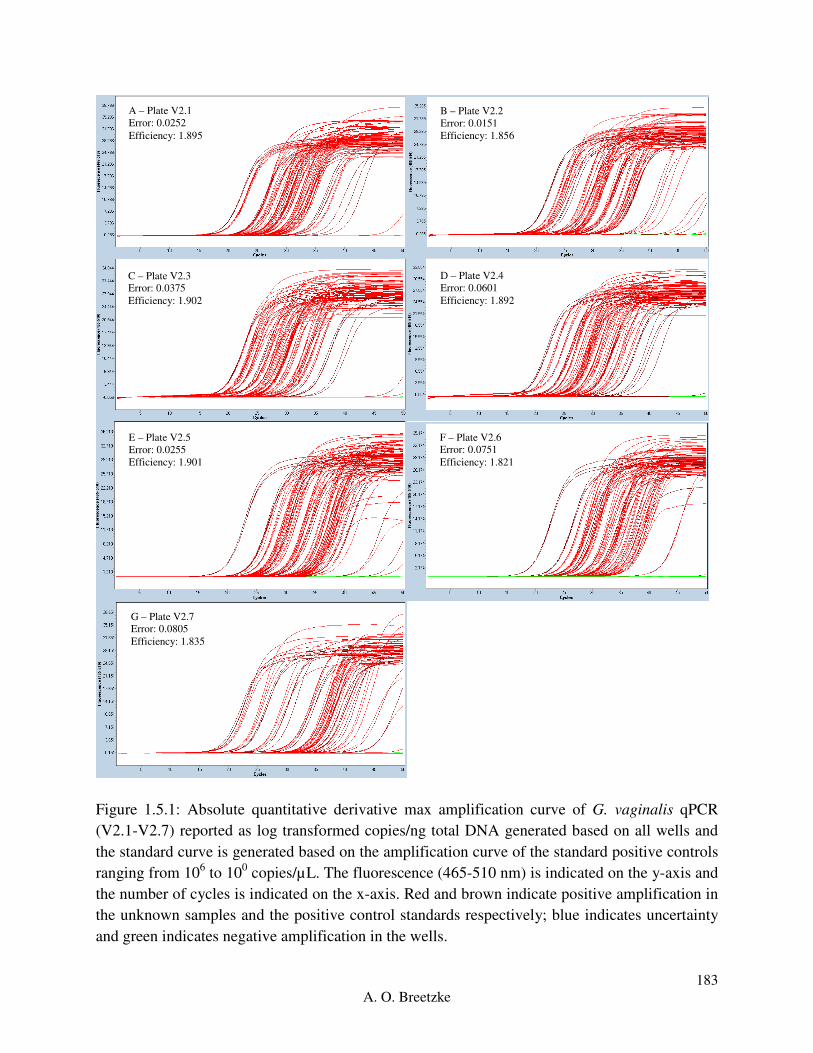
183
A. O. Breetzke
Figure 1.5.1: Absolute quantitative derivative max amplification curve of G. vaginalis qPCR
(V2.1-V2.7) reported as log transformed copies/ng total DNA generated based on all wells and
the standard curve is generated based on the amplification curve of the standard positive controls
ranging from 106 to 10
0 copies/µL. The fluorescence (465-510 nm) is indicated on the y-axis and
the number of cycles is indicated on the x-axis. Red and brown indicate positive amplification in
the unknown samples and the positive control standards respectively; blue indicates uncertainty
and green indicates negative amplification in the wells.
E – Plate V2.5
Error: 0.0255
Efficiency: 1.901
B – Plate V2.2
Error: 0.0151
Efficiency: 1.856
C – Plate V2.3
Error: 0.0375
Efficiency: 1.902
A – Plate V2.1
Error: 0.0252
Efficiency: 1.895
D – Plate V2.4
Error: 0.0601
Efficiency: 1.892
F – Plate V2.6
Error: 0.0751
Efficiency: 1.821
G – Plate V2.7
Error: 0.0805
Efficiency: 1.835

184
A. O. Breetzke
Figure 1.5.2: Melt curve of G. vaginalis qPCR (V2.1-V2.7) generated based on the amplification
curve of all wells where red indicates a single product (peak) and blue indicates no product. The
–d/dT fluorescence (465-510 nm) is indicated on the y-axis and the temperature (C) is indicated
on the x-axis.
G – Plate V2.7
E – Plate V2.5
B – Plate V2.2
F – Plate V2.6
C – Plate V2.3 D – Plate V2.4
A – Plate V2.1

185
A. O. Breetzke
1.6 Prevotella bivia
Five plates were run in total for the 143 samples in triplicate with the positive controls for P.
bivia. There were no instances where either one or two replicates showed primer dimers, no
amplification or different values in comparison to the other replicates for the samples, thus no
samples were repeated. There was not enough standard control DNA to run repeats of all the
dilutions each time, thus a reference standard curve was used to quantify the samples (Figure
1.6.1, Figure 1.6.2).
Figure 1.6.1: Absolute quantitative derivative max amplification curve of P. bivia qPCR (V2.1-
V2.5) reported as log transformed copies/ng total DNA, generated based on all wells and the
standard curve is generated based on the amplification curve of the standard positive controls
ranging from 106 to 10
0 copies/µL. The fluorescence (465-510 nm) is indicated on the y-axis and
the number of cycles is indicated on the x-axis. Red and brown indicate positive amplification in
E – Plate V2.5
Error: 0.0608
Efficiency: 1.993
B – Plate V2.2
Error: 0.0608
Efficiency: 1.993
C – Plate V2.3
Error: 0.0608
Efficiency: 1.993
D – Plate V2.4
Error: 0.0608
Efficiency: 1.993
A – Plate V2.1
Error: 0.0608
Efficiency: 1.993
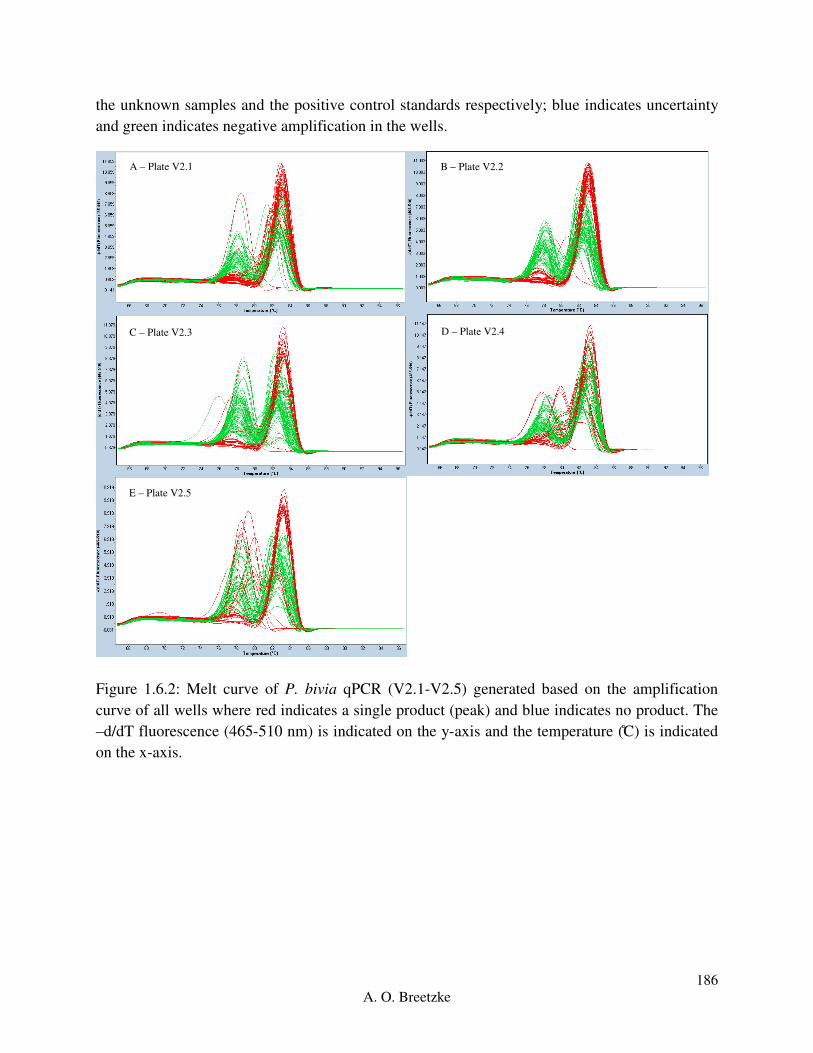
186
A. O. Breetzke
the unknown samples and the positive control standards respectively; blue indicates uncertainty
and green indicates negative amplification in the wells.
Figure 1.6.2: Melt curve of P. bivia qPCR (V2.1-V2.5) generated based on the amplification
curve of all wells where red indicates a single product (peak) and blue indicates no product. The
–d/dT fluorescence (465-510 nm) is indicated on the y-axis and the temperature (C) is indicated
on the x-axis.
E – Plate V2.5
B – Plate V2.2
C – Plate V2.3 D – Plate V2.4
A – Plate V2.1
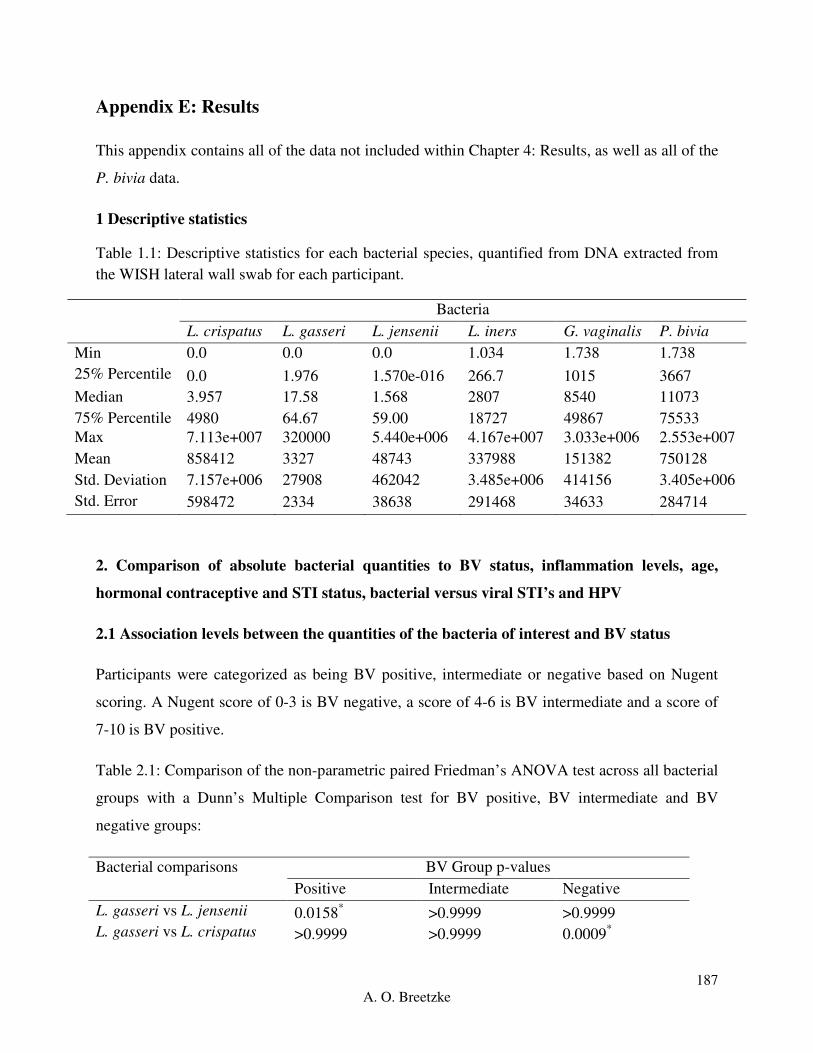
187
A. O. Breetzke
Appendix E: Results
This appendix contains all of the data not included within Chapter 4: Results, as well as all of the
P. bivia data.
1 Descriptive statistics
Table 1.1: Descriptive statistics for each bacterial species, quantified from DNA extracted from
the WISH lateral wall swab for each participant.
Bacteria
L. crispatus L. gasseri L. jensenii L. iners G. vaginalis P. bivia
Min 0.0 0.0 0.0 1.034 1.738 1.738
25% Percentile 0.0 1.976 1.570e-016 266.7 1015 3667
Median 3.957 17.58 1.568 2807 8540 11073
75% Percentile 4980 64.67 59.00 18727 49867 75533
Max 7.113e+007 320000 5.440e+006 4.167e+007 3.033e+006 2.553e+007
Mean 858412 3327 48743 337988 151382 750128
Std. Deviation 7.157e+006 27908 462042 3.485e+006 414156 3.405e+006
Std. Error 598472 2334 38638 291468 34633 284714
2. Comparison of absolute bacterial quantities to BV status, inflammation levels, age,
hormonal contraceptive and STI status, bacterial versus viral STI’s and HPV
2.1 Association levels between the quantities of the bacteria of interest and BV status
Participants were categorized as being BV positive, intermediate or negative based on Nugent
scoring. A Nugent score of 0-3 is BV negative, a score of 4-6 is BV intermediate and a score of
7-10 is BV positive.
Table 2.1: Comparison of the non-parametric paired Friedman’s ANOVA test across all bacterial
groups with a Dunn’s Multiple Comparison test for BV positive, BV intermediate and BV
negative groups:
Bacterial comparisons BV Group p-values
Positive Intermediate Negative
L. gasseri vs L. jensenii 0.0158* >0.9999 >0.9999
L. gasseri vs L. crispatus >0.9999 >0.9999 0.0009*

188
A. O. Breetzke
L. gasseri vs L. iners <0.0001* 0.1756 <0.0001
*
L. gasseri vs G. vaginalis <0.0001* 0.0123
* 0.0002
*
L. gasseri vs P. bivia <0.0001* 0.0001
* <0.0001
*
L. jensenii vs L. crispatus 0.741 >0.9999 <0.0001*
L. jensenii vs L. iners <0.0001* 0.1178 <0.0001
*
L. jensenii vs G. vaginalis <0.0001* 0.0074
* <0.0001
*
L. jensenii vs P. bivia <0.0001* <0.0001
* <0.0001
*
L. crispatus vs L. iners <0.0001* 0.0044
* >0.9999
L. crispatus vs G. vaginalis <0.0001* 0.0001
* >0.9999
L. crispatus vs P. bivia <0.0001* <0.0001
* 0.0012
*
L. iners vs G. vaginalis 0.007 >0.9999 >0.9999
L. iners vs P. bivia 0.0274 0.8133 0.3939
G. vaginalis vs P. bivia >0.9999 >0.9999 0.0041*
ANOVA p-value <0.0001* <0.0001
* <0.0001
*
*The asterisk indicates a p-value lower than the standardized p-value of 0.05 with a 95%
confidence interval.
2.1.1 Prevotella bivia
We compared the quantified log copies/ng of P. bivia between the BV groups. There was no
significant difference in P. bivia between the BV groups (Kruskal-Wallis ANOVA p=0.8031)
(Figure 2.1.1). This is one of the reasons that P. bivia was not included in the comparison
between the bacteria per category. The results are not reliable and indicate and oversensitivity of
the primers, resulting in increased copies/ng between all thee BV groups.
Pos Int
Neg
1.0×1000
1.0×1002
1.0×1004
1.0×1006
1.0×1008 p>0.9999
p>0.9999
p>0.9999
BV Status
log
tra
nsfo
rmed
co
pie
s/n
g

189
A. O. Breetzke
Figure 2.1.1: Comparison of the quantities of P. bivia (log transformed copies/ng DNA)
measured in the DNA extracted from vaginal lateral wall swabs from participants in the WISH
study, between BV positive, intermediate and negative groups. All p-value comparisons were
based on an unpaired, non-parametric Dunn’s Multiple Comparison test. Each point in the figure
represents an individual participant. The three horizontal bars represent the median value (middle
bar), upper interquartile range (top bar) and lower interquartile range (bottom bar).
2.2 Association levels between bacteria of interest and inflammatory immunological factor
levels
The two inflammatory groups were defined based on the unsupervised analysis of the 47
immunological factors of interest in the cervicovaginal fluid of women in the WISH cohort.
These immunological factors were categorized into high and low inflammation by partitioning
around medoids (PAM) using an R package ‘cluster’ with a k-value of 2. The samples were
originally separated into high and low inflammation based on the levels of only the pro-
inflammatory and chemokine factors measured. However, the inflammation separation of the
participant samples showed little difference between the two pro-inflammatory and chemokine
groups of immunological factor analysis in comparison to using all of the factors to determine
high and low inflammation. Thus the final inflammation categorization was done using all 47
immunological factors.
The immunological factors measured in this study can be generally grouped into five different
categories. The immunological factors considered as pro-inflammatory were IL-1a, IL-1b, IL-6,
IL-12p40, IL-12(p70), IL-18, MIF, TNF-a, TNF-b and TRAIL. The immunological factors
considered chemokines were CTACK, Eotaxin, GROa, IL-8, IL-16, IP-10, MCP-1, MCP-3,
MIG, MIP-1a, MIP-1b, IFN-a2, and RANTES. The immunological factors considered growth
factors were b-NGF, FGF basic, G-CSF, GM-CSF, HGF, IL-3, IL-7, IL-9, LIF, M-CSF, PDGF-
bb, SCF, SCGF-b, SDF-1a and VEGF. The immunological factors considered adaptive were
IFN-g, IL-4, IL-13, IL-17, IL-2Ra, IL-2, and IL-5. The immunological factors considered
regulatory were IL-10 and IL-1ra.

190
A. O. Breetzke
Table 2.2: Comparison of the non-parametric, paired Friedman’s ANOVA test across all
bacterial groups with a Dunn’s Multiple Comparison test for the Inflammation high and low
groups:
Bacterial comparisons Inflammation Level p-values
Low High
L. gasseri vs L. jensenii >0.9999 0.0463
L. gasseri vs L. crispatus 0.0097* >0.9999
L. gasseri vs L. iners <0.0001* <0.0001
*
L. gasseri vs G. vaginalis <0.0001* <0.0001
*
L. gasseri vs P. bivia <0.0001* <0.0001
*
L. jensenii vs L. crispatus 0.0005* 0.23
L. jensenii vs L. iners <0.0001* <0.0001
*
L. jensenii vs G. vaginalis <0.0001* <0.0001
*
L. jensenii vs P. bivia <0.0001* <0.0001
*
L. crispatus vs L. iners >0.9999 <0.0001*
L. crispatus vs G. vaginalis 0.9929 <0.0001*
L. crispatus vs P. bivia 0.0007* <0.0001
*
L. iners vs G. vaginalis >0.9999 0.8439
L. iners vs P. bivia 0.1302 0.0117*
G. vaginalis vs P. bivia 0.3712 >0.9999
ANOVA p-value <0.0001* <0.0001
*
* The asterisk indicates a p-value lower than the standardized p-value of 0.05 with a 95%
confidence interval.
2.2.1 Prevotella bivia
We compared the quantified log copies/ng of P. bivia between the inflammation groups. The
high inflammation group and the low inflammation group had no significant difference
(p=0.8438) (Figure 2.2.1). The copies/ng within this inflammatory group should not be
compared against the other five bacteria due to unreliable primers.
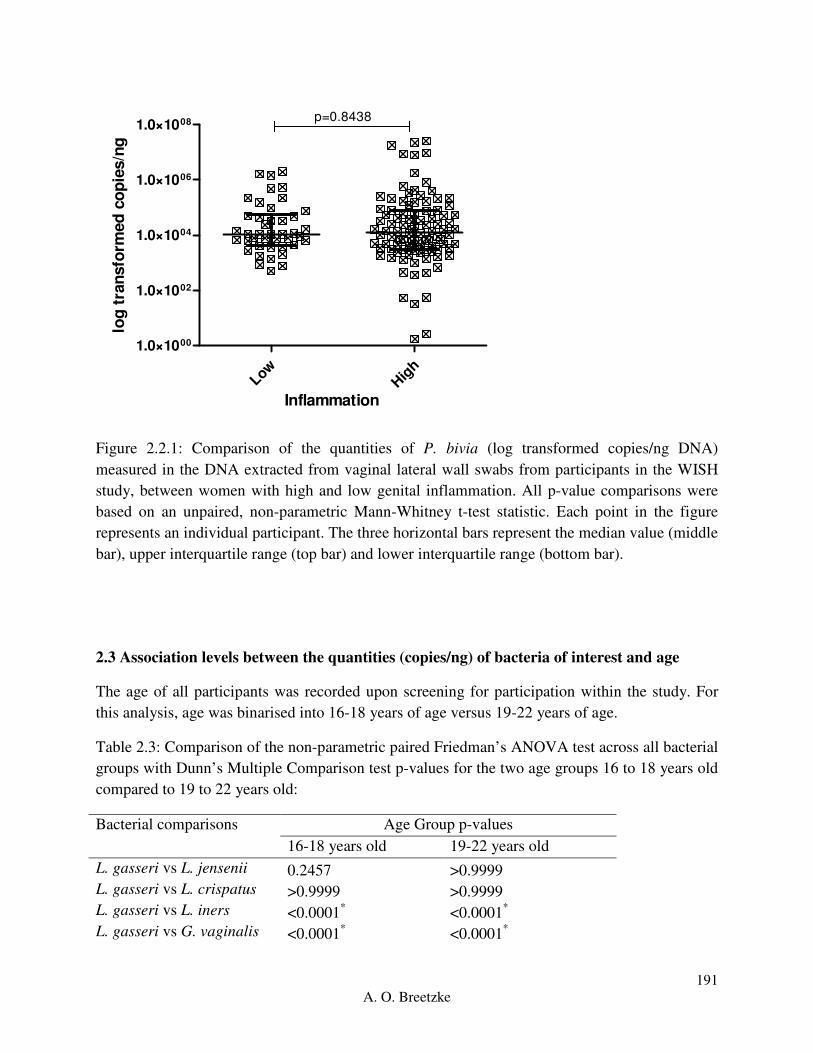
191
A. O. Breetzke
LowHig
h
1.0×1000
1.0×1002
1.0×1004
1.0×1006
1.0×1008 p=0.8438
Inflammation
log
tra
nsfo
rmed
co
pie
s/n
g
Figure 2.2.1: Comparison of the quantities of P. bivia (log transformed copies/ng DNA)
measured in the DNA extracted from vaginal lateral wall swabs from participants in the WISH
study, between women with high and low genital inflammation. All p-value comparisons were
based on an unpaired, non-parametric Mann-Whitney t-test statistic. Each point in the figure
represents an individual participant. The three horizontal bars represent the median value (middle
bar), upper interquartile range (top bar) and lower interquartile range (bottom bar).
2.3 Association levels between the quantities (copies/ng) of bacteria of interest and age
The age of all participants was recorded upon screening for participation within the study. For
this analysis, age was binarised into 16-18 years of age versus 19-22 years of age.
Table 2.3: Comparison of the non-parametric paired Friedman’s ANOVA test across all bacterial
groups with Dunn’s Multiple Comparison test p-values for the two age groups 16 to 18 years old
compared to 19 to 22 years old:
Bacterial comparisons Age Group p-values
16-18 years old 19-22 years old
L. gasseri vs L. jensenii 0.2457 >0.9999
L. gasseri vs L. crispatus >0.9999 >0.9999
L. gasseri vs L. iners <0.0001* <0.0001
*
L. gasseri vs G. vaginalis <0.0001* <0.0001
*

192
A. O. Breetzke
L. gasseri vs P. bivia <0.0001* <0.0001
*
L. jensenii vs L. crispatus 0.0419* 0.0582
L. jensenii vs L. iners <0.0001* <0.0001
*
L. jensenii vs G. vaginalis <0.0001* <0.0001
*
L. jensenii vs P. bivia <0.0001* <0.0001
*
L. crispatus vs L. iners <0.0001* <0.0001
*
L. crispatus vs G. vaginalis <0.0001* <0.0001
*
L. crispatus vs P. bivia <0.0001* <0.0001
*
L. iners vs G. vaginalis 0.8223 >0.9999
L. iners vs P. bivia 0.0117* 0.1348
G. vaginalis vs P. bivia >0.9999 0.7713
ANOVA p-value <0.0001* <0.0001
*
* The asterisk indicates a p-value lower than the standardized p-value of 0.05 with a 95%
confidence interval.
2.3.1 Prevotella bivia
We compared the quantified copies/ng of P. bivia between the age groups. The 16-18 years old
age group and the 19-22 years old age group had no difference in log copies/ng (p=0.2629)
(Figure 2.3.1). Although the P. bivia age data follows the same trend as the other bacteria, this
analysis should be repeated with new primers.
16-1
8
19-2
2
1.0×1000
1.0×1002
1.0×1004
1.0×1006
1.0×1008p=0.2629
Age Group (years)
log
tra
nsfo
rmed
co
pie
s/n
g
Figure 2.3.1: Comparison of the quantities of P. bivia (log transformed copies/ng DNA)
measured in the DNA extracted from vaginal lateral wall swabs from participants in the WISH

193
A. O. Breetzke
study, between the two 16-18 years old and 19-22 years old, age groups. All p-value
comparisons were based on an unpaired, non-parametric Mann-Whitney t-test statistic. Each
point in the figure represents an individual participant. The three horizontal bars represent the
median value (middle bar), upper interquartile range (top bar) and lower interquartile range
(bottom bar).
2.4 Association levels between the quantities (copies/ng) of vaginal bacteria and hormonal
contraceptives
The hormonal contraceptive that each participant was using was recorded at the first visit of the
WISH Cohort study process. The three hormonal contraceptives of particular interest within this
study include DMPA, the Implanon and Nur Isterate.
Table 2.4: Comparison of the non-parametric paired Friedman’s ANOVA test across all bacterial
groups with a Dunn’s Multiple Comparison test for the DMPA, Implanon and Nur Isterate
hormonal contraceptive groups:
Bacterial comparisons Hormonal Contraceptive p-values
DMPA Implanon Nur Isterate
L. gasseri vs L. jensenii 0.8817 >0.9999 >0.9999
L. gasseri vs L. crispatus >0.9999 >0.9999 0.1923
L. gasseri vs L. iners 0.0057* >0.9999 <0.0001
*
L. gasseri vs G. vaginalis 0.0057* 0.0375
* <0.0001
*
L. gasseri vs P. bivia <0.0001* 0.2103 <0.0001
*
L. jensenii vs L. crispatus 0.5144 >0.9999 0.0065*
L. jensenii vs L. iners <0.0001* 0.0375
* <0.0001
*
L. jensenii vs G. vaginalis <0.0001* <0.0001
* <0.0001
*
L. jensenii vs P. bivia <0.0001* 0.0003
* <0.0001
*
L. crispatus vs L. iners 0.0132* 0.8817 <0.0001
*
L. crispatus vs G. vaginalis 0.0132* 0.003
* <0.0001
*
L. crispatus vs P. bivia <0.0001* 0.0245
* <0.0001
*
L. iners vs G. vaginalis >0.9999 >0.9999 >0.9999
L. iners vs P. bivia >0.9999 >0.9999 0.0015*
G. vaginalis vs P. bivia >0.9999 >0.9999 0.3366
ANOVA p-value <0.0001* <0.0001
* <0.0001
*
* The asterisk indicates a p-value lower than the standardized p-value of 0.05 with a 95%
confidence interval.
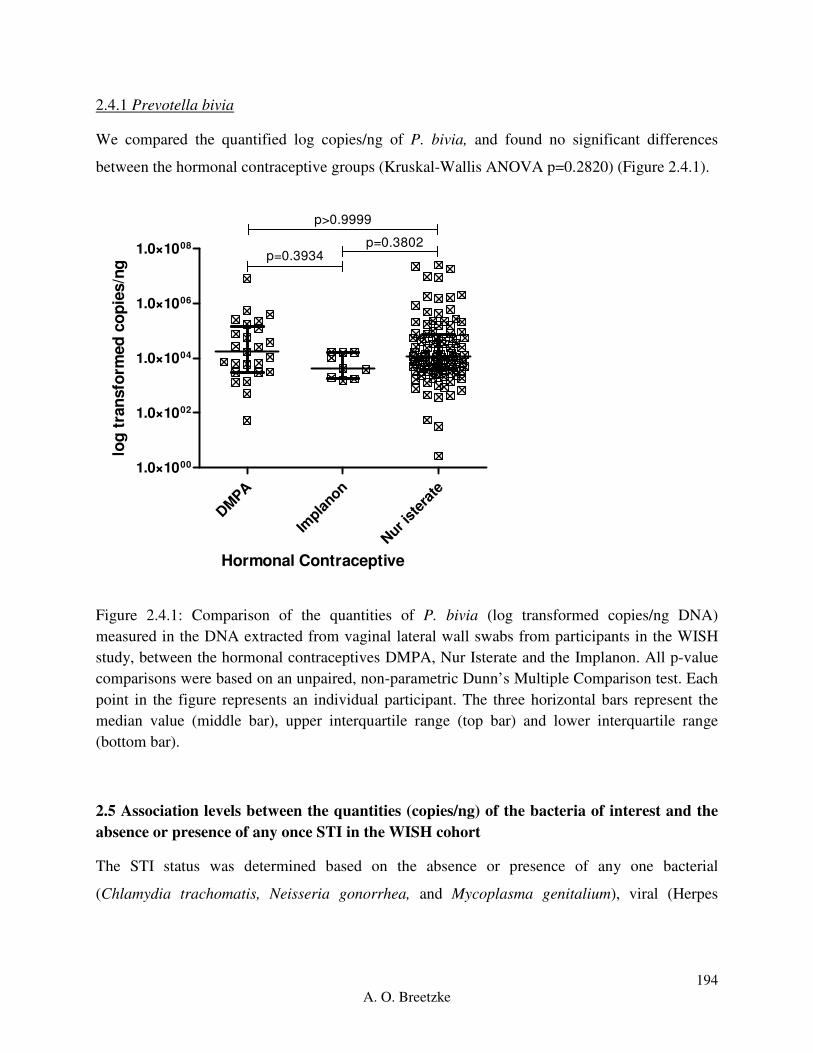
194
A. O. Breetzke
2.4.1 Prevotella bivia
We compared the quantified log copies/ng of P. bivia, and found no significant differences
between the hormonal contraceptive groups (Kruskal-Wallis ANOVA p=0.2820) (Figure 2.4.1).
DM
PA
Impla
non
Nur i
ster
ate
1.0×1000
1.0×1002
1.0×1004
1.0×1006
1.0×1008
p>0.9999
p=0.3934p=0.3802
Hormonal Contraceptive
log
tra
nsfo
rmed
co
pie
s/n
g
Figure 2.4.1: Comparison of the quantities of P. bivia (log transformed copies/ng DNA)
measured in the DNA extracted from vaginal lateral wall swabs from participants in the WISH
study, between the hormonal contraceptives DMPA, Nur Isterate and the Implanon. All p-value
comparisons were based on an unpaired, non-parametric Dunn’s Multiple Comparison test. Each
point in the figure represents an individual participant. The three horizontal bars represent the
median value (middle bar), upper interquartile range (top bar) and lower interquartile range
(bottom bar).
2.5 Association levels between the quantities (copies/ng) of the bacteria of interest and the
absence or presence of any once STI in the WISH cohort
The STI status was determined based on the absence or presence of any one bacterial
(Chlamydia trachomatis, Neisseria gonorrhea, and Mycoplasma genitalium), viral (Herpes

195
A. O. Breetzke
Simplex Virus 2, and Human Papilloma Virus) or parasitic (Trichomonas vaginalis) STI for each
participant.
Table 2.5: Comparison of the non-parametric, paired Friedman’s ANOVA test across all
bacterial groups with a Dunn’s Multiple Comparison test for the absence or presence of any one
STI of interest in the WISH study.
Bacterial comparisons STI Status Group p-values
Absent Any one Present
L. gasseri vs L. jensenii 0.918 0.436
L. gasseri vs L. crispatus >0.9999 >0.9999
L. gasseri vs L. iners <0.0001* <0.0001
*
L. gasseri vs G. vaginalis <0.0001* <0.0001
*
L. gasseri vs P. bivia <0.0001* <0.0001
*
L. jensenii vs L. crispatus 0.1534 0.0079*
L. jensenii vs L. iners <0.0001* <0.0001
*
L. jensenii vs G. vaginalis <0.0001* <0.0001
*
L. jensenii vs P. bivia <0.0001* <0.0001
*
L. crispatus vs L. iners <0.0001* 0.0002
*
L. crispatus vs G. vaginalis <0.0001* <0.0001
*
L. crispatus vs P. bivia <0.0001* <0.0001
*
L. iners vs G. vaginalis >0.9999 0.9398
L. iners vs P. bivia 0.1884 0.0079*
G. vaginalis vs P. bivia 0.918 >0.9999
ANOVA p-value <0.0001* <0.0001
*
* The asterisk indicates a p-value lower than the standardized p-value of 0.05 with a 95%
confidence interval.
2.5.1 Prevotella bivia
We compared the quantified log copies/ng of P. bivia and found no significant differences
between the participants with and without any one STI (p=0.1905) (Figure 2.5.1). Although this
follows the trend of the other bacterium within this cohort, due to the lack of accuracy of the
primers this data should not be taken as reliable.
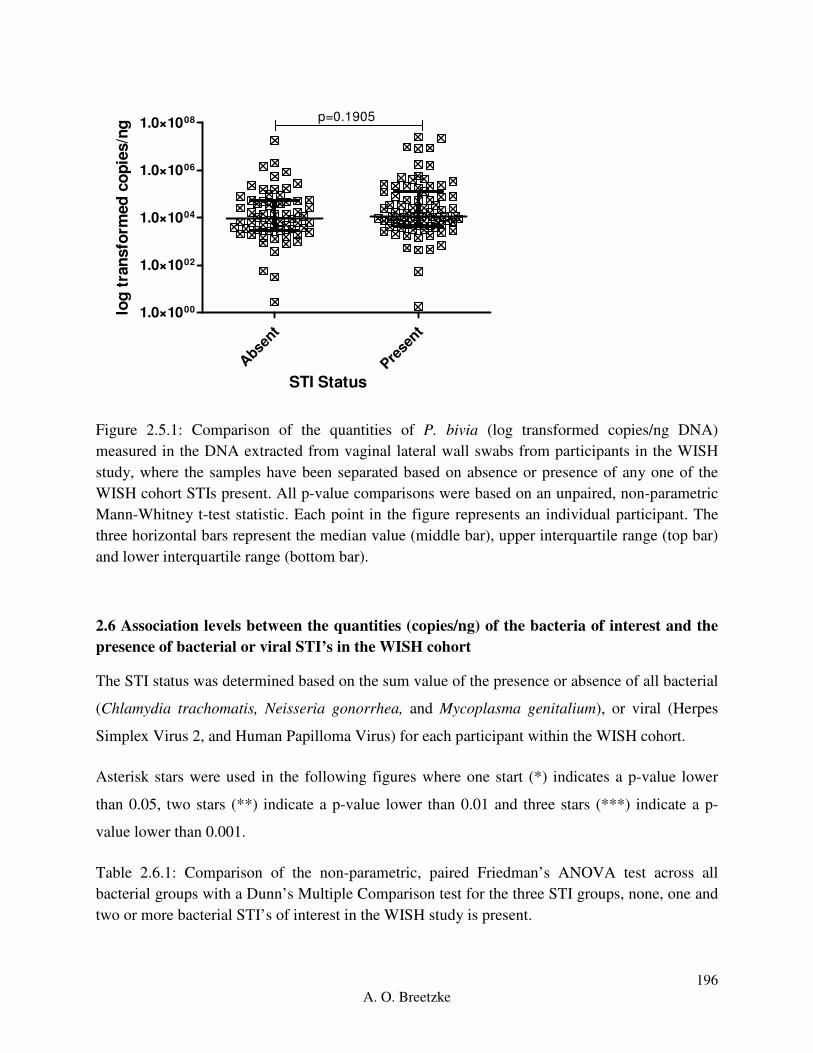
196
A. O. Breetzke
Abse
nt
Prese
nt
1.0×1000
1.0×1002
1.0×1004
1.0×1006
1.0×1008 p=0.1905
STI Status
log
tra
nsfo
rmed
co
pie
s/n
g
Figure 2.5.1: Comparison of the quantities of P. bivia (log transformed copies/ng DNA)
measured in the DNA extracted from vaginal lateral wall swabs from participants in the WISH
study, where the samples have been separated based on absence or presence of any one of the
WISH cohort STIs present. All p-value comparisons were based on an unpaired, non-parametric
Mann-Whitney t-test statistic. Each point in the figure represents an individual participant. The
three horizontal bars represent the median value (middle bar), upper interquartile range (top bar)
and lower interquartile range (bottom bar).
2.6 Association levels between the quantities (copies/ng) of the bacteria of interest and the
presence of bacterial or viral STI’s in the WISH cohort
The STI status was determined based on the sum value of the presence or absence of all bacterial
(Chlamydia trachomatis, Neisseria gonorrhea, and Mycoplasma genitalium), or viral (Herpes
Simplex Virus 2, and Human Papilloma Virus) for each participant within the WISH cohort.
Asterisk stars were used in the following figures where one start (*) indicates a p-value lower
than 0.05, two stars (**) indicate a p-value lower than 0.01 and three stars (***) indicate a p-
value lower than 0.001.
Table 2.6.1: Comparison of the non-parametric, paired Friedman’s ANOVA test across all
bacterial groups with a Dunn’s Multiple Comparison test for the three STI groups, none, one and
two or more bacterial STI’s of interest in the WISH study is present.

197
A. O. Breetzke
Bacterial comparisons Bacterial STI grouping p-values
None One Two<
L. gasseri vs L. jensenii 0.5221 >0.9999 0.6815
L. gasseri vs L. crispatus >0.9999 0.9595 >0.9999
L. gasseri vs L. iners <0.0001* <0.0001
* >0.9999
L. gasseri vs G. vaginalis <0.0001* <0.0001
* 0.0812
L. gasseri vs P. bivia <0.0001* <0.0001
* 0.0055
*
L. jensenii vs L. crispatus 0.2835 0.0294* >0.9999
L. jensenii vs L. iners <0.0001* <0.0001
* 0.0095
*
L. jensenii vs G. vaginalis <0.0001* <0.0001
* <0.0001
*
L. jensenii vs P. bivia <0.0001* <0.0001
* <0.0001
*
L. crispatus vs L. iners <0.0001* 0.0117
* >0.9999
L. crispatus vs G. vaginalis <0.0001* 0.0001
* 0.0437
*
L. crispatus vs P. bivia <0.0001* <0.0001
* 0.0026
*
L. iners vs G. vaginalis >0.9999 >0.9999 >0.9999
L. iners vs P. bivia 0.129 0.1043 0.4769
G. vaginalis vs P. bivia >0.9999 >0.9999 >0.9999
ANOVA p-value <0.0001* <0.0001
* <0.0001
*
* The asterisk indicates a p-value lower than the standardized p-value of 0.05 with a 95%
confidence interval.
The absence of any bacterial STI group (Figure 2.6.1A) had significantly different copies/ng of
G. vaginalis and L. iners in comparison to L. gasseri (p<0.0001), L. jensenii (p<0.0001) and L.
crispatus (p<0.0001). This trend was followed by the group with one bacterial STI present
(Figure 2.6.1B) except G. vaginalis and L. iners had a significance of p=0.0001 and p=0.0117 in
comparison to L. crispatus respectively, with L. crispatus having significantly different copies/ng
in comparison to L. jensenii (p=0.0294). In the presence of two or more bacterial STIs (Figure
2.6.1C), G. vaginalis and L. iners had significantly higher copies/ng in comparison to L. jensenii
(p<0.0001, p=0.0095) with G. vaginalis further having higher copies/ng in comparison to L.
crispatus (p=0.0437). The absence of, or presence of one bacterial STI, show similar trends in
bacterial copies/ng with the presence of two or more bacterial STIs having fewer differences
between the bacterial copies/ng.

198
A. O. Breetzke
L. g
asse
ri
L. jen
senii
L. c
risp
atus
L. ine
rs
G. v
aginalis
1.0×10-04
1.0×10-02
1.0×1000
1.0×1002
1.0×1004
1.0×1006
1.0×1008
***
******
******
***
Bacteria
log tra
nsfo
rmed c
opie
s/n
g
Figure 2.6.1A: Box-plot of the absence of any one bacterial STI for L. gasseri (red), L. jensenii
(orange), L. crispatus (green), L. iners (blue), G. vaginalis (purple) reported as log transformed
copies/ng total DNA. The ‘box’ component of each plot indicates the interquartile range (IQR)
of the data set and the ‘whiskers’ which are the two lines (bottom and top) extending from the
box component of each block that end with a horizontal stroke, indicate the range from the
smallest and largest non-outliers to the 25% and 75% percentile components, respectively. The
middle line indicates the median value for each data set.
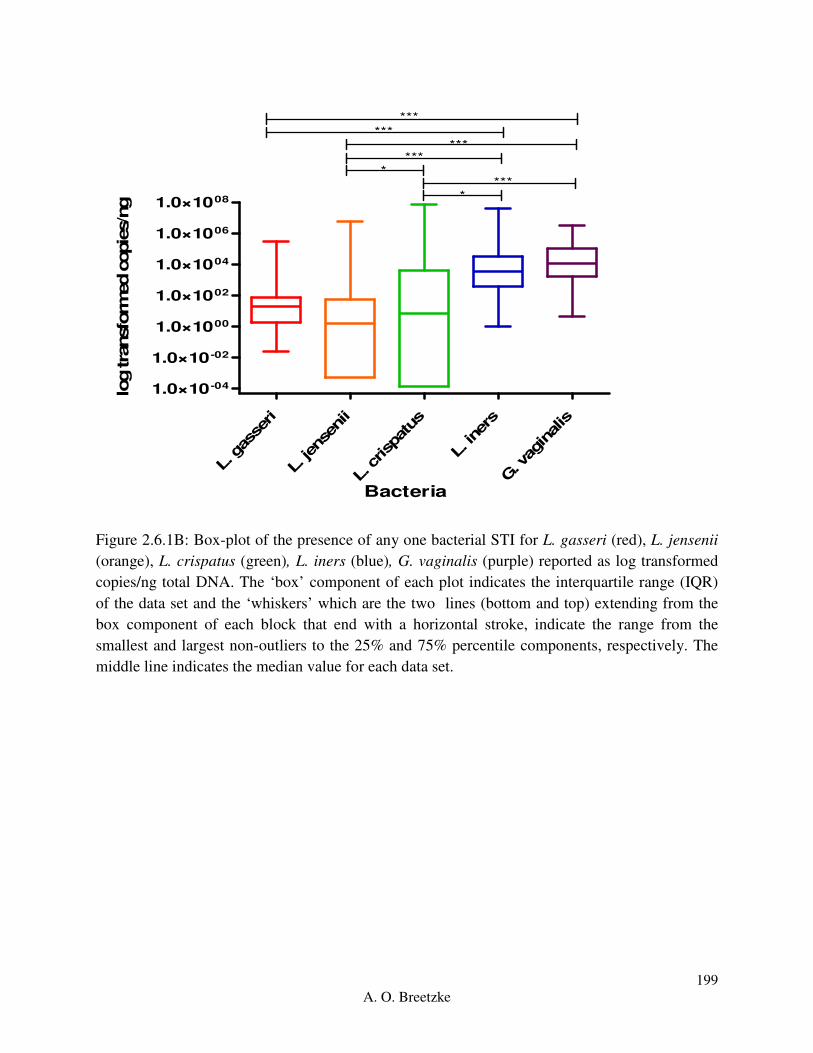
199
A. O. Breetzke
L. g
asse
ri
L. jen
senii
L. c
risp
atus
L. iner
s
G. v
aginalis
1.0×10-04
1.0×10-02
1.0×1000
1.0×1002
1.0×1004
1.0×1006
1.0×1008
***
******
****
***
*
Bacteria
log tra
nsfo
rmed c
opie
s/n
g
Figure 2.6.1B: Box-plot of the presence of any one bacterial STI for L. gasseri (red), L. jensenii
(orange), L. crispatus (green), L. iners (blue), G. vaginalis (purple) reported as log transformed
copies/ng total DNA. The ‘box’ component of each plot indicates the interquartile range (IQR)
of the data set and the ‘whiskers’ which are the two lines (bottom and top) extending from the
box component of each block that end with a horizontal stroke, indicate the range from the
smallest and largest non-outliers to the 25% and 75% percentile components, respectively. The
middle line indicates the median value for each data set.

200
A. O. Breetzke
L. g
asse
ri
L. jen
senii
L. c
risp
atus
L. ine
rs
G. v
aginalis
1.0×10-04
1.0×10-02
1.0×1000
1.0×1002
1.0×1004
1.0×1006
1.0×1008**
***
*
Bacteria
log tra
nsfo
rmed c
opie
s/n
g
Figure 2.6.1C: Box-plot of two or more bacterial STIs for L. gasseri (red), L. jensenii (orange),
L. crispatus (green), L. iners (blue), G. vaginalis (purple) reported as log transformed copies/ng
total DNA. The ‘box’ component of each plot indicates the interquartile range (IQR) of the data
set and the ‘whiskers’ which are the two lines (bottom and top) extending from the box
component of each block that end with a horizontal stroke, indicate the range from the smallest
and largest non-outliers to the 25% and 75% percentile components, respectively. The middle
line indicates the median value for each data set.
Table 2.6.2: Comparison of the non-parametric, paired Friedman’s ANOVA test across all viral
groups with a Dunn’s Multiple Comparison test for the three STI groups, none, one or two viral
STI’s of interest in the WISH.
Bacterial comparisons Viral STI grouping p-values
None One Two
L. gasseri vs L. jensenii 0.4463 0.4859 >0.9999
L. gasseri vs L. crispatus >0.9999 >0.9999 0.6729
L. gasseri vs L. iners <0.0001* <0.0001
* >0.9999
L. gasseri vs G. vaginalis <0.0001* <0.0001
* 0.1307
L. gasseri vs P. bivia <0.0001* <0.0001
* 0.2033
L. jensenii vs L. crispatus 0.0083* 0.3777 0.6729
L. jensenii vs L. iners <0.0001* <0.0001
* >0.9999
L. jensenii vs G. vaginalis <0.0001* <0.0001
* 0.1307
L. jensenii vs P. bivia <0.0001* <0.0001
* 0.2033

201
A. O. Breetzke
L. crispatus vs L. iners 0.0184* <0.0001
* >0.9999
L. crispatus vs G. vaginalis 0.0011* <0.0001
* >0.9999
L. crispatus vs P. bivia <0.0001* <0.0001
* >0.9999
L. iners vs G. vaginalis >0.9999 >0.9999 >0.9999
L. iners vs P. bivia 0.6725 0.0054* >0.9999
G. vaginalis vs P. bivia >0.9999 0.5104 >0.9999
ANOVA p-value < 0.0001* < 0.0001
* 0.0038
*
* The asterisk indicates a p-value lower than the standardized p-value of 0.05 with a 95%
confidence interval.
In the presence of one viral STI (Figure 2.6.2A), G. vaginalis and L. iners had significantly
different copies/ng in comparison to L. gasseri (p<0.0001), L. jensenii (p<0.0001) and L.
crispatus (p<0.0001). A similar pattern was followed in the absence of any viral STI (Figure
2.6.2B), except G. vaginalis and L. iners had a significance of p=0.0011 and p=0.0184 in
comparison to L. crispatus, respectively. Further, L. crispatus had significantly different
copies/ng in comparison to L. jensenii (p=0.0083). The presence of two viral STIs (Figure
2.6.2C) showed no association with the copies/ng of the bacterium which showed no difference.
L. g
asse
ri
L. jen
senii
L. c
risp
atus
L. iner
s
G. v
aginalis
1.0×10-04
1.0×10-02
1.0×1000
1.0×1002
1.0×1004
1.0×1006
1.0×1008
***
******
***
***
**
Bacteria
log tra
nsfo
rmed c
opie
s/n
g

202
A. O. Breetzke
Figure 2.6.2A: Box-plot of the absence of any one viral STI for L. gasseri (red), L. jensenii
(orange), L. crispatus (green), L. iners (blue), G. vaginalis (purple) reported as log transformed
copies/ng total DNA. The ‘box’ component of each plot indicates the interquartile range (IQR)
of the data set and the ‘whiskers’ which are the two lines (bottom and top) extending from the
box component of each block that end with a horizontal stroke, indicate the range from the
smallest and largest non-outliers to the 25% and 75% percentile components, respectively. The
middle line indicates the median value for each data set.
L. g
asse
ri
L. jen
senii
L. c
risp
atus
L. iner
s
G. v
aginalis
1.0×10-04
1.0×10-02
1.0×1000
1.0×1002
1.0×1004
1.0×1006
1.0×1008
***
******
******
***
Bacteria
log tra
nsfo
rmed c
opie
s/n
g
Figure 2.6.2B: Box-plot of the presence of any one viral STI for L. gasseri (red), L. jensenii
(orange), L. crispatus (green), L. iners (blue), G. vaginalis (purple) reported as log transformed
copies/ng total DNA. The ‘box’ component of each plot indicates the interquartile range (IQR)
of the data set and the ‘whiskers’ which are the two lines (bottom and top) extending from the
box component of each block that end with a horizontal stroke, indicate the range from the
smallest and largest non-outliers to the 25% and 75% percentile components, respectively. The
middle line indicates the median value for each data set.

203
A. O. Breetzke
L. g
asse
ri
L. jen
senii
L. c
risp
atus
L. iner
s
G. v
aginalis
1.0×10-04
1.0×10-02
1.0×1000
1.0×1002
1.0×1004
1.0×1006
1.0×1008
Bacteria
log tra
nsfo
rmed c
opie
s/n
g
Figure 2.6.2C: Box-plot of two viral STIs for L. gasseri (red), L. jensenii (orange), L. crispatus
(green), L. iners (blue), G. vaginalis (purple) reported as log transformed copies/ng total DNA.
The ‘box’ component of each plot indicates the interquartile range (IQR) of the data set and the
‘whiskers’ which are the two lines (bottom and top) extending from the box component of each
block that end with a horizontal stroke, indicate the range from the smallest and largest non-
outliers to the 25% and 75% percentile components, respectively. The middle line indicates the
median value for each data set.
2.6.3 Prevotella bivia
We compared the quantified log copies/ng of P. bivia between those with none, one or two (or
more) bacterial or viral STI groups s. The bacterial STI groups had no significant difference in P.
bivia (Kruskal-Wallis ANOVA p=0.5566). The copies/ng of P. bivia in the viral STI group with
no STI differed significantly from the presence of two viral STIs (p=0.0488). There was no
significant difference in P. bivia between the viral STI groups (Kruskal-Wallis ANOVA
p=0.0526) (Figure 2.6.3). This data should not be taken as reliable due to the primer errors
discussed previously.
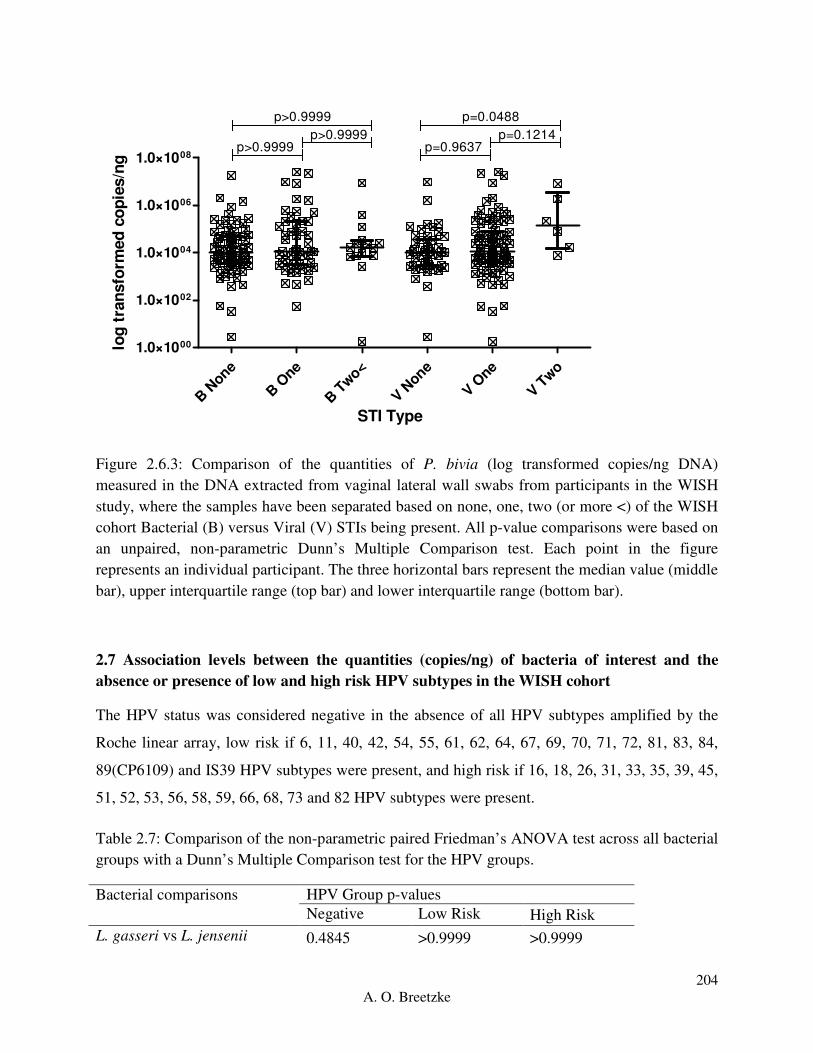
204
A. O. Breetzke
B N
one
B O
ne
B T
wo<
V None
V One
V Two
1.0×1000
1.0×1002
1.0×1004
1.0×1006
1.0×1008
p>0.9999
p>0.9999p>0.9999
p=0.0488
p=0.9637p=0.1214
STI Type
log
tra
nsfo
rmed
co
pie
s/n
g
Figure 2.6.3: Comparison of the quantities of P. bivia (log transformed copies/ng DNA)
measured in the DNA extracted from vaginal lateral wall swabs from participants in the WISH
study, where the samples have been separated based on none, one, two (or more <) of the WISH
cohort Bacterial (B) versus Viral (V) STIs being present. All p-value comparisons were based on
an unpaired, non-parametric Dunn’s Multiple Comparison test. Each point in the figure
represents an individual participant. The three horizontal bars represent the median value (middle
bar), upper interquartile range (top bar) and lower interquartile range (bottom bar).
2.7 Association levels between the quantities (copies/ng) of bacteria of interest and the
absence or presence of low and high risk HPV subtypes in the WISH cohort
The HPV status was considered negative in the absence of all HPV subtypes amplified by the
Roche linear array, low risk if 6, 11, 40, 42, 54, 55, 61, 62, 64, 67, 69, 70, 71, 72, 81, 83, 84,
89(CP6109) and IS39 HPV subtypes were present, and high risk if 16, 18, 26, 31, 33, 35, 39, 45,
51, 52, 53, 56, 58, 59, 66, 68, 73 and 82 HPV subtypes were present.
Table 2.7: Comparison of the non-parametric paired Friedman’s ANOVA test across all bacterial
groups with a Dunn’s Multiple Comparison test for the HPV groups.
Bacterial comparisons HPV Group p-values
Negative Low Risk High Risk
L. gasseri vs L. jensenii 0.4845 >0.9999 >0.9999
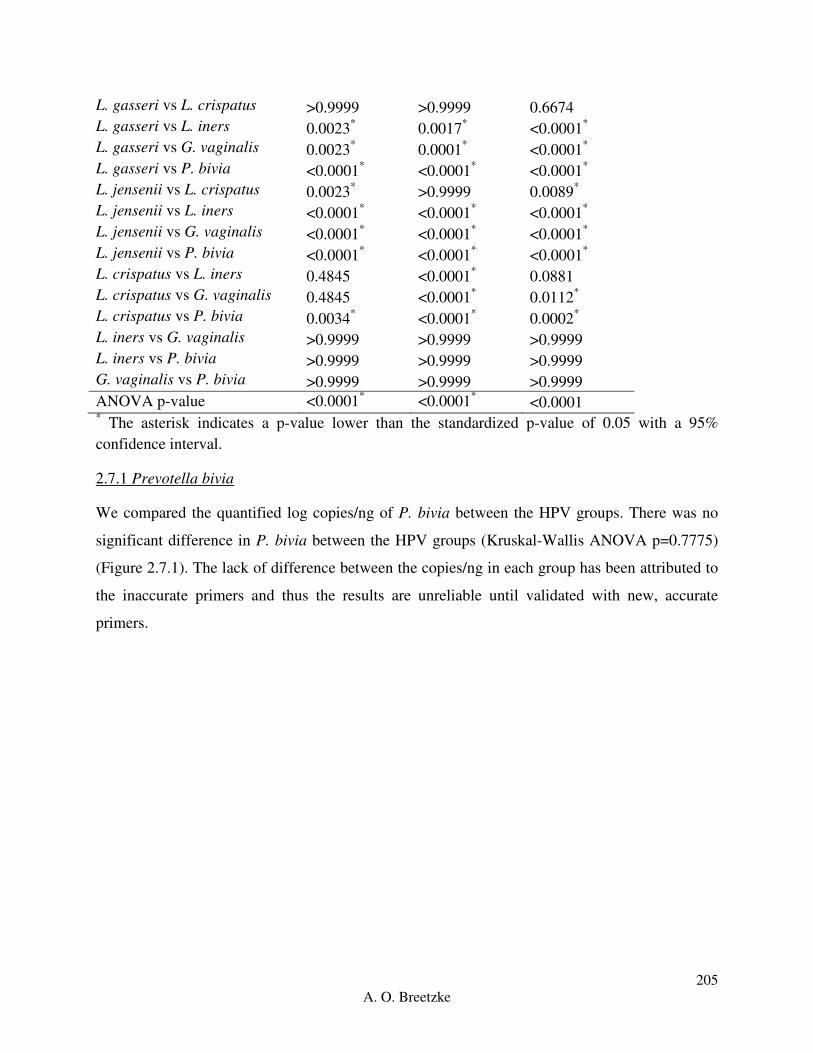
205
A. O. Breetzke
* The asterisk indicates a p-value lower than the standardized p-value of 0.05 with a 95%
confidence interval.
2.7.1 Prevotella bivia
We compared the quantified log copies/ng of P. bivia between the HPV groups. There was no
significant difference in P. bivia between the HPV groups (Kruskal-Wallis ANOVA p=0.7775)
(Figure 2.7.1). The lack of difference between the copies/ng in each group has been attributed to
the inaccurate primers and thus the results are unreliable until validated with new, accurate
primers.
L. gasseri vs L. crispatus >0.9999 >0.9999 0.6674
L. gasseri vs L. iners 0.0023* 0.0017
* <0.0001
*
L. gasseri vs G. vaginalis 0.0023* 0.0001
* <0.0001
*
L. gasseri vs P. bivia <0.0001* <0.0001
* <0.0001
*
L. jensenii vs L. crispatus 0.0023* >0.9999 0.0089
*
L. jensenii vs L. iners <0.0001* <0.0001
* <0.0001
*
L. jensenii vs G. vaginalis <0.0001* <0.0001
* <0.0001
*
L. jensenii vs P. bivia <0.0001* <0.0001
* <0.0001
*
L. crispatus vs L. iners 0.4845 <0.0001* 0.0881
L. crispatus vs G. vaginalis 0.4845 <0.0001* 0.0112
*
L. crispatus vs P. bivia 0.0034* <0.0001
* 0.0002
*
L. iners vs G. vaginalis >0.9999 >0.9999 >0.9999
L. iners vs P. bivia >0.9999 >0.9999 >0.9999
G. vaginalis vs P. bivia >0.9999 >0.9999 >0.9999
ANOVA p-value <0.0001* <0.0001
* <0.0001

206
A. O. Breetzke
Neg
ativ
e
Low R
isk
Hig
h Ris
k
1.0×1001
1.0×1003
1.0×1005
1.0×1007
p>0.9999
p>0.9999p>0.9999
HPV Status
log
tra
nsfo
rmed
co
pie
s/n
g
Figure 2.7.1: Comparison of the quantities of P. bivia (log transformed copies/ng DNA)
measured in the DNA extracted from vaginal lateral wall swabs from participants in the WISH
study, between the negative, low risk and high risk HPV groups. All p-value comparisons were
based on an unpaired, non-parametric Dunn’s Multiple Comparison test. Each point in the figure
represents an individual participant. The three horizontal bars represent the median value (middle
bar), upper interquartile range (top bar) and lower interquartile range (bottom bar).
Related Documents