450 – 1 Street SW Calgary, Alberta T2P 5H1 Tel: (403) 920-2603 Fax: (403) 920-2347 Email: [email protected] October 31, 2019 Canada Energy Regulator Filed Electronically Suite 210, 517 Tenth Avenue SW Calgary, Alberta T2R 0A8 Attention: Ms. L. George, Secretary of the Commission Dear Ms. George: Re: Foothills Pipe Lines Ltd. (Foothills) Statement of Rates and Charges effective January 1, 2020 Foothills encloses for filing pursuant to section 229(1)(a) of the Canadian Energy Regulator Act rates and charges for transportation service on Foothills Zones 6, 7, 8 and 9 to be effective January 1, 2020 (Effective 2020 Rates). The following attachments are included with this letter: • Attachment 1 consists of supporting Schedules A through G • Attachments 2 and 3 are black-lined and clean copies, respectively, of the Table of Effective Rates for 2020 The rates and charges are based on the methodology approved in Decision TG-8-2004, as amended by Order TG-03-2007. The filing also includes the Foothills’ Abandonment Surcharges effective January 1, 2020, which are included in the Table of Effective Rates for 2020. The supporting information on the Abandonment Surcharge calculations are provided in the attached Schedule G. Foothills met with shippers and interested parties on October 24, 2019 and presented the preliminary 2020 revenue requirement, preliminary Effective 2020 Rates and preliminary Abandonment Surcharges. Based on this consultation, Foothills is not aware of any objections to its proposal for establishing the Effective 2020 Rates. Foothills understands that any party that is opposed to the rates and charges will advise the Commission accordingly. Foothills will notify its shippers and interested parties of this filing and post a copy of it on TC Energy’s Foothills System website at: http://www.tccustomerexpress.com/934.html

Welcome message from author
This document is posted to help you gain knowledge. Please leave a comment to let me know what you think about it! Share it to your friends and learn new things together.
Transcript

450 – 1 Street SW Calgary, Alberta T2P 5H1
Tel: (403) 920-2603 Fax: (403) 920-2347 Email: [email protected]
October 31, 2019
Canada Energy Regulator Filed Electronically Suite 210, 517 Tenth Avenue SW Calgary, Alberta T2R 0A8
Attention: Ms. L. George, Secretary of the Commission
Dear Ms. George:
Re: Foothills Pipe Lines Ltd. (Foothills) Statement of Rates and Charges effective January 1, 2020
Foothills encloses for filing pursuant to section 229(1)(a) of the Canadian Energy Regulator Act
rates and charges for transportation service on Foothills Zones 6, 7, 8 and 9 to be effective January 1, 2020 (Effective 2020 Rates).
The following attachments are included with this letter:
• Attachment 1 consists of supporting Schedules A through G
• Attachments 2 and 3 are black-lined and clean copies, respectively, of the Table of Effective Rates for 2020
The rates and charges are based on the methodology approved in Decision TG-8-2004, as amended by Order TG-03-2007.
The filing also includes the Foothills’ Abandonment Surcharges effective January 1, 2020, which are included in the Table of Effective Rates for 2020. The supporting information on the Abandonment Surcharge calculations are provided in the attached Schedule G.
Foothills met with shippers and interested parties on October 24, 2019 and presented the preliminary 2020 revenue requirement, preliminary Effective 2020 Rates and preliminary Abandonment Surcharges. Based on this consultation, Foothills is not aware of any objections to its proposal for establishing the Effective 2020 Rates.
Foothills understands that any party that is opposed to the rates and charges will advise the Commission accordingly.
Foothills will notify its shippers and interested parties of this filing and post a copy of it on TC Energy’s Foothills System website at:
http://www.tccustomerexpress.com/934.html

October 31, 2019 Ms. S. Young Page 2 of 2 Communication regarding this filing should be directed to:
Laura Albrecht Project Manager, Tolls and Tariffs Canadian Natural Gas Pipelines Foothills Pipe Lines Ltd. 450 – 1 Street SW Calgary, Alberta T2P 5H1 Telephone: (403) 920-5784 Facsimile: (403) 920-2347 Email: [email protected]
Namrita Sohi Legal Counsel Canadian Law, Natural Gas Pipelines Foothills Pipe Lines Ltd. 450 – 1 Street SW Calgary, Alberta T2P 5H1 Telephone: (403) 920-7835 Facsimile: (403) 920-2347 Email: [email protected]
Yours truly, Foothills Pipe Lines Ltd.
Original signed by
Bernard Pelletier Director, Regulatory Tolls and Tariffs Canadian Natural Gas Pipelines Attachments
cc: Foothills Firm Shippers Interruptible Shippers and Interested Parties

Attachment 1
Foothills Pipe Lines Ltd. Supporting Schedules A through G
Effective 2020 Rates
Foothills Pipe Lines Ltd., 2020 Effective Rates
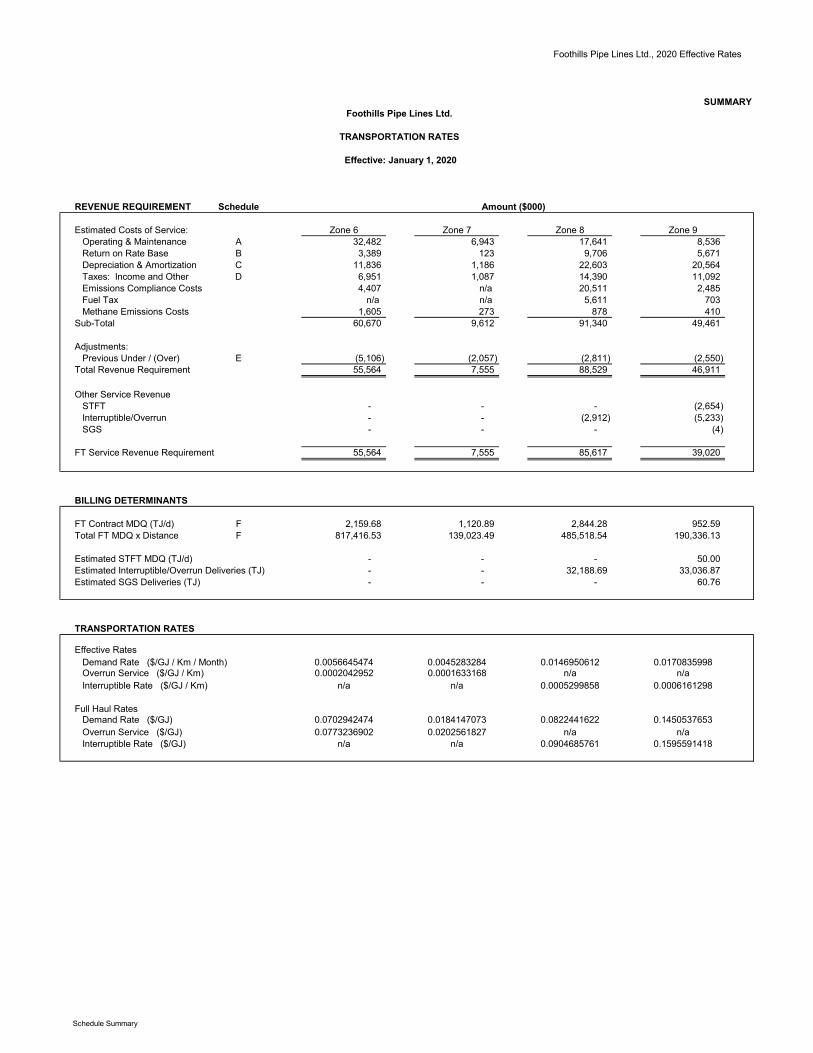
SUMMARY
REVENUE REQUIREMENT Schedule
Estimated Costs of Service: Zone 6 Zone 7 Zone 8 Zone 9Operating & Maintenance A 32,482 6,943 17,641 8,536 Return on Rate Base B 3,389 123 9,706 5,671 Depreciation & Amortization C 11,836 1,186 22,603 20,564 Taxes: Income and Other D 6,951 1,087 14,390 11,092 Emissions Compliance Costs 4,407 n/a 20,511 2,485 Fuel Tax n/a n/a 5,611 703 Methane Emissions Costs 1,605 273 878 410
Sub-Total 60,670 9,612 91,340 49,461
Adjustments:Previous Under / (Over) E (5,106) (2,057) (2,811) (2,550)
Total Revenue Requirement 55,564 7,555 88,529 46,911
Other Service RevenueSTFT - - - (2,654) Interruptible/Overrun - - (2,912) (5,233) SGS - - - (4)
FT Service Revenue Requirement 55,564 7,555 85,617 39,020
BILLING DETERMINANTS
FT Contract MDQ (TJ/d) F 2,159.68 1,120.89 2,844.28 952.59 Total FT MDQ x Distance F 817,416.53 139,023.49 485,518.54 190,336.13
Estimated STFT MDQ (TJ/d) - - - 50.00 Estimated Interruptible/Overrun Deliveries (TJ) - - 32,188.69 33,036.87 Estimated SGS Deliveries (TJ) - - - 60.76
100% 100% 100% 100%
TRANSPORTATION RATES
Effective RatesDemand Rate ($/GJ / Km / Month) 0.0056645474 0.0045283284 0.0146950612 0.0170835998Overrun Service ($/GJ / Km) 0.0002042952 0.0001633168 n/a n/aInterruptible Rate ($/GJ / Km) n/a n/a 0.0005299858 0.0006161298
Full Haul RatesDemand Rate ($/GJ) 0.0702942474 0.0184147073 0.0822441622 0.1450537653Overrun Service ($/GJ) 0.0773236902 0.0202561827 n/a n/aInterruptible Rate ($/GJ) n/a n/a 0.0904685761 0.1595591418
Note(s):1. Forecasted Shippers' Savings with respect to Foothills' General & Administrative Expenses Settlement Agreement dated January 13, 2003
as approved in Board Order TG-2-2003, as amended November 3, 2006 and approved in Board Order TG-03-2007.
Amount ($000)
Foothills Pipe Lines Ltd.
TRANSPORTATION RATES
Effective: January 1, 2020
Schedule Summary

Foothills Pipe Lines Ltd., 2020 Effective Rates
SCHEDULE A
Total Zone 6 Zone 7 Zone 8 Zone 9
Operations, Maintenance and Administrative Costs 32,478 16,464 2,800 9,007 4,207
Electrical powerJenner, Acme and Crawling Valley 3,871 3,871 - - - De/re Facilities at Empress 6,960 6,960 - - - BC 923 - - 923 - Saskatchewan 787 - - - 787
12,541 10,831 - 923 787
Compressor Repair 3,240 505 - 1,300 1,435
Pipeline Integrity Program 13,059 2,547 3,817 5,292 1,403
Government Agency Costs Recovery 4,283 2,135 326 1,119 704
Total 65,602 32,482 6,943 17,641 8,536
OPERATING AND MAINTENANCE EXPENSESFOR THE YEAR ENDING DECEMBER 31, 2020
($000)
Schedule A

Foothills Pipe Lines Ltd., 2020 Effective Rates
SCHEDULE BPage 1 of 2
ZONE 6
COST COSTAMOUNT RATIO RATE COMPONENT
($000) % % %
Debt - Funded 35,560 54.88 2.50 1.37 - Unfunded/(Prefunded) 3,314 5.12 2.75 0.14
38,874 60.00 1.51 Common Equity 25,916 40.00 10.10 4.04
Total Capitalization 64,790 100.00 5.55
Rate Base 61,064 GPUC 3,726
Total Capitalization 64,790
Return on Rate Base 3,389 = 61,064 X 5.55%
ZONE 7
COST COSTAMOUNT RATIO RATE COMPONENT
($000) % % %
Debt - Funded 910 40.50 2.50 1.01 - Unfunded/(Prefunded) 438 19.50 2.75 0.54
1,348 60.00 1.55 Common Equity 898 40.00 10.10 4.04
Total Capitalization 2,246 100.00 5.59
Rate Base 2,204 GPUC 42
Total Capitalization 2,246
Return on Rate Base 123 = 2,204 X 5.59%
RETURN ON RATE BASEDEEMED AVERAGE CAPITALIZATION AND
FOR THE YEAR ENDING DECEMBER 31, 2020
Schedule B
Foothills Pipe Lines Ltd., 2020 Effective Rates
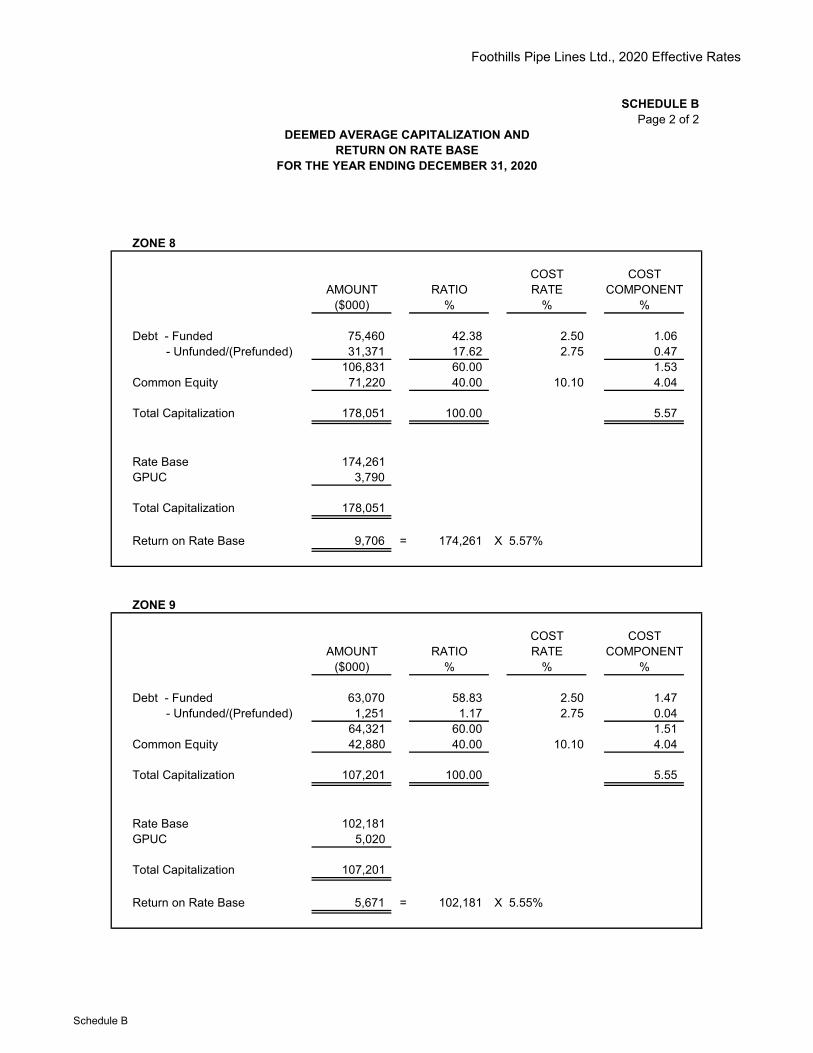
SCHEDULE BPage 2 of 2
ZONE 8
COST COSTAMOUNT RATIO RATE COMPONENT
($000) % % %
Debt - Funded 75,460 42.38 2.50 1.06 - Unfunded/(Prefunded) 31,371 17.62 2.75 0.47
106,831 60.00 1.53 Common Equity 71,220 40.00 10.10 4.04
Total Capitalization 178,051 100.00 5.57
Rate Base 174,261 GPUC 3,790
Total Capitalization 178,051
Return on Rate Base 9,706 = 174,261 X 5.57%
ZONE 9
COST COSTAMOUNT RATIO RATE COMPONENT
($000) % % %
Debt - Funded 63,070 58.83 2.50 1.47 - Unfunded/(Prefunded) 1,251 1.17 2.75 0.04
64,321 60.00 1.51 Common Equity 42,880 40.00 10.10 4.04
Total Capitalization 107,201 100.00 5.55
Rate Base 102,181 GPUC 5,020
Total Capitalization 107,201
Return on Rate Base 5,671 = 102,181 X 5.55%
DEEMED AVERAGE CAPITALIZATION ANDRETURN ON RATE BASE
FOR THE YEAR ENDING DECEMBER 31, 2020
Schedule B

Foothills Pipe Lines Ltd., 2020 Effective Rates
SCHEDULE B-1Page 1 of 2
ZONE 6
MaterialsNet Plant Supplies & Working Rate Base
Month Month End Prepaid Capital Linepack End Month
January Opening Balance 53,765 993 6,003 2,577 63,338 January 53,787 992 4,385 2,577 61,741 February 54,343 992 4,489 2,577 62,401 March 53,909 992 4,563 2,577 62,041 April 53,144 991 4,045 2,577 60,757 May 52,545 991 4,451 2,577 60,564 June 53,195 990 5,740 2,577 62,502 July 52,839 990 4,361 2,577 60,767 August 51,595 989 4,736 2,577 59,897 September 50,572 989 4,538 2,577 58,676 October 49,974 989 4,730 2,577 58,270 November 52,233 988 5,730 2,577 61,528 December 51,823 988 5,962 2,577 61,350
Average Rate Base - 13 Month 61,064
ZONE 7
MaterialsNet Plant Supplies & Working Rate Base
Month Month End Prepaid Capital Linepack End Month
January Opening Balance 229 - 600 1,039 1,868 January 177 - 410 1,039 1,626 February 176 - 1,178 1,039 2,393 March 175 - 494 1,039 1,708 April 174 - 512 1,039 1,725 May 173 - 503 1,039 1,715 June 473 - 1,727 1,039 3,239 July 458 - 2,359 1,039 3,856 August 394 - 875 1,039 2,308 September 357 - 779 1,039 2,175 October 301 - 1,250 1,039 2,590 November 320 - 18 1,039 1,377 December 309 - 718 1,039 2,066
Average Rate Base - 13 Month 2,204
RATE BASE - 2020
($000)
Schedule B-1
Foothills Pipe Lines Ltd., 2020 Effective Rates
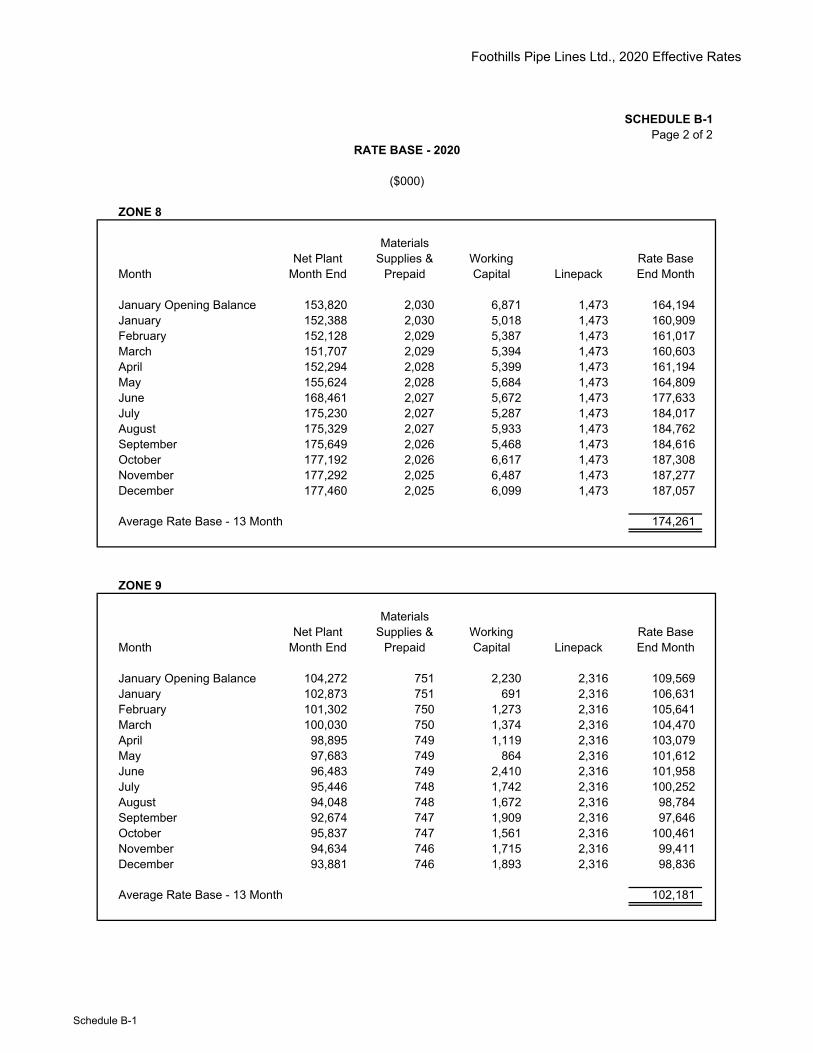
SCHEDULE B-1Page 2 of 2
ZONE 8
MaterialsNet Plant Supplies & Working Rate Base
Month Month End Prepaid Capital Linepack End Month
January Opening Balance 153,820 2,030 6,871 1,473 164,194 January 152,388 2,030 5,018 1,473 160,909 February 152,128 2,029 5,387 1,473 161,017 March 151,707 2,029 5,394 1,473 160,603 April 152,294 2,028 5,399 1,473 161,194 May 155,624 2,028 5,684 1,473 164,809 June 168,461 2,027 5,672 1,473 177,633 July 175,230 2,027 5,287 1,473 184,017 August 175,329 2,027 5,933 1,473 184,762 September 175,649 2,026 5,468 1,473 184,616 October 177,192 2,026 6,617 1,473 187,308 November 177,292 2,025 6,487 1,473 187,277 December 177,460 2,025 6,099 1,473 187,057
Average Rate Base - 13 Month 174,261
ZONE 9
MaterialsNet Plant Supplies & Working Rate Base
Month Month End Prepaid Capital Linepack End Month
January Opening Balance 104,272 751 2,230 2,316 109,569 January 102,873 751 691 2,316 106,631 February 101,302 750 1,273 2,316 105,641 March 100,030 750 1,374 2,316 104,470 April 98,895 749 1,119 2,316 103,079 May 97,683 749 864 2,316 101,612 June 96,483 749 2,410 2,316 101,958 July 95,446 748 1,742 2,316 100,252 August 94,048 748 1,672 2,316 98,784 September 92,674 747 1,909 2,316 97,646 October 95,837 747 1,561 2,316 100,461 November 94,634 746 1,715 2,316 99,411 December 93,881 746 1,893 2,316 98,836
Average Rate Base - 13 Month 102,181
RATE BASE - 2020
($000)
Schedule B-1

Foothills Pipe Lines Ltd., 2020 Effective Rates
SCHEDULE CPage 1 of 2
ZONE 6
Depreciation &Month Depreciation Amortization Amortization
January 1,019 - 1,019 February 722 - 722 March 728 - 728 April 893 - 893 May 730 - 730 June 729 - 729 July 1,501 - 1,501 August 1,504 - 1,504 September 1,405 - 1,405 October 938 - 938 November 822 - 822 December 845 - 845
TOTAL 11,836 - 11,836
ZONE 7
Depreciation &Month Depreciation Amortization Amortization
January 57 - 57 February 7 - 7 March 7 - 7 April 7 - 7 May 7 - 7 June 7 - 7 July 196 - 196 August 196 - 196 September 197 - 197 October 198 - 198 November 143 - 143 December 165 - 165
TOTAL 1,186 - 1,186
($000)
DEPRECIATION AND AMORTIZATION
FOR THE PERIOD ENDING DECEMBER 31, 2020
Schedule C
Foothills Pipe Lines Ltd., 2020 Effective Rates
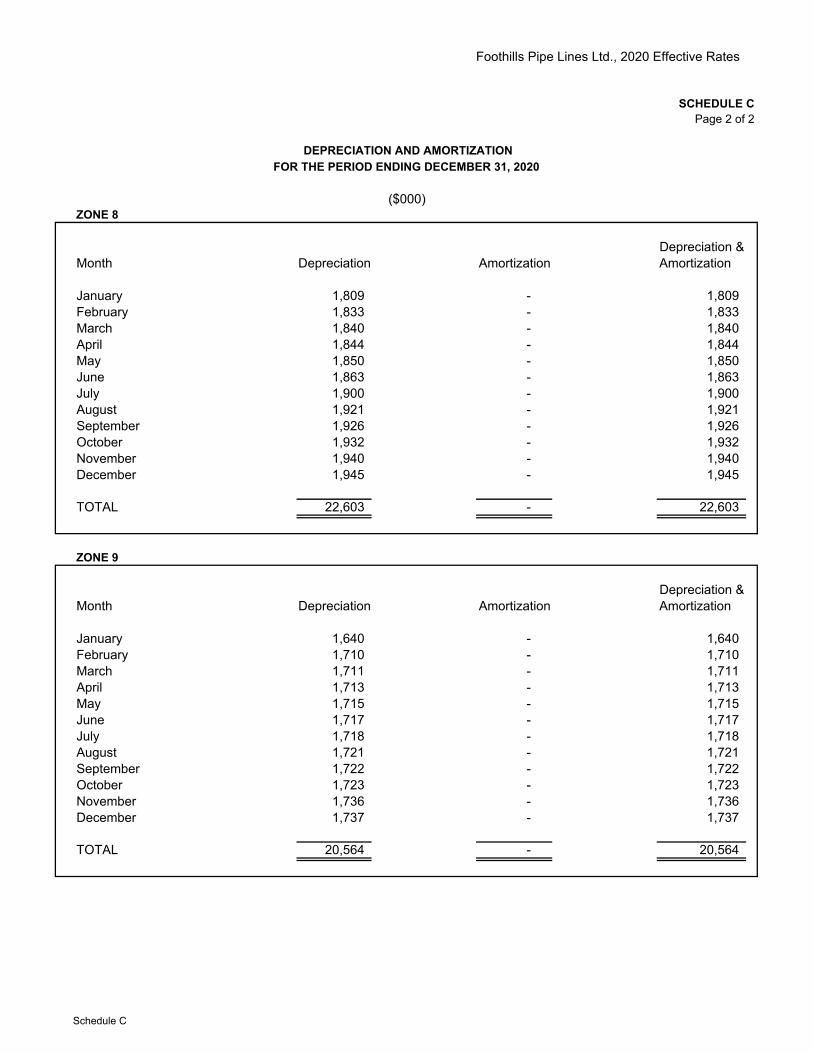
SCHEDULE CPage 2 of 2
ZONE 8
Depreciation &Month Depreciation Amortization Amortization
January 1,809 - 1,809 February 1,833 - 1,833 March 1,840 - 1,840 April 1,844 - 1,844 May 1,850 - 1,850 June 1,863 - 1,863 July 1,900 - 1,900 August 1,921 - 1,921 September 1,926 - 1,926 October 1,932 - 1,932 November 1,940 - 1,940 December 1,945 - 1,945
TOTAL 22,603 - 22,603
ZONE 9
Depreciation &Month Depreciation Amortization Amortization
January 1,640 - 1,640 February 1,710 - 1,710 March 1,711 - 1,711 April 1,713 - 1,713 May 1,715 - 1,715 June 1,717 - 1,717 July 1,718 - 1,718 August 1,721 - 1,721 September 1,722 - 1,722 October 1,723 - 1,723 November 1,736 - 1,736 December 1,737 - 1,737
TOTAL 20,564 - 20,564
DEPRECIATION AND AMORTIZATION
($000)
FOR THE PERIOD ENDING DECEMBER 31, 2020
Schedule C
Foothills Pipe Lines Ltd., 2020 Effective Rates
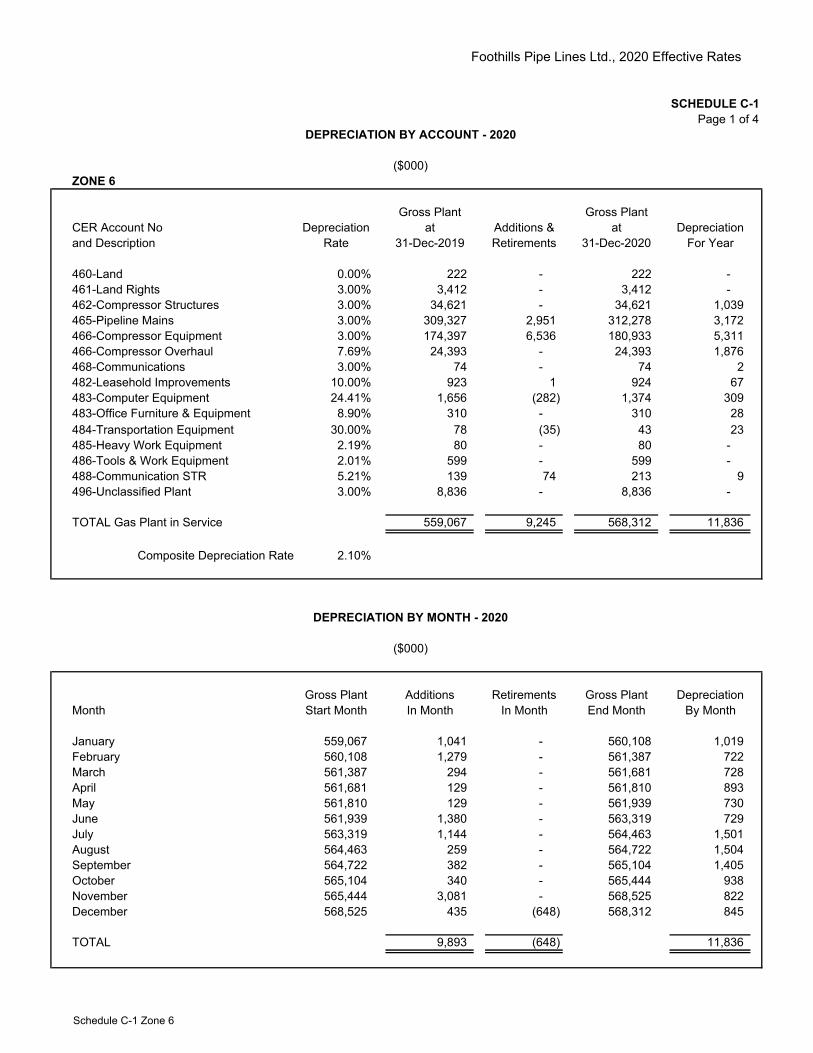
SCHEDULE C-1Page 1 of 4
ZONE 6
Gross Plant Gross PlantCER Account No Depreciation at Additions & at Depreciationand Description Rate 31-Dec-2019 Retirements 31-Dec-2020 For Year
460-Land 0.00% 222 - 222 - 461-Land Rights 3.00% 3,412 - 3,412 - 462-Compressor Structures 3.00% 34,621 - 34,621 1,039 465-Pipeline Mains 3.00% 309,327 2,951 312,278 3,172 466-Compressor Equipment 3.00% 174,397 6,536 180,933 5,311 466-Compressor Overhaul 7.69% 24,393 - 24,393 1,876 468-Communications 3.00% 74 - 74 2 482-Leasehold Improvements 10.00% 923 1 924 67 483-Computer Equipment 24.41% 1,656 (282) 1,374 309 483-Office Furniture & Equipment 8.90% 310 - 310 28 484-Transportation Equipment 30.00% 78 (35) 43 23 485-Heavy Work Equipment 2.19% 80 - 80 - 486-Tools & Work Equipment 2.01% 599 - 599 - 488-Communication STR 5.21% 139 74 213 9 496-Unclassified Plant 3.00% 8,836 - 8,836 -
TOTAL Gas Plant in Service 559,067 9,245 568,312 11,836
Composite Depreciation Rate 2.10%
Gross Plant Additions Retirements Gross Plant DepreciationMonth Start Month In Month In Month End Month By Month
January 559,067 1,041 - 560,108 1,019 February 560,108 1,279 - 561,387 722 March 561,387 294 - 561,681 728 April 561,681 129 - 561,810 893 May 561,810 129 - 561,939 730 June 561,939 1,380 - 563,319 729 July 563,319 1,144 - 564,463 1,501 August 564,463 259 - 564,722 1,504 September 564,722 382 - 565,104 1,405 October 565,104 340 - 565,444 938 November 565,444 3,081 - 568,525 822 December 568,525 435 (648) 568,312 845
TOTAL 9,893 (648) 11,836
DEPRECIATION BY ACCOUNT - 2020
($000)
DEPRECIATION BY MONTH - 2020
($000)
Schedule C-1 Zone 6

Foothills Pipe Lines Ltd., 2020 Effective Rates
SCHEDULE C-1Page 2 of 4
ZONE 7
Gross Plant Gross PlantCER Account No Depreciation at Additions & at Depreciationand Description Rate 31-Dec-2019 Retirements 31-Dec-2020 For Year
461-Land Rights 3.00% 1,081 - 1,081 - 465-Pipeline Mains 3.00% 75,060 1,195 76,255 1,098 482-Leasehold Improvements 10.00% 133 - 133 5 483-Computer Equipment 24.41% 313 (58) 255 77 483-Office Furniture & Equipment 8.90% 47 1 48 4 486-Tools & Work Equipment 2.01% 27 - 27 - 488-Communication STR 5.21% 25 12 37 2 496-Unclassified Plant 3.00% 23,072 - 23,072 -
TOTAL Gas Plant in Service 99,758 1,150 100,908 1,186
Composite Depreciation Rate 1.18%
Gross Plant Additions Retirements Gross Plant DepreciationMonth Start Month In Month In Month End Month By Month
January 99,758 5 - 99,763 57 February 99,763 6 - 99,769 7 March 99,769 6 - 99,775 7 April 99,775 6 - 99,781 7 May 99,781 5 - 99,786 7 June 99,786 308 - 100,094 7 July 100,094 181 - 100,275 196 August 100,275 132 - 100,407 196 September 100,407 160 - 100,567 197 October 100,567 141 - 100,708 198 November 100,708 162 - 100,870 143 December 100,870 154 (116) 100,908 164
TOTAL 1,266 (116) 1,186
DEPRECIATION BY ACCOUNT - 2020
($000)
DEPRECIATION BY MONTH - 2020
($000)
Schedule C-1 Zone 7
Foothills Pipe Lines Ltd., 2020 Effective Rates
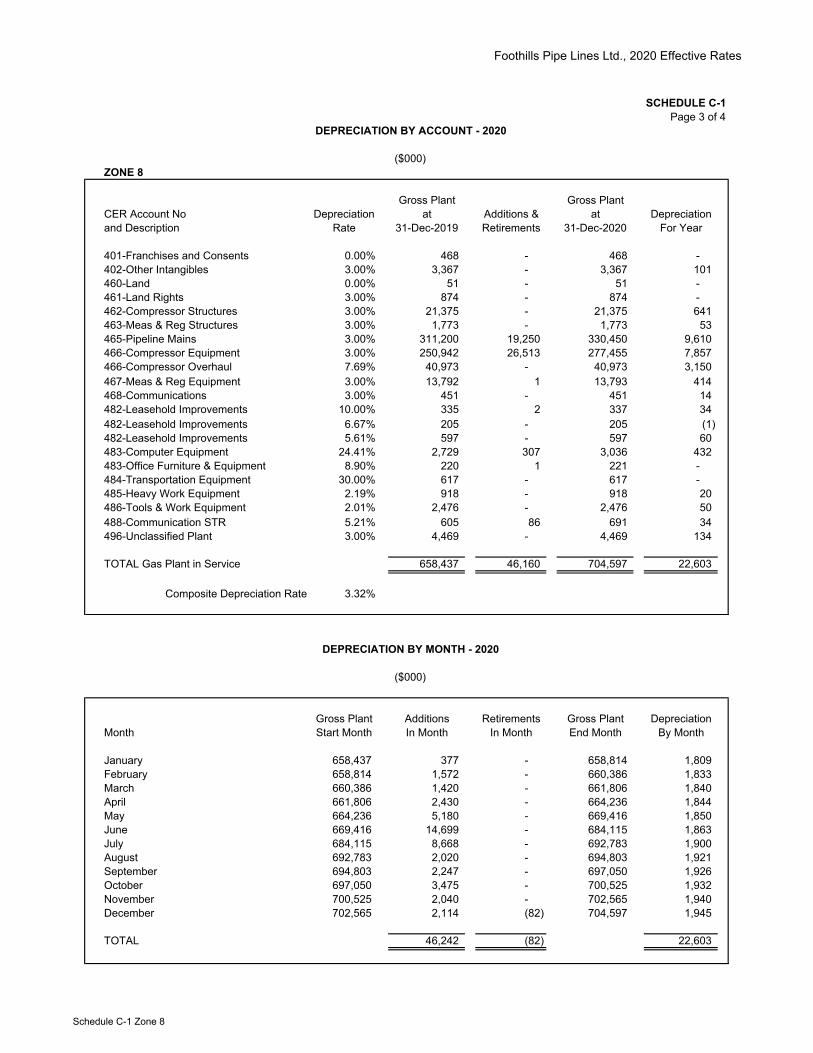
SCHEDULE C-1Page 3 of 4
ZONE 8
Gross Plant Gross PlantCER Account No Depreciation at Additions & at Depreciationand Description Rate 31-Dec-2019 Retirements 31-Dec-2020 For Year
401-Franchises and Consents 0.00% 468 - 468 - 402-Other Intangibles 3.00% 3,367 - 3,367 101 460-Land 0.00% 51 - 51 - 461-Land Rights 3.00% 874 - 874 - 462-Compressor Structures 3.00% 21,375 - 21,375 641 463-Meas & Reg Structures 3.00% 1,773 - 1,773 53 465-Pipeline Mains 3.00% 311,200 19,250 330,450 9,610 466-Compressor Equipment 3.00% 250,942 26,513 277,455 7,857 466-Compressor Overhaul 7.69% 40,973 - 40,973 3,150 467-Meas & Reg Equipment 3.00% 13,792 1 13,793 414 468-Communications 3.00% 451 - 451 14 482-Leasehold Improvements 10.00% 335 2 337 34 482-Leasehold Improvements 6.67% 205 - 205 (1) 482-Leasehold Improvements 5.61% 597 - 597 60 483-Computer Equipment 24.41% 2,729 307 3,036 432 483-Office Furniture & Equipment 8.90% 220 1 221 - 484-Transportation Equipment 30.00% 617 - 617 - 485-Heavy Work Equipment 2.19% 918 - 918 20 486-Tools & Work Equipment 2.01% 2,476 - 2,476 50 488-Communication STR 5.21% 605 86 691 34 496-Unclassified Plant 3.00% 4,469 - 4,469 134
TOTAL Gas Plant in Service 658,437 46,160 704,597 22,603
Composite Depreciation Rate 3.32%
Gross Plant Additions Retirements Gross Plant DepreciationMonth Start Month In Month In Month End Month By Month
January 658,437 377 - 658,814 1,809 February 658,814 1,572 - 660,386 1,833 March 660,386 1,420 - 661,806 1,840 April 661,806 2,430 - 664,236 1,844 May 664,236 5,180 - 669,416 1,850 June 669,416 14,699 - 684,115 1,863 July 684,115 8,668 - 692,783 1,900 August 692,783 2,020 - 694,803 1,921 September 694,803 2,247 - 697,050 1,926 October 697,050 3,475 - 700,525 1,932 November 700,525 2,040 - 702,565 1,940 December 702,565 2,114 (82) 704,597 1,945
TOTAL 46,242 (82) 22,603
DEPRECIATION BY ACCOUNT - 2020
($000)
DEPRECIATION BY MONTH - 2020
($000)
Schedule C-1 Zone 8
Foothills Pipe Lines Ltd., 2020 Effective Rates
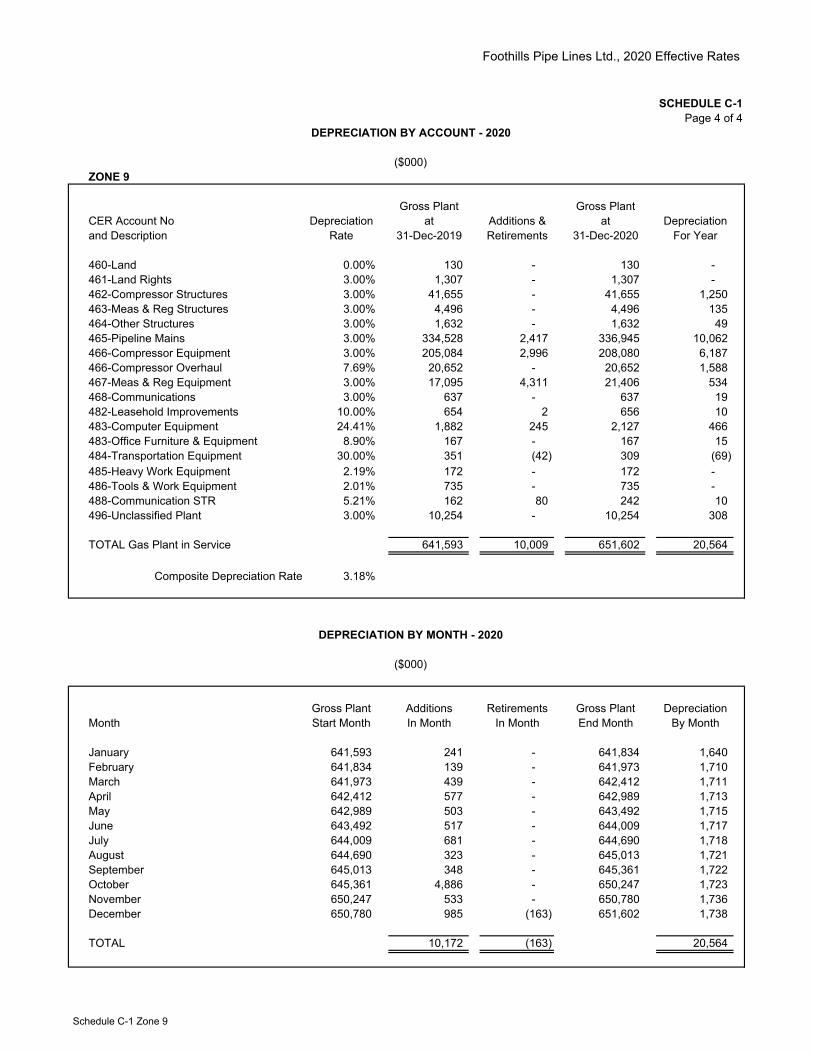
SCHEDULE C-1Page 4 of 4
ZONE 9
Gross Plant Gross PlantCER Account No Depreciation at Additions & at Depreciationand Description Rate 31-Dec-2019 Retirements 31-Dec-2020 For Year
460-Land 0.00% 130 - 130 - 461-Land Rights 3.00% 1,307 - 1,307 - 462-Compressor Structures 3.00% 41,655 - 41,655 1,250 463-Meas & Reg Structures 3.00% 4,496 - 4,496 135 464-Other Structures 3.00% 1,632 - 1,632 49 465-Pipeline Mains 3.00% 334,528 2,417 336,945 10,062 466-Compressor Equipment 3.00% 205,084 2,996 208,080 6,187 466-Compressor Overhaul 7.69% 20,652 - 20,652 1,588 467-Meas & Reg Equipment 3.00% 17,095 4,311 21,406 534 468-Communications 3.00% 637 - 637 19 482-Leasehold Improvements 10.00% 654 2 656 10 483-Computer Equipment 24.41% 1,882 245 2,127 466 483-Office Furniture & Equipment 8.90% 167 - 167 15 484-Transportation Equipment 30.00% 351 (42) 309 (69) 485-Heavy Work Equipment 2.19% 172 - 172 - 486-Tools & Work Equipment 2.01% 735 - 735 - 488-Communication STR 5.21% 162 80 242 10 496-Unclassified Plant 3.00% 10,254 - 10,254 308
TOTAL Gas Plant in Service 641,593 10,009 651,602 20,564
Composite Depreciation Rate 3.18%
Gross Plant Additions Retirements Gross Plant DepreciationMonth Start Month In Month In Month End Month By Month
January 641,593 241 - 641,834 1,640 February 641,834 139 - 641,973 1,710 March 641,973 439 - 642,412 1,711 April 642,412 577 - 642,989 1,713 May 642,989 503 - 643,492 1,715 June 643,492 517 - 644,009 1,717 July 644,009 681 - 644,690 1,718 August 644,690 323 - 645,013 1,721 September 645,013 348 - 645,361 1,722 October 645,361 4,886 - 650,247 1,723 November 650,247 533 - 650,780 1,736 December 650,780 985 (163) 651,602 1,738
TOTAL 10,172 (163) 20,564
DEPRECIATION BY ACCOUNT - 2020
($000)
DEPRECIATION BY MONTH - 2020
($000)
Schedule C-1 Zone 9

Foothills Pipe Lines Ltd., 2020 Effective Rates
SCHEDULE D
Zone 6 Zone 7 Zone 8 Zone 9
Return on Rate Base 3,389 123 9,706 5,671
Add:Depreciation and Amortization 11,836 1,186 22,603 20,564
Deduct:Return on Debt 922 34 2,666 1,543 Capital Cost Allowance 4,630 628 10,655 6,719 Compressor Overhaul Capitalized - - - -
Total Taxable Amount 9,673 647 18,988 17,973
Income Tax Rate (R) 26.04% 26.04% 26.04% 26.04%
Income Tax Provision 3,405 228 6,684 6,327 (at R/(1-R) x Taxable Amount)
Taxes - Other than Income Tax 3,546 859 7,706 4,765
Total Taxes: Income and Other 6,951 1,087 14,390 11,092
TAXES: INCOME AND OTHER
($000)
FOR THE YEAR ENDING DECEMBER 31, 2020
Schedule D

Foothills Pipe Lines Ltd., 2020 Effective Rates
SCHEDULE EPage 1 of 2
1.35% 2.33% unded rate (carry char 2.75%ZONE 6 12 12
2018 Forecast 2018 Actual 2019 Forecast Cost of Service
Operating & Maintenance 27,526 26,126 28,479Return on Rate Base 3,360 3,321 3,494Depreciation & Amortization 12,051 12,062 10,101Taxes: Income and Other 5,597 5,542 6,331Emissions Compliance Costs 2,878 2,878 3,865Methane Emissions Costs - - 536
Sub-Total 51,412 49,929 52,806
Adjustments:Previous (Over) / Under (1,893) (1,893) (2,728)Overrun Service - - -
Total Firm Revenue Requirement 49,519 48,036 50,078
Service RevenueFT Service 53,734 53,733 53,603
Total Revenue Generated 53,734 53,733 53,603
Variance 2018 1 2018 2018 2 2019 3 Total 4
Revenue Required minus Revenue Generated (4,215) (5,697) (1,482) (3,525) (5,007)Interest on Variance (130) (132) (2) (97) (99)
BILLING ADJUSTMENT FOR TEST YEAR (4,345) (5,829) (1,484) (3,622) (5,106)
ZONE 72018 Forecast 2018 Actual 2019 Forecast
Cost of ServiceOperating & Maintenance 5,941 4,251 3,991Return on Rate Base 100 90 97Depreciation & Amortization 272 272 658Taxes: Income and Other 710 677 877Methane Emissions Costs - - 83
Sub-Total 7,023 5,290 5,706
Adjustments:Previous (Over) / Under (2,501) (2,501) (1,394)Overrun Service - - -
Total Firm Revenue Requirement 4,522 2,789 4,312
Service RevenueFT Service 5,435 5,432 4,598
Total Revenue Generated 5,435 5,432 4,598
Variance 2018 1 2018 2018 2 2019 3 Total 4
Revenue Required minus Revenue Generated (913) (2,643) (1,730) (286) (2,016)Interest on Variance (28) (61) (33) (8) (41)
BILLING ADJUSTMENT FOR TEST YEAR (941) (2,704) (1,763) (294) (2,057)
Notes:1. Forecast 2018 as identified in the 2019 rates application.2. Estimate/Actual (over)/under collection from 2018.3. 2019 estimated (over)/under collection.4. Total adjustment from 2018 and 2019.
ADJUSTMENT FOR (OVER) OR UNDER COLLECTION
($000)
Schedule E

Foothills Pipe Lines Ltd., 2020 Effective Rates
SCHEDULE EPage 2 of 2
ZONE 82018 Forecast 2018 Actual 2019 Forecast
Cost of ServiceOperating & Maintenance 20,182 20,084 20,063Return on Rate Base 7,599 7,328 8,068Depreciation & Amortization 21,630 21,475 21,484Taxes: Income and Other 12,238 12,449 12,952Emissions Compliance Costs 11,900 11,876 16,660Fuel Tax 4,352 4,318 5,018Methane Emissions Costs - - 279
Sub-Total 77,901 77,530 84,524
Adjustments:Previous (Over) / Under (6,587) (6,587) 4,069STFT & IT Service (2,798) (3,246) (3,516)
Total Firm Revenue Requirement 68,516 67,698 85,077
Service RevenueFT Service 64,667 66,670 84,975
Total Revenue Generated 64,667 66,670 84,975
Variance 2018 1 2018 2018 2 2019 3 Total 4
Revenue Required minus Revenue Generated 3,849 1,028 (2,821) 102 (2,719)Interest on Variance 119 24 (95) 3 (92)
BILLING ADJUSTMENT FOR TEST YEAR 3,968 1,052 (2,916) 105 (2,811)
ZONE 92018 Forecast 2018 Actual 2019 Forecast
Cost of ServiceOperating & Maintenance 9,115 8,462 10,397Return on Rate Base 5,989 5,973 6,176Depreciation & Amortization 20,289 20,280 20,471Taxes: Income and Other 10,532 10,592 11,613Emissions Compliance Costs - - 1,679Fuel Tax 423 349 576Methane Emissions Costs - - 163
Sub-Total 46,348 45,656 51,075
Adjustments:Previous (Over) / Under (3,587) (3,587) 9,934STFT, IT & SGS Service (8,339) (7,863) (12,742)
Total Firm Revenue Requirement 34,422 34,206 48,267
Service RevenueFT Service 26,273 25,876 50,869
Total Revenue Generated 26,273 25,876 50,869
Variance 2018 1 2018 2018 2 2019 3 Total 4
Revenue Required minus Revenue Generated 8,149 8,330 181 (2,602) (2,421)Interest on Variance 251 194 (57) (72) (129)
BILLING ADJUSTMENT FOR TEST YEAR 8,400 8,524 124 (2,674) (2,550)
Notes:1. Forecast 2018 as identified in the 2019 rates application.2. Estimate/Actual (over)/under collection from 2018.3. 2019 estimated (over)/under collection.4. Total adjustment from 2018 and 2019.
ADJUSTMENT FOR (OVER) OR UNDER COLLECTION
($000)
Schedule E
Foothills Pipe Lines Ltd., 2020 Effective Rates
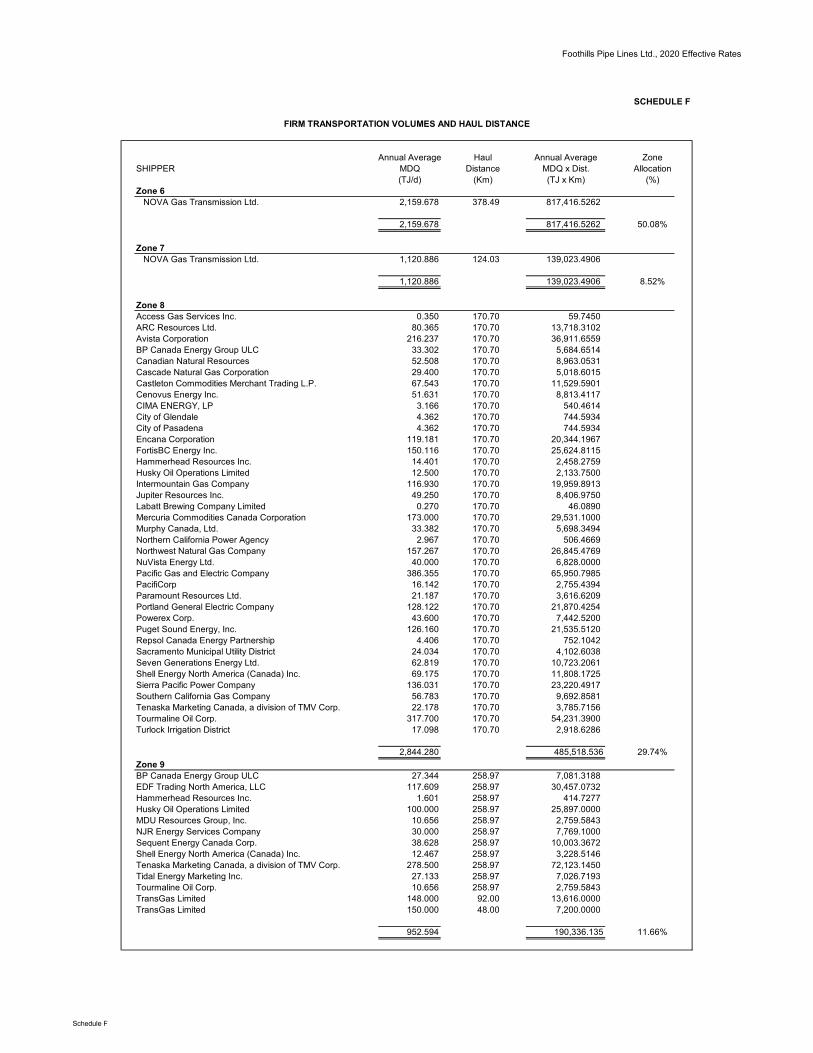
SCHEDULE F
Annual Average Haul Annual Average ZoneSHIPPER MDQ Distance MDQ x Dist. Allocation
(TJ/d) (Km) (TJ x Km) (%)Zone 6
NOVA Gas Transmission Ltd. 2,159.678 378.49 817,416.5262
2,159.678 817,416.5262 50.08%
Zone 7NOVA Gas Transmission Ltd. 1,120.886 124.03 139,023.4906
1,120.886 139,023.4906 8.52%
Zone 8Access Gas Services Inc. 0.350 170.70 59.7450 ARC Resources Ltd. 80.365 170.70 13,718.3102 Avista Corporation 216.237 170.70 36,911.6559 BP Canada Energy Group ULC 33.302 170.70 5,684.6514 Canadian Natural Resources 52.508 170.70 8,963.0531 Cascade Natural Gas Corporation 29.400 170.70 5,018.6015 Castleton Commodities Merchant Trading L.P. 67.543 170.70 11,529.5901 Cenovus Energy Inc. 51.631 170.70 8,813.4117 CIMA ENERGY, LP 3.166 170.70 540.4614 City of Glendale 4.362 170.70 744.5934 City of Pasadena 4.362 170.70 744.5934 Encana Corporation 119.181 170.70 20,344.1967 FortisBC Energy Inc. 150.116 170.70 25,624.8115 Hammerhead Resources Inc. 14.401 170.70 2,458.2759 Husky Oil Operations Limited 12.500 170.70 2,133.7500 Intermountain Gas Company 116.930 170.70 19,959.8913 Jupiter Resources Inc. 49.250 170.70 8,406.9750 Labatt Brewing Company Limited 0.270 170.70 46.0890 Mercuria Commodities Canada Corporation 173.000 170.70 29,531.1000 Murphy Canada, Ltd. 33.382 170.70 5,698.3494 Northern California Power Agency 2.967 170.70 506.4669 Northwest Natural Gas Company 157.267 170.70 26,845.4769 NuVista Energy Ltd. 40.000 170.70 6,828.0000 Pacific Gas and Electric Company 386.355 170.70 65,950.7985 PacifiCorp 16.142 170.70 2,755.4394 Paramount Resources Ltd. 21.187 170.70 3,616.6209 Portland General Electric Company 128.122 170.70 21,870.4254 Powerex Corp. 43.600 170.70 7,442.5200 Puget Sound Energy, Inc. 126.160 170.70 21,535.5120 Repsol Canada Energy Partnership 4.406 170.70 752.1042 Sacramento Municipal Utility District 24.034 170.70 4,102.6038 Seven Generations Energy Ltd. 62.819 170.70 10,723.2061 Shell Energy North America (Canada) Inc. 69.175 170.70 11,808.1725 Sierra Pacific Power Company 136.031 170.70 23,220.4917 Southern California Gas Company 56.783 170.70 9,692.8581 Tenaska Marketing Canada, a division of TMV Corp. 22.178 170.70 3,785.7156 Tourmaline Oil Corp. 317.700 170.70 54,231.3900 Turlock Irrigation District 17.098 170.70 2,918.6286
2,844.280 485,518.536 29.74%
Zone 9BP Canada Energy Group ULC 27.344 258.97 7,081.3188 EDF Trading North America, LLC 117.609 258.97 30,457.0732 Hammerhead Resources Inc. 1.601 258.97 414.7277 Husky Oil Operations Limited 100.000 258.97 25,897.0000 MDU Resources Group, Inc. 10.656 258.97 2,759.5843 NJR Energy Services Company 30.000 258.97 7,769.1000 Sequent Energy Canada Corp. 38.628 258.97 10,003.3672 Shell Energy North America (Canada) Inc. 12.467 258.97 3,228.5146 Tenaska Marketing Canada, a division of TMV Corp. 278.500 258.97 72,123.1450 Tidal Energy Marketing Inc. 27.133 258.97 7,026.7193 Tourmaline Oil Corp. 10.656 258.97 2,759.5843 TransGas Limited 148.000 92.00 13,616.0000 TransGas Limited 150.000 48.00 7,200.0000
952.594 190,336.135 11.66%
FIRM TRANSPORTATION VOLUMES AND HAUL DISTANCE
Schedule F
Foothills Pipe Lines Ltd., 2020 Effective Rates
SCHEDULE G
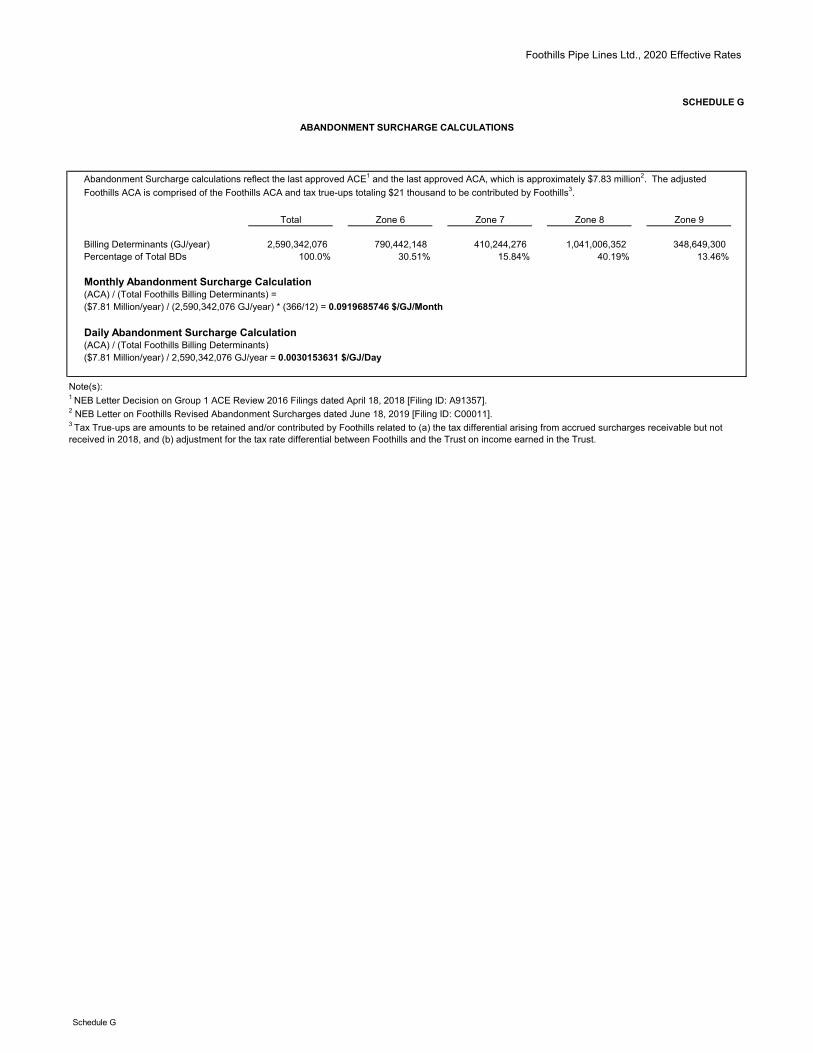
Total Zone 6 Zone 7 Zone 8 Zone 9
Billing Determinants (GJ/year) 2,590,342,076 790,442,148 410,244,276 1,041,006,352 348,649,300 Percentage of Total BDs 100.0% 30.51% 15.84% 40.19% 13.46%
Monthly Abandonment Surcharge Calculation(ACA) / (Total Foothills Billing Determinants) =($7.81 Million/year) / (2,590,342,076 GJ/year) * (366/12) = 0.0919685746 $/GJ/Month
Daily Abandonment Surcharge Calculation(ACA) / (Total Foothills Billing Determinants)($7.81 Million/year) / 2,590,342,076 GJ/year = 0.0030153631 $/GJ/Day
Note(s):
ABANDONMENT SURCHARGE CALCULATIONS
Abandonment Surcharge calculations reflect the last approved ACE1 and the last approved ACA, which is approximately $7.83 million2. The adjusted
Foothills ACA is comprised of the Foothills ACA and tax true-ups totaling $21 thousand to be contributed by Foothills3.
1 NEB Letter Decision on Group 1 ACE Review 2016 Filings dated April 18, 2018 [Filing ID: A91357].2 NEB Letter on Foothills Revised Abandonment Surcharges dated June 18, 2019 [Filing ID: C00011].3 Tax True‐ups are amounts to be retained and/or contributed by Foothills related to (a) the tax differential arising from accrued surcharges receivable but not received in 2018, and (b) adjustment for the tax rate differential between Foothills and the Trust on income earned in the Trust.
Schedule G

Attachment 2
Foothills Pipe Lines Ltd. Table of Effective Rates
Blackline Version Effective 2020 Rates

Foothills Pipe Lines Ltd. Page 1
TARIFF – PHASE I Effective Date: January 1, 2020July 1, 2019
TABLE OF EFFECTIVE RATES
1. Rate Schedule FT, Firm Transportation Service
Demand Rate ($/GJ/Km/Month)
Zone 6 0.0056645474 0.0053689132
Zone 7 0.0045283284 0.0029594363
Zone 8* 0.0146950612 0.0163193182
Zone 9 0.0170835998 0.0169980422
2. Rate Schedule OT, Overrun Transportation Service
Commodity Rate ($/GJ/Km)
Zone 6 0.0002042952 0.0001941634
Zone 7 0.0001633168 0.0001070262
3. Rate Schedule IT, Interruptible Transportation Service
Commodity Rate ($/GJ/Km)
Zone 8 0.0005299858 0.0005901781
Zone 9 0.0006161298 0.0006147237
4. Monthly Abandonment Surcharge**
All Zones 0.0919685746 0.0900602551 ($/GJ/Month)
5. Daily Abandonment Surcharge***
All Zones 0.0030153631 0.0029608851 ($/GJ/Day)
* For Zone 8, Shippers Haul Distance shall be 170.7 km.
**Monthly Abandonment Surcharge applicable to Rate Schedule Firm Transportation Service, and Short Term Firm Transportation Service for all zones.
***Daily Abandonment Surcharge applicable to Rate Schedule Overrun Transportation Service for Zone 6 & 7, Interruptible Transportation Service for Zone 8 & 9, and Small General Service for Zone 9.

Attachment 3
Foothills Pipe Lines Ltd. Table of Effective Rates
Clean Version Effective 2020 Rates
Foothills Pipe Lines Ltd. Page 1
TARIFF – PHASE I Effective Date: January 1, 2020
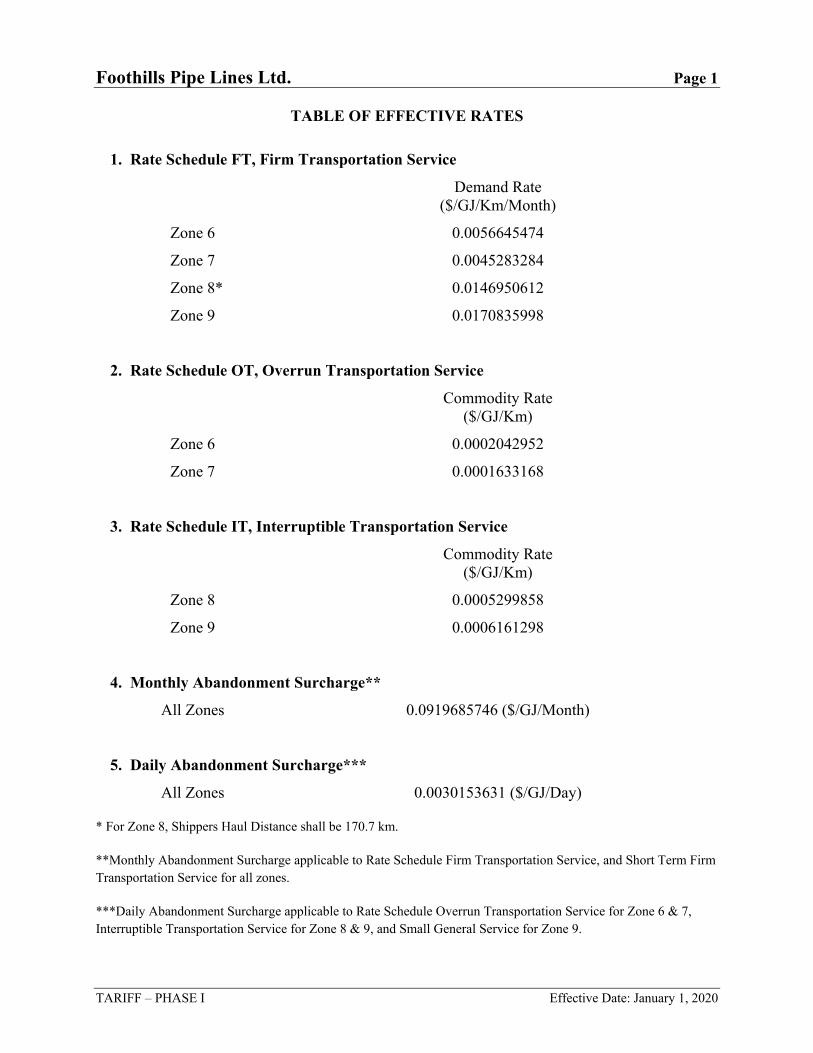
TABLE OF EFFECTIVE RATES
1. Rate Schedule FT, Firm Transportation Service
Demand Rate ($/GJ/Km/Month)
Zone 6 0.0056645474
Zone 7 0.0045283284
Zone 8* 0.0146950612
Zone 9 0.0170835998
2. Rate Schedule OT, Overrun Transportation Service
Commodity Rate ($/GJ/Km)
Zone 6 0.0002042952
Zone 7 0.0001633168
3. Rate Schedule IT, Interruptible Transportation Service
Commodity Rate ($/GJ/Km)
Zone 8 0.0005299858
Zone 9 0.0006161298
4. Monthly Abandonment Surcharge**
All Zones 0.0919685746 ($/GJ/Month)
5. Daily Abandonment Surcharge***
All Zones 0.0030153631 ($/GJ/Day)
* For Zone 8, Shippers Haul Distance shall be 170.7 km.
**Monthly Abandonment Surcharge applicable to Rate Schedule Firm Transportation Service, and Short Term Firm Transportation Service for all zones.
***Daily Abandonment Surcharge applicable to Rate Schedule Overrun Transportation Service for Zone 6 & 7, Interruptible Transportation Service for Zone 8 & 9, and Small General Service for Zone 9.
Related Documents


