Orlando, February, 2006

Welcome message from author
This document is posted to help you gain knowledge. Please leave a comment to let me know what you think about it! Share it to your friends and learn new things together.
Transcript

Orlando, February, 2006

2
19.2% 21.8%
30.7%34.9% 33.0%
35.8%
43.5%47.8%
27.2%
1998 1999 2000 2001 2002 2003 2004 2005 2006
Domestic Market Share (RPK’s)
Source: ANAC
TAM has the leadership in the domestic and international markets
0.1%3.8%
13.9% 12.5% 12.0%14.3%
18.8%
37.3%
7.9%
1998 1999 2000 2001 2002 2003 2004 2005 2006
International Market Share (RPK’s)
3
12Non-stop city links3
44264342Daily Roundtrips3
109129
124848+272Destinations3
6444.7116.894ASKs1
TAM VarigGOL
81%89%90%Operational efficiency 1
TAM has the most extensive domestic network...
1 Based on 3Q06 ANAC numbers; in million ASKs2 27 destinations served through operational agreements with OceanAir, Pantanal, Passaredo, Total, Trip3 Based on December, 2006 reported routes (HOTRANs)
4
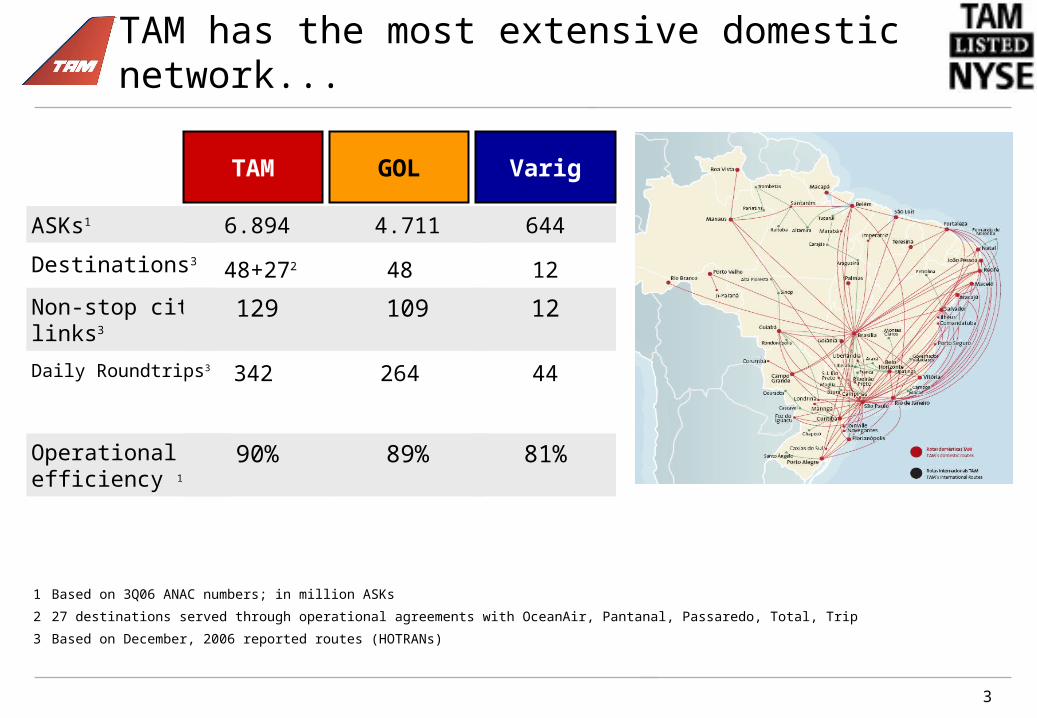
...and is the leading Brazilian international carrier
Longhaul marketParis 3x per dayLondon 1x per dayNY 2x per dayMiami 3x per day
Latin American marketBuenos Aires 7x per daySantiago 2x per day Assuncion 8x per day Lima 1x per day Montevideo 1x per day Ciudad del Este 3x per day Sta Cruz dl Sierra 1x per day Cochabamba 1x per day
Note: Based on Jan 2006 network
5
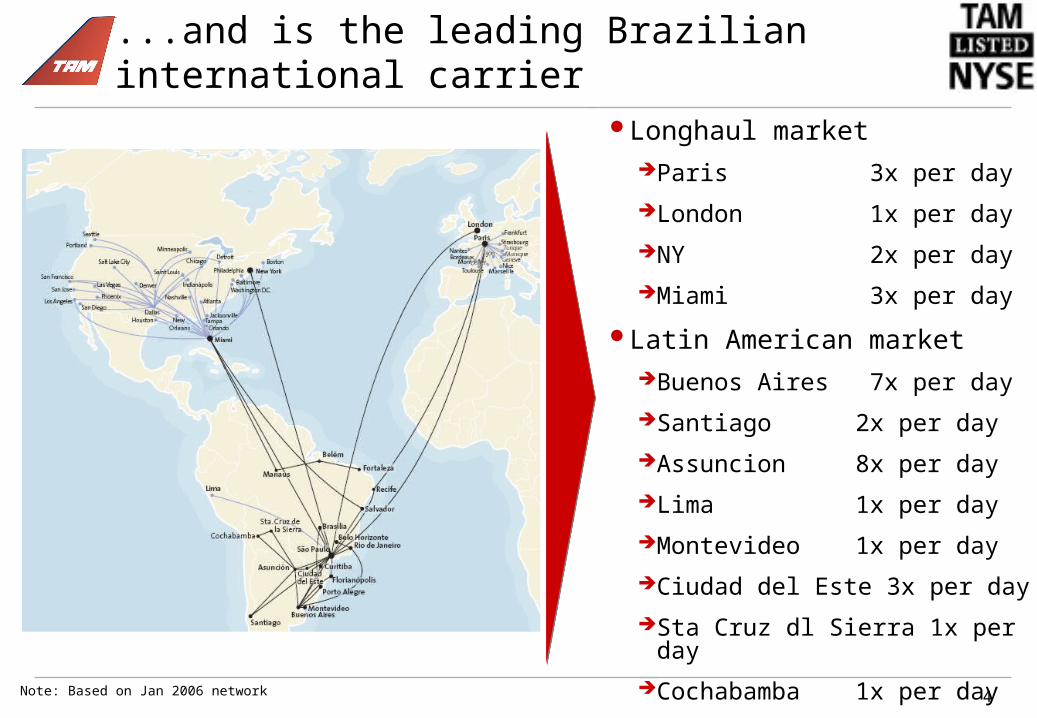
...expanding the fleet and maintaining one of the youngest fleets in the world
TAM will be monofleet in the domestic market by 1S08
10
64
22
3
12
886
414
103
416
106
416
112
2006 2007 2008 2009 2010
96109
121 126 132
0
50
100
150
Total Fleet
F100A319/320A330MD11B777
AverageFleet Age 7 6 5 6 7
6
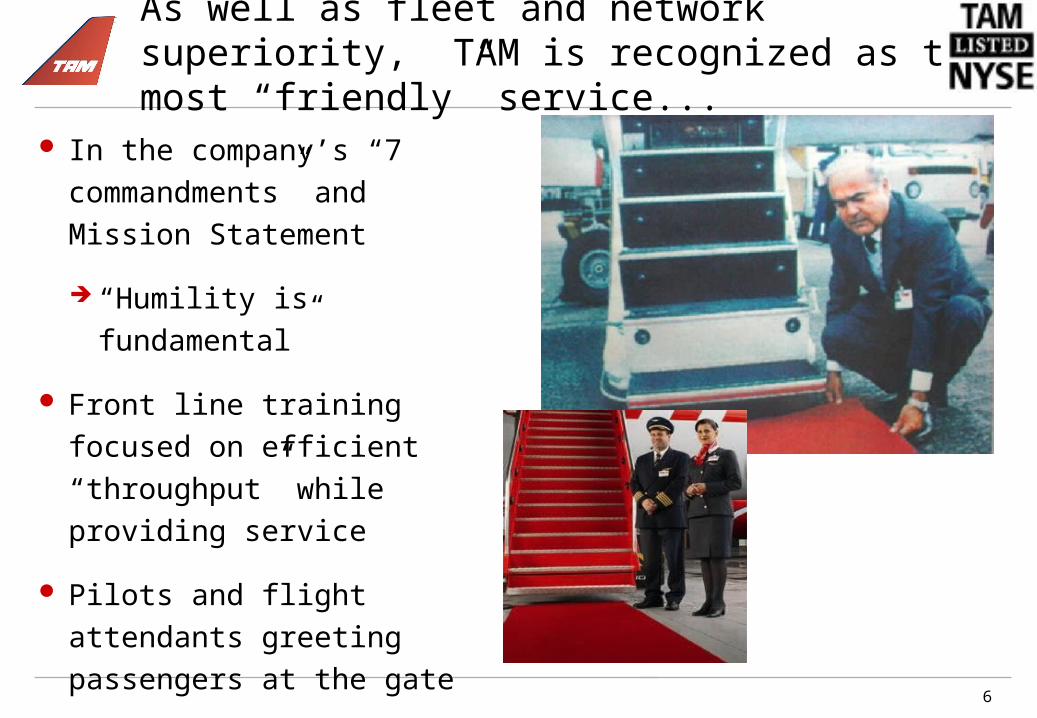
As well as fleet and network superiority, TAM is recognized as the most “friendly” service...
In the company’s “7 commandments” and Mission Statement
“Humility is fundamental”
Front line training focused on efficient “throughput” while providing service
Pilots and flight attendants greeting passengers at the gate
7
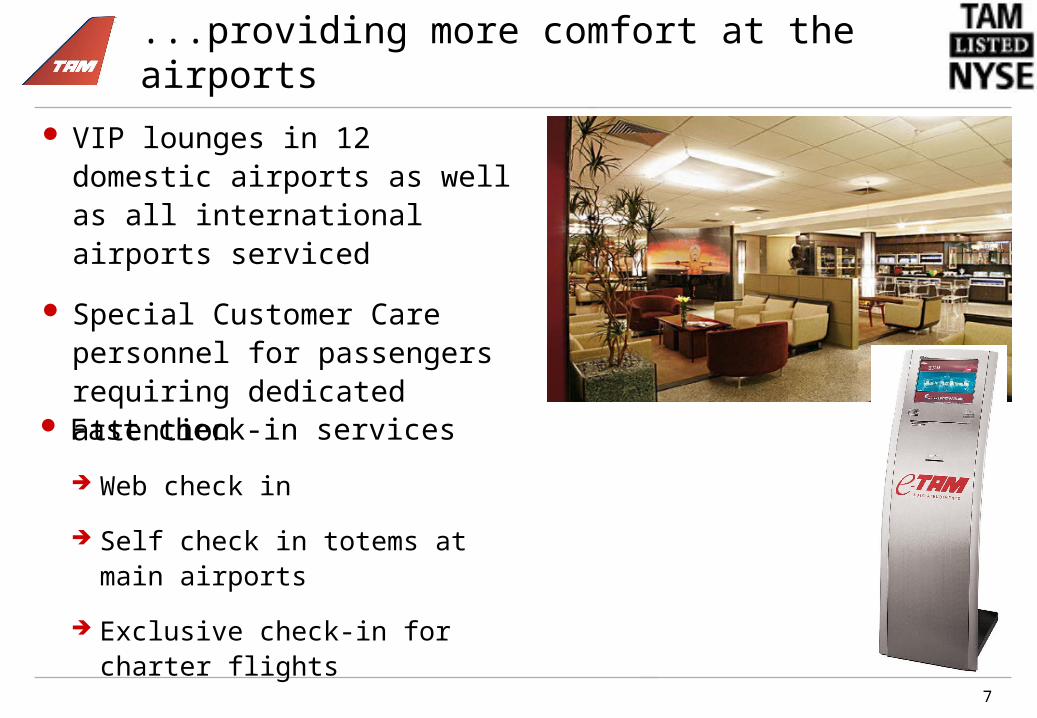
...providing more comfort at the airports
Fast check-in services
Web check in
Self check in totems at main airports
Exclusive check-in for charter flights
VIP lounges in 12 domestic airports as well as all international airports serviced
Special Customer Care personnel for passengers requiring dedicated attention
8
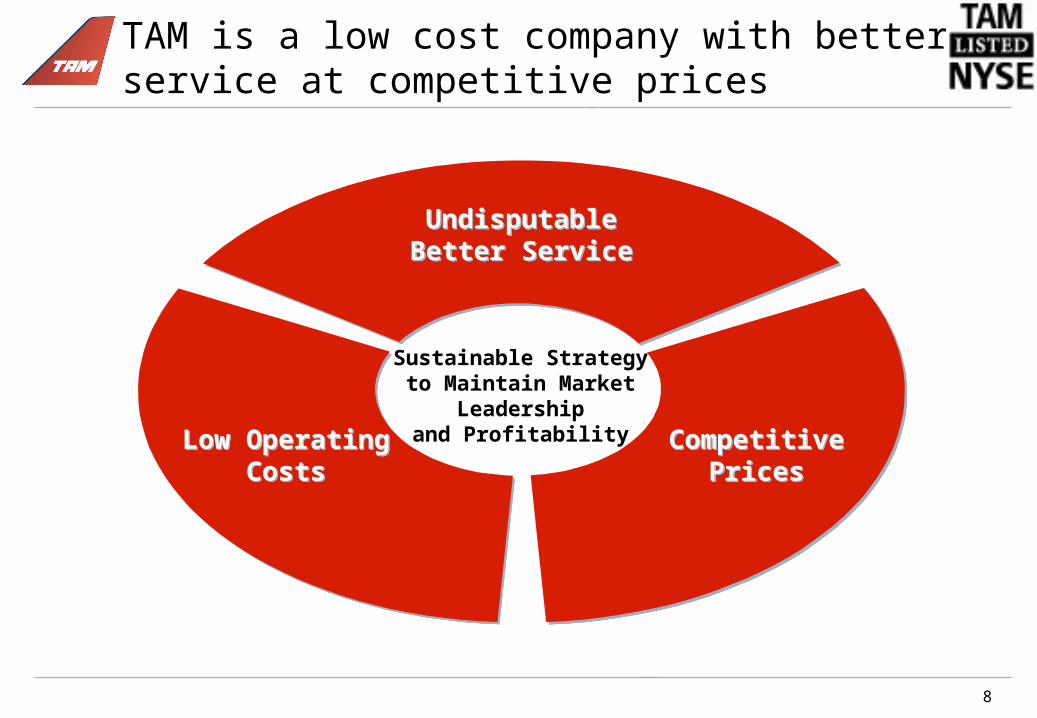
TAM is a low cost company with better service at competitive prices
Low OperatingCosts
UndisputableBetter Service
CompetitivePrices
Sustainable Strategyto Maintain Market
Leadershipand Profitability

9
TAM has increased the spread (RASK – CASK)…
RASK
CASK
2002 2003 2004 2005 1T06 2T06 3T0615
20
25RASK/CASK (R$ Centavos)
EBITMargem
Spread
-7.1%
-0.3
-0.9%
0.8
6.5%
1.4
7.5%
1.5
11.9%
2.4
12.8%
2.8
16.8%
3.7
10
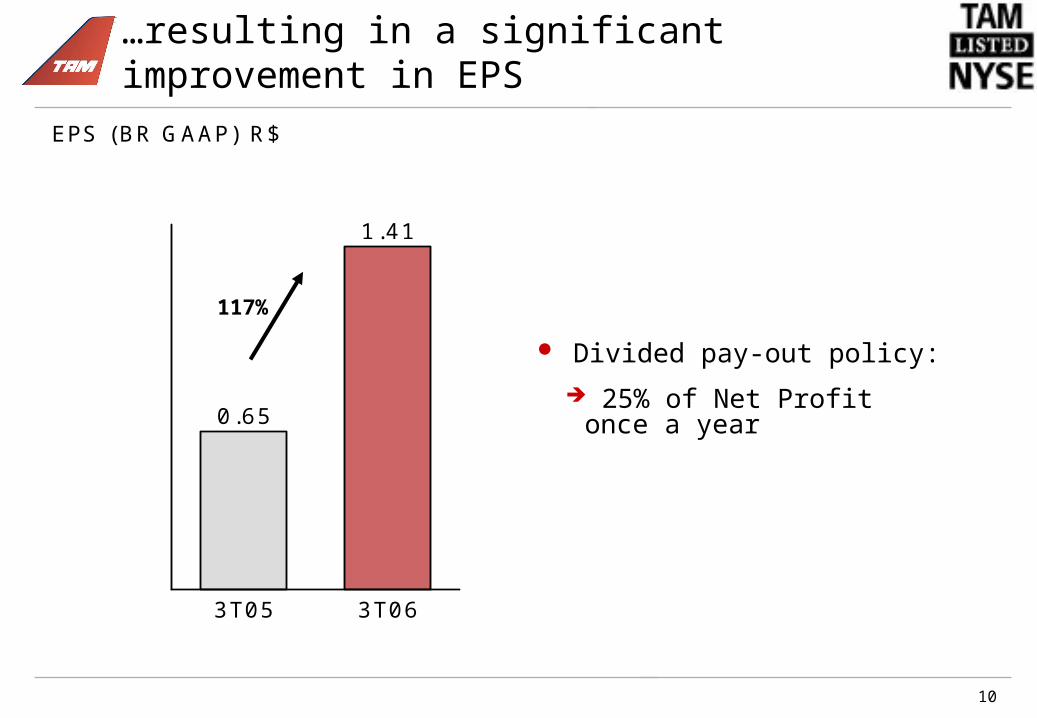
…resulting in a significant improvement in EPS
3T05 3T06
0.65
1.41
EPS (BR GAAP) R$
117%
Divided pay-out policy: 25% of Net Profit once a year
11
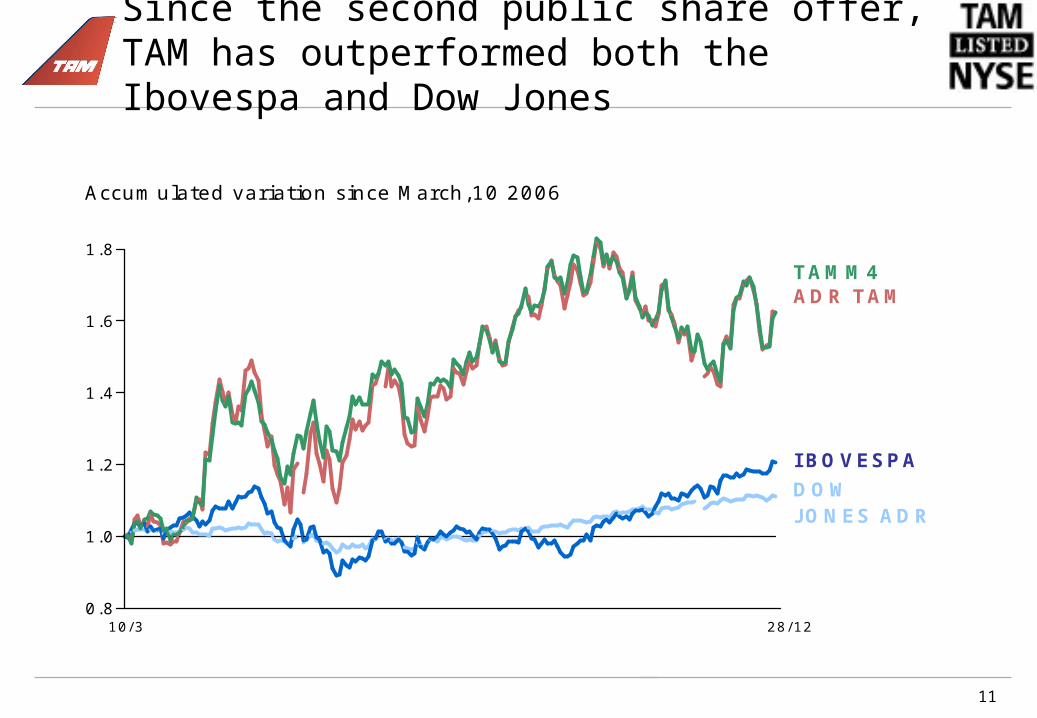
Since the second public share offer, TAM has outperformed both the Ibovespa and Dow Jones
TAMM4
IBOVESPADOWJONES ADR
ADR TAM
10/3 28/120.8
1.0
1.2
1.4
1.6
1.8
Accumulated variation since March,10 2006
12
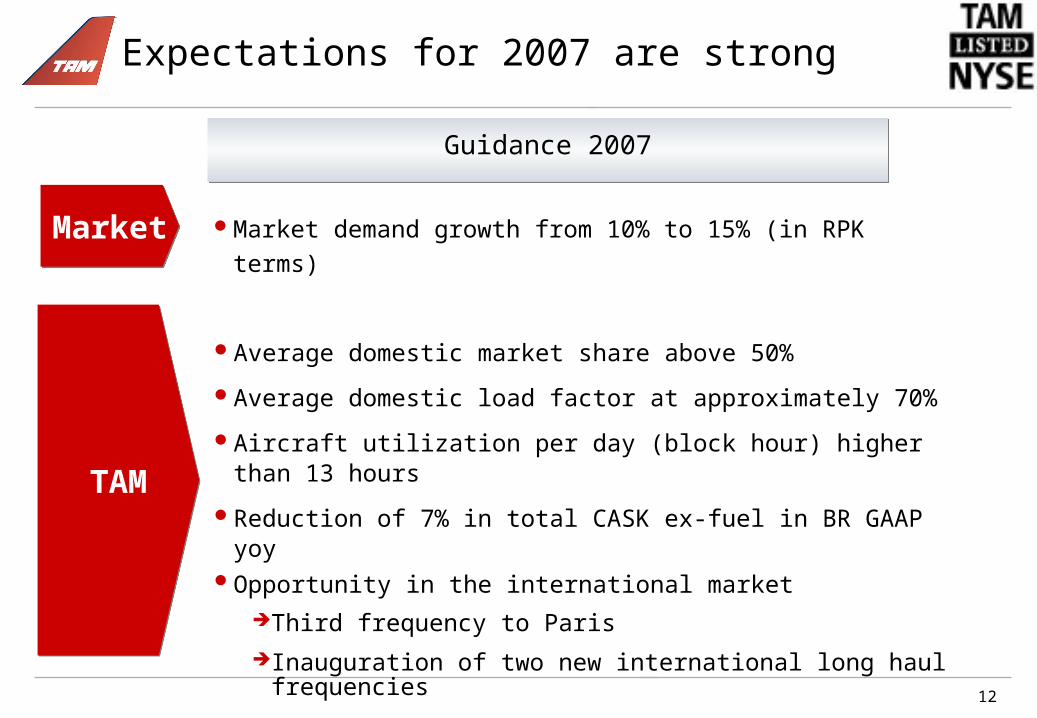
Expectations for 2007 are strong
Average domestic market share above 50%
Average domestic load factor at approximately 70%
Aircraft utilization per day (block hour) higher than 13 hours
Reduction of 7% in total CASK ex-fuel in BR GAAP yoyOpportunity in the international market
Third frequency to ParisInauguration of two new international long haul frequencies
Market demand growth from 10% to 15% (in RPK terms)
TAM
Guidance 2007
Market
13
Information and Projection
This notice may contain estimates for future events. These estimates merely reflect the expectations of the Company’s management, and involve risks and uncertainties. The Company is not responsible for investment operations or decisions taken based on information contained in this communication. These estimates are subject to changes without prior notice. This material has been prepared by TAM S.A. (“TAM“ or the “Company”) includes certain forward-looking statements that are based principally on TAM’s current expectations and on projections of future events and financial trends that currently affect or might affect TAM’s business, and are not guarantees of future performance. They are based on management’s expectations that involve a number of business risks and uncertainties, any of each could cause actual financial condition and results of operations to differ materially from those set out in TAM’s forward-looking statements. TAM undertakes no obligation to publicly update or revise any forwardlooking statements. This material is published solely for informational purposes and is not to be construed as a solicitation or an offer to buy or sell any securities or related financial instruments. Likewise it does not give and should not be treated as giving investment advice. It has no regard to the specific investment objectives, financial situation or particular needs of any recipient. No representation or warranty, either express or implied, is provided in relation to the accuracy, completeness or reliability of the information contained herein. It should not be regarded by recipients as a substitute for the exercise of their own judgment.
Related Documents

![WELCOME [licfamily.org.gh]licfamily.org.gh/wp-content/uploads/2019/01/... · Jan 06:Ms Akua Danquah Obeng-Dwamena Jan 06: Mr Michael Kwabena Osei Jan 07: Mr Eric Minta-Asare Jan 07:](https://static.cupdf.com/doc/110x72/5f10ad597e708231d44a47cb/welcome-jan-06ms-akua-danquah-obeng-dwamena-jan-06-mr-michael-kwabena-osei.jpg)