APPLICATION FOR ENVIRONMENTAL CLEARANCE For M/s. Codissia Industrial Park Ltd. At S.Nos. 96/1, 97, 98, 99/2, 101/2, 101/3, 102/2B, 131/2, 135/2, 136/2, 138, 141/2, 142/1B1, 142/2B1, 142/2B2, 142/3A, 142/3B, 143/1, 143/2, 143/3, 143/4, 144/1, 144/2, 144/3, 144/4, 145/1, 146/1, 147/1, 147/2, 147/3, 148/1, 148/2, 314, 315/1A, 315/1B, 315/2A, 315/2B, 315/3, 316/1, 316/2, 316/3, 317/2, 318/1, 318/2, 318/3, 320/1, 320/2A, 320/2B, 320/2C, 320/2D, 320/2E, 320/2F, 321/1, 321/2, 322/1 and 322/2 Kallapalayam Village, Palladam Taluk, Coimbatore District, Tamil Nadu Submitted to Submitted to the State Level Environmental Impact Assessment Authority, Tamil Nadu

Welcome message from author
This document is posted to help you gain knowledge. Please leave a comment to let me know what you think about it! Share it to your friends and learn new things together.
Transcript
APPLICATION FOR ENVIRONMENTAL CLEARANCE
For
M/s. Codissia Industrial Park Ltd.
At
S.Nos. 96/1, 97, 98, 99/2, 101/2, 101/3, 102/2B, 131/2, 135/2, 136/2, 138, 141/2, 142/1B1, 142/2B1, 142/2B2, 142/3A, 142/3B, 143/1, 143/2, 143/3, 143/4, 144/1, 144/2, 144/3, 144/4, 145/1, 146/1, 147/1, 147/2, 147/3, 148/1, 148/2, 314, 315/1A, 315/1B, 315/2A, 315/2B, 315/3, 316/1, 316/2, 316/3, 317/2, 318/1, 318/2, 318/3, 320/1, 320/2A, 320/2B, 320/2C, 320/2D, 320/2E, 320/2F, 321/1, 321/2, 322/1 and 322/2 Kallapalayam Village, Palladam Taluk, Coimbatore District, Tamil Nadu
Submitted to
Submitted to the State Level Environmental Impact Assessment
Authority, Tamil Nadu
1
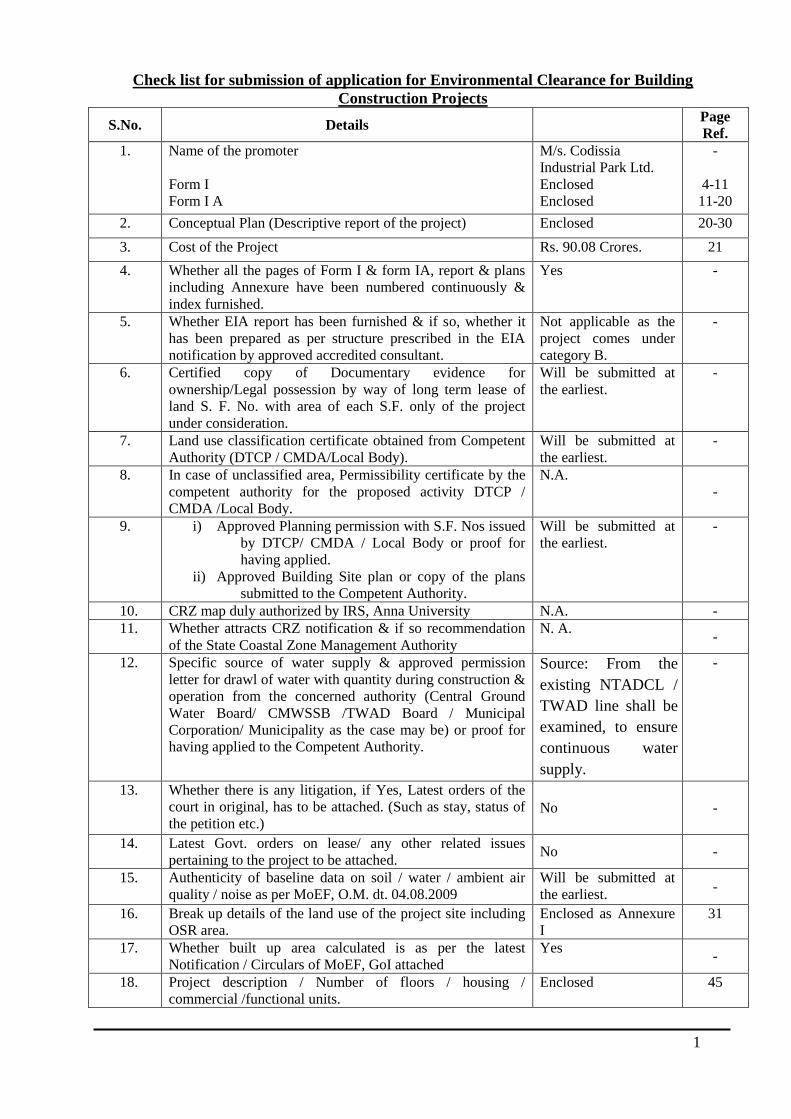
Check list for submission of application for Environmental Clearance for Building
Construction Projects
S.No. Details Page
Ref.
1. Name of the promoter
Form I
Form I A
M/s. Codissia
Industrial Park Ltd.
Enclosed
Enclosed
-
4-11
11-20
2. Conceptual Plan (Descriptive report of the project) Enclosed 20-30
3. Cost of the Project Rs. 90.08 Crores. 21
4. Whether all the pages of Form I & form IA, report & plans
including Annexure have been numbered continuously &
index furnished.
Yes
-
5. Whether EIA report has been furnished & if so, whether it
has been prepared as per structure prescribed in the EIA
notification by approved accredited consultant.
Not applicable as the
project comes under
category B.
-
6. Certified copy of Documentary evidence for
ownership/Legal possession by way of long term lease of
land S. F. No. with area of each S.F. only of the project
under consideration.
Will be submitted at
the earliest.
-
7. Land use classification certificate obtained from Competent
Authority (DTCP / CMDA/Local Body).
Will be submitted at
the earliest.
-
8. In case of unclassified area, Permissibility certificate by the
competent authority for the proposed activity DTCP /
CMDA /Local Body.
N.A.
-
9. i) Approved Planning permission with S.F. Nos issued
by DTCP/ CMDA / Local Body or proof for
having applied.
ii) Approved Building Site plan or copy of the plans
submitted to the Competent Authority.
Will be submitted at
the earliest.
-
10. CRZ map duly authorized by IRS, Anna University N.A. -
11. Whether attracts CRZ notification & if so recommendation
of the State Coastal Zone Management Authority
N. A.
-
12. Specific source of water supply & approved permission
letter for drawl of water with quantity during construction &
operation from the concerned authority (Central Ground
Water Board/ CMWSSB /TWAD Board / Municipal
Corporation/ Municipality as the case may be) or proof for
having applied to the Competent Authority.
Source: From the
existing NTADCL /
TWAD line shall be
examined, to ensure
continuous water
supply.
-
13. Whether there is any litigation, if Yes, Latest orders of the
court in original, has to be attached. (Such as stay, status of
the petition etc.) No -
14. Latest Govt. orders on lease/ any other related issues
pertaining to the project to be attached. No -
15. Authenticity of baseline data on soil / water / ambient air
quality / noise as per MoEF, O.M. dt. 04.08.2009
Will be submitted at
the earliest. -
16. Break up details of the land use of the project site including
OSR area.
Enclosed as Annexure
I
31
17. Whether built up area calculated is as per the latest
Notification / Circulars of MoEF, GoI attached
Yes -
18. Project description / Number of floors / housing /
commercial /functional units.
Enclosed 45
2
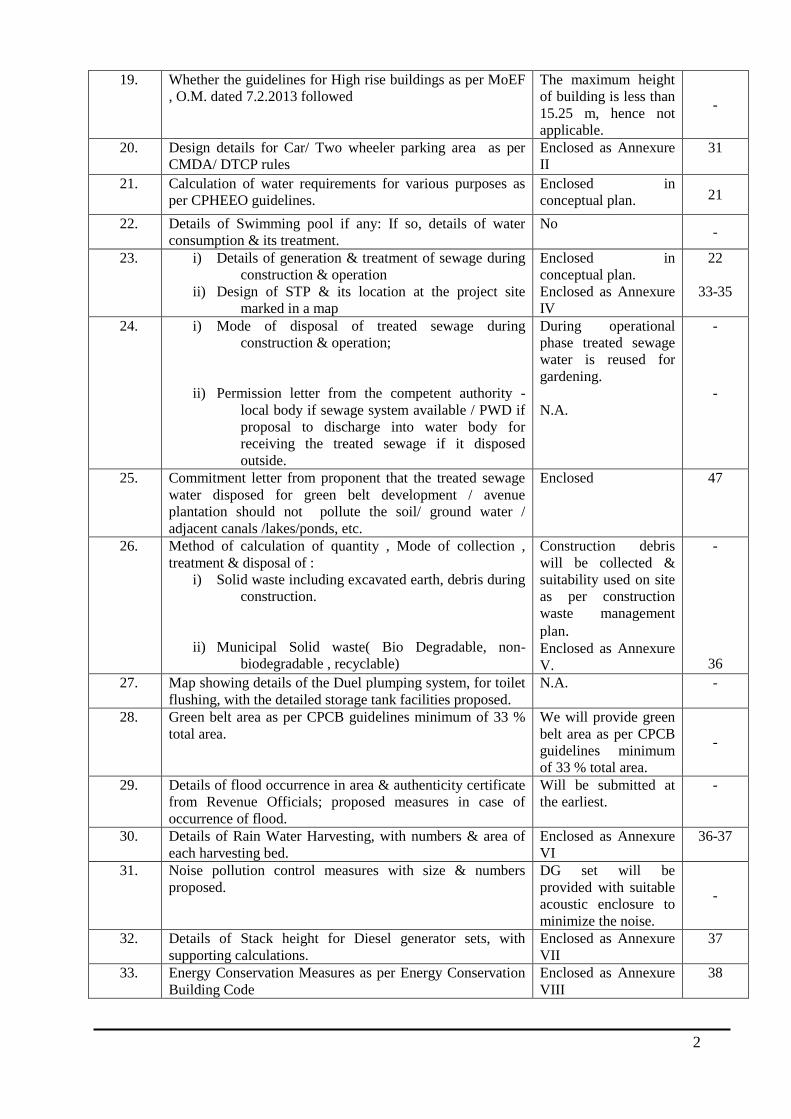
19. Whether the guidelines for High rise buildings as per MoEF
, O.M. dated 7.2.2013 followed
The maximum height
of building is less than
15.25 m, hence not
applicable.
-
20. Design details for Car/ Two wheeler parking area as per
CMDA/ DTCP rules
Enclosed as Annexure
II
31
21. Calculation of water requirements for various purposes as
per CPHEEO guidelines.
Enclosed in
conceptual plan. 21
22. Details of Swimming pool if any: If so, details of water
consumption & its treatment.
No -
23. i) Details of generation & treatment of sewage during
construction & operation
ii) Design of STP & its location at the project site
marked in a map
Enclosed in
conceptual plan.
Enclosed as Annexure
IV
22
33-35
24. i) Mode of disposal of treated sewage during
construction & operation;
ii) Permission letter from the competent authority -
local body if sewage system available / PWD if
proposal to discharge into water body for
receiving the treated sewage if it disposed
outside.
During operational
phase treated sewage
water is reused for
gardening.
N.A.
-
-
25. Commitment letter from proponent that the treated sewage
water disposed for green belt development / avenue
plantation should not pollute the soil/ ground water /
adjacent canals /lakes/ponds, etc.
Enclosed 47
26. Method of calculation of quantity , Mode of collection ,
treatment & disposal of :
i) Solid waste including excavated earth, debris during
construction.
ii) Municipal Solid waste( Bio Degradable, non-
biodegradable , recyclable)
Construction debris
will be collected &
suitability used on site
as per construction
waste management
plan. Enclosed as Annexure
V.
-
36
27. Map showing details of the Duel plumping system, for toilet
flushing, with the detailed storage tank facilities proposed.
N.A. -
28. Green belt area as per CPCB guidelines minimum of 33 %
total area.
We will provide green
belt area as per CPCB
guidelines minimum
of 33 % total area.
-
29. Details of flood occurrence in area & authenticity certificate
from Revenue Officials; proposed measures in case of
occurrence of flood.
Will be submitted at
the earliest.
-
30. Details of Rain Water Harvesting, with numbers & area of
each harvesting bed.
Enclosed as Annexure
VI
36-37
31. Noise pollution control measures with size & numbers
proposed.
DG set will be
provided with suitable
acoustic enclosure to
minimize the noise.
-
32. Details of Stack height for Diesel generator sets, with
supporting calculations.
Enclosed as Annexure
VII
37
33. Energy Conservation Measures as per Energy Conservation
Building Code
Enclosed as Annexure
VIII
38
3
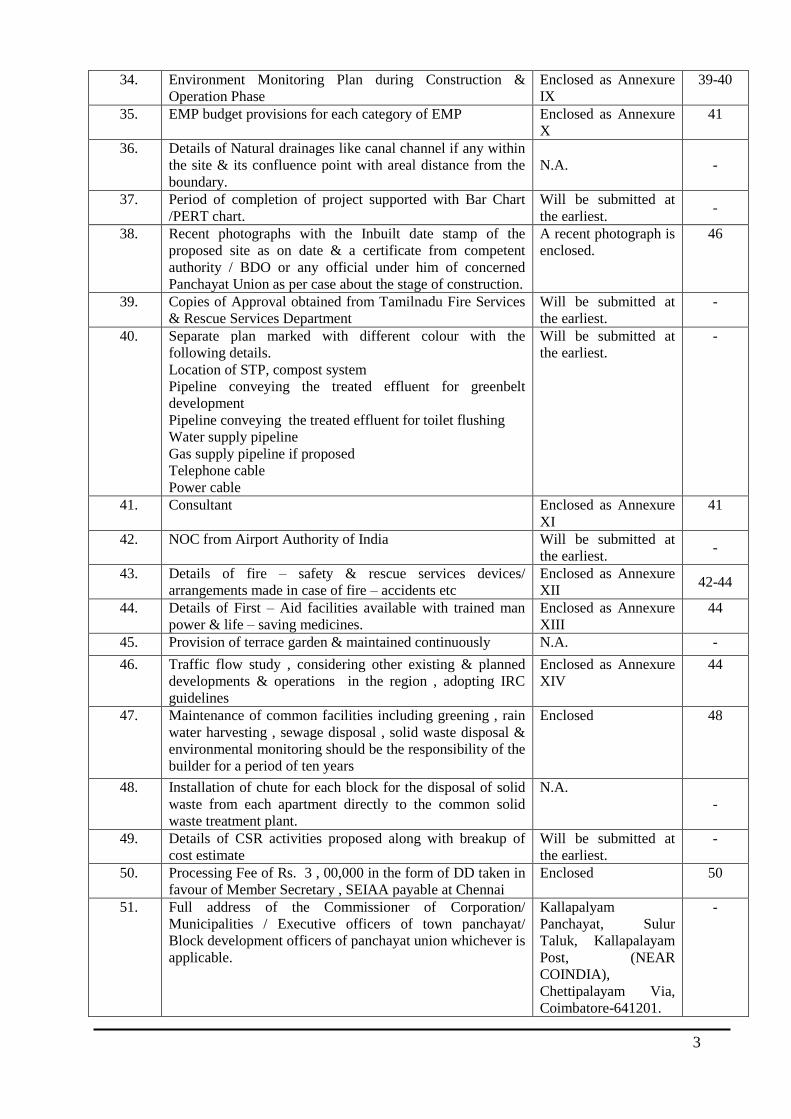
34. Environment Monitoring Plan during Construction &
Operation Phase
Enclosed as Annexure
IX
39-40
35. EMP budget provisions for each category of EMP Enclosed as Annexure
X
41
36. Details of Natural drainages like canal channel if any within
the site & its confluence point with areal distance from the
boundary.
N.A. -
37. Period of completion of project supported with Bar Chart
/PERT chart.
Will be submitted at
the earliest. -
38. Recent photographs with the Inbuilt date stamp of the
proposed site as on date & a certificate from competent
authority / BDO or any official under him of concerned
Panchayat Union as per case about the stage of construction.
A recent photograph is
enclosed.
46
39. Copies of Approval obtained from Tamilnadu Fire Services
& Rescue Services Department
Will be submitted at
the earliest.
-
40. Separate plan marked with different colour with the
following details.
Location of STP, compost system
Pipeline conveying the treated effluent for greenbelt
development
Pipeline conveying the treated effluent for toilet flushing
Water supply pipeline
Gas supply pipeline if proposed
Telephone cable
Power cable
Will be submitted at
the earliest.
-
41. Consultant Enclosed as Annexure
XI
41
42. NOC from Airport Authority of India Will be submitted at
the earliest. -
43. Details of fire – safety & rescue services devices/
arrangements made in case of fire – accidents etc
Enclosed as Annexure
XII 42-44
44. Details of First – Aid facilities available with trained man
power & life – saving medicines.
Enclosed as Annexure
XIII
44
45. Provision of terrace garden & maintained continuously N.A. -
46. Traffic flow study , considering other existing & planned
developments & operations in the region , adopting IRC
guidelines
Enclosed as Annexure
XIV
44
47. Maintenance of common facilities including greening , rain
water harvesting , sewage disposal , solid waste disposal &
environmental monitoring should be the responsibility of the
builder for a period of ten years
Enclosed 48
48. Installation of chute for each block for the disposal of solid
waste from each apartment directly to the common solid
waste treatment plant.
N.A.
-
49. Details of CSR activities proposed along with breakup of
cost estimate
Will be submitted at
the earliest.
-
50. Processing Fee of Rs. 3 , 00,000 in the form of DD taken in
favour of Member Secretary , SEIAA payable at Chennai
Enclosed 50
51. Full address of the Commissioner of Corporation/
Municipalities / Executive officers of town panchayat/
Block development officers of panchayat union whichever is
applicable.
Kallapalyam
Panchayat, Sulur
Taluk, Kallapalayam
Post, (NEAR
COINDIA),
Chettipalayam Via,
Coimbatore-641201.
-
4
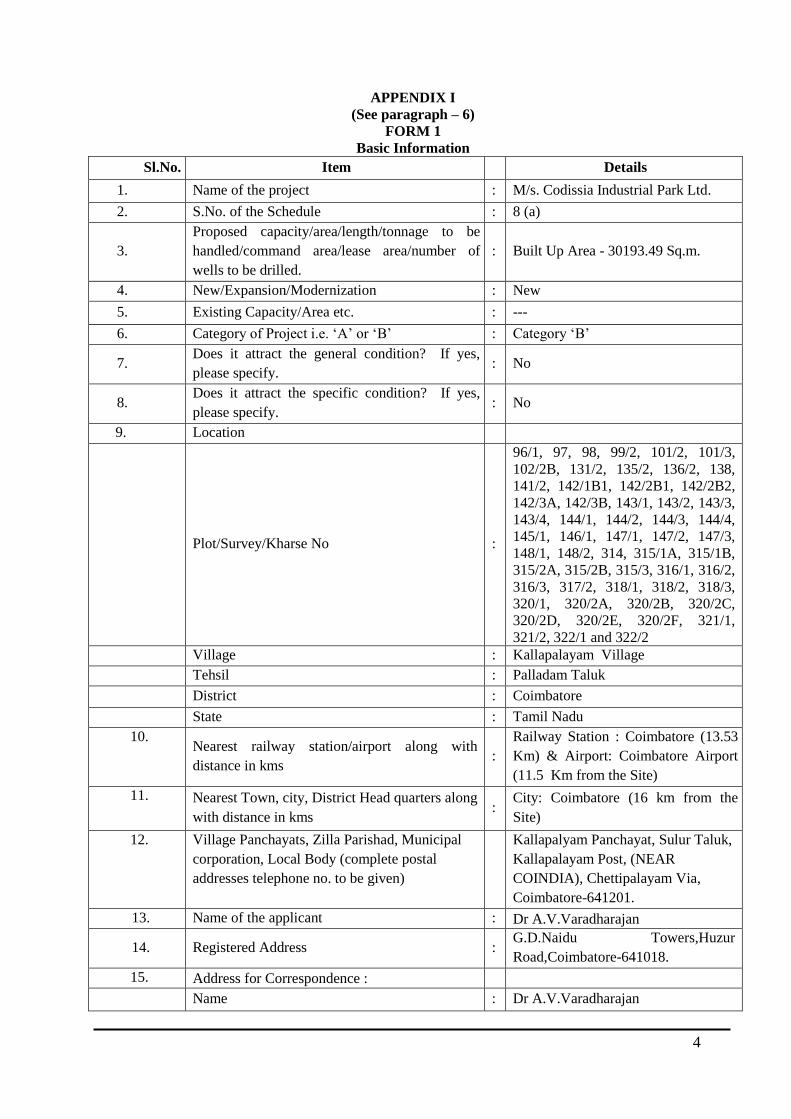
APPENDIX I
(See paragraph – 6)
FORM 1
Basic Information
Sl.No. Item Details
1. Name of the project : M/s. Codissia Industrial Park Ltd.
2. S.No. of the Schedule : 8 (a)
3.
Proposed capacity/area/length/tonnage to be
handled/command area/lease area/number of
wells to be drilled.
: Built Up Area - 30193.49 Sq.m.
4. New/Expansion/Modernization : New
5. Existing Capacity/Area etc. : ---
6. Category of Project i.e. „A‟ or „B‟ : Category „B‟
7. Does it attract the general condition? If yes,
please specify. : No
8. Does it attract the specific condition? If yes,
please specify. : No
9. Location
Plot/Survey/Kharse No :
96/1, 97, 98, 99/2, 101/2, 101/3,
102/2B, 131/2, 135/2, 136/2, 138,
141/2, 142/1B1, 142/2B1, 142/2B2,
142/3A, 142/3B, 143/1, 143/2, 143/3,
143/4, 144/1, 144/2, 144/3, 144/4,
145/1, 146/1, 147/1, 147/2, 147/3,
148/1, 148/2, 314, 315/1A, 315/1B,
315/2A, 315/2B, 315/3, 316/1, 316/2,
316/3, 317/2, 318/1, 318/2, 318/3,
320/1, 320/2A, 320/2B, 320/2C,
320/2D, 320/2E, 320/2F, 321/1,
321/2, 322/1 and 322/2
Village : Kallapalayam Village
Tehsil : Palladam Taluk
District : Coimbatore
State : Tamil Nadu
10. Nearest railway station/airport along with
distance in kms :
Railway Station : Coimbatore (13.53
Km) & Airport: Coimbatore Airport
(11.5 Km from the Site)
11. Nearest Town, city, District Head quarters along
with distance in kms :
City: Coimbatore (16 km from the
Site)
12. Village Panchayats, Zilla Parishad, Municipal
corporation, Local Body (complete postal
addresses telephone no. to be given)
Kallapalyam Panchayat, Sulur Taluk,
Kallapalayam Post, (NEAR
COINDIA), Chettipalayam Via,
Coimbatore-641201.
13. Name of the applicant : Dr A.V.Varadharajan
14. Registered Address : G.D.Naidu Towers,Huzur
Road,Coimbatore-641018.
15. Address for Correspondence :
Name : Dr A.V.Varadharajan
5
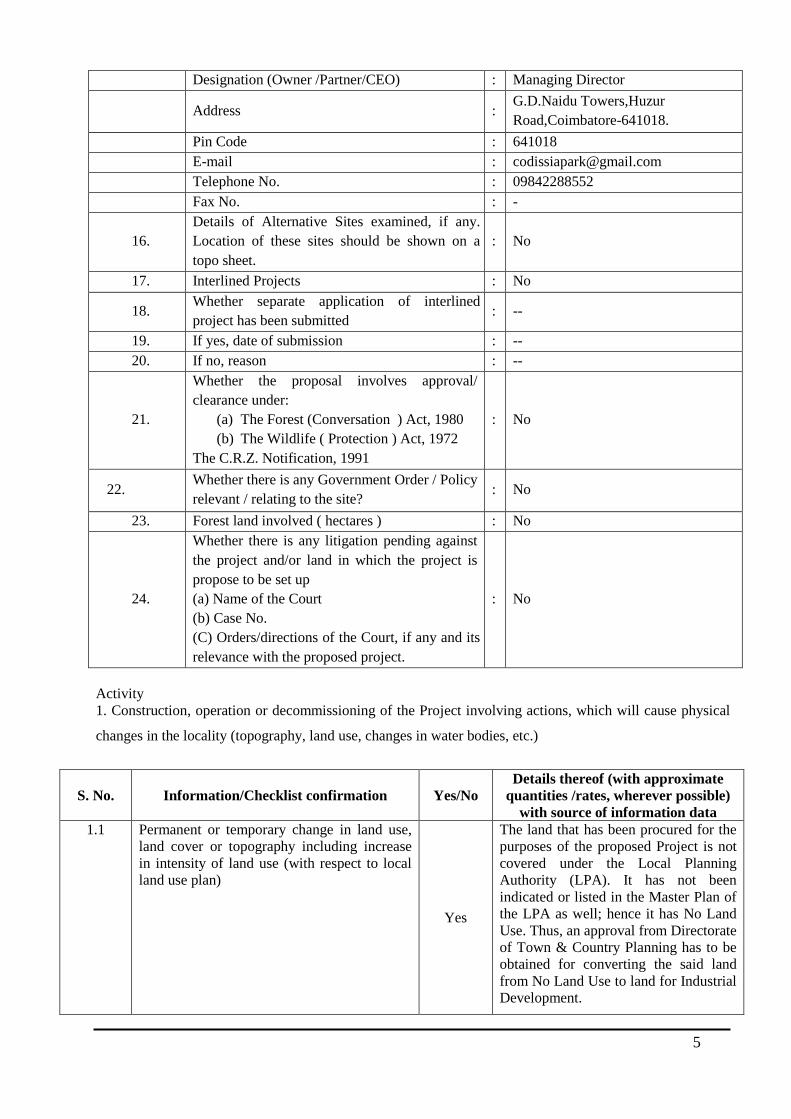
Designation (Owner /Partner/CEO) : Managing Director
Address :
G.D.Naidu Towers,Huzur
Road,Coimbatore-641018.
Pin Code : 641018
E-mail : [email protected]
Telephone No. : 09842288552
Fax No. : -
16.
Details of Alternative Sites examined, if any.
Location of these sites should be shown on a
topo sheet.
: No
17. Interlined Projects : No
18. Whether separate application of interlined
project has been submitted : --
19. If yes, date of submission : --
20. If no, reason : --
21.
Whether the proposal involves approval/
clearance under:
(a) The Forest (Conversation ) Act, 1980
(b) The Wildlife ( Protection ) Act, 1972
The C.R.Z. Notification, 1991
: No
22. Whether there is any Government Order / Policy
relevant / relating to the site? : No
23. Forest land involved ( hectares ) : No
24.
Whether there is any litigation pending against
the project and/or land in which the project is
propose to be set up
(a) Name of the Court
(b) Case No.
(C) Orders/directions of the Court, if any and its
relevance with the proposed project.
: No
Activity
1. Construction, operation or decommissioning of the Project involving actions, which will cause physical
changes in the locality (topography, land use, changes in water bodies, etc.)
S. No. Information/Checklist confirmation Yes/No
Details thereof (with approximate
quantities /rates, wherever possible)
with source of information data
1.1 Permanent or temporary change in land use,
land cover or topography including increase
in intensity of land use (with respect to local
land use plan)
Yes
The land that has been procured for the
purposes of the proposed Project is not
covered under the Local Planning
Authority (LPA). It has not been
indicated or listed in the Master Plan of
the LPA as well; hence it has No Land
Use. Thus, an approval from Directorate
of Town & Country Planning has to be
obtained for converting the said land
from No Land Use to land for Industrial
Development.
6
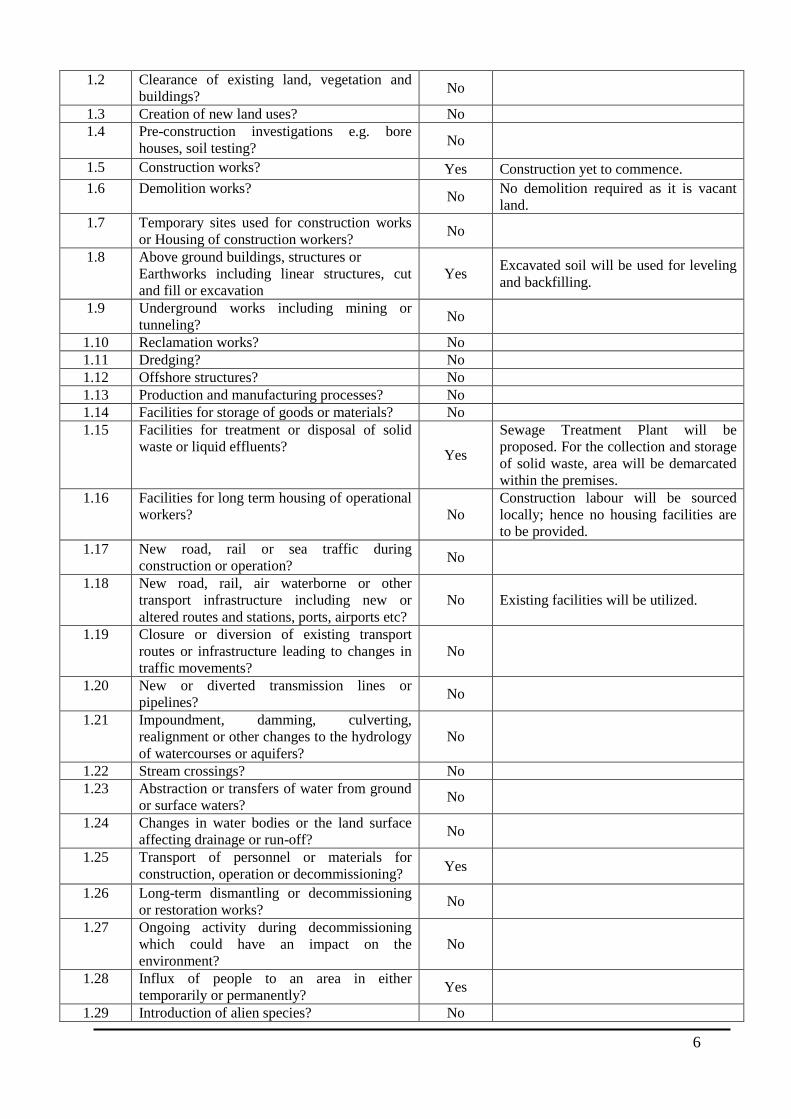
1.2 Clearance of existing land, vegetation and
buildings? No
1.3 Creation of new land uses? No
1.4 Pre-construction investigations e.g. bore
houses, soil testing? No
1.5 Construction works? Yes Construction yet to commence.
1.6 Demolition works? No
No demolition required as it is vacant
land.
1.7 Temporary sites used for construction works
or Housing of construction workers? No
1.8 Above ground buildings, structures or
Earthworks including linear structures, cut
and fill or excavation
Yes Excavated soil will be used for leveling
and backfilling.
1.9 Underground works including mining or
tunneling? No
1.10 Reclamation works? No
1.11 Dredging? No
1.12 Offshore structures? No
1.13 Production and manufacturing processes? No
1.14 Facilities for storage of goods or materials? No
1.15 Facilities for treatment or disposal of solid
waste or liquid effluents? Yes
Sewage Treatment Plant will be
proposed. For the collection and storage
of solid waste, area will be demarcated
within the premises.
1.16 Facilities for long term housing of operational
workers? No
Construction labour will be sourced
locally; hence no housing facilities are
to be provided.
1.17 New road, rail or sea traffic during
construction or operation? No
1.18 New road, rail, air waterborne or other
transport infrastructure including new or
altered routes and stations, ports, airports etc?
No Existing facilities will be utilized.
1.19 Closure or diversion of existing transport
routes or infrastructure leading to changes in
traffic movements?
No
1.20 New or diverted transmission lines or
pipelines? No
1.21 Impoundment, damming, culverting,
realignment or other changes to the hydrology
of watercourses or aquifers?
No
1.22 Stream crossings? No
1.23 Abstraction or transfers of water from ground
or surface waters? No
1.24 Changes in water bodies or the land surface
affecting drainage or run-off? No
1.25 Transport of personnel or materials for
construction, operation or decommissioning? Yes
1.26 Long-term dismantling or decommissioning
or restoration works? No
1.27 Ongoing activity during decommissioning
which could have an impact on the
environment?
No
1.28 Influx of people to an area in either
temporarily or permanently? Yes
1.29 Introduction of alien species? No
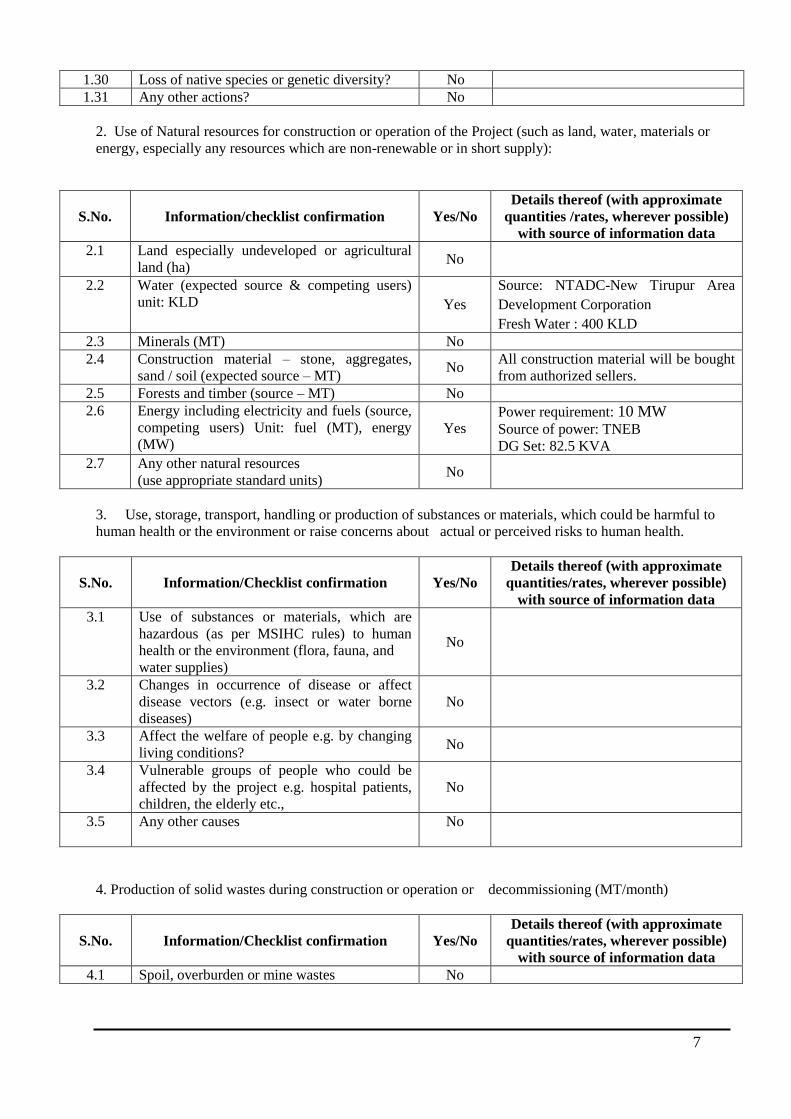
7
1.30 Loss of native species or genetic diversity? No
1.31 Any other actions? No
2. Use of Natural resources for construction or operation of the Project (such as land, water, materials or
energy, especially any resources which are non-renewable or in short supply):
S.No.
Information/checklist confirmation
Yes/No
Details thereof (with approximate
quantities /rates, wherever possible)
with source of information data
2.1 Land especially undeveloped or agricultural
land (ha) No
2.2 Water (expected source & competing users)
unit: KLD Yes
Source: NTADC-New Tirupur Area
Development Corporation
Fresh Water : 400 KLD
2.3 Minerals (MT) No
2.4 Construction material – stone, aggregates,
sand / soil (expected source – MT) No
All construction material will be bought
from authorized sellers.
2.5 Forests and timber (source – MT) No
2.6 Energy including electricity and fuels (source,
competing users) Unit: fuel (MT), energy
(MW) Yes
Power requirement: 10 MW
Source of power: TNEB
DG Set: 82.5 KVA
2.7 Any other natural resources
(use appropriate standard units) No
3. Use, storage, transport, handling or production of substances or materials, which could be harmful to
human health or the environment or raise concerns about actual or perceived risks to human health.
S.No. Information/Checklist confirmation Yes/No
Details thereof (with approximate
quantities/rates, wherever possible)
with source of information data
3.1 Use of substances or materials, which are
hazardous (as per MSIHC rules) to human
health or the environment (flora, fauna, and
water supplies)
No
3.2 Changes in occurrence of disease or affect
disease vectors (e.g. insect or water borne
diseases)
No
3.3 Affect the welfare of people e.g. by changing
living conditions? No
3.4 Vulnerable groups of people who could be
affected by the project e.g. hospital patients,
children, the elderly etc.,
No
3.5 Any other causes No
4. Production of solid wastes during construction or operation or decommissioning (MT/month)
S.No. Information/Checklist confirmation Yes/No
Details thereof (with approximate
quantities/rates, wherever possible)
with source of information data
4.1 Spoil, overburden or mine wastes No
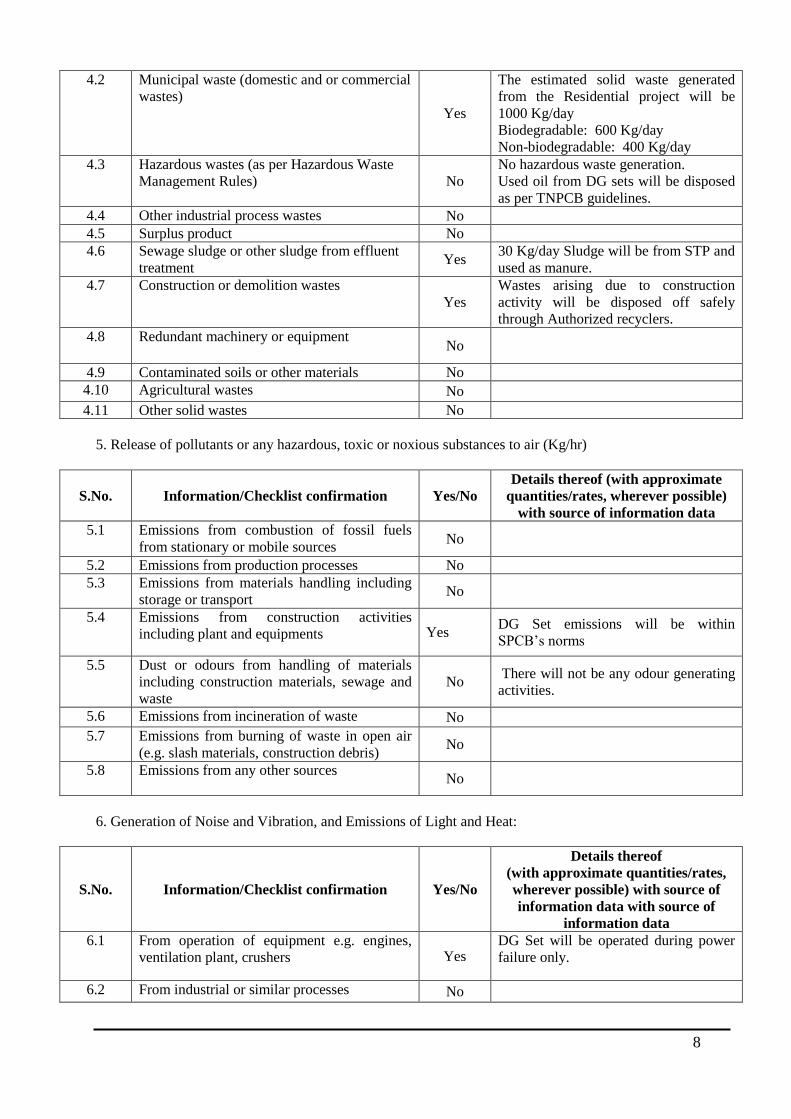
8
4.2 Municipal waste (domestic and or commercial
wastes)
Yes
The estimated solid waste generated
from the Residential project will be
1000 Kg/day
Biodegradable: 600 Kg/day
Non-biodegradable: 400 Kg/day
4.3 Hazardous wastes (as per Hazardous Waste
Management Rules) No
No hazardous waste generation.
Used oil from DG sets will be disposed
as per TNPCB guidelines.
4.4 Other industrial process wastes No
4.5 Surplus product No
4.6 Sewage sludge or other sludge from effluent
treatment Yes
30 Kg/day Sludge will be from STP and
used as manure.
4.7 Construction or demolition wastes
Yes
Wastes arising due to construction
activity will be disposed off safely
through Authorized recyclers.
4.8 Redundant machinery or equipment No
4.9 Contaminated soils or other materials No
4.10 Agricultural wastes No
4.11 Other solid wastes No
5. Release of pollutants or any hazardous, toxic or noxious substances to air (Kg/hr)
S.No. Information/Checklist confirmation Yes/No
Details thereof (with approximate
quantities/rates, wherever possible)
with source of information data
5.1 Emissions from combustion of fossil fuels
from stationary or mobile sources No
5.2 Emissions from production processes No
5.3 Emissions from materials handling including
storage or transport No
5.4 Emissions from construction activities
including plant and equipments Yes DG Set emissions will be within
SPCB‟s norms
5.5 Dust or odours from handling of materials
including construction materials, sewage and
waste
No There will not be any odour generating
activities.
5.6 Emissions from incineration of waste No
5.7 Emissions from burning of waste in open air
(e.g. slash materials, construction debris) No
5.8 Emissions from any other sources
No
6. Generation of Noise and Vibration, and Emissions of Light and Heat:
S.No. Information/Checklist confirmation Yes/No
Details thereof
(with approximate quantities/rates,
wherever possible) with source of
information data with source of
information data
6.1 From operation of equipment e.g. engines,
ventilation plant, crushers Yes DG Set will be operated during power
failure only.
6.2 From industrial or similar processes No
9
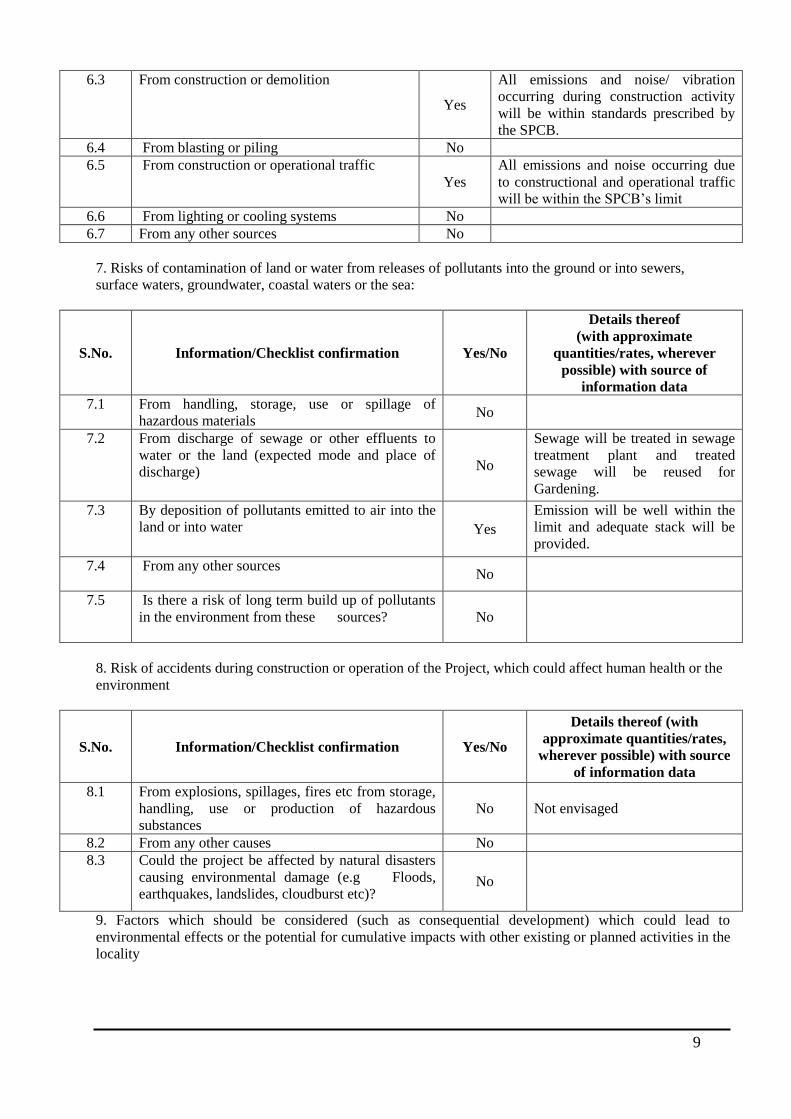
6.3 From construction or demolition
Yes
All emissions and noise/ vibration
occurring during construction activity
will be within standards prescribed by
the SPCB.
6.4 From blasting or piling No
6.5 From construction or operational traffic
Yes
All emissions and noise occurring due
to constructional and operational traffic
will be within the SPCB‟s limit
6.6 From lighting or cooling systems No
6.7 From any other sources No
7. Risks of contamination of land or water from releases of pollutants into the ground or into sewers,
surface waters, groundwater, coastal waters or the sea:
S.No. Information/Checklist confirmation Yes/No
Details thereof
(with approximate
quantities/rates, wherever
possible) with source of
information data
7.1 From handling, storage, use or spillage of
hazardous materials No
7.2 From discharge of sewage or other effluents to
water or the land (expected mode and place of
discharge) No
Sewage will be treated in sewage
treatment plant and treated
sewage will be reused for
Gardening.
7.3 By deposition of pollutants emitted to air into the
land or into water Yes
Emission will be well within the
limit and adequate stack will be
provided.
7.4 From any other sources
No
7.5 Is there a risk of long term build up of pollutants
in the environment from these sources?
No
8. Risk of accidents during construction or operation of the Project, which could affect human health or the
environment
S.No. Information/Checklist confirmation Yes/No
Details thereof (with
approximate quantities/rates,
wherever possible) with source
of information data
8.1 From explosions, spillages, fires etc from storage,
handling, use or production of hazardous
substances
No
Not envisaged
8.2 From any other causes No
8.3 Could the project be affected by natural disasters
causing environmental damage (e.g Floods,
earthquakes, landslides, cloudburst etc)? No
9. Factors which should be considered (such as consequential development) which could lead to
environmental effects or the potential for cumulative impacts with other existing or planned activities in the
locality
10
S. No. Information/Checklist confirmation Yes/No
Details thereof (with
approximate quantities/rates,
wherever possible) with source
of information data
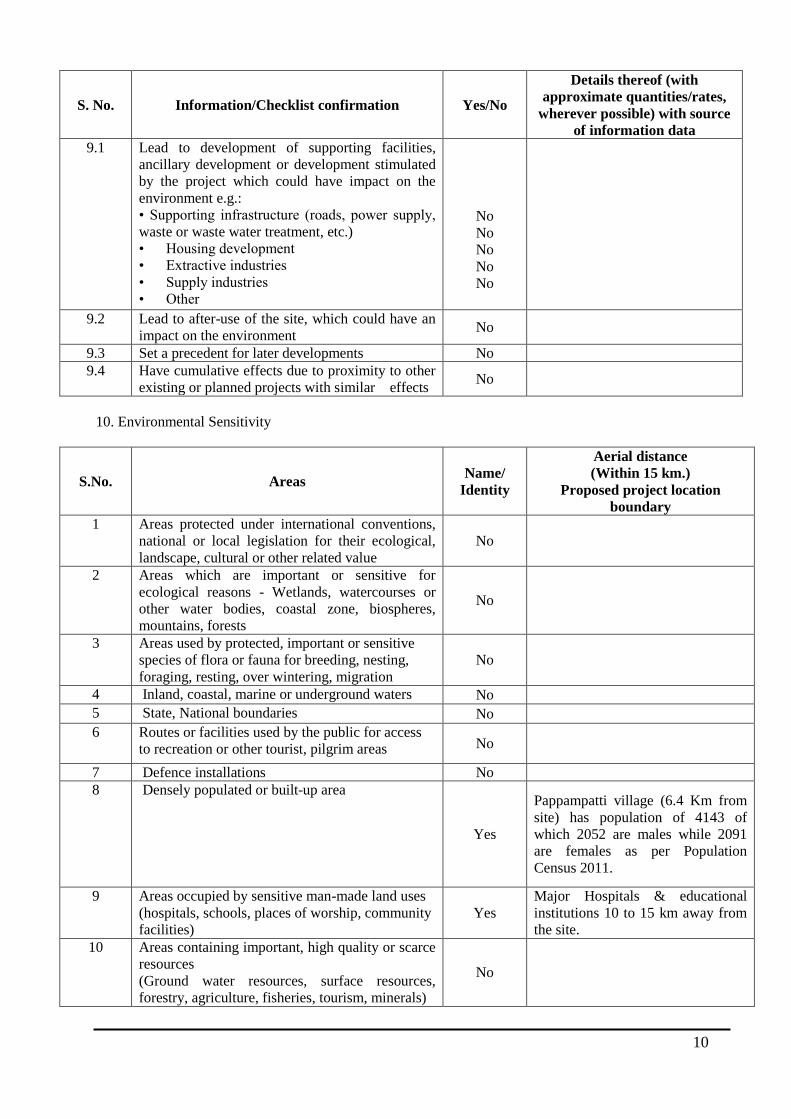
9.1 Lead to development of supporting facilities,
ancillary development or development stimulated
by the project which could have impact on the
environment e.g.:
• Supporting infrastructure (roads, power supply,
waste or waste water treatment, etc.)
• Housing development
• Extractive industries
• Supply industries
• Other
No
No
No
No
No
9.2 Lead to after-use of the site, which could have an
impact on the environment No
9.3 Set a precedent for later developments No
9.4 Have cumulative effects due to proximity to other
existing or planned projects with similar effects No
10. Environmental Sensitivity
S.No. Areas Name/
Identity
Aerial distance
(Within 15 km.)
Proposed project location
boundary
1 Areas protected under international conventions,
national or local legislation for their ecological,
landscape, cultural or other related value
No
2 Areas which are important or sensitive for
ecological reasons - Wetlands, watercourses or
other water bodies, coastal zone, biospheres,
mountains, forests
No
3 Areas used by protected, important or sensitive
species of flora or fauna for breeding, nesting,
foraging, resting, over wintering, migration
No
4 Inland, coastal, marine or underground waters No
5 State, National boundaries
No
6 Routes or facilities used by the public for access
to recreation or other tourist, pilgrim areas No
7 Defence installations No
8 Densely populated or built-up area
Yes
Pappampatti village (6.4 Km from
site) has population of 4143 of
which 2052 are males while 2091
are females as per Population
Census 2011.
9 Areas occupied by sensitive man-made land uses
(hospitals, schools, places of worship, community
facilities)
Yes
Major Hospitals & educational
institutions 10 to 15 km away from
the site.
10 Areas containing important, high quality or scarce
resources
(Ground water resources, surface resources,
forestry, agriculture, fisheries, tourism, minerals)
No
11
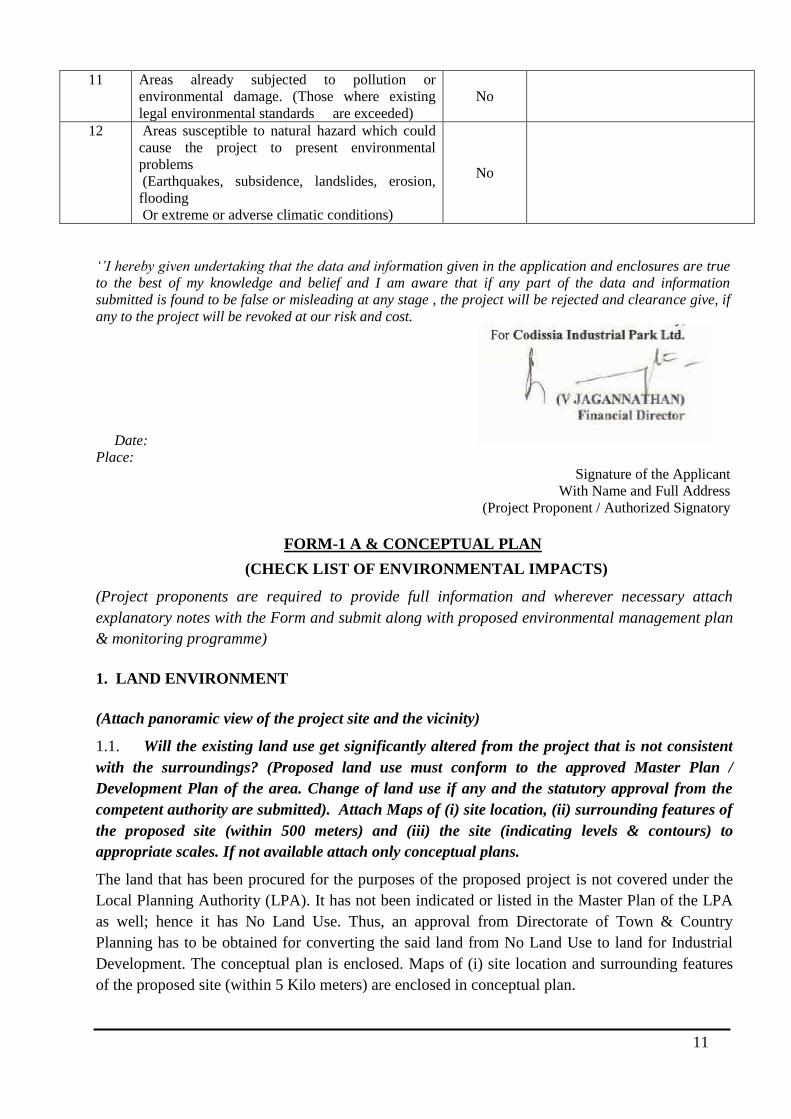
11 Areas already subjected to pollution or
environmental damage. (Those where existing
legal environmental standards are exceeded)
No
12 Areas susceptible to natural hazard which could
cause the project to present environmental
problems
(Earthquakes, subsidence, landslides, erosion,
flooding
Or extreme or adverse climatic conditions)
No
‘’I hereby given undertaking that the data and information given in the application and enclosures are true
to the best of my knowledge and belief and I am aware that if any part of the data and information
submitted is found to be false or misleading at any stage , the project will be rejected and clearance give, if
any to the project will be revoked at our risk and cost.
Date:
Place:
Signature of the Applicant
With Name and Full Address
(Project Proponent / Authorized Signatory
FORM-1 A & CONCEPTUAL PLAN
(CHECK LIST OF ENVIRONMENTAL IMPACTS)
(Project proponents are required to provide full information and wherever necessary attach
explanatory notes with the Form and submit along with proposed environmental management plan
& monitoring programme)
1. LAND ENVIRONMENT
(Attach panoramic view of the project site and the vicinity)
1.1. Will the existing land use get significantly altered from the project that is not consistent
with the surroundings? (Proposed land use must conform to the approved Master Plan /
Development Plan of the area. Change of land use if any and the statutory approval from the
competent authority are submitted). Attach Maps of (i) site location, (ii) surrounding features of
the proposed site (within 500 meters) and (iii) the site (indicating levels & contours) to
appropriate scales. If not available attach only conceptual plans.
The land that has been procured for the purposes of the proposed project is not covered under the
Local Planning Authority (LPA). It has not been indicated or listed in the Master Plan of the LPA
as well; hence it has No Land Use. Thus, an approval from Directorate of Town & Country
Planning has to be obtained for converting the said land from No Land Use to land for Industrial
Development. The conceptual plan is enclosed. Maps of (i) site location and surrounding features
of the proposed site (within 5 Kilo meters) are enclosed in conceptual plan.
12
1.2. List out all the major project requirements in terms of the land area, built up area, water
consumption, power requirement, connectivity, community facilities, parking needs etc.
The project requirements for the proposed project are:
Total site area : 643704.02 Sq. m
Build Up Area : 30193.49 Sq.m
Water consumption : 400 KLD
Power requirements : 10 MW from TNEB
Parking needs : 32186.70 Sq.m
1.3. What are the likely impacts of the proposed activity on the existing facilities adjacent to the
proposed site? (Such as open spaces, community facilities, details of the existing land use,
disturbance to the local ecology).
The proposed project is likely to attract commercial activity such as hotels, utilities and stationary
shops during the construction phase and operation phase. These activities are expected to have a
positive socio-economic impact on the local population. No significant negative impacts are likely.
1.4. Will there be any significant land disturbance resulting in erosion, subsidence &
instability? (Details of soil type, slope analysis, vulnerability to subsidence, seismicity etc may
be given).
There is no significant land disturbance resulting in erosion, subsidence and instability. The project
site, as can be seen from the topographic survey map mostly plain so there will not be any
significant land disturbance.
1.5. Will the proposal involve alteration of natural drainage systems? (Give details on a
contour map showing the natural drainage near the proposed project site)
The natural drainage system will not be altered in any way due to the proposed project.
1.6. What are the quantities of earthwork involved in the construction activity-cutting, filling,
reclamation etc. (Give details of the quantities of earthwork involved, transport of fill
materials from outside the site etc.)
As the site is relatively flat with negligible contour level difference compared to the total extent of
the site the cutting quantities are not recognizable. There will be excavations for the proposed
column foundations, the soil excavated will be used for back filling.
1.7. Give details regarding water supply, waste handling etc during the construction period.
The requirement during construction will be met NTADC-New Tirupur Area Development
Corporation. The construction waste will be disposed off regularly as suggested by authorized
recyclers.
13
1.8. Will the low lying areas & wetlands get altered? (Provide details of how low lying and
wetlands are getting modified from the proposed activity)
The proposed design plans will not affect the outside drainage patterns. The storm water from the
land will be utilized for greenbelt or drain to the nearest drainage system.
1.9. Whether construction debris & waste during construction cause health hazard? (Give
quantities of various types of wastes generated during construction including the construction
labour and the means of disposal)
No, the construction waste will not cause any health hazard. Construction debris will be collected
and suitability used on site as per construction waste management plan. And will be safely
disposed off by the authorized recyclers.
2. WATER ENVIRONMENT
2.1. Give the total quantity of water requirement for the proposed project with the breakup
of requirements for various uses. How will the water requirement met? State the sources &
quantities and furnish a water balance statement.
Water requirement for the project site is expected to be sourced from the existing NTADCL /
TWAD line shall be examined, to ensure continuous water supply. The total water requirement for
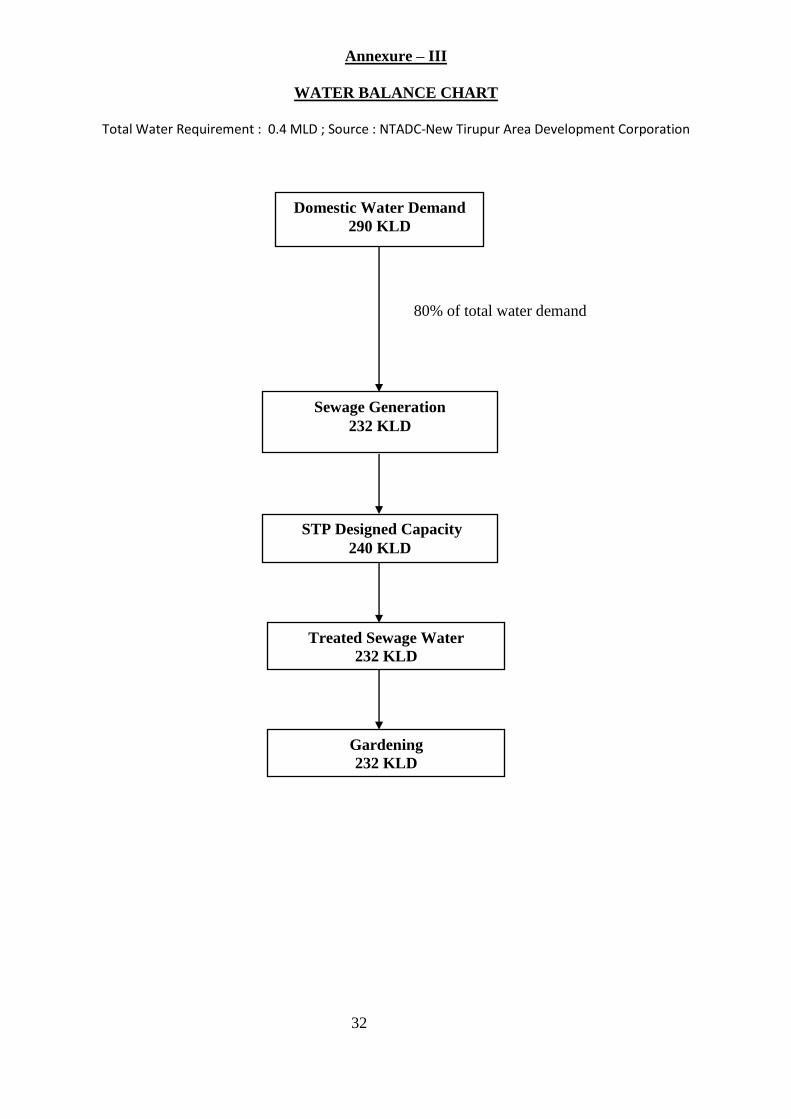
the project will be about 400 KLD. Water balance chart is given in Annexure – III.
2.2. What is the capacity (dependable flow or yield) of the proposed source of water?
The 400 KLD water demand will be met from the existing NTADCL / TWAD line shall be
examined, to ensure continuous water supply.
2.3. What is the quality of water required, in case, the supply is not from a municipal source?
(Provide physical, chemical, biological characteristics with class of water quality)
290 KLD will be required for domestic use; water will be sourced from the existing NTADCL /
TWAD line shall be examined, to ensure continuous water supply.
2.4. How much of the water requirement can be met from the recycling of treated
wastewater? (Give the details of quantities, sources and usage)
The treated sewage water of capacity 232 KLD will be used for gardening.
2.5. Will there be diversion of water from other users? (Please assess the impacts of the
project on other existing uses and quantities of consumption)
There will be no water diversion from other users.
2.6. What is the incremental pollution load from wastewater generated from the proposed
activity? (Give details of the quantities and composition of wastewater generated from the
proposed activity)
The wastewater generated from the project site will be sent to sewage treatment plant. Based on
general domestic wastewater characteristics, the BOD and COD concentrations in the wastewater
14
are expected to be in the range of 300-350 mg/L and 100-150 mg/L respectively.
2.7. Give details of the water requirements met from water harvesting? Furnish details of the
facilities created.
Through water harvesting ground water levels will be improved. The details about the rain water
harvesting plans are enclosed as Annexure – VI.
2.8. What would be the impact of the land use changes occurring due to the proposed project
on the runoff characteristics (quantitative as well as qualitative) of the area in the post
construction phase on a long term basis? Would it aggravate the problems of flooding or
water logging in any way?
The proposed project will not have any impact on the run off characteristics of the area.
2.9. What are the impacts of the proposal on the ground water? (Will there be tapping of
ground water; give the details of ground water table, recharging capacity, and approvals
obtained from competent authority, if any)
In this proposed project activity the water for the domestic uses will be sourced from the existing
NTADCL / TWAD line shall be examined, to ensure continuous water supply. Bore water will not
be extracted for the domestic and other process. So there will be no impact on the ground water.
Rain water harvesting will be implemented effectively to recharge ground water level.
2.10. What precautions/measures are taken to prevent the run-off from construction activities
polluting land & aquifers? (Give details of quantities and the measures taken to avoid the
adverse impacts)
Storm water drains will be provided along the internal roads of the site to meet the expected
increase in the runoff during the rainy season due to the impervious nature of the roof, roads and
other paved areas. In addition, all roof water will be collected and discharged into specially
designed rain water harvesting facilities.
2.11. How is the storm water from within the site managed?(State the provisions made to
avoid flooding of the area, details of the drainage facilities provided along with a site layout
indication contour levels)
As detailed, Storm water is proposed to be disposed off through percolation pit / utilized by green
belt, which are proposed to be constructed all around the complex.
2.12. Will the deployment of construction laborers particularly in the peak period lead to
unsanitary conditions around the project site (Justify with proper explanation)
No. construction labors will be hired locally and no temporary housing facility is proposed hence
not leading to any unsanitary conditions around the project site.
2.13. What on-site facilities are provided for the collection, treatment & safe disposal of
sewage? (Give details of the quantities of wastewater generation, treatment capacities with
technology & facilities for recycling and disposal)
Sewage treatment plant of capacity 240 KLD will be proposed to treat the sewage (232 KLD)
generated from the project site. Treated sewage water (232 KLD) will be reused for gardening.
15
2.14. Give details of dual plumbing system if treated waste used is used for flushing of toilets
or any other use.
Treated sewage water is used for gardening only, hence no requirement for dual plumbing system.
3. VEGETATION
3.1. Is there any threat of the project to the biodiversity? (Give a description of the local
ecosystem with its unique features, if any)
The proposed project does not affect the local ecosystem. The project site is located in an area
where only barren dry lands are present. No animals are seen in the area surrounding the site.
3.2. Will the construction involve extensive clearing or modification of vegetation? (Provide
a detailed account of the trees & vegetation affected by the project)
In the vicinity of the proposed project site there are no big trees are present. The present project site
is vacant and no sight of trees in the surroundings.
4. FAUNA
4.1. Is there likely to be any displacement of fauna- both terrestrial and aquatic or creation of
barriers for their movement? Provide the details.
The location for the proposed project is a vacant land; no fauna will be disturbed due to the
proposed project.
4.2. Any direct or indirect impacts on the avifauna of the area? Provide details.
No, there are no direct or indirect impacts on the avifauna of the area.
4.3. Prescribe measures such as corridors, fish ladders etc to mitigate adverse impacts on
fauna
There will not be adverse impacts on fauna by the proposed project and so the above said measures
are not required.
5. AIR ENVIRONMENT
5.1. Will the project increase atmospheric concentration of gases & result in heat islands?
(Give details of background air quality levels with predicted values based on dispersion
models taking into account the increased traffic generation as a result of the proposed
constructions)
The proposed project is a construction of Industrial Park project. There will be no emissions from
the proposed project. There will be a slight increase in the vehicular traffic, which might result to a
slight increase in pollution. However emissions would be well within the TNPCB limits.
16
5.2. What are the impacts on generation of dust, smoke, odorous fumes or other hazardous
gases? Give details in relation to all the meteorological parameters.
No hazardous gases are produced due to proposed construction. There will be a slight increase in
the vehicular traffic, which might result to a slight increase in dust, smoke etc.
5.3. Will the proposal create shortage of parking space for vehicles? Furnish details of the
present level of transport infrastructure and measures proposed for improvement including
the traffic management at the entry & exit to the project site.
The proposed project has planned to provide 100% parking facilities for all the vehicles in the open
space. Adequate measures will be taken to efficiently manage the traffic at the entry and exit of the
site.
5.4. Provide details of the movement patterns with internal roads, bicycle tracks, pedestrian
pathways, footpaths etc., with areas under each category.
The parking details are shown in the project layout map. The parking details are enclosed in
Annexure – II.
5.5. Will there be significant increase in traffic noise & vibrations? Give details of the sources
and the measures proposed for mitigation of the above.
Due to the proposed construction project there will be a slight vehicular traffic noise & vibrations
will be resulted and the impact by the same will be reduced by planting trees etc.
5.6. What will be the impact of DG sets & other equipment on noise levels & vibration in &
ambient air quality around the project site? Provide details.
For this project, DG set of capacity of 82.5 KVA (1 No) will be used. As per the prevailing
norms the DG sets will be covered with acoustic enclosures to reduce the noise levels. Emission of
heat and smoke is vented out through stack as per norms from statutory body.
6. AESTHETICS
6.1. Will the proposed constructions in any way result in the obstruction of a view, scenic
amenity or landscapes? Are these considerations taken into account by the proponents?
The proposed project does not obstruct any scenic view.
6.2. Will there be any adverse impacts from new constructions on the existing structures?
What are the considerations taken into account?
With the development of the proposed project there will not be adverse impacts on the surrounding area.
6.3. Whether there are any local considerations of urban form & urban design influencing
the design criteria? They may be explicitly spelt out.
17
All norms on ground coverage, FAR, height, setbacks, structural design, and other parameters will be
strictly followed.
6.4. Are there any anthropological or archaeological sites or artifacts nearby? State if any
other significant features in the vicinity of the proposed site have been considered.
There are no such sites located in the vicinity of the proposed project site.
7. SOCIO-ECONOMIC ASPECTS
7.1. Will the proposal result in any changes to the demographic structure of local population?
Provide the details.
With the proposed project there will be an inflow of population into the area. During construction
phase of the project, this project will provide temporary employment to many unskilled and semi-
skilled laborers in nearby areas. This project will also help in generation of indirect employment to
those people who render their services for the personnel directly working in the project. Thus the
direct and indirect employment generation by this project will be a positive socio-economic
development in the surroundings of the project area. The socio-economic development in the
region will lead for enhancement of quality of life of people in the region.
7.2. Give details of the existing social infrastructure around the proposed project.
Some Industrial/residential development is seen in the surrounding of the project site.
7.3. Will the project cause adverse effects on local communities, disturbance to sacred sites or
other cultural values? What are the safeguards proposed?
No such effects will be caused on the local communities due to proposed project.
8. BUILDING MATERIALS
8.1. May involve the use of building materials with high-embodied energy. Are the
construction materials produced with energy efficient processes? (Give details of energy
conservation measures in the selection of building materials and their energy efficiency)
The proposed project is designed and developed based on energy conservation concept Energy
Conservation Measures enclosed as Annexure VIII.
8.2. Transport and handling of materials during construction may result in pollution, noise &
public nuisance. What measures are taken to minimize the impacts?
The transport and handling of material will result in pollution to the nearby areas but they will still
be within the permissible limits of residential/commercial areas. To minimize the impacts of
pollution the construction materials are proposed to be transported to the site during non peak hours
reducing noise, traffic & public nuisance.
18
8.3. Are recycled materials used in roads and structures? State the extent of savings
achieved?
Recycled materials like fly ash bricks and hollow blocks are proposed to be used for this project.
8.4. Give details of the methods of collection, segregation & disposal of the garbage generated
during the operation phases of the project.
For biodegradable wastes, composting method/buyers is proposed and the non biodegradable
wastes are disposed off through authorized recyclers.
9. ENERGY CONSERVATION
9.1. Give details of the power requirements, source of supply, backup source etc. What is the
energy consumption assumed per square foot of built-up area? How have you tried to
minimize energy consumption?
The estimated power requirement for the site is a maximum of 10 MW and this will be sourced
from TNEB.
9.2. What type of, and capacity of, power back-up to you plan to provide?
Power backup through diesel generator set of capacity 82.5 KVA (1 No.) will be provided for
essential services.
9.3. What are the characteristics of the glass you plan to use? Provide specifications of its
characteristics related to both short wave and long wave radiation?
Normal glass of 5mm thick will be used for windows and pin head 4mm thick glass for ventilators
will be used.
9.4. What passive solar architectural features are being used in the building? Illustrate the
applications made in the proposed project.
Solar street lights are proposed to reduce the power consumption.
9.5. Does the layout of streets & buildings maximize the potential for solar energy devices?
Have you considered the use of street lighting, emergency lighting and solar hot water
systems for use in the building complex? Substantiate with details.
Yes, solar energy systems will be used.
9.6. Is shading effectively used to reduce cooling/heating loads? What principles have been
used to maximize the shading of Walls on the East and the West and the Roof? How much
energy saving has been effected?
Insulated sheet cladding will be provided to reduce the heat ingress inside the building.
19
9.7. Do the structures use energy-efficient space conditioning, lighting and mechanical
systems? Provide technical details. Provide details of the transformers and motor efficiencies,
lighting intensity and air-conditioning load assumptions? Are you using CFC and HCFC free
chillers? Provide specifications.
The proposed project is designed and developed based on maximum energy efficient concept,
so all necessary arrangements will be made.
9.8. What are the likely effects of the building activity in altering the micro-climates? Provide
a self assessment on the likely impacts of the proposed construction on creation of heat island
& inversion effects?
As the proposed project is a construction of Industrial Park project, no such effects will be
created on the environment.
9.9. What are the thermal characteristics of the building envelope? (a) roof; (b) external
walls; and (c) fenestration? Give details of the material used and the U-values or the R values
of the individual components.
All the characteristics and properties of the material will be adhered to National building code
2005 codes.
9.10. What precautions & safety measures are proposed against fire hazards? Furnish details
of emergency plans.
As per local building norms and regulations of NBC the fire safety precautions are proposed.
9.11. If you are using glass as wall material provides details and specifications including
emissivity and thermal characteristics.
Glass is not used as wall material.
10. ENVIRONMENT MANAGEMENT PLAN
The Environment Management Plan would consist of all mitigation measures for each item wise
activity to be undertaken during the construction, operation and the entire life cycle to minimize
adverse environmental impacts as a result of the activities of the project. It would also delineate
the environmental monitoring plan for compliance of various environmental regulations. It will
state the steps to be taken in case of emergency such as accidents at the site including fire.
The environmental management plan would focus on possible significant impacts. As indicated the
proposed project is not expected to cause any impacts to the natural environment. However, during
site preparation and construction phases of the project some impacts to air quality through dust
emission is expected. The same can be mitigated through proper dust control measures such as
sprinkling water along the areas where vehicular traffic and earth moving equipment will be
active. Impacts to air quality from emission of exhaust gases from vehicles and equipment
could be minimized by turning of the engines instead of keeping them in idle mode. The impact
20
of emissions from on site vehicles and equipment is expected to low compared to that
caused by the emissions from vehicular traffic.
Water quality impacts are not expected as it is proposed to meet the domestic water supply
demand from the existing NTADCL / TWAD line shall be examined, to ensure continuous water
supply. Best practice for storm water management will be followed and the storm water drain
systems will be developed which will drain excess storm water into the nearby drainage system.
Wastewater generated by the project will be treated in sewage treatment plant and treated water
reused for gardening.
The contractor will take all necessary actions to ensure health and safety of construction workers.
CONCEPTUAL PLAN (DESCRIPTIVE REPORT OF THE PROJECT)
1. INTRODUCTION
M/s. Codissia Industrial Park Ltd has proposed to construct industrial park project at Survey
96/1, 97, 98, 99/2, 101/2, 101/3, 102/2B, 131/2, 135/2, 136/2, 138, 141/2, 142/1B1, 142/2B1,
142/2B2, 142/3A, 142/3B, 143/1, 143/2, 143/3, 143/4, 144/1, 144/2, 144/3, 144/4, 145/1, 146/1,
147/1, 147/2, 147/3, 148/1, 148/2, 314, 315/1A, 315/1B, 315/2A, 315/2B, 315/3, 316/1, 316/2,
316/3, 317/2, 318/1, 318/2, 318/3, 320/1, 320/2A, 320/2B, 320/2C, 320/2D, 320/2E, 320/2F,
321/1, 321/2, 322/1 and 322/2 Kallapalayam Village, Palladam Taluk, Coimbatore District.
1.1 Details of the proposed site: Following are the details regarding the proposed site.
a) Archaeological monuments
The location does not have any archaeological monuments in nearby 10km radius.
b) Biological resources
It was found during study period that the location is devoid of any endangered flora and fauna in
25 km radius.
c) Cultural Monuments
The site does not have any cultural monuments within the area of 10 km radius.
d) Defence
There is no defence installation within 10 km radius of this site.
e) Employment Generation
This project will generate the employment in the immediate surroundings of the people during
the construction period.
f) Geography
The location is geographically suitable for setting up of project, as the unit will not be disturbed
by climatic and other geographical condition.
21
g) Transportation facilities
The project site is well connected by road and rail. The nearest major railway station is
Coimbatore and Airport is Coimbatore.
h) Socio-economic
The unit will improve the economy both at International, National and State level.
I) Meteorology
Both micro and macro meteorology is found to be suitable for this project.
j) Natural disaster
The area is devoid of natural disasters like earthquake, cyclone, landslides etc.
k) Sensitive area
The location does not have any sensitive areas in nearby 10km radius.
l) Power
The power would be sourced from TNEB. The estimated power requirement for the project is
about 10 MW.
m) Highway
The proposed project site is also well connected by NH and MDRs and abuts the road in the north.
n) Land use classification
The land that has been procured for the purposes of the proposed project is not covered under the
Local Planning Authority (LPA). It has not been indicated or listed in the Master Plan of the LPA
as well; hence it has No Land Use. Thus, an approval from Directorate of Town & Country
Planning has to be obtained for converting the said land from No Land Use to land for Industrial
Development.
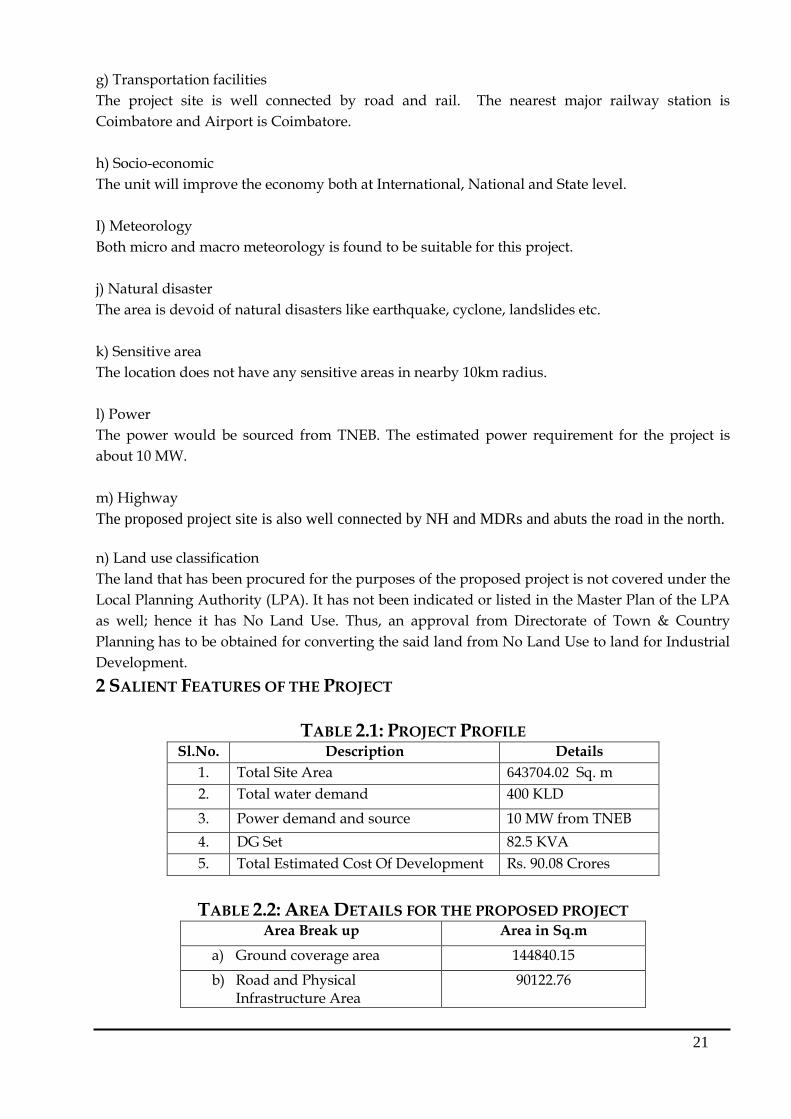
2 SALIENT FEATURES OF THE PROJECT
TABLE 2.1: PROJECT PROFILE Sl.No. Description Details
1. Total Site Area
643704.02 Sq. m
2. Total water demand 400 KLD
3. Power demand and source 10 MW from TNEB
4. DG Set 82.5 KVA
5. Total Estimated Cost Of Development Rs. 90.08 Crores
TABLE 2.2: AREA DETAILS FOR THE PROPOSED PROJECT
Area Break up Area in Sq.m
a) Ground coverage area 144840.15
b) Road and Physical Infrastructure Area
90122.76
22
c) Parking Area 32186.70
d) Landscaping area (33 % of the total area)
212432.2
e) OSR area (11 % of the total area)
70810.74
f) (STP & Solid waste storage Area
12874.68
g) Others/Vacant 80436.79
Total Site Area 643704.02
Table 2.3: Details of Material used during construction No. Description
1. Reinforcement Steel
2. Cement
3. Cement Blocks
4. Sand
5. Aggregate
6. Aluminum
7. Wood
Table 2.4: Details of Details of construction equipment No. Description
1. Transit mixers
2. Tipper
3. Batching plant
4. Vibrators
5. Mobile concrete pump
6. Static pump
7. Tower crane
8. Excavator
9. JCB
10. Loader
11. Compressor
3 WATER CONSUMPTION In this project, water will be used for domestic purpose. The total requirement of water for this project will
be 400 KLD. It will be met from the existing NTADCL / TWAD line shall be examined, to ensure
continuous water supply.
4 WASTEWATER DETAILS In this project, the wastewaters generated due to the domestic uses. The sewage disposal method and the details are given below:
Table: 4.1
Water balance chart and design details of STP are enclosed as Annexure III & IV respectively.
S.No. Details Quantity/day
1. Sewage 232 KLD
23
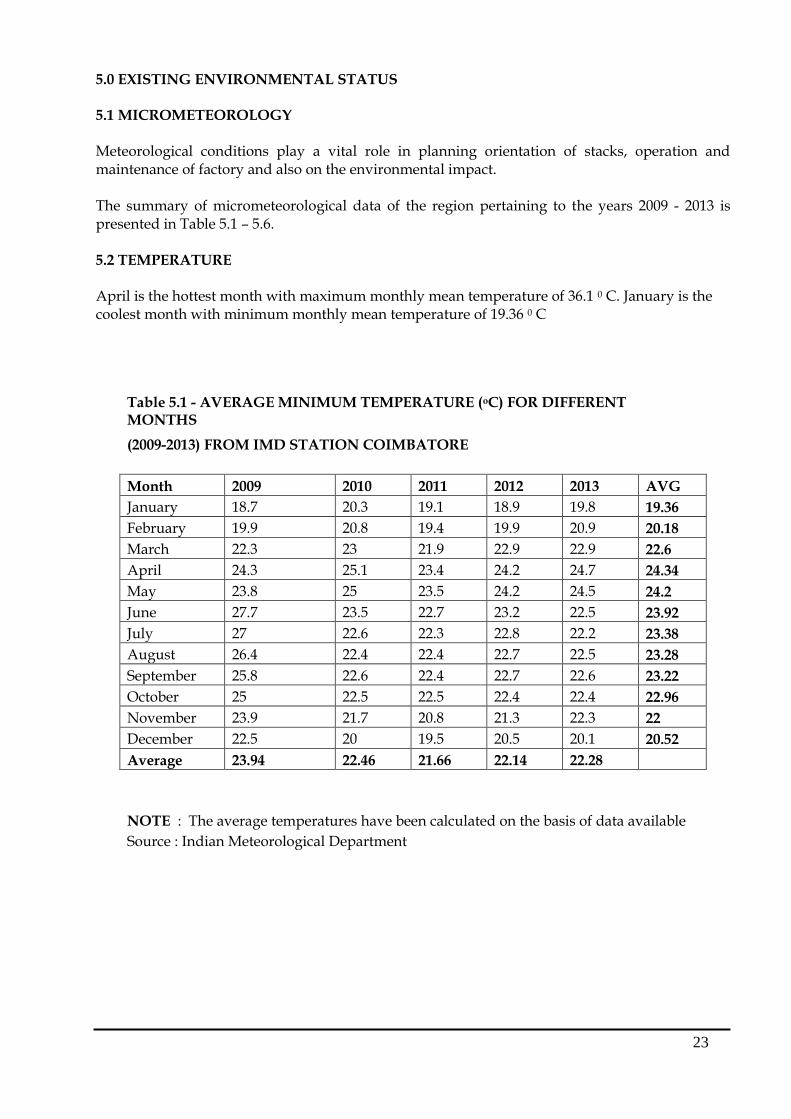
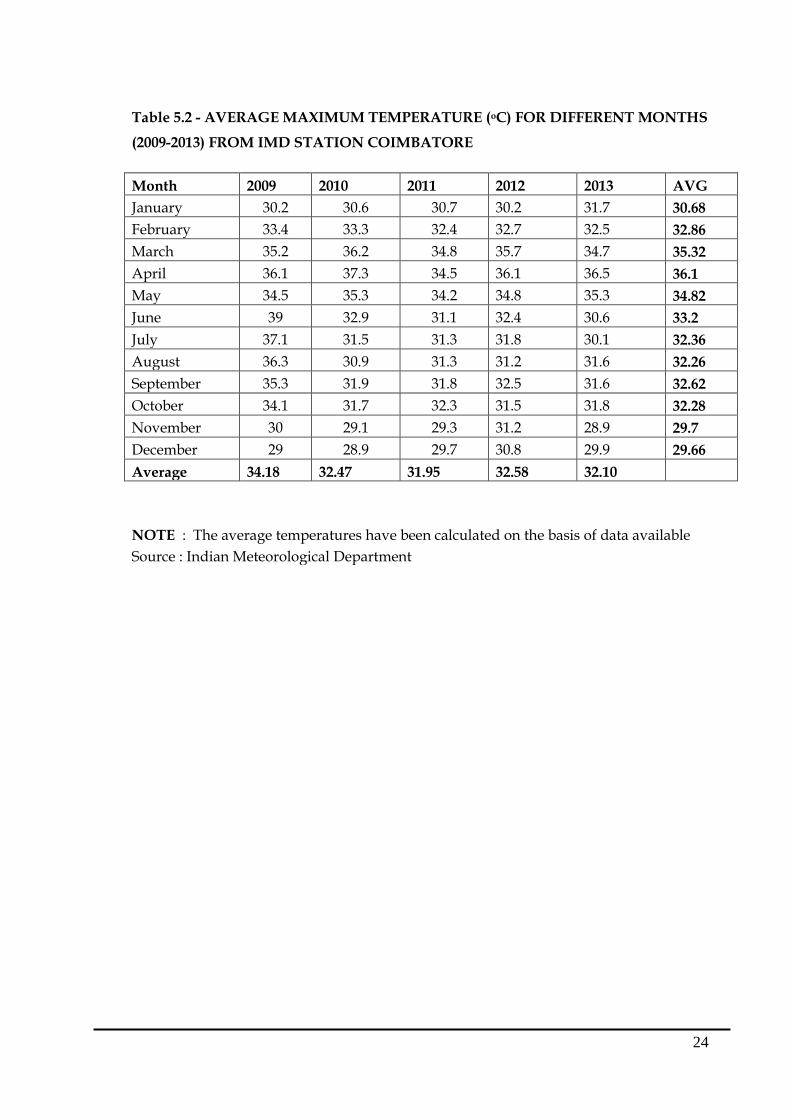
5.0 EXISTING ENVIRONMENTAL STATUS 5.1 MICROMETEOROLOGY Meteorological conditions play a vital role in planning orientation of stacks, operation and maintenance of factory and also on the environmental impact. The summary of micrometeorological data of the region pertaining to the years 2009 - 2013 is presented in Table 5.1 – 5.6. 5.2 TEMPERATURE April is the hottest month with maximum monthly mean temperature of 36.1 0 C. January is the coolest month with minimum monthly mean temperature of 19.36 0 C
Table 5.1 - AVERAGE MINIMUM TEMPERATURE (oC) FOR DIFFERENT MONTHS
(2009-2013) FROM IMD STATION COIMBATORE
Month 2009 2010 2011 2012 2013 AVG
January 18.7 20.3 19.1 18.9 19.8 19.36
February 19.9 20.8 19.4 19.9 20.9 20.18
March 22.3 23 21.9 22.9 22.9 22.6
April 24.3 25.1 23.4 24.2 24.7 24.34
May 23.8 25 23.5 24.2 24.5 24.2
June 27.7 23.5 22.7 23.2 22.5 23.92
July 27 22.6 22.3 22.8 22.2 23.38
August 26.4 22.4 22.4 22.7 22.5 23.28
September 25.8 22.6 22.4 22.7 22.6 23.22
October 25 22.5 22.5 22.4 22.4 22.96
November 23.9 21.7 20.8 21.3 22.3 22
December 22.5 20 19.5 20.5 20.1 20.52
Average 23.94 22.46 21.66 22.14 22.28
NOTE : The average temperatures have been calculated on the basis of data available
Source : Indian Meteorological Department
24
Table 5.2 - AVERAGE MAXIMUM TEMPERATURE (oC) FOR DIFFERENT MONTHS
(2009-2013) FROM IMD STATION COIMBATORE
Month 2009 2010 2011 2012 2013 AVG
January 30.2 30.6 30.7 30.2 31.7 30.68
February 33.4 33.3 32.4 32.7 32.5 32.86
March 35.2 36.2 34.8 35.7 34.7 35.32
April 36.1 37.3 34.5 36.1 36.5 36.1
May 34.5 35.3 34.2 34.8 35.3 34.82
June 39 32.9 31.1 32.4 30.6 33.2
July 37.1 31.5 31.3 31.8 30.1 32.36
August 36.3 30.9 31.3 31.2 31.6 32.26
September 35.3 31.9 31.8 32.5 31.6 32.62
October 34.1 31.7 32.3 31.5 31.8 32.28
November 30 29.1 29.3 31.2 28.9 29.7
December 29 28.9 29.7 30.8 29.9 29.66
Average 34.18 32.47 31.95 32.58 32.10
NOTE : The average temperatures have been calculated on the basis of data available
Source : Indian Meteorological Department
25
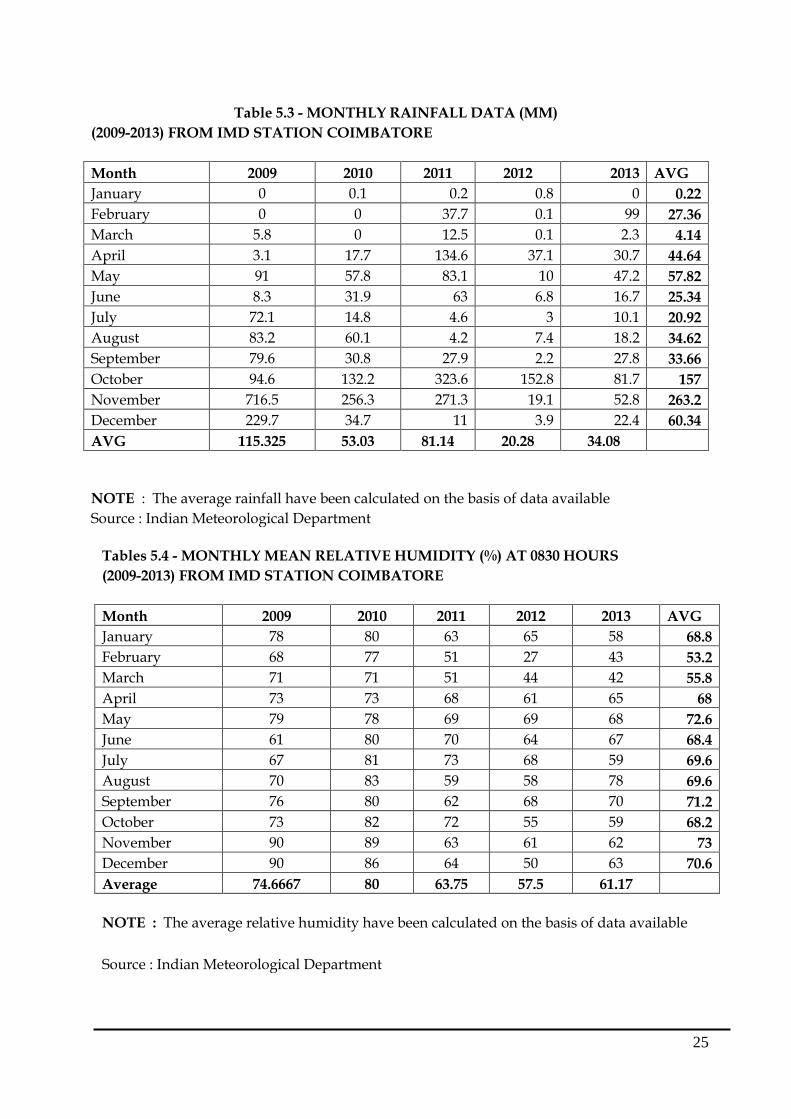
Tables 5.4 - MONTHLY MEAN RELATIVE HUMIDITY (%) AT 0830 HOURS
(2009-2013) FROM IMD STATION COIMBATORE
Month 2009 2010 2011 2012 2013 AVG
January 78 80 63 65 58 68.8
February 68 77 51 27 43 53.2
March 71 71 51 44 42 55.8
April 73 73 68 61 65 68
May 79 78 69 69 68 72.6
June 61 80 70 64 67 68.4
July 67 81 73 68 59 69.6
August 70 83 59 58 78 69.6
September 76 80 62 68 70 71.2
October 73 82 72 55 59 68.2
November 90 89 63 61 62 73
December 90 86 64 50 63 70.6
Average 74.6667 80 63.75 57.5 61.17
NOTE : The average relative humidity have been calculated on the basis of data available
Source : Indian Meteorological Department
Table 5.3 - MONTHLY RAINFALL DATA (MM)
(2009-2013) FROM IMD STATION COIMBATORE
Month 2009 2010 2011 2012 2013 AVG
January 0 0.1 0.2 0.8 0 0.22
February 0 0 37.7 0.1 99 27.36
March 5.8 0 12.5 0.1 2.3 4.14
April 3.1 17.7 134.6 37.1 30.7 44.64
May 91 57.8 83.1 10 47.2 57.82
June 8.3 31.9 63 6.8 16.7 25.34
July 72.1 14.8 4.6 3 10.1 20.92
August 83.2 60.1 4.2 7.4 18.2 34.62
September 79.6 30.8 27.9 2.2 27.8 33.66
October 94.6 132.2 323.6 152.8 81.7 157
November 716.5 256.3 271.3 19.1 52.8 263.2
December 229.7 34.7 11 3.9 22.4 60.34
AVG 115.325 53.03 81.14 20.28 34.08
NOTE : The average rainfall have been calculated on the basis of data available Source : Indian Meteorological Department
26
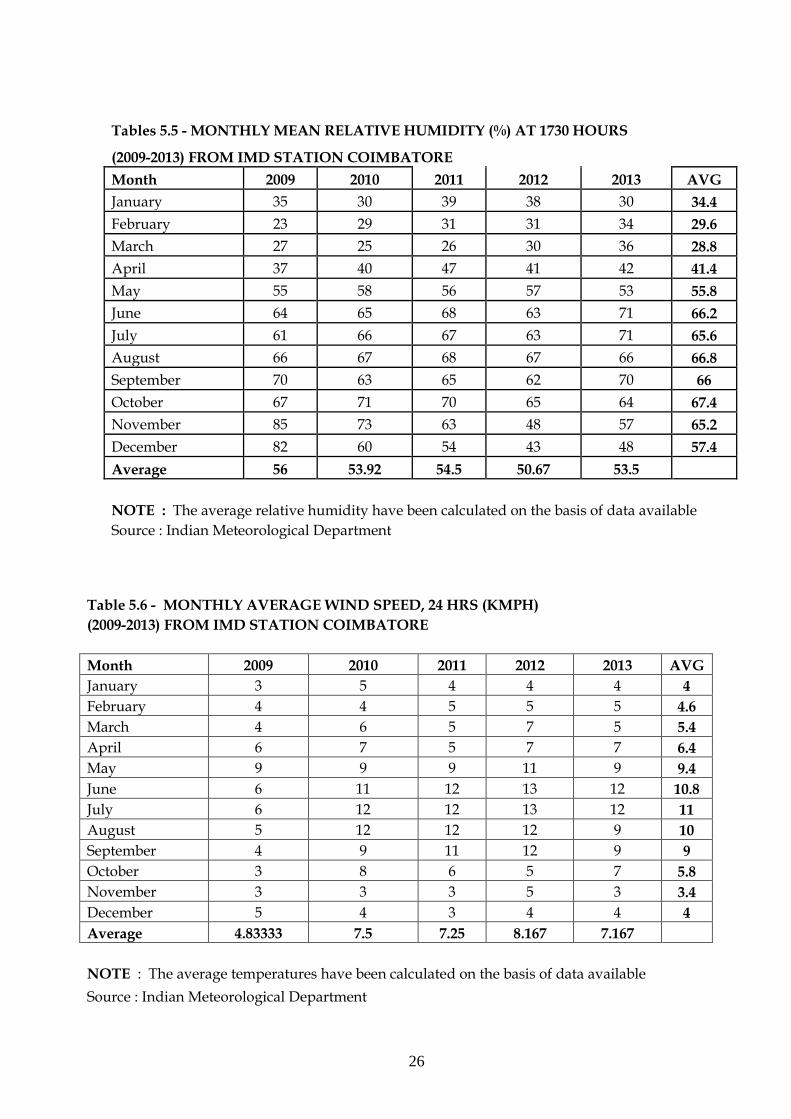
Tables 5.5 - MONTHLY MEAN RELATIVE HUMIDITY (%) AT 1730 HOURS
(2009-2013) FROM IMD STATION COIMBATORE
Month 2009 2010 2011 2012 2013 AVG
January 35 30 39 38 30 34.4
February 23 29 31 31 34 29.6
March 27 25 26 30 36 28.8
April 37 40 47 41 42 41.4
May 55 58 56 57 53 55.8
June 64 65 68 63 71 66.2
July 61 66 67 63 71 65.6
August 66 67 68 67 66 66.8
September 70 63 65 62 70 66
October 67 71 70 65 64 67.4
November 85 73 63 48 57 65.2
December 82 60 54 43 48 57.4
Average 56 53.92 54.5 50.67 53.5
NOTE : The average relative humidity have been calculated on the basis of data available
Source : Indian Meteorological Department
Table 5.6 - MONTHLY AVERAGE WIND SPEED, 24 HRS (KMPH)
(2009-2013) FROM IMD STATION COIMBATORE
Month 2009 2010 2011 2012 2013 AVG
January 3 5 4 4 4 4
February 4 4 5 5 5 4.6
March 4 6 5 7 5 5.4
April 6 7 5 7 7 6.4
May 9 9 9 11 9 9.4
June 6 11 12 13 12 10.8
July 6 12 12 13 12 11
August 5 12 12 12 9 10
September 4 9 11 12 9 9
October 3 8 6 5 7 5.8
November 3 3 3 5 3 3.4
December 5 4 3 4 4 4
Average 4.83333 7.5 7.25 8.167 7.167
NOTE : The average temperatures have been calculated on the basis of data available Source : Indian Meteorological Department
27
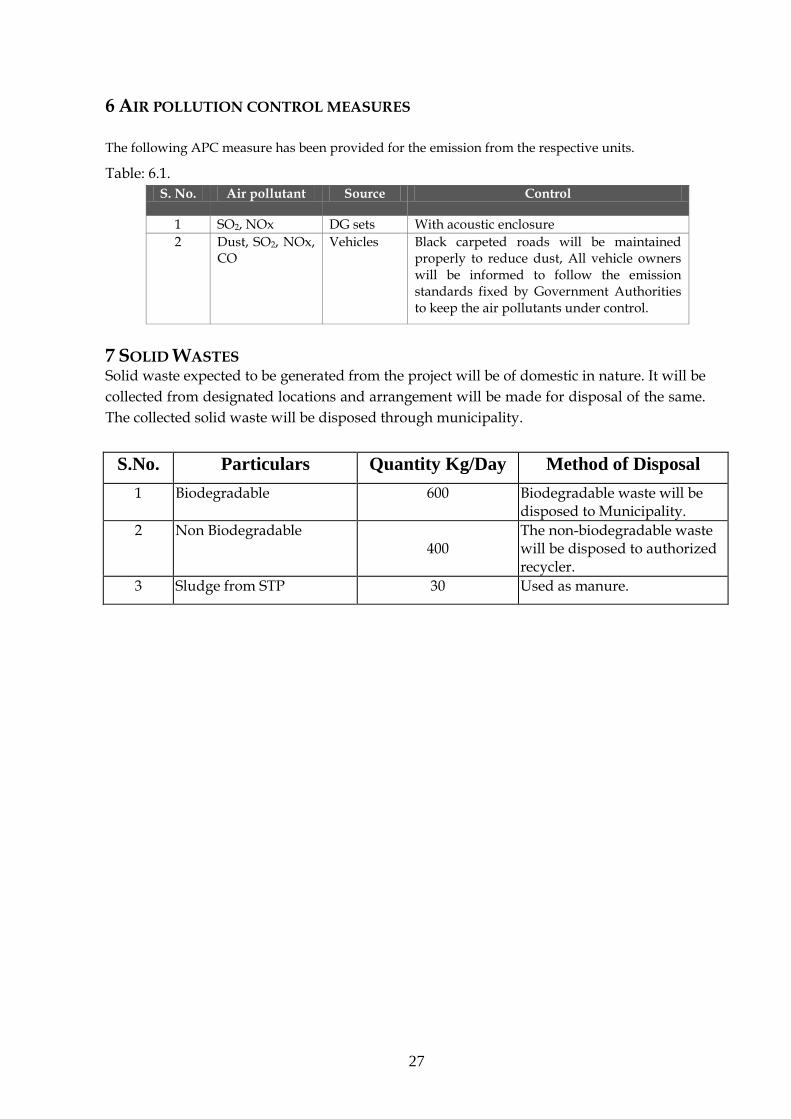
6 AIR POLLUTION CONTROL MEASURES The following APC measure has been provided for the emission from the respective units.
Table: 6.1.
S. No. Air pollutant Source Control
1 SO2, NOx DG sets With acoustic enclosure
2 Dust, SO2, NOx, CO
Vehicles Black carpeted roads will be maintained properly to reduce dust, All vehicle owners will be informed to follow the emission standards fixed by Government Authorities to keep the air pollutants under control.
7 SOLID WASTES Solid waste expected to be generated from the project will be of domestic in nature. It will be
collected from designated locations and arrangement will be made for disposal of the same.
The collected solid waste will be disposed through municipality.
S.No. Particulars Quantity Kg/Day Method of Disposal
1 Biodegradable 600 Biodegradable waste will be disposed to Municipality.
2 Non Biodegradable 400
The non-biodegradable waste will be disposed to authorized recycler.
3 Sludge from STP 30 Used as manure.
28
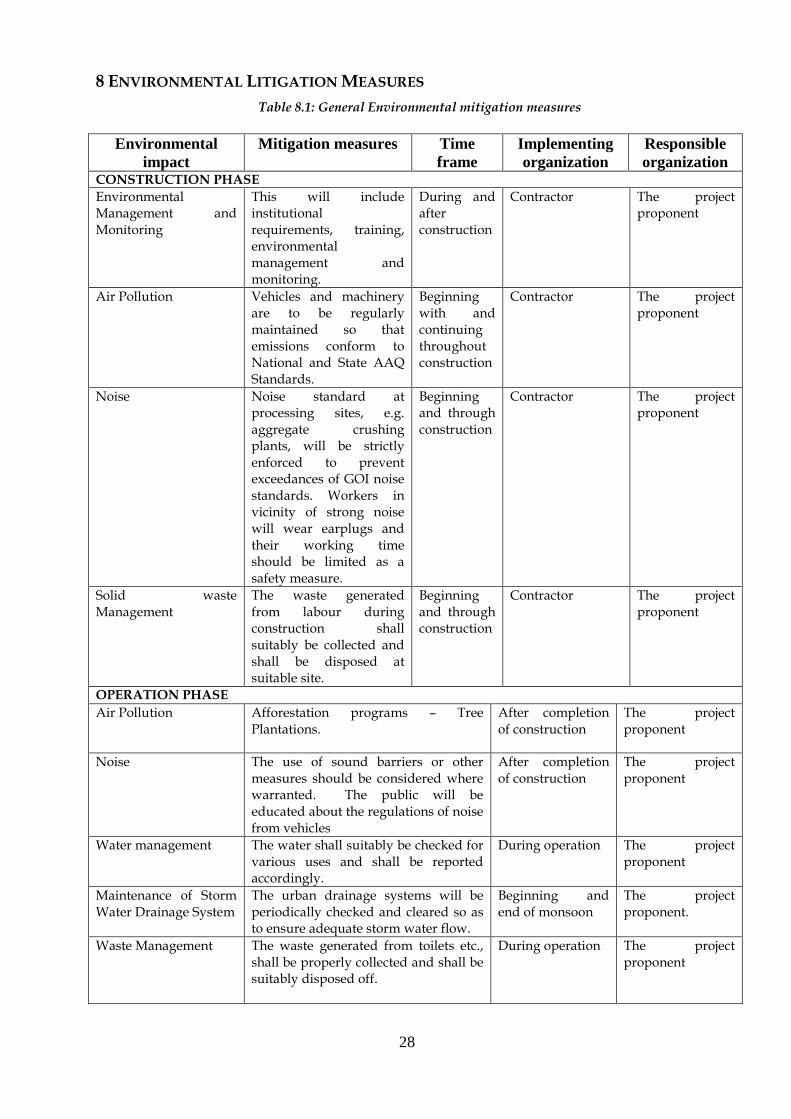
8 ENVIRONMENTAL LITIGATION MEASURES
Table 8.1: General Environmental mitigation measures
Environmental
impact
Mitigation measures Time
frame
Implementing
organization
Responsible
organization CONSTRUCTION PHASE
Environmental Management and Monitoring
This will include institutional requirements, training, environmental management and monitoring.
During and after construction
Contractor The project proponent
Air Pollution Vehicles and machinery are to be regularly maintained so that emissions conform to National and State AAQ Standards.
Beginning with and continuing throughout construction
Contractor The project proponent
Noise Noise standard at processing sites, e.g. aggregate crushing plants, will be strictly enforced to prevent exceedances of GOI noise standards. Workers in vicinity of strong noise will wear earplugs and their working time should be limited as a safety measure.
Beginning and through construction
Contractor The project proponent
Solid waste Management
The waste generated from labour during construction shall suitably be collected and shall be disposed at suitable site.
Beginning and through construction
Contractor The project proponent
OPERATION PHASE
Air Pollution Afforestation programs – Tree Plantations.
After completion of construction
The project proponent
Noise The use of sound barriers or other measures should be considered where warranted. The public will be educated about the regulations of noise from vehicles
After completion of construction
The project proponent
Water management The water shall suitably be checked for various uses and shall be reported accordingly.
During operation The project proponent
Maintenance of Storm Water Drainage System
The urban drainage systems will be periodically checked and cleared so as to ensure adequate storm water flow.
Beginning and end of monsoon
The project proponent.
Waste Management The waste generated from toilets etc., shall be properly collected and shall be suitably disposed off.
During operation The project proponent
29
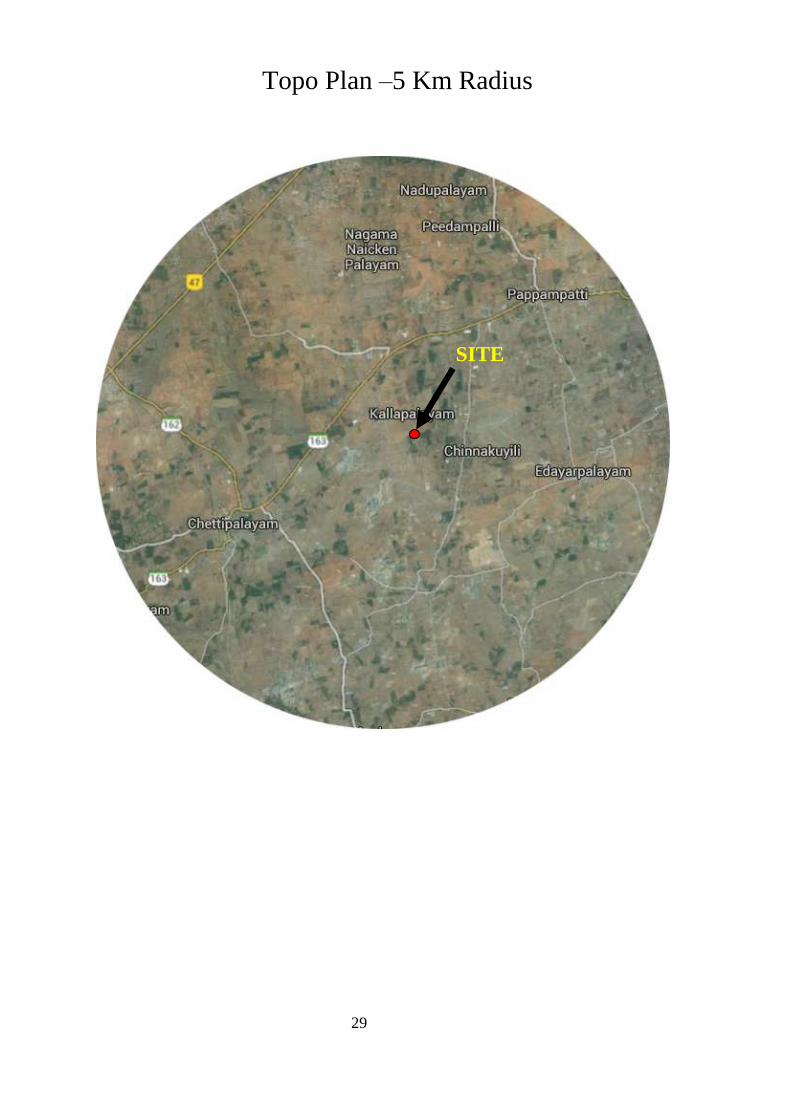
Topo Plan –5 Km Radius
SITE
30
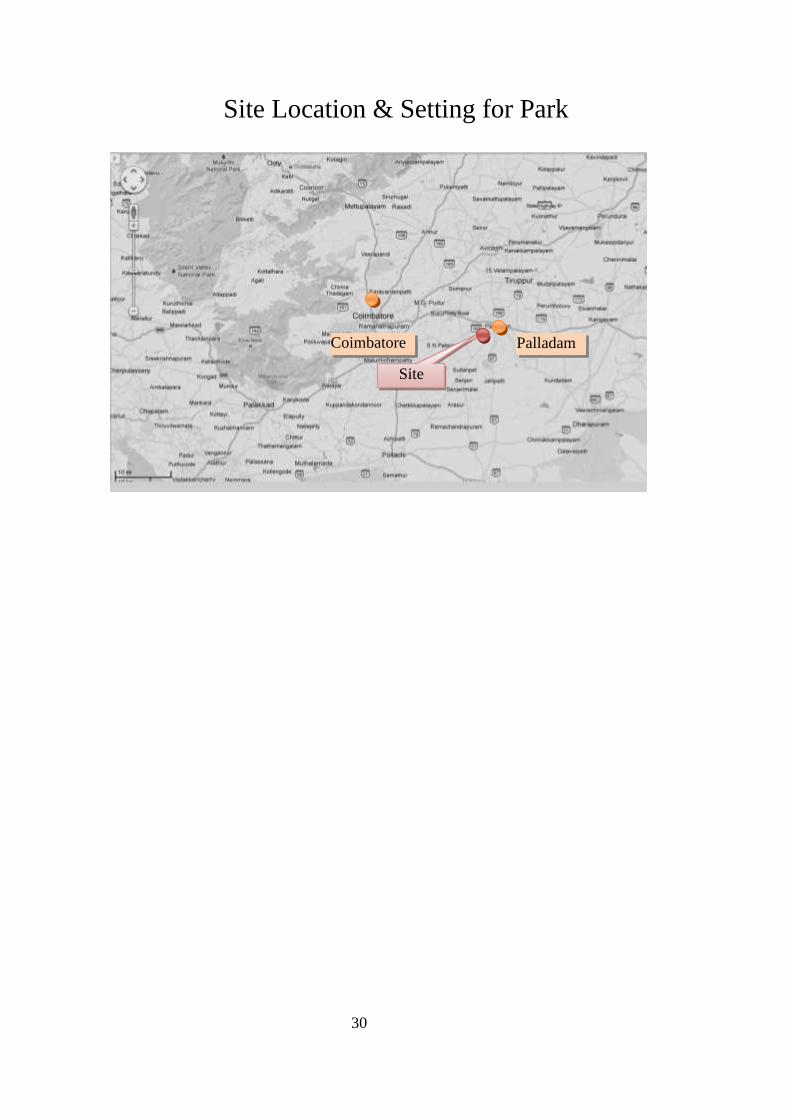
Site Location & Setting for Park
Coimbatore
Site
Palladam
31
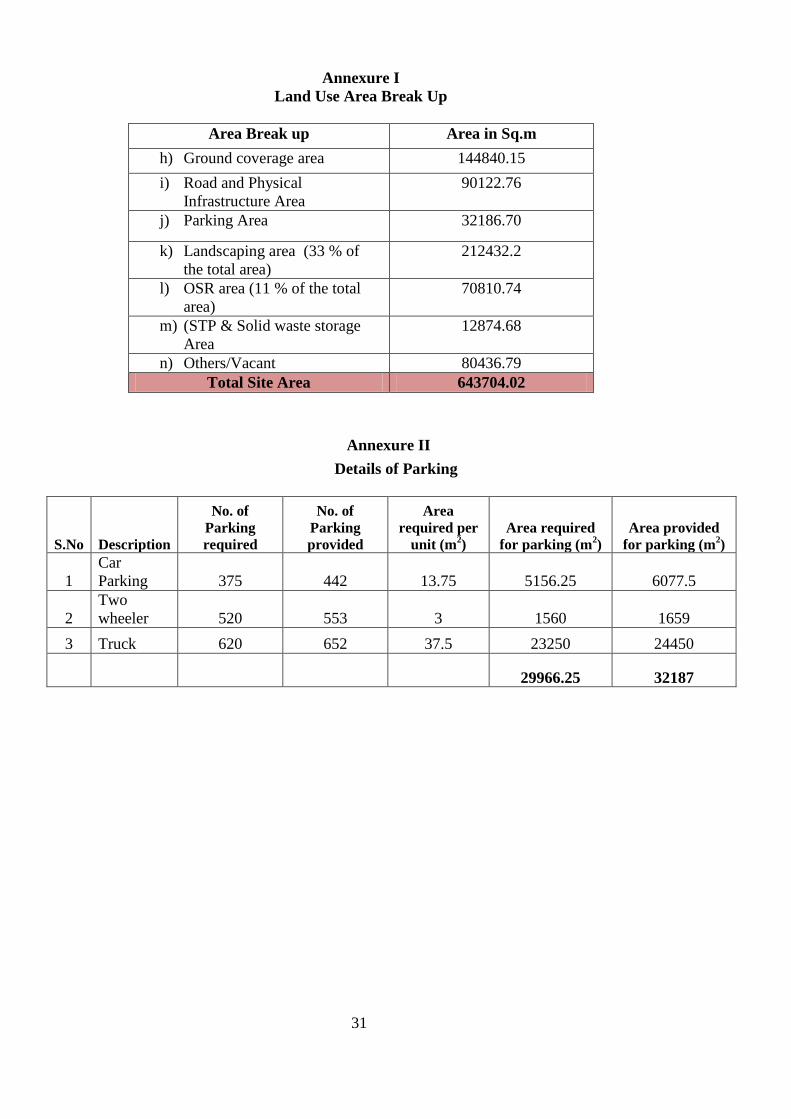
Annexure I
Land Use Area Break Up
Area Break up Area in Sq.m
h) Ground coverage area 144840.15
i) Road and Physical
Infrastructure Area
90122.76
j) Parking Area 32186.70
k) Landscaping area (33 % of
the total area)
212432.2
l) OSR area (11 % of the total
area)
70810.74
m) (STP & Solid waste storage
Area
12874.68
n) Others/Vacant 80436.79
Total Site Area 643704.02
Annexure II
Details of Parking
S.No Description
No. of
Parking
required
No. of
Parking
provided
Area
required per
unit (m2)
Area required
for parking (m2)
Area provided
for parking (m2)
1
Car
Parking 375 442 13.75 5156.25 6077.5
2
Two
wheeler 520 553 3 1560 1659
3 Truck 620 652 37.5 23250 24450
29966.25 32187
32
Annexure – III
WATER BALANCE CHART
Total Water Requirement : 0.4 MLD ; Source : NTADC-New Tirupur Area Development Corporation
Domestic Water Demand
290 KLD
STP Designed Capacity
240 KLD
Gardening
232 KLD
80% of total water demand
Sewage Generation
232 KLD
Treated Sewage Water
232 KLD
33
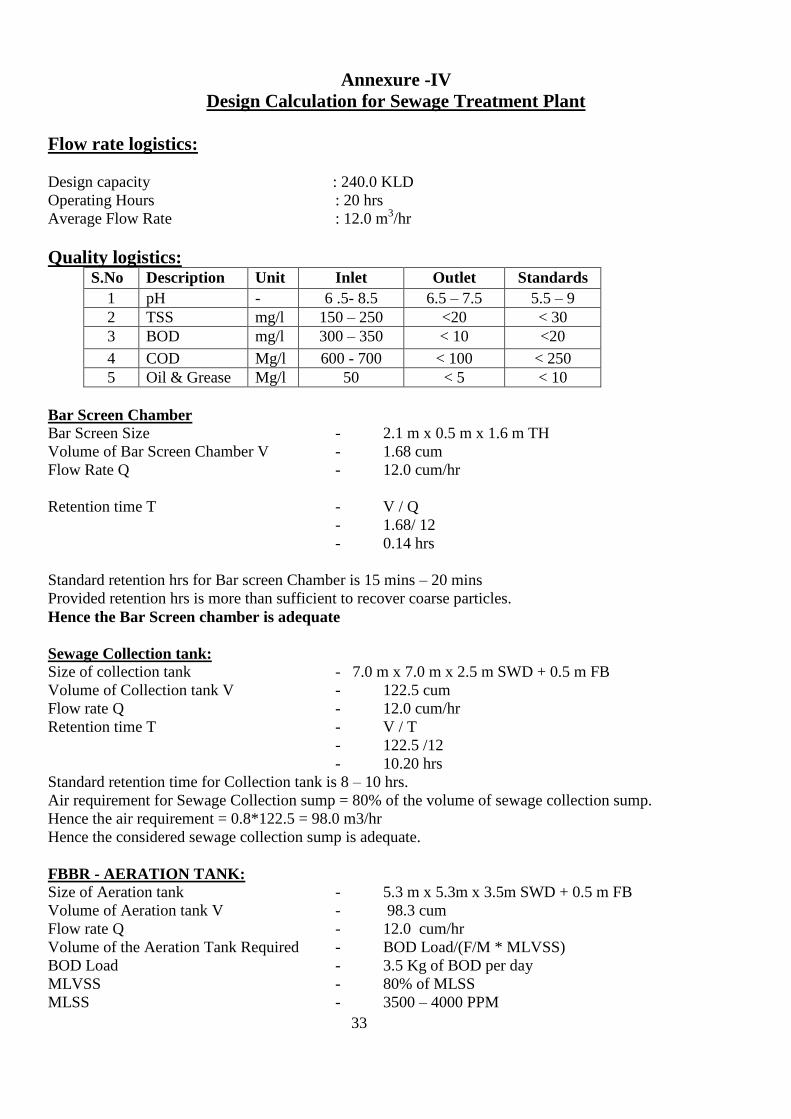
Annexure -IV
Design Calculation for Sewage Treatment Plant
Flow rate logistics:
Design capacity : 240.0 KLD
Operating Hours : 20 hrs
Average Flow Rate : 12.0 m3/hr
Quality logistics: S.No Description Unit Inlet Outlet Standards
1 pH - 6 .5- 8.5 6.5 – 7.5 5.5 – 9
2 TSS mg/l 150 – 250 <20 < 30
3 BOD mg/l 300 – 350 < 10 <20
4 COD Mg/l 600 - 700 < 100 < 250
5 Oil & Grease Mg/l 50 < 5 < 10
Bar Screen Chamber
Bar Screen Size - 2.1 m x 0.5 m x 1.6 m TH
Volume of Bar Screen Chamber V - 1.68 cum
Flow Rate Q - 12.0 cum/hr
Retention time T - V / Q
- 1.68/ 12
- 0.14 hrs
Standard retention hrs for Bar screen Chamber is 15 mins – 20 mins
Provided retention hrs is more than sufficient to recover coarse particles.
Hence the Bar Screen chamber is adequate
Sewage Collection tank:
Size of collection tank - 7.0 m x 7.0 m x 2.5 m SWD + 0.5 m FB
Volume of Collection tank V - 122.5 cum
Flow rate Q - 12.0 cum/hr
Retention time T - V / T
- 122.5 /12
- 10.20 hrs
Standard retention time for Collection tank is 8 – 10 hrs.
Air requirement for Sewage Collection sump = 80% of the volume of sewage collection sump.
Hence the air requirement = 0.8*122.5 = 98.0 m3/hr
Hence the considered sewage collection sump is adequate.
FBBR - AERATION TANK:
Size of Aeration tank - 5.3 m x 5.3m x 3.5m SWD + 0.5 m FB
Volume of Aeration tank V - 98.3 cum
Flow rate Q - 12.0 cum/hr
Volume of the Aeration Tank Required - BOD Load/(F/M * MLVSS)
BOD Load - 3.5 Kg of BOD per day
MLVSS - 80% of MLSS
MLSS - 3500 – 4000 PPM
34
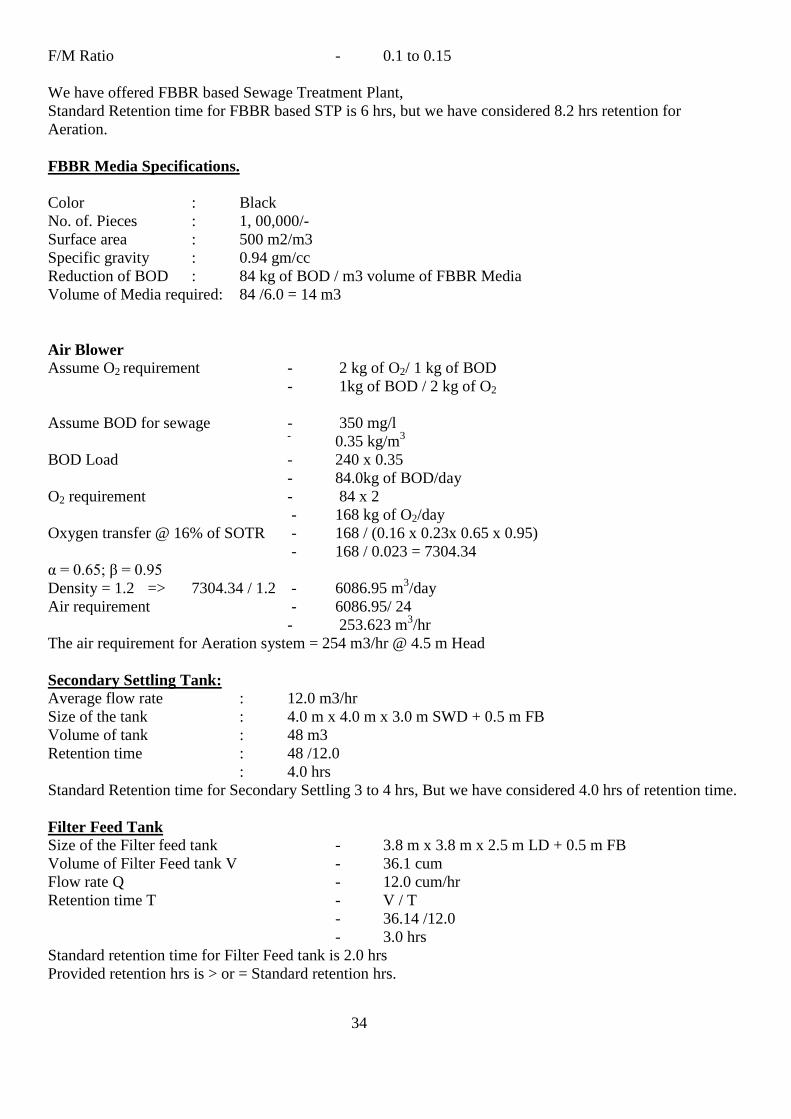
F/M Ratio - 0.1 to 0.15
We have offered FBBR based Sewage Treatment Plant,
Standard Retention time for FBBR based STP is 6 hrs, but we have considered 8.2 hrs retention for
Aeration.
FBBR Media Specifications.
Color : Black
No. of. Pieces : 1, 00,000/-
Surface area : 500 m2/m3
Specific gravity : 0.94 gm/cc
Reduction of BOD : 84 kg of BOD / m3 volume of FBBR Media
Volume of Media required: 84 /6.0 = 14 m3
Air Blower Assume O2 requirement - 2 kg of O2/ 1 kg of BOD
- 1kg of BOD / 2 kg of O2
Assume BOD for sewage - 350 mg/l - 0.35 kg/m
3
BOD Load - 240 x 0.35
- 84.0kg of BOD/day
O2 requirement - 84 x 2
- 168 kg of O2/day
Oxygen transfer @ 16% of SOTR - 168 / (0.16 x 0.23x 0.65 x 0.95)
- 168 / 0.023 = 7304.34
α = 0.65; β = 0.95
Density = 1.2 => 7304.34 / 1.2 - 6086.95 m3/day
Air requirement - 6086.95/ 24
- 253.623 m3/hr
The air requirement for Aeration system = 254 m3/hr @ 4.5 m Head
Secondary Settling Tank:
Average flow rate : 12.0 m3/hr
Size of the tank : 4.0 m x 4.0 m x 3.0 m SWD + 0.5 m FB
Volume of tank : 48 m3
Retention time : 48 /12.0
: 4.0 hrs
Standard Retention time for Secondary Settling 3 to 4 hrs, But we have considered 4.0 hrs of retention time.
Filter Feed Tank
Size of the Filter feed tank - 3.8 m x 3.8 m x 2.5 m LD + 0.5 m FB
Volume of Filter Feed tank V - 36.1 cum
Flow rate Q - 12.0 cum/hr
Retention time T - V / T
- 36.14 /12.0
- 3.0 hrs
Standard retention time for Filter Feed tank is 2.0 hrs
Provided retention hrs is > or = Standard retention hrs.
35
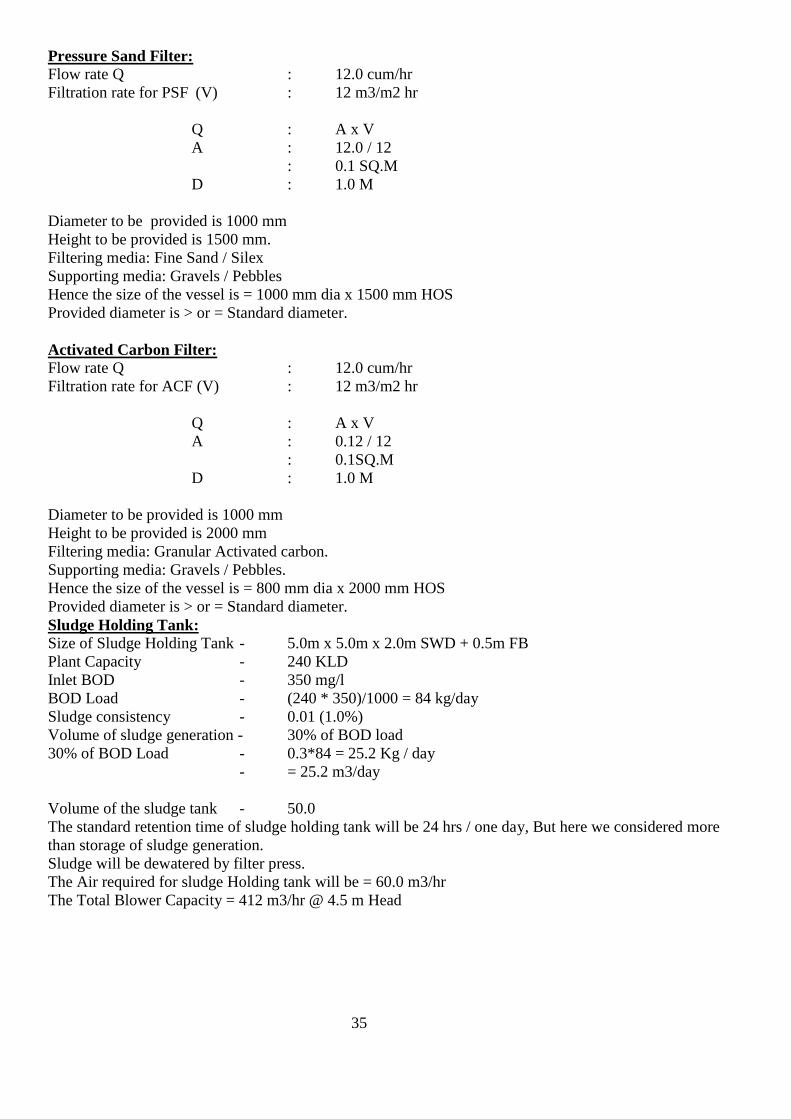
Pressure Sand Filter:
Flow rate Q : 12.0 cum/hr
Filtration rate for PSF (V) : 12 m3/m2 hr
Q : A x V
A : 12.0 / 12
: 0.1 SQ.M
D : 1.0 M
Diameter to be provided is 1000 mm
Height to be provided is 1500 mm.
Filtering media: Fine Sand / Silex
Supporting media: Gravels / Pebbles
Hence the size of the vessel is = 1000 mm dia x 1500 mm HOS
Provided diameter is > or = Standard diameter.
Activated Carbon Filter:
Flow rate Q : 12.0 cum/hr
Filtration rate for ACF (V) : 12 m3/m2 hr
Q : A x V
A : 0.12 / 12
: 0.1SQ.M
D : 1.0 M
Diameter to be provided is 1000 mm
Height to be provided is 2000 mm
Filtering media: Granular Activated carbon.
Supporting media: Gravels / Pebbles.
Hence the size of the vessel is = 800 mm dia x 2000 mm HOS
Provided diameter is > or = Standard diameter.
Sludge Holding Tank:
Size of Sludge Holding Tank - 5.0m x 5.0m x 2.0m SWD + 0.5m FB
Plant Capacity - 240 KLD
Inlet BOD - 350 mg/l
BOD Load - (240 * 350)/1000 = 84 kg/day
Sludge consistency - 0.01 (1.0%)
Volume of sludge generation - 30% of BOD load
30% of BOD Load - 0.3*84 = 25.2 Kg / day
- = 25.2 m3/day
Volume of the sludge tank - 50.0
The standard retention time of sludge holding tank will be 24 hrs / one day, But here we considered more
than storage of sludge generation.
Sludge will be dewatered by filter press.
The Air required for sludge Holding tank will be = 60.0 m3/hr
The Total Blower Capacity = 412 m3/hr @ 4.5 m Head
36
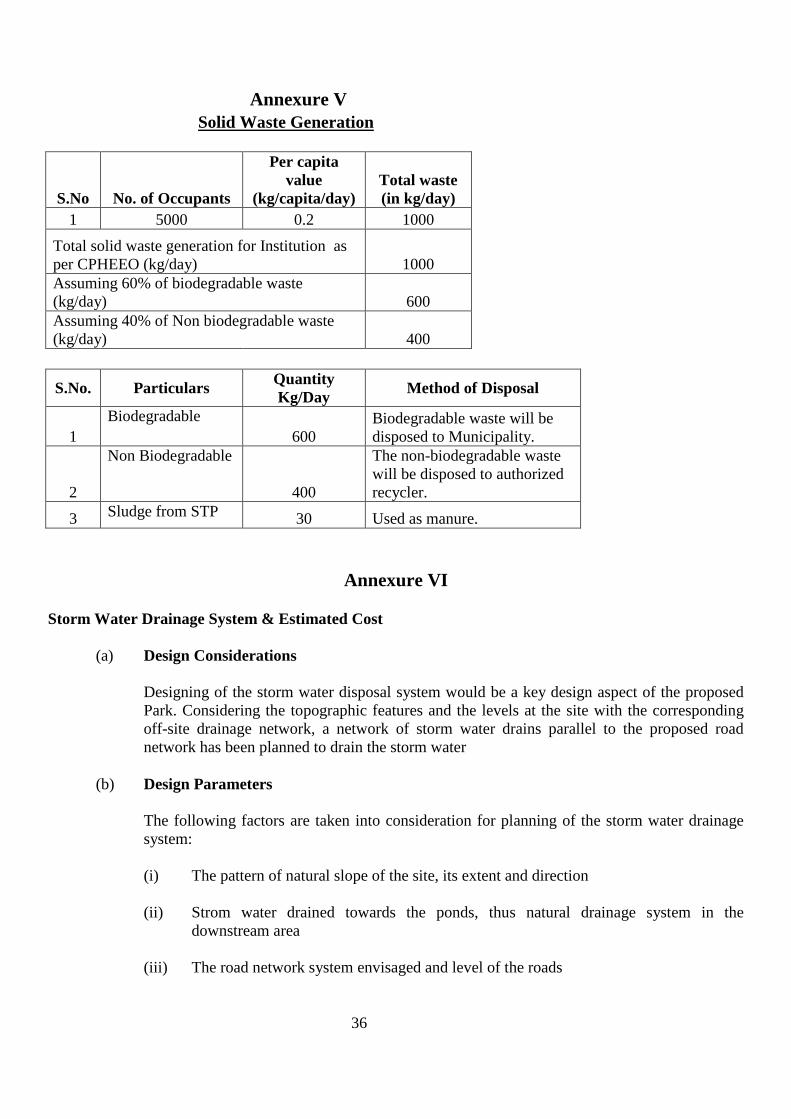
Annexure V
Solid Waste Generation
S.No No. of Occupants
Per capita
value
(kg/capita/day)
Total waste
(in kg/day) 1 5000 0.2 1000
Total solid waste generation for Institution as
per CPHEEO (kg/day) 1000 Assuming 60% of biodegradable waste
(kg/day) 600 Assuming 40% of Non biodegradable waste
(kg/day) 400
S.No. Particulars
Quantity
Kg/Day Method of Disposal
1
Biodegradable
600
Biodegradable waste will be
disposed to Municipality.
2
Non Biodegradable
400
The non-biodegradable waste
will be disposed to authorized
recycler.
3 Sludge from STP
30 Used as manure.
Annexure VI
Storm Water Drainage System & Estimated Cost
(a) Design Considerations
Designing of the storm water disposal system would be a key design aspect of the proposed
Park. Considering the topographic features and the levels at the site with the corresponding
off-site drainage network, a network of storm water drains parallel to the proposed road
network has been planned to drain the storm water
(b) Design Parameters
The following factors are taken into consideration for planning of the storm water drainage
system:
(i) The pattern of natural slope of the site, its extent and direction
(ii) Strom water drained towards the ponds, thus natural drainage system in the
downstream area
(iii) The road network system envisaged and level of the roads
37
(iv) The rain fall run off from plots/units, and other covered areas into catch basin
connected to branch drain laid along the road adjacent property line. The branch drain
carries the water into lateral, which in turn carries it to the trunk drain
(v) The rainwater from open spaces and from isolated places, flow over the ground
following the natural slope and get into the nearest drain through the vertical grating
(vi) As a camber of 2.5% on the pavement is provided, the runoff from the ROW shall
flow towards the drains provided at either side of road
(vii) For design of storm water drainage system for the park, following design parameters
are considered:
(AA) Rainfall Intensity: 35mm / hr for a return period of 2 years
(BB) Runoff factor: 60% runoff factor from the total area
(CC) Minimum gradient: 1 in 300
(DD) Minimum velocity: 0.6 m /sec
(c) Proposed Drainage System
(i) The network shall be designed to drain away the runoff from the plots and the roads
would comprise of open rectangular RCC drains with PCC floor
(ii) The storm water flow will finally drain into a lead off storm water drainage system
connected to the road system
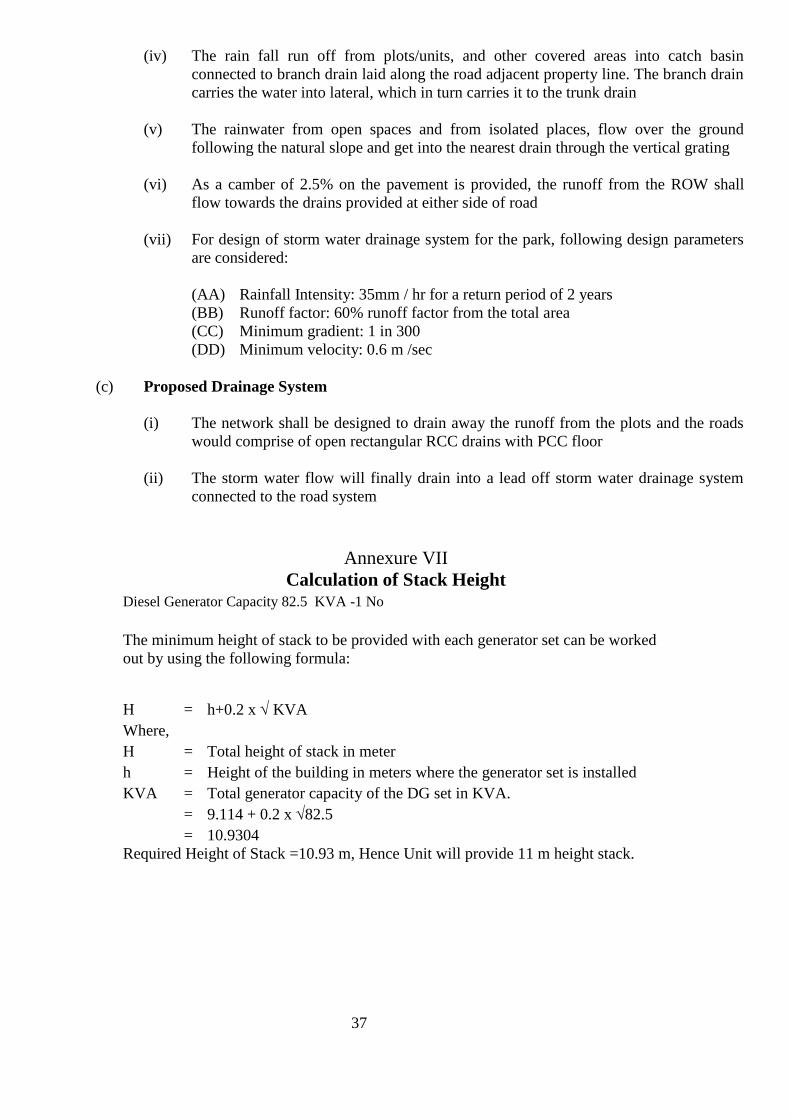
Annexure VII
Calculation of Stack Height Diesel Generator Capacity 82.5 KVA -1 No
The minimum height of stack to be provided with each generator set can be worked
out by using the following formula:
H = h+0.2 x KVA
Where, H = Total height of stack in meter
h = Height of the building in meters where the generator set is installed
KVA = Total generator capacity of the DG set in KVA.
= 9.114 + 0.2 x 82.5
= 10.9304
Required Height of Stack =10.93 m, Hence Unit will provide 11 m height stack.
38
Annexure VIII
ENERGY CONSERVATION MEASURES
Energy conservation measures proposed are provision of Compact fluorescent lamps (CFL). The usage of
CFL will reduce the energy consumption substantially and reduce the indirect impact of emissions. Various
capacities of compact fluorescent lamps are available in the market. The equivalent CFL for incandescent
lamps are presented below.
CFL and Incandescent Lamp Capacities
Incandescent lamp capacity in
watts
CFL capacity with same lumens
in watts
20 5
28 7
36 9
40 10
52 13
60 15
75 20
100 26 – 29
150 38 – 42
250 - 300 55
Maximum utilization of natural light.
CFL Lighting fixtures will be used in common areas
Solar lighting for garden and open area
Solar water heaters for 20% of total hot water requirement
MEASURE DESCRIPTION ENERGY
SAVING METHODS
ENERGY SAVING
METHODS
Energy efficient equipment Internal lighting – Use of CFL
lighting
20% of normal operation by
using CFL lamps &
electronic ballast
Pumps 25% normal operation by
using VFD drive
Renewable Energy Solar street lighting 25% normal operation by
using solar street lights
Solar water heater 20% Normal operation by
using solar heater
39
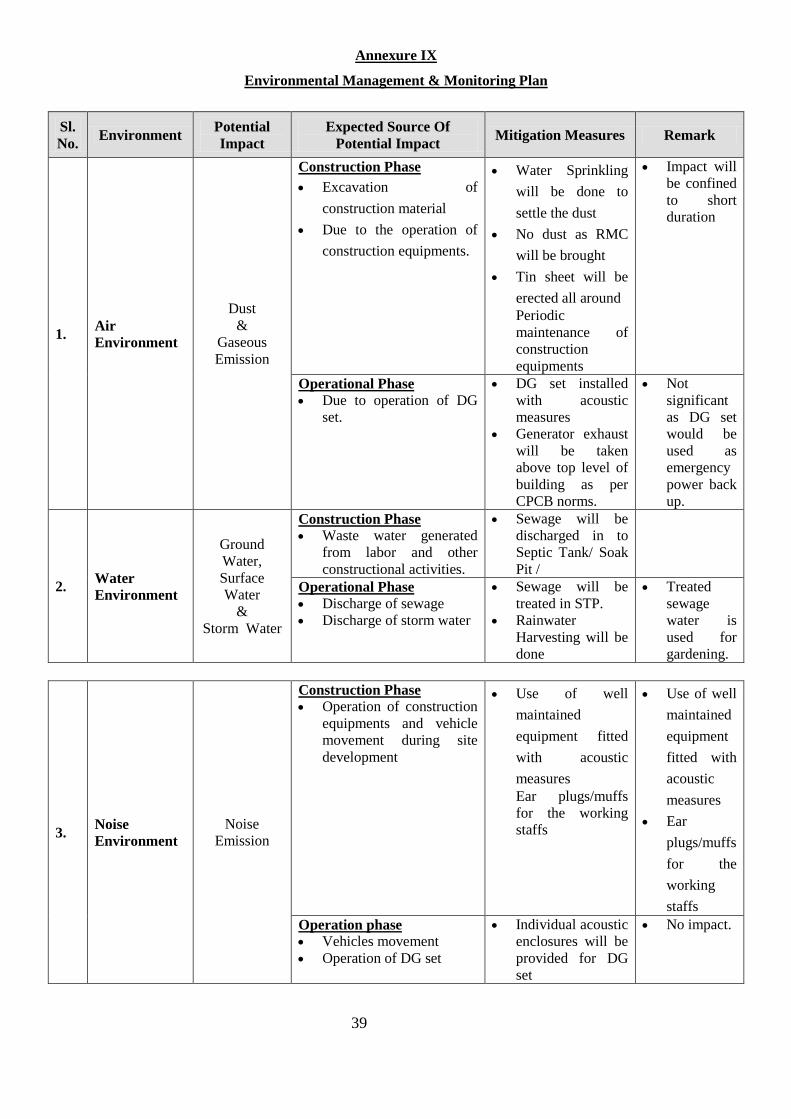
Annexure IX
Environmental Management & Monitoring Plan
Sl.
No. Environment
Potential
Impact
Expected Source Of
Potential Impact Mitigation Measures Remark
1. Air
Environment
Dust
&
Gaseous
Emission
Construction Phase
Excavation of
construction material
Due to the operation of
construction equipments.
Water Sprinkling
will be done to
settle the dust
No dust as RMC
will be brought
Tin sheet will be
erected all around
Periodic
maintenance of
construction
equipments
Impact will
be confined
to short
duration
Operational Phase
Due to operation of DG
set.
DG set installed
with acoustic
measures
Generator exhaust
will be taken
above top level of
building as per
CPCB norms.
Not
significant
as DG set
would be
used as
emergency
power back
up.
2. Water
Environment
Ground
Water,
Surface
Water
&
Storm Water
Construction Phase
Waste water generated
from labor and other
constructional activities.
Sewage will be
discharged in to
Septic Tank/ Soak
Pit /
Operational Phase
Discharge of sewage
Discharge of storm water
Sewage will be
treated in STP.
Rainwater
Harvesting will be
done
Treated
sewage
water is
used for
gardening.
3. Noise
Environment
Noise
Emission
Construction Phase
Operation of construction
equipments and vehicle
movement during site
development
Use of well
maintained
equipment fitted
with acoustic
measures
Ear plugs/muffs
for the working
staffs
Use of well
maintained
equipment
fitted with
acoustic
measures
Ear
plugs/muffs
for the
working
staffs
Operation phase
Vehicles movement
Operation of DG set
Individual acoustic
enclosures will be
provided for DG
set
No impact.
40
4. Solid Waste Soil Construction Phase
Disposal of construction
debris
Domestic waste by
labours
Construction
debris will be
collected and
suitability used on
site as per
construction waste
management plan
Operation Phase The paper and the plastic
used at the individual
level.
Food Waste/Kitchen
Waste in the form of
garbage and rubbish.
Reuse/Recycle of
the paper and
plastic waste.
Planned system for
waste collection,
segregation, and
disposal.
Solid
Waste will
be disposed
as per
guidelines
of
Municipal
Corporatio
n
5. Ecology No significant
Impact
Construction Phase
Site Development during
construction
Existing trees will
be retained or
replanted as per
the landscape plan.
Operational Phase
Increase of green cover
Suitable green belt
will be developed
as per landscaping
plan at site.
6. Traffic
Pattern
Increase of
vehicular
movements
Construction Phase
Heavy Vehicular
movement at site
Heavy Vehicular
movement will be
restricted to
daytime only and
adequate parking
facility will be
provided.
--
Operational Phase
Traffic due to commercial
once the site is
operational
Vehicular
movement will be
regulated inside
the site with
adequate roads and
parking.
--
41
Annexure X – EMP BUDGET
S.No Description Capital Cost In
Lakhs
Operational Cost
In Lakhs Per Annum
1 Environmental Monitoring 10 3
2 Sewerage System (Sewerage Network, Lift Stations/Pumping
Stations, Sewage Treatment Plant , Treated Water -Recycling
Network)
189 15
3 Storm Water Drain Network)
1. Drainage (with and without cover (based on design))
2. Rain Water Harvesting Arrangement
277 10
4 Solid Waste Management 8 2
5 Green Belt Development 50 10
TOTAL 534 40
Annexure XI
DISCLOSURE OF CONSULTANT
42
Annexure XII
FIRE PROTECTION MEASURES
This is a brief description of a number of fire protection measures, which will be used in building.
1) Fire Alarm Systems
The purpose of a fire alarm system is to alert all the occupants of the building that an emergency of fire
exists so that such occupants may put into practice the measures required by the Fire Safety Plan. All fire
alarm systems shall be maintained in full operation condition at all times. There are two main types of fire
alarm systems namely, single-stage systems and two-stage systems.
A) A single-stage system sounds a general alarm throughout the facility that may require total evacuation of
the building. Operation of the fire alarm is activated by a manual pull station, heat detector, smoke detector
or a sprinkler head.
B) A two-stage fire alarm system is designed to allow staff to investigate and take appropriate action and
may require evacuation of the fire affected area. The general alarm or second signal is reserved as a clear
indication for complete evacuation of the building where this proves necessary.
2) Exits
An exit is that part of a means of egress that leads from the floor area it serves to a public thoroughfare or to
an approved open space. Walls, floors, doors or other means provide a protected path necessary for
occupants to proceed with reasonable safety to a place of refuge. Vertical shafts accessed from above or
below grade are protected from the remainder of the building provided the doors leading to the shaft are kept
closed.
3) Fire Department Access
Fire Department access allows fire fighters and their equipment to gain access to the building. Vehicles
parked in the fire route, excessive vegetation, snow and other forms of obstructions to access routes, fire
hydrants and fire department connections are not
permitted by the Fire Code. Maintaining fire department access is an ongoing matter, in addition, access into
a building requires consideration (ie. with a key box, through preplanning, etc.).
4) Portable Extinguishers
Portable extinguishers are intended as a first-aid measure to cope with fires of limited size. The basic types
of fires are Class A, B and C. Portable extinguishers are rated for the corresponding classes of fire.
5) Standpipe and Hose Systems
A standpipe system is an arrangement of piping, valves and hose outlets installed in a building or structure
in such a manner that water can be discharged through a hose and nozzle for extinguishment of fire. The
system is connected to a water supply, which permits an adequate supply of water to the hose outlets.
6) Automatic Sprinkler Systems
An automatic sprinkler system is a series of underground and overhead piping designed in accordance with
the fire protection engineering standards. The system is connected to a water supply such as a storage tank
or municipal water supply. The system includes a controlling valve, a series of sprinkler heads and a device
for actuating an alarm when the system is in operation. The system is usually activated by heat from a fire
and discharges water over the fire area.
43
7) Water Supply
The total water supplies required for firefighting purposes may be supplied from various sources such as a
municipal water supply, storage tanks (elevated or underground), lakes, rivers, wells, swimming pools or a
combination of sources, and should be obtained within practical distances. Water supplies must be
accessible to firefighting equipment.
8) Fire Pumps
Fire pumps are used to ensure that the water required for fire fighting and automatic sprinkler and standpipe
and hose systems is available.
9) Emergency Power
Emergency power is required to ensure the continued operation of fire and life safety equipment and systems
in case of loss of normal power.
10) Emergency Lighting
Emergency lighting ensures that exits, corridors and principal routes providing access to exits are
illuminated in the event of loss of power.
Evacuation System
Successful and efficient evacuation depends on complete preplanning, organization, and supervision.
Planning includes these basic principles:
1. Building evacuation organization;
2. Evacuation policy and plans;
3. Detection and reporting (of fire or hazard);
4. Evacuation program coordination (of movement and evacuation);
5. Communication to direct movement and evacuation;
6. Inspection and evaluation.
Building evacuation and fire safety program
Written plan _ As soon as building occupancy begins, a written plan of fire and other emergency procedures
should be agreed upon by building management and responsible representatives of each building tenant.
The emergency evacuation plan should include:
1. An outline of the emergency evacuation organization plan and agreed-upon priorities, including
responsibilities and authorities. Building and tenant representatives should agree upon these.
2. Detection, emergency warning systems, and reporting procedures for fire and other hazards should be
provided.
3. Coordination of central building emergency evacuation control with assigned floor emergency evacuation
teams should provide for the orderly movement of persons. Pre-planning and “fire in progress” chain-of-
command instructions should be detailed, and each tenant should be required to acknowledge and comply.
4. In addition to a suitable and effective fire-detection system (automatic)
5. Building management and tenants should cooperate in an education and training program for all
emergency floor-evacuation teams, employees, and building visitors. This should include a system of
personal instruction for all building inhabitants and proper posting of instructions, placards, and evacuation
diagrams at strategic locations on every floor. Emergency fire procedure information should be prominently
posted in corridors.
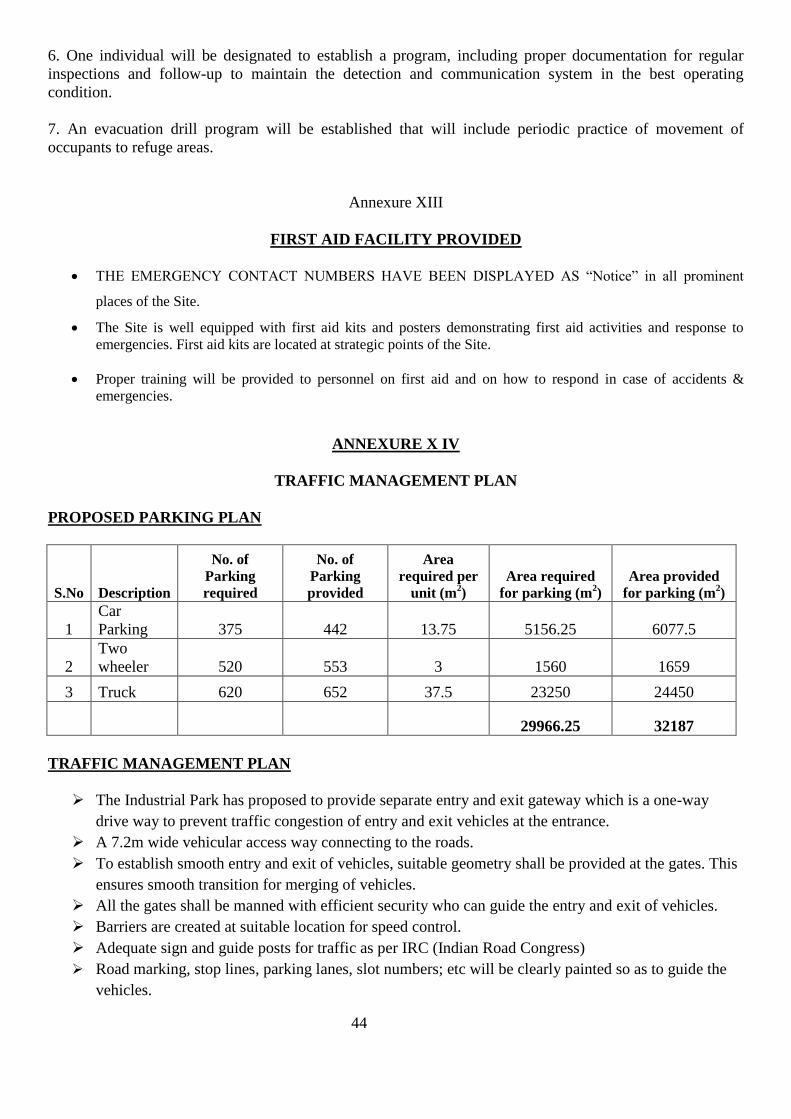
44
6. One individual will be designated to establish a program, including proper documentation for regular
inspections and follow-up to maintain the detection and communication system in the best operating
condition.
7. An evacuation drill program will be established that will include periodic practice of movement of
occupants to refuge areas.
Annexure XIII
FIRST AID FACILITY PROVIDED
THE EMERGENCY CONTACT NUMBERS HAVE BEEN DISPLAYED AS “Notice” in all prominent
places of the Site.
The Site is well equipped with first aid kits and posters demonstrating first aid activities and response to
emergencies. First aid kits are located at strategic points of the Site.
Proper training will be provided to personnel on first aid and on how to respond in case of accidents &
emergencies.
ANNEXURE X IV
TRAFFIC MANAGEMENT PLAN
PROPOSED PARKING PLAN
S.No Description
No. of
Parking
required
No. of
Parking
provided
Area
required per
unit (m2)
Area required
for parking (m2)
Area provided
for parking (m2)
1
Car
Parking 375 442 13.75 5156.25 6077.5
2
Two
wheeler 520 553 3 1560 1659
3 Truck 620 652 37.5 23250 24450
29966.25 32187
TRAFFIC MANAGEMENT PLAN
The Industrial Park has proposed to provide separate entry and exit gateway which is a one-way
drive way to prevent traffic congestion of entry and exit vehicles at the entrance.
A 7.2m wide vehicular access way connecting to the roads.
To establish smooth entry and exit of vehicles, suitable geometry shall be provided at the gates. This
ensures smooth transition for merging of vehicles.
All the gates shall be manned with efficient security who can guide the entry and exit of vehicles.
Barriers are created at suitable location for speed control.
Adequate sign and guide posts for traffic as per IRC (Indian Road Congress)
Road marking, stop lines, parking lanes, slot numbers; etc will be clearly painted so as to guide the
vehicles.
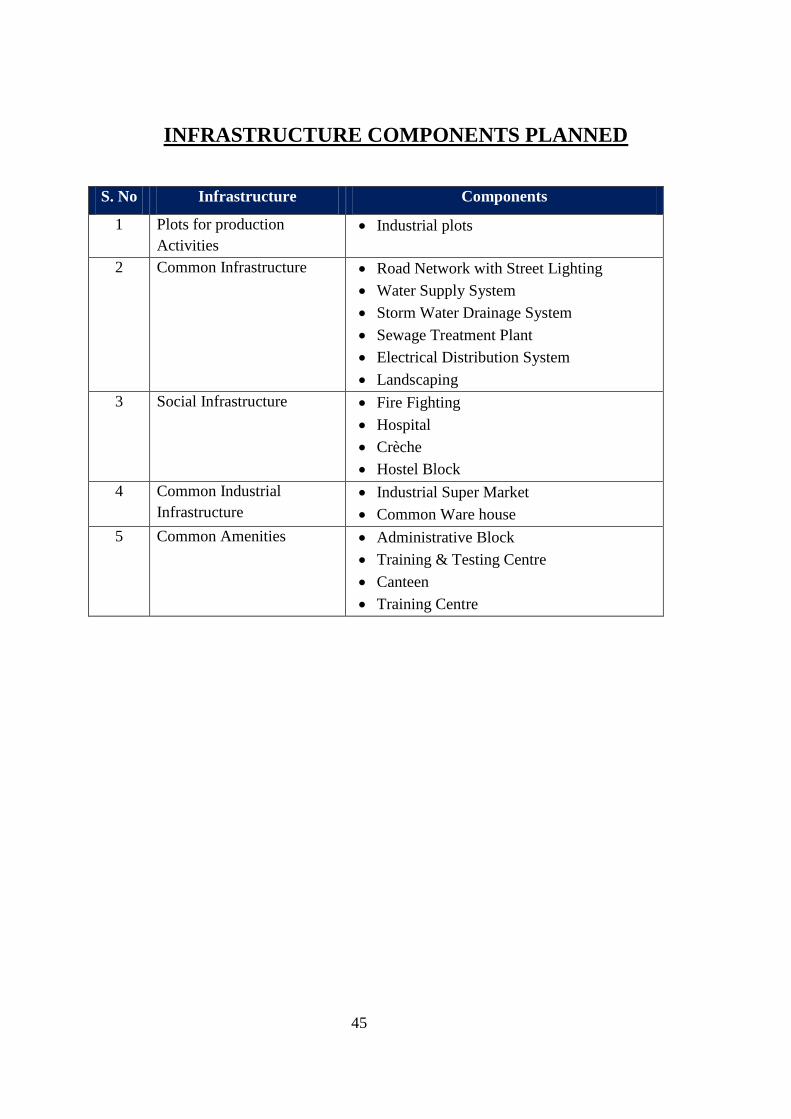
45
INFRASTRUCTURE COMPONENTS PLANNED
S. No Infrastructure Components
1 Plots for production
Activities
Industrial plots
2 Common Infrastructure Road Network with Street Lighting
Water Supply System
Storm Water Drainage System
Sewage Treatment Plant
Electrical Distribution System
Landscaping
3 Social Infrastructure Fire Fighting
Hospital
Crèche
Hostel Block
4 Common Industrial
Infrastructure
Industrial Super Market
Common Ware house
5 Common Amenities Administrative Block
Training & Testing Centre
Canteen
Training Centre
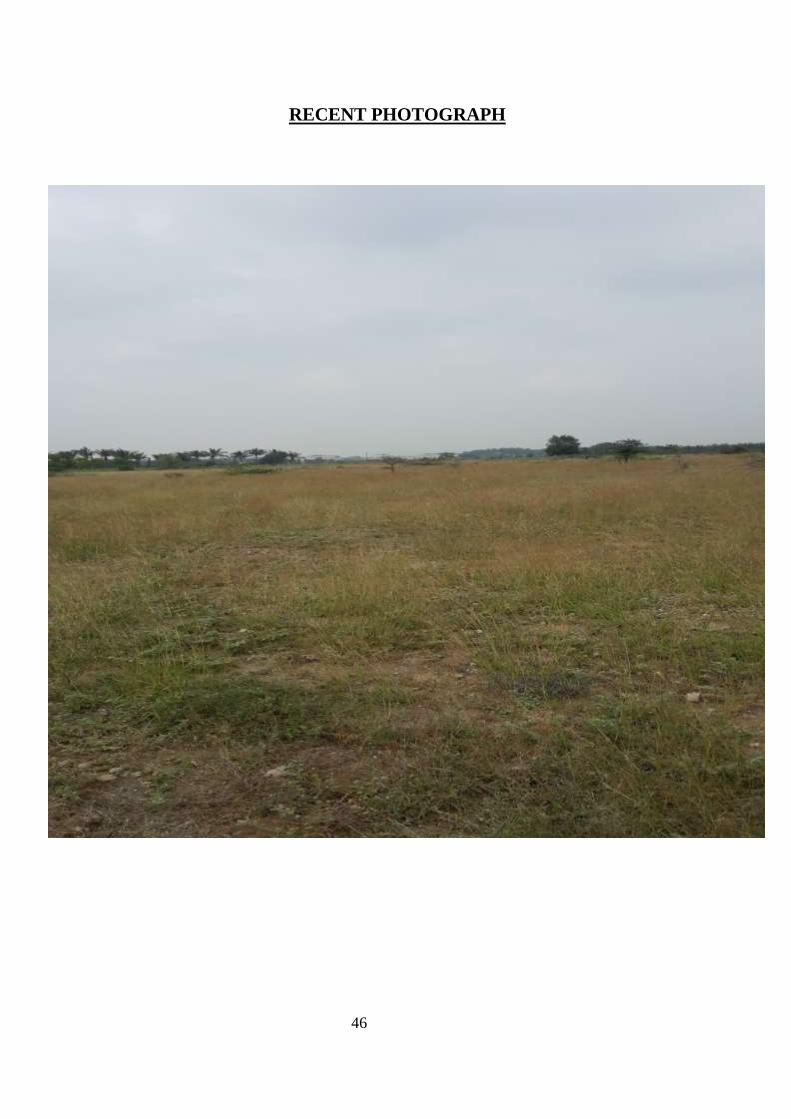
46
RECENT PHOTOGRAPH
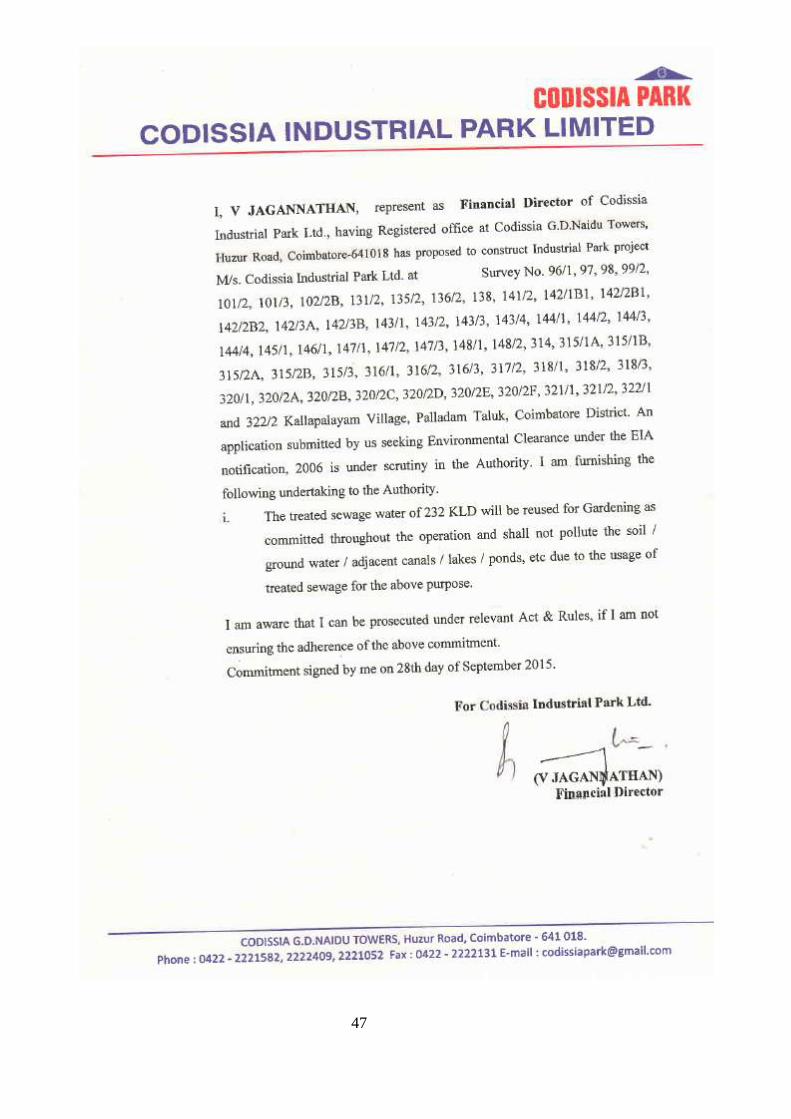
47
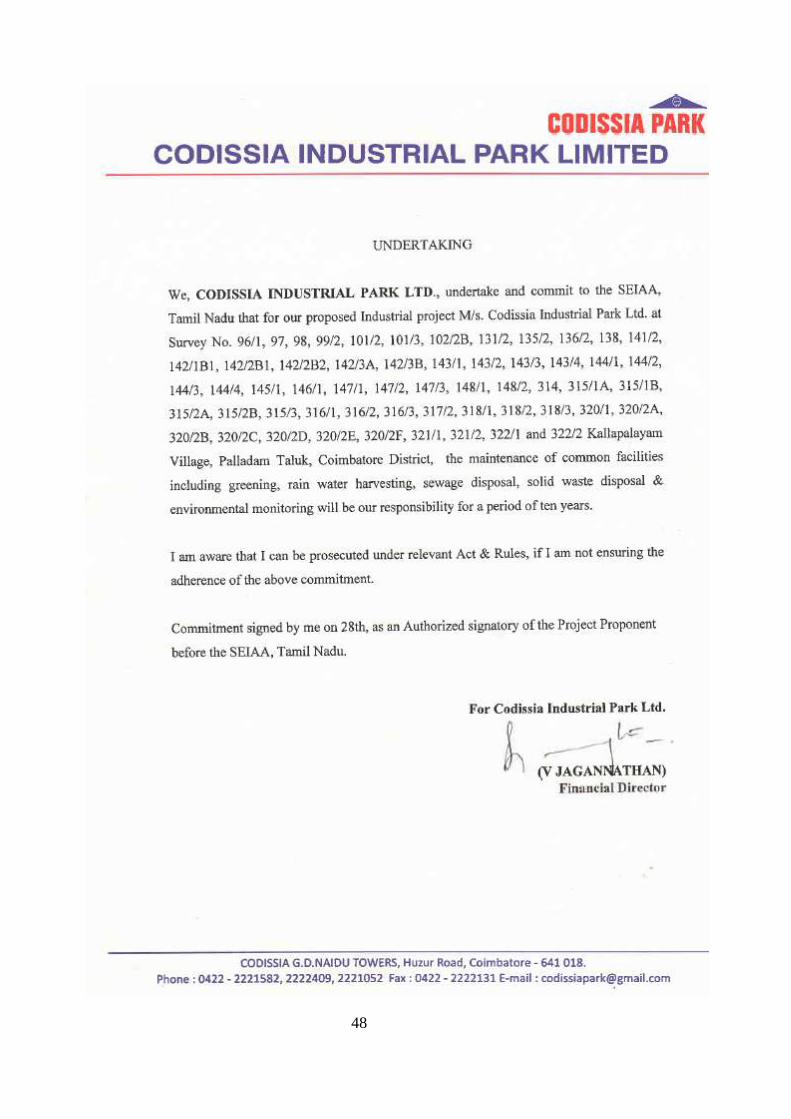
48
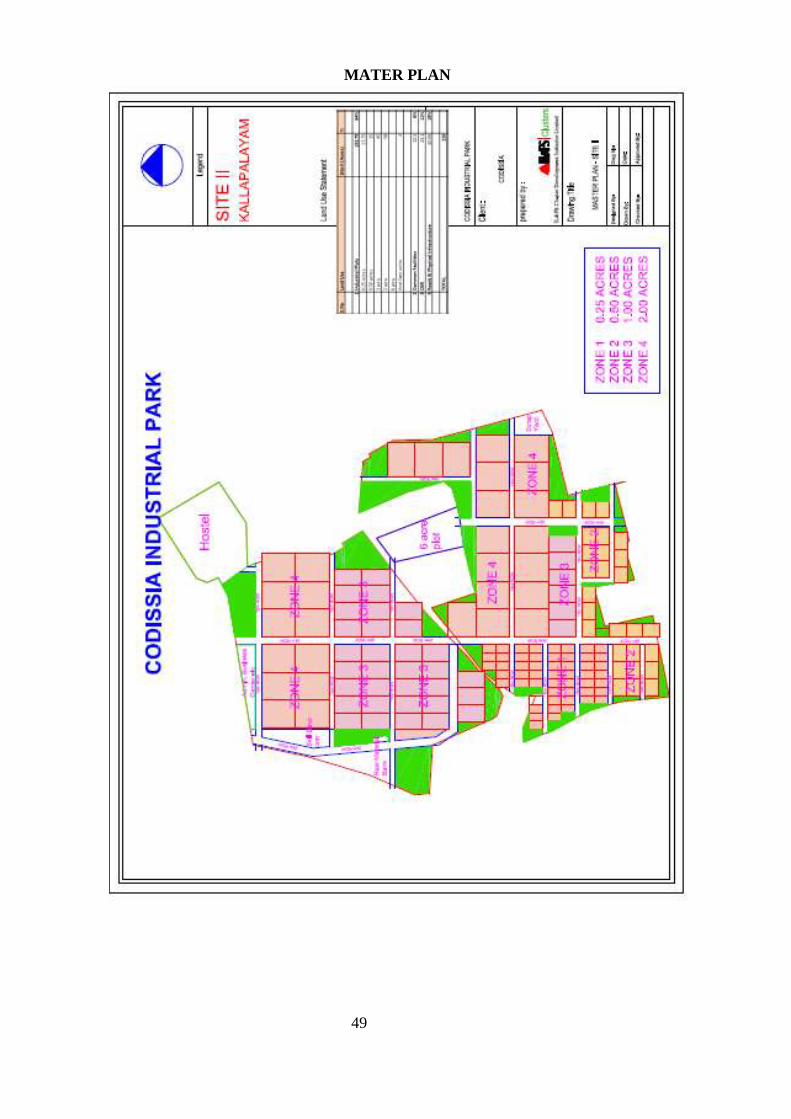
49
MATER PLAN
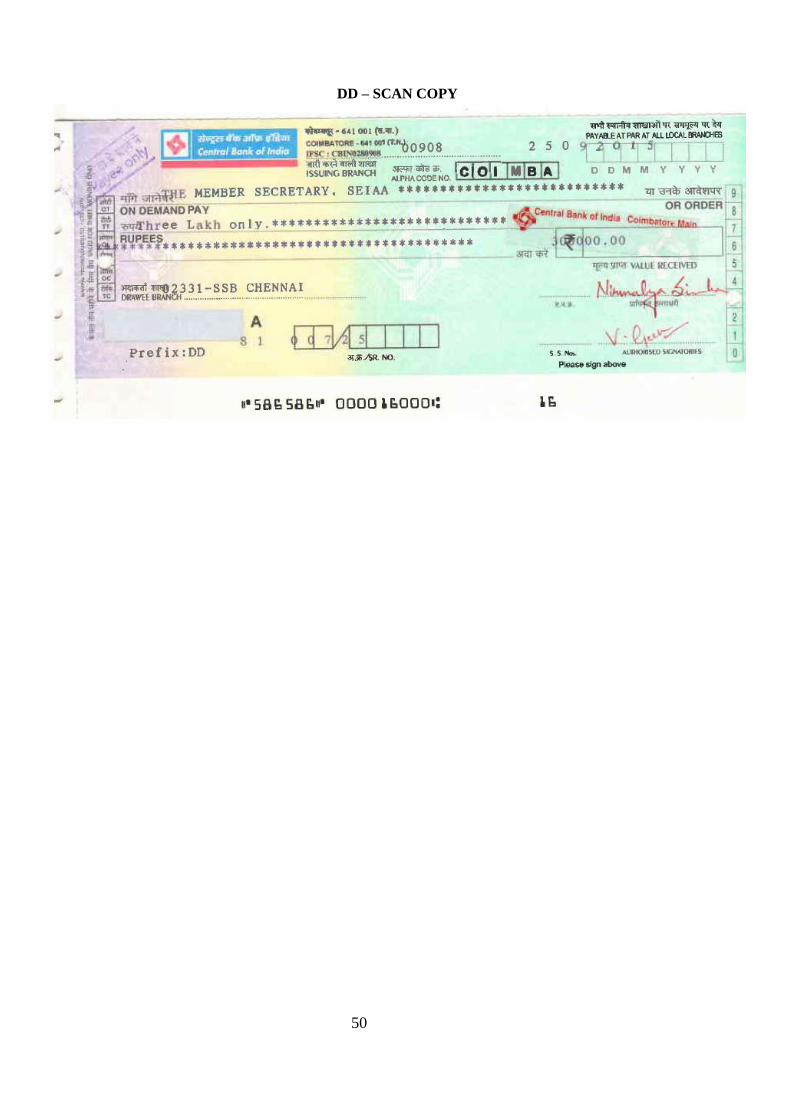
50
DD – SCAN COPY
Risk Assessment
Risk analysis involves the identification and assessment of risks the persons involved in the
proposed project and the neighboring populations are exposed to as a result of hazard
occurrence. This requires a thorough knowledge of failure probability, credible accident
scenario, vulnerability of population etc. Much of this information is difficult to get or
generate. Consequently, the risk analysis is often confined to maximum credible accident
studies.
In the sections below, the identification of various hazards, probable risks in the proposed
project, maximum credible accident analysis and consequences analysis, which give a broad
identification of risks involved, are addressed. Based on the risk estimation for fuel storage,
a Disaster Management Plan (DMP) has been presented.
Approach to the study
Risk involves the occurrence or potential occurrence of some accidents consisting of an
event or sequence of events. The risk assessment study covers the following:
Identification of potential hazard areas;
Identification of representative failure cases;
Visualization of the resulting scenarios in terms of fire (thermal radiation) and
explosion;
Assessment of the overall damage potential of the identified hazardous events and
the impact zones from the accidental scenarios;
Assessment of the overall suitability of the site from hazard minimization and
disaster mitigation points of view;
Furnishing specific recommendations on the minimization of the worst accident
possibilities; and
Preparation of broad Disaster Management Plan (DMP), On-site and Off-site
Emergency Plan, which includes Occupational and Health Safety Plan.
Hazard Identification
Identification of hazards in the proposed project is of primary significance in the analysis,
quantification and cost effective control of accidents involving HSD. A classical definition of
hazard states that hazard is in fact the characteristic that presents potential for an accident.
Hence, the components of the proposed project need to be thoroughly examined to assess
their potential for initiating or propagating an unplanned event/sequence of events, which
can be termed as an accident. The following two methods for hazard identification have
been employed in the study:
Identification of major hazardous units based on Manufacture, Storage and Import
of Hazardous Chemical Rules, 1989 of Government of India (GOI rules, 1989); and
Identification of hazardous units and storage units in IT/ITES SEZ based on relative
ranking technique, Fire Explosion and Toxicity Index (FE&TI)
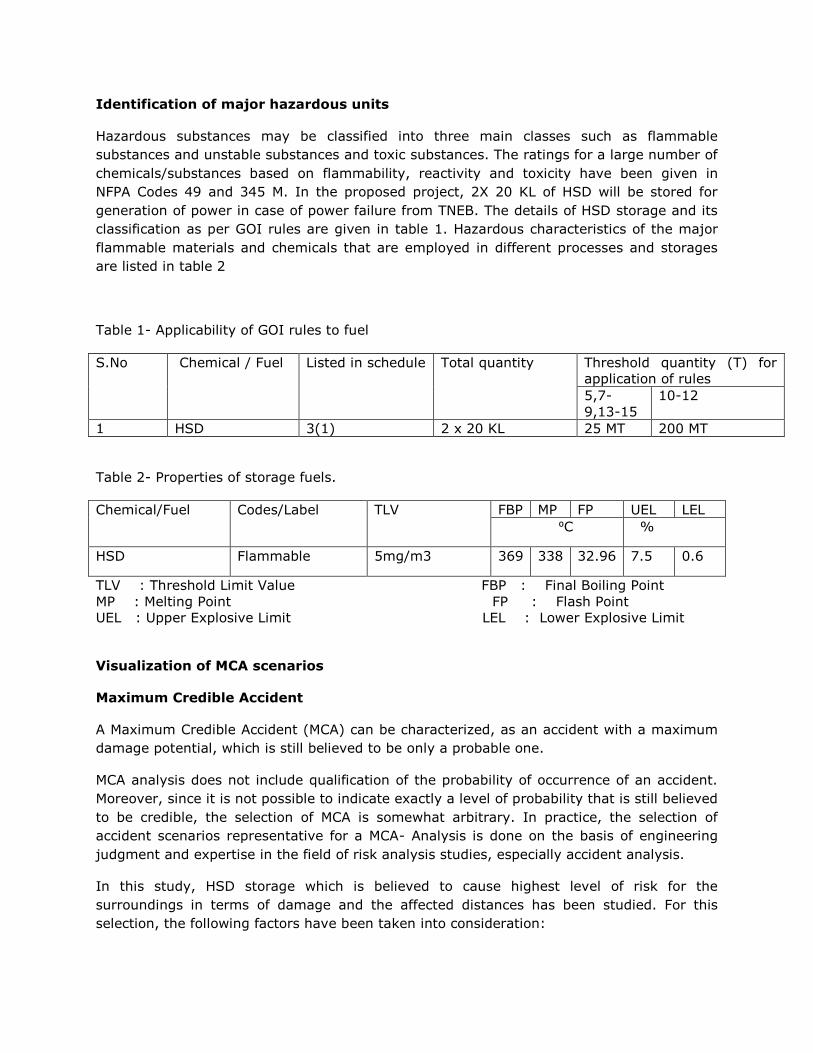
Identification of major hazardous units
Hazardous substances may be classified into three main classes such as flammable
substances and unstable substances and toxic substances. The ratings for a large number of
chemicals/substances based on flammability, reactivity and toxicity have been given in
NFPA Codes 49 and 345 M. In the proposed project, 2X 20 KL of HSD will be stored for
generation of power in case of power failure from TNEB. The details of HSD storage and its
classification as per GOI rules are given in table 1. Hazardous characteristics of the major
flammable materials and chemicals that are employed in different processes and storages
are listed in table 2
Table 1- Applicability of GOI rules to fuel
S.No Chemical / Fuel Listed in schedule Total quantity Threshold quantity (T) for
application of rules
5,7-
9,13-15
10-12
1 HSD 3(1) 2 x 20 KL 25 MT 200 MT
Table 2- Properties of storage fuels.
Chemical/Fuel
Codes/Label TLV FBP MP FP UEL LEL
⁰C %
HSD Flammable 5mg/m3 369 338 32.96 7.5 0.6
TLV : Threshold Limit Value FBP : Final Boiling Point
MP : Melting Point FP : Flash Point
UEL : Upper Explosive Limit LEL : Lower Explosive Limit
Visualization of MCA scenarios
Maximum Credible Accident
A Maximum Credible Accident (MCA) can be characterized, as an accident with a maximum
damage potential, which is still believed to be only a probable one.
MCA analysis does not include qualification of the probability of occurrence of an accident.
Moreover, since it is not possible to indicate exactly a level of probability that is still believed
to be credible, the selection of MCA is somewhat arbitrary. In practice, the selection of
accident scenarios representative for a MCA- Analysis is done on the basis of engineering
judgment and expertise in the field of risk analysis studies, especially accident analysis.
In this study, HSD storage which is believed to cause highest level of risk for the
surroundings in terms of damage and the affected distances has been studied. For this
selection, the following factors have been taken into consideration:
Type of compound like flammable;
Quantity of HSD present in the proposed project site; and
Storage conditions such as temperature, pressure and flow.
In addition to the above factors, the location of HSD storage tanks with reference to the
adjacent activities is taken into consideration for identifying the potential escalation of an
accident. This phenomenon is known as the domino effect. Accident scenarios are
established and effect and damage calculations are carried out for Maximum Credible
Accident Analysis Studies.
Methodology
Following aspects have been studied for visualization of MCA scenarios:
Flammable characteristics of HSD;
Identification of accident scenarios;
Analysis of past accidents taken place in similar conditions to establish credibility to
identified scenarios; and
Short-listing of MCA scenarios.
Common causes of accidents
Based on the analysis of past accident information, common causes of accidents are
identified as:
Proper housekeeping;
Improper use of tools, equipments, facilities;
Unsafe or defective equipment facilities;
Lack of proper procedure;
Failure to follow prescribed procedures;
Jobs not understood
Lack of awareness of involved hazards;
Lack of guides and safety devices; and
Lack of protective equipment and clothing.
Failures of human systems
Major causes of human failures reported are due to:
Stress induced by poor equipment design, unfavorable environmental conditions,
fatigue, etc;
Lack of training in safety and loss prevention;
Indecision in critical situations; and
Inexperienced staff being employed in hazardous situations.
Often, human errors are not analyzed while accidents reporting and accident reports only
provide information about equipment and/or component failures. Hence, a great deal of
uncertainty surrounds analysis of failure of human systems and consequent damages.
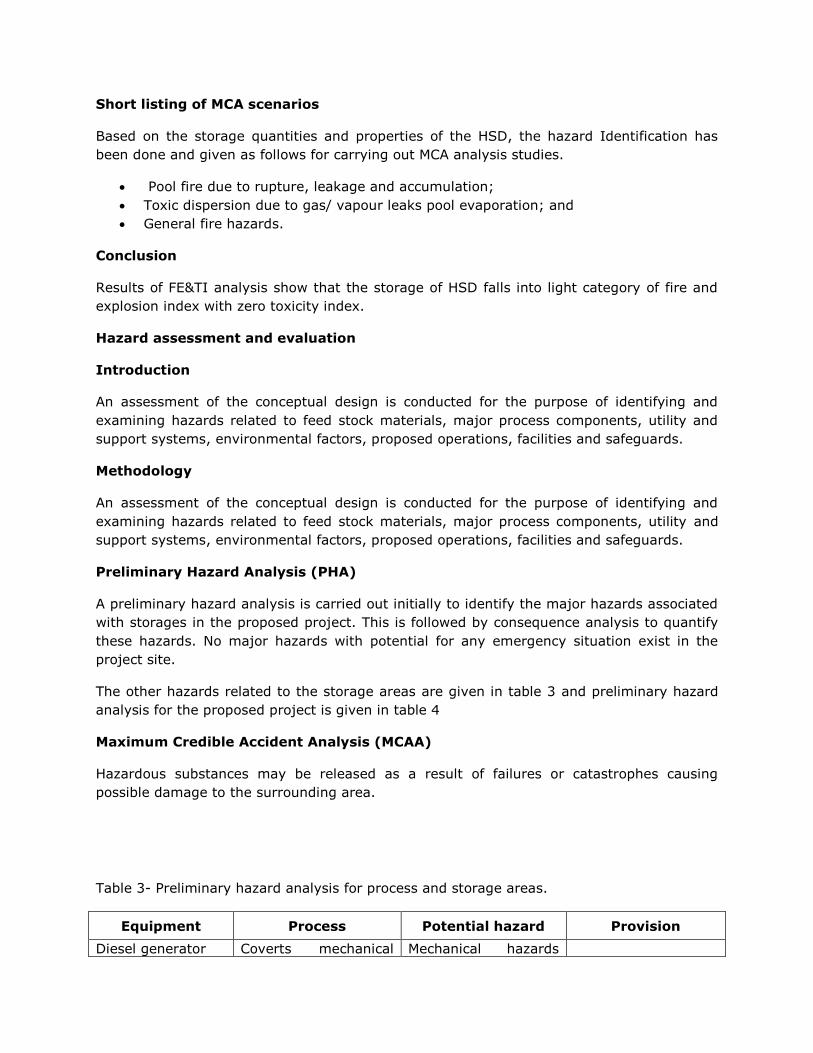
Short listing of MCA scenarios
Based on the storage quantities and properties of the HSD, the hazard Identification has
been done and given as follows for carrying out MCA analysis studies.
Pool fire due to rupture, leakage and accumulation;
Toxic dispersion due to gas/ vapour leaks pool evaporation; and
General fire hazards.
Conclusion
Results of FE&TI analysis show that the storage of HSD falls into light category of fire and
explosion index with zero toxicity index.
Hazard assessment and evaluation
Introduction
An assessment of the conceptual design is conducted for the purpose of identifying and
examining hazards related to feed stock materials, major process components, utility and
support systems, environmental factors, proposed operations, facilities and safeguards.
Methodology
An assessment of the conceptual design is conducted for the purpose of identifying and
examining hazards related to feed stock materials, major process components, utility and
support systems, environmental factors, proposed operations, facilities and safeguards.
Preliminary Hazard Analysis (PHA)
A preliminary hazard analysis is carried out initially to identify the major hazards associated
with storages in the proposed project. This is followed by consequence analysis to quantify
these hazards. No major hazards with potential for any emergency situation exist in the
project site.
The other hazards related to the storage areas are given in table 3 and preliminary hazard
analysis for the proposed project is given in table 4
Maximum Credible Accident Analysis (MCAA)
Hazardous substances may be released as a result of failures or catastrophes causing
possible damage to the surrounding area.
Table 3- Preliminary hazard analysis for process and storage areas.
Equipment Process Potential hazard Provision
Diesel generator Coverts mechanical Mechanical hazards
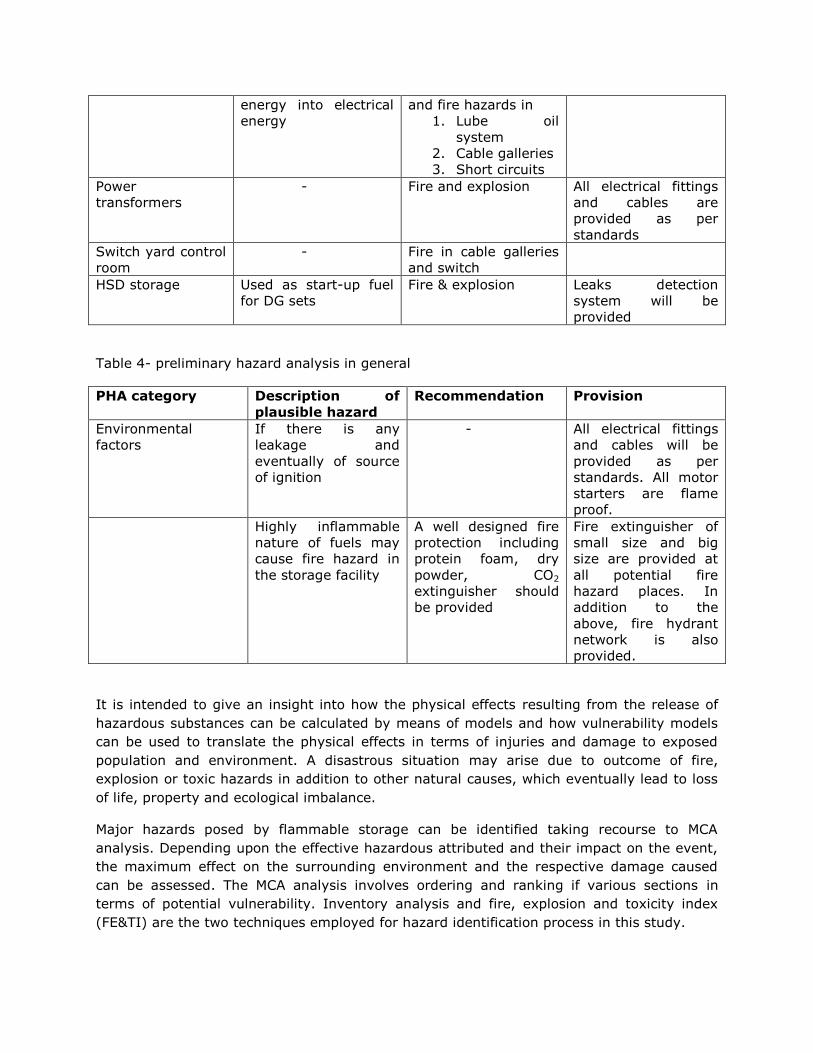
energy into electrical
energy
and fire hazards in
1. Lube oil
system
2. Cable galleries
3. Short circuits
Power
transformers
- Fire and explosion All electrical fittings
and cables are
provided as per
standards
Switch yard control
room
- Fire in cable galleries
and switch
HSD storage Used as start-up fuel
for DG sets
Fire & explosion Leaks detection
system will be
provided
Table 4- preliminary hazard analysis in general
PHA category Description of
plausible hazard
Recommendation Provision
Environmental
factors
If there is any
leakage and
eventually of source
of ignition
- All electrical fittings
and cables will be
provided as per
standards. All motor
starters are flame
proof.
Highly inflammable
nature of fuels may
cause fire hazard in
the storage facility
A well designed fire
protection including
protein foam, dry
powder, CO2
extinguisher should
be provided
Fire extinguisher of
small size and big
size are provided at
all potential fire
hazard places. In
addition to the
above, fire hydrant
network is also
provided.
It is intended to give an insight into how the physical effects resulting from the release of
hazardous substances can be calculated by means of models and how vulnerability models
can be used to translate the physical effects in terms of injuries and damage to exposed
population and environment. A disastrous situation may arise due to outcome of fire,
explosion or toxic hazards in addition to other natural causes, which eventually lead to loss
of life, property and ecological imbalance.
Major hazards posed by flammable storage can be identified taking recourse to MCA
analysis. Depending upon the effective hazardous attributed and their impact on the event,
the maximum effect on the surrounding environment and the respective damage caused
can be assessed. The MCA analysis involves ordering and ranking if various sections in
terms of potential vulnerability. Inventory analysis and fire, explosion and toxicity index
(FE&TI) are the two techniques employed for hazard identification process in this study.
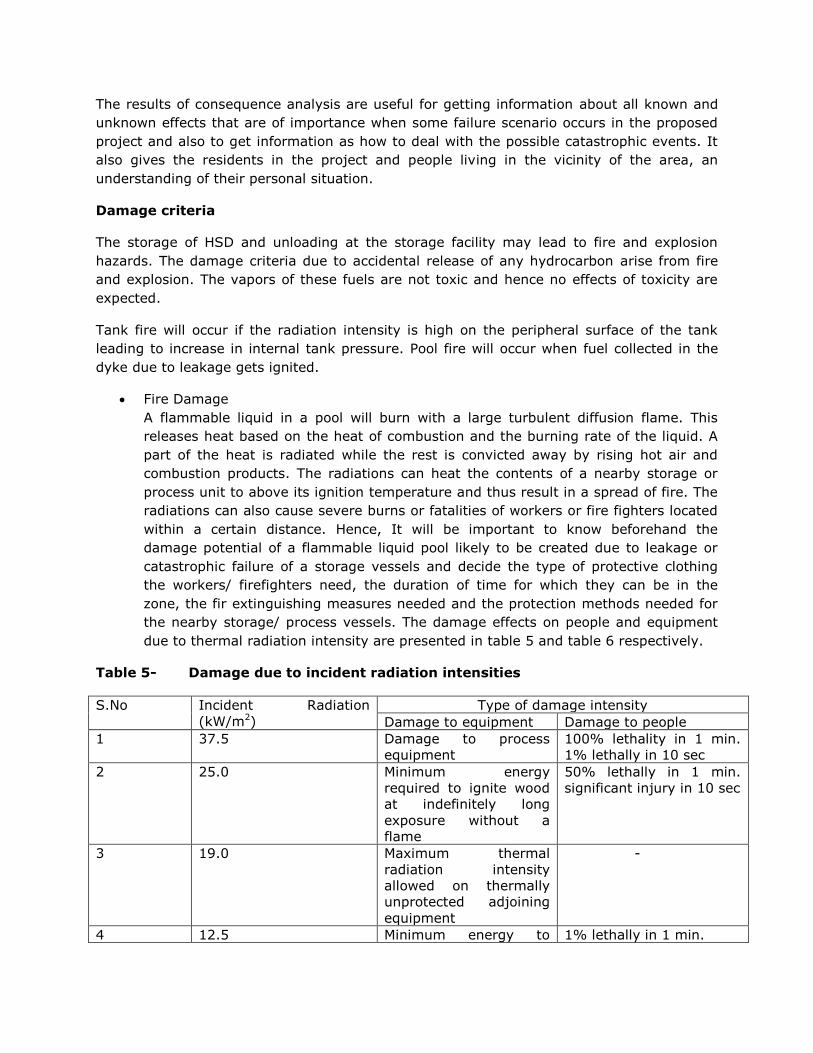
The results of consequence analysis are useful for getting information about all known and
unknown effects that are of importance when some failure scenario occurs in the proposed
project and also to get information as how to deal with the possible catastrophic events. It
also gives the residents in the project and people living in the vicinity of the area, an
understanding of their personal situation.
Damage criteria
The storage of HSD and unloading at the storage facility may lead to fire and explosion
hazards. The damage criteria due to accidental release of any hydrocarbon arise from fire
and explosion. The vapors of these fuels are not toxic and hence no effects of toxicity are
expected.
Tank fire will occur if the radiation intensity is high on the peripheral surface of the tank
leading to increase in internal tank pressure. Pool fire will occur when fuel collected in the
dyke due to leakage gets ignited.
Fire Damage
A flammable liquid in a pool will burn with a large turbulent diffusion flame. This
releases heat based on the heat of combustion and the burning rate of the liquid. A
part of the heat is radiated while the rest is convicted away by rising hot air and
combustion products. The radiations can heat the contents of a nearby storage or
process unit to above its ignition temperature and thus result in a spread of fire. The
radiations can also cause severe burns or fatalities of workers or fire fighters located
within a certain distance. Hence, It will be important to know beforehand the
damage potential of a flammable liquid pool likely to be created due to leakage or
catastrophic failure of a storage vessels and decide the type of protective clothing
the workers/ firefighters need, the duration of time for which they can be in the
zone, the fir extinguishing measures needed and the protection methods needed for
the nearby storage/ process vessels. The damage effects on people and equipment
due to thermal radiation intensity are presented in table 5 and table 6 respectively.
Table 5- Damage due to incident radiation intensities
S.No Incident Radiation
(kW/m2)
Type of damage intensity
Damage to equipment Damage to people
1 37.5 Damage to process
equipment
100% lethality in 1 min.
1% lethally in 10 sec
2 25.0 Minimum energy
required to ignite wood
at indefinitely long
exposure without a
flame
50% lethally in 1 min.
significant injury in 10 sec
3 19.0 Maximum thermal
radiation intensity
allowed on thermally
unprotected adjoining
equipment
-
4 12.5 Minimum energy to 1% lethally in 1 min.
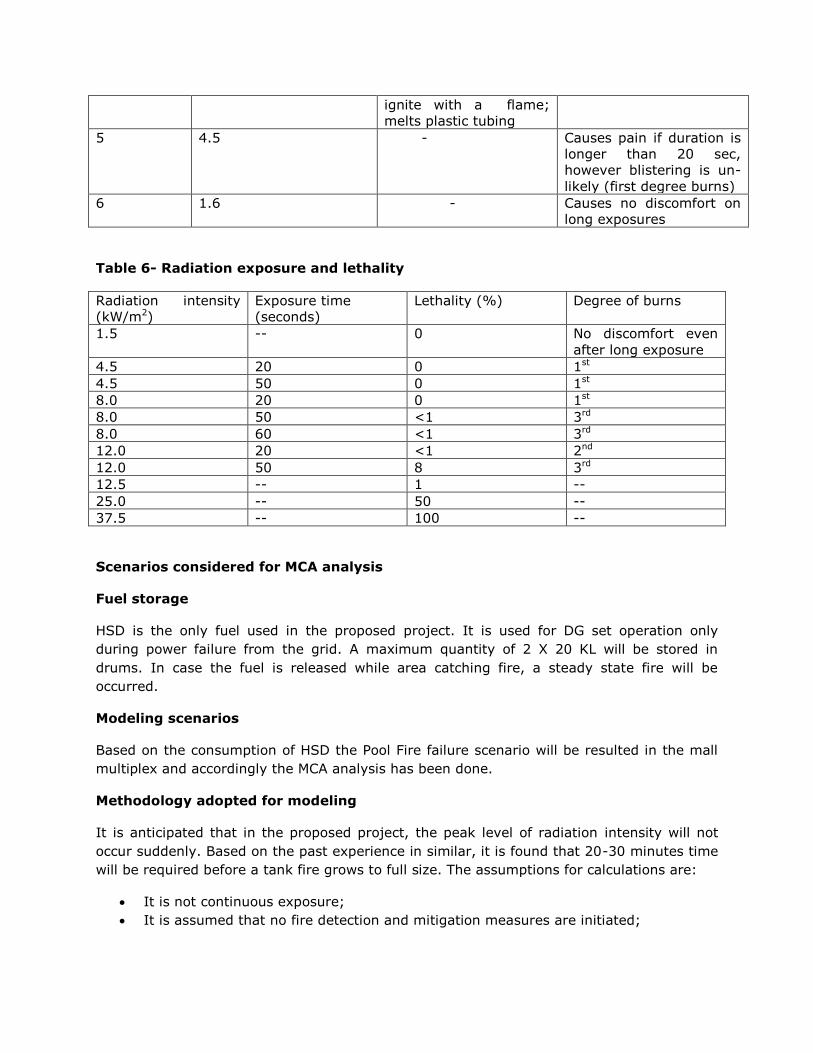
ignite with a flame;
melts plastic tubing
5 4.5 - Causes pain if duration is
longer than 20 sec,
however blistering is un-
likely (first degree burns)
6 1.6 - Causes no discomfort on
long exposures
Table 6- Radiation exposure and lethality
Radiation intensity
(kW/m2)
Exposure time
(seconds)
Lethality (%) Degree of burns
1.5 -- 0 No discomfort even
after long exposure
4.5 20 0 1st
4.5 50 0 1st
8.0 20 0 1st
8.0 50 <1 3rd
8.0 60 <1 3rd
12.0 20 <1 2nd
12.0 50 8 3rd
12.5 -- 1 --
25.0 -- 50 --
37.5 -- 100 --
Scenarios considered for MCA analysis
Fuel storage
HSD is the only fuel used in the proposed project. It is used for DG set operation only
during power failure from the grid. A maximum quantity of 2 X 20 KL will be stored in
drums. In case the fuel is released while area catching fire, a steady state fire will be
occurred.
Modeling scenarios
Based on the consumption of HSD the Pool Fire failure scenario will be resulted in the mall
multiplex and accordingly the MCA analysis has been done.
Methodology adopted for modeling
It is anticipated that in the proposed project, the peak level of radiation intensity will not
occur suddenly. Based on the past experience in similar, it is found that 20-30 minutes time
will be required before a tank fire grows to full size. The assumptions for calculations are:
It is not continuous exposure;
It is assumed that no fire detection and mitigation measures are initiated;
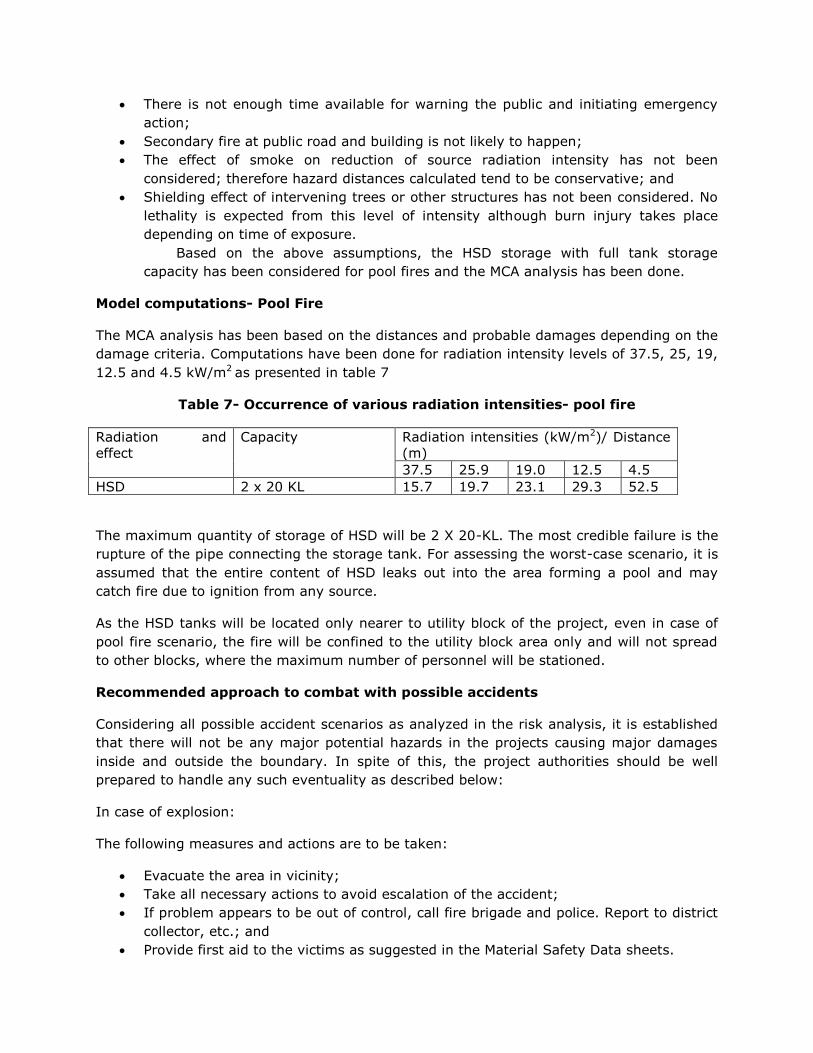
There is not enough time available for warning the public and initiating emergency
action;
Secondary fire at public road and building is not likely to happen;
The effect of smoke on reduction of source radiation intensity has not been
considered; therefore hazard distances calculated tend to be conservative; and
Shielding effect of intervening trees or other structures has not been considered. No
lethality is expected from this level of intensity although burn injury takes place
depending on time of exposure.
Based on the above assumptions, the HSD storage with full tank storage
capacity has been considered for pool fires and the MCA analysis has been done.
Model computations- Pool Fire
The MCA analysis has been based on the distances and probable damages depending on the
damage criteria. Computations have been done for radiation intensity levels of 37.5, 25, 19,
12.5 and 4.5 kW/m2 as presented in table 7
Table 7- Occurrence of various radiation intensities- pool fire
Radiation and
effect
Capacity Radiation intensities (kW/m2)/ Distance
(m)
37.5 25.9 19.0 12.5 4.5
HSD 2 x 20 KL 15.7 19.7 23.1 29.3 52.5
The maximum quantity of storage of HSD will be 2 X 20-KL. The most credible failure is the
rupture of the pipe connecting the storage tank. For assessing the worst-case scenario, it is
assumed that the entire content of HSD leaks out into the area forming a pool and may
catch fire due to ignition from any source.
As the HSD tanks will be located only nearer to utility block of the project, even in case of
pool fire scenario, the fire will be confined to the utility block area only and will not spread
to other blocks, where the maximum number of personnel will be stationed.
Recommended approach to combat with possible accidents
Considering all possible accident scenarios as analyzed in the risk analysis, it is established
that there will not be any major potential hazards in the projects causing major damages
inside and outside the boundary. In spite of this, the project authorities should be well
prepared to handle any such eventuality as described below:
In case of explosion:
The following measures and actions are to be taken:
Evacuate the area in vicinity;
Take all necessary actions to avoid escalation of the accident;
If problem appears to be out of control, call fire brigade and police. Report to district
collector, etc.; and
Provide first aid to the victims as suggested in the Material Safety Data sheets.
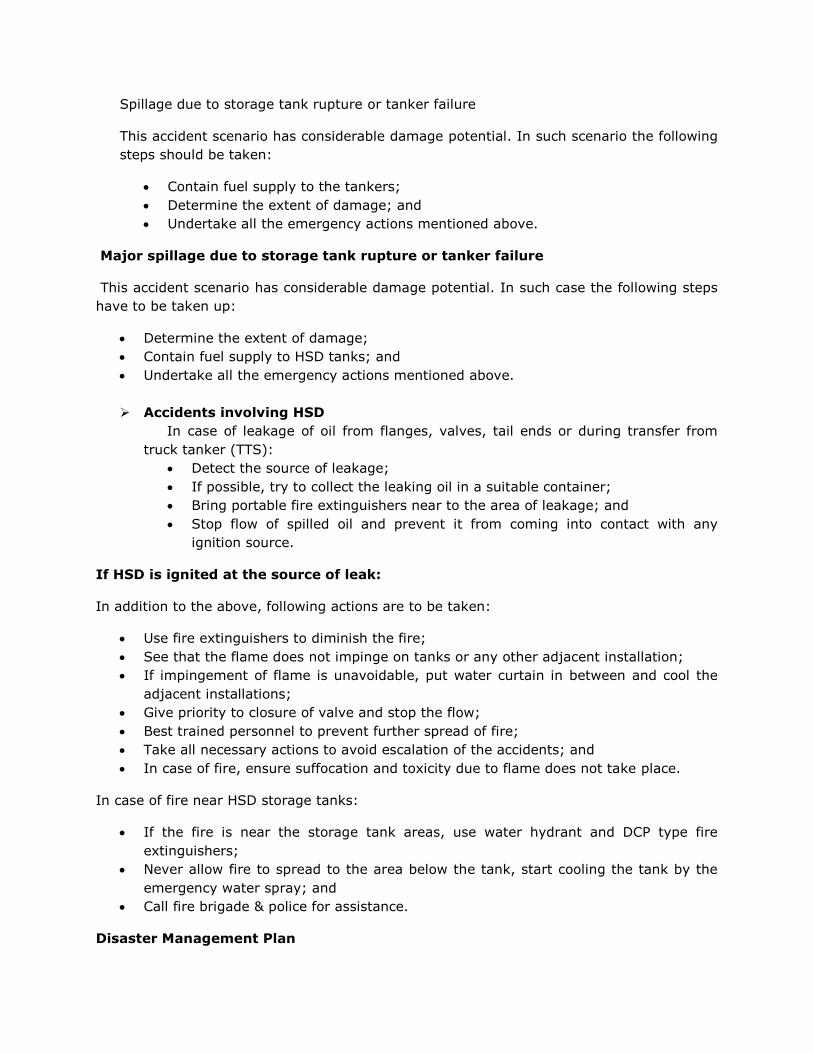
Spillage due to storage tank rupture or tanker failure
This accident scenario has considerable damage potential. In such scenario the following
steps should be taken:
Contain fuel supply to the tankers;
Determine the extent of damage; and
Undertake all the emergency actions mentioned above.
Major spillage due to storage tank rupture or tanker failure
This accident scenario has considerable damage potential. In such case the following steps
have to be taken up:
Determine the extent of damage;
Contain fuel supply to HSD tanks; and
Undertake all the emergency actions mentioned above.
Accidents involving HSD
In case of leakage of oil from flanges, valves, tail ends or during transfer from
truck tanker (TTS):
Detect the source of leakage;
If possible, try to collect the leaking oil in a suitable container;
Bring portable fire extinguishers near to the area of leakage; and
Stop flow of spilled oil and prevent it from coming into contact with any
ignition source.
If HSD is ignited at the source of leak:
In addition to the above, following actions are to be taken:
Use fire extinguishers to diminish the fire;
See that the flame does not impinge on tanks or any other adjacent installation;
If impingement of flame is unavoidable, put water curtain in between and cool the
adjacent installations;
Give priority to closure of valve and stop the flow;
Best trained personnel to prevent further spread of fire;
Take all necessary actions to avoid escalation of the accidents; and
In case of fire, ensure suffocation and toxicity due to flame does not take place.
In case of fire near HSD storage tanks:
If the fire is near the storage tank areas, use water hydrant and DCP type fire
extinguishers;
Never allow fire to spread to the area below the tank, start cooling the tank by the
emergency water spray; and
Call fire brigade & police for assistance.
Disaster Management Plan
A disaster is a catastrophic situation in which suddenly, people are plunged into
helplessness and suffering, as a result, need protection, clothing, shelter, medical and social
care and other necessities of life.
Disaster can be divided into two main groups. In the first, disasters resulting from
natural phenomena like earthquakes, volcanic eruptions, storm surges, cyclones, tropical
storms, floods, avalanches, landslides, forest fires, etc. The second group includes
disastrous events occasioned by man, or man‟s impact upon the environment. Examples are
armed conflict, radiation accidents, campus fires and river pollution, air, sea, rail and road
transport accidents and can reach catastrophic dimensions in terms of human loss.
There can be no set criteria for assessing the gravity of a disaster in the abstract since
this depends to a large extent on the physical, economic and social environment in which it
occurs. What would be considered a major disaster in a developing country, ill equipped to
cope with the problems involved may not mean more than a temporary emergency
elsewhere. However, all disaster brings in their wake similar consequences that call for
immediate action, whether at the local, national or international level, for the rescue and
relief of the victims. This includes the search for the dead and injured and removal of debris
and social care, the provision of temporary shelter to the homeless food, clothing and
medical supplies and rapid re-establishment of essential services.
Objectives of Disaster Management Plan (DMP)
The disaster Management Plan is aimed to ensure safety of life, protection of
environment, protection of installation, restoration of production and salvage operations in
this same order of priorities. For effective implementation of the Disaster Management Plan,
it will be widely circulated and personnel training given through rehearsals/drills.
The disaster Management Plan would reflect the probable, consequential severalties of
the undesired event due to deteriorating conditions or through „knock on‟ effects. Further
the management should be able to demonstrate that their assessment of the consequences
uses good supporting evidence and is based on currently available and reliable information,
incident data from internal and external sources and if necessary the reports of outside
agencies.
To tackle the consequences of a major emergency inside the factory or immediate
vicinity if the factory, a Disaster Management Plan has to be formulated and this planned
emergency document is called “Disaster Management Plan”.
The objective of Disaster Management Plan is to make use of the combine resources of
the plant and the outside services to achieve the following:
Effect the rescue and medical treatment of causalities;
Safeguard other people;
Minimize damage to property and the environment;
Initially contain and ultimately bring the incident under control;
Identify any dead;
Provide for needs of relatives;
Provide authoritative information to the news media;
Secure the safe rehabilitation of affected area; and
Preserve relevant records and equipment for subsequent inquiry into the cause and
circumstances of the Emergency.
In effect, it is to optimize operational efficiency to rescue rehabilitation and render
medical help and to restore normalcy.
Social Impact Assessment
The impact of the proposed project will begin with the starting up of the construction
activities at the site. The proposed construction will provide employment to considerable
number of skilled and semi-skilled and un-skilled construction laborers. In normal
circumstances, the local people will be given preference for the unskilled activities, as there
are many construction laborers in the vicinity of the project and are expected to be available
with normal wages. Presently, a large number of skilled and semi-skilled technicians and
laborers who in-migrated from various parts of India have been engaged in many
companies on wages/contract basis. Similar technicians and skilled workers will either be
brought or sourced from the local area for construction of the proposed project.
The peak labor force required during the construction period will be about 1000
per day and it is anticipated that about two third of the labor force will be sourced from the
local area. Provision of wage employment to the local populace during construction period of
the project will benefit the local area to some extent. This will enhance the income levels of
the construction phase of the proposed project, which will be positive impact due to the
project.
In addition, the real estate in the region will get a boon and the land prices likely
to shoot-up as part of speculation.
Normally, the construction activity will benefit the local populace in a number of
ways, which include the requirement of skilled, semi-skilled and un-skilled construction
laborers, tertiary sector employment and provision of goods and services for daily needs
including transport. In line with the above, some more recommendations are given below:
Local people will be given preference;
All the guidelines under the Labour Act and Safety Rules as specified under Factories
Act, 1948 will be implemented during the construction work to avoid any accidents;
The contractor will be instructed to provide cooking fuel to the workers to prevent
damage to trees. This will be part of the contractual agreement between the project
proponent and the contractor engaged for construction; and
The construction site will be secured with fencing and will have guarded entry points.

Rehabilitation & resettlement action phase
The proposed project does not involve any Rehabilitation & Resettlement Issues, as the
entire land required for the proposed project is available under project proponent.
Related Documents