MRI predictors of cognitive change in a diverse and carefully characterized elderly population Owen Carmichael a, *, Dan Mungas a , Laurel Beckett b , Danielle Harvey b , Sarah Tomaszewski Farias a , Bruce Reed a,c , John Olichney a , Joshua Miller d , Charles DeCarli a a Department of Neurology, School of Medicine, University of California, Davis b Department of Public Health Sciences, School of Medicine, University of California, Davis c Veterans Administration Northern California Health Care System d Department of Pathology, School of Medicine, University of California, Davis Abstract Background. Trajectories of cognitive decline among elderly individuals are heterogeneous, and markers that have high reliability for predicting cognitive trajectories across a broad spectrum of the elderly population have yet to be identified. Method. This study examined the utility of a variety of MRI-based brain measures, obtained at baseline, as predictors of subsequent declines in domain-specific measures of cognitive function in a cohort of 307 community-dwelling elderly individuals with varying degrees of cognitive impairment who were diverse across several relevant demographic variables and were evaluated yearly. Psychometrically matched measures of cognition were used to assess episodic memory, semantic memory, and executive function. Relationships between baseline MRI measures, including the volumes of the brain, hippocampus, and white matter hyperintensities (WMH), and cognitive trajectories were assessed in mixed effects regression models that modeled MRI effects on cognitive performance at baseline and rate of change as well as interindividual variability in cognitive baseline and rate of change. Results. Greater baseline brain volume predicted slower subsequent rate of decline in episodic memory and smaller WMH volume predicted slower subsequent rate of decline in executive function and semantic memory. Baseline hippocampal volume, while strongly related to baseline cognitive function, was not predictive of subsequent change in any of the cognitive domains. Conclusions. Baseline measures of brain structure and tissue pathology predicted rate of cognitive decline in a diverse and carefully characterized cohort, suggesting that they may provide summary measures of pre-existing neuropathological damage or the capacity of the brain to compensate for the impact of subsequent neuropathology on cognition. Conventional MRI measures may have use for predicting cognitive outcomes in highly heterogeneous elderly populations. © 2012 Elsevier Inc. All rights reserved. Keywords: Brain; MRI; Cognitive decline; Mixed effects modeling; Item response theory 1. Introduction There are robust interindividual differences in cognitive functioning throughout adulthood and this heterogeneity is compounded by differences in trajectories of cognitive change that emerge as people age. Longitudinal studies of older individuals reveal widely differing rates of cognitive decline, as well as many cases of stable function and even modest improvement (Albert et al., 1995; Christensen et al., 1999; Colsher and Wallace, 1991; Rubin et al., 1998; Schaie, 1988; Wilson et al., 2002; Zelinski et al., 1993). Variability in longitudinal trajectories translates into the increased variability of function over time that is one of the basic observations of cross sectional studies of cognitive aging (Christensen et al., 1999). In the context of this broad heterogeneity, the prediction of late-life cognitive change has emerged as one of the central goals of cognitive aging research. * Corresponding author. Tel.: 530 754 9657; fax: 530 754 5036. E-mail address: [email protected] (O. Carmichael). Neurobiology of Aging 33 (2012) 83–95 www.elsevier.com/locate/neuaging 0197-4580/$ – see front matter © 2012 Elsevier Inc. All rights reserved. doi:10.1016/j.neurobiolaging.2010.01.021

Welcome message from author
This document is posted to help you gain knowledge. Please leave a comment to let me know what you think about it! Share it to your friends and learn new things together.
Transcript

Neurobiology of Aging 33 (2012) 83–95
MRI predictors of cognitive change in a diverse and carefullycharacterized elderly population
Owen Carmichaela,*, Dan Mungasa, Laurel Beckettb, Danielle Harveyb,Sarah Tomaszewski Fariasa, Bruce Reeda,c, John Olichneya, Joshua Millerd, Charles DeCarlia
a Department of Neurology, School of Medicine, University of California, Davisb Department of Public Health Sciences, School of Medicine, University of California, Davis
c Veterans Administration Northern California Health Care Systemd Department of Pathology, School of Medicine, University of California, Davis
Abstract
Background. Trajectories of cognitive decline among elderly individuals are heterogeneous, and markers that have high reliability forpredicting cognitive trajectories across a broad spectrum of the elderly population have yet to be identified.Method. This study examined the utility of a variety of MRI-based brain measures, obtained at baseline, as predictors of subsequentdeclines in domain-specific measures of cognitive function in a cohort of 307 community-dwelling elderly individuals with varying degreesof cognitive impairment who were diverse across several relevant demographic variables and were evaluated yearly. Psychometricallymatched measures of cognition were used to assess episodic memory, semantic memory, and executive function. Relationships betweenbaseline MRI measures, including the volumes of the brain, hippocampus, and white matter hyperintensities (WMH), and cognitivetrajectories were assessed in mixed effects regression models that modeled MRI effects on cognitive performance at baseline and rate ofchange as well as interindividual variability in cognitive baseline and rate of change.Results. Greater baseline brain volume predicted slower subsequent rate of decline in episodic memory and smaller WMH volumepredicted slower subsequent rate of decline in executive function and semantic memory. Baseline hippocampal volume, while stronglyrelated to baseline cognitive function, was not predictive of subsequent change in any of the cognitive domains.Conclusions. Baseline measures of brain structure and tissue pathology predicted rate of cognitive decline in a diverse and carefullycharacterized cohort, suggesting that they may provide summary measures of pre-existing neuropathological damage or the capacity of thebrain to compensate for the impact of subsequent neuropathology on cognition. Conventional MRI measures may have use for predictingcognitive outcomes in highly heterogeneous elderly populations.© 2012 Elsevier Inc. All rights reserved.
Keywords: Brain; MRI; Cognitive decline; Mixed effects modeling; Item response theory
www.elsevier.com/locate/neuaging
1. Introduction
There are robust interindividual differences in cognitivefunctioning throughout adulthood and this heterogeneity iscompounded by differences in trajectories of cognitivechange that emerge as people age. Longitudinal studies ofolder individuals reveal widely differing rates of cognitive
* Corresponding author. Tel.: 530 754 9657; fax: 530 754 5036.
E-mail address: [email protected] (O. Carmichael).0197-4580/$ – see front matter © 2012 Elsevier Inc. All rights reserved.doi:10.1016/j.neurobiolaging.2010.01.021
decline, as well as many cases of stable function and evenmodest improvement (Albert et al., 1995; Christensen et al.,1999; Colsher and Wallace, 1991; Rubin et al., 1998;Schaie, 1988; Wilson et al., 2002; Zelinski et al., 1993).Variability in longitudinal trajectories translates into theincreased variability of function over time that is one of thebasic observations of cross sectional studies of cognitiveaging (Christensen et al., 1999). In the context of this broadheterogeneity, the prediction of late-life cognitive changehas emerged as one of the central goals of cognitive aging
research.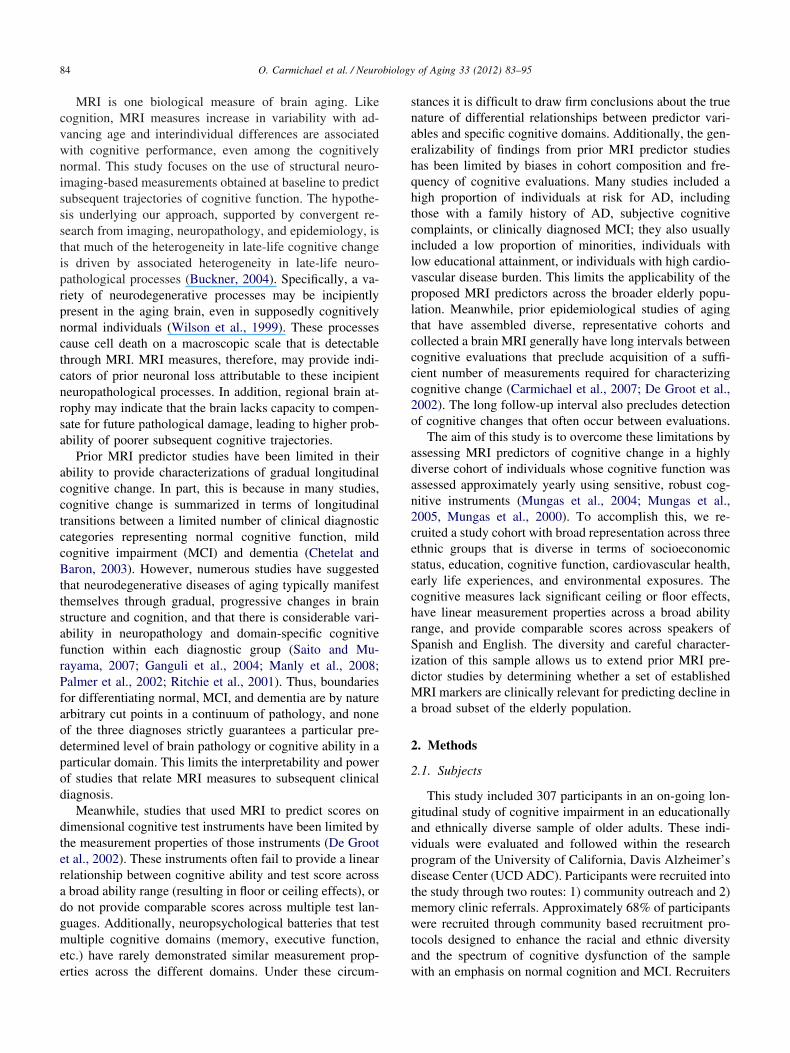
84 O. Carmichael et al. / Neurobiology of Aging 33 (2012) 83–95
MRI is one biological measure of brain aging. Likecognition, MRI measures increase in variability with ad-vancing age and interindividual differences are associatedwith cognitive performance, even among the cognitivelynormal. This study focuses on the use of structural neuro-imaging-based measurements obtained at baseline to predictsubsequent trajectories of cognitive function. The hypothe-sis underlying our approach, supported by convergent re-search from imaging, neuropathology, and epidemiology, isthat much of the heterogeneity in late-life cognitive changeis driven by associated heterogeneity in late-life neuro-pathological processes (Buckner, 2004). Specifically, a va-riety of neurodegenerative processes may be incipientlypresent in the aging brain, even in supposedly cognitivelynormal individuals (Wilson et al., 1999). These processescause cell death on a macroscopic scale that is detectablethrough MRI. MRI measures, therefore, may provide indi-cators of prior neuronal loss attributable to these incipientneuropathological processes. In addition, regional brain at-rophy may indicate that the brain lacks capacity to compen-sate for future pathological damage, leading to higher prob-ability of poorer subsequent cognitive trajectories.
Prior MRI predictor studies have been limited in theirability to provide characterizations of gradual longitudinalcognitive change. In part, this is because in many studies,cognitive change is summarized in terms of longitudinaltransitions between a limited number of clinical diagnosticcategories representing normal cognitive function, mildcognitive impairment (MCI) and dementia (Chetelat andBaron, 2003). However, numerous studies have suggestedthat neurodegenerative diseases of aging typically manifestthemselves through gradual, progressive changes in brainstructure and cognition, and that there is considerable vari-ability in neuropathology and domain-specific cognitivefunction within each diagnostic group (Saito and Mu-rayama, 2007; Ganguli et al., 2004; Manly et al., 2008;Palmer et al., 2002; Ritchie et al., 2001). Thus, boundariesfor differentiating normal, MCI, and dementia are by naturearbitrary cut points in a continuum of pathology, and noneof the three diagnoses strictly guarantees a particular pre-determined level of brain pathology or cognitive ability in aparticular domain. This limits the interpretability and powerof studies that relate MRI measures to subsequent clinicaldiagnosis.
Meanwhile, studies that used MRI to predict scores ondimensional cognitive test instruments have been limited bythe measurement properties of those instruments (De Grootet al., 2002). These instruments often fail to provide a linearrelationship between cognitive ability and test score acrossa broad ability range (resulting in floor or ceiling effects), ordo not provide comparable scores across multiple test lan-guages. Additionally, neuropsychological batteries that testmultiple cognitive domains (memory, executive function,etc.) have rarely demonstrated similar measurement prop-
erties across the different domains. Under these circum-stances it is difficult to draw firm conclusions about the truenature of differential relationships between predictor vari-ables and specific cognitive domains. Additionally, the gen-eralizability of findings from prior MRI predictor studieshas been limited by biases in cohort composition and fre-quency of cognitive evaluations. Many studies included ahigh proportion of individuals at risk for AD, includingthose with a family history of AD, subjective cognitivecomplaints, or clinically diagnosed MCI; they also usuallyincluded a low proportion of minorities, individuals withlow educational attainment, or individuals with high cardio-vascular disease burden. This limits the applicability of theproposed MRI predictors across the broader elderly popu-lation. Meanwhile, prior epidemiological studies of agingthat have assembled diverse, representative cohorts andcollected a brain MRI generally have long intervals betweencognitive evaluations that preclude acquisition of a suffi-cient number of measurements required for characterizingcognitive change (Carmichael et al., 2007; De Groot et al.,2002). The long follow-up interval also precludes detectionof cognitive changes that often occur between evaluations.
The aim of this study is to overcome these limitations byassessing MRI predictors of cognitive change in a highlydiverse cohort of individuals whose cognitive function wasassessed approximately yearly using sensitive, robust cog-nitive instruments (Mungas et al., 2004; Mungas et al.,2005, Mungas et al., 2000). To accomplish this, we re-cruited a study cohort with broad representation across threeethnic groups that is diverse in terms of socioeconomicstatus, education, cognitive function, cardiovascular health,early life experiences, and environmental exposures. Thecognitive measures lack significant ceiling or floor effects,have linear measurement properties across a broad abilityrange, and provide comparable scores across speakers ofSpanish and English. The diversity and careful character-ization of this sample allows us to extend prior MRI pre-dictor studies by determining whether a set of establishedMRI markers are clinically relevant for predicting decline ina broad subset of the elderly population.
2. Methods
2.1. Subjects
This study included 307 participants in an on-going lon-gitudinal study of cognitive impairment in an educationallyand ethnically diverse sample of older adults. These indi-viduals were evaluated and followed within the researchprogram of the University of California, Davis Alzheimer’sdisease Center (UCD ADC). Participants were recruited intothe study through two routes: 1) community outreach and 2)memory clinic referrals. Approximately 68% of participantswere recruited through community based recruitment pro-tocols designed to enhance the racial and ethnic diversityand the spectrum of cognitive dysfunction of the sample
with an emphasis on normal cognition and MCI. Recruiters
85O. Carmichael et al. / Neurobiology of Aging 33 (2012) 83–95
used various outreach methods such as soliciting in a com-munity hospital lobby, a community survey, health fairs orword of mouth. The other 28% of the sample initially soughta clinical evaluation at the UCD ADC and subsequentlywere recruited for this study. These individuals predomi-nantly had a clinical diagnosis of MCI. The overall sampleincluded 99 African Americans, 79 Hispanics, and 129Caucasians. Fifteen individuals from other racial/ethnicgroups, recruited from clinical evaluation, were removeddue to the small size and heterogeneous nature of this group.
Regardless of recruitment source, inclusion criteria wereage greater than 60 and ability to speak English or Spanish.Exclusion criteria included unstable major medical illness,major primary psychiatric disorder (history of schizophre-nia, bipolar disorder, or recurrent major depression), andsubstance abuse or dependence in the last 5 yr. All partic-ipants signed informed consent, and all human subject in-volvement was overseen by institutional review boards atUniversity of California, Davis, the Veterans Administra-tion, Northern California Health Care System and SanJoaquin General Hospital in Stockton, California.
2.2. Cognitive assessment
The primary cognitive outcome measures in this studywere from the Spanish and English NeuropsychologicalAssessment Scales (SENAS). The SENAS has undergoneextensive development as a battery of cognitive tests rele-vant to diseases of aging (Mungas et al., 2004, Mungas etal., 2005; Mungas et al., 2000). Modern psychometric meth-ods based on item response theory were used to createpsychometrically matched measures across different scalesand across English and Spanish versions. This study used asubset of SENAS tests to measure three cognitive domains:episodic memory, semantic memory, and executive func-tion. The Episodic Memory measure was a composite scorederived from a multitrial word list learning test (Word ListLearning one, Mungas et al., 2004). Semantic Memory wasa composite of highly correlated verbal (Object Naming)and nonverbal (Picture Association) tasks. Executive Func-tion was a composite measure constructed from componenttasks of Category Fluency, Phonemic (letter) Fluency, andWorking Memory. Measure development and psychometriccharacteristics have been reported in previous publications(Crane et al., 2008; Mungas et al., 2004; Mungas et al.,2005). These measures do not have appreciable floor orceiling effects for participants in this sample and have linearmeasurement properties across a broad ability range. Theyare near-normally distributed, which presents advantagesfor statistical analyses. Psychometrically matched measuresof domain specific cognitive functions (i.e., measures withequivalent reliability and sensitivity) were used to facilitateunambiguous interpretation of any potential differential ef-fects of the imaging variables on cognitive trajectories. Theuse of psychometrically matched measures in the current
study allows us to draw more confident conclusions aboutthe influence of brain imaging variables on domain-specificcognitive trajectories.
2.3. Imaging
Baseline MRI data were acquired on two 1.5 T MRIscanners: a GE Signa machine located at UCD MedicalCenter (Sacramento, CA), and a Philips Eclipse machinelocated at the Veterans Administration, Northern CaliforniaHealth Care System (Martinez, CA). High-resolution T1-weighted and fluid-attenuated inversion recovery (FLAIR)sequences required for measurement of MRI variables wereacquired in each subject. The T1-weighted sequence was anaxial-oblique 3D Fast Spoiled Gradient Recalled Echo(FSPGR) sequence with the following parameters: TE: 2.9msec (min) TR: 9 msec (min), Flip angle: 15 degrees, Slicethickness: 1.5 mm, Number of Slices: 128, FOV: 25 cm �25 cm, Matrix: 256 � 256. The Axial-oblique 2D FLAIRFast Spin Echo sequence had the following parameters: TE:144 ms, TR: 11,000 ms, TI: 2,250 ms, Flip Angle: 90degrees, Slice thickness: 3 mm, FOV: 22 cm � 22 cm,Matrix: 256 (freq) � 192 (phase). Analogous sequenceswere installed on both the GE and Philips scanners.
After acquisition, all scans were digitally transmitted tothe Imaging of Dementia and Aging Laboratory (IDeALaboratory) at UC, Davis for analysis. Standard analyses ofall MRIs included measurement of total intracranial (TCV),cerebral brain (BV), hippocampal (HC) and WMH volumes.All images were analyzed by an operator blind to patientage, gender and diagnostic category to avoid introducingbias to the process. Quantification of BV, TCV, HC, andWMH were performed using the Quanta package of soft-ware routines, which was produced in-house.
TCV, BV, and WMH volumes were obtained from FLAIRaccording to a previously reported analysis protocol (DeCarliet al., 2005). First, nonbrain elements were manually removedfrom the image by operator guided tracing of the dura materwithin the cranial vault including the middle cranial fossa, butexcluding the posterior fossa and cerebellum. The volume ofthe traced region was defined as the TCV. Tissues outside thetraced cranial vault were removed from the image. To identifybrain matter, image intensity nonuniformities were removedfrom the image, and the corrected image was modeled as amixture of two Gaussian probability functions correspondingto brain tissue and nonbrain tissue; the segmentation thresholdbetween brain and nonbrain image intensities was located atthe minimum probability between these two distributions (De-Carli et al., 1992; DeCarli et al., 1996). The volume of voxelson the brain side of the threshold was defined as BV. Morpho-metric erosion of two exterior image pixels was then applied tothe image of BV voxels to remove the effects of partially-volumed CSF pixels on WMH detection. A single Gaussiandistribution was then fitted to the intensity distribution of theremaining BV voxels, and all voxels with intensity greater than3.5 standard deviations above the mean BV intensity were
defined as WMH (DeCarli et al., 2005).
86 O. Carmichael et al. / Neurobiology of Aging 33 (2012) 83–95
The HC was manually traced on T1-weighted scans toinclude the CA1–CA4 fields, dentate gyrus, and the subicularcomplex using a protocol described previously (DeCarli et al.,2008). Briefly, all scans were resliced perpendicular to the longaxis of the left HC and HC borders were manually traced oncontiguous coronal slices in the anterior to posterior direction.The HP was bounded anteriorly by the amygdala, and tracingended posteriorly at the first slice where the fornices werecompletely distinct from thalamic gray and white matter. Theinferior boundary of the hippocampus was the white matter ofthe parahippocampal gyrus. The lateral boundary was the tem-poral horn of the lateral ventricle. The uncus was included insections in which the uncus was ventral to caudal amygdala;the fimbria were excluded.
MRI-evident infarcts were identified by a trained neurol-ogist through imaging characteristics and location using theQuanta software package. Quanta allows simultaneousviews of T1-, PD-, and T2-weighted sequences, as well as a“pseudo-T1” image (PD subtracted from T2). Signal void,best seen on T2-weighted images, is interpreted to indicatea blood vessel. Only lesions � 3 mm qualify for considerationas cerebral infarcts. Other necessary imaging characteristicsinclude the following: 1) CSF density on the pseudo-T1 imageand 2) distinct separation from the circle of Willis vessels if theinfract is in the basal ganglia region. The location and type ofinfarction (small vessel lacune or large vessel territory) wasrecorded for each infarct. Lacunar infarcts are defined asinfarcts less than 1.5 cm in largest diameter and located insubcortical white matter or basal ganglia.
A rigorous protocol insured the validity of the MRI mea-sures across differing scanners and analysts. Each analyst wasrequired to produce ratings of training scans that agreedstrongly with those of prior analysts as well as a neurologistskilled in neuroanatomy and neuroimaging; intraclass correla-tion coefficients (ICCs) between new analysts, all previouslytrained analysts, and the neurologist were required to be above.95, .95, .95, and .9 for TCV, BV, WMH, and HC. A set ofseven cognitively-normal elderly individuals received one scanon the GE system and another scan on the Philips systemwithin a 60-day interval; within-subject, between-scanneragreement in HC, TCV, and WMH was strong (ICCs � .87,.96, and .89). In addition, 20 subjects received two scans eachin a 2-week interval on the GE scanner, and BV and TCV weremeasured on all scans; within-subject agreement in the mea-sures was strong (ICCs � .97 and .99).
BV was corrected for head size by linearly regressingBV against TCV, and replacing BV in the mixed effectsmodeling with the signed difference between the BV pre-dicted based solely on TCV, and the true BV (Van Petten,2004). This residualized measurement represents the com-ponent of BV that is not already explained by TCV. HC wasresidualized in the same way. The residualized measure-ments had superior reliability to additive measurement noisethan HC and BV divided by TCV (see appendix). The
residualized BV and HC measures were reasonably nor-mally distributed on visual inspection, but because the dis-tribution of WMH values was skewed we used log-trans-formed WMH in the mixed effects modeling.
2.4. Statistical modeling
We used mixed-effects repeated-measures regression mod-els to assess relationships between baseline MRI measures andlongitudinal changes over time in the episodic memory, se-mantic memory, and executive function measures (Pinheiroand Bates, 2000). Analysis was restricted to individuals withcognitive measures at baseline and at least one follow-up time,and with MRI at baseline. The mean trajectories of cognitivemeasures over time were modeled as linear trends, with thepredicted initial cognitive level (intercept) and the rate ofchange (slope) allowed to vary with baseline MRI measuresand other covariates (fixed effects). In addition, our modelallowed for people to have systematic differences, not ac-counted for by MRI or other predictors, in the starting level andrate of change of cognitive measures (random effects). Finally,the model assumed that the observed measures at an individualcognitive assessment time might differ from the person’s gen-eral trajectory by a quantity drawn independently from aGaussian distribution with zero mean and constant “noise”variance. Such mixed effects models are highly effective inassessing general trends over time and how they are modifiedby predictors, as well as characterizing between- and within-person variation from the general trend (Wilson et al., 2002).Our estimation approach allowed for missing times of obser-vation, unequal lengths and numbers of follow-ups, and pos-sible correlation between the initial level of cognitive measure-ment for an individual and the rate of change over time. Allmodels were fitted in using the nlme routines in R version 3.1(Ihaka and Gentleman, 1996). Model assumptions were vali-dated graphically and by examining alternative models to testfor violations such as nonlinearity.
Each cognitive measure was modeled by a separate series ofmixed-effects models in a sequential model-building approach.First, we built a reference model of the cognitive measure as afunction of time, with random effects of subject on baselineand change rate, and fixed effects of ethnicity, years of edu-cational attainment, and gender on baseline. Subject age wasnot entered as a fixed effect in these models due to earlierindications that age adjustment may attenuate relationshipsbetween MRI variables and cognitive outcomes in this cohort,a finding consistent with the hypothesis that age-related MRIchange may represent a key explanation for decline in cogni-tion in elderly people (Mungas et al., 2009). Ethnicity andeducation, by contrast, were included as more direct ways toassess the influence of early childhood experiences and genetictraits on cognitive trajectory.
A set of “single-MRI” models was then constructed,each of which added fixed effects of a single MRI vari-able on baseline and change rate. Likelihood ratio testsassessed whether the explanatory power of each of the
second models exceeded that of the reference model; for
mtcl
vfmcbea
tadowt
pmtatetoM
Arahtbawlghmctvw
F
B
T cm3
87O. Carmichael et al. / Neurobiology of Aging 33 (2012) 83–95
any MRI variable whose likelihood ratio was significant(p � 0.05), we used F tests on the single-MRI model
arginal sums of squares to evaluate the significance ofhe fixed effects of the MRI variable on baseline andhange rate. Any fixed effect whose F test passed aiberal significance threshold (p � 0.25) was entered into
a final “multiple-MRI” model to evaluate the independentfixed effects of all relevant MRI variables simultane-ously. The incremental explanatory value-added by themultiple-MRI model over the baseline model was evaluatedby a likelihood-ratio test. In addition, we used Cohen’s f 2 toquantify the effect size of adding the MRI variables to thereference model; in brief, this compares the variance ex-plained (R2) by the reference model fixed effects to theariance explained by the multiple-MRI model fixed ef-ects. The significance of fixed effects in the multiple-MRIodel was evaluated using F tests. In all models that in-
luded MRI variables, the duration of time between theaseline cognitive evaluation and the baseline MRI wasntered as a fixed effect on cognitive baseline to guardgainst spurious effects caused by the time lag.
This study analyzed the subset of 307 individuals fromhe UCD ADC longitudinal cohort who received an MRIt baseline. We verified our assumption that the longitu-inal cognitive characteristics of this sample reflect thosef the full UCD ADC cohort of 369 individuals, whichere published previously (Mungas et al., 2009). In par-
Table 1Cohort characteristics for 307 participantsDescriptive summary of the study population. Z scores for cognitive and
Variable
DemographicsGender (no. male, percent male)Age (mean � SD, range)Ethnicity (African American, Caucasian, Hispanic)Education (mean � SD)
ollowupNumber of cognitive evaluations (two, three, four, five, � 5)Total duration of cognitive followup (mean � SD)Interval between cognitive assessments (mean � SD)Interval between baseline cognitive assessment and baseline MRI (mea
aseline cognition and functionBaseline clinical diagnosis (Normal, MCI, demented)Baseline MMSE (mean � SD)Baseline CDR sum of boxes (mean � SD)
Domain-specific cognitive measures
Baseline episodic memory (mean z-score � SD in z-score)Yearly change in episodic memory (mean change in z-score per year � SBaseline semantic memory (mean z-score � SD in z-score)Yearly change in semantic memory (mean change in z-score per year � SBaseline executive function (mean z-score � SD in z-score)Yearly change in executive function (mean change in z-score per year �
Baseline MRI Overall
Brain volume (mean � SD) 919.1 � 10White matter hyperintensity volume (mean � SD) 9.10 � 12
otal hippocampal volume (left � right, mean � SD) 3.62 � .70
icular, we used the same mixed effects modeling ap- c
roach as the prior analysis to relate baseline perfor-ance and rate of change in the three cognitive measures
o baseline clinical diagnostic category (normal, MCI,nd demented) and groups representing differing transi-ions in clinical diagnosis between first and final clinicalvaluation (normal-to-normal, normal-to-MCI, etc.). Wehen qualitatively compared the model-estimated effectsf clinical diagnosis on cognitive trajectories between theRI subset and the full cohort.Approximately sixty-eight percent of the full UCD
DC cohort was recruited from the community, and theemainder were referred from memory clinics. A priornalysis suggested the clinic-recruited participants had aigher proportion of Caucasians, higher educational at-ainment, higher proportion of males, greater degrees ofaseline functional impairment, and lower baseline BVnd HC (Farias et al., 2009). Therefore, we investigatedhether recruitment source may have influenced the re-
ationships between MRI variables, cognition, and demo-raphic covariates that were ascertained in the MRI co-ort. To do so, we re-estimated the same multiple-MRIodels derived as described above on the subset of the MRI
ohort that was recruited from the community, and qualita-ively compared the model-derived relationships between MRIariables, cognitive measures, and demographic covariates thatere derived from the full cohort, to those derived from the
easures are broken down by baseline diagnostic category
Conclusions
117, 38%75.9 � 6.9 y, 60.0–94.599, 129, 7912.6 � 4.5 y
92, 88, 77, 38, 122.9 � 1.36 y
1.31 � .40 y) .27 � .48 y
163, 104, 4027.4 � 8.891.39 � 2.08
Normal Z score MCI Z score Demented Z score
0.25 � 0.81 �0.72 � 0.66 �1.5 � 0.5�0.12 � 0.27 �0.13 � 0.44 �0.25 � 0.32
0.28 � 0.77 �0.032 � 0.83 �0.8 � 10.042 � 0.23 �0.086 � 0.25 �0.14 � 0.360.056 � 0.61 �0.28 � 0.57 �0.95 � 0.69
�0.0091 � 0.17 �0.14 � 0.3 �0.18 � 0.28
Normal Z score MCI Z score Demented Z score
.192 � .939 �.234 � 1.02 �.738 � .942�.125 � .961 .086 � 1.05 .399 � .944
.248 � .901 �.184 � .935 �.70 � .924
MRI m
n � SD
D)
D)
SD)
6.4 cm3
.05 cm3
ommunity-recruited subset.
88 O. Carmichael et al. / Neurobiology of Aging 33 (2012) 83–95
3. Results
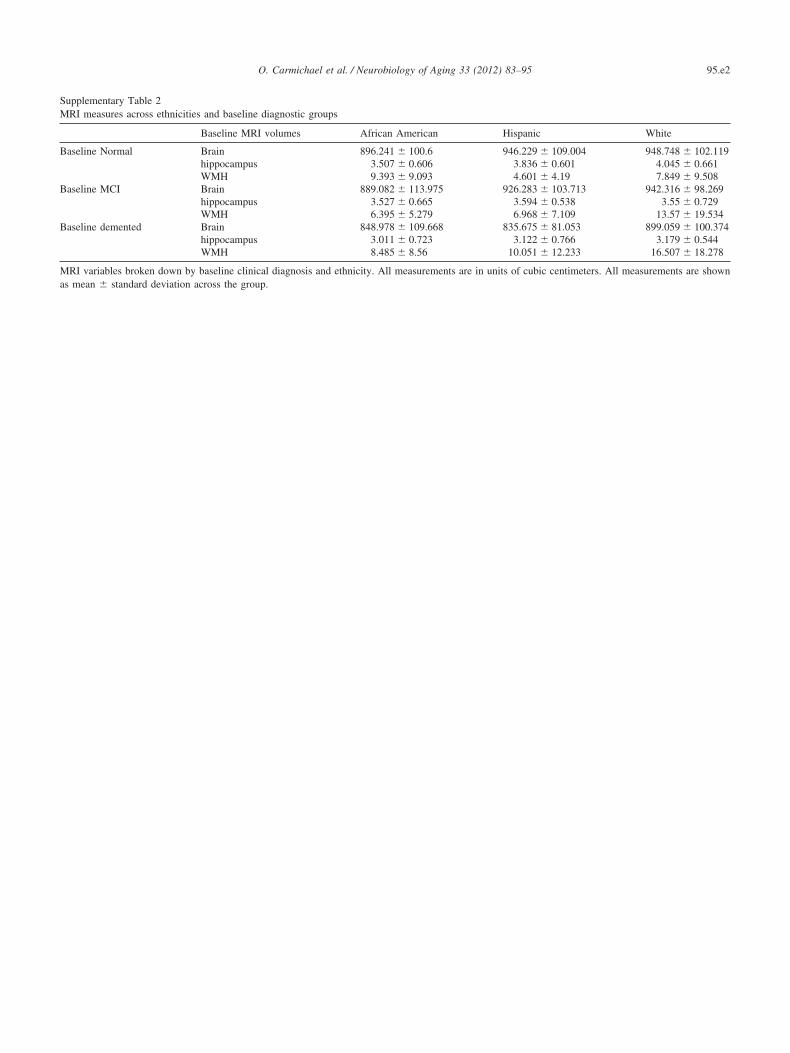
Cohort characteristics are listed in Table 1. The subjectpool represents a range of educational attainment, substan-tial representation across all three ethnic groups, and broadheterogeneity in cognitive function measured through thedimensional measures as well as through clinical diagnosis.Brain MRI measures were also heterogeneous, with ex-pected pathology-associated differences between individu-als who were normal, MCI, and demented at baseline.Breakdowns of cognitive and MRI measures by ethnicityand diagnostic group are shown in Supplementary Tables 1
Fig. 1. Characteristic slices from MRI scans of individuals who had the minand brain volume. The left hippocampus is annotated by a red-to-white oveoverlay on axial slices of FLAIR images. Note that in the statistical analydifferences in intracranial volume.
and 2. Example images showing the spectrum of raw BV,
HC, and WMH values, before adjustment for cranial vol-ume, are shown in Fig. 1. Individuals were followed for anaverage of about 3 yr, with evaluations occurring approxi-mately annually. The average time lag between initial cog-nitive evaluation and MRI was approximately 3 mo.
The longitudinal cognitive trajectories of this sample, aswell as relationships between cognitive trajectories and clin-ical diagnosis, largely reflected those of the parent UCDADC longitudinal cohort (Mungas et al., 2009). In particu-lar, all three baseline diagnostic groups experienced statis-tically significant mean declines over time in episodic mem-
median, and maximum values of left hippocampal volume, WMH volume,sagittal slices of T1-weighted images, and WMHs are annotated by a whitein and hippocampal volume were adjusted to account for interindividual
imum,rlay onsis, bra
ory and executive function (Normal: p � .001 and p � .049;
.mp
ptsdoABlaM0M
vr0v0tiGpsbmsW
liipb s.
89O. Carmichael et al. / Neurobiology of Aging 33 (2012) 83–95
MCI: p � .001 and p � .001; Dementia: p � .001 and p �.001), but rate of change in semantic memory showed sig-nificant decline only among baseline MCI and baselinedemented groups (Normal: p � .48; MCI: p � .001; De-mentia: p � .001). The baseline normal group had signifi-cantly slower declines in executive function and semanticmemory than the other groups (p � .001 for all compari-sons), but other intergroup differences in decline rates werenot significant (minimum p values for all other group com-parisons in episodic, semantic, and executive were .29, .13,.62). In addition, robust differences between baseline diag-nostic groups in baseline performance were evident acrossall cognitive domains (all p values for omnibus F tests were� .001). As in the prior analysis, the lack of differences inmean declines across baseline diagnostic groups appeared tobe accounted for by the presence of subsequent declinersand subsequent non-decliners in the same baseline diagnos-tic group. Specifically, subjects transitioning from normal toMCI or MCI to dementia, along with subjects dementedthroughout follow-up, had significant declines in all cogni-tive measures (all p � .001), while subjects with a stablediagnosis or improvement from MCI to normal mostly ex-hibited change rates that were slightly positive or whosestatistical significance was borderline (MCI to normal andMCI to MCI: p � .34, p � .99, p � .60 and p � .06, p �08, p � .001 for episodic, semantic, executive; stable nor-
al: p � .001 for a .04 SD/year improvement in semantic,� .99 for executive). However, in a departure from the
prior analysis, episodic memory did decline significantlyamong subjects who were normal at baseline and through-out follow-up (p � .001). All comparisons between diag-nostic groups indicated significantly greater rates of decline
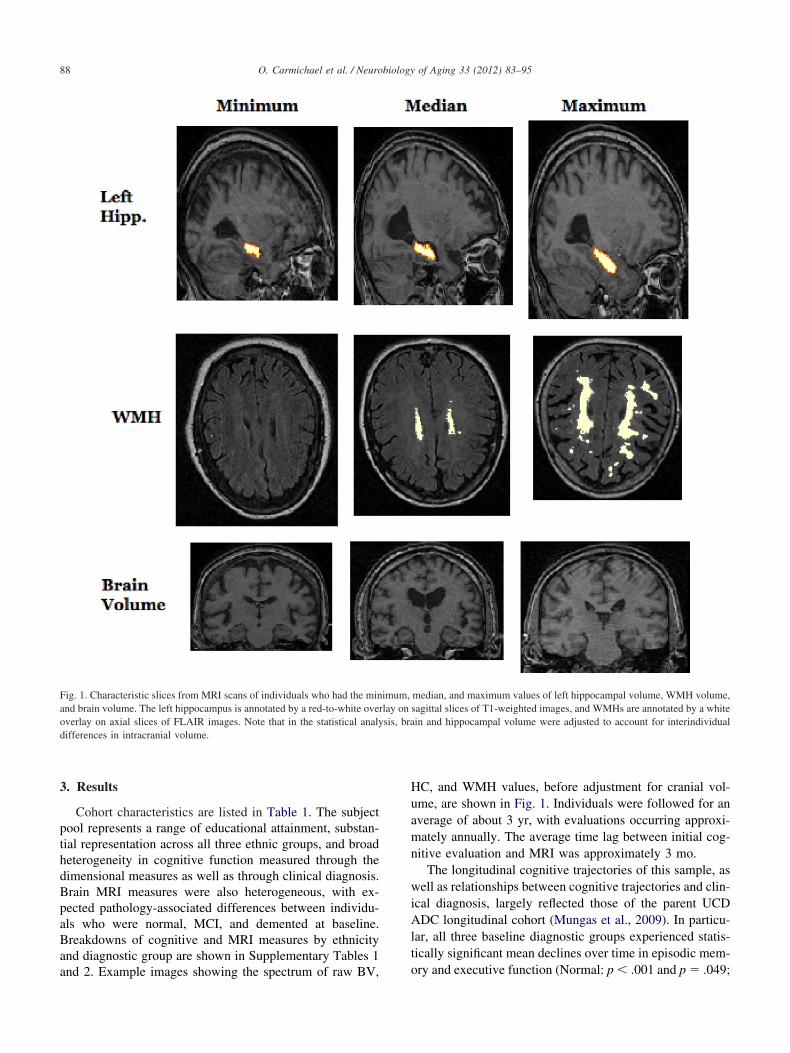
Table 2Mixed effects modeling results
Baseline
Cognitive variable Effect of brain volume onbaseline
� p
Episodic memory 0.167 0.001Executive function 0.19 < 0.001Semantic memory 0.17 < 0.001
Change
Cognitive variable Effect of brain volume onchange
� p
Episodic memory 0.038 0.012Executive function 0.011 0.349Semantic memory * *
Summary of mixed effects models of cognitive trajectories using multiple Misted fixed effect, followed by the associated p value for an F test on the mn bold. For baseline fixed effects, regression coefficients represent the numncrease in the MRI variable. For fixed effects on change rate, regression coer year attributed to a 1 mL increase in the MRI variable. Entries with aecause they failed significance tests earlier in the model-building proces
for groups with a clinical diagnosis of greater impairment f
(e.g., change per year in episodic, semantic, executive wassmaller by .13. 11, And .12 SD per year in stable MCIcompared with MCI declining to dementia; p � .006, p �.001, p � .001).
All single-MRI models added significant explanatoryower over the baseline model according to likelihood ratioests (all p � .001). However, in the single-MRI model foremantic memory, higher baseline WHM predicted greaterecline but was not associated with baseline semantic mem-ry using the p � 0.25 threshold (p � .001 and p � .88).lso, in the single-MRI model for semantic memory usingV as a predictor, lower baseline BV predicted worse base-
ine semantic memory but not change in semantic memory,t the p � 0.25 threshold (p � .001 and p � .46). All otherRI fixed effects in the single-MRI models passed the p �
.25 threshold and therefore were included in the multiple-RI models.Multiple-MRI models for each cognitive outcome pro-
ided significant explanatory power over the correspondingeference models according to likelihood ratio tests (all p �.001). Adding the MRI variables had a moderate effect onariance explained by the models, with Cohen’s f2 values of.21, 0.18, and 0.12 for episodic memory, executive func-ion, and semantic memory. The significance of fixed effectsn the multiple-MRI models is summarized in Table 2.reater BV at baseline was associated with greater baselineerformance in all three domains as well as slower rate ofubsequent decline in episodic memory. Greater HC ataseline was associated with greater episodic and semanticemory performance at baseline, but its associations with
ubsequent rate of change were not significant. GreaterMH at baseline was associated with poorer baseline per-
ffect of hippocampalolume on baseline
Effect of WMH volume onbaseline
p � P
.219 < 0.001 �1.135 0.007
.051 0.144 �1.089 0.012
.134 0.002 * *
ffect of hippocampalolume on change
Effect of WMH volume onchange
p � p
.013 0.341 �1.016 0.253
.016 0.136 �1.027 0.011
.008 0.464 �1.045 0.001
dictors as fixed effects. Entries show the regression coefficient (�) for thesum of squares for that fixed effect. Fixed effects with p � 0.05 are shownstandard deviations increase in the cognitive measure attributed to a 1 mLts represent the number of standard deviations increase in cognitive changeresent fixed effects that were not entered into the final multivariate model
Ev
�
000
Ev
�
000
RI prearginalber of
efficien“*” rep
ormance in episodic memory and executive function, as

easemd
Ttpmzd
90 O. Carmichael et al. / Neurobiology of Aging 33 (2012) 83–95
well as faster subsequent declines in executive function andsemantic memory. Each graph in Figs 1–3 illustrates how atypical cognitive trajectory is modified by varying the val-ues of a single MRI variable of interest. Each line representsa model-predicted cognitive trajectory for a Hispanic femalewith mean educational attainment (12.6 yr) and mean values
Fig. 2. Example longitudinal trajectories of executive function and seman-tic memory, and the effect of WMH volume in modifying those trajecto-ries. Each line represents the estimated cognitive trajectory for a hispanicfemale with mean educational attainment (12.6 years), mean BV (919.1cm3), and mean HC, 3.62 cm3. The three lines per plot represent thestimated trajectories of an individual that exhibits these characteristicslong with differing levels of BV: the population mean, the mean plus onetandard deviation, and the mean minus one standard deviation. The ex-cutive function and semantic memory scores are scaled as z-scores; theean of these measures over the entire population is 0 and a 1 unit
ifference represents a difference of one standard deviation.
of all other MRI variables. The three lines per graph repre-
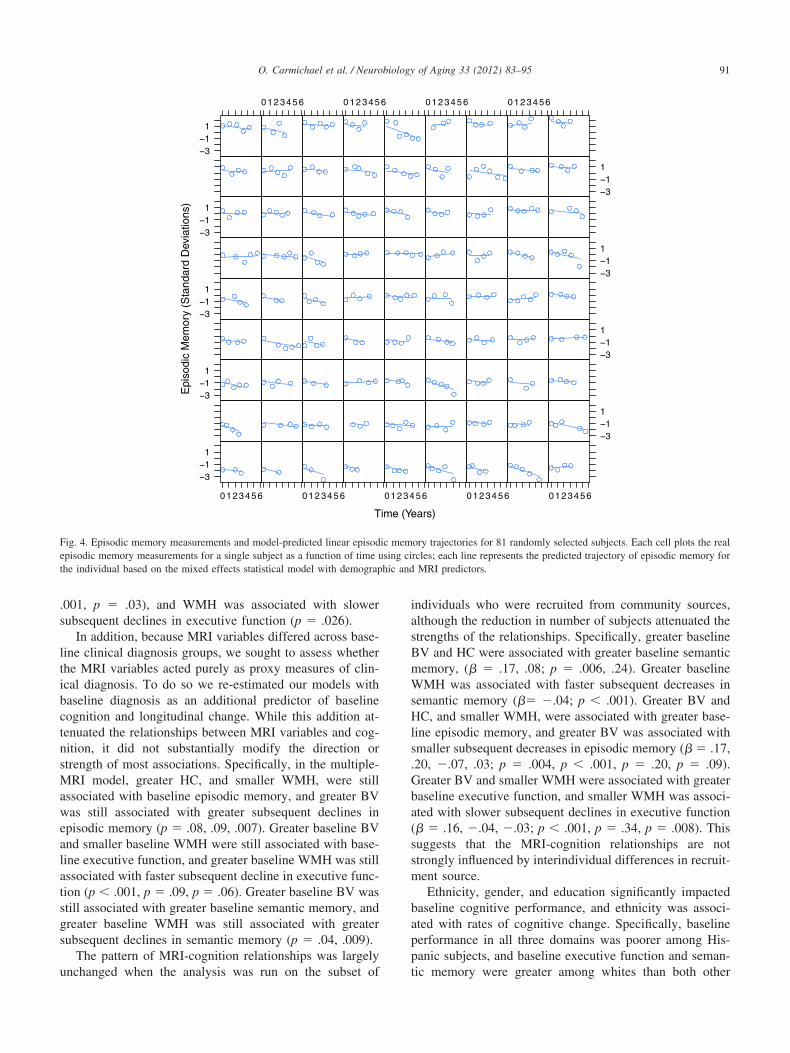
sent predicted trajectories for subjects whose MRI variableof interest takes on the mean value and mean plus or minusone standard deviation. In addition, Fig. 4 shows model-predicted episodic memory trajectories along with episodicmemory measurements for 81 randomly selected subjects.The Figure confirms that use of linear trajectory models wasappropriate for these data.
Because MRI-evident infarction is strongly associatedwith WMH and cognitive performance, we investigatedwhether the WMH-cognition relationships may have beendriven by the presence of infarcts at baseline. To do so were-estimated all multiple-MRI models including an addi-tional binary variable indicating whether or not the individ-ual had one or more infarcts evident on the baseline MRI.This variable did not change the results in any appreciableway. Specifically, single-MRI models for the infarct vari-able did not provide significantly improved goodness-of-fitover reference models for episodic and semantic memory bylikelihood ratio tests (p � .27, .29). The likelihood-ratio testfor the single-MRI model for executive function was sig-nificant (p � .035); by F tests, baseline infarcts were sig-nificantly associated with baseline executive function butnot longitudinal change (p � .01, .90). In the multiple-MRImodel, the effect of infarcts on baseline executive functionwas not significant (p � .17), greater BV and WMH were
Fig. 3. Example longitudinal trajectory of episodic memory, and the effectof brain volume in modifying that trajectory. Each line represents theestimated cognitive trajectory for a Hispanic female with mean educationalattainment (12.6 years), mean WMH (9.10 cm3), and mean HC, 3.62 cm3.
he three lines per plot represent the estimated trajectories of an individualhat exhibits these characteristics along with differing levels of BV: theopulation mean, the mean plus one standard deviation, and the meaninus one standard deviation. The episodic memory score is scaled as a
-score; the mean value over the entire population is 0 and a 1 unitifference represents a difference of one standard deviation.
associated with greater baseline executive function (p �
s
ltibctnsMawealat
WsHls
hic and
91O. Carmichael et al. / Neurobiology of Aging 33 (2012) 83–95
.001, p � .03), and WMH was associated with slowerubsequent declines in executive function (p � .026).
In addition, because MRI variables differed across base-ine clinical diagnosis groups, we sought to assess whetherhe MRI variables acted purely as proxy measures of clin-cal diagnosis. To do so we re-estimated our models withaseline diagnosis as an additional predictor of baselineognition and longitudinal change. While this addition at-enuated the relationships between MRI variables and cog-ition, it did not substantially modify the direction ortrength of most associations. Specifically, in the multiple-RI model, greater HC, and smaller WMH, were still
ssociated with baseline episodic memory, and greater BVas still associated with greater subsequent declines in
pisodic memory (p � .08, .09, .007). Greater baseline BVnd smaller baseline WMH were still associated with base-ine executive function, and greater baseline WMH was stillssociated with faster subsequent decline in executive func-ion (p � .001, p � .09, p � .06). Greater baseline BV was
still associated with greater baseline semantic memory, andgreater baseline WMH was still associated with greatersubsequent declines in semantic memory (p � .04, .009).
The pattern of MRI-cognition relationships was largely
T
Epi
sodi
c M
emor
y (S
tand
ard
Dev
iatio
ns)
311
0123456 0123456
311
311
311
311
0123456 012345
Fig. 4. Episodic memory measurements and model-predicted linear episodepisodic memory measurements for a single subject as a function of time uthe individual based on the mixed effects statistical model with demograp
unchanged when the analysis was run on the subset of
individuals who were recruited from community sources,although the reduction in number of subjects attenuated thestrengths of the relationships. Specifically, greater baselineBV and HC were associated with greater baseline semanticmemory, (� � .17, .08; p � .006, .24). Greater baseline
MH was associated with faster subsequent decreases inemantic memory (�� �.04; p � .001). Greater BV andC, and smaller WMH, were associated with greater base-
ine episodic memory, and greater BV was associated withmaller subsequent decreases in episodic memory (� � .17,
.20, �.07, .03; p � .004, p � .001, p � .20, p � .09).Greater BV and smaller WMH were associated with greaterbaseline executive function, and smaller WMH was associ-ated with slower subsequent declines in executive function(� � .16, �.04, �.03; p � .001, p � .34, p � .008). Thissuggests that the MRI-cognition relationships are notstrongly influenced by interindividual differences in recruit-ment source.
Ethnicity, gender, and education significantly impactedbaseline cognitive performance, and ethnicity was associ-ated with rates of cognitive change. Specifically, baselineperformance in all three domains was poorer among His-panic subjects, and baseline executive function and seman-
ars)
56 0123456 0123456
31
1
31
1
31
1
31
1
0123456 0123456
ory trajectories for 81 randomly selected subjects. Each cell plots the realrcles; each line represents the predicted trajectory of episodic memory for
MRI predictors.
ime (Ye
01234
6
ic memsing ci
tic memory were greater among whites than both other

92 O. Carmichael et al. / Neurobiology of Aging 33 (2012) 83–95
ethnic groups (p � .001, p � .002, p � .001). Baselineepisodic memory was poorer among males (p � .001), andgreater educational attainment was associated with greaterbaseline performance in all three domains (p � .001, p �.001, p � .001 for episodic, executive, semantic). Rates ofdecline in executive function and semantic memory werefaster among whites, and rate of decline in episodic memorywas slower among Hispanics (p � .008, p � .03, p � .01).Educational attainment was not significantly associated withrate of change in any domain (p � .73, p � .92, p � .90 forepisodic, executive, semantic). In addition, when interactioneffects of education and MRI variables on cognitive changewere entered into the single-MRI and multiple-MRI modelsdescribed above, none were significant, suggesting thathigher-order education-MRI-cognition relationships did notaccount for the lack of effect of education on cognitivechange (minimum p � .36). This general pattern of resultsdid not change appreciably when the data set was reduced toinclude only the community-recruited subjects.
The interindividual variability in cognitive baselines andchange rates captured by random effects parameters wassubstantial. The standard deviations in baseline episodicmemory, executive function, and semantic memory z-scoresassociated with interindividual variability were .69, .52, and.63, representing 56%, 57%, and 63% of the cognitive scorevariance unexplained by the fixed effects. Standard devia-tions in change rate in the three domains were .10, .11, and.057 z-score units per year, representing 8%, 11%, and 6%of the cognitive score variance unexplained by the fixedeffects.
4. Discussion
The key finding of this study is that in a broadly heter-ogeneous and carefully characterized elderly cohort, multi-ple MRI-based measures of brain structure were predictiveof future performance across three highly informative mea-sures of cognitive function. In particular, individuals withmore brain tissue (BV) and less injured white matter(WMH) at baseline went on to have better subsequent per-formance in episodic memory, semantic memory, and ex-ecutive function. These results did not appear to be drivenby infarcts or recruitment source. The results suggest thatbrain MRI could provide useful information for prognosisof late-life cognitive outcomes across a broad spectrum ofelderly individuals.
While hippocampal volume was strongly associated withbaseline memory, it did not predict future cognitive perfor-mance. We feel that this is largely explained by the uniquelyhigh level of heterogeneity in this cohort. That is, our cohortincludes a subset of individuals whose relatively small base-line HC likely reflects the early effects of progressive neu-ropathology such as AD; by providing a marker of pre-existing neuropathological damage that is likely to worsen
over time, diminished HC predicts future cognitive perfor-mance in these individuals. However, our cohort also in-cludes individuals whose relatively small baseline HC likelyreflects a wide variety of other influences, including genet-ics, early life experiences and environmental exposures, andoverall physical health; in these individuals HC may in factremain stable over time (Dauncey and Bicknell, 1999; Petitet al., 1983; Sullivan et al., 2001). In both groups, HC wouldbe associated with concurrent cognitive function, as ourassociations between baseline HC and baseline cognitionsuggest; however, the diverse reasons for small baseline HCundercut its ability to predict future cognition. In contrast,prior studies that showed the predictive power of baselineHC generally included a high proportion of participants whowere more likely to already exhibit early AD pathology atbaseline, and for whom reduced HC would therefore morelikely predict future hippocampal damage.
A similar argument would appear to apply to BV—specifically, that in our diverse cohort, small baseline BVmay or may not have been caused by progressive neuropa-thology, and therefore may or may not be associated withsubsequent rate of decline. However, we feel there are threepossible reasons why brain volume was predictive. The firstreason is that loss of BV may be the final common pathwayof a wide variety of pathological processes, which are pres-ent to varying degrees across the cognitive spectrum of ourcohort due to the high level of cohort diversity (Wilson etal., 1999). Because BV reflects the accumulated effects ofall such processes, even among cognitively-normal partici-pants, BV in this cohort possesses great variability that isprimarily driven by progressive pathology. This wouldmake BV a more specific measure of progressive patholog-ical damage than HC and therefore a better predictor ofcognitive change. The second reason is that brain volumemay reflect the sheer bulk of brain tissue that is available forcognitive systems to recruit to compensate for future path-ological damage, leading to improved outcomes on averagefor individuals with higher BV (Dai et al., 2009; Dickersonet al., 2005; Stern et al., 2000; Gould et al., 2006; Cabeza etal., 2002). The third reason is that because the hippocampusis complex, small, and partially bounded by other graymatter structures, HC may have greater measurement noisethan BV or WMH, thus reducing the strength of its associ-ations with cognitive change.
While prediction of future cognitive performance wasthe primary scientific goal of this study, cross-sectionalrelationships between MRI variables and cognitive perfor-mance validate our methodology by largely agreeing with asubstantial body of prior cross-sectional imaging studies.Specifically, greater BV was associated with greater perfor-mance across all three domains, greater HC was associatedwith greater memory performance, and greater WMH wasassociated with poorer episodic memory and executivefunction.
The key strengths of this study are its heterogeneous,
community-dwelling participants and careful, frequent
93O. Carmichael et al. / Neurobiology of Aging 33 (2012) 83–95
measurement of cognition. The state-of-the-art cognitiveinstruments allowed sensitive and robust measurement ofdistinct aspects of longitudinal cognitive function acrossmultiple languages and across a broad ability range; thisis what enabled us to assess MRI predictors of cognitionin a population that included significant numbers ofSpanish-speaking and English-speaking participants anda broad range of baseline cognition and cognitive change.The diversity in cognitive characteristics across the sam-ple reflects our intentional recruitment of individuals thatwere diverse in terms of socioeconomic status, cardio-vascular health, and other factors that impact cognitiveand brain health. Acquiring cognitive assessments fre-quently—approximately yearly— helped us to guardagainst interval censoring issues. These unique featuresof the study support the generalizability of our findings toa relatively broad subset of the elderly population atlarge.
The key limitation of this study was the lack of mul-tiple MRI measurements per subject. As mentionedabove, heterogeneity in neuropathology in this samplelikely lead to heterogeneity in brain structure, which leadto high heterogeneity in cognitive trajectories. Imagingthe brain at a single time point does not allow us tocharacterize longitudinal trajectories of brain structure,and therefore limits our ability to characterize longitudi-nal cognition. In particular, we were unable to detectindividuals whose MRI-based brain measures were in themidst of deteriorating, and therefore would presumablyexhibit poorer cognitive outcomes. This limitation ofsingle-MRI studies has been exhibited repeatedly in theAD literature, where serial MRI measurements are supe-rior to a single MRI for detecting and characterizing thedisease (Jack et al., 2005; Schott et al., 2005). However,global MRI measures at a single time point did haveutility for predicting future performance. Therefore, fu-ture studies should determine the value-added by multi-ple MRIs over a single MRI for predicting subsequentcognitive trajectories in this heterogeneous sample.
Another limitation is our modeling of cognitive changeas a linear trend over time. We used psychometricallymatched composite scales designed to have linear measure-ment characteristics that may have encouraged linearity incognitive trajectories over time, and graphical plots such asFig. 4 suggested that linear trajectories provided adequatefits to our data. However, because many of the subjects hadonly two or three cognitive evaluations, we likely lackedadequate statistical power to formally assess whether therewere systematic trends toward nonlinear cognitive changesat the population level. While most prior work in this areainvolves linear models of cognitive change, recent evidencesuggests that nonlinear models may provide a more accuratecharacterization of individual cognitive trajectories (John-
son et al., 2009).Ethnicity effects in this study merit special consideration.The sample in this study was a sample of convenience, anddifferent ethnic groups were not equated in terms of amountof underlying brain pathology and cognitive trajectories.Caucasians on average had greater brain pathology as indi-cated by smaller brain and hippocampal volumes and fastercognitive decline. We controlled for ethnicity in analyses,which helps to limit confounding effects that might obscurerelationships between MRI and cognition (Mungas et al.,2009). In addition, we were limited in our ability to assessthe role of ethnicity as an independent predictor of cognitivetrajectories because the clinic-recruited and community-recruited components of our sample differed significantlywith respect to both ethnic makeup and MRI measures(Farias et al., 2009). The consistency of findings betweenthe full sample and the reduced sample of community re-cruits supports the validity of our conclusions, but futurework should verify findings related to ethnicity on a largercohort that lacks possible recruitment biases. Another im-portant question that this study did not address is whetherethnicity modifies the relationship between MRI and cog-nition, that is, if the MRI-cognition relationships differacross ethnic groups. This would involve interaction effectsand the sample size, while relatively large for a studycomparing MRI and cognition, is not large enough to pro-vide adequate statistical power to identify across-group dif-ferences in associations of MRI and cognition. Finding nosignificant difference would be especially problematic, be-cause true lack of difference could not be distinguishedfrom lack of statistical power to detect difference.
This study is part of an effort to understand the myriadbiological processes that encourage or discourage cognitivedecline in a diverse elderly population, and use that under-standing to develop tools for diagnosis, prognosis, and treat-ment. The role of this study in that effort is 2-fold: first, tosuggest that methods that reduce brain atrophy or the for-mation of WMH could promote cognitive health, and sec-ond, to suggest that MRI measures of these brain propertiescould have prognostic value across a very heterogeneoussample. Future work should build on these findings byevaluating the value-added to prognosis by measures thathave greater explanatory value than our MRI measures, areeasier to obtain, or provide complementary views of brainstructure and function. In particular, recently-developedMRI measures of the spatial arrangement, shape, connec-tivity, and function of localized brain regions may assess theintegrity of specific cognitive systems more precisely thanBV and WMH, and therefore may have greater prognosticvalue for specific cognitive outcomes (DeCarli et al., 2005;Xie et al., 2009; Greicius et al., 2004; Thompson et al.,2004). As mentioned above, multiple MRI per individualcould provide measures of brain structural trajectories thathelp to indicate progressive neuropathological damage. Avariety of molecular markers derived from blood or cere-
brospinal fluid are potentially cheaper and easier to obtain
94 O. Carmichael et al. / Neurobiology of Aging 33 (2012) 83–95
than brain MRI, and provide microscopic measures of neu-ropathological activity that complement the macroscopicview provided by MRI; these markers may modify thebrain-cognition relationships established here and thereforecould add value for prognosis. Finally, given the geneticdiversity present in a heterogeneous cohort, the contributionof genetic risk factors as determinants of brain structure andmodifiers of brain-cognition relationships should be ex-plored as well. Assessing the contribution of these addi-tional measures to prognosis involves adding them to thefoundational statistical models presented in this study, andformally testing whether they provide additional explana-tory value.
Disclosure statement
The authors report no conflicts of interest.
Acknowledgements
This work was supported by National Institute on AgingGrants AG10220, AG10129, AG 030,514, AG031252, andAG021028 and by the California Department of PublicHealth Alzheimer’s Disease Program Contracts 06–55,311and 06–55,312. Dr Miller receives research support fromthe NIH (R01CA120523-01A1 (Co–I), # 1R21CA116409-01A2 (PI), # 1R01HL083276-01A2 (Co–I), and no.2R44DK077563-02 (Co–I)), the US Department of Defense[W81XWH-07-1-0650 (Co-PI)], and the American CancerSociety.
Appendix: Reliability of residualized and normalizedMRI variables
Our goal was to estimate the independent effects of BV,HC, and WMH on cognitive variables, but BV and HC wereboth strongly correlated with TCV. We considered twoalternatives for accounting for this correlation in the statis-tical modeling: normalizing, in which BV and HC weredivided by TCV; and residualizing, in which BV and HCwere related to TCV in linear regression models, and BVand HC were replaced by the difference between their truevalues and the values predicted by linear regression basedsolely on TCV. Both approaches result in a derived MRImeasurement (e.g., normalized BV or residualized BV)based on a combination of two raw MRI measurements (BVand TCV). Each raw MRI measurement represents a true,underlying MRI quantity that has been corrupted by somelevel of measurement noise. We used a simulation study toassess the robustness of the derived measurements by de-termining how differing levels of additive noise in the rawmeasurements modified the reliability of the derived MRImeasurements. To do so, we used the MRI measures from
this study as “true” scores and then added randomly gener-ated, normally distributed artificial measurement noise tothese scores to correspond to reliabilities of the raw mea-sures of .95, .90, and .75. We then calculated normalizedand residualized measures of BV and HC, and repeated thisprocess over 100 independent simulations for each reliabil-ity level. “True” normalized and residualized measures werecalculated and were correlated with derived measures withsimulated measurement error. These correlation coefficientswere used to estimate reliability of the derived BV and HCmeasures. The reliability of residualized measures wasmodestly but consistently higher than that of normalizedmeasures. For BV, average reliability across simulations ofresidualized versus normalized was 0.84 compared with0.82 when raw score reliability was 0.95, it was 0.63 versus0.59 when raw score reliability was 0.90, and it was 0.48versus 0.43 when raw score reliability was 075. For HC,corresponding values were both 0.96 at reliability of 0.95,0.87 versus 0.86 at reliability of 0.90, and 0.77 versus 0.74at reliability of 0.75. For low levels of added noise, thedifference in reliability between corresponding residualizedand normalized measures was not great, but this differenceincreased with increasing levels of added noise. BV wasmore affected than HC because BV is much more highlycorrelated with ICV than is HC (0.86 v. 0.35). Differencesbetween normalized and residualized measures were notsubstantial at realistic reliability levels, but normalized mea-sures also are potentially problematic due to induced nega-tive correlation between ICV and the derived normalizedmeasure (Van Petten, 2004). This problem does not apply tothe residualized measures.
References
Albert, M.S., Jones, K., Savage, C.R., Berkman, L., Seeman, T., Blazer, D.,Rowe, J.W., 1995. Predictors of cognitive change in older persons:MacArthur studies of successful aging. Psychol. Aging 10, 578–58.
Buckner, R.L., 2004. Memory and executive function in aging and AD:multiple factors that cause decline and reserve factors that compensate.Neuron 44, 195–208.
Cabeza, R., Anderson, N.D., Locantore, J.K., McIntosh, A.R., 2002. Aginggracefully: compensatory brain activity in high-performing olderadults. Neuroimage 17, 1394–1402.
Carmichael, O.T., Kuller, L.H., Lopez, O.L., Thompson, P.M., Dutton,R.A., Lu, A., Lee, S.E., Lee, J.Y., Aizenstein, H.J., Meltzer, C.C., Liu,Y., Toga, A.W., Becker, J.T., 2007. Ventricular volume and dementiaprogression in the Cardiovascular Health Study. Neurobiol. Aging 28,389–397.
Chetelat, G., Baron, J.C., 2003. Early diagnosis of Alzheimer’s disease:contribution of structural neuroimaging. Neuroimage 18, 525–541.
Christensen, H., Mackinnon, A.J., Korten, A.E., Jorm, A.F., Henderson,A.S., Jacomb, P., Rodgers, B., 1999. An analysis of diversity in thecognitive performance of elderly community dwellers: individual dif-ferences in change scores as a function of age. Psychol. Aging 14,365–379.
Colsher, P.L., Wallace, R.B., 1991. Longitudinal application of cognitivefunction measures in a defined population of community-dwellingelders. Ann. Epidemiol. 1, 215–230.
Crane, P.K., Narasimhalu, K., Gibbons, L.E., Pedraza, O., Mehta, K.M.,
Tang, Y., Manly, J.J., Reed, B.R., Mungas, D.M., 2008. Composite
95O. Carmichael et al. / Neurobiology of Aging 33 (2012) 83–95
scores for executive function items: demographic heterogeneity andrelationships with quantitative magnetic resonance imaging. J. Int.Neuropsychol. Soc. 14, 746–759.
Dai, W., Lopez, O.L., Carmichael, O.T., Becker, J.T., Kuller, L.H., Gach,H.M., 2009. Mild cognitive impairment and alzheimer disease: patternsof altered cerebral blood flow at MR imaging. Radiology 250, 856–866.
Dauncey, M.J., Bicknell, R.J., 1999. “Nutrition and neurodevelopment:mechanisms of developmental dysfunction and disease in later life.”Nutr Res Rev. 12, 231–253.
De Groot, J.C., De Leeuw, F.E., Oudkerk, M., Van Gijn, J., Hofman, A.,Jolles, J., Breteler, M.M., 2002. Periventricular cerebral white matterlesions predict rate of cognitive decline. Ann Neurol. 52, 335–341.
DeCarli, C., Fletcher, E., Ramey, V., Harvey, D., Jagust, W.J., 2005.Anatomical mapping of white matter hyperintensities (WMH): explor-ing the relationships between periventricular WMH, deep WMH, andtotal WMH burden. Stroke 36, 50–55.
DeCarli, C., Maisog, J., Murphy, D.G., Teichberg, D., Rapoport, S.I.,Horwitz, B., 1992. Method for quantification of brain, ventricular, andsubarachnoid CSF volumes from MR images. J. Comput. Assist. To-mogr. 16, 274–284.
DeCarli, C., Murphy, D.G., Teichberg, D., Campbell, G., Sobering, G.S.,1996. Local histogram correction of MRI spatially dependent imagepixel intensity nonuniformity. J. Magn. Reson. Imaging 6, 519–528.
DeCarli, C., Reed, B.R., Jagust, W., Martinez, O., Ortega, M., Mungas, D.,2008. Brain behavior relationships among African Americans, whites,and Hispanics. Alzheimer Dis. Assoc. Disord. 22, 382–391.
Dickerson, B.C., Salat, D.H., Greve, D.N., Chua, E.F., Rand-Giovannetti,E., Rentz, D.M., Bertram, L., Mullin, K., Tanzi, R.E., Blacker, D.,Albert, M.S., Sperling, R.A., 2005. Increased hippocampal activation inmild cognitive impairment compared to normal aging and AD. Neu-rology 65, 404–411.
Farias, S., Mungas, D., Reed, B., Harvey, D., DeCarli, C., 2009. Progres-sion of Mild Cognitive Impairment to Dementia in Clinic versus Com-munity-Based Cohorts. Arch. Neurol. in press.
Ganguli, M., Dodge, H.H., Shen, C., DeKosky, S.T., 2004. Mild cognitiveimpairment, amnestic type: an epidemiologic study. Neurology 63,115–121.
Gould, R.L., Arroyo, B., Brown, R.G., Owen, A.M., Bullmore, E.T.,Howard, R.J., 2006. Brain mechanisms of successful compensationduring learning in Alzheimer disease. Neurology 67, 1011–1017.
Greicius, M.D., Srivastava, G., Reiss, A.L., Menon, V., 2004. Default-mode network activity distinguishes Alzheimer’s disease from healthyaging: evidence from functional MRI. Proc. Natl. Acad. Sci. USA 101,4637–4642.
Ihaka, R., Gentleman, R., 1996. R: A Language for Data Analysis andGraphics. J. Comput. Graph. Stat. 5, 299–314.
Jack, C.R., Jr, Shiung, M.M., Weigand, S.D., O’Brien, P.C., Gunter, J.L.,Boeve, B.F., Knopman, D.S., Smith, G.E., Ivnik, R.J., Tangalos, E.G.,Petersen, R.C., 2005. Brain atrophy rates predict subsequent clinicalconversion in normal elderly and amnestic MCI. Neurology 65, 1227–1231.
Johnson, D.K., Storandt, M., Morris, J.C., Galvin, J.E., 2009. Longitudinalstudy of the transition from healthy aging to Alzheimer disease. Arch.Neurol. 66, 1254–1259.
Manly, J.J., Tang, M.X., Schupf, N., Stern, Y., Vonsattel, J.P., Mayeux, R.,2008. Frequency and course of mild cognitive impairment in a multi-ethnic community. Ann. Neurol. 63, 494–506.
Mungas, D., Beckett, L., Harvey, D., Farias, S., Reed, B., Carmichael, O.,Olichney, J., Miller, J., DeCarli, C., 2009. Heterogeneity of CognitiveTrajectories in Diverse Older Persons: What Does Diagnosis Tell Us?Psychology And Aging (in press).
Mungas, D., Reed, B.R., Crane, P.K., Haan, M.N., Gonzalez, H., 2004.Spanish and English Neuropsychological Assessment Scales (SENAS):further development and psychometric characteristics. Psychol. Assess.
16, 347–359.Mungas, D., Reed, B.R., Farias, S.T., Decarli, C., 2009. Age and educationeffects on relationships of cognitive test scores with brain structure indemographically diverse older persons. Psychol. Aging 24, 116–128.
Mungas, D., Reed, B.R., Haan, M.N., Gonzalez, H., 2005. Spanish andEnglish neuropsychological assessment scales: relationship to demo-graphics, language, cognition, and independent function. Neuropsy-chology 19, 466–475.
Mungas, D., Reed, B.R., Marshall, S.C., Gonzalez, H.M., 2000. Develop-ment of psychometrically matched English and Spanish language neu-ropsychological tests for older persons. Neuropsychology 14, 209–223.
Mungas, D., Reed, B.R., Tomaszewski Farias, S., DeCarli, C., 2005.Criterion-referenced validity of a neuropsychological test battery:equivalent performance in elderly Hispanics and non-Hispanic Whites.J. Int. Neuropsychol. Soc. 11, 620–630.
Palmer, K., Wang, H.X., Backman, L., Winblad, B., Fratiglioni, L., 2002.Differential evolution of cognitive impairment in nondemented olderpersons: results from the Kungsholmen Project. Am. J. Psychiatry 159,436–442.
Petit, T.L., Alfano, D.P., LeBoutillier, J.C., 1983. Early lead exposure andthe hippocampus: a review and recent advances. Neurotoxicology 4,79–94.
Pinheiro, J., Bates, D., 2000. Mixed-Effects Models in S and S-Plus.Springer-Verlag, New York, NY.
Ritchie, K., Artero, S., Touchon, J., 2001. Classification criteria for mildcognitive impairment: a population-based validation study. Neurology56, 37–42.
Rubin, E.H., Storandt, M., Miller, J.P., Kinscherf, D.A., Grant, E.A.,Morris, J.C., Berg, L., 1998. A prospective study of cognitive functionand onset of dementia in cognitively healthy elders. Arch. Neurol. 55,395–401.
Saito, Y., Murayama, S., 2007. Neuropathology of mild cognitive impair-ment. Neuropathology 27, 578–584.
Schaie, K.W., 1988. Variability in cognitive function in the elderly: im-plications for societal participation. Basic Life Sci. 43, 191–211.
Schott, J.M., Price, S.L., Frost, C., Whitwell, J.L., Rossor, M.N., Fox, N.C.,2005. Measuring atrophy in Alzheimer disease: a serial MRI study over6 and 12 months. Neurology 65, 119–124.
Stern, Y., Moeller, J.R., Anderson, K.E., Luber, B., Zubin, N.R., DiMauro,A.A., Park, A., Campbell, C.E., Marder, K., Bell, K., Van Heertum, R.,Sackeim, H.A., 2000. Different brain networks mediate task perfor-mance in normal aging and AD: defining compensation. Neurology 55,1291–1297.
Sullivan, E.V., Pfefferbaum, A., Swan, G.E., Carmelli, D., 2001. Herita-bility of hippocampal size in elderly twin men: equivalent influencefrom genes and environment. Hippocampus 11, 754–762.
Thompson, P.M., Hayashi, K.M., De Zubicaray, G.I., Janke, A.L., Rose,S.E., Semple, J., Hong, M.S., Herman, D.H., Gravano, D., Doddrell,D.M., Toga, A.W., 2004. Mapping hippocampal and ventricular changein Alzheimer disease. Neuroimage 22, 1754–1766.
Van Petten, C., 2004. Relationship between hippocampal volume andmemory ability in healthy individuals across the lifespan: review andmeta-analysis. Neuropsychologia 42, 1394–1413.
Wilson, R.S., Beckett, L.A., Barnes, L.L., Schneider, J.A., Bach, J., Evans,D.A., Bennett, D.A., 2002. Individual differences in rates of change incognitive abilities of older persons. Psychol. Aging 17, 179–193.
Wilson, R.S., Beckett, L.A., Bennett, D.A., Albert, M.S., Evans, D.A.,1999. Change in cognitive function in older persons from a communitypopulation: relation to age and Alzheimer disease. Arch. Neurol. 56,1274–1279.
Xie, J., Alcantara, D., Amenta, N., Fletcher, E., Martinez, O., Persianinova,M., DeCarli, C., Carmichael, O., 2009. Spatially localized hippocampalshape analysis in late-life cognitive decline. Hippocampus 19, 526–532.
Zelinski, E.M., Gilewski, M.J., Schaie, K.W., 1993. Individual differencesin cross-sectional and 3-year longitudinal memory performance across
the adult life span. Psychol. Aging 8, 176–186.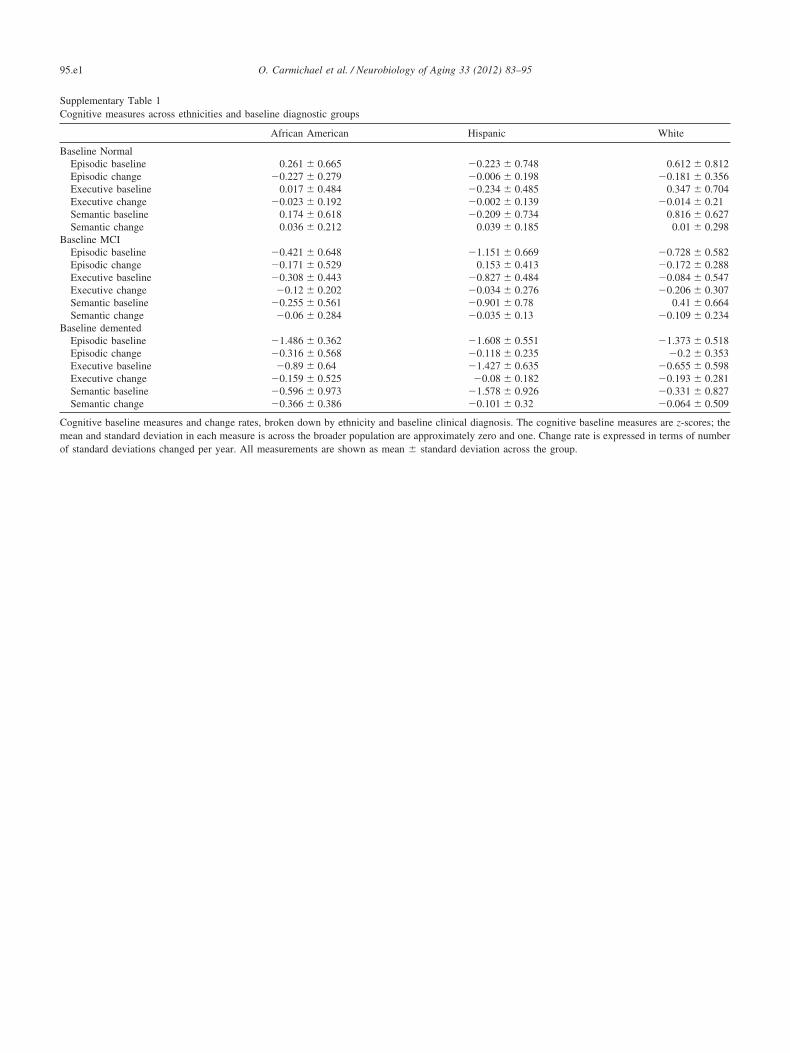
B
B
mean � standard deviation across the group.
95.e1 O. Carmichael et al. / Neurobiology of Aging 33 (2012) 83–95
Supplementary Table 1Cognitive measures across ethnicities and baseline diagnostic groups
African American
aseline NormalEpisodic baseline 0.261 � 0.665Episodic change �0.227 � 0.279Executive baseline 0.017 � 0.484Executive change �0.023 � 0.192Semantic baseline 0.174 � 0.618Semantic change 0.036 � 0.212
aseline MCIEpisodic baseline �0.421 � 0.648Episodic change �0.171 � 0.529Executive baseline �0.308 � 0.443Executive change �0.12 � 0.202Semantic baseline �0.255 � 0.561Semantic change �0.06 � 0.284
Baseline dementedEpisodic baseline �1.486 � 0.362Episodic change �0.316 � 0.568Executive baseline �0.89 � 0.64Executive change �0.159 � 0.525Semantic baseline �0.596 � 0.973Semantic change �0.366 � 0.386
Cognitive baseline measures and change rates, broken down by ethnicity amean and standard deviation in each measure is across the broader populatof standard deviations changed per year. All measurements are shown as
Hispanic White
�0.223 � 0.748 0.612 � 0.812�0.006 � 0.198 �0.181 � 0.356�0.234 � 0.485 0.347 � 0.704�0.002 � 0.139 �0.014 � 0.21�0.209 � 0.734 0.816 � 0.627
0.039 � 0.185 0.01 � 0.298
�1.151 � 0.669 �0.728 � 0.5820.153 � 0.413 �0.172 � 0.288
�0.827 � 0.484 �0.084 � 0.547�0.034 � 0.276 �0.206 � 0.307�0.901 � 0.78 0.41 � 0.664�0.035 � 0.13 �0.109 � 0.234
�1.608 � 0.551 �1.373 � 0.518�0.118 � 0.235 �0.2 � 0.353�1.427 � 0.635 �0.655 � 0.598�0.08 � 0.182 �0.193 � 0.281
�1.578 � 0.926 �0.331 � 0.827�0.101 � 0.32 �0.064 � 0.509
nd baseline clinical diagnosis. The cognitive baseline measures are z-scores; theion are approximately zero and one. Change rate is expressed in terms of number
95.e2O. Carmichael et al. / Neurobiology of Aging 33 (2012) 83–95
Supplementary Table 2MRI measures across ethnicities and baseline diagnostic groups
Baseline MRI volumes African American Hispanic White
Baseline Normal Brain 896.241 � 100.6 946.229 � 109.004 948.748 � 102.119hippocampus 3.507 � 0.606 3.836 � 0.601 4.045 � 0.661WMH 9.393 � 9.093 4.601 � 4.19 7.849 � 9.508
Baseline MCI Brain 889.082 � 113.975 926.283 � 103.713 942.316 � 98.269hippocampus 3.527 � 0.665 3.594 � 0.538 3.55 � 0.729WMH 6.395 � 5.279 6.968 � 7.109 13.57 � 19.534
Baseline demented Brain 848.978 � 109.668 835.675 � 81.053 899.059 � 100.374hippocampus 3.011 � 0.723 3.122 � 0.766 3.179 � 0.544WMH 8.485 � 8.56 10.051 � 12.233 16.507 � 18.278
MRI variables broken down by baseline clinical diagnosis and ethnicity. All measurements are in units of cubic centimeters. All measurements are shown
as mean � standard deviation across the group.
Related Documents

![Lumbar foraminal neuropathy: an update on non-surgical ...€¦ · Foraminal stenosis is common in the elderly population [1], characterized by narrowing of the bony exit of the nerve](https://static.cupdf.com/doc/110x72/6062a38e6344726cad414763/lumbar-foraminal-neuropathy-an-update-on-non-surgical-foraminal-stenosis-is.jpg)