1 IR Contacts United States Kevin C. Mannix (215) 591-8912 Israel Ran Meir 972 (3) 9267516 PR Contacts United States Kelley Dougherty (973) 658-0237 Israel Yonatan Beker 972 (54) 888 5898 TEVA REPORTS FOURTH QUARTER AND FULL YEAR 2018 FINANCIAL RESULTS FY 2018 Q4 2018 Revenues $18.9 billion $4.6 billion Cash flow from operations $2.4 billion $0.4 billion GAAP loss per share $2.35 $2.85 Non-GAAP EPS $2.92 $0.53 2019 Business outlook: Revenues are expected to be $17.0 – 17.4 billion Non-GAAP EPS is expected to be $2.20-2.50 Jerusalem, February 13, 2019 - Teva Pharmaceutical Industries Ltd. (NYSE and TASE: TEVA) today reported results for the year and the quarter ended December 31, 2018. Mr. Kåre Schultz, Teva’s President and CEO, said, "2018 was the first year of our restructuring plan and we have met or exceeded all of our key financial targets for the year. The full year yielded a cost base reduction of $2.2 billion, exceeding our 2018 target, and we are well on track to deliver the total $3.0 billion reduction in 2019 as compared to the 2017 spend base. AJOVY ® is performing very well since its September launch in the U.S. with growing demand for the first and only anti- CGRP treatment with both quarterly and monthly dosing for the preventive treatment of migraine in adults. We will focus our investments on growing AJOVY and continuing our success with AUSTEDO ® , with both franchises positioned to be important growth drivers for Teva. Looking ahead, we continue to expect that 2019 will be the trough for our business, a year in which we will experience similar challenges to those of 2018 including the continued erosion of COPAXONE ® in the U.S. and Europe as well as the introduction of generics in the ProAir ® market. Throughout the year, we will continue to execute against our restructuring plan goals, including the optimization of our global portfolio and network, as we focus our efforts on generating cash to reduce the company's debt." 2018 Annual Consolidated Results Revenues in 2018 were $18,854 million, a decrease of 16% in both U.S. dollar and local currency terms, compared to 2017, mainly due to generic competition to COPAXONE, a decline in revenues

Welcome message from author
This document is posted to help you gain knowledge. Please leave a comment to let me know what you think about it! Share it to your friends and learn new things together.
Transcript

1 IR Contacts United States Kevin C. Mannix (215) 591-8912
Israel Ran Meir 972 (3) 9267516
PR Contacts United States Kelley Dougherty (973) 658-0237
Israel Yonatan Beker 972 (54) 888 5898
TEVA REPORTS FOURTH QUARTER AND FULL YEAR 2018 FINANCIAL RESULTS
FY 2018 Q4 2018
Revenues $18.9 billion $4.6 billion
Cash flow from operations $2.4 billion $0.4 billion
GAAP loss per share $2.35 $2.85
Non-GAAP EPS $2.92 $0.53
2019 Business outlook:
Revenues are expected to be $17.0 – 17.4 billion
Non-GAAP EPS is expected to be $2.20-2.50
Jerusalem, February 13, 2019 - Teva Pharmaceutical Industries Ltd. (NYSE and TASE: TEVA)
today reported results for the year and the quarter ended December 31, 2018.
Mr. Kåre Schultz, Teva’s President and CEO, said, "2018 was the first year of our restructuring plan
and we have met or exceeded all of our key financial targets for the year. The full year yielded a
cost base reduction of $2.2 billion, exceeding our 2018 target, and we are well on track to deliver
the total $3.0 billion reduction in 2019 as compared to the 2017 spend base. AJOVY® is performing
very well since its September launch in the U.S. with growing demand for the first and only anti-
CGRP treatment with both quarterly and monthly dosing for the preventive treatment of migraine
in adults. We will focus our investments on growing AJOVY and continuing our success with
AUSTEDO®, with both franchises positioned to be important growth drivers for Teva.
Looking ahead, we continue to expect that 2019 will be the trough for our business, a year in which
we will experience similar challenges to those of 2018 including the continued erosion of
COPAXONE® in the U.S. and Europe as well as the introduction of generics in the ProAir® market.
Throughout the year, we will continue to execute against our restructuring plan goals, including the
optimization of our global portfolio and network, as we focus our efforts on generating cash to
reduce the company's debt."
2018 Annual Consolidated Results
Revenues in 2018 were $18,854 million, a decrease of 16% in both U.S. dollar and local currency
terms, compared to 2017, mainly due to generic competition to COPAXONE, a decline in revenues

2 IR Contacts United States Kevin C. Mannix (215) 591-8912
Israel Ran Meir 972 (3) 9267516
PR Contacts United States Kelley Dougherty (973) 658-0237
Israel Yonatan Beker 972 (54) 888 5898
in our U.S. generics business and loss of revenues following the divestment of certain products and
discontinuation of certain activities.
Exchange rate movements between 2018 and 2017 positively impacted our revenues by $152
million, our GAAP operating income by $4 million and our non-GAAP operating income by $10
million.
GAAP gross profit was $8,296 million in 2018, a decrease of 22% compared to 2017. GAAP gross
profit margin for 2018 was 44.0%, compared to 47.4% in 2017. Non-GAAP gross profit was
$9,546 million in 2018, a decrease of 21% compared to 2017. Non-GAAP gross profit margin was
50.6% in 2018, compared to 53.8% in 2017. The decrease in both GAAP and non-GAAP gross
profit was mainly due to lower profitability in North America resulting from a decline in
COPAXONE revenues due to generic competition and a decline in revenues in our U.S. generics
business, partially offset by higher profitability in Europe.
Research and Development (R&D) expenses in 2018 were $1,213 million, a decrease of 32%
compared to 2017. R&D expenses excluding equity compensation expenses and purchase of in-
process R&D in 2018 were $1,102 million, or 5.8% of revenues, compared to $1,515 million or
6.8% in 2017. The decrease in R&D expenses resulted primarily from pipeline optimization, phase
3 studies that have ended and related headcount reductions.
Selling and Marketing (S&M) expenses in 2018 were $2,916 million, a decrease of 14% compared
to 2017. S&M expenses excluding amortization of purchased intangible assets and equity
compensation expenses were $2,718 million, or 14.4% of revenues, in 2018, compared to $3,149
million, or 14.1% of revenues, in 2017. The decrease was mainly due to cost reductions and
efficiency measures as part of the restructuring plan.
General and Administrative (G&A) expenses in 2018 were $1,298 million, a decrease of 11%
compared to 2017. G&A expenses excluding equity compensation expenses were $1,228 million in
2018, or 6.5% of revenues, compared to $1,413 million or 6.3% of revenues in 2017. The decrease
was mainly due to cost reductions and efficiency measures as part of the restructuring plan.
GAAP other income in 2018 was $291 million, compared to other income of $1,199 million in
2017. The decline in GAAP other income was primarily the result of none recurring income related
to the divestment of our women's health business in 2017. Non-GAAP other income in 2018 was
$225 million, an increase of 94% compared to $116 million in 2017, mainly due to higher Section
8 recoveries from multiple cases in Canada and recovery of lost profits in cases in which U.S. patent
infringement litigation had previously prevented the sale of certain products.
GAAP Operating loss was $1,637 million in 2018 compared to operating loss of $17,484 million
in 2017. The increase was mainly due higher goodwill impairment charges, higher intangible assets
impairments and other asset impairments recorded in 2017. Non-GAAP operating income was
$4,723 million, a decrease of 22% compared to $6,073 million in 2017.
Adjusted EBITDA (non-GAAP operating income, which excludes amortization and certain other
items, and excluding depreciation expenses) in 2018 was $5,319 million, compared to $6,665
million in 2017.

3 IR Contacts United States Kevin C. Mannix (215) 591-8912
Israel Ran Meir 972 (3) 9267516
PR Contacts United States Kelley Dougherty (973) 658-0237
Israel Yonatan Beker 972 (54) 888 5898
In 2018, GAAP financial expenses were $959 million, compared to $895 million in 2017. Non-
GAAP financial expenses were $893 in 2018, compared to $908 in 2017.
In 2018 we recognized a GAAP tax benefit of $195 million, or 8%, on pre-tax loss of $2,596
million. In 2017 we recognized a tax benefit of $1,933 million, or 11%, on pre-tax loss of $18,379
million. Our tax rate for 2018 was mainly affected by one-time legal settlements and divestments
that had a low corresponding tax effect. Additionally, in 2018 we recorded impairments, some of
which did not have a corresponding tax effect.
The non-GAAP income taxes for 2018 were $519 million on non-GAAP pre-tax income of $3,830
million. The non-GAAP income taxes in 2017 were $788 million on non-GAAP pre-tax income of
$5,165 million. The non-GAAP tax rate for 2018 was 14%, compared to 15% in 2017. The decrease
in our tax rate was mainly due to the reduction in the U.S. federal corporate tax rate following the
U.S. tax reform.
GAAP net loss attributable to Teva's ordinary shareholders and GAAP diluted loss per share in
2018 were $2,399 million and $2.35, respectively, compared to net loss of $16,525 million and
diluted loss per share of $16.26 in 2017. Non-GAAP net income attributable to ordinary
shareholders for calculating diluted EPS and non-GAAP diluted EPS in 2018 were $2,985 million
and $2.92, respectively, compared to $4,075 million and $4.01 in 2017.
The weighted average diluted shares outstanding used for the fully diluted share calculation on
a GAAP basis for 2018 and 2017 were 1,021 million and 1,016 million shares, respectively. The
weighted average outstanding shares used for the fully diluted EPS calculation on a non-GAAP
basis for 2018 and 2017 were 1,024 million and 1,018 million shares, respectively.
As of December 31, 2018 and 2017, the fully diluted share count for purposes of calculating our
market capitalization was approximately 1,100 million and 1,086 million shares, respectively.
Non-GAAP information: Net non-GAAP adjustments in 2018 were $5,384 million. Non-GAAP
net income and non-GAAP EPS for the year were adjusted to exclude the following items:
A goodwill impairment of $3,027 million, mainly related to International Markets;
An impairment of intangible and fixed assets and equity investment of $2,594 million mainly
related to the acquisition of Actavis Generics;
Amortization of purchased intangible assets totaling $1,166 million, of which $1,004 million
is included in cost of goods sold and the remaining $162 million in selling and marketing
expenses;
Restructuring expenses of $488 million;
Equity compensation expenses of $152 million;
In-Process R&D of $83 million;
Financial expenses of $66 million mainly related to early redemption fees;
Contingent consideration of $57 million;
Other non-GAAP items of $104 million;
Minority interest adjustment of $431 million mainly relate to business venture in
International markets;
Related tax effect of $714 million; and

4 IR Contacts United States Kevin C. Mannix (215) 591-8912
Israel Ran Meir 972 (3) 9267516
PR Contacts United States Kelley Dougherty (973) 658-0237
Israel Yonatan Beker 972 (54) 888 5898
Benefits from legal settlements and loss contingencies of $1,208 million, mainly related to
the Allergan working capital adjustments, the Rimsa settlement and the reversal of the
reserve recorded for the carvedilol judgement against Teva.
Teva believes that excluding such items facilitates investors' understanding of its business. For
further information see the below tables for a reconciliation of the U.S. GAAP results to the
adjusted non-GAAP figures and the information under “Non-GAAP Financial Measures.”
Investors should consider non-GAAP financial measures in addition to, and not as replacement
for, or superior to, measures of financial performance prepared in accordance with GAAP.
Cash flow generated from operating activities in 2018 was $2,446 million, an increase of $221
million, or 10% compared to 2017. This increase was mainly due to the working capital adjustment
with Allergan and the Rimsa settlement in 2018, partially offset by lower profit in our North
America segment.
Free cash flow (Cash flow generated from operating activities in 2018, net of cash used for capital
investments and beneficial interest collected in exchange for securitized trade receivables) was
$3,679 million, compared to $2,693 million in 2017. This increase resulted mainly from the higher
cash flow generated from operating activities, higher beneficial interest collected in exchange for
securitized trade receivables and lower capital expenditures.
As of December 31, 2018, our debt was $28,916 million, compared to $32,475 million as of
December 31, 2017. The decrease was mainly due to senior notes and term loans repaid at maturity
or prepaid with cash generated during the year. The portion of total debt classified as short-term as
of December 31, 2018 was 8%, compared to 11% as of December 31, 2017, due to a decrease in
current maturities. Our average debt maturity was approximately 6.8 years as of December 31, 2018,
compared to 6.4 years as of December 31, 2017.
Annual Report on Form 10-K
Teva will file its Annual Report on Form 10-K with the SEC in the coming days. The report will
include a complete analysis of the financial results for 2018 and will be available on Teva’s website,
http://ir.tevapharm.com, as well as on the SEC’s website: http://www.sec.gov.
Fourth Quarter 2018 Consolidated Results
Revenues in the fourth quarter of 2018 were $4,559 million, a decrease of 16%, or 14% in local
currency terms, compared to the fourth quarter of 2017, mainly due to generic competition to
COPAXONE, a decline in revenues in our U.S. generics business and loss of revenues following
the divestment of certain products and discontinuation of certain activities.
Exchange rate differences between the fourth quarter of 2018 and the fourth quarter of 2017
negatively impacted our revenues and GAAP operating income by $100 million and $13 million,
respectively. Our non-GAAP operating income was negatively impacted by $17 million.

5 IR Contacts United States Kevin C. Mannix (215) 591-8912
Israel Ran Meir 972 (3) 9267516
PR Contacts United States Kelley Dougherty (973) 658-0237
Israel Yonatan Beker 972 (54) 888 5898
GAAP gross profit was $1,971 million in the fourth quarter of 2018, a decrease of 19% compared
to the fourth quarter of 2017. GAAP gross profit margin was 43.2% in the fourth quarter of 2018,
compared to 45.3% in the fourth quarter of 2017. Non-GAAP gross profit was $2,328 million in
the fourth quarter of 2018, a decline of 15% from the fourth quarter of 2017. Non-GAAP gross
profit margin was 51.1% in the fourth quarter of 2018, compared to 50.9% in the fourth quarter of
2017. The increase in gross profit margin on a non-GAAP basis resulted primarily from improved
gross profit margin in our Europe segment.
Research and Development (R&D) expenses for the fourth quarter of 2018 were $295 million, a
decrease of 15% compared to the fourth quarter of 2017. R&D expenses excluding equity
compensation expenses and other expenses were $289 million, or 6.3% of quarterly revenues in the
fourth quarter of 2018, compared to $295 million, or 5.5% of quarterly revenues in the fourth quarter
of 2017. The decrease in R&D expenses resulted primarily from pipeline optimization, phase 3
studies that have ended and related headcount reduction.
Selling and Marketing (S&M) expenses in the fourth quarter of 2018 were $797 million, a decrease
of 3% compared to the fourth quarter of 2017. S&M expenses excluding amortization of purchased
intangible assets, equity compensation expenses and other expenses were $768 million, or 16.8% of
quarterly revenues in the fourth quarter of 2018, compared to $749 million, or 13.9% of quarterly
revenues in the fourth quarter of 2017. The increase was mainly due to higher promotional cost
associated with the launch of AJOVY in the U.S., partially offset by cost reduction and efficiency
measures as part of the restructuring plan.
General and Administrative (G&A) expenses in the fourth quarter of 2018 were $344 million, a
decrease of 2% compared to the fourth quarter of 2017. G&A expenses excluding equity
compensation expenses and other expenses were $330 million in the fourth quarter of 2018, or 7.2%
of quarterly revenues in the fourth quarter of 2018, compared to $335 million, or 6.2% of quarterly
revenues in the fourth quarter of 2017.
GAAP other loss in the fourth quarter of 2018 was $43 million, compared to other income of $1,099
million in the fourth quarter of 2017. Non-GAAP other income in the fourth quarter of 2018 was
$5 million, compared to $15 million in fourth quarter of 2017.
GAAP operating loss in the fourth quarter of 2018 was $3,164 million, compared to $13,017
million in the fourth quarter of 2017. Non-GAAP operating income in the fourth quarter of 2018
was $946 million, a decrease of 32% compared to the fourth quarter of 2017. Non-GAAP operating
margin was 20.8% in the fourth quarter of 2018 compared to 25.7% in the fourth quarter of 2017.
EBITDA (non-GAAP operating income, which excludes amortization and certain other items, as
well as depreciation expenses) was $1,091 million in the fourth quarter of 2018, a decrease of 29%
compared to $1,534 million in the fourth quarter of 2017.
GAAP financial expenses for the fourth quarter of 2018 were $223, compared to $191 million in
the fourth quarter of 2017. Non-GAAP financial expenses were $216 million in the fourth quarter
of 2018, compared to $209 million in the fourth quarter of 2017.
In the fourth quarter of 2018, we recognized a tax benefit of $139 million, or 4%, on pre-tax loss
of $3,387 million. In the fourth quarter of 2017, we recognized a tax benefit of $1,471 million, on

6 IR Contacts United States Kevin C. Mannix (215) 591-8912
Israel Ran Meir 972 (3) 9267516
PR Contacts United States Kelley Dougherty (973) 658-0237
Israel Yonatan Beker 972 (54) 888 5898
pre-tax loss of $13,208 million. Our tax rate for the fourth quarter of 2018 was mainly affected by
impairments recorded, some of which did not have a corresponding tax effect. Non-GAAP income
taxes for the fourth quarter of 2018 were $96 million, or 13%, on pre-tax non-GAAP income of
$730 million. Non-GAAP income taxes in the fourth quarter of 2017 were $183 million, or 16%,
on pre-tax non-GAAP income of $1,176 million.
GAAP net loss attributable to ordinary shareholders and GAAP diluted loss per share in the fourth
quarter of 2018 were $2,940 million and $2.85, respectively, compared to loss of $11,600 million
and $11.41 in the fourth quarter of 2017. Non-GAAP net income attributable to ordinary
shareholders and non-GAAP diluted EPS in the fourth quarter of 2018 were $543 million and
$0.53, respectively, compared to $949 million and $0.93 in the fourth quarter of 2017.
For the fourth quarter of 2018, the weighted average outstanding shares for the fully diluted EPS
calculation on a GAAP basis was 1,031 million shares, compared to 1,017 million shares in the
fourth quarter of 2017. The weighted average outstanding shares for the fully diluted EPS
calculation on a non-GAAP basis was 1,034 million shares, compared to 1,018 million shares in the
fourth quarter of 2017.
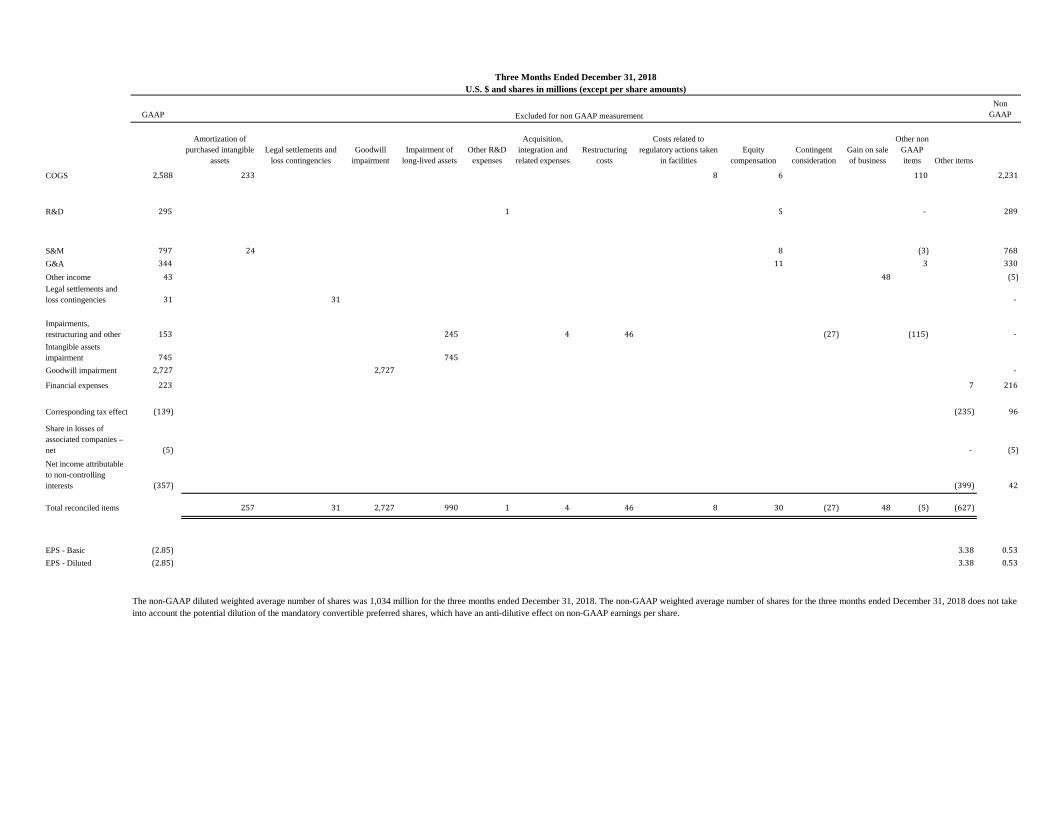
Non-GAAP information: Net non-GAAP adjustments in the fourth quarter of 2018 were $3,483
million. Non-GAAP net income and non-GAAP EPS for the fourth quarter were adjusted to exclude
the following items:
A goodwill impairment of $2,727 million, mainly related to International Markets;
An impairment of intangible and fixed assets and equity investment of $990 million mainly
related to the acquisition of Actavis Generics;
Amortization of purchased intangible assets totaling $257 million, of which $233 million is
included in cost of goods sold and the remaining $24 million in selling and marketing
expenses;
Restructuring expenses of $46 million;
Legal settlements and loss contingencies of $31 million;
Equity compensation expenses of $30 million;
Other non-GAAP items of $36 million;
Minority interest adjustment of $399 million related to business venture in the International
markets; and
Related tax effect of $235 million.
Teva believes that excluding such items facilitates investors' understanding of its business. See the
attached tables for a reconciliation of the GAAP results to the adjusted non-GAAP figures. Investors
should consider non-GAAP financial measures in addition to, and not as replacement for, or superior
to, measures of financial performance prepared in accordance with GAAP.
Cash flow generated from operations during the fourth quarter of 2018 was $367 million,
compared to $859 million in the fourth quarter of 2017. The decrease was mainly due to lower profit
in our North America segment.
7 IR Contacts United States Kevin C. Mannix (215) 591-8912
Israel Ran Meir 972 (3) 9267516
PR Contacts United States Kelley Dougherty (973) 658-0237
Israel Yonatan Beker 972 (54) 888 5898
Free cash flow (Cash flow generated from operating activities, net of cash used for capital
investments and beneficial interest collected in exchange for securitized trade receivables) was $522
million in the fourth quarter of 2018, compared to $934 million in the fourth quarter of 2017. The
increase in 2018 resulted mainly from the higher cash flow generated from operating activities.
Segment Results for the Fourth Quarter 2018
Due to the organizational changes announced in November 2017, we began reporting our financial
results under a new structure in the first quarter of 2018, consisting of the following segments:
a) North America segment, which includes the United States and Canada.
b) Europe segment, which includes the European Union and certain other European countries.
c) International Markets segment, which includes all countries other than those in our North
America and Europe segments.
In addition to these three segments, we have other activities, primarily the sale of API to third parties
and certain contract manufacturing services.
Segment profit is comprised of gross profit for the segment, less R&D, S&M, G&A expenses and
other income related to each segment. Segment profit does not include amortization and certain
other items.
The data presented in this press release for prior periods have been conformed to reflect our current
segment reporting, which commenced in the first quarter of 2018.
North America Segment
Our North America segment includes the United States and Canada.
The following table presents revenues, expenses and profit for our North America segment for the
three months ended December 31, 2018 and 2017:
Three months ended December 31,
2018 2017
(U.S.$ in millions / % of Segment Revenues)
Revenues ............ 2,238 100% 2,689 100.0%
Gross profit ........ 1,201 53.7% 1,506 56.0%
R&D expenses .... 185 8.3% 192 7.1%
S&M expenses .... 341 15.2% 285 10.6%
G&A expenses .... 127 5.7% 101 3.8%
Other income ...... (3) § (10) §
Segment profit .... 551 24.6% 938 34.9%
__________
§ Represents an amount less than 0.5%.
Revenues from our North America segment in the fourth quarter of 2018 were $2,238 million, a
decrease of $451 million, or 17%, compared to the fourth quarter of 2017, mainly due to a decline

8 IR Contacts United States Kevin C. Mannix (215) 591-8912
Israel Ran Meir 972 (3) 9267516
PR Contacts United States Kelley Dougherty (973) 658-0237
Israel Yonatan Beker 972 (54) 888 5898
in revenues of COPAXONE, our U.S. generics business, ProAir and QVAR® and the loss of
revenues from the sale of our women’s health business, partially offset by higher revenues from
AUSTEDO and Anda.
Revenues in the United States, our largest market, were $2,103 million in the fourth quarter of
2018, a decrease of $434 million, or 17%, compared to the fourth quarter of 2017.
Revenues by Major Products and Activities
The following table presents revenues for our North America segment by major products and
activities for the three months ended December 31, 2018 and 2017:
North America Three months ended
December 31,
Percentage
Change
2018 2017 2017-2018
(U.S.$ in millions)
Generic products ......................................................... $ 1,099 $ 1,224 (10%)
COPAXONE .............................................................. 356 641 (44%)
BENDEKA / TREANDA ............................................ 140 158 (11%)
ProAir ........................................................................ 45 102 (56%)
QVAR ....................................................................... 9 48 (81%)
AUSTEDO ................................................................. 68 17 314%
Anda ......................................................................... 363 289 26%
Generic products revenues in our North America segment in the fourth quarter of 2018 decreased
by 10% to $1,099 million, compared to the fourth quarter of 2017, mainly due to additional
competition to methylphenidate extended-release tablets (Concerta® authorized generic), portfolio
optimization primarily as part of the restructuring plan as well as market dynamics and price erosion
in our U.S. generics business, partially offset by new generic product launches.
In the fourth quarter of 2018, we led the U.S. generics market in total prescriptions and new
prescriptions, with approximately 504 million total prescriptions (based on trailing twelve months),
representing 13% of total U.S. generic prescriptions according to IQVIA data.
COPAXONE revenues in our North America segment in the fourth quarter of 2018 decreased by
44% to $356 million, of which $341 million were generated in the United States, compared to the
fourth quarter of 2017, mainly due to generic competition in the United States.
BENDEKA® and TREANDA® combined revenues in our North America segment in the fourth
quarter of 2018 decreased by 11% to $140 million, compared to the fourth quarter of 2017, mainly
due to lower volumes resulting from Eagle Pharmaceuticals' launch of a ready-to-dilute
bendamustine hydrochloride in June 2018, partially offset by higher pricing.
ProAir revenues in our North America segment in the fourth quarter of 2018 decreased by 56% to
$45 million, compared to the fourth quarter of 2017, mainly due to higher sales reserves recorded
in the fourth quarter of 2018 in anticipation of generic competition to the short-acting beta-agonist
class of drugs, including an approved generic version of Ventolin HFA. In the albuterol inhaler
category, approximately 40% of prescriptions are written as “generic albuterol,” which means that

9 IR Contacts United States Kevin C. Mannix (215) 591-8912
Israel Ran Meir 972 (3) 9267516
PR Contacts United States Kelley Dougherty (973) 658-0237
Israel Yonatan Beker 972 (54) 888 5898
the launch of any generic inhaler may cause patient migration to such generic products. We launched
our own ProAir authorized generic in the United States in January 2019.
QVAR revenues in our North America segment in the fourth quarter of 2018 decreased by 81% to
$9 million, compared to the fourth quarter of 2017. The decrease in sales was mainly due to lower
net pricing.
AUSTEDO revenues in our North America segment in the fourth quarter of 2018 were $68 million,
compared to $17 million in the fourth quarter of 2017.
Anda revenues in our North America segment in the fourth quarter of 2018 increased by 26% to
$363 million, compared to the fourth quarter of 2017.
North America Gross Profit
Gross profit from our North America segment in the fourth quarter of 2018 was $1,201 million, a
decrease of 20% compared to $1,506 million in the fourth quarter of 2017. The decrease was mainly
due to lower revenues from COPAXONE and generic products.
Gross profit margin for our North America segment in the fourth quarter of 2018 decreased to
53.7%, compared to 56.0% in the fourth quarter of 2017. This decrease was mainly due to lower
COPAXONE revenues.
North America Profit
Profit from our North America segment in the fourth quarter of 2018 was $551 million, a decrease
of 41% compared to $938 million in the fourth quarter of 2017. The decrease was mainly due to
lower revenues from COPAXONE and generic products as well as investment in the launch of
AJOVY.
Europe Segment
Our Europe segment includes the European Union and certain other European countries.
The following table presents revenues, expenses and profit for our Europe segment for the three
months ended December 31, 2018 and 2017:
Three months ended December 31,
2018 2017
(U.S.$ in millions / % of Segment Revenues)
Revenues ................ 1,204 100% 1,450 100%
Gross profit ............ 689 57.2% 758 52.3%
R&D expenses ........ 75 6.2% 78 5.4%
S&M expenses ........ 278 23.1% 284 19.6%
G&A expenses ........ 82 6.8% 96 6.6%
Other income .......... 1 § (1) §
Segment profit ........ 253 21.0% 301 20.8%
__________
§ Represents an amount less than 0.5%.

10 IR Contacts United States Kevin C. Mannix (215) 591-8912
Israel Ran Meir 972 (3) 9267516
PR Contacts United States Kelley Dougherty (973) 658-0237
Israel Yonatan Beker 972 (54) 888 5898
Revenues from our Europe segment in the fourth quarter of 2018 were $1,204 million, a decrease
of $246 million, or 17%, compared to the fourth quarter of 2017. In local currency terms, revenues
decreased by 14%, mainly due to the loss of revenues from the closure of our distribution business
in Hungary, the sale of our women’s health business and a decline in COPAXONE revenues,
partially offset by new generic product launches.
Revenues by Major Products and Activities
The following table presents revenues for our Europe segment by major products and activities for
the three months ended December 31, 2018 and 2017:
Europe Three months ended
December 31,
Percentage
Change
2018 2017 2017-2018
(U.S.$ in millions)
Generic products ............................................................................ $ 844 $ 928 (9%)
COPAXONE ................................................................................. 118 155 (24%)
Respiratory products ...................................................................... 90 110 (18%)
Generic products revenues in our Europe segment in the fourth quarter of 2018, including OTC
products, decreased by 9% to $844 million, compared to the fourth quarter of 2017. In local currency
terms, revenues decreased by 6%, mainly due to the loss of revenues from the termination of the
PGT joint venture and generic price reductions, partially offset by new generic product launches.
COPAXONE revenues in our Europe segment in the fourth quarter of 2018 decreased by 24% to
$118 million, compared to the fourth quarter of 2017. In local currency terms, revenues decreased
by 21%, mainly due to price reductions resulting from the entry of competing glatiramer acetate
products.
Respiratory products revenues in our Europe segment in the fourth quarter of 2018 decreased by
18% to $90 million, compared to the fourth quarter of 2017. In local currency terms, revenues
decreased by 15%, mainly due to lower sales in the United Kingdom.
Europe Gross Profit
Gross profit from our Europe segment in the fourth quarter of 2018 was $689 million, a decrease of
9% compared to $758 million in the fourth quarter of 2017. The decrease was mainly due to the loss
of revenues from the sale of our women’s health business and a decline in COPAXONE revenues.
Gross profit margin for our Europe segment in the fourth quarter of 2018 increased to 57.2%,
compared to 52.3% in the fourth quarter of 2017. This increase was mainly due to lower cost of
goods sold, primarily as a result of the termination of the PGT joint venture and the closure of our
distribution business in Hungary.
Europe Profit
Profit from our Europe segment in the fourth quarter of 2018 was $253 million, a decrease of 16%
compared to $301 million in the fourth quarter of 2017. The decrease was mainly due to lower

11 IR Contacts United States Kevin C. Mannix (215) 591-8912
Israel Ran Meir 972 (3) 9267516
PR Contacts United States Kelley Dougherty (973) 658-0237
Israel Yonatan Beker 972 (54) 888 5898
revenues, partially offset by cost reductions and efficiency measures as part of the restructuring
plan.
International Markets Segment
Our International Markets segment includes all countries other than those in our North America and
Europe segments. The key markets in this segment are Japan, Israel and Russia.
During the fourth quarter of 2017, we deconsolidated our subsidiaries in Venezuela from our
financial results. Consequently, results of operations of our subsidiaries in Venezuela are not
included in the fourth quarter of 2018.
The following table presents revenues, expenses and profit for our International Markets segment
for the three months ended December 31, 2018 and 2017:
Three months ended December 31,
2018 2017
(U.S.$ in millions / % of Segment Revenues)
Revenues ............ 740 100% 910 100%
Gross profit ........ 312 42.1% 390 42.9%
R&D expenses .... 26 3.5% 25 2.7%
S&M expenses .... 134 18.1% 169 18.6%
G&A expenses .... 38 5.1% 45 4.9%
Other income ...... - § (4) §
Segment profit .... 114 15.4% 155 17.0%
__________
§ Represents an amount less than 0.5%.
Revenues from our International Markets segment in the fourth quarter of 2018 were $740 million,
a decrease of $170 million, or 19%, compared to the fourth quarter of 2017. In local currency terms,
revenues decreased 13% compared to the fourth quarter of 2017, mainly due to lower sales in Russia
and Japan, the effect of the deconsolidation of our subsidiaries in Venezuela and the loss of revenues
from the sale of our women’s health business.
Revenues by Major Products and Activities
The following table presents revenues for our International Markets segment by major products and
activities for the three months ended December 31, 2018 and 2017:
Three months ended
December 31,
Percentage
Change
2018 2017 2017-2018
(U.S.$ in millions)
Generic products .................................................................. $ 499 $ 650 (23%)
COPAXONE ....................................................................... 20 26 (23%)
Distribution ......................................................................... 146 144 1%

12 IR Contacts United States Kevin C. Mannix (215) 591-8912
Israel Ran Meir 972 (3) 9267516
PR Contacts United States Kelley Dougherty (973) 658-0237
Israel Yonatan Beker 972 (54) 888 5898
Generic products revenues in our International Markets segment in the fourth quarter of 2018,
which include OTC products, decreased by 23% to $499 million, compared to the fourth quarter of
2017. In local currency terms, revenues decreased by 18%, mainly due to lower sales in Russia and
lower sales in Japan resulting from regulatory pricing reductions and generic competition to off-
patented products.
COPAXONE revenues in our International Markets segment in the fourth quarter of 2018
decreased by 23% to $20 million, compared to the fourth quarter of 2017. In local currency terms,
revenues decreased by 6%.
Distribution revenues in our International Markets segment in the fourth quarter of 2018 increased
by 1% to $146 million, compared to the fourth quarter of 2017. In local currency terms, revenues
increased by 6%.
International Markets Gross Profit
Gross profit from our International Markets segment in the fourth quarter of 2018 was $312 million,
a decrease of 20% compared to $390 million in the fourth quarter of 2017. Gross profit margin for
our International Markets segment in the fourth quarter of 2018 decreased to 42.1%, compared to
42.9% in the fourth quarter of 2017. The decrease was mainly due to lower gross profit resulting
from changes in the product mix in certain countries, mainly Russia and Japan.
International Markets Profit
Profit from our International Markets segment in the fourth quarter of 2018 was $114 million,
compared to $155 million in the fourth quarter of 2017. The decrease was mainly due to lower
revenues in Russia and Japan, partially offset by cost reductions and efficiency measures as part of
the restructuring plan.
Other Activities
We have other sources of revenues, primarily the sale of API to third parties and certain contract
manufacturing services. These other activities are not included in our North America, Europe or
International Markets segments.
Our revenues from other activities in the fourth quarter of 2018 increased by 8% to $377 million,
compared to the fourth quarter of 2017. In local currency terms, revenues increased by 9%.
API sales to third parties in the fourth quarter of 2018 were $209 million, an increase of 16%
compared to the fourth quarter of 2017. In local currency terms, revenues increased by 16%.

13 IR Contacts United States Kevin C. Mannix (215) 591-8912
Israel Ran Meir 972 (3) 9267516
PR Contacts United States Kelley Dougherty (973) 658-0237
Israel Yonatan Beker 972 (54) 888 5898
Outlook for 2019 Non-GAAP Results
2018 Actuals 2019 Outlook
Revenues $18.9 billion $17.0-17.4 billion
Non-GAAP Operating Income $4.7 billion $3.8 – 4.2 billion
EBITDA $5.3 billion $4.4-4.8 billion
Non-GAAP EPS $2.92 $2.20-2.50
Weighted average number of shares 1,024 million 1,096 million
Free cash flow $3.7 billion $1.6-2.0 billion

14 IR Contacts United States Kevin C. Mannix (215) 591-8912
Israel Ran Meir 972 (3) 9267516
PR Contacts United States Kelley Dougherty (973) 658-0237
Israel Yonatan Beker 972 (54) 888 5898
The outlook for 2019 non-GAAP results is based on the following key assumptions:
2018 Actuals 2019 Commentary
Global COPAXONE $2.4 billion Continued price erosion as a result of generic
competition; anticipated sales of ~$1.5 billion
ProAir HFA $397 million Significant erosion due to introduction of generic
Albuterol
AJOVY $3 million Continued ramp up of sales in the U.S. to ~$150 million
AUSTEDO $204 million Continued ramp up of sales in the U.S. to $350 million
North America
Generics
$4.1 billion Slight decline due to erosion and volume declines offset
by new launches
Europe Generics $3.6 billion Continued portfolio optimization and full year effect of
OTC JV dissolution
International
Generics
$2 billion Adverse impact in Japan due to NHI price revision and
LLP erosion
Foreign Exchange Negative impact of approximately $0.3 billion on sales,
and $0.1 billion on operating profit vs. 2018
Non-GAAP Other
Income
$0.2 billion Significant decline vs. 2018
Non-GAAP Tax
Rate
14% 16% vs. 2018 actual of 14%
CAPEX $0.6 billion At similar level as 2018
Some amounts in this press release may not add up due to rounding. All percentages have been calculated using
unrounded amounts.

15 IR Contacts United States Kevin C. Mannix (215) 591-8912
Israel Ran Meir 972 (3) 9267516
PR Contacts United States Kelley Dougherty (973) 658-0237
Israel Yonatan Beker 972 (54) 888 5898
Conference Call
Teva will host a conference call and live webcast along with a slide presentation on Wednesday,
February 13, 2019 at 8:00 a.m. ET to discuss its fourth quarter and annual 2018 results and overall
business environment. A question & answer session will follow.
United States 1-866-966-1396
International +44 (0) 2071 928000
Israel 1-809-203-624
For a list of other international toll-free numbers, click here.
passcode: 1174907
A live webcast of the call will also be available on Teva's website at: ir.tevapharm.com. Please log
in at least 10 minutes prior to the conference call in order to download the applicable software.
Following the conclusion of the call, a replay of the webcast will be available within 24 hours on
the Company's website by calling United States 1-866-331-1332; International +44 (0) 3333
009785; passcode: 1174907.
About Teva
Teva Pharmaceutical Industries Ltd. (NYSE and TASE: TEVA) is a global leader in generic medicines, with
innovative treatments in select areas, including CNS, pain and respiratory. We deliver high-quality generic
products and medicines in nearly every therapeutic area to address unmet patient needs. We have an
established presence in generics, specialty, OTC and API, building on more than a century-old legacy, with
a fully integrated R&D function, strong operational base and global infrastructure and scale. We strive to act
in a socially and environmentally responsible way. Headquartered in Israel, with production and research
facilities around the globe, we employ 42,500 professionals, committed to improving the lives of millions of
patients. Learn more at www.tevapharm.com.
Non-GAAP Financial Measures
This press release contains certain financial information that differs from what is reported under accounting principles
generally accepted in the United States ("GAAP"). These non-GAAP financial measures, including, but not limited to,
non-GAAP EPS, non-GAAP operating income, non-GAAP gross profit, non-GAAP gross profit margin, EBITDA, non-
GAAP financial expenses, non-GAAP income taxes, non-GAAP net income and non-GAAP diluted EPS are presented
in order to facilitates investors' understanding of our business. We utilize certain non-GAAP financial measures to
evaluate performance, in conjunction with other performance metrics. The following are examples of how we utilize
the non-GAAP measures: our management and board of directors use the non-GAAP measures to evaluate our
operational performance, to compare against work plans and budgets, and ultimately to evaluate the performance of
management; our annual budgets are prepared on a non-GAAP basis; and senior management’s annual compensation
is derived, in part, using these non-GAAP measures. See the attached tables for a reconciliation of the GAAP results to
the adjusted non-GAAP figures. Investors should consider non-GAAP financial measures in addition to, and not as
replacements for, or superior to, measures of financial performance prepared in accordance with GAAP. We are not
providing forward looking guidance for GAAP reported financial measures or a quantitative reconciliation of forward-
looking non-GAAP financial measures to the most directly comparable GAAP measure because we are unable to predict
with reasonable certainty the ultimate outcome of certain significant items without unreasonable effort.

16 IR Contacts United States Kevin C. Mannix (215) 591-8912
Israel Ran Meir 972 (3) 9267516
PR Contacts United States Kelley Dougherty (973) 658-0237
Israel Yonatan Beker 972 (54) 888 5898
Cautionary Note Regarding Forward-Looking Statements
This press release contains forward-looking statements within the meaning of the Private Securities Litigation Reform Act of 1995, which are based on management’s current beliefs and expectations and are subject to substantial risks and uncertainties, both known and unknown, that could cause our future results, performance or achievements to differ significantly from that expressed or implied by such forward-looking statements. Important factors that could cause or contribute to such differences include risks relating to:
• our ability to successfully compete in the marketplace, including: that we are substantially dependent on our
generic products; competition for our specialty products, especially COPAXONE®
, our leading medicine, which faces competition from existing and potential additional generic versions and orally-administered alternatives; the
uncertainty of commercial success of AJOVY®
or AUSTEDO®
; competition from companies with greater resources and capabilities; efforts of pharmaceutical companies to limit the use of generics, including through legislation and regulations; consolidation of our customer base and commercial alliances among our customers; the increase in the number of competitors targeting generic opportunities and seeking U.S. market exclusivity for generic versions of significant products; price erosion relating to our products, both from competing products and increased regulation; delays in launches of new products and our ability to achieve expected results from investments in our product pipeline; our ability to take advantage of high-value opportunities; the difficulty and expense of obtaining licenses to proprietary technologies; and the effectiveness of our patents and other measures to protect our intellectual property rights;
• our substantial indebtedness, which may limit our ability to incur additional indebtedness, engage in additional transactions or make new investments, may result in a further downgrade of our credit ratings; and our inability to raise debt or borrow funds in amounts or on terms that are favorable to us;
• our business and operations in general, including: failure to effectively execute our restructuring plan announced in December 2017; uncertainties related to, and failure to achieve, the potential benefits and success of our senior management team and organizational structure; harm to our pipeline of future products due to the ongoing review of our R&D programs; our ability to develop and commercialize additional pharmaceutical products; potential additional adverse consequences following our resolution with the U.S. government of our FCPA investigation; compliance with sanctions and other trade control laws; manufacturing or quality control problems, which may damage our reputation for quality production and require costly remediation; interruptions in our supply chain; disruptions of our or third party information technology systems or breaches of our data security; the failure to recruit or retain key personnel; variations in intellectual property laws that may adversely affect our ability to manufacture our products; challenges associated with conducting business globally, including adverse effects of political or economic instability, major hostilities or terrorism; significant sales to a limited number of customers in our U.S. market; our ability to successfully bid for suitable acquisition targets or licensing opportunities, or to consummate and integrate acquisitions; and our prospects and opportunities for growth if we sell assets ;
• compliance, regulatory and litigation matters, including: costs and delays resulting from the extensive governmental regulation to which we are subject; the effects of reforms in healthcare regulation and reductions in pharmaceutical pricing, reimbursement and coverage; increased legal and regulatory action in connection with public concern over the abuse of opioid medications in the U.S.; governmental investigations into selling and marketing practices; potential liability for patent infringement; product liability claims; increased government scrutiny of our patent settlement agreements; failure to comply with complex Medicare and Medicaid reporting and payment obligations; and environmental risks;
• other financial and economic risks, including: our exposure to currency fluctuations and restrictions as well as credit risks; potential impairments of our intangible assets; potential significant increases in tax liabilities; and the effect on our overall effective tax rate of the termination or expiration of governmental programs or tax benefits, or of a change in our business;
and other factors discussed in our Annual Report on Form 10-K for the year ended December 31, 2018, including the sections captioned "Risk Factors." Forward-looking statements speak only as of the date on which they are made, and we assume no obligation to update or revise any forward-looking statements or other information contained herein, whether as a result of new information, future events or otherwise. You are cautioned not to put undue reliance on these forward-looking statements.

Three months ended Year endedDecember 31, December 31,
2018 2017 2018 2017(Unaudited) (Unaudited) (Audited) (Audited)
Net revenues........................................................................................................................................................... 4,559 5,398 18,854 22,385 Cost of sales............................................................................................................................................................ 2,588 2,954 10,558 11,770
Gross profit............................................................................................................................................................ 1,971 2,444 8,296 10,615 Research and development expenses.................................................................................................................... 295 346 1,213 1,778 Selling and marketing expenses............................................................................................................................ 797 823 2,916 3,395 General and administrative expenses................................................................................................................... 344 350 1,298 1,451 Other asset impairments, restructuring and other items.................................................................................... 153 1,036 987 1,836 Intangible assets impairment................................................................................................................................ 745 2,829 1,991 3,238 Goodwill impairment............................................................................................................................................. 2,727 11,000 3,027 17,100 Legal settlements and loss contingencies............................................................................................................. 31 176 (1,208) 500 Other expense (income) ............................................................................................................ 43 (1,099) (291) (1,199)Operating loss........................................................................................................................................................ (3,164) (13,017) (1,637) (17,484)Financial expenses – net........................................................................................................................................ 223 191 959 895 Loss before income taxes....................................................................................................................................... (3,387) (13,208) (2,596) (18,379)Tax benefits............................................................................................................................................................ (139) (1,471) (195) (1,933)Share in losses (profit) of associated companies, net.......................................................................................... (5) (7) 71 3 Net loss ................................................................................................................................................................... (3,243) (11,730) (2,472) (16,449)Net income attributable to non-controlling interests.......................................................................................... (357) (195) (322) (184)Net loss attributable to Teva................................................................................................................................. (2,886) (11,535) (2,150) (16,265)Dividends on preferred shares.............................................................................................................................. 54 65 249 260 Net loss attributable to Teva's ordinary shareholders........................................................................................ (2,940) (11,600) (2,399) (16,525)
Earnings per share attributable to ordinary shareholders: Basic ($) (2.85) (11.41) (2.35) (16.26) Diluted ($) (2.85) (11.41) (2.35) (16.26) Weighted average number of shares (in millions): Basic 1,031 1,017 1,021 1,016 Diluted 1,031 1,017 1,021 1,016
Non-GAAP net income attributable to ordinary shareholders:* 543 949 2,985 4,075 Non-GAAP net income attributable to ordinary shareholders for diluted earnings per share: 543 949 2,985 4,075
Non-GAAP earnings per share attributable to ordinary shareholders:* Basic ($) 0.53 0.93 2.92 4.01 Diluted ($) 0.53 0.93 2.92 4.01
Non-GAAP average number of shares (in millions): Basic 1,031 1,017 1,021 1,016 Diluted 1,034 1,018 1,024 1,018
* See reconciliation attached.
Consolidated Statements of Income (U.S. dollars in millions, except share and per share data)

December 31, December 31,2018 2017
ASSETSCurrent assets:Cash and cash equivalents............................................................. 1,782 963 Trade receivables........................................................................... 5,822 7,128 Inventories..................................................................................... 4,731 4,924 Prepaid expenses........................................................................... 899 1,100 Other current assets....................................................................... 468 701 Assets held for sale........................................................................ 92 566 Total current assets..................................................................... 13,794 15,382 Deferred income taxes................................................................. 368 574 Other non-current assets............................................................. 731 932 Property, plant and equipment, net........................................... 6,868 7,673 Identifiable intangible assets, net............................................... 14,005 17,640 Goodwill........................................................................................ 24,917 28,414 Total assets................................................................................... 60,683 70,615
LIABILITIES & EQUITYCurrent liabilities:Short-term debt.............................................................................. 2,216 3,646 Sales reserves and allowances....................................................... 6,711 7,881 Trade payables............................................................................... 1,853 2,069 Employee-related obligations........................................................ 870 549 Accrued expenses.......................................................................... 1,868 3,014 Other current liabilities.................................................................. 804 724 Liabilities held for sale.................................................................. - 38 Total current liabilities................................................................ 14,322 17,921
Long-term liabilities:Deferred income taxes................................................................... 2,140 3,277 Other taxes and long-term liabilities.............................................. 1,727 1,843 Senior notes and loans................................................................... 26,700 28,829 Total long-term liabilities............................................................ 30,567 33,949 Equity:Teva shareholders’ equity 14,707 17,359 Non-controlling interests............................................................... 1,087 1,386 Total equity.................................................................................. 15,794 18,745 Total liabilities and equity........................................................... 60,683 70,615
Condensed Consolidated Balance Sheets (U.S. dollars in millions)
(Audited)

Three months ended Year endedDecember 31, December 31,
2018 2017 2018 2017Unaudited Unaudited Unaudited Unaudited
Operating activities:Net income (loss) (3,243) (11,730) (2,472) (16,449) Net change in operating assets and liabilities (302) 72 (1,823) (1,645) Items not involving cash flow 3,912 12,517 6,741 20,319
Net cash provided by operating activities 367 859 2,446 2,225
Net cash provided by investing activities 74 1,912 1,866 3,446
Net cash used in financing activities (499) (2,506) (3,351) (5,750)
Translation adjustment on cash and cash equivalents (35) 18 (142) 54
Net change in cash and cash equivalents (93) 283 819 (25)
Balance of cash and cash equivalents at beginning of period 1,875 680 963 988
Balance of cash and cash equivalents at end of period 1,782 963 1,782 963
Condensed Consolidated Cash Flow (U.S. Dollars in millions)
GAAPNon
GAAP
Amortization of purchased intangible
assetsLegal settlements and
loss contingenciesGoodwill
impairmentImpairment of
long-lived assetsOther R&D
expenses
Acquisition, integration and
related expensesRestructuring
costs
Costs related to regulatory actions taken
in facilitiesEquity
compensationContingent
considerationGain on sale of business
Other non GAAP items Other items
COGS 2,588 233 8 6 110 2,231
R&D 295 1 5 - 289
S&M 797 24 8 (3) 768 G&A 344 11 3 330 Other income 43 48 (5)Legal settlements and loss contingencies 31 31 -
Impairments, restructuring and other 153 245 4 46 (27) (115) - Intangible assets impairment 745 745 Goodwill impairment 2,727 2,727 -
Financial expenses 223 7 216
Corresponding tax effect (139) (235) 96
Share in losses of associated companies – net (5) - (5)
Net income attributable to non-controlling interests (357) (399) 42
Total reconciled items 257 31 2,727 990 1 4 46 8 30 (27) 48 (5) (627)
EPS - Basic (2.85) 3.38 0.53 EPS - Diluted (2.85) 3.38 0.53
Three Months Ended December 31, 2018U.S. $ and shares in millions (except per share amounts)
Excluded for non GAAP measurement
The non-GAAP diluted weighted average number of shares was 1,034 million for the three months ended December 31, 2018. The non-GAAP weighted average number of shares for the three months ended December 31, 2018 does not take into account the potential dilution of the mandatory convertible preferred shares, which have an anti-dilutive effect on non-GAAP earnings per share.

GAAPNon
GAAP
Amortization of purchased intangible
assetsLegal settlements and
loss contingenciesGoodwill
impairmentImpairment of
long-lived assetsOther R&D
expenses
Acquisition, integration and
related expensesRestructuring
costs
Costs related to regulatory actions taken
in facilitiesEquity
compensationContingent
considerationOther non
GAAP itemsOther items
COGS 2,954 291 (1) 5 10 2,649
R&D 346 45 5 1 295
S&M 823 65 9 - 749
G&A 350 8 7 335
Other income (1,099) (1,084) (15)Legal settlements and loss contingencies 176 176 - Impairments, restructuring and other 946 299 18 235 (25) 419 - Intangible assets impairment 2,919 2,919 -
Goodwill impairment 11,000 11,000 -
Financial expenses 191 (18) 209
Corresponding tax effect (1,471) (1,654) 183 Share in losses of associated companies – net (7) 45 (52)Net income attributable to non-controlling interests (195) (226) 31
Total reconciled items 356 176 11,000 3,218 45 18 235 (1) 27 (25) (647) (1,853)
EPS - Basic (11.41) 12.34 0.93
EPS - Diluted (11.41) 12.34 0.93
Three Months Ended December 31, 2017U.S. $ and shares in millions (except per share amounts)
Excluded for non GAAP measurement
The non-GAAP diluted weighted average number of shares was 1,018 million for the three months ended December 31, 2017. The non-GAAP weighted average number of shares for the three months ended December 31, 2017 does not take into account the potential dilution of the mandatory convertible preferred shares, which have an anti-dilutive effect on non-GAAP earnings per share.

GAAPNon
GAAP
Amortization of purchased intangible
assets Goodwill impairment
Legal settlements and loss
contingenciesImpairment of
long-lived assetsOther R&D
expenses
Acquisition, integration and
related expensesRestructuring
costs
Costs related to regulatory actions taken
in facilitiesEquity
compensationContingent
considerationGain on sale of business
Other non GAAP items Other items
COGS 10,558 1,004 14 28 204 9,308 R&D 1,213 83 26 2 1,102 S&M 2,916 162 43 (7) 2,718 G&A 1,298 55 15 1,228 Other income (291) (66) (225)Legal settlements and loss contingencies (1,208) (1,208) - Impairments, restructuring and other 987 500 13 488 57 (71) - Intangible assets impairment 1,991 1,991 - Goodwill impairment 3,027 3,027 -
Financial expenses 959 66 893 Corresponding tax effect (195) (714) 519
Share in losses of associated companies – net 71 103 (32)
Net income attributable to non-controlling interests (322) (431) 109 Total reconciled items 1,166 3,027 (1,208) 2,491 83 13 488 14 152 57 (66) 143 (976)
EPS - Basic (2.35) 5.27 2.92
EPS - Diluted (2.35) 5.27 2.92
Year Ended December 31, 2018(U.S. $ and shares in millions, except per share amounts)
Excluded for non GAAP measurement
The non-GAAP diluted weighted average number of shares was 1,024 million for the year ended December 31, 2018. The non-GAAP weighted average number of shares for the year ended December 31, 2018 does not take into account the potential dilution of the mandatory convertible preferred shares, which have an anti-dilutive effect on non-GAAP earnings per share.

GAAP Non GAAP
Amortization of purchased intangible
assets Goodwill impairment
Legal settlements and loss
contingenciesImpairment of long-
lived assetsOther R&D
expenses Inventory step-up
Acquisition, integration and
related expenses Restructuring costs
Costs related to regulatory actions taken in facilities
Equity compensation
Contingent consideration
Other non GAAP items Other items
COGS 11,770 1,235 67 47 23 47 10,351
R&D 1,778 221 22 20 1,515
S&M 3,395 209 38 (1) 3,149
G&A 1,451 46 (8) 1,413
Other income (1,199) (1,083) (116)
Legal settlements and loss contingencies 500 500 -
Impairments, restructuring and other 1,836 544 105 535 154 498 -
Intangible assets impairment 3,238 3,238 -
Goodwill impairment 17,100 17,100 -
Financial expenses 895 (13) 908
Corresponding tax effect (1,933) (2,721) 788
Share in losses of associated companies – net 3 47 (44)
Net income attributable to non-controlling interests (184) (270) 86
Total reconciled items 1,444 17,100 500 3,782 221 67 105 535 47 129 154 (527) (2,957)
EPS - Basic (16.26) 20.27 4.01
EPS - Diluted (16.26) 20.27 4.01
Year ended December 31, 2017(U.S. $ and shares in millions, except per share amounts)
Excluded for non GAAP measurement
The non-GAAP diluted weighted average number of shares was 1,018 million for the year ended December 31, 2017. The non-GAAP weighted average number of shares for the year ended December 31, 2017 does not take into account the potential dilution of the mandatory convertible preferred shares (amounting to 59 million weighted average shares), which have an anti-dilutive effect on non-GAAP earnings per share.

Revenues........................... $ 2,238 $ 2,689 $ 1,204 $ 1,450 $ 740 $ 910 Gross profit........................ 1,201 1,506 689 758 312 390 R&D expenses................... 185 192 75 78 26 25 S&M expenses................... 341 285 278 284 134 169 G&A expenses................... 127 101 82 96 38 45 Other income (loss)........... (3) (10) 1 (1) - (4) Segment profit.................. $ 551 $ 938 $ 253 $ 301 $ 114 $ 155
Segment Information
North America Europe International MarketsThree months ended December
31,Three months ended December
31,Three months ended December
31,2017
(U.S. $ in millions) (U.S. $ in millions) (U.S. $ in millions)
2018 2017 2018 2017 2018

Revenues........................... $ 9,297 $ 12,141 $ 5,186 $ 5,466 $ 3,005 $ 3,395 Gross profit........................ 4,979 7,322 2,884 2,887 1,254 1,433 R&D expenses................... 713 969 283 390 96 154 S&M expenses................... 1,154 1,288 1,003 1,130 518 672 G&A expenses................... 484 533 325 354 153 189 Other income.................... (209) (92) - (16) (11) (8) Segment profit.................. $ 2,837 $ 4,624 $ 1,273 $ 1,029 $ 498 $ 426
Segment Information
North America Europe International MarketsYear ended December 31, Year ended December 31, Year ended December 31,
2017
(U.S. $ in millions) (U.S. $ in millions) (U.S. $ in millions)
2018 2017 2018 2017 2018

North America profit................................................................................... $ 551 $ 938 Europe profit............................................................................................... 253 301 International Markets profit....................................................................... 114 155 Total segment profit................................................................................... 918 1,394 Profit (loss) of other activities..................................................................... 28 (9)
946 1,385 Amounts not allocated to segments: Amortization 257 356
Other asset impairments, restructuring and other items 153 1,036 Goodwill impairment 2,727 11,000 Intangible asset impairments 745 2,829
Loss from divestitures, net of divestitures related costs 48 (1,083) Other R&D expenses 1 45 Costs related to regulatory actions taken in facilities 8 (1) Legal settlements and loss contingencies 31 176 Other unallocated amounts 140 44 Consolidated operating income (3,164) (13,017)Financial expenses - net 223 191 Consolidated income (loss) before income taxes $ (3,387) $ (13,208)
(U.S.$ in millions)
Reconciliation of our segment profitto consolidated income before income taxes
Three months endedDecember 31,
2018 2017

North America profit................................................................................... $ 2,837 $ 4,624 Europe profit............................................................................................... 1,273 1,029 International Markets profit....................................................................... 498 426 Total segment profit................................................................................... 4,608 6,079 Profit of other activities.............................................................................. 115 (6)
4,723 6,073 Amounts not allocated to segments: Amortization 1,166 1,444 Other asset impairments, restructuring and other items 987 1,836 Goodwill impairment 3,027 17,100 Intangible asset impairments 1,991 3,238 Gain on divestitures, net of divestitures related costs (66) (1,083) Inventory step-up - 67 Other R&D expenses 83 221 Costs related to regulatory actions taken in facilities 14 47 Legal settlements and loss contingencies (1,208) 500 Other unallocated amounts 366 187
Consolidated operating income (loss) (1,637) (17,484)Financial expenses - net 959 895 Consolidated income (loss) before income taxes $ (2,596) $ (18,379)
(U.S.$ in millions)
Reconciliation of our segment profitto consolidated income before income taxes
Year endedDecember 31,
2018 2017

Percentage Change
2017-2018
North America segmentGenerics medicines......................................... $ 1,099 $ 1,224 (10%)COPAXONE...................................................... 356 641 (44%)Bendeka and Trenda....................................... 140 158 (11%)ProAir.............................................................. 45 102 (56%)QVAR............................................................... 9 48 (81%)AUSTEDO........................................................ 68 17 314%ANDA .............................................................. 363 289 26%
Percentage Change
2017-2018
Europe segmentGeneric medicines.......................................... $ 844 $ 928 (9%)COPAXONE...................................................... 118 155 (24%)Respiratory products...................................... 90 110 (18%)
Percentage Change
2017-2018
International Markets segmentGenerics medicines......................................... $ 499 $ 650 (23%)COPAXONE...................................................... 20 26 (23%)Distribution .................................................... 146 144 1%
Revenues by Activity and Geographical Area(Unaudited)
Three months ended
December 31,2018 2017
(U.S.$ in millions)
Three months ended
December 31,2018 2017
(U.S.$ in millions)
(U.S.$ in millions)
Three months ended
December 31,2018 2017

Percentage Change
2017-2018
North America segmentGenerics medicines.......................................... $ 4,056 5,203 (22%)COPAXONE....................................................... 1,759 3,116 (44%)Bendeka and Trenda........................................ 642 656 (2%)ProAir............................................................... 397 501 (21%)QVAR................................................................ 182 313 (42%)AUSTEDO.......................................................... 204 24 750%ANDA ............................................................... 1,347 1,153 17%
Percentage Change
2017-2018
Europe segmentGeneric medicines........................................... $ 3,593 $ 3,471 4%COPAXONE....................................................... 535 595 (10%)Respiratory products....................................... 402 368 9%
Percentage Change
2017-2018
International Markets segmentGenerics medicines.......................................... $ 2,022 $ 2,370 (15%)COPAXONE....................................................... 72 91 (21%)Distribution ..................................................... 602 550 9%
Revenues by Activity and Geographical Area(Unaudited)
Year ended
December 31,2018 2017
(U.S.$ in millions)
Year ended
December 31,2018 2017
(U.S.$ in millions)
(U.S.$ in millions)
Year ended
December 31,2018 2017
Related Documents