University of New Mexico UNM Digital Repository Civil Engineering ETDs Engineering ETDs Fall 12-16-2017 Moving Bed Biofilm Reactors: Evaluation of Geometry, Aachment Surface Material and Biofilm Populations on the Uptake of Ammonia and Synthetic Organic Contaminants In Wastewater. Patrick D. McLee Follow this and additional works at: hps://digitalrepository.unm.edu/ce_etds Part of the Environmental Engineering Commons is Dissertation is brought to you for free and open access by the Engineering ETDs at UNM Digital Repository. It has been accepted for inclusion in Civil Engineering ETDs by an authorized administrator of UNM Digital Repository. For more information, please contact [email protected]. Recommended Citation McLee, Patrick D.. "Moving Bed Biofilm Reactors: Evaluation of Geometry, Aachment Surface Material and Biofilm Populations on the Uptake of Ammonia and Synthetic Organic Contaminants In Wastewater.." (2017). hps://digitalrepository.unm.edu/ce_etds/ 168

Welcome message from author
This document is posted to help you gain knowledge. Please leave a comment to let me know what you think about it! Share it to your friends and learn new things together.
Transcript

University of New MexicoUNM Digital Repository
Civil Engineering ETDs Engineering ETDs
Fall 12-16-2017
Moving Bed Biofilm Reactors: Evaluation ofGeometry, Attachment Surface Material andBiofilm Populations on the Uptake of Ammoniaand Synthetic Organic Contaminants InWastewater.Patrick D. McLee
Follow this and additional works at: https://digitalrepository.unm.edu/ce_etds
Part of the Environmental Engineering Commons
This Dissertation is brought to you for free and open access by the Engineering ETDs at UNM Digital Repository. It has been accepted for inclusion inCivil Engineering ETDs by an authorized administrator of UNM Digital Repository. For more information, please contact [email protected].
Recommended CitationMcLee, Patrick D.. "Moving Bed Biofilm Reactors: Evaluation of Geometry, Attachment Surface Material and Biofilm Populations onthe Uptake of Ammonia and Synthetic Organic Contaminants In Wastewater.." (2017). https://digitalrepository.unm.edu/ce_etds/168
i
Patrick McLee Candidate Civil Engineering Department This dissertation is approved, and it is acceptable in quality and form for publication: Approved by the Dissertation Committee: Andrew Schuler, Chairperson Kerry Howe Bruce Thomson Carlo Santoro

ii
Moving Bed Biofilm Reactors: Evaluation of Geometry, Attachment Surface
Material and Biofilm Populations on the Uptake of Ammonia and Synthetic Organic
Contaminants In Wastewater.
By
Patrick McLee
B.S., Environmental Engineering, Manhattan College, 2011
M.E., Environmental Engineering, Manhattan College, 2013
DISSERTATION
Submitted in Partial Fulfillment of the
Requirements for the Degree of
Doctor of Philosophy
Engineering
The University of New Mexico
Albuquerque, New Mexico
May 2017

iii
Acknowledgements
I would like to give special thanks to Dr. Andrew Schuler for facilitating my
graduate school experience as a Lobo. His optimism, academic guidance, and willingness
to share knowledge are invaluable to my positive growth as an individual.
I am also very grateful for the rest of my committee for their support and
scientific passion that provided much of the inspiration towards this work. Equally, I
would like that thank my friends, family, and dog for their patience and emotional
support on this journey.
Finally, I would like to thank the National Science Foundation for providing
funding to my research at the University of New Mexico.

iv
Moving Bed Biofilm Reactors: Evaluation of Geometry, Attachment Surface Material and Biofilm Populations on the Uptake of Ammonia and Synthetic Organic
Contaminants In Wastewater.
By Patrick McLee
B.S., Environmental Engineering, Manhattan College, 2011 M.E., Environmental Engineering, Manhattan College, 2013 Ph.D., Civil Engineering, University of New Mexico, 2017
Abstract
Plastic biofilm carriers are used in biological wastewater treatment to encourage
the attachment and retention of microorganisms that metabolize pollutants. The following
research was conducted to better understand how different characteristics of the biofilm
carrier affect the treatment performance of the attached biofilms in moving bed
bioreactors. Lab scale reactors were used in this study to grow nitrifying biofilms in
reactors with contrasting and controlled conditions. The effect of surface geometry on
nitrification performance was evaluated by testing commercially available moving bed
bioreactor media that contrast in physical design, and by varying operational parameters.
Additionally, mature biofilm from a similar attachment media type were tested under
nitrification-inhibited conditions to better understand microbial populations and
metabolisms associated with organic microconstituent removal. Finally, the influence of
surface chemistry on biofilm attachment and performance was tested by facilitating
biofilm growth on freely floating nylon and high-density polyethylene. Results indicate
that organisms grown on more protected, sheltered carrier media respond to changes in
mixing more rapidly than those on open and exposed media design. Geometry of the
carrier media in a well mixed freely floating reactor influences the environment of the
biofilm as it determines the fluid dynamics experienced by the microorganisms. In

v
biofilm systems designed to remove organic microconstituents, the occurrence of
nitrification appears to have benefits for the removal of several different compounds. The
type of plastic used to attach biofilms may also influence the total quantity or relative
abundance of bacteria types and the performance of microconstituent removal.
vi
Table Of Contents Chapter 1 Introduction .................................................................................................... 1
Introduction ..................................................................................................................... 1 Objectives ....................................................................................................................... 2 Hypothesis....................................................................................................................... 2
Chapter 2 The Effect of Geometric Design and Temperature on Moving Bed Bioreactor Media Performance and Resulting Biofilm Populations ............................ 4
Introduction ..................................................................................................................... 4 Background ..................................................................................................................... 4
Nitrification ................................................................................................................. 4 Ammonia Inhibition .................................................................................................... 5 Biofilm Mass Transfer ................................................................................................ 7
Hypothesis....................................................................................................................... 7 Objectives ....................................................................................................................... 8 Methods........................................................................................................................... 9
Reactor Operation ....................................................................................................... 9 Reactor Feed ............................................................................................................. 12 Mixing ....................................................................................................................... 13 Startup and Routine Operation of Continuous System ............................................. 17 Batch Testing ............................................................................................................ 18 Biomass ..................................................................................................................... 19 Nitrogen Species ....................................................................................................... 19 pH Control ................................................................................................................ 20 Dissolved Oxygen ..................................................................................................... 20 Illumina Next Gen DNA Sequencing ....................................................................... 21
Results and Discussion ................................................................................................. 21 Phase 1 Reactor Performance ................................................................................... 24 Phase 1 Microbial Biomass and Populations ............................................................ 26 Phase 2 Reactor Performance ................................................................................... 29 Phase 2 Microbial Biomass and Populations ............................................................ 30 Phase 3 Reactor Performance ................................................................................... 32 Phase 3 Microbial Biomass and Populations ............................................................ 34 Batch Testing ............................................................................................................ 35
Conclusions ................................................................................................................... 39 Chapter 3: An Assessment of Moving Bed Bioreactors and the Importance of Nitrification on the Removal of Trace Organics. ......................................................... 41
Introduction ................................................................................................................... 41 Background ................................................................................................................... 41
Trace organics ........................................................................................................... 42 Cometabolism of Trace Organics ............................................................................. 43 Conjugation ............................................................................................................... 44
Hypothesis..................................................................................................................... 45 Objectives ..................................................................................................................... 45 Methods......................................................................................................................... 46
Reactor Feed ............................................................................................................. 48 Reactor Mixing ......................................................................................................... 49

vii
Batch Testing ............................................................................................................ 50 Solid Phase Extraction .............................................................................................. 50 Biomass measurement .............................................................................................. 51 Nitrogen .................................................................................................................... 52 pH Control ................................................................................................................ 52 Dissolved Oxygen ..................................................................................................... 53 Illumina Next Gen DNA Sequencing ....................................................................... 53 Liquid Chromatography Mass Spectrometer (LC-MS) Analysis ............................. 53 Ultra-High Performance Liquid Chromatography Mass Spectrometer Analysis (UHPLC-MS/MS) ..................................................................................................... 55
Results and Discussion ................................................................................................. 56 Reactor Performance ................................................................................................. 57 Influent Characteristics ............................................................................................. 59 Microbial Populations ............................................................................................... 61 Batch Testing AMO Inhibition ................................................................................. 62 Trace Organics Removal ........................................................................................... 65
Conclusions ................................................................................................................... 70 Chapter 4: A Comparison of Nylon and High Density Polyethylene Plastic Biofilm Carriers In Moving Bed Bioreactors. ............................................................................ 72
Introduction ................................................................................................................... 72 Background ................................................................................................................... 72
Nitrification ............................................................................................................... 72 Trace organics ........................................................................................................... 73 Surface Chemistry ..................................................................................................... 74
Hypothesis..................................................................................................................... 75 Objectives ..................................................................................................................... 75 Methods......................................................................................................................... 75
Reactor Design .......................................................................................................... 75 Reactor Feed ............................................................................................................. 78 Reactor Mixing ......................................................................................................... 79 Batch Testing ............................................................................................................ 80 Nitrogen .................................................................................................................... 81 pH Control ................................................................................................................ 82 Illumina DNA Sequencing ........................................................................................ 83 Trace organics ........................................................................................................... 83 Solid Phase Extraction .............................................................................................. 84
Results and Discussion ................................................................................................. 85 Startup and Operations, Experiment 1 ...................................................................... 85 Biofilm Microbial Populations ................................................................................. 86 Startup and Operations, Experiment 2 ...................................................................... 88 Triclosan and Caffeine Batch Tests .......................................................................... 89
Conclusions ................................................................................................................... 94 Chapter 5 Conclusions .................................................................................................... 95 Chapter 6 References ...................................................................................................... 97 Appendix ........................................................................................................................ 102
Appendix A: Chapter 2 Data ....................................................................................... 102

viii
Figure 2.5 ................................................................................................................ 102 Figure 2.6 ................................................................................................................ 112 Figure 2.7 ................................................................................................................ 122 Figure 2.8 ................................................................................................................ 123 Figure 2.9 ................................................................................................................ 124 Figure 2.10 .............................................................................................................. 124 Figure 2.11 .............................................................................................................. 124 Figure 2.12 .............................................................................................................. 125
Appendix B: Chapter 3 Data ....................................................................................... 126 Table 3.2 ................................................................................................................. 126 Table 3.3 ................................................................................................................. 128 Table 3.4 ................................................................................................................. 128 Table 3.5 ................................................................................................................. 129 Table 3.6 ................................................................................................................. 130 Table 3.7 ................................................................................................................. 130 Figure 3.2 ................................................................................................................ 131 Figure 3.3 ................................................................................................................ 135 Figure 3.4 ................................................................................................................ 139 Figure 3.5 ................................................................................................................ 140 Figure 3.6 ................................................................................................................ 140 Figure 3.7 - 3.8 ........................................................................................................ 141 Figure 3.9 - 3.10 ...................................................................................................... 142 Figure 3.11 .............................................................................................................. 143
Appendix C: Chapter 4 Data ....................................................................................... 144 Figure 4.2 ................................................................................................................ 144 Figure 4.3 ................................................................................................................ 145 Figure 4.4 ................................................................................................................ 146 Triclosan Calibration .............................................................................................. 147 Caffeine Calibration ................................................................................................ 147 Figure 4.5 ................................................................................................................ 148 Figure 4.6 ................................................................................................................ 148 Figure 4.7 ................................................................................................................ 149 Figure 4.8 ................................................................................................................ 149

1
Chapter 1 Introduction
Introduction
Excess nutrients discharged into natural water systems by human activity are of
global concern, in part because they result in eutrophication of receiving waters
(Vitousek et al., 1997). To reduce the potential for eutrophication, nitrogen in
wastewater commonly removed by a combination of nitrification (ammonia oxidation)
and denitrification (nitrite and nitrate reduction to nitrogen gas) during wastewater
treatment before it is discharged back into the environment.
In conventional activated sludge (CAS) wastewater treatment, nitrifying
(commonly autotrophic) and ordinary heterotrophic bacteria grow in planktonic
agglomeration (flocs). Treatment performance is affected by the average amount of time
that the mixed liquor is in the system, a parameter known as solids retention time (SRT).
Because nitrifiers are generally slow growing, that can require higher SRTs than non-
nitrifying systems, which can increase requirements for aeration and loading to
secondary clarifiers. Moving bed biofilm reactors (MBBR) and integrated fixed film
activated sludge (IFAS) systems include biofilms grown on plastic media, either in
separate reactors (MBBRs), or by adding plastic media to activated sludge systems
(IFAS). A primary driver for these systems is that they have been shown to be highly
effective at increasing nitrification rates (Hem et al., 1994, Randall et al., 1996), as the
long SRTs inherent in biofilms is conducive to nitrifier growth (Siripong et al., 2007).

2
Increasing SRT in CAS is well known for improving nitrification and has been
suggested to improve the removal of synthetic organic trace organics as well (Nakada et
al., 2006). For this reason, MBBR and IFAS treatment may be a low cost method of
upgrading treatment plants to achieve better nitrification.
Objectives
1) The first objective of this study was to evaluate the effect of mixing on
nitrification fluxes using two contrasting commercial available media geometry (R1 and
R2) and the effect of mass transfer resulting from a closed media (R2) vs. an open media
(R1).
2) The second objective of this study was to evaluate differences in removal of
targeted trace organics in moving bed bioreactors with and without inhibition of
nitrification.
3) The third objective was to compare two different MBBR plastic materials for
nitrification performance, organic microconstituent removal performance, and determine
the effects of plastic type on biofilm quantity.
Hypothesis
The first hypothesis is that the performance of floating media that support
biofilms in MBBR and IFAS systems may be enhanced by geometric design. The
internal fluid dynamics of different commercially available floating media may be
influenced by contrasting designs of channel dimensions and sidewalls. Internal fluid

3
flow may affect mass transfer from the bulk liquid to the biofilm by influencing
boundary layer thickness and therefor reaction rates. Internal fluid velocity may also
affect biofilm sloughing due to mixing induced shear. For these reasons, the physical
characteristics of MBBR plastic media may determine the influence that mixing
intensity, dissolved oxygen (DO) and temperature have on nitrification performance,
biofilm thickness, biofilm community structure, and chemical inhibition.
The second hypothesis is that nitrification can increase the removal rates of trace
organics other than the estrogens that have been previously suggested to be removed by
nitrification in activated sludge. Analyzing a broad array of trace organics in mixed
heterotrophic/nitrifying and purely heterotrophic systems will gives us a better
understanding of the benefits to nitrification in the removal of all other synthetic organic
contaminants found in wastewater.
The last hypothesis for this study is that nutrient and trace organics removal from
wastewater can be improved by altering the chemistry of the biofilm attachment
surfaces. Surface chemistry of plastic biofilm carriers used in IFAS and MBBR systems
determines adhesion, attachment strength, and detachment of microbial populations that
effect system functionality. Attachment surface chemistry may be exploited to engineer
biofilms for the removal of synthetic organic contaminants through biodegradation
and/or adsorption.

4
Chapter 2 The Effect of Geometric Design and Temperature on
Moving Bed Bioreactor Media Performance and Resulting Biofilm
Populations
Introduction
The research described in this chapter evaluated the effect of mixing,
temperature and dissolved oxygen on nitrification fluxes. Two different commercially
available media with contrasting geometries were used in lab scale reactors to grow
nitrifying biofilms and evaluate how these variables affect nitrification performance and
attached microbial populations.
Background
Nitrification
Nitrification is a 2 step biological process shown in equations 2.1 and 2.2.
2𝑁𝐻!! + 3𝑂! → 2𝑁𝑂! + 4𝐻! + 2𝐻!𝑂 (2.1)
2𝑁𝑂!! + 𝑂! → 2𝑁𝑂!! (2.2)
The first step is the oxidation of ammonia to nitrite by the ammonia oxidizing
bacteria (AOB) such as Nitrosomonas under aerobic conditions (Kowalchuk et al., 2001)
The second step of nitrification is the aerobic oxidation of nitrite to nitrate by nitrite
oxidizing bacteria (NOB), including the genus Nitrobacter (Kowalchuk et al., 2001).
AOB and NOB obtain energy from by coupling oxygen reduction with ammonia and
nitrite oxidation, respectively. Autotrophic nitrifiers use this energy to convert CO2 to
cellular carbon (Metcalf and Eddy 2003). Recently, several other groups of bacteria,
5
such as xanthamondacia, springamonadacia, pseudomonas stutzeri yzn-001, and
Alcaligenes faecalis have been reported to oxidize ammonia by an unknown
heterotrophic pathway (Fitzgerald et al., 2015, Jo et al., 2005, Zhang et al., 2011) to
nitrite and nitrate.
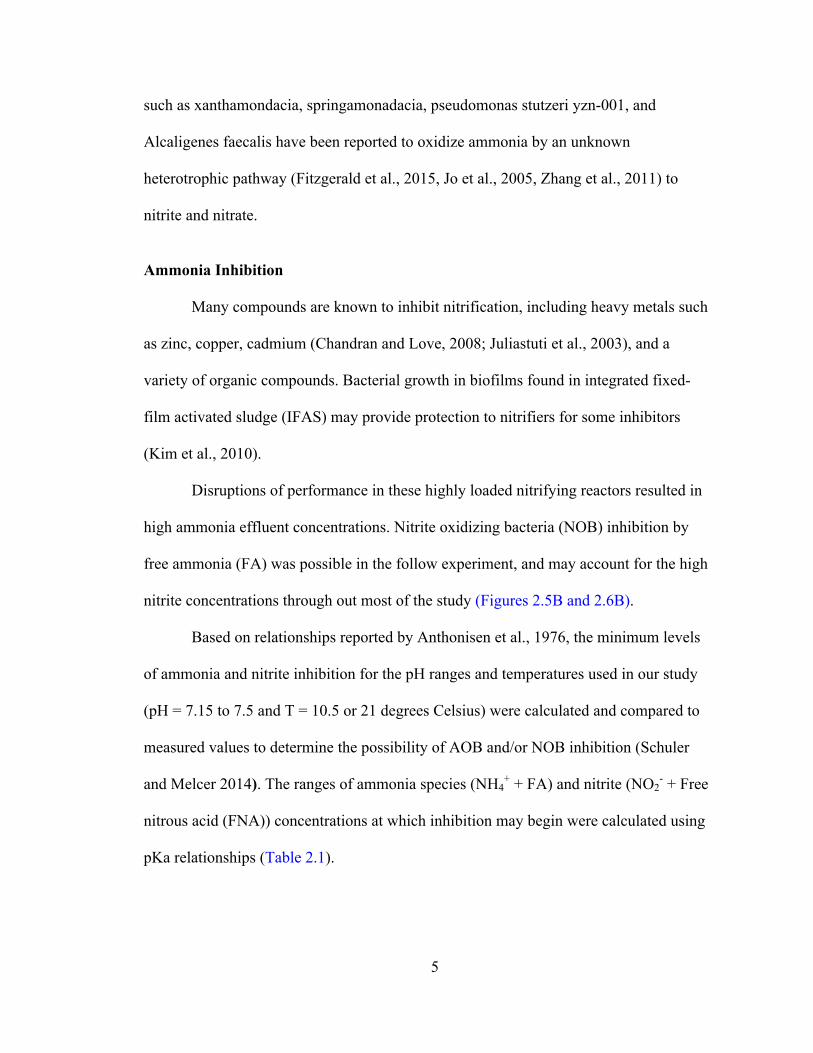
Ammonia Inhibition
Many compounds are known to inhibit nitrification, including heavy metals such
as zinc, copper, cadmium (Chandran and Love, 2008; Juliastuti et al., 2003), and a
variety of organic compounds. Bacterial growth in biofilms found in integrated fixed-
film activated sludge (IFAS) may provide protection to nitrifiers for some inhibitors
(Kim et al., 2010).
Disruptions of performance in these highly loaded nitrifying reactors resulted in
high ammonia effluent concentrations. Nitrite oxidizing bacteria (NOB) inhibition by
free ammonia (FA) was possible in the follow experiment, and may account for the high
nitrite concentrations through out most of the study (Figures 2.5B and 2.6B).
Based on relationships reported by Anthonisen et al., 1976, the minimum levels
of ammonia and nitrite inhibition for the pH ranges and temperatures used in our study
(pH = 7.15 to 7.5 and T = 10.5 or 21 degrees Celsius) were calculated and compared to
measured values to determine the possibility of AOB and/or NOB inhibition (Schuler
and Melcer 2014). The ranges of ammonia species (NH4+ + FA) and nitrite (NO2
- + Free
nitrous acid (FNA)) concentrations at which inhibition may begin were calculated using
pKa relationships (Table 2.1).

6
Table 2.1. Concentrations of nitrogen species at which inhibition may begin for
AOB and NOB calculated from data in Anthonisen et al., 1976 (from Schuler and
Melcer 2014).
T = 21°C T = 10.5°C
pH = 7.15 pH = 7.5 pH = 7.15 pH = 7.5 AOB inhibition by ammonia
FA, mg N/L total ammonia, mg N/L total ammonia, mg N/L
Low estimate 8 1,400 620 3,100 1,400
High estimate 120 20,700 9,300 46,000 21,000
NOB inhibition by ammonia
FA, mg N/L total ammonia, mg N/L total ammonia, mg N/L
Low estimate 0.1 14 6.2 31 14 High estimate 1 140 62 310 140
AOB or NOB inhibition by nitrite
FNA, mg N/L total nitrite, mg N/L total nitrite, mg N/L
Low estimate 0.07 370 830 280 620 High estimate 0.8 4,700 11,000 3,500 7,900

7
Biofilm Mass Transfer
Mass transfer into a biofilm can be modeled as transport of a constituent from a
bulk solution, with diffusion through a laminar boundary layer, and then with diffusion
through a biofilm (Figure 2.1). (De Beer et al., 1996)
According to this model, increased mixing rates will decrease the boundary layer
thickness, thereby increasing the rate of mass transport into and out of a biofilm (De
Beer et al., 1996). For nitrification, key transported constituents are oxygen and
ammonia into the biofilm, and nitrite, nitrate, and protons out of the biofilm (Eq. 2.1 and
2.2).
Hypothesis
It was hypothesized that the performance of suspended media that carry biofilms
in MBBR and IFAS systems may be enhanced by geometric design. It was also
hypothesized that while increasing mixing rates will tend to increase nitrification rates,
the extent of this affect will depend on media geometry, with a less pronounced affect in
Figure 2.1: Schematic representation of mass transfer from bulk liquid to a biofilm

8
media with more “open” design. The internal fluid dynamics of different media may be
influenced by media geometry. Internal fluid flow may affect mass transfer from the
bulk liquid to the occupying biofilm by influencing boundary layer thickness and
therefor reaction rates. Internal fluid flow may also influence the susceptibility of the
biofilm to sloughing due to mixing induced shear. For these reasons, the physical
characteristics of MBBR plastic media may determine the influence that mixing
intensity, dissolved oxygen (DO) and temperature have on nitrification performance,
biofilm thickness, biofilm community structure, and chemical inhibition.
Objectives
The objectives of the research described in this Chapter were to 1) evaluate the
effect of mixing on ammonia flux in two types of commercially available MBBR media
with contrasting geometries. 2) Compare the biofilm populations on each media type
after reaching equilibrium at the maximum ammonia uptake. 3) Evaluate the effect that
temperature has on moving bed biofilm populations at high and low temperatures.
The experimental approach to address these objectives was to grow nitrifying
biofilms on each media type in continuously flowing, well-mixed reactors. Once
nitrifying biofilms were well established, batch testing with mixing as an experimental
variable was conducted to determine the effect of mixing on ammonia flux.

9
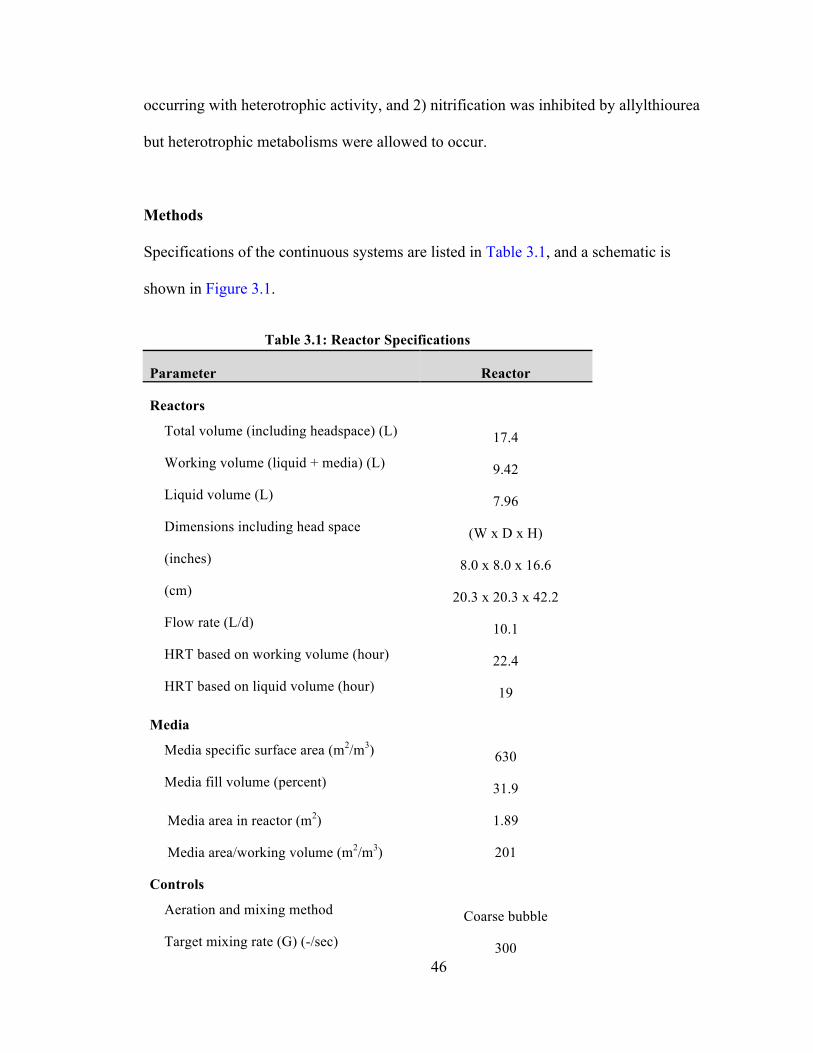
Methods
Reactor Operation
Specifications of the continuous systems are listed in Table 2.2, and a schematic is
shown in Figure 2.2.
Table 2.2 Reactor Specifications
Parameter R1 R2
Reactors
Total volume (including headspace) (L) 17.4 17.4
Working volume (liquid + media) (L) 9.36 9.42
Liquid volume (L) 8.15 7.96
Dimensions including head space (W x D x H)
(inches) 8.0 x 8.0 x 16.6
(cm) 20.3 x 20.3 x 42.2
Flow rate (L/d) 10.1 10.1
HRT based on working volume (hour) 22.3 22.4
HRT based on liquid volume (hour) 19.4 19
Media
Media specific surface area (m2/m3) 650 630
Media fill volume (percent) 32.1 31.9
Media area in reactor (m2) 1.95 1.89
Media area/working volume (m2/m3) 208 201
Controls
Aeration and mixing method Coarse bubble
Target mixing rate (G) (-/sec) 240–327 (variation discussed below)
Dissolved oxygen concentration (mg/L) >6.5 mg/L (measured but not controlled)

10
Table 2.2 Reactor Specifications
Parameter R1 R2
pH control range 7.15–7.50
Temperature (°C) 21.0 or 10.5 in temperature-controlled water bath
Figure 2.2: MBBR System Schematic
Air Pump
Effluent
Dechlorinated Tap Water
Concentrated Neutrient Feed
Course Bubble Aerator
pH meter and controller with acid/base addition
DO Meter

11
Two commercially available media were tested. The Reactor 1 (R1) and 2 (R2)
media had similar specific surface areas (Table 2), but R1 media were smaller (14 mm
long, 12 mm diameter) with a more open design (with openings on all sides), while R2
media were larger (15 mm long, 20 mm diameter) and had a more protected interior
(with openings on 2 sides). (Figure 2.3)
Figure 2.3: Top: Reactor 1 media (Media 1); Bottom: Reactor 2 media
12
Reactor Feed
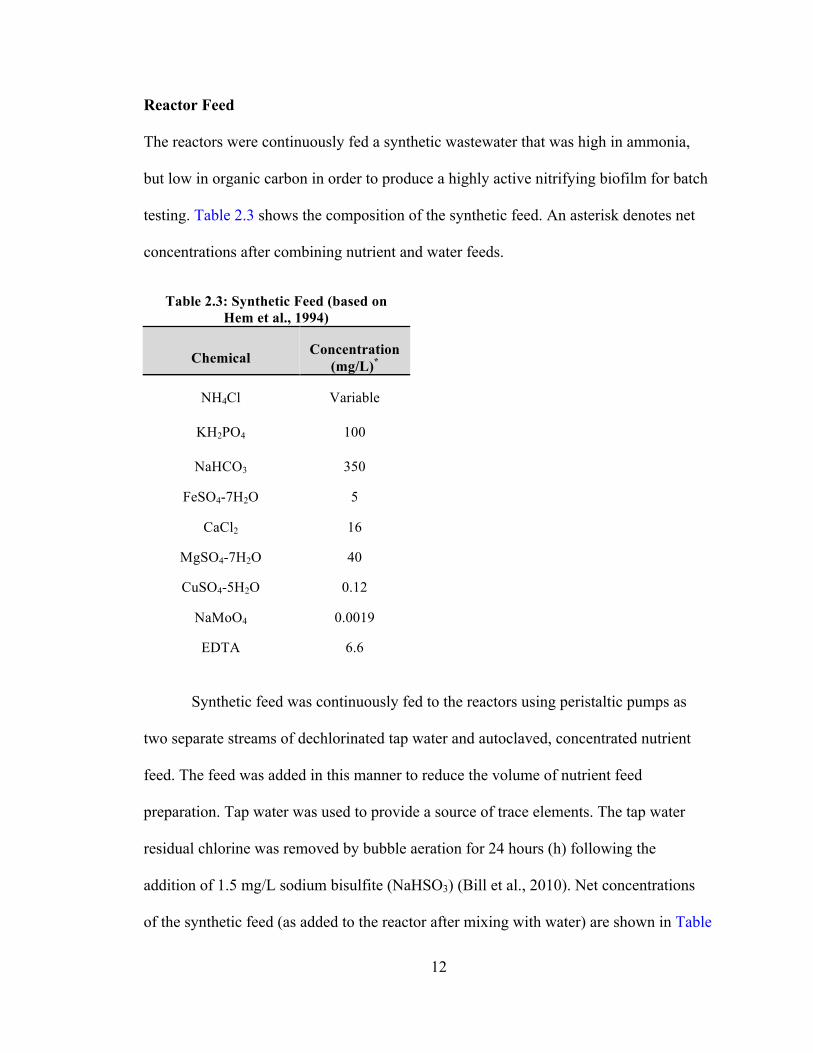
The reactors were continuously fed a synthetic wastewater that was high in ammonia,
but low in organic carbon in order to produce a highly active nitrifying biofilm for batch
testing. Table 2.3 shows the composition of the synthetic feed. An asterisk denotes net
concentrations after combining nutrient and water feeds.
Table 2.3: Synthetic Feed (based on Hem et al., 1994)
Chemical Concentration (mg/L)*
NH4Cl Variable
KH2PO4 100
NaHCO3 350
FeSO4-7H2O 5
CaCl2 16
MgSO4-7H2O 40
CuSO4-5H2O 0.12
NaMoO4 0.0019
EDTA 6.6
Synthetic feed was continuously fed to the reactors using peristaltic pumps as
two separate streams of dechlorinated tap water and autoclaved, concentrated nutrient
feed. The feed was added in this manner to reduce the volume of nutrient feed
preparation. Tap water was used to provide a source of trace elements. The tap water
residual chlorine was removed by bubble aeration for 24 hours (h) following the
addition of 1.5 mg/L sodium bisulfite (NaHSO3) (Bill et al., 2010). Net concentrations
of the synthetic feed (as added to the reactor after mixing with water) are shown in Table

13
2.3. Treated effluent overflowed each reactor via the effluent port, the location of which
determined the reactor volume No organic carbon was included in the feed to reduce the
heterotroph component of the biofilms as much as possible. Ammonium chloride was
the sole source of nitrogen in the feed, and its concentration was adjusted with the goal
of maintaining a target effluent ammonia concentration between 10 and 50 mg N/L. This
ammonia residual aimed to prevent limiting biofilm activity with out creating an excess
of ammonia to inhibit nitrification. Influent ammonia feed concentrations varied from
initial concentrations of 30 to 40 mg N/L early in reactor biofilm development to 400 to
600 mg N/L once the biofilm was fully matured.
Mixing
Mixing of the reactors was done by coarse bubble aeration through a horizontal
section of polyvinyl chloride pipe spanning the bottom width of the reactor. Coarse
bubble air was delivered at a steady flow rate to provide constant mixing intensity in the
reactors. Mixing intensity can be described by the velocity gradient (G, 1/s), which can
be calculated using Equation 2.3 (Parker 1970).
G =Q ∗ γ ∗ 𝐻!
𝜇𝑉 (eq. 2.3)
where:
G = velocity gradient (1/s)

14
Q= airflow rate (m3/s)
γ = water specific weight (N/m3)
HL = head loss (m) (distance from aerators to water surface)
µ = water dynamic viscosity (N*s/m2)
V= volume (m3) (working volume used for all calculations)
Mixing rates in the continuous reactors and in the batch experiments were
selected based upon a review of typical G values used in full-scale MBBR installations
(Melcer et al., 2014). Table 2.4 presents data from 16 full-scale reactors, some of which
comprised several basins, along with calculated G values. Figure 2.4 is a histogram of
this distribution.

15
Table 2.4. Full-Scale MBBR Plant Calculated Values of G (SI Units) (from Schuler and Melcer 2014)
Plant
Volume Depth Air Rates per Basin (m3/min) G (1/s)
m3 m Basin No. Basin No.
1 2 3 4 1 2 3 4
A 623 4.1 92 61 315 257
B 1,133 4.9 88 74 249 228
C 696 6.1 27 27 27 27 198 198 198 198
D1 1,631 4.9 139 139 261 261
D2 2,276 4.9 96 96 183 183
E 580 6.1 42 35 270 247
F 58 3 9 6 6 274 228 221
G1 306 3.7 9 9 134 134
H 505 6.1 66 23 360 212
I 1,133 5.5 119 60 306 218
J1 1,298 5.3 107 267
J2 882 4.4 43 189
G2 842 6.2 54 54 54 255 255 255
SJ 1,245 4.9 46 171
M 169 4.1 11 210
P 187 3 33 27 296 270

16
The range of G values calculated for these systems was 134/s to 360/s. The
average across all plants was 233/s. Most of the high G values are associated with plant
operating at high oxygen uptake rates.
The high end of the G value range (380/s) used in batch experiments was based
on the range shown in Table 2.4. The minimum batch experiment G value of 158/s was
based on the minimum G value that provided enough movement of the media in order to
keep the media well mixed. The initial mixing rate used in each continuous system was
240/s but was increased to 298/s after approximately one month of operation in order to
reduce sloughing observed in initial batch tests.
Figure 2.4: Frequency distribution of G values observed in 32 full-scale MBBR reactors spread across 16 facilities (Melcer and Schuler 2014)
17
Startup and Routine Operation of Continuous System
Both reactors were inoculated in March of 2013. 3 L of each media were
incubated at room temperature for 3 days in a bucket containing 10 L of fresh activated
sludge, with coarse-bubble mixing. The activated sludge was obtained from the
Albuquerque, New Mexico, Southside Water Reclamation Facility (SWRF) activated
sludge system, which has a Modified Ludzack-Ettinger configuration. After inoculation
with sludge, the media were transferred to the continuous flow reactor that initially
contained approximately 5 L of activated sludge and 5 L of primary effluent obtained
from the SWRF. Thereafter the systems were operated with continuous synthetic feed.
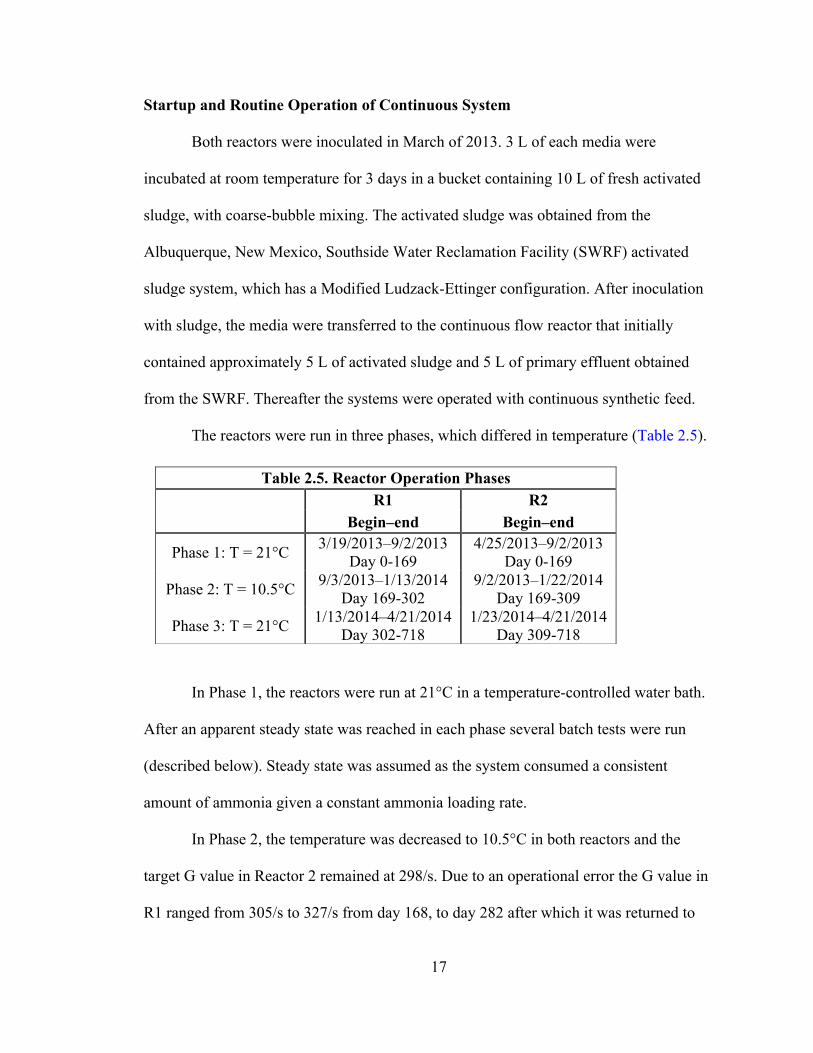
The reactors were run in three phases, which differed in temperature (Table 2.5).
In Phase 1, the reactors were run at 21°C in a temperature-controlled water bath.
After an apparent steady state was reached in each phase several batch tests were run
(described below). Steady state was assumed as the system consumed a consistent
amount of ammonia given a constant ammonia loading rate.
In Phase 2, the temperature was decreased to 10.5°C in both reactors and the
target G value in Reactor 2 remained at 298/s. Due to an operational error the G value in
R1 ranged from 305/s to 327/s from day 168, to day 282 after which it was returned to
Table 2.5. Reactor Operation Phases R1 R2
Begin–end Begin–end
Phase 1: T = 21°C 3/19/2013–9/2/2013 Day 0-169
4/25/2013–9/2/2013 Day 0-169
Phase 2: T = 10.5°C 9/3/2013–1/13/2014 Day 169-302
9/2/2013–1/22/2014 Day 169-309
Phase 3: T = 21°C 1/13/2014–4/21/2014 Day 302-718
1/23/2014–4/21/2014 Day 309-718

18
298/s. In Phase 3, the temperature was returned to 21°C in both reactors. This was done
to test whether the reactors could utilize ammonia at the ammonia loading rate values
applied during Phase 1, and to conduct additional batch experiments to evaluate the
effects of bulk liquid phase DO concentration on mass transfer characteristics in both
reactors.
Batch Testing
Batch nitrification tests were conducted on the media grown in the continuous
systems in which mixing (aeration) rates were varied from G = 160/s to 390/s..
Additional tests were conducted with varied dissolved oxygen concentrations from 3 to
21 mg/L. Batch tests were conducted by stopping the continuous feed, rinsing the media,
and adding fresh feed. Measurements of NH3, NO2-, and NO3
- were then taken over
time.
The batch testing data consisted of ammonia, nitrate, and nitrite concentrations
measured at specific time intervals. During each test the average temperature, airflow
rate, and DO concentration were recorded. The average rate of ammonia oxidation was
estimated by a best-fit linear regression over the course of the batch experiment. Flux
rates were calculated according the Equation 2.4.
J = dCdt×1SSA
×1F
(2.4)
Where
J = mass flux relative to media surface area (g/m2/d)

19
SSA = media specific surface area (m2/m3)
F = media fill percentage (unitless)
C = ammonia concentration (g/m3)
t = time (day)
Biomass
Prior to batch testing, 5 to 10 media pieces were taken from a given reactor, and
each piece was thoroughly cleaned by brushing using Proxabrush “Go-Betweens”
(Sunstar Americas Inc. Schaumburg, IL.) which were developed for dental cleaning. The
removed biofilm was collected by rinsing with DI water, the total attached solids (TAS)
and volatile attached solids (VAS) in the rinse water was measured according to the total
and volatile suspended solids Standard Methods 2540B and 2540E, respectively
(American Public Health Association et al., 2012). The biofilm mass concentration in
the reactor was calculated using Equation 2.5:
Total biofilm solids, TBS mgL
=
dry mass removed from media (mg)reactor working volume (L)
×total media pieces
pieces of media tested (eq. 2.5)
Nitrogen Species
Samples taken for nitrogen species analysis were immediately filtered through a
0.45 µm nylon membrane syringe filter, stored at 4°C, and measured within 24 hours.
All measurements of nitrogen species were performed using Hach kits with a Hach

20
DR2700 spectrophotometer (Hach Company, Loveland, Colorado, USA) as follows:
NH4-N: Nitrogen-Ammonia Reagent Set, TNT, AmVer (Salicylate), High Range,
Product 2606945, NO2-N: NitriVer 3 TNT Reagent Set, Nitrogen-Nitrite, Low Range,
Product 2608345, NO3-N: NitraVer X Nitrogen-Nitrate Reagent Set, High Range,
Product 2605345. All kits were used in accordance with the manufacturer’s instructions,
except a correction for potential nitrite interference with the nitrate measurement was
started on January 6, 2014. The manufacturer’s instructions note that nitrite interference
could occur at nitrite concentrations greater than 12 mg/L. Per the manufacturer’s
instructions, this interference was removed by adding 400 mg urea to 10 mL of sample.
Nitrate concentrations measured prior to January 6, 2014, may therefore overestimate
the actual values.
pH Control
pH was measured and controlled in the range of 7.15 to 7.5 in each reactor with a
pH controller (Chemcadet Model 5652-00, Cole-Parmer, Vernon Hills, Illinois, USA)
with a combination, double-junction, gel-filled pH electrode (Model EW-59001-70,
Cole-Parmer, Vernon Hills, Illinois, USA). Acid and base solutions were 0.1 M
hydrogen chloride (HCl) and 0.7 M sodium carbonate (Na2CO3), respectively.
Dissolved Oxygen
DO was measured using a Hach IntelliCAL LDO101 standard
luminescent/optical DO probe with a Hach HQ440d multi-parameter meter (Hach
Company, Loveland, Colorado, USA).

21
Illumina Next Gen DNA Sequencing
MBBR media was thoroughly cleaned by brushing using Proxabrush
“Go-Betweens” dental brushes (Sunstar Americas Inc. Schaumburg, IL.) The removed
biofilm was collected by rinsing with DI water, and excess liquid was centrifuged off to
form a pellet. The pellet was frozen and shipped to RTL Genomics, Research and
Testing Laboratory (Lubbock, TX) for DNA extraction and Illumina Next Generation
sequencing using the 357wF-785R assay and 784F [5′-RGGATTAGATACCC-3′]
and 1064R [5′-CGACRRCCATGCANCACCT-3′]) bacterial DNA primers.
Results and Discussion
R1 performance in terms of ammonia removal, nitrite and nitrate production, and
biofilm biomass (VBS) over the 4 experimental phases is shown in Figures 2.5A, 2.5B,
and 2.5C. Similarly, R2 performance is shown in Figures 2.6A, 2.6B and 2.6C

22
Figure 2.5: A) R1 Influent ammonia, effluent ammonia, and ammonia uptake. B) R1 effluent nitrite and nitrate expressed as concentrations (mg/L-N). C) R1 volatile attached solid concentrations and batch test dates.

23
Figure 2.6: A) R2 Influent ammonia, effluent ammonia, and ammonia uptake. B) Effluent Nitrite and Nitrate expressed as concentrations (mg/L-N). C) R2 volatile attached solid concentrations and batch test dates

24
Phase 1 Reactor Performance
As noted, the objective of experimental Phase 1 was to grow biofilms in both
reactors at room temperature in order to conduct batch tests at variable mixing rates.
After inoculation, ammonia uptake increased in both reactors (Figures 2.5A and
Figure 2.6A), as well as nitrite and nitrate concentrations (Figures 2.5B and Figure
2.6B). The ammonia feed concentration was gradually increased after startup in both
reactors an attempt to neither limit nitrifier growth because of low reactor NH3
concentrations or to inhibit nitrifier growth because of high reactor NH3 concentrations.
In R1, the ammonia feed concentration was gradually increased from 40 mg N/L
to 400 mgN/L, with the goal of maintaining effluent ammonia concentration between 10
and 50 mg N/L (Figure 2.5A). Nitrification was initially complete in R1, as nitrate
concentrations nearly matched ammonia uptake. Toward the end of Phase 1,
concentrations of nitrite increased steadily relative to nitrate concentrations (Figure
2.5B), indicating decreasing NOB activity relative to AOB activity . The reason for
nitrite accumulation in this phase and later phases is not known, but NOB inhibition by
free ammonia (NH3) was possible during much of the study, as discussed in Background
section of the chapter. Higher influent ammonia concentrations were used in this study
(up to 433 mg NH3-N/L in R1, Phase 1) than normally found in domestic wastewater to
provide highly active biofilms. One consequence of this was that disruptions in reactor
performance could greatly increase effluent ammonia concentrations, and this may have
inhibited NOB activity (thereby increasing nitrite concentrations as seen at the end
Phase 1 in reactor 1). High nitrite concentrations may have also contributed to NOB
inhibition as well. AOB inhibition by FA was estimated to begin under the “worst-case”

25
condition of pH = 7.50 at total ammonia concentration of 620 to 9,300 mg N/L at T =
21.5°C and 1,400 to 21,000 mg N/L at T = 10°C (Table 2.1). As AOB never experienced
concentrations of FA to this order of magnitude in Reactor 1 or 2 throughout the study
(Figure 2.5A and Figure 2.6A), AOB inhibition by FA was unlikely in either reactor.
NOB inhibition by FA was estimated to occur under the “worst case” condition
of pH = 7.50 at total ammonia concentration of 6.2 to 62 mg N/L at T = 21.5°C and 14
to 140 mg N/L at T = 10°C (Table 2.1). These inhibitory levels were within the range of
effluent ammonia concentrations observed in this study (Figures 2.5A and Figure 2.6A),
and may account for the high nitrite concentrations observed in both reactors throughout
the study.
The most likely form of inhibition was high ammonia concentrations decreasing
NOB activity, although it is also possible that high nitrite concentrations decreased NOB
activity as well. A decrease in NOB activity is apparent by accumulating nitrite and low
nitrate concentrations in both reactors (Figure 2.5B and Figure 2.6B).
Occasional small decreases in apparent ammonia uptake and effluent nitrate and
nitrite effluent concentrations were observed, followed by periods of recovery over
several days. These events occurred immediately after batch tests due to the refilling of
the reactor after each batch test with fresh feed solution. The replacement feed consisted
of a high ammonia concentration relative to the effluent solution removed from the
reactors before the batch tests, with zero nitrate and nitrite concentrations. This practice
applied a pulse ammonia load to the reactors, while removing all accumulated nitrate
and nitrite. It typically took the reactor several days to equilibrate back to a steady state.
For this reason, the increases in effluent ammonia and decreases in ammonia uptake and

26
nitrite and nitrate concentrations during Phase 1 was likely the result of the batch testing
procedure, rather than a decrease in performance. The batch test procedure was modified
after Phase 1 in both reactors such that the reactor liquid phase was removed before
batch testing, saved, and returned after the batch test was complete, before restarting the
continuous system.
R2 was inoculated approximately one month after R1 (Figure 2.6A). Initial
ammonia loadings were increased more rapidly in R2 than in R1, to prevent ammonia
limiting conditions that were experienced during startup of R1, as indicated by low
effluent ammonia concentrations. For example, after 30 days of operation, the R2 feed
ammonia concentration had been increased to 304 mg N/L, with nearly complete uptake,
while after 30 days R1 influent had been increased to 166 mg N/L (Figure 2.5). Two
months after startup, R2 activity reached an approximate steady state at approximately
500 mg N/L ammonia uptake, with influent ammonia concentration equal to 415
mgN/L.
Similar to R1, nitrate concentrations in R2 initially matched the ammonia uptake
rate, followed by a gradual increase in nitrite concentration. Nitrite levels in R2 were
nearly double the nitrate concentrations (300 and 160 mg N/L, respectively) by the end
of Phase 1.
Phase 1 Microbial Biomass and Populations
R1 produced a biofilm with less total biomass than R2, with a value of 619 mg/L
(0.30 mg/cm2) in R1 and 2000 mg/L (1.00 mg/cm2) in R2 at the end of Phase 1. It is
hypothesized that the open design of the R1 media resulted in higher internal fluid

27
velocities and induced shear, when compared to the more protected R2 media. Higher
shear associated with the R1 media may explain the difference in attached biomass that
accumulated by the end of Phase 1.
Figure 2.7 shows the relative abundance of bacteria family present in the R1 and
R2 biofilm at the end of Phase as determined by Illumina DNA sequencing analysis.
The bacteria family Comamonadaceae made up the majority of the R1 biomass
(41.5%) but was less abundant on the R2 media (14.5%). Xin et al., 2016 reported that
Comamonadaceae (also measured by Illumina) dominated a sequencing batch kettle
reactor (SBKR) for wastewater nutrient removal operated at varying aeration pressures
As aeration pressure increased from 0.2 to 0.6MPa in the SBKR, the relative abundance
of Comamonadaceae increased from 22% to 40% as a result of increased dissolved
oxygen in the higher pressure aeration systems, suggesting that Comamonadaceae may
thrive in oxygen-rich environments. These results may have been consistent with those
obtained for Phase 1 of this study, as the reactor with higher Comamonadaceae
population (R1) may have had higher dissolved oxygen concentrations in the biofilm, as
Figure 7: Illumina sequencing results. R2 end of Phase 1, 21 deg C (Right) and R1 end of Phase 1, 21 deg C (Left) Legend shows bacteria ID as Class, Order, Family.
28
indicated by (1) less biofilm per surface area on R1 compared to the R2 media, which
likely indicated a thinner biofilm with less resistance to oxygen mass transfer, and (2)
the more open structure of the R1 media relative to the R2 media (Figure 2.3) may have
resulted in less resistance to liquid flow through the media and consequently higher local
fluid velocities, which would decrease the laminar boundary layer (Figure 2.2) and
increase rates of oxygen mass transfer into the biofilm. The higher internal fluid
velocities are also consistent with thinner biofilms, as the higher shear forces would tend
to lead to thinner biofilms.
In addition, R2 exhibited a higher relative abundance of the AOB family
Nitrosomonadaceae (24%) than did R1 (8%) and may explain greater ammonia uptake
observed in R2 during this time. A lower relative abundance of the AOB family
Nitrosomonadaceae in R1 compared to R2 may also be attributed to competition with
the most abundant bacteria Comamonadaceae found in on R1 media. A higher relative
abundance of the NOB Nitrospiraceae in R1 (2.5%) and the absence of this family in R2
(0.04%) may be attributed to inhibition of NOB by the higher ammonia concentrations
in R2 throughout much of Phase 1 (Figure 2.5A and Figure 2.6A) These results were
also consistent with the observed higher nitrite concentrations in R2 than in R1 during
Phase 1 (Figure 2.5 and Figure 2.6), as nitrite accumulation is evidence of decreased
NOB activity relative to AOB activity.
During Phase 2, both reactors were operated at a lower temperature to evaluate
how different media geometries respond to stressful conditions. The temperature was
decreased in both reactors after sampling on September 2, 2013 (day 168) from 21
degrees Celsius to 10 degrees Celsius.

29
Phase 2 Reactor Performance
The effluent ammonia concentration in Reactor 1 increased to approximately 85
mg N/L shortly after the decrease in temperature at the start of Phase 2 (Figure 2.5A). In
order to achieve the target ammonia effluent range of 10–50 mg N/L mg N/L the feed
ammonia concentration was decreased. Despite this effort, the effluent ammonia
concentration remained higher than the target range at approximately 75 mg N/L.
During this time, effluent nitrate and nitrite concentrations decreased to less than 20 mg
N/L. Toward the end of Phase 2 ammonia influent was reduced to 90 mg/L in order to
achieve an effluent ammonia concentration of 20 mg N/L at equilibrium. The nitrite
concentration increased to approximately 60 mg N/L at the end of Phase 2, with nitrate
concentrations less than 10 mg N/L.
The biomass in R1 decreased from 540 mg/L (0.26 mg/cm2) in late September
(day 195), to 41 mg/L (0.02mg/cm2) by mid-December (day 272) in Phase 2 (Figure
2.6C) . The role of the unintentional increase in mixing rate in R1 Phase 2 from 298/s to
327/s described earlier is not known, but it is possible that this contributed to
deterioration of AOB and NOB activity by increasing shear and sloughing of the
biofilm. As noted, the R1 mixing rates was decreased to 298/s on day 283, however
performance did not improve.
The decreased temperature in R2 Phase 2 also resulted in decreased AOB and
NOB activity, as indicated by reduction in R2 ammonia uptake and nitrate production
(Figures 2.5A and Figure 2.5B). NOB activity was particularly affected, with a decrease
in nitrate concentrations from approximately 200 mg N/L at the end of Phase 1 to 13 mg
N/L in mid November (day 241). In response to the reduction in ammonia uptake, the
30
influent ammonia was decreased from 379 mg N/L to 307 mg N/L in order to reduce the
possibility of NOB inhibition by higher ammonia effluent. Ammonia effluent decreased
from 72 mg N/L in mid (day 241) November, to 1.8 mg N/L in early December (day
258), but reactor nitrate concentrations continued to decrease to nearly zero by the end
of Phase 2. Despite ammonia uptake decreasing in this phase, the amount of biofilm in
the reactor increased from approximately 1500 mg/L (0.74 mg/cm2) to 2000 mg/L (1.00
mg/m2) VAS (Figure 2.5C)
Phase 2 Microbial Biomass and Populations
Figure 2.8 shows the results from Illumina DNA sequencing analysis performed
on a R2 biomass sample at the end of Phase 2, Phase 3. Illumina analyses were not
conducted on R1 in Phase 2 due to the large loss in R1 biomass during this time.

31
In R2, moving from Phase 1 21 degrees C to Phase 2 10 degrees C dramatically
affected the relative abundance of bacteria families present on the biofilm. By the end of
Phase 2, the family Nitrosomonadaceae decreased in relative abundance from 23.7%
(end of phase 1) to 0.6% percent. This reduction in Nitrosomonadaceae was consistent
with the reduction in ammonia uptake during Phase 2, shown in Figure 2.6A. Despite
ammonia uptake decreasing in this phase, the amount of biofilm in the reactor increased
from approximately 1500 mg/L (0.74 mg/cm2) to 2000 mg/L (1.00 mg/m2) VAS (Figure
2.5C) suggesting that colder temperatures facilitated growth or organisms that nitrify
less efficiently or not at all, or possibly decreased detachment rates. Illumina sequencing
results shown in Figure 2.8 show the family Xanthomonadaceae increased from 4.0% at
the end of Phase 1 to 45.3% at the end of Phase 2. Xanthomonadaceae is reported to by
Allen et al., 2004 and Cydzik-Kwiatkowska 2015 to be crucial contributors to extra
cellular polysaccharide (EPS) production in biofilm communities, possibly explaining
Figure 2.8: R2 Illumina sequencing results sorted by Family, expressed as relative abundance and Shannon Diversity Index in Phases 1-4.

32
the continuous increase of biomass on R2 media during this phase. In studies conducted
by Fitzgerald et al., 2015, the family Xanthomonadaceae was found to be involved with
heterotrophic ammonia oxidation under low dissolved oxygen conditions (<0.3mg.L) In
R2, where the biofilm is dominated by Xanthomonadaceae, the biofilm thickness
increased and dissolved oxygen may have decreased deep inside the biofilm. Relative
abundance of the family Comamonadaceae also increased from 14.5% at the end of
Phase 1 to 26.9% at the end of Phase 2. This may be explained by the preference of
Comamonadaceae for oxygen rich environments, and the increase in dissolved oxygen
saturation from temperature decrease. Extremely low levels of nitrate in Phase 2 (Figure
2.6B) were consistent with the complete absence of the only detected NOB family
Nitrospiraceae in R2. Figure 2.8 also shows that the overall family diversity expressed
by Shannon Diversity Index (SDI) greatly decreased from Phase 1 to Phase 2.
Phase 3 Reactor Performance
During Phase 3, the reactors were returned to 21°C in order to supplement high-
temperature batch testing (described below) conducted during Phase 1. Ammonia uptake
increased in R1 after the Phase 3 temperature increase (Figure 2.5A), but did not return
to the levels of uptake observed during Phase 1. Biomass measurements in R1
demonstrated only a small increase in solids in Phase 3, from 41 mg/L (0.02 mg/cm2) in
mid December (day 272), to 56 (0.03 mg/cm2) mg/L in mid February (334) (Figure
2.5C). In an effort to accelerate recovery from the Phase 2 crash, R1 was reinoculated
using the same protocol employed at the start of the experiment. Following reinoculation
(day 336, Figure 2.5C), R1 biomass concentration increased to 140 mg /L (0.07 mg/cm2)

33
on March 13, 2014 (day 360) however this concentration was well below levels
observed in Phase 1 (645 mg/L). Reactor activity increased following reinoculation, but
ammonia uptake did not return to Phase 1 levels.
In order to accommodate for increasing ammonia uptake that resulted from
temperature increase at the start of Phase 3, the feed ammonia concentration to R2 was
increased from 300 to 435 mg N/L. Although ammonia uptake increased, the effluent
ammonia concentration also increased, averaging 70 mg N/L in the first month of Phase
3.
Visual inspection of the media determined that approximately 40 percent of the
R2 media contained little to no biomass in early Phase 3. It was hypothesized that these
were media that had been removed and cleaned for biomass measurements, and that
biomass had not re-grown on them over the course of the study. It may have been that
the inoculation procedure (incubating the media in activated sludge for several days) at
the beginning of the study was critical for priming of the media for biofilm growth,
while use of the zero organic carbon synthetic feed contributed to a poor environment
for biofilm regrowth on the media. For this reason, the media with no attached biofilm
were removed from R2 and they were reinoculated on February 17, 2014 (day 336) with
activated sludge according the same protocol used at the beginning of the study. Plastic
media in R2 with significant visible biomass were not reinoculated.
The media with little visible biomass that were reinoculated increased from
1.60 mg/media to 54.3 mg/media 30 days after reinoculation. Ten media without visible
biomass were marked and returned to the reactors without reinoculation. There was
comparably little increase in biomass on these media (from 1.60 mg/media to 5.8
34
mg/media after 30 days). These results confirmed the hypothesis that biofilm regrowth
was very slow on cleaned media returned directly to the reactor after biomass
measurement, and it is therefore confirms the importance of the initial inoculation.
After reinoculation, R2 ammonia uptake quickly increased, although it did not
return to the Phase 1 levels. After remaining at 0 mg/L through much of Phase 3, nitrate
concentrations steadily increased after reinoculation with a simultaneous decrease in
nitrite concentrations.
Phase 3 Microbial Biomass and Populations
As shown in Figure 2.12, after increasing the temperature in Phase 3, the relative
abundance of the families Xanthomonadaceae and Comamonadaceae decreased to levels
similar to that at the end of Phase 1 (5.1% and 11.6%, respectively). This may suggest
that the colder temperatures facilitated the increase of Xanthomonadaceae and modest
decrease of Comamonadaceae. At the same time, the relative abundance of
Nitrosomonas at the end of Phase 3 recovered to similar levels to the end of Phase 1.
This recovery may be attributed to increasing temperature to a more preferred
environment of Nitrosomonas. Figure 2.8 also shows that the overall bacterial diversity
expressed by SDI recovered in Phase 3 to levels similar to conditions at the end of Phase
1.

35
Batch Testing
Batch testing of the R1 and R2 media was conducted in all phases of the study
(Figure 7), in which mixing rates were varied to determine effects in nitrification rates.
In Phase 1, batch tests were conducted at various mixing rates with out controlling
dissolved oxygen. As shown in Figure 2.9 increasing the mixing had a more dramatic
effect on ammonia flux on the R2 media than the R1 media.
As shown in Figure 2.9, both biofilm carrier media produced a similar flux
values at the lower mixing values during Phase 1. At higher mixing rates, the fluxes in
R2 tended to increase to a greater degree than they did in R1. It was hypothesized that
this was because the R2 media had a more protected interior than the R1 media, and so
fluid velocities in the R2 media may have been lower than those in the R1 media. The
result would be a greater differential between the bulk fluid concentrations and the those
at the biofilm surface in R2 than in R1, and this would be most pronounced at lower
mixing rates. As mixing rates were increased, these differentials were expected to
decrease in both systems, resulting in increased flux rates in both cases. The greater
Figure 2.9: Phase 1, R1 and R2 variable mixing batch nitrification testing.

36
effect of increasing mixing on flux rates in R2 relative to R1 was consistent with a
greater protection by the R2 media design.
Increasing mixing rates entrained more oxygen into the bulk liquid, and therefor
raised the dissolved oxygen of the system. Variable dissolved oxygen batch tests were
conducted to show that increasing dissolved oxygen, also increased flux, and needed to
be controlled in future batch tests so that mixing is the only variable.
37
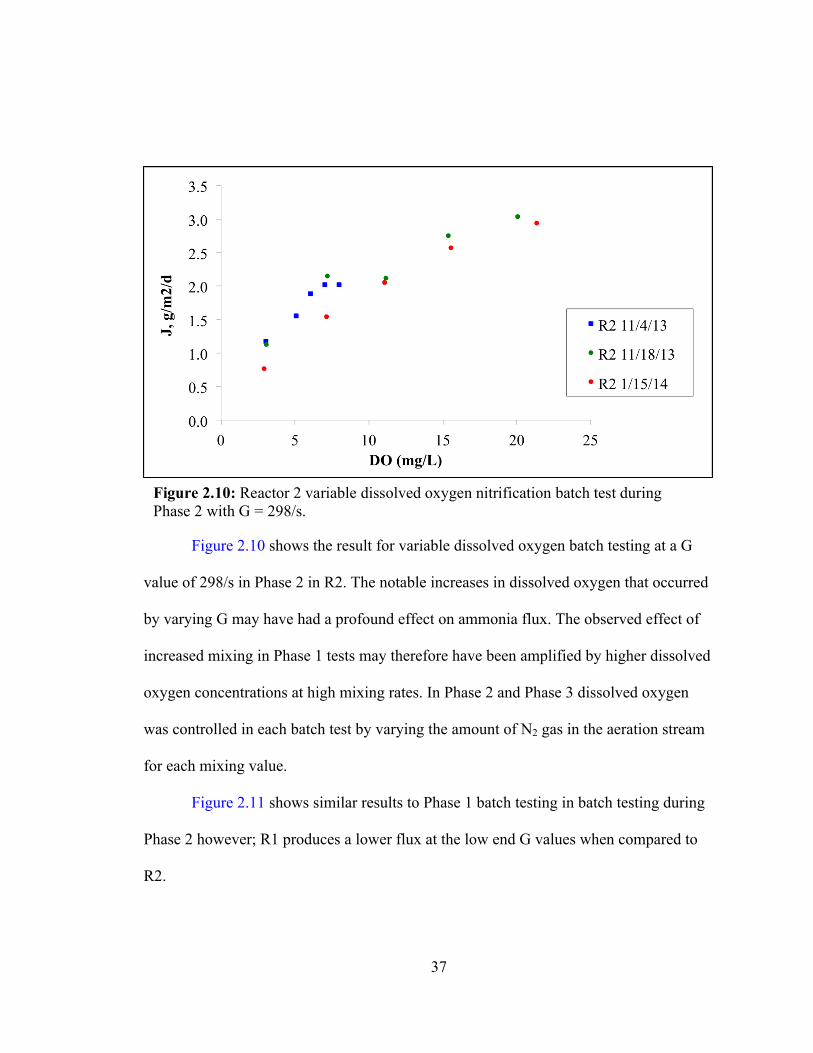
Figure 2.10 shows the result for variable dissolved oxygen batch testing at a G
value of 298/s in Phase 2 in R2. The notable increases in dissolved oxygen that occurred
by varying G may have had a profound effect on ammonia flux. The observed effect of
increased mixing in Phase 1 tests may therefore have been amplified by higher dissolved
oxygen concentrations at high mixing rates. In Phase 2 and Phase 3 dissolved oxygen
was controlled in each batch test by varying the amount of N2 gas in the aeration stream
for each mixing value.
Figure 2.11 shows similar results to Phase 1 batch testing in batch testing during
Phase 2 however; R1 produces a lower flux at the low end G values when compared to
R2.
Figure 2.10: Reactor 2 variable dissolved oxygen nitrification batch test during Phase 2 with G = 298/s.

38
This is most likely due to a large decrease in the attached biomass and the
ammonia uptake in the continuous system (Figure 2.5A and Figure 2.5C) in R1 after
decreasing the temperature. Similar to Phase 1 batch testing, increasing mixing has very
little effect on flux on the R1 media. As shown in Figure 2.11, increasing mixing to a
higher G value in R2 also increased flux in a similar fashion to phase 1 batch testing.
Dissolved oxygen was controlled during these batch tests from 6.5mg/L to 7mg/L, and
may account for the slightly reduced effect of mixing on flux compared to Phase 1
testing for both R1 and R2.
Figure 2.11: Phase 2, R1 and R2 variable mixing batch nitrification testing.

39
Additional tests were conducted in Phase 3, to confirm the effect of mixing on
ammonia flux at the 21 degree temperature phase, with controlled dissolved oxygen. The
results of these additional batch tests are shown in Figure 2.12.
Figure 2.12 confirms the results from the Phase 1 batch testing, by showing similar
trends observed in Figure 2.11 for both the R1 and R2 media while controlling dissolved
oxygen between 6.5mg/L to 7mg/L.
Conclusions
Following nitrification reactor startup of commercially available MBBR/IFAS
media designed with contrasting geometries, system performance and microbial
communities varied greatly in the resulting biofilms.
Figure 2.12: Variable mixing batch testing results during Phase 3 in R1 and R2 media

40
Media geometry likely influenced internal fluid dynamics within each type of
plastic biofilm carrier. The open media produced a thinner biofilm with a low abundance
of the known AOB Nitrosomonas, while the sheltered design produced a thicker biofilm
rich in Nitrosomonas.
Batch testing each media type at various mixing rates indicates that nitrification
performance in the more protected media benefits from increasing mixing, where the
open R1 media does not.
Decreasing temperature from 21 to 10.5 degrees Celsius in R1 resulted in the
eventual failure of the media to retain its biomass. Although nitrification performance
was decreased, sloughing was not observed in the sheltered R2 media design and may
suggest that decreasing temperature makes a biofilm more susceptible to mixing induced
shear.
Following the drop in temperature the R2 media decreased in overall diversity,
all but eliminating the AOB Nitrosomonas while largely favoring the family
Xanthomonadaceae. Xanthomonadaceae is known for heterotrophic nitrification by an
unknown pathway and its occurrence explain the disappearance of the known AOBs
with only a modest decrease in nitrification performance.
After increasing the temperature back to 21 degrees, the R2 biofilm diversity and
microbial family relative abundance returned to similar level to before the temperature
decrease.
Media geometry likely influenced internal fluid dynamics within the plastic
biofilm carrier.

41
Chapter 3: An Assessment of Moving Bed Bioreactors and the
Importance of Nitrification on the Removal of Trace Organics.
Introduction
The research described in this chapter was to evaluate the contribution of
nitrification activity to trace organic removal in MBBRs systems. The experimental
approach was to test the removal of trace organics in batch experiments where
nitrification is occurring, and where nitrification was inhibited by allylthiourea.
Background
Nitrification is a 2 step biological process shown in equations 3.1 and 3.2.
2𝑁𝐻!! + 3𝑂! → 2𝑁𝑂! + 4𝐻! + 2𝐻!𝑂 (3.1)
2𝑁𝑂!! + 𝑂! → 2𝑁𝑂!! (3.2)
The first step is the oxidation of ammonia to nitrite by the ammonia oxidizing
bacteria (AOB) such as Nitrosomonas under aerobic conditions (Kowalchuk et al., 2001)
The second step of nitrification is the aerobic oxidation of nitrite to nitrate by nitrite
oxidizing bacteria (NOB), including the genus Nitrobacter (Kowalchuk et al., 2001).
AOB and NOB obtain energy from by coupling oxygen reduction with ammonia and
nitrite oxidation, respectively. Autotrophic nitrifiers use this energy to convert CO2 to
cellular carbon (Metcalf and Eddy 2003). Recently, several other groups of bacteria,
such as xanthamondacia, springamonadacia, pseudomonas stutzeri yzn-001, and
Alcaligenes faecalis have been reported to oxidize ammonia by an unknown

42
heterotrophic pathway (Fitzgerald et al., 2015, Jo et al., 2005, Zhang et al., 2011) to
nitrite and nitrate.
Trace organics
Microconstituents in wastewater effluent include pharmaceuticals, personal care
products, industrial chemicals, and synthetic hormones present at low concentrations
(Ternes et al., 1998; Paxeus et al., 2004). This class of contaminants is receiving
increasing attention due their persistence in the environment, and potential to impact the
ecosystem (Kolpin et al., 2002). By mimicking and disrupting natural endocrine
systems, trace organics may impair immune systems, lead to feminization of aquatic
organisms, and interfere with reproduction. Removing trace organics is particularly
important in arid regions where water scarcity and direct/indirect reuse is becoming
more prevalent. Advanced physiochemical processes are effective at removing trace
organics, however costly due to excessive energy consumption. With constraints on
energy usage and carbon footprint, biological treatment of trace organics is of interest
due to cost effectiveness and benefits to downstream physiochemical processes.
Engineering biofilms to enhance microconstituent removal may be achieved by
designing surfaces where chemical and physical properties of the attachment surface
enrich a biofilm that is more capable of removing such compounds. Targeting specific
biofilm populations for attachment to a system, and altering biofilm morphology will be
examined in this study to possibly improve microconstituent removal with out increase
space or energy requirements.

43
Cometabolism of Trace Organics
Microconstituents are found at very low concentrations in wastewater, but may
pose a risk for aquatic ecosystems and human health if they are not eliminated during
wastewater treatment (Fischer et al., 2014). Toxicity at high concentrations under lab
conditions makes some microconstituents insufficient to support bacterial growth as the
sole carbon source. Concentrations of emerging organic pollutants in wastewater are so
low (ng/L) that they cannot support metabolic activity even if they are biodegradable.
For these reasons, cometabolism is theorized to be the dominating biodegradation
process for many microconstituents found in wastewater. (Fischer et al., 2014, Ngoc et
al., 2013). Cometabolism in wastewater treatment and bioremediation refers to the
inadvertent breakdown of synthetic organic compounds by enzymes created when
microorganisms metabolize simple and essential nutrients for growth (Ngoc et al.,
2013). While metabolizing simple sugars, bacteria strain S. maltophilia KB2 has been
shown to breakdown the synthetic organic compound naproxen more efficiently when
compared to a system where naproxen is the only substrate for growth (Wojcieszynska
et al., 2014). As KB2 breaks down those simple sugars, specific enzymes are created
that will inadvertently aid in the degradation of naproxen.
In pure cultures of the nitrifying bacteria N. europaea, an enzyme suspected to be
ammonia mono oxygenase (AMO) easily breaks down microconstituents such as
triclosan and bisphenol A (Roh et al., 2009). AMO is produced during oxidation of
ammonia to nitrite. As AMO production is inhibited by allylthiourea (ATU), these micro
constituents are unable to be metabolized by a pure culture of N. europaea. This
indicates that BPA and Triclosan are removed cometabolically by the oxidation of

44
ammonia. Similar tests by Roh et al., 2009 also show that triclosan and BPA can be
metabolized in mixed cultures found in wastewater treatment plant nitrifying sludge
both in the presences and absence of the ammonia mono oxygenase inhibitor. This
suggests that in addition to cometabolic processes during nitrification, heterotrophic
processes may be involved in breaking down micro contaminants co-metabolically.
Further research is warranted to match heterotrophic and autotrophic metabolic
processes to newly emerging contaminants that may be degraded by the cometabolic
pathway. Following the biological transformation of micropollutants in wastewater,
micro-constituents such as estrogen may appear to be removed, however they may only
be converted to daughter products that may also have adverse effects on the environment
and require further investigation (e.g. estradiol discussed below). (Yi et al., 2007)
Khunjar et al., 2011 reported that AOBs transformed ethinyl estradiol (EE2) five
times faster than heterotrophs, but not remove trimethoprim. In this same study,
heterotrophs mineralized EE2 and AOB formed EE2 metabolites, and bio transformed
trimethoprim. EE2 removal was significantly slowed as an inhibitor to nitrification was
added. This would suggest that AOB inhibition has an effect on EE2 removal, but not
the removal of trimethoprim.
Conjugation
The majority of natural and synthetic hormones are excreted from humans or
animas in a conjugated form, where the addition of a sulfate or glucuronide group
increases solubility to facilitate excretion (Kovalova et al., 2006). The fate of synthetic
organic compounds at a wastewater treatment plant can be divided into three main
45
pathways. Mineralization to CO2 and water, retention onto solids found in sludge, and
release into receiving waters in the deconjugated parent form (Halling-Sorensen et al.,
1998). As conjugated synthetics enter the treatment plant and are deconjugated, the
apparent concentration of the parent compound may appear to increase in the effluent of
the wastewater treatment plant. An example of this is the tendency for 17b-estradiol-
17glucuronide and 17b-estradiol-3glucuronide to deconjugated and form 17b-estradiol
when in contact with activated sludge. (Ternes et al., 1999) Although the conjugated
form is not detected, the occurrence of the deconjugated form deceptively suggests
production in the wastewater treatment process.
Hypothesis
Our hypothesis is that nitrification can increase the removal rates of trace
organics other than the estrogens that have been previously suggested to be removed by
nitrification in activated sludge.
Analyzing a broad array of trace organics in mixed heterotrophic/nitrifying and
purely heterotrophic systems gives a better understanding of the benefits to nitrification
in the removal of all synthetic organic contaminants found in wastewater.
Objectives
The objective of this study was to evaluate differences in removal of targeted
trace organics in moving bed bioreactors with and without inhibition of nitrification.
This was tested by measuring trace organics in batch tests where 1) nitrification was
46
occurring with heterotrophic activity, and 2) nitrification was inhibited by allylthiourea
but heterotrophic metabolisms were allowed to occur.
Methods
Specifications of the continuous systems are listed in Table 3.1, and a schematic is
shown in Figure 3.1.
Table 3.1: Reactor Specifications
Parameter Reactor
Reactors
Total volume (including headspace) (L) 17.4
Working volume (liquid + media) (L) 9.42
Liquid volume (L) 7.96
Dimensions including head space (W x D x H)
(inches) 8.0 x 8.0 x 16.6
(cm) 20.3 x 20.3 x 42.2
Flow rate (L/d) 10.1
HRT based on working volume (hour) 22.4
HRT based on liquid volume (hour) 19
Media
Media specific surface area (m2/m3) 630
Media fill volume (percent) 31.9
Media area in reactor (m2) 1.89
Media area/working volume (m2/m3) 201
Controls Aeration and mixing method Coarse bubble
Target mixing rate (G) (-/sec) 300

47
Table 3.1: Reactor Specifications
Parameter Reactor
Dissolved oxygen concentration (mg/L) >6.5 mg/L (measured but not controlled)
pH control range 7.15–7.50
Temperature (°C) 21
The Reactor media had specific surface areas shown in (Table 3.1) and geometry
shown in Figure 3.2, (15 mm long, 20 mm diameter)
Figure 3.1: MBBR System Schematic
Air Pump
Effluent
Dechlorinated Tap Water
Concentrated Neutrient Feed
Course Bubble Aerator
pH meter and controller with acid/base addition
DO Meter

48
Reactor Feed
The MBBR was fed primary effluent from the Albuquerque WWTP for the
duration of this study. The reactor was originally inoculated with activated sludge to
accelerate the formation of biofilm on the media. 3 L of media were incubated at room
temperature for 3 days in a bucket containing 10 L of fresh activated sludge, with
coarse-bubble mixing. The activated sludge was obtained from the Albuquerque, New
Mexico, Southside Water Reclamation Facility (SWRF) activated sludge system, which
has a Modified Ludzack-Ettinger configuration and operated with synthetic feed for
approximately two years as part of a previous study (Schuler and Melcer. 2014). The
reactor feed was switched to primary effluent and operated an additional month to insure
Figure 3.2: MBBR reactor biofilm carrier media

49
acclimation before the start of this study. Primary effluent (PE) was used to provide a
source of carbon for heterotrophic growth, ammonia nitrogen for autotrophic growth,
and trace amounts of synthetic organic contaminants. PE was collected weekly and
stored at 4 °C for supplying continuous feed. All PE batch test feed samples were
collected fresh from the WWTP, and used that day.
Reactor Mixing
Mixing of the reactors was done by coarse bubble aeration through a horizontal
section of pvc pipe spanning the bottom width of the reactor. Coarse bubble air was
delivered at a steady flow rate to provide constant mixing intensity in the reactors.
Mixing intensity was expressed as G (1/s), which can be calculated using Equation 3.3
(Parker 1970).
G =Q ∗ γ ∗ 𝐻!
𝜇𝑉 (eq. 3.3)
where:
G = velocity gradient (1/s)
Q= airflow rate (m3/s)
γ = water specific weight (N/m3)
HL = head loss (m) (distance from aerators to water surface)
µ = water dynamic viscosity (N*s/m2)
V= volume (m3) (working volume used for all calculations)

50
Mixing rates in the continuous reactors and in the batch experiments were
selected based upon a review of typical G values used in full-scale MBBR installations
found in Schuler and Melcer 2014.
Batch Testing
Batch tests were conducted with (aeration) rates were at G = 300/s. Batch tests
were conducted by stopping the continuous feed, rinsing the media, and adding fresh
primary effluent feed. Measurements of NH3, NO2-, and NO3
- were then taken over time.
Samples to be analyzed by the trace organics and hormone methods described below
were taken at t=0 and t=6 hours. 20 mL Samples were collected in 40 mL silanized,
amber glass vials for trace organic analysis. Samples were preserved with 1 g/L sodium
azide to prevent microbial degradation. Samples were stored on ice and shipped to the
University of Arizona where within 24h of collection where they were stored at 4°C. 1
Liter samples for hormone analysis were spiked with 100 ng of isotopically labeled
surrogate standards before extraction. Analytes were extracted in using Oasis HLB
cartridges (6 mL, 500 mg) (Waters Corporation, Milford, MA) manually at UNM.
Solid Phase Extraction
The SPE cartridges were sequentially preconditioned with 5 mL of methyl
tertiary butyl ether MTBE, 5 mL of methanol, and 5 mL of reagent water. The samples
were then loaded onto the cartridges at 10 mL/min, after which the cartridges were
rinsed with 5 mL of HPLC water and then dried with a light vacuum. Next, the analytes
were eluted with 5 mL of methanol followed by 5 mL of 10/90 (v/v) methanol/MTBE.

51
The extracts were dried and redissolved in 0.2 mL of ethyl acetate and 1.8 mL of hexane
at the University of Arizona, and the following cleanup methods. The mixed solutions
were applied to silica cartridges (6 mL, 500 mg, Waters) which had been preconditioned
with 4 mL water-saturated ethyl acetate and 4 mL hexane/ethyl acetate (90:10, v/v).
After the cartridges were rinsed with 3 mL of hexane/ethyl acetate (90:10, v/v), the
analytes were eluted with 5 mL of water-saturated ethyl acetate. The elutes were dried
and reconstituted with 1.0 mL of methanol for LC-MS/MS analysis
Biomass measurement
Prior to batch testing, 5 to 10 media pieces were taken from a given reactor, and
each piece was thoroughly cleaned by brushing using Proxabrush “Go-Betweens”
(Sunstar Americas Inc. Schaumburg, IL) which were developed for dental cleaning and
is available in U.S. drug stores. The removed biofilm was collected by rinsing with DI
water, the total suspended solids (TSS) and volatile suspended solids (VSS) in the rinse
water was measured according to Standard Methods 2540B and 2540E, respectively
(American Public Health Association et al., 2012).
The biofilm mass concentration in the reactor was calculated using Equation 3.4:
Total biofilm solids, TBS mgL
=dry mass removed from media (mg)
reactor working volume (L)×
total media piecespieces of media tested
(eq. 3.4)

52
Nitrogen
All samples for nitrogen species analysis were immediately filtered through a
0.45 µm nylon membrane syringe filter, stored at 4°C, and measured within 24 hours.
All measurements of nitrogen species were performed using Hach kits with a Hach
DR2700 spectrophotometer (Hach Company, Loveland, Colorado, USA) as follows:
NH4-N: Nitrogen-Ammonia Reagent Set, TNT, AmVer (Salicylate), High Range,
Product 2606945, NO2-N: NitriVer 3 TNT Reagent Set, Nitrogen-Nitrite, Low Range,
Product 2608345, NO3-N: NitraVer X Nitrogen-Nitrate Reagent Set, High Range,
Product 2605345. All kits were used in accordance with the manufacturer’s instructions,
except a correction for potential nitrite interference with the nitrate measurement was
started on January 6, 2014. The manufacturer’s instructions note that nitrite interference
could occur at nitrite concentrations greater than 12 mg/L. Per the manufacturer’s
instructions, this interference was removed by adding 400 mg urea to 10 mL of sample.
Nitrate concentrations measured prior to January 6, 2014, may therefore overestimate
the actual values.
pH Control
pH was measured and controlled in the range of 7.15 to 7.5 in each reactor with a
pH controller (Chemcadet Model 5652-00, Cole-Parmer, Vernon Hills, Illinois, USA)
with a combination, double-junction, gel-filled pH electrode (Model EW-59001-70,
Cole-Parmer, Vernon Hills, Illinois, USA). Acid and base solutions were 0.1 M
hydrogen chloride (HCl) and 0.7 M sodium carbonate (Na2CO3), respectively.
53
Dissolved Oxygen
DO was measured using a Hach IntelliCAL LDO101 standard
luminescent/optical DO probe with a Hach HQ440d multi-parameter meter (Hach
Company, Loveland, Colorado, USA).
Illumina Next Gen DNA Sequencing
MBBR media was thoroughly cleaned by brushing using Proxabrush
“Go-Betweens” dental brushes (Sunstar Americas Inc. Schaumburg, IL). The removed
biofilm was collected by rinsing with DI water, and excess liquid was centrifuged off to
form a pellet. The pellet was frozen and shipped to RTL Genomics, Research and
Testing Laboratory (Lubbock, TX) for DNA extraction and Illumina Next Generation
sequencing using the 357wF-785R assay and 784F [5′-RGGATTAGATACCC-3′]
and 1064R [5′-CGACRRCCATGCANCACCT-3′]) bacterial DNA primers.
Liquid Chromatography Mass Spectrometer (LC-MS) Analysis
All samples were analyzed using an automated online SPE unit coupled to a
liquid chromagraph-tandem mass spectrometer from Agilent Technologies. An Agilent
Poroshell 120 EC C-18 (2.1x50 mm, 2.7 µm) column was used for chromatographic
separation of all analytes. The column was maintained at 30˚C throughout the run. A
dual eluent mobile phase comprising of water with 0.1% acetic acid (A) and ACN with
0.1% acetic acid (B) at 350 µL/min was used for separation. For the first 4 min, the
gradient was held at 5% B while the sample was loaded onto the online SPE cartridge
and the binary pump was conditioning cartridge 2. At 4 min, the switching valve turned

54
to the ELUTE position (position 2) and solvent B was linearly increased to 100% at 11
min. This gradient was held till 12 min before returning to the initial condition at 12.5
min. A post-time of 2 min was added to allow the column to re-equilibrate before the
next analysis. This resulted in a total cycle time (extraction + analysis) of 14.5 min per
sample.
Mass spectrometry was performed on an Agilent 6460 triple quadrupole mass
spectrometer. The optimization of the mass spectrometer was divided into two: (i)
compound-specific optimization and (ii) source-dependent optimization. Details of the
optimization process have been published previously (Anumol, Merel et al., 2013). The
optimized compound parameters and retention times (RT) are shown in appendix Table
3.2 while source-dependent parameters for both ESI positive and negative modes (run
simultaneously) are shown in appendix Table 3.3.
The mass spectrometer was run in dynamic multiple reaction monitoring
(DMRM) mode with a delta RT of 0.7 minutes for each compound. Fast polarity
switching with the dielectric capillary allowed for simultaneous analysis in ESI positive
and negative in the same run. Two transitions: a quantifier (most-abundant product) and
qualifier were used for most of the compounds to increase specificity of the method.
Data acquisition and analysis was performed using Agilent MassHunter software
(version Rev B.06.00). Isotope dilution was used for quantification of all analytes
(Vanderford and Snyder 2006). RT locking and product ion ratio monitoring reduced the
possibility of false positives in the method. The method detection limits calculated in
ultra-pure water are shown in appendix Table 3.4 The limit of detection (LOD) and
method detection limits for all TORCs are provided in appendix Table 3.4. Data analysis

55
and processing was carried out using the Agilent MassHunter (v 6.00) software and all
quantification was done using the isotope dilution method (Vanderford and Snyder
2006).
Ultra-High Performance Liquid Chromatography Mass Spectrometer Analysis
(UHPLC-MS/MS)
Analysis was performed using an Agilent (Palo Alto, CA) 1290 binary pump
coupled to an Agilent 6460 Triple Quadrupole mass spectrometer. All analytes were
monitored in dynamic multiple reaction monitoring (DMRM) mode using electrospray
ionization (ESI) source. The MRM transitions and MS source parameters are provided
in appendix Table 3.2 and appendix Table 3.3
An Agilent ZORBAX Eclipse Plus C8 Rapid Resolution HD column (1200 bar,
50 × 2.1 mm, 1.8 µm particle size) was used for ER agonists (estrone, 17α-estradiol,
17β-estradiol, 17α-ethinylestradiol and bisphenol A) in ESI negative mode, while an
Agilent ZORBAX Eclipse Plus C18 Rapid Resolution HD column (1200 bar, 100 × 2.1
mm, 1.8 µm particle size) was used for analysis of other hormones in ESI positive mode.
The column was maintained at 30 °C at a flow rate of 0.4 mL/min for the entirety of the
run in both ionization modes. For ER agonists, water (A) and methanol (B) were used as
mobile phases. The gradient was as follows: 10% B increased to 40% in 0.5 min,
increased linearly to 70% in the next 6.0 min, then to 100% in 0.1 min and held for 1.0
min. A 2.5-min equilibration step at 10% B was used at the beginning of each run. For
the other hormones, water containing 0.1% (v/v) formic acid (A) and acetonitrile (B)
were used as mobile phases. The gradient was as follows: 5% B held for 1.5 min,
increased linearly to 20% in 1.5 min, to 45% in the next 1.0 min, to 65 % in the next 3.0
56
min, to 100% in the next 1.0 min and held for 1.0 min. A 1.5-min equilibration step at
5% B was used at the beginning of each run. An injection volume of 5 µl was used for
analysis of all samples.
Quantitation and Quality Control
The instrument detection limits (IDLs) were determined by the lowest standard
in calibration curve with signal to noise ratio of at least 3 (S/N > 3) and 80% accuracy.
Due to the varying IDLs from this study, a conservative lowest calibration point of 0.1
µg/L was chosen for all compounds. The remaining calibration points were at 0.2, 0.5,
1.0, 2.0, 5.0, 10, 20, 50, 100, and 200 µg/L. All concentrations that were above the
highest point in the calibration curve were diluted and re-analyzed. The method
reporting limits (MRLs) were calculated by multiplying the reciprocal of the
concentration factor (CF) of the SPE process by the concentration of the second
calibration point. The MDLs of analytes were shown in appendix Table 3.4 All analytes
were calibrated externally using linear or power regression with 1/x weighting.
Correlation coefficients were required to be at least 0.990 and typically exceeded 0.995.
Quality control samples at low, medium and high (random) concentrations as well as
were included every 10 samples to ensure the integrity of mass spectrometric analysis.
The data was then processed with MassHunter Quantitative Analysis B.04.00. At least
one lab blank and one lab fortified blank sample were carried out for every 10 samples.
Results and Discussion
57
Reactor Performance
Continuing the reactor operation from a previous study, the MBBR reactor
switched from the synthetic feed to primary clarifier effluent (PE) from the Albuquerque
SWRF on 03/06/15 to provide a source of carbon for heterotrophic growth, nitrogen for
autotrophic growth, and synthetic organic microconstituents shown in Figure 3.4 and
Figure 3.5.
The following figures (Figure 3.3A – Figure 3.3C) show nitrification
performance history (ammonia loading, effluent nitrate, and nitrite) and biomass for the
reactor used in this study approximately one year before it was switched to primary
effluent feed.

58
Figure 3.3: Reactor performance. (A) Influent ammonia, ammonia uptake, and ammonia effluent expressed as concentration (mg/L-N) (B) Effluent Nitrite and Nitrate expressed as concentrations (mg/L-N) (C) volatile suspended solid concentrations expressed as mg/L.

59
Ammonia and DOC concentrations in the primary effluent were approximately 40-50
mg NH4-N/L and 50-55 mg/L respectively. PE was supplemented with ammonia in the
continuous feed to match similar influent levels as seen at the end of the previous
experiment shown in Figure 3.3.
Influent Characteristics
Figure 3.4 shows the results of several trace organics detected in the primary
effluent on three different days spanning three months, at concentrations of 100 ng/L or
parts per trillion (PPT) to 80 ug/L or parts per billion (PPB) (this LC-MS data was
provided by the Snyder Lab at the University of Arizona).
Figure 3.4: LC-MS analysis of primary effluent from the Albuquerque Wastewater Treatment plant on 03/8/15, 04/06/15 and 06/05/15. Performed by Snyder Research Group.
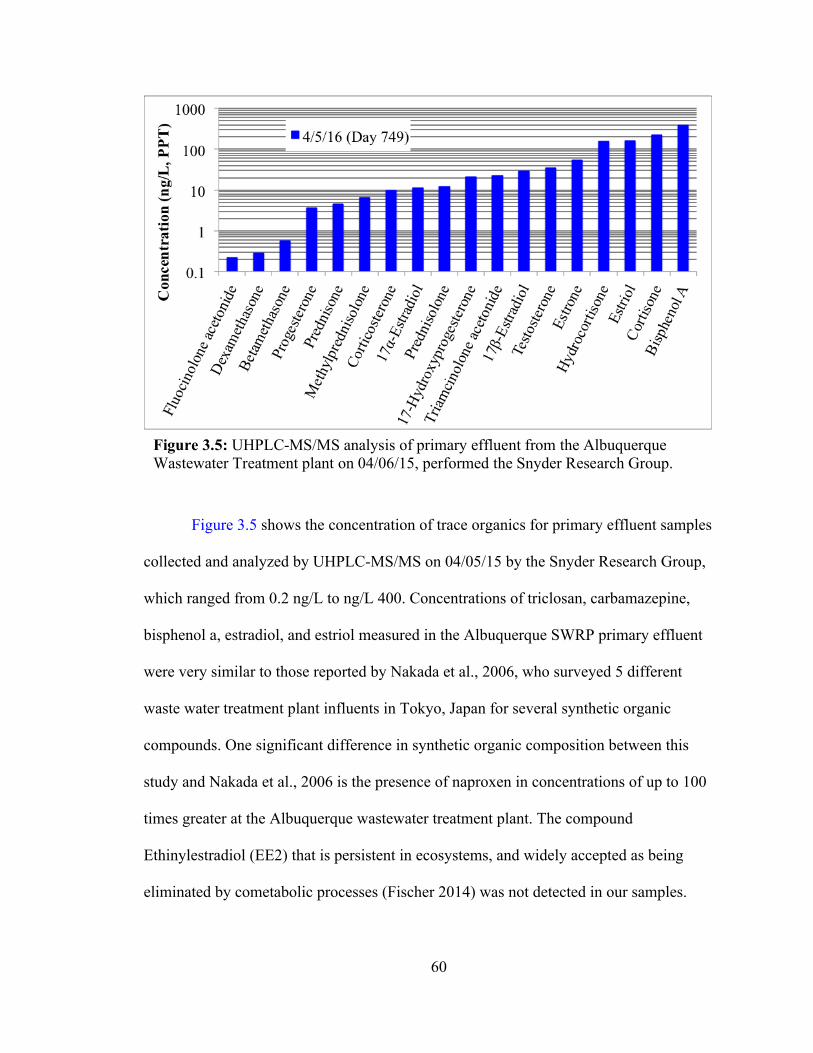
60
Figure 3.5 shows the concentration of trace organics for primary effluent samples
collected and analyzed by UHPLC-MS/MS on 04/05/15 by the Snyder Research Group,
which ranged from 0.2 ng/L to ng/L 400. Concentrations of triclosan, carbamazepine,
bisphenol a, estradiol, and estriol measured in the Albuquerque SWRP primary effluent
were very similar to those reported by Nakada et al., 2006, who surveyed 5 different
waste water treatment plant influents in Tokyo, Japan for several synthetic organic
compounds. One significant difference in synthetic organic composition between this
study and Nakada et al., 2006 is the presence of naproxen in concentrations of up to 100
times greater at the Albuquerque wastewater treatment plant. The compound
Ethinylestradiol (EE2) that is persistent in ecosystems, and widely accepted as being
eliminated by cometabolic processes (Fischer 2014) was not detected in our samples.
Figure 3.5: UHPLC-MS/MS analysis of primary effluent from the Albuquerque Wastewater Treatment plant on 04/06/15, performed the Snyder Research Group.

61
Microbial Populations
In order to better understand the microbial communities that are associated with
the removal of synthetic compounds, biomass samples were analyzed by Illumina next
generation sequencing before and after the switch to primary effluent feed. Figure 3.6
shows the results of Illumina next generation DNA for these samples.
The relative abundance of bacteria populations found in the biofilm changes in
several ways after being switched to primary effluent feed. Nitrosomonas decreases
from 15.8% at before the feed switch, to 2.7% after acclimation to primary effluent. The
reduction in Nitrosomonas is also accompanied by an increase in Comamonadaceae
from 11.9% to 26.6%. For the first time in this study, a significant abundance the family
Cryomophaceae is detected at 8.9%. Cryomophaceae has been reported by Bowman
2014 to be found in environments with rich organic carbon, making the most likely
explanation for its occurrence to be the introduction of DOC rich PE. As determine by
SDI (Figure 3.6), the overall diversity of microbial populations on the R2 media
increased by the end of phase 4 from 2.58 to 2.87.
Figure 3.6: Illumina sequencing results sorted by Family, expressed as relative abundance and Shannon Diversity Index.

62
Batch Testing AMO Inhibition
To evaluate the possible role of heterotrophic or autotrophic cometabolism of the
trace organics in primary effluent, batch tests were performed on MBBR media in AMO
inhibited conditions (heterotrophic) and in the absence of AMO (mixed
heterotrophic/autotrophic) using the AMO inhibitor allylthiourea. On 04/06/15 MBBR
media was split into 4 separate reactors containing 766 mgTSS/L and 686 mgVSS/L,
and initial concentrations of 50 mgNH4-N/L and approximately 50 mgDOC/L.
R2A,R2B,R2C, and R2D contained 0, 0.1, 0.4, and 3 mg/L ATU. Batch tests were run at
the continuous system mixing rate (G=298/s) for 6 hours to allow for the slow
degradation of recalcitrant contaminants. All four reactors were analyzed for NH4
(Figure 3.7) and NOx measurements (Data not shown, see appendix) at half hour
intervals. Reactors R2A and R2D were analyzed for trace organics and hormones at hour
1 and hour 6 (Figure 3.9 and Figure 3.10), and dissolved organic carbon at 1-hour
intervals (Figure 3.8).

63
Figure 3.7: 04/06/15 Ammonia Batch Tests
Figure 3.8: 04/06/15 Dissolved organic carbon batch test data.

64
Figure 3.7 shows that in R2A ammonia is readily being oxidized to Nitrite in the
absence of ATU and in R2D, ammonia oxidation to nitrite is completely inhibited by the
3mg/L dose of ATU. Interestingly, Figure 3.8 shows that ATU may have had a small
positive effect on the uptake of DOC. It is possible that the uptake of DOC was
enhanced by the inhibition of AOBs, eliminating competition for available oxygen use
to metabolize DOC. These results show R2A is a system mixed with heterotrophic
(DOC uptake) and autotrophic (Ammonia Oxidation) metabolisms and only
heterotrophs are active in R2D.
Of the 48 target compounds analyzed, 16 were below the detection limit, and 3
were the detection limit (Caffeine, Naproxen, Ibuprofen, >2500 ppt).

65
Trace Organics Removal
Figure 3.9 shows results for the removal of compounds analyzed by LC-MS in
the 04/06/15 batch experiments with and without inhibition. Compounds at
concentrations below the detection limit at t=0 are not included.
Of the 12 compounds successfully analyzed, 4 of the compounds (triclocarban,
trimethoprim, primidone, PFOA) were more efficiently removed by the control reactor
containing no allylthiourea (Removal in R2A was at least 10% greater than in R2B)
shown in Figure 3.9. Trimethoprim and Primidone were the only compounds shown in
this analysis to have significant removal in R2A (43%) and no removal in the reactor
where nitrification was completely inhibited. This observation is similar to Batt et al.,
Figure 3.9 04/06/15 ATU batch test results for LC-MS Analysis. Figure 3.9 shows percent removal of contaminants at time = 6 hours. See Figure 3.4 for starting concentrations.

66
2006 who observed enhanced biotransformation of trimethoprim in nitrifying activated
sludge (70% removal) when compared to AMO inhibited activated sludge (25%
removal). Interestingly, our results and Batt et al., 2006 suggest a trend in the removal of
trimethoprim during batch testing (Figure 3.9) that is contrary to what was reported by
Khunjar et al., 2011 who found that the removal of trimethoprim was not effected by
AOB inhibition in flow through AOB culture and activated sludge reactors.
Primidone has been reported by Kovalova et al., 2006 to increase in concentration in
membrane bioreactor (MBR) systems used to treat concentrated hospital wastes.
Results from this experiment suggest that nitrification may enhance the removal
of Primidone (19% removal in R2A) and overtake the rate that deconjugation occurs
resulting in apparent Primidone production as seen in the AMO inhibited system (-6%
removal in R2D).
Triclocarban is a relatively hydrophobic compound (logkow=4.9) and is well
known to readily sorb and accumulate in biosolids. The results from this experiment
may indicate that significantly more triclocarban is being removed in the uninhibited
reactor (64.5%) than in the nitrification inhibited reactor (35.5%) as in both cases
triclocarban is being absorbed to biomass in both reactors, however this suggests that
cometabolism is adding additional removal by the biodegradation of triclocarban.

67
Figure 3.10 shows results for the removal of compounds analyzed by LC-
MS/MS. Compounds with concentrations less than the detection limit at t=0 have been
omitted.
As shown in Figure 3.10, of the compounds analyzed by the LC-MS/MS, nearly
as many compounds showed negative removal as positive removal. A likely cause of
this is the occurrence of contaminants in a conjugated form, where the compound is
brought back to the unconjugated form after a biotransformation takes place. Yi et al.,
2007 reported various mechanisms for the conjugation (sulfate addition) and
hydroxylation of different forms of estrogen in wastewater. Another example of a
contaminant that is well documented to be found in a conjugated form in wastewater is
Sulfamethoxazole (Kovalova et al., 2012). Kovalova et al., measured both the
Figure 3.10: 04/06/15 batch test results for UHPLC-MS/MS. Both figures show percent removal of contaminants at time = 6 hours. See Figure 3.5 for starting concentrations.

68
conjugated form N4-acetylsulfamethoxazole before treatment with MBR, and increases
in Sulfamethoxazole after treatment resulting in negative removal. For this study, we
observed an overall removal efficiency of Sulfamethoxazole in R2A and R2B at 13.3%.
This may underestimate the actual removal efficiency of Sulfamethoxazole as it may be
produced from existing N4-acetylsulfamethoxazole at a slightly slower rate than it is
removed.
The sex hormone progesterone has been well documented by Clemens et al.,
1982 to form several glucuronide conjugates in animals during metabolism in the liver.
The results of this study are the first to suggest de-conjugation of progesterone in
wastewater treatment, by the apparent increase of progesterone after coming into contact
with both nitrifying and heterotrophic biofilms.
The results of this study shown in Figure 3.10 support previous studies done by
Shi et al., 2004, who showed that both nitrifying activated sludge, and nitrifying
inhibited systems were able to degrade esterone, 17B-estradiol, estriol, and 17a-
ethynlestradiol. This study also showed that 17B-estradiol was the most easily degraded
out of the estrogens tested, as it is readily transformed to esterone. This finding is also
consistent with our results that show nearly 100 percent degradation of 17B-estradiol in
both R2A and R2D, and may indicated that the removal of esterone is under estimated
due to this transformation.

69
To evaluate the MBBR effectiveness of removing recalcitrant trace organics
during continuous operations, a sample from the continuous feed reactor was taken on
04/06/15 before interrupting operations for batch testing.
As shown in Figures 3.10 and 3.11, compounds such as prednisolone,
prednisone, progesterone and corticosterone that were produced in the batch testing
Figure 3.11: Removal of compounds measured by UHPLC-MS/MS in the continuous system reactor feed.

70
experiments, were effectively removed in the continuous feed. A likely cause of this is
that slow processes remove these compounds over many steps. One difference between
batch testing and the continuous feed is the 6 hour batch testing time starting with
reactor liquid being replaced with fresh feed, compared to the 22.4 hour hydraulic
residence time of the continuous feed (Table 3.1). Batch testing was also conducted by
splitting up the parent reactor into individual reactors with approximately 25% of the
biomass. Enhanced removal in the continuous system may therefore be due to increased
adsorption and biodegradation from to higher solids concentrations, and more
nitrification continuous system operations. This data suggests that moving bed
bioreactors are very effective at removing the array of compounds tested in the
continuous system, however long HRTs maybe be necessary to remove more recalcitrant
organic compounds that require multiple steps to degrade.
Conclusions
The analysis of Albuquerque’s primary effluent revealed consistent
concentrations of synthetic organic compounds found in other studies of treatment plants
around the world. Several of these compounds are present but not detected in a
conjugate form. When coming into contact with biofilms, it is possible that these
compounds deconjugated to underestimate removal, or produce the parent compound in
reactor effluents. Of the compounds analyzed, triclocarban, trimethoprim, primidone,
and PFOA were more efficiently removed by the control reactor containing no
allylthiourea (Figure 3.9). This finding supports other studies that suggest trimethoprim
and Primidone degradation are cometabolic processes. Our observation of enhanced
removal for triclocarban and PFOA in nitrifying MBBR reactors is the first to suggest a

71
cometabolic degradation pathway for these compounds under these conditions.

72
Chapter 4: A Comparison of Nylon and High Density Polyethylene
Plastic Biofilm Carriers In Moving Bed Bioreactors.
Introduction
The research described in this chapter examines how biofilm attachment surface
material affects nitrification and trace organics removal from wastewater, with the
longer term goal of improving MBBR and IFAS system performance. Specifically, the
performance of biofilms grown on two plastics (nylon and high-density polyethylene, or
HPDE) were compared. Typically, moving bed bioreactor (MBBR) attachment media
are made from HDPE, which is relatively hydrophobic, while nylon is relatively
hydrophilic. Nylon also contains amine groups in its chemical structure where HPDE
does not, which may encourage attachment of desired bacterial groups.
Background
Nitrification
Nitrification is a 2 step biological process shown in equations 4.1 and 4.2.
2𝑁𝐻!! + 3𝑂! → 2𝑁𝑂! + 4𝐻! + 2𝐻!𝑂 (eq. 4.1)
2𝑁𝑂!! + 𝑂! → 2𝑁𝑂!! (eq. 4.2)
The first step is the oxidation of ammonia to nitrite by the ammonia oxidizing
bacteria (AOB) such as Nitrosomonas under aerobic conditions (Kowalchuk et al., 2001)
The second step of nitrification is the aerobic oxidation of nitrite to nitrate by nitrite
oxidizing bacteria (NOB), including the genus Nitrobacter (Kowalchuk et al., 2001).
AOB and NOB obtain energy from by coupling oxygen reduction with ammonia and
nitrite oxidation, respectively. Autotrophic nitrifiers use this energy to convert CO2 to

73
cellular carbon (Metcalf and Eddy 2003). Recently, several other groups of bacteria,
such as xanthamondacia, springamonadacia, pseudomonas stutzeri yzn-001, and
Alcaligenes faecalis have been reported to oxidize ammonia by an unknown
heterotrophic pathway (Fitzgerald et al., 2015, Jo et al., 2005, Zhang et al., 2011) to
Trace organics
Microconstituents in wastewater effluents consist of pharmaceuticals, personal
care products, industrial chemicals, and synthetic hormones found in very small
concentrations (Ternes et al., 1998; Paxeus et al., 2004). This class of contaminants is
receiving increasing attention due the ability to persist in the environment, disrupt
ecosystem health (Kolpin et al., 2002). By mimicking and disrupting natural endocrine
systems, trace organics may impair immune systems, lead to feminization of aquatic
organisms, and interfere with reproduction. Removing trace organics is particularly
important in arid regions where water scarcity and direct/indirect reuse is becoming
more prevalent. Advanced physiochemical processes are effective at removing trace
organics, however costly due to excessive energy consumption. With constraints on
energy usage and carbon footprint, biological treatment of trace organics is of interest
due to cost effectiveness and benefits to downstream physiochemical processes.
Engineering biofilms to enhance microconstituent removal may be achieved by
designing surfaces where chemical and physical properties of the attachment surface
enrich a biofilm that is more capable of removing such compounds. Targeting specific
biofilm populations for attachment to a system, and altering biofilm morphology will be
74
examined in this study to possibly improve microconstituent removal with out increase
space or energy requirements.
Surface Chemistry
Attachment surface energy is well known to effect bacterial attachment and
adhesion (Van Loosdrecht et al., 1990). Some microorganisms have been shown to have
attachment preferences to surfaces of different chemistries in studies utilizing self
assembling monolayers (SAMs) (Ista et al., 2004, 2010; Khan et al., 2011). These
studies used self assembling monolayers (SAM) to vary the surface energy and
functional groups of an attachment surface. The driving force for cell attachment to a
surface has been suggested by Ista et al., 2004 to be the surface tension between the cell
and a surface, making selection of material for a attachment surface important for
engineering biofilm functionality. Kahn et al., 2011 found that ammonia oxidizing pure
cultures of Nitrosomonas europaea and Nitrospira multiformis had higher rates of
adhesion on SAMs with higher surface energies than did the heterotroph Escherichia
coli. Khan et al., 2013 found a positive correlation between attached biomass and
attachment to plastics with a range of surface energy values incubated in a full scale
activated sludge system. These authors also found a general positive correlation between
surface energy, ammonia uptake, and estrogen removal expressed as a rate specific to
the amount of biomass. This may indicate that AOB populations preferred and occurred
in greater relative abundance on the higher surface energy plastics that may be used to
produce biofilms with improved estrogen removal capabilities. Nylon, the alternative
plastic used in this study contains amine groups in its chemical structure where HPDE
75
does not. Lackner et al., 2009 showed that self assembled monolayers modified with
amine groups effectively increased biofilm attachment to the surface.
Hypothesis
The hypothesis for this study is that nutrient and trace organics removal from
wastewater can be improved by altering the chemistry of the biofilm attachment
surfaces. Surface chemistry of plastic biofilm carriers used in IFAS and MBBR systems
determines adhesion, attachment strength, and detachment of microbial populations that
effect system functionality. Attachment surface chemistry may be exploited to engineer
biofilms for the removal of synthetic organic contaminants through biodegradation
and/or adsorption.
Objectives
The objective of this study was to compare two different MBBR plastic materials
for nitrification performance, organic microconstituent removal performance, and
determine the effects of plastic type on biofilm quantity.
Methods
Reactor Design
Specifications of the continuous systems are listed in Table 4.1, and a schematic
is shown in Figure 4.1. Conical shaped reactors (Imhoff cones) were used to facilitate
keeping nylon media in suspension, as described below.

76
Table 4.1 Reactor Specifications Parameter Nylon HDPE Reactors
Total volume (including headspace) (L) 1.6 1.6 Working volume (liquid + media) (L) 1.15 1.15 Liquid volume (L) 0.93 0.95 Flow rate (L/d) 0.7 0.7 HRT based on working volume (hour) 27.4 27.4 HRT based on liquid volume (hour) 22.14 22.62
Media Media specific surface area (m2/m3) 472 472 Media fill volume (percent) 15 15 Media area in reactor (m2) 0.0404 0.0404 Media area/working volume (m2/m3) 35.1 35.1 Water Contact Angel (Degrees) (Kahn et al., 2013) 51 - 55 89-91 Surface Energy γtotal (mj/m2) (Kahn et al., 2013) 47.9 - 49.9 29.6 - 31.2
Controls Aeration and mixing method Coarse bubble Target mixing rate (G) (-/sec) 700
Dissolved oxygen concentration (mg/L) >6.5 mg/L (measured but not controlled)
pH control range 7.15–7.50 Temperature (°C) 21

77
Effluent Influent (synthetic feed)
pH probe, acid/base controller
Glass tube (aerator)
Plastic Screen (preventing media from settling)
Figure 4.1: MBBR system schematic
Glass Imhoff Cone Reactor

78
Reactor Feed
The reactors were continuously fed a synthetic wastewater containing ammonia,
and zero organic carbon with the goal of producing a highly active nitrifying biofilm for
batch testing. Table 4.2 shows the composition of the synthetic feed.
Table 4.2. Synthetic Feed (based on Hem et al., 1994)
Chemical Concentration (mg/L)
NH4Cl Variable
KH2PO4 100
NaHCO3 350
FeSO4-7H2O 5
CaCl2 16 MgSO4-7H2O 40 CuSO4-5H2O 0.12
NaMoO4 0.0019 EDTA 6.6
Ammonium chloride was the sole source of nitrogen in the feed, and its
concentration was periodically adjusted with the goal of maintaining a target effluent
ammonia concentration between 5 and 5 and 20 mg N/L (actual effluent ammonia varied
considerably with reactor performance). This ammonia residual aimed to prevent
limiting biofilm activity without creating an excess of ammonia that could inhibit
nitrification. Influent ammonia feed concentrations varied from initial concentrations of
10 mg N/L early in reactor biofilm development to approximately 50 mg N/L once the
biofilm was fully matured.

79
Reactor Mixing
Unlike HDPE, the nylon media was denser than water so it required a strong
upward flow to stay in suspension. In order to address this, reactor geometry was
changed from the rectangular prism type reactor used in previous experiments, to an
inverted cone design using a glass Imhoff cone (Figure 4.1) where aeration was
delivered from the narrow bottom of the reactor, providing strong upward flow and
preventing Nylon media from settling. Mixing of the reactors was done by coarse bubble
aeration, delivered by the glass tube shown in Figure 4.1. A screen was placed at the
bottom of the cone shaped reactor to prevent any media from settling below the aerator.
Coarse bubble air was delivered at a steady flow rate to provide constant mixing
intensity in the reactors. Mixing intensity can be expressed as the velocity gradient G
(1/s), which can be calculated using Equation 4.3 (Parker 1970).
G =Q ∗ γ ∗ 𝐻!
𝜇𝑉 (eq. 4.3)
Where:
G = velocity gradient (1/s)
Q= airflow rate (m3/s)
γ = Water specific weight (N/m3)
HL = head loss (m) (distance from aerators to water surface)
µ = water dynamic viscosity (N*s/m2)

80
V= volume (m3) (working volume used for all calculations)
The mixing rate was set to G = 700/s in this study. This was higher than typical
in full-scale systems G = 180/s to 389/s; (Melcer and Schuler 2014), as this was found to
be necessary to keep the nylon media in suspension.
Batch Testing
Batch tests to determine removal of trace organics were conducted as follows.
Reactor continuous feed was stopped and the liquid phase was removed, and filtered
through a 1um glass filter. The plastic media was set aside and the glass cone container
was scrubbed with a brush to remove any biofilm and rinsed with DI. The filtered liquid
phase was dosed with ammonia, and triclosan or caffeine to be used in the batch test.
Caffeine was tested at concentrations of 80-200 mg/L and triclosan was tested at
concentrations of 100 ug/L. For some experiments, 100 mL samples were taken of the
liquid before adding back the biofilm, and in all experiments samples were taken at 1
minute and at 60 minutes after adding the media. These samples were used for
measurements of trace organics. 5 mL samples were filtered for measurements of NH3,
NO2-, and NO3
- at the 1 minute and 60 minute sampling times.

81
Nitrogen
Ammonia
All samples for nitrogen species analysis were immediately filtered through a
0.45 µm nylon membrane syringe filter, and stored at -20°C. All measurements of
ammonia as nitrogen were performed using Hach kits with a Hach DR2700
spectrophotometer (Hach Company, Loveland, Colorado, USA) as follows: NH4-N:
Nitrogen-Ammonia Reagent Set, TNT, AmVer (Salicylate), High Range, Product
2606945. All kits were used in accordance with the manufacturer’s instructions.
NOx
All samples for nitrogen species analysis were immediately filtered through a
0.45 µm nylon membrane syringe filter, and stored at -20°C. All measurements of
ammonia as nitrogen were performed using Hach kits with a Hach DR2700
spectrophotometer (Hach Company, Loveland, Colorado, USA) as follows: NH4-N:
Nitrogen-Ammonia Reagent Set, TNT, AmVer (Salicylate), High Range, Product
2606945. All kits were used in accordance with the manufacturer’s instructions.
All samples for nitrogen species analysis were immediately filtered through a
0.45 µm nylon membrane syringe filter, and stored at -20°C. All measurements of
ammonia as nitrogen were performed using a Thermo Scientific Ion Chromatography
System (ICS-1100) with an auto sampler. The column was a Thermo Scientific Dionex
IonPa AS9-HC, with a Dionex AERS 500 4 mm suppressor set at current of 45 uS. The
eluent was 9mM Sodium Carbonate set at flow rate through the column at 1ml/min.
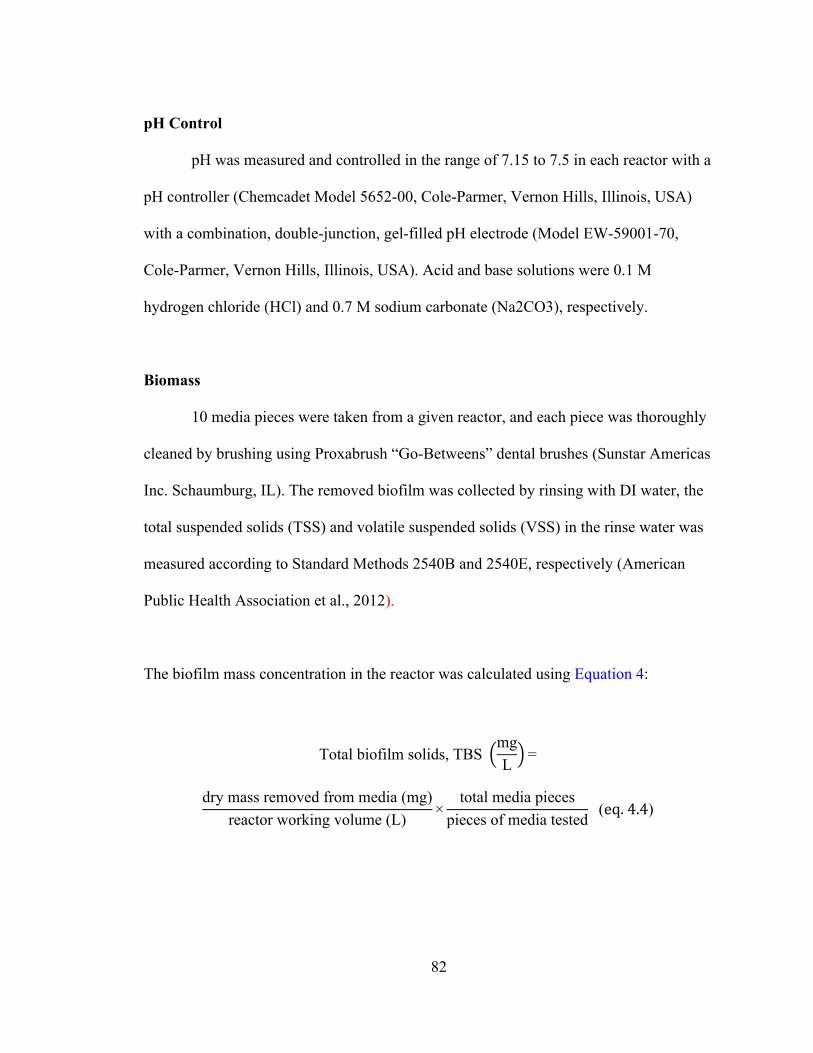
82
pH Control
pH was measured and controlled in the range of 7.15 to 7.5 in each reactor with a
pH controller (Chemcadet Model 5652-00, Cole-Parmer, Vernon Hills, Illinois, USA)
with a combination, double-junction, gel-filled pH electrode (Model EW-59001-70,
Cole-Parmer, Vernon Hills, Illinois, USA). Acid and base solutions were 0.1 M
hydrogen chloride (HCl) and 0.7 M sodium carbonate (Na2CO3), respectively.
Biomass
10 media pieces were taken from a given reactor, and each piece was thoroughly
cleaned by brushing using Proxabrush “Go-Betweens” dental brushes (Sunstar Americas
Inc. Schaumburg, IL). The removed biofilm was collected by rinsing with DI water, the
total suspended solids (TSS) and volatile suspended solids (VSS) in the rinse water was
measured according to Standard Methods 2540B and 2540E, respectively (American
Public Health Association et al., 2012).
The biofilm mass concentration in the reactor was calculated using Equation 4:
Total biofilm solids, TBS mgL
=
dry mass removed from media (mg)reactor working volume (L)
×total media pieces
pieces of media tested (eq. 4.4)

83
Illumina DNA Sequencing
20 media pieces were taken from a given reactor, and each piece was thoroughly
cleaned by brushing using Proxabrush “Go-Betweens” dental brushes (Sunstar Americas
Inc. Schaumburg, IL). The removed biofilm was collected by rinsing with DI water, and
excess liquid was centrifuged off to form a pellet. The pellet was frozen and shipped to
RTL Genomics, Research and Testing Laboratory (Lubbock, TX) for DNA extraction
and Illumina Next Generation sequencing using the 357wF-785R assay and 784F [5′-
RGGATTAGATACCC-3′] and 1064R [5′-CGACRRCCATGCANCACCT-3′])
bacterial DNA primers.
Trace organics
Triclosan, ibuprofen, and caffeine were measured by solid phase extraction
(SPE) followed by analysis on high performance liquid chromatography (HPLC) at
UNM. SPE was done using Oasis HLB cartridges, 3 mL, 40 mg; Waters Corporation,
Millford, MA) according to the manufacturers instructions. They were sequentially
preconditioned with 6 mL of methanol, and 6mL of reagent water acidified to pH 2 with
HCL. The samples were acidified to pH 2, and were then loaded onto the cartridges at a
max flow rate of 10 mL/min. After loading the 100mL samples, cartridges were rinsed
with 5 mL of water acidified to pH 2 and then dried with a light vacuum. Next, the
analytes were eluted from the cartridge with 5 mL of methanol, and reconstituted with
5mL of reagent water.
Hewlett-Packard, HP 1100 was used for measurement triclosan, ibuprofen, and
caffeine. The system consisted of a degasser, a quaternary pump, an ALS auto-sampler,

84
thermostat, and a variable wavelength UV-vis detector. A Waters Xterra C18 15mm
column with vanguard guard cartridge was used for separation.
Caffeine, ibuprofen, and caffeine were purchased from Sigma Aldrich. Naproxen
catalog number: M1275-5G, ibuprofen Catalog Number: I110-1G triclosan, Catalog
Number: PHR1338-1G and dissolved into stock solutions of HPLC grade 1:1
methanol:water.
For triclosan and ibuprofen, the HPLC carrier eluent was a 20:80 A:B mixture of
A) 1% trifluoroacetic acid, 99% HPLC grade water and B) 50:50: methanol:water. For
caffeine the eluent mixture was 60:40 A:B A) methanol, B) HPLC grade water. Flow
through the column was 0.2 mL/min at a run time of 30 minutes. The UV detector was
set to 210nm.
Solid Phase Extraction
The SPE cartridges (Oasis HLB cartridges (3 mL, 40 mg) (Waters Corporation,
Milford, MA) were sequentially preconditioned with 6 mL of methanol, and 6mL of
reagent water acidified to pH two with HCL. The samples were acidified to pH two, and
were then loaded onto the cartridges at a max flow rate of 10 mL/min. After loading the
100mL samples, cartridges were rinsed with 5 mL of water acidified to pH 2 and then
dried with a light vacuum. Next, the analytes were eluted from the cartridge with 5 mL
of methanol, and reconstituted with 5mL of reagent water.

85
Results and Discussion
Startup and Operations, Experiment 1
Figure 4.2 shows the HDPE and nylon reactor startup performance over a two-
month period.
Both reactors exhibited similar performance over a two month period in terms of
ammonia uptake and NOx production (Figure 4.2). However, by the end of this study the
nylon media had much less attached biomass (48 mgVBS/L) than did the HDPE reactor
((147mgVBS/L). This indicated that that the nylon reactor had a higher rate maximum
specific to the amount of biofilm present (2000mgN/gVBS*d) than did the HDPE
reactor (687mgN/gVBS*d). These rates are greater than those reported by Melcer and
Schuler 2014, who found maximum specific rates of nitrifying biofilms at 247
Figure 4.2 Nylon and HDPE reactor performance: Effluent ammonia, ammonia uptake, effluent nitrate and nitrite (mg/L-N), and biomass (mg/L)

86
mgN/gVBS*d in lab scale reactors using commercially available MBBR media.
Towards the end of the two month period, nitrite concentrations were higher than in the
HDPE reactor, indicating less NOB activity relative to AOB activity in the nylon reactor
in the nylon reactor as compared to the HDPE reactor.
Biofilm Microbial Populations
After nearly 2 months of reactor operation, the biofilm samples were analyzed by
Illumina next generation sequencing to characterize the microbial communities
associated with each plastic type. Figure 4.3 shows Illumina DNA sequencing at the
family taxonomic level, expresses relative abundance (percent of total operational
taxonomic units, or OTUs, detected).
These results indicate large differences in community structures of the two
biofilms. The calculated Shannon Diversity Index for the nylon biofilm population was
Figure 4.3: Nylon Vs HDPE Illumina sequencing results sorted by Family, expressed as relative abundance.

87
slightly lower than the HDPE biofilm (SDI = 2.38, 3.08 respectively), indicating a
somewhat less diverse population on the nylon media. The dominant family on the nylon
biofilm Rhizobiacae, (34.3%), while this group was much lower on the HDPE (1.37%).
Bacteria from the family Rhizobiacae were reported by Sasaki et al., 2007 as an
ammonia assimilating microorganism isolated from biological ammonia removal
systems receiving livestock wastewater. The family Nitrosomonadaceae, which are
well-known AOB (Kowalchuk et al., 2001), was also found in greater abundance on the
nylon carrier (3.77%) than on HDPE (0.56%). Although the total amount of biofilm was
less on the nylon plastic, a difference in performance is not observed because the nylon
biofilm is more concentrated in AOB type organisms. In studies conducted by Fitzgerald
et al., 2015, the family Xanthomonadaceae was found to be involved with heterotrophic
ammonia oxidation under low dissolved oxygen conditions (<0.3mg.L) On the HDPE
media, where the biofilm by has a higher relative abundance of Xanthomonadaceae
compared to Nylon (12.9% and 1.4% respectively), the thicker HDPE biofilm may have
decreased dissolved oxygen deep inside the biofilm, facilitating the growth of this
heterotrophic AOB organism.
At a higher taxonomic level, the order Rhizobiales comprised the majority of the
nylon attached biomass accounting for 57.7%, and was only 26.2% on the HDPE
attached biofilm. In addition to this the nylon reactor biofilm also has a higher
concentration of s (8.5%) than found on HDPE (4.9%) This is important to note, as it
has been determined by Esplugas et al., 2013 that Rhizobiales along with
burkholderiales are important organisms associated with the removal sulfamethoxazole,
as the sole carbon source in sequencing batch biofilm reactors. Sulfamethoxazole is a

88
synthetic organic chemical that functions as an antibiotic to treat bacterial infection, and
is also commonly found in trace amounts in influents to wastewater treatment plants.
The organisms belonging to proteobacteria that are more abundant on nylon media and
able to metabolize Sulfamethoxazole, may also have the potential to remove a wider
variety of other common synthetic organics found in wastewater.
Startup and Operations, Experiment 2
After the experiment described above, fresh media were reinoculated in both
reactors. This was done in part because approximately 30 percent of the media in each
reactor had been sacrificed for biomass and Illumina sequencing measurements. A new
set of reactors were again inoculated, and started up in with the same operating
parameters listed Table 4.1 and configuration listed in Figure 4.1. The primary objective
of this second experimental run was to evaluate the ability of nitrifying biofilms grown
on different plastics to remove organic microconstituents commonly found in
wastewater. Figure 4.4 shows the startup nitrification performance of these reactors.

89
Influent ammonia to the continuous system was held at a concentration of
25mg/L during for batch test dates shown in Figure 4.4 in order to ensure complete and
equal conversion of ammonia to nitrate in both reactors.
Triclosan and Caffeine Batch Tests
In all batch test experiments conducted, sampled were extracted and measured
for organic microconstituents 1 minute after dosing and 61 minutes after dosing. This
information allows us to calculate an hourly removal rate for each chemical following
the rapid initial removal due to adsorption. Figure 4.5 shows the results of this test.
Figure 4.4: Nylon and HDPE reactor performance: Effluent ammonia, ammonia uptake, effluent nitrate and nitrite (mg/L-N) and batch test dates.

90
As shown in Figure 4.5 when compared to HDPE, the nylon biofilm was able to
remove more caffeine in the 200ug/L dose and triclosan in both 100ug/L dose batch
tests. In the less concentrated 80ug/L caffeine test, and the 500ug/L ibuprofen test both
the nylon and HDPE attached biofilms did not remove significant amounts of caffeine in
the one hour following the rapid initial removal.
Figure 4.6 shows the nylon and HDPE biofilm reactor batch test concentrations
and removal efficiency of triclosan in both short and long term time periods by
measuring concentration before the biofilm is added (t=0), immediately after the
addition of the biofilm to the liquid (t=1 min) and at 61 minutes following the dose.
Figure 4.5: Hourly removal rates calculated for Caffiene doses of 200 and 80ug/L, Triclosan doses of 100 ug/L and Ibuprofen dose of 500ug/L. (*Test was calculated based on 2 hour sample)

91
As shown in Figure 4.6, the nylon reactor removed a greater percentage of
triclosan than did the HDPE reactor both at 1 minute (6% and 16%, respectively) and at
61 minutes (77% and 55%, respectively). The rate of removal was more rapid during the
first minute (Nylon average 1252 mg/L*min, HDPE average 800 mg/L*min) than it was
during minutes 1 to 61 (Nylon average 41 mg/L*hr, HDPE average 31.3 mg/L*hr) a
decreasing rate of removal is consistent with first order kinetics.
In order to discern between adsorption/biotransformation of the organic
microconstituent to the biofilm, and adsorption to the plastic, a batch tests containing a
similar triclosan dose were conducted on the nylon and HDPE media with and without
biofilms attached. Figure 4.7 shows the results this batch test in terms of concentration
and percent removal following a 100ug/L dose of triclosan before the biofilm is added
(t=0), immediately after the addition of the biofilm to the liquid (t=1 min) and at 61
minutes following the dose.
Figure 4.6: Nylon and HDPE biofilm reactor batch test concentrations and removal efficiency of triclosan at t = 0, 1 and 61 minutes
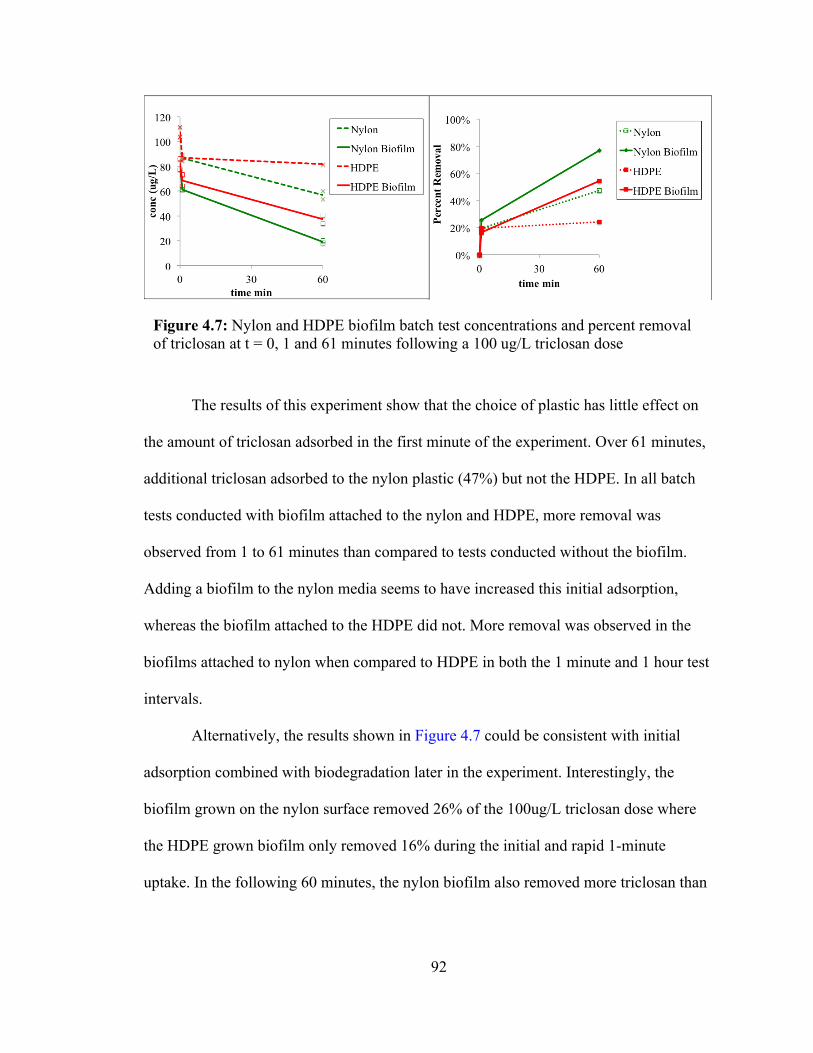
92
The results of this experiment show that the choice of plastic has little effect on
the amount of triclosan adsorbed in the first minute of the experiment. Over 61 minutes,
additional triclosan adsorbed to the nylon plastic (47%) but not the HDPE. In all batch
tests conducted with biofilm attached to the nylon and HDPE, more removal was
observed from 1 to 61 minutes than compared to tests conducted without the biofilm.
Adding a biofilm to the nylon media seems to have increased this initial adsorption,
whereas the biofilm attached to the HDPE did not. More removal was observed in the
biofilms attached to nylon when compared to HDPE in both the 1 minute and 1 hour test
intervals.
Alternatively, the results shown in Figure 4.7 could be consistent with initial
adsorption combined with biodegradation later in the experiment. Interestingly, the
biofilm grown on the nylon surface removed 26% of the 100ug/L triclosan dose where
the HDPE grown biofilm only removed 16% during the initial and rapid 1-minute
uptake. In the following 60 minutes, the nylon biofilm also removed more triclosan than
Figure 4.7: Nylon and HDPE biofilm batch test concentrations and percent removal of triclosan at t = 0, 1 and 61 minutes following a 100 ug/L triclosan dose
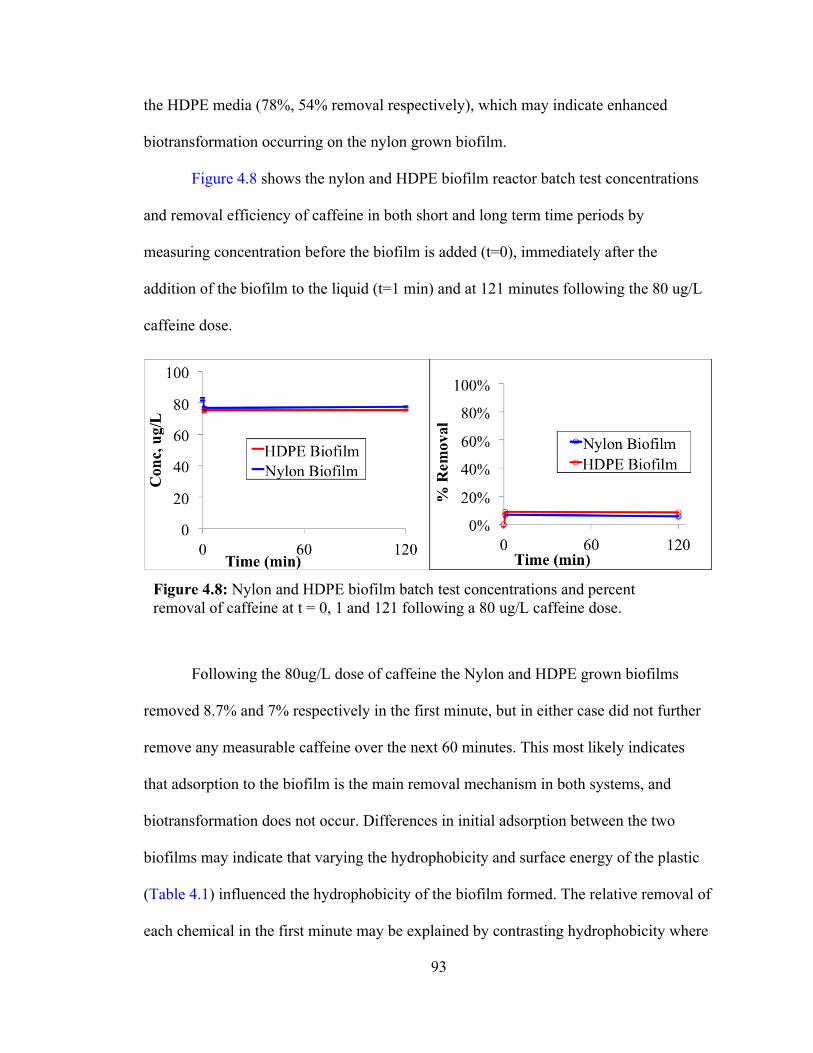
93
the HDPE media (78%, 54% removal respectively), which may indicate enhanced
biotransformation occurring on the nylon grown biofilm.
Figure 4.8 shows the nylon and HDPE biofilm reactor batch test concentrations
and removal efficiency of caffeine in both short and long term time periods by
measuring concentration before the biofilm is added (t=0), immediately after the
addition of the biofilm to the liquid (t=1 min) and at 121 minutes following the 80 ug/L
caffeine dose.
Following the 80ug/L dose of caffeine the Nylon and HDPE grown biofilms
removed 8.7% and 7% respectively in the first minute, but in either case did not further
remove any measurable caffeine over the next 60 minutes. This most likely indicates
that adsorption to the biofilm is the main removal mechanism in both systems, and
biotransformation does not occur. Differences in initial adsorption between the two
biofilms may indicate that varying the hydrophobicity and surface energy of the plastic
(Table 4.1) influenced the hydrophobicity of the biofilm formed. The relative removal of
each chemical in the first minute may be explained by contrasting hydrophobicity where
Figure 4.8: Nylon and HDPE biofilm batch test concentrations and percent removal of caffeine at t = 0, 1 and 121 following a 80 ug/L caffeine dose. triclosan dose or 80ug/L caffeine dose

94
triclosan is more hydrophobic (log Kow 4.76) and caffeine is more hydrophilic (log Kow
0.091).
This data supports the idea that using nylon plastic as an attachment surface may
facilitate and enhances the removal of organic microconstituents. A reasonable
explanation for this may be that the nylon plastic alone adsorbs more of the contaminant,
making it more available to the biofilm that is growing on the surface to remove by
further adsorption and biotransformation. Another explanation may be that the nylon
plastic with greater surface energy selected for microorganism better suited to remove
organic microconstituents through metabolism (discussed above).
Conclusions
After successfully starting up nitrifying biofilms grown on either nylon or HDPE
plastic, it was determined that neither plastic benefited overall nitrification performance.
Despite no differences in overall performances, when compared to the HDPE biofilm
the nylon plastic media formed a thinner biofilm that was more active on a specific rate.
The nylon biofilm was slightly less diverse with a higher concentration of nitrifiers and
potential organic microconstituent metabolizers. A likely explanation for this is the
differences in hydrophobicity between the two plastic types. Batch testing results
indicated enhanced removals rates in the biofilms attached to nylon for caffeine in the
larger dose (200ug/L), and all triclosan tests. No removal in either reactor was observed
for caffeine in the smaller dose (80ug/L), and ibuprofen.

95
Chapter 5 Conclusions
1) Following nitrification reactor startup of commercially available MBBR/IFAS
media designed with contrasting geometries, system performance and microbial
communities varied greatly in the resulting biofilms. Media geometry likely influenced
internal fluid dynamics within each type of plastic biofilm carrier. The open media
produced a thinner biofilm with a low abundance of the known AOB Nitrosomonas,
while the sheltered design produced a thicker biofilm rich in Nitrosomonas. Batch
testing each media type at various mixing rates indicates that nitrification performance
in the more protected media benefits from increasing mixing, where the open R1 media
does not. Decreasing temperature from 21 to 10.5 degrees Celsius in R1 resulted in the
eventual failure of the media to retain its biomass. Although nitrification performance
was decreased, sloughing was not observed in the sheltered R2 media design and may
suggest that decreasing temperature makes a biofilm more susceptible to mixing induced
shear. Following the drop in temperature the R2 media decreased in overall diversity, all
but eliminating the AOB Nitrosomonas while largely favoring the family
Xanthomonadaceae. Xanthomonadaceae is known for heterotrophic nitrification by an
unknown pathway and its occurrence explain the disappearance of the known AOBs
with only a modest decrease in nitrification performance. After increasing the
temperature back to 21 degrees, the R2 biofilm diversity and microbial family relative
abundance returned to similar level to before the temperature decrease. Media geometry
likely influenced internal fluid dynamics within the plastic biofilm carrier.
2) The analysis of Albuquerque’s primary effluent revealed consistent
concentrations of synthetic organic compounds found in other studies of treatment plants

96
around the world. Several of these compounds are present but not detected in a
conjugate form. When coming into contact with biofilms, it is possible that these
compounds deconjugated to underestimate removal, or produce the parent compound in
reactor effluents. Of the compounds analyzed, triclocarban, trimethoprim, primidone,
and PFOA were more efficiently removed by the control reactor containing no
allylthiourea (Figure 4.11). This finding supports other studies that suggest trimethoprim
and Primidone degradation are cometabolic processes. Our observation of enhanced
removal for triclocarban and PFOA in nitrifying MBBR reactors is the first to suggest a
cometabolic degradation pathway for these compounds under these conditions.
3) After successfully starting up nitrifying biofilms grown on either nylon or
HDPE plastic, it was determined that neither plastic benefited overall nitrification
performance. Despite no differences in overall performances, when compared to the
HDPE biofilm the nylon plastic media formed a thinner biofilm that was more active on
a specific rate. The nylon biofilm was slightly less diverse with a higher concentration of
nitrifiers and potential organic microconstituent metabolizers. A likely explanation for
this is the differences in hydrophobicity between the two plastic types. Batch testing
results indicated enhanced removals rates in the biofilms attached to nylon for caffeine
in the larger dose (200ug/L), and all triclosan tests. No removal in either reactor was
observed for caffeine in the smaller dose (80ug/L), and ibuprofen.

97
Chapter 6 References
Allen, Welch, Prebyl, Baker, Meyers, Sayler, (2004). Analysis and glycosyl composition
of the exopolysaccharide isolated from the floc-forming wastewater bacterium
Thauera sp. MZ1T. Environmental. Microbiology. 6, 780–790.
Anthonisen, A.C., Loehr R.C., Prakasam T.B., Srinath, E.G., (1976). Inhibition of
nitrification by ammonia and nitrous acid. Journal of the Water Pollution Control
Federation 48(5):835–852
Anumol, T., Merel, S., (2013). Ultra high performance liquid chromatography tandem
mass spectrometry for rapid analysis of trace organic contaminants in water.
Chemistry Central Journal 7(1): 104.
Batt, A., Kim, S., Aga, D. (2006). Enhanced Biodegradation of Iopromide and
Trimethoprim in Nitrifying Activated Sludge. Environ. Sci. Technol. 2006, 40,
7367-7373.
Bill, K.A., Bott, C.B. and Murthy, S.N., (2010). Evaluation of sulfide-driven autotrophic
denitrification in a moving bed biofilm reactor, Water Environment Federation,
Proceedings of the Water Environment Federation Annual Conference
(WEFTEC), New Orleans.
Chandran, K. and Love, N.G., (2008). Physiological state, growth mode, and oxidative
stress play a role in Cd(II)-mediated inhibition of Nitrosomonas europaea 19718.
Applied and Environmental Microbiology 74(8), 2447-2453.
Clemens, J., Estergreen, V. (1982). Metabolism and conjugation of [4-14C]progesterone
by bovine liver and adipose tissues, in vitro. Steroids 40(3) (1982) 287-306
Cydzik-Kwiatkowska, Agnieszka (2015). Bacterial structure of aerobic granules is
determined by aeration mode and nitrogen load in the reactor cycle. Bioresource
Technology 181, 312–320
98
De Beer, D., Stoodley, P., & Lewandowski, Z. (1996). Liquid flow and mass transfer in
heterogeneous biofilms. Water Research, 30(11), 2761}2765.
Fischer, Majewsky (2014). Cometabolic degradation of organic wastewater
micropollutants by activated sludge and sludge-inherent microorganisms.
Applications in Microbiology Biotechnology 98 6583–6597
Fitzgerald, Camejo, Oshlag, Noguera (2015) Ammonia-oxidizing microbial
communities in reactors with efficient nitrification at low-dissolved oxygen
water research 70 38-51
Halling-Sørensen B., Nors Nielsen S., Lanzky P.F., Ingerslev F., Holten Lützøft H.C.
and Jørgensen S.E. (1998). Occurrence, fate and effects of pharmaceutical
substances in the environment – a review. Chemosphere., 36, 357-393
Ista, L.K., Callow, M.E., Finlay, J.A., Coleman, S.E., Nolasco, A.C., Simons, R.H.,
Callow, J.A., Lopez, G.P., (2004). Effect of substratum surface chemistry and
surface energy on attachment of marine bacteria and algal spores. Applied and
Environmental Microbiology 70 (7), 4151-4157.
Jia, A., Escher, B. I., Leusch, F. D. L., Tang, J. Y. M., Prochazka, E., Dong, B., Snyder,
S. A. (2015). In vitro bioassays to evaluate complex chemical mixtures in
recycled water. Water Research, 80, 1-11.
Juliastuti, S.R., Baeyens, J. and Creemers, C., (2003). Inhibition of nitrification by heavy
metals and organic compounds: The ISO 9509 test. Environmental Engineering
Science 20(2), 79-90.
Kim, H., Gunsch, C.K., Geller, J.L., Boltz, J.P., Freudenberg, R.G. and Schuler, A.J.,
(2010). Shelter from the storm: Integrated fixed film activated sludge protects
nitrifiers from toxic upsets. Proceedings of Water Environment Federation
Annual Conference (WEFTEC), New Orleans.
Khan M., Chapman T., Cochran K., Schuler A., (2013). Attachment surface energy
effects on nitrification and estrogen removal rates by biofilms for improved

99
wastewater treatment. Water Research 47 2190-2198
Khan, M., Ista, L.K., Lopez, G.P., Schuler, A.J., (2011). Experimental and theoretical
examination of surface energy and adhesion of nitrifying and heterotrophic
bacteria using self-assembled monolayers. Environmental Science and
Technology 45 (3), 1055-1060.
Khunjar, W.O., Mackintosh, S.A., Skotnicka-Pitak, J., Baik, S., Aga, D.S., Love, N.G.,
(2011). Elucidating the relative roles of ammonia oxidizing and heterotrophic
bacteria during the biotransformation of 17 alpha-ethinylestradiol and
trimethoprim. Environmental Science and Technology 45 (8), 3605-3612.
Lackner, S., Holmberg, M., Terada, A., Kingshott, P., Smets, B.F., (2009). Enhancing
the formation and shear resistance of nitrifying biofilms on membranes by
surface modification. Water Research 43 (14), 3469-3478.
Lozano, N., Rice, C., Ramirez, M., Torrents, A. (2013) Fate of Triclocarban, Triclosan
and Methyltriclosan during wastewater and biosolids treatment processes. Water
Research 47 4519-4527
Metcalf and Eddy. (2003). Wastewater Engineering Treatment and Reuse. Forth Edition.
Ngoc, Urase, Ngo, Hu, Ogn, (2013). Insight into metabolic and cometabolic activities of
autotrophic and heterotrophic microorganisms in the biodegradation of emerging
trace organic contaminants. Bioresource Technology 146 721-731
Norihide Nakada, Toshikatsu Tanishima, Hiroyuki Shinohara, Kentaro Kiri, Hideshige
Takada. (2006). Pharmaceutical chemicals and endocrine disrupters in municipal
wastewater in Tokyo and their removal during activated sludge treatment. Water
Research 40 3297-3303
Parker D. S. (1970) Characteristics of biological flocs in turbulent regimes, Doctoral
thesis, University of California, Berkeley, http://disexpress.umi.com/dxweb,
UMI publication number 7109887.

100
Paxeus, N., (2004). Removal of selected non-steroidal anti-inflammatory drugs
(NSAIDs), gemfibrozil, carbamazepine, b-blockers, trimethoprim and triclosan
in conventional wastewater treatment plants in five EU countries and their
discharge to the aquatic environment. Water Sci. Technol. 50 (5), 253–260.
Roh, Subramanya, Zhao, Ping, Sandt, Chu (2009). Biodegradation potential of
wastewater micropollutants by ammonia-oxidizing bacteria. Chemosphere 77
1084-1089
Sasaki, H., Nonaka, J., Sasaki,. T. (2006) Ammonia removal from livestock
wastewater by ammonia-assimilating microorganisms immobilized in polyvinyl
alcohol Journal of Industrial Microbiology and Biotechnology. 34:105–110
Schuler and Melcer. (2014). Mass Transfer Characteristics of Floating Media In MBBR
and IFAS Fixed-Film Systems. Project U4R11 Final Report. Water Environment
Research Foundation.
Shi, J., Fujisawa, S., Nakai, S., Hosomi, M. (2004) Biodegradation Of Natural and
Synthetic Estrogens By Nitrifying Activated Sludge and Ammonia Oxidizing
Bacterium Nitrosomonas europaea. Water Research 38 2323-2330
Siripong Slil, Rittman Bruce (2007). Diversity study of nitrifying bacteria in full-scale
municipal wastewater treatment plants. Water Research 41 (2007) 1110– 1120
Ternes T.A., Stumpf M., Mueller J, Haberer K, Wilken R-D and Servos M. (1999)
Behaviour and occurence of estrogens in municipal sewage treatment plants - II.
Aerobic batch experiments with activated sludge Sci. Total Environ. 225, 91-99.
Van Loosdrecht, M.C.M., Lyklema, J., Norde, W., Zehnder, A.J.B., (1990). Influence of
interfaces on microbial activity. Microbiological Reviews 54 (1), 75e87.
Vanderford, B. J. and S. A. Snyder (2006). "Analysis of pharmaceuticals in water by
isotope dilution liquid chromatography/tandem mass spectrometry."
Environmental Science & Technology 40: 7312-7320.

101
Wojcieszynska, Domaradzka, Kocurek, (2014). Bacterial degradation of naproxen -
Undisclosed pollutant in the environment. Journal of Environmental
Management 145 157-161
Xin Xiaodong, He Junguo, Wang Yuefei, Feng Jinghan, Qiu Wei (2016) Role of
aeration intensity on performance and microbial community profiles in a
sequencing batch reaction kettle (SBRK) for wastewater nutrients rapid removal.
Bioresource Technology 201 (2016) 140–147
Yi Taewood, Harper Willie, (2007). The Link between Nitrification and
Biotransformation of 17 Alpha Ethinylestradiol. Environmental Science and
Technology 41 4331-4316
Vitousek, P., Aber, J., Howarth, R., Likens, G., Matson, P., Schindler, D., Schledsinger,
W., Tilman, D. (1997). Human Alteration of The Global Nitrogen Cycle:
Sources and Consequences. Ecological Applications, 7(3) 737-750
Randall, C.W., Sen, D., (1996). Full-scale investigation of an integrated fixed-film
activated sludge (IFAS) process for enhanced nitrogen removal. Water Science
and Technology 33 (12), 155e162.
Kowalchuk, G., Stephen, J. (2001) Ammonia-Oxidizing Bacteria: A Model For
Molecular Microbial Ecology. Annual Review Microbiology, 55, 485-529
Joo, H.S., Hirai, M., Shoda, M., (2005). Characteristics of ammonium removal by
heterotrophic nitrification–aerobic denitrification by Alcaligenes faecalis No. 4.
Journal of Bioscience and Bioengineering 100 (2), 184–191.
Zhang, J., Wu, P., Hao, B., Yu, Z. (2011) Heterotrophic nitrification and aerobic
denitrification by the bacterium Pseudomonas stutzeri YZN-001. Bioresource
Technology, 102, 9866-9869

102
Appendix
Appendix A: Chapter 2 Data
Figure 2.5
Dates G, 1/s R1 Influent NH4-N, mg/L
R1 Effluent NH4-N, mg/L
R1 Effluent NO3-N, mg/L
R1 Effluent NO2-N, mg/L
3/19/13 239.8 43.6 24.8 16.2
3/21/13 239.8 43.6 16.5 25.6
3/22/13 239.8 56.1 20.9 34.9
3/24/13 239.8 56.1 12.3 41.8
3/26/13 239.8 66.2 15.6 49.1
3/27/13 239.8 66.2 6.4 56
3/28/13 239.8 66.2 3.9 61.1
3/29/13 239.8 76.6 0.6 74.6
4/1/13 239.8 106.5 6.8 96
4/2/13 239.8 106.5 2.2 102
4/4/13 239.8 122.7 9 111
4/6/13 239.8 122.7 5.1 112
4/8/13 239.8 122.7 0.8 119
4/10/13 239.8 149.1 11.2 129
4/13/13 239.8 149.1 2.9 137
4/17/13 239.8 149.1 26.5 108
4/19/13 239.8 165.7 15.6 137
4/23/13 239.8 165.7 30.9 116
4/25/13 239.8 165.7 0.8 154
4/26/13 298.0 165.7 0.1 156
4/29/13 298.0 173.1 1.9 170
4/30/13 298.0 225 1.4 189

103
Dates G, 1/s R1 Influent NH4-N, mg/L
R1 Effluent NH4-N, mg/L
R1 Effluent NO3-N, mg/L
R1 Effluent NO2-N, mg/L
5/2/13 298.0 293 104.7 146
5/3/13 298.0 293 104.2 149
5/6/13 298.0 293 49.4 207
5/7/13 298.0 293 40 216
5/9/13 298.0 293 42.8 217 37.1
5/13/13 298.0 293
5/15/13 298.0 293 93.5 140 19
5/17/13 298.0 386 125 229 13.9
5/20/13 298.0 310 5 277 0.5
5/23/13 298.0 231 20.8 197 15.5
5/27/13 298.0 250 9.1 189 73.7
5/29/13 298.0 250 104.6 61 62.3
5/31/13 298.0 250 102.8 68 88.8
6/3/13 298.0 250 55.4 83 122
6/5/13 298.0 250 55.7 72 139
6/7/13 298.0 256 45.5 86 136.8
6/10/13 298.0 420 220 129 52.8
6/12/13 298.0 190 1.4 127 55.7
6/14/13 298.0 238 1.7 182 65.4
6/17/13 298.0 276 1.3 260 12
6/19/13 298.0 304 2.3 259 46.5
6/21/13 298.0 304 5.5 201 78
6/24/13 298.0 359 18.7 223 120.9
6/26/13 298.0 359 44.7 206 64.8
6/28/13 298.0 359 32.7 239 98.6
7/1/13 298.0 359 12.7 213 141.1

104
Dates G, 1/s R1 Influent NH4-N, mg/L
R1 Effluent NH4-N, mg/L
R1 Effluent NO3-N, mg/L
R1 Effluent NO2-N, mg/L
7/3/13 298.0 404 47.1 258 115.8
7/5/13 298.0 404 18.1 263 135.3
7/8/13 298.0 433 43.3 265 141.1
7/10/13 298.0 412 110.5 202 70.5
7/12/13 298.0 412 76.5 229 101.2
7/15/13 298.0 412 49.7 243 111.2
7/17/13 298.0 412 46.6 250 95.6
7/19/13 298.0 412 42.9 258 97
7/22/13 298.0 412 39.4 267 106
7/24/13 298.0 412 107.1 198 69.5
7/26/13 298.0 401 48.8 210 147.5
7/29/13 298.0 401 39.1 229 156.7
7/31/13 298.0 401 23.8 212 183.5
8/2/13 298.0 401 3.7 268 141.5
8/6/13 298.0 401 3.8 251 151.5
8/9/13 298.0 401 4.1 258 149.5
8/12/13 298.0 401 3.8 251 159.5
8/14/13 298.0 401 100 179 75
8/16/13 298.0 401 44.1 221 155.5
8/19/13 298.0 398 18.2 249 142.5
8/21/13 298.0 415 14.1 246 151.5
8/23/13 298.0 415 20.5 212 176.5
8/26/13 298.0 415 19.1 229 181.5
8/28/13 298.0 410 22.9 199 198.5
8/30/13 298.0 410 11.4 201 205.5
9/2/13 298.0 410 17 197 201

105
Dates G, 1/s R1 Influent NH4-N, mg/L
R1 Effluent NH4-N, mg/L
R1 Effluent NO3-N, mg/L
R1 Effluent NO2-N, mg/L
9/5/13 327.3 370 76.6 82 201
9/6/13 327.3 370 80.6 81 201.5
9/9/13 308.0 300 56.5 82 164
9/12/13 308.0 300 81.2 67 115
9/13/13 308.0 300 89.6 67 130
9/16/13 308.0 225 14.7 68 131.5
9/20/13 308.0 225 82.8 80 66
9/24/13 327.3 225 90.9 76 58.5
9/26/13 327.3 178 60.6 71 56
9/29/13 327.3 178 90.5 58 29.5
10/4/13 327.3 161 57.5 51 49.5
10/7/13 327.3 161 65.3 47 46.5
10/9/13 327.3 161 67.7 31 34.2
10/11/13 327.3 150 69.8 39 38.5
10/13/13 327.3 150 71.2 32 36.5
10/19/13 327.3 150 84.3 22 32.5
10/23/13 327.3 121 76.8 18.3 25
10/25/13 327.3 121 81.2 20 19.5
10/28/13 327.3 109 66 19 22.5
10/31/13 327.3 95 61.2 10 20.5
11/2/13 327.3 95 66.5 9.8 20.5
11/4/13 327.3 95 62.6 10.2 22
11/7/13 327.3 95 63.6 8.5 25.5
11/9/13 327.3 95 60.6 9.1 20.2
11/11/13 327.3 95 67.5 7.4 20.5
11/14/13 327.3 100 70.3 8.5 22.35

106
Dates G, 1/s R1 Influent NH4-N, mg/L
R1 Effluent NH4-N, mg/L
R1 Effluent NO3-N, mg/L
R1 Effluent NO2-N, mg/L
11/16/13 327.3 100 71.8 8.9 20.95
11/18/13 327.3 85 58.8 5.7 23.35
11/21/13 327.3 85 57.1 6.4 22.05
11/23/13 327.3 85 55.1 7 21.95
11/25/13 327.3 85 57.1 6.5 22.95
11/27/13 327.3 85 52.6 6.7 23.78
12/1/13 327.3 85 47.3 7.2 28.2
12/14/13 304.6 77 26.9 6 55
12/15/13 304.6 77 20.8 8 52
12/19/13 304.6 77 21.3 7 50.2
12/21/13 304.6 77 22.9 6.8 44.6
12/24/13 304.6 88 19 11.7 44
12/26/13 295.9 88 19 8.2 46
12/29/13 295.9 88 15 8.7 61
12/31/13 295.9 88 26 9.3 60
1/2/14 295.9 88 8 5.8 55
1/4/14 295.9 88 5 2.3 88
1/6/14 295.9 88 9.1 5.7 76
1/8/14 295.9 121 56 5.5 74
1/10/14 295.9 121 55 4.6 75
1/12/14 295.9 121 36 5.7 95
1/14/14 298.0 121 0.5 8.3 115
1/16/14 298.0 233 107 12.3 134
1/19/14 298.0 233 52.2 16.7 171.6
1/21/14 298.0 233 18.9 23.1 201
1/22/14 298.0 233 5.9 24.6 212

107
Dates G, 1/s R1 Influent NH4-N, mg/L
R1 Effluent NH4-N, mg/L
R1 Effluent NO3-N, mg/L
R1 Effluent NO2-N, mg/L
1/24/14 298.0 340 46 25.2 244
1/26/14 298.0 340 59 33.2 254
1/28/14 298.0 407 187 21.6 179
1/30/14 298.0 407 204 25.4 207
2/2/14 298.0 339 91 19.4 229
2/4/14 298.0 339 101 15.3 233
2/6/14 298.0 339 116 12 218
2/8/14 298.0 339 142 11.5 189
2/10/14 298.0 339 181 7.9 140
2/12/14 298.0 339 229 9.5 123
2/20/14 298.0 208 147
2/21/14 298.0 132 56
2/22/14 298.0 132 5.4
2/23/14 298.0 209 27.7 18.2 159
2/24/14 298.0 209 45 17.3 136
2/26/14 298.0 209 24.9 20.2 167
2/28/14 298.0 214 40 23.1 165
3/2/14 298.0 214 3.5 26.7 168
3/4/14 298.0 314 13 26.1 240
3/5/14 298.0 316 8.8
3/6/14 298.0 353 12 17 310
3/7/14 298.0 327 8
3/8/14 298.0 327 20.6 27.4 310
3/10/14 298.0 330 90
3/12/14 298.0 330 90
3/13/14 298.0 240 16.4 18.8 231

108
Dates G, 1/s R1 Influent NH4-N, mg/L
R1 Effluent NH4-N, mg/L
R1 Effluent NO3-N, mg/L
R1 Effluent NO2-N, mg/L
3/15/14 298.0 240 4.9 29.4 212
3/17/14 298.0 240 4.5 32.2 197
3/19/14 298.0 259 22.1 36.8 205
3/21/14 298.0 259 11.3 35.5 201
3/23/14 298.0 259 4.6 36 221
3/25/14 298.0 259 2.8 40.4 220
3/26/14 298.0 292 3.7
3/27/14 298.0 320 11.3 48 226
3/28/14 298.0 379 25.9
3/31/14 298.0 372 67 48.8 260
4/2/14 298.0 340 31 43.2 254
4/4/14 298.0 332 13.3 45.2 278
4/6/14 298.0 332 12 37.6 283
4/8/14 298.0 332 45 37.4 265
4/10/14 298.0 326 10.9 43.2 285
4/12/14 298.0 355 25.7 38.4 274
4/15/14 298.0 347 16.9 32.8 270
4/18/14 298.0 335 174 30.4 148
4/19/14 298.0 335 155
4/20/14 298.0 300 135
4/21/14 298.0 207 39
4/23/14 298.0 173 3.7 90 80
4/26/14 298.0 173 2 100 129
4/29/14 298.0 173 2.2 76 48
5/1/14 298.0 225 2.4 103.6 86
5/3/14 298.0 225 3 102 80

109
Dates G, 1/s R1 Influent NH4-N, mg/L
R1 Effluent NH4-N, mg/L
R1 Effluent NO3-N, mg/L
R1 Effluent NO2-N, mg/L
5/5/14 298.0 225 3.3 115.2 95
5/7/14 298.0 288 20.1 83.7 170
5/9/14 298.0 288 7.6 137 170
5/12/14 298.0 381 26.7 78 285
5/14/14 298.0 380 61 70 213
5/20/14 298.0 363 66 100 363
5/21/14 298.0 326 13 100 310
5/23/14 298.0 313 3 144 159
5/26/14 298.0 358 3 224 115
5/27/14 298.0 358 1.8 338 16
5/28/14 298.0 387 5.7 302 47
5/30/14 298.0 403 57 182 137
5/30/14 298.0 403 29 186 254
6/2/14 298.0 359 13.5 176 113
6/5/14 298.0 382 7 224 138
6/8/14 298.0 387 5.7 226 181
6/10/14 298.0 400 10.6 174 181
6/12/14 298.0 400 22.5 250 156
6/13/14 298.0 447 0.6 128 204
6/15/14 298.0 447 18.9 126 269
6/17/14 298.0 447 3.9 164 227
6/19/14 298.0 375 10 132 229
6/22/14 298.0 375 3 222 115
6/23/14 298.0 375 2
6/25/14 298.0 375 50.1 122 139
6/26/14 298.0 375 23

110
Dates G, 1/s R1 Influent NH4-N, mg/L
R1 Effluent NH4-N, mg/L
R1 Effluent NO3-N, mg/L
R1 Effluent NO2-N, mg/L
6/30/14 298.0 375 3.1 220 143
7/1/14 298.0 375 12 184 152
7/3/14 298.0 375 3.2 210 127
7/5/14 298.0 375 3.3 222 98
7/7/14 298.0 375 2.1 212 113
7/11/14 298.0 390 8.6 92 246
7/13/14 298.0 384 5.4 88 293
7/15/14 389.0 384 2.5 102 264
7/17/14 389.0 384 2.7 255
7/23/14 298.0 384 259
7/25/14 298.0 202 22.5 50 156
7/26/14 298.0 202 3.5 70 148
7/28/14 298.0 224 1.2 154 71
7/31/14 298.0 255 1.4 238 16
8/2/14 298.0 294 2.7 249 75
8/4/14 298.0 342 2 286 62
8/6/14 298.0 381 0.4 262 118
8/9/14 298.0 515 100
8/11/14 298.0 282 1.1 326 1.1
9/1/14 298.0 300 2.2 130 135
9/8/14 298.0 300 3.7 132 160
9/11/14 298.0 279 1.2 182 85
9/14/14 298.0 270 1.6 201 91
9/19/14 298.0 270 1.1 201 80
9/26/14 298.0 270 0.3 201 91
10/2/14 298.0 280 0.2 200 99

111
Dates G, 1/s R1 Influent NH4-N, mg/L
R1 Effluent NH4-N, mg/L
R1 Effluent NO3-N, mg/L
R1 Effluent NO2-N, mg/L
10/6/14 1.9 300 1.9 296 3
10/11/14 298.0 300 1.1 250 110
10/20/14 298.0 300 1.1 200 112
10/27/14 298.0 300 1.2 201 120
11/3/14 298.0 300 0.8 12 139
11/4/14 298.0 200 0.9 177 50
11/5/14 298.0 300 1.2 178 88
11/7/14 298.0 300 0.7 110 236
11/8/14 298.0 250 0.2 82 158
11/9/14 298.0 250 0.5 92 155
11/10/14 298.0 250 1.1 90 173
11/13/14 298.0 200 0.7 94 114
11/17/14 298.0 200 1 116 110
11/19/14 298.0 170 1 92 73
11/25/14 298.0 170 0.5 115 75
11/28/14 298.0 170 1.5 110 84
12/3/14 298.0 172 0.1 92 49.4
12/7/14 298.0 110 0.7 94 8.1
12/9/14 298.0 110 0.7 99 3
12/12/14 298.0 110 0.7 98 5
12/18/14 298.0 110 0.5 89 7
12/23/14 298.0 110 0.4 91 4.5
12/26/14 298.0 110 1.2 105 6.1
12/29/14 298.0 110 0.5 108 4
1/2/15 298.0 110 0.5 114 4
1/8/15 298.0 110 0.9 112 3.5

112
Dates G, 1/s R1 Influent NH4-N, mg/L
R1 Effluent NH4-N, mg/L
R1 Effluent NO3-N, mg/L
R1 Effluent NO2-N, mg/L
1/16/15 298.0 160 0.8 163 11.6
1/19/15 298.0 160 0.8 160 10
1/23/15 298.0 162 1.2 157 19.6
1/27/15 298.0 158 0.9 143 28.7
1/30/15 298.0 255 66 45 186
2/2/15 298.0 255 41 47 197
2/5/15 298.0 300 1.1 205 130
2/9/15 298.0 300 0.6 171 120
2/12/15 298.0 300 12 141 136
2/16/15 298.0 300 11 137 164
2/18/15 298.0 300 1.1 118 172
2/23/15 298.0 448 7 47 394
2/24/15 298.0 448 1 50 400
3/2/15 298.0 550 150 89 340
3/7/15 298.0 515 90 96 328
3/10/15 298.0 515 89 95 321
3/11/15 298.0 515 98 126 354
Figure 2.6
Date G, 1/s R2 Influent NH4-N, mg/L
R2 Effluent NH4-N, mg/L
R2 Effluent NO3-N, mg/L
R2 Effluent NO2-N, mg/L
4/25/13 239.8 29.6 23.9 5.4
4/26/13 239.8 29.6 16.7 7
4/29/13 239.8 40.1 1.9 8.6
4/30/13 239.8 71 5.8 11

113
Date G, 1/s R2 Influent NH4-N, mg/L
R2 Effluent NH4-N, mg/L
R2 Effluent NO3-N, mg/L
R2 Effluent NO2-N, mg/L
5/2/13 239.8 169 39 13
5/3/13 239.8 169 11.8 16
5/6/13 239.8 169 1.9 20.4
5/7/13 239.8 169 13.9 22.5
5/9/13 239.8 169 2.4 20.1
5/13/13 239.8 248 41.5 21.7 97.4
5/17/13 239.8 248 3.8 28.7 98.1
5/20/13 239.8 301 6 44.7 98
5/23/13 239.8 301 27.9 41.2 97.7
5/24/13 298.0
5/27/13 298.0 304 2 218 90.5
5/29/13 298.0 393 5.8 198 97.7
5/31/13 298.0 393 4.8 236 97.7
6/3/13 298.0 393 4.5 280 125
6/5/13 298.0 393 64.5 245 60.6
6/7/13 298.0 440 67.2 264 106.2
6/10/13 298.0 440 30.3 268 144.9
6/12/13 298.0 440 11.5 284 147.6
6/14/13 298.0 451 6.2 326 124.2
6/17/13 298.0 510 27 341 126
6/19/13 298.0 510 79.2 286 67.5
6/21/13 298.0 510 44.7 272 183.3
6/24/13 298.0 499 10.2 218 264.9
6/26/13 298.0 499 9.9 224 266.7
6/28/13 298.0 499 5.2 208 261.6
7/1/13 298.0 510 6.9 213 286.5
7/3/13 298.0 510 88.2 172 51.6
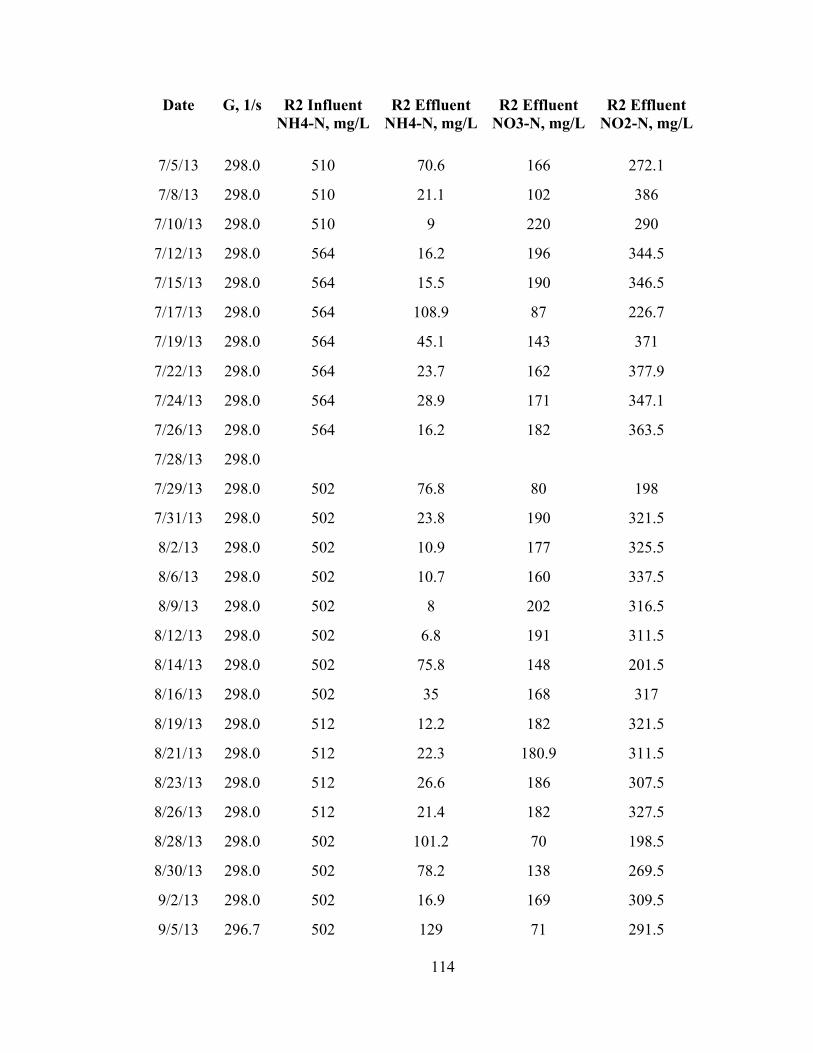
114
Date G, 1/s R2 Influent NH4-N, mg/L
R2 Effluent NH4-N, mg/L
R2 Effluent NO3-N, mg/L
R2 Effluent NO2-N, mg/L
7/5/13 298.0 510 70.6 166 272.1
7/8/13 298.0 510 21.1 102 386
7/10/13 298.0 510 9 220 290
7/12/13 298.0 564 16.2 196 344.5
7/15/13 298.0 564 15.5 190 346.5
7/17/13 298.0 564 108.9 87 226.7
7/19/13 298.0 564 45.1 143 371
7/22/13 298.0 564 23.7 162 377.9
7/24/13 298.0 564 28.9 171 347.1
7/26/13 298.0 564 16.2 182 363.5
7/28/13 298.0
7/29/13 298.0 502 76.8 80 198
7/31/13 298.0 502 23.8 190 321.5
8/2/13 298.0 502 10.9 177 325.5
8/6/13 298.0 502 10.7 160 337.5
8/9/13 298.0 502 8 202 316.5
8/12/13 298.0 502 6.8 191 311.5
8/14/13 298.0 502 75.8 148 201.5
8/16/13 298.0 502 35 168 317
8/19/13 298.0 512 12.2 182 321.5
8/21/13 298.0 512 22.3 180.9 311.5
8/23/13 298.0 512 26.6 186 307.5
8/26/13 298.0 512 21.4 182 327.5
8/28/13 298.0 502 101.2 70 198.5
8/30/13 298.0 502 78.2 138 269.5
9/2/13 298.0 502 16.9 169 309.5
9/5/13 296.7 502 129 71 291.5
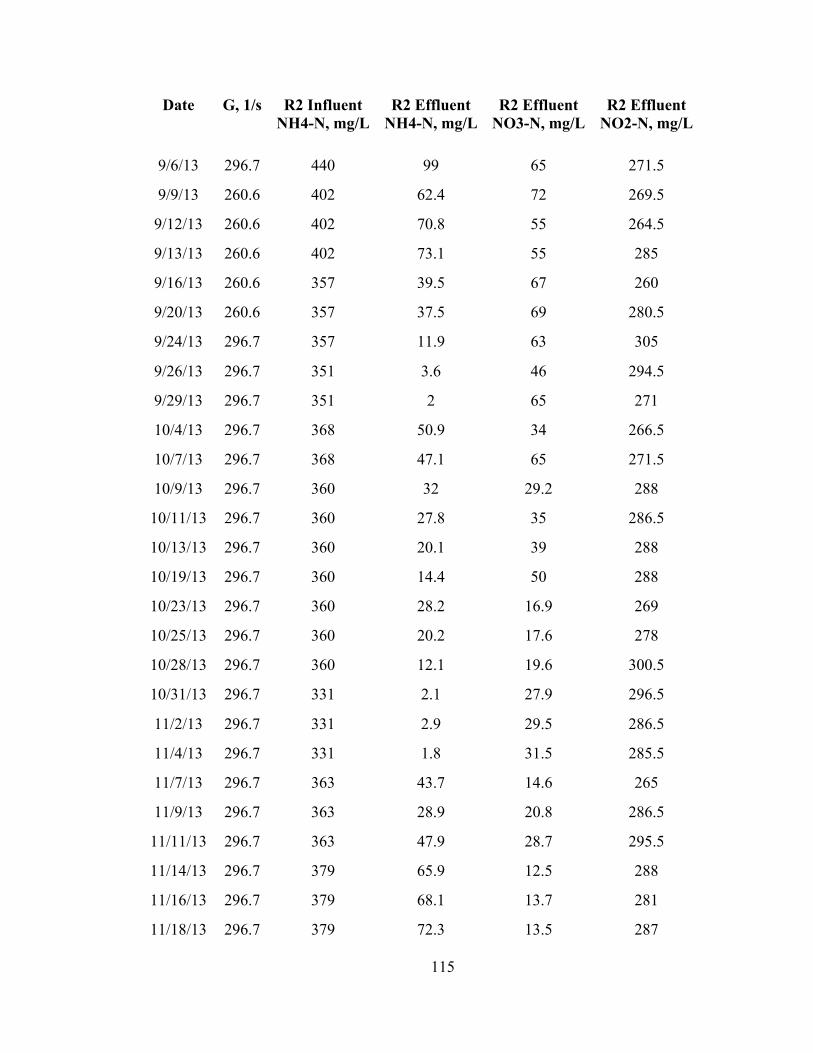
115
Date G, 1/s R2 Influent NH4-N, mg/L
R2 Effluent NH4-N, mg/L
R2 Effluent NO3-N, mg/L
R2 Effluent NO2-N, mg/L
9/6/13 296.7 440 99 65 271.5
9/9/13 260.6 402 62.4 72 269.5
9/12/13 260.6 402 70.8 55 264.5
9/13/13 260.6 402 73.1 55 285
9/16/13 260.6 357 39.5 67 260
9/20/13 260.6 357 37.5 69 280.5
9/24/13 296.7 357 11.9 63 305
9/26/13 296.7 351 3.6 46 294.5
9/29/13 296.7 351 2 65 271
10/4/13 296.7 368 50.9 34 266.5
10/7/13 296.7 368 47.1 65 271.5
10/9/13 296.7 360 32 29.2 288
10/11/13 296.7 360 27.8 35 286.5
10/13/13 296.7 360 20.1 39 288
10/19/13 296.7 360 14.4 50 288
10/23/13 296.7 360 28.2 16.9 269
10/25/13 296.7 360 20.2 17.6 278
10/28/13 296.7 360 12.1 19.6 300.5
10/31/13 296.7 331 2.1 27.9 296.5
11/2/13 296.7 331 2.9 29.5 286.5
11/4/13 296.7 331 1.8 31.5 285.5
11/7/13 296.7 363 43.7 14.6 265
11/9/13 296.7 363 28.9 20.8 286.5
11/11/13 296.7 363 47.9 28.7 295.5
11/14/13 296.7 379 65.9 12.5 288
11/16/13 296.7 379 68.1 13.7 281
11/18/13 296.7 379 72.3 13.5 287
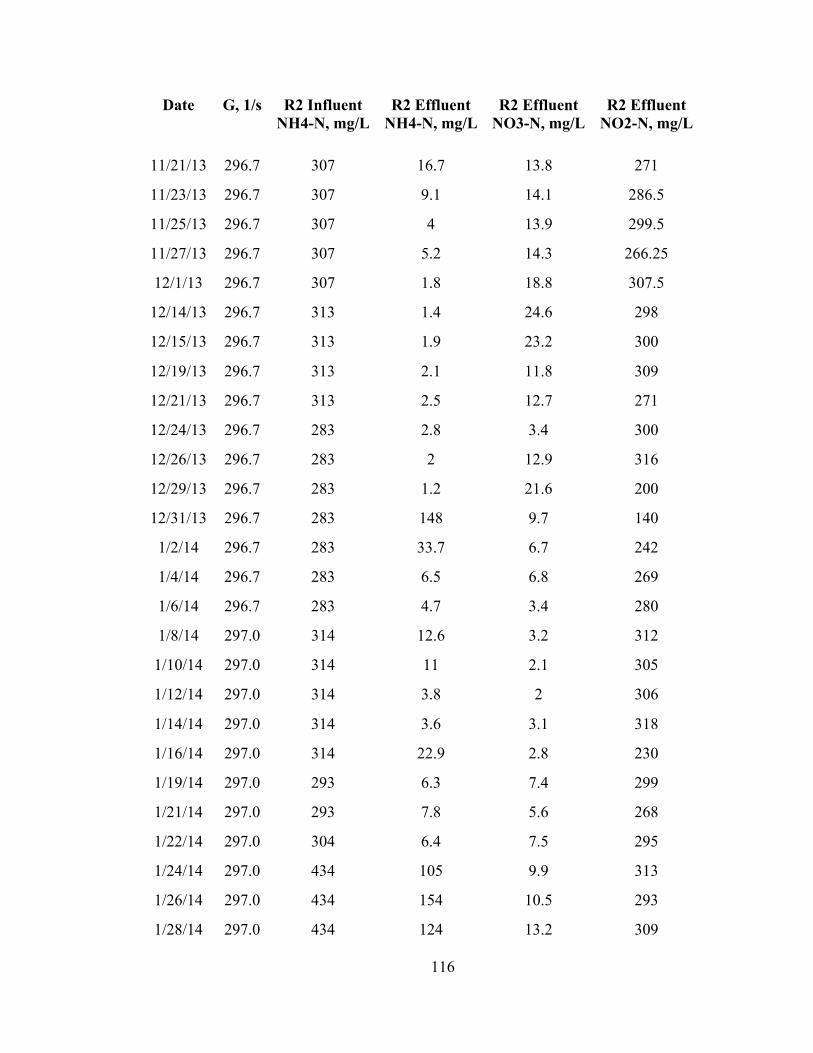
116
Date G, 1/s R2 Influent NH4-N, mg/L
R2 Effluent NH4-N, mg/L
R2 Effluent NO3-N, mg/L
R2 Effluent NO2-N, mg/L
11/21/13 296.7 307 16.7 13.8 271
11/23/13 296.7 307 9.1 14.1 286.5
11/25/13 296.7 307 4 13.9 299.5
11/27/13 296.7 307 5.2 14.3 266.25
12/1/13 296.7 307 1.8 18.8 307.5
12/14/13 296.7 313 1.4 24.6 298
12/15/13 296.7 313 1.9 23.2 300
12/19/13 296.7 313 2.1 11.8 309
12/21/13 296.7 313 2.5 12.7 271
12/24/13 296.7 283 2.8 3.4 300
12/26/13 296.7 283 2 12.9 316
12/29/13 296.7 283 1.2 21.6 200
12/31/13 296.7 283 148 9.7 140
1/2/14 296.7 283 33.7 6.7 242
1/4/14 296.7 283 6.5 6.8 269
1/6/14 296.7 283 4.7 3.4 280
1/8/14 297.0 314 12.6 3.2 312
1/10/14 297.0 314 11 2.1 305
1/12/14 297.0 314 3.8 2 306
1/14/14 297.0 314 3.6 3.1 318
1/16/14 297.0 314 22.9 2.8 230
1/19/14 297.0 293 6.3 7.4 299
1/21/14 297.0 293 7.8 5.6 268
1/22/14 297.0 304 6.4 7.5 295
1/24/14 297.0 434 105 9.9 313
1/26/14 297.0 434 154 10.5 293
1/28/14 297.0 434 124 13.2 309

117
Date G, 1/s R2 Influent NH4-N, mg/L
R2 Effluent NH4-N, mg/L
R2 Effluent NO3-N, mg/L
R2 Effluent NO2-N, mg/L
1/30/14 297.0 434 104 8.4 329
2/2/14 297.0 415 89 4.1 326
2/4/14 297.0 415 87.2 6.8 340
2/6/14 297.0 415 66 6.3 368
2/8/14 297.0 415 82 4.9 351
2/10/14 297.0 415 71 4.7 357
2/12/14 297.0 458 51 7.6 401
2/20/14 297.0 459 187
2/21/14 297.0 339 20
2/22/14 297.0 370 14
2/23/14 297.0 435 26.1
2/24/14 297.0 435 29 11.3 417
2/26/14 297.0 495 107 9.7 377
2/28/14 297.0 499 88 13.7 368
3/2/14 297.0 499 94 21.6 340
3/4/14 297.0 485 72 14.4 345
3/5/14 297.0 474 86
3/6/14 297.0 420 63 18.6 377
3/7/14 297.0 370 8
3/8/14 297.0 413 15.3 30 344
3/10/14 297.0 413 40
3/11/14 297.0 413 39.5 40 321
3/12/14 297.0 406 33
3/13/14 297.0 406 11.9 68.1 318
3/15/14 297.0 406 36.4 80.1 268
3/17/14 297.0 406 49 75.2 266
3/19/14 297.0 381 13.9 93.1 265

118
Date G, 1/s R2 Influent NH4-N, mg/L
R2 Effluent NH4-N, mg/L
R2 Effluent NO3-N, mg/L
R2 Effluent NO2-N, mg/L
3/21/14 297.0 381 8.6 84.9 269
3/23/14 297.0 381 11.8 94.5 269
3/25/14 297.0 364 11.5 98.4 238
3/26/14 297.0 364 6.8
3/27/14 297.0 364 3.7 172.8 184
3/28/14 298.0 392 6
3/31/14 298.0 431 72 115.8 252
4/2/14 298.0 415 16 109.6 263
4/4/14 298.0 419 36.7 108 248
4/6/14 298.0 419 34 81.2 270
4/8/14 298.0 419 57 83.7 244
4/10/14 298.0 373 7.8 82 275
4/12/14 298.0 358 4 86.5 251
4/15/14 298.0 358 2.6 126.5 200
4/18/14 298.0 330 7 71.2 200
4/19/14 298.0 333 8
4/20/14 298.0 333 8
4/21/14 298.0 333 3
4/23/14 298.0 333 6.7 128 188
4/26/14 298.0 335 3.8 130 159
4/29/14 298.0 338 2.2 90 118.4
5/1/14 298.0 339 2.9 118.4 195
5/3/14 298.0 343 2.8 190 120
5/5/14 298.0 343 2.6 272.3 65
5/7/14 298.0 370 1 291.1 68
5/9/14 298.0 370 3.3 299 66
5/12/14 298.0 423 10.1 221 163

119
Date G, 1/s R2 Influent NH4-N, mg/L
R2 Effluent NH4-N, mg/L
R2 Effluent NO3-N, mg/L
R2 Effluent NO2-N, mg/L
5/14/14 298.0 384 3.1 165 153
5/16/14 298.0 384 14.4 166 173
5/21/14 298.0 343 2 310 24
5/23/14 298.0 356 0 350 13
5/26/14 298.0 394 3.1 292 151
5/27/14 298.0 394 1.6 375 28
5/30/14 298.0 410 8.2 322 100
6/2/14 298.0 410 6.4 126
6/5/14 298.0 413 2 400 20
6/8/14 298.0 365 2.2 390 15.7
6/10/14 298.0 374 5.9 356 40
6/12/14 298.0 374 1.4
6/15/14 298.0 376 1.2 7 360
6/17/14 298.0 376 1.6 8 380
6/19/14 298.0 420 1.3 400 5
6/22/14 298.0 420 10.6 196 195
6/26/14 298.0 425 2.6 268 145
6/30/14 298.0 425 2 356 105
7/1/14 298.0 425 2.1 348 48
7/3/14 298.0 425 1.9 378 17
7/5/14 298.0 425 1.9 392 8
7/7/14 298.0 425 0.9 402 6
7/8/14 298.0 461 1.3
7/11/14 298.0 459 69 164 154
7/13/14 298.0 399 6 196 179
7/15/14 389.0 399 1.2 374 5
7/23/14 389.0 397 0.01 190 131
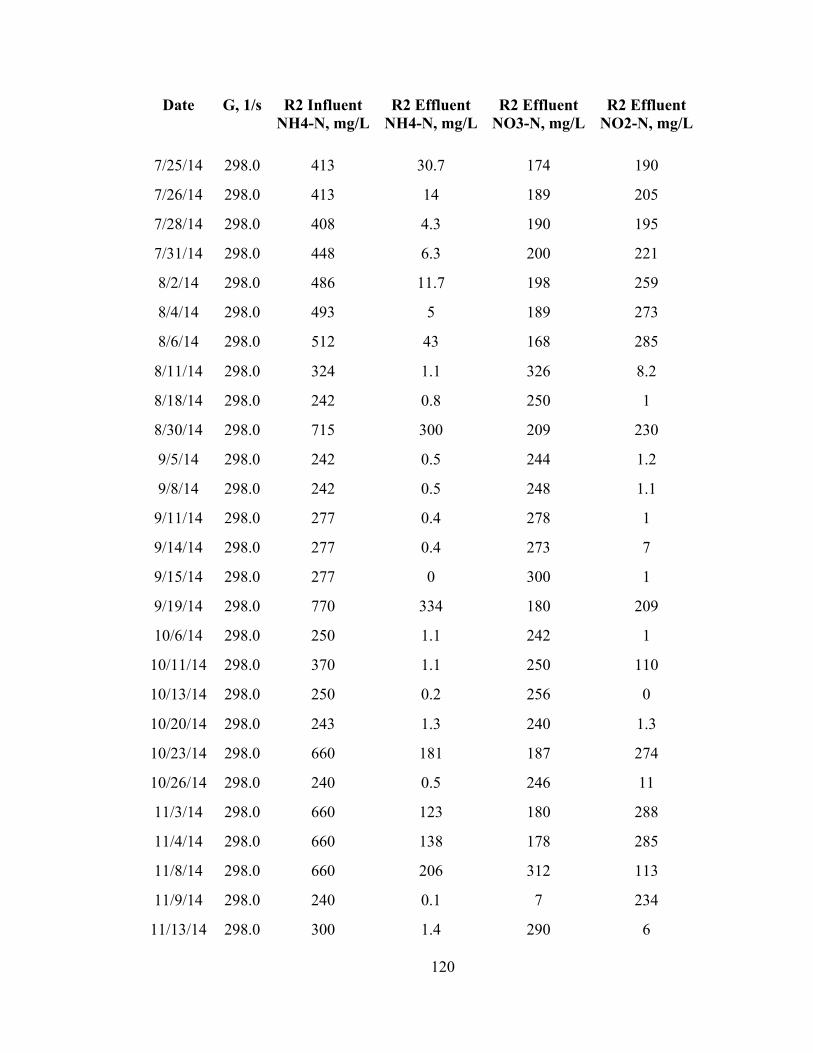
120
Date G, 1/s R2 Influent NH4-N, mg/L
R2 Effluent NH4-N, mg/L
R2 Effluent NO3-N, mg/L
R2 Effluent NO2-N, mg/L
7/25/14 298.0 413 30.7 174 190
7/26/14 298.0 413 14 189 205
7/28/14 298.0 408 4.3 190 195
7/31/14 298.0 448 6.3 200 221
8/2/14 298.0 486 11.7 198 259
8/4/14 298.0 493 5 189 273
8/6/14 298.0 512 43 168 285
8/11/14 298.0 324 1.1 326 8.2
8/18/14 298.0 242 0.8 250 1
8/30/14 298.0 715 300 209 230
9/5/14 298.0 242 0.5 244 1.2
9/8/14 298.0 242 0.5 248 1.1
9/11/14 298.0 277 0.4 278 1
9/14/14 298.0 277 0.4 273 7
9/15/14 298.0 277 0 300 1
9/19/14 298.0 770 334 180 209
10/6/14 298.0 250 1.1 242 1
10/11/14 298.0 370 1.1 250 110
10/13/14 298.0 250 0.2 256 0
10/20/14 298.0 243 1.3 240 1.3
10/23/14 298.0 660 181 187 274
10/26/14 298.0 240 0.5 246 11
11/3/14 298.0 660 123 180 288
11/4/14 298.0 660 138 178 285
11/8/14 298.0 660 206 312 113
11/9/14 298.0 240 0.1 7 234
11/13/14 298.0 300 1.4 290 6
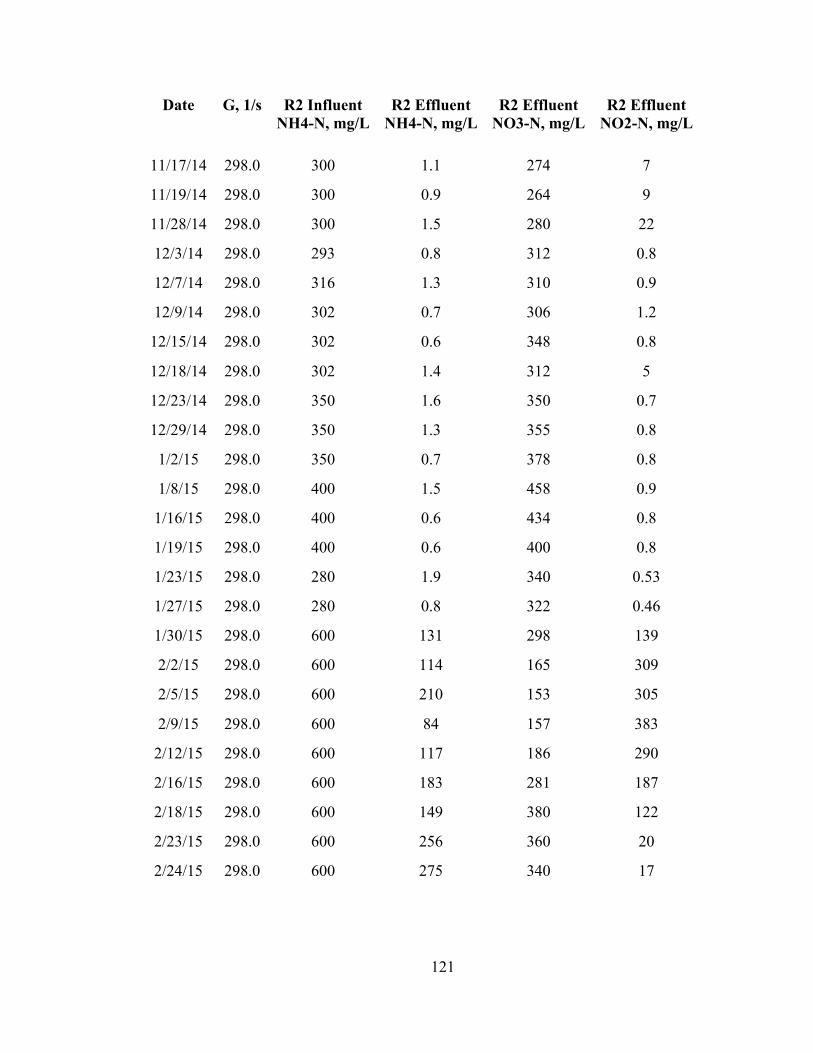
121
Date G, 1/s R2 Influent NH4-N, mg/L
R2 Effluent NH4-N, mg/L
R2 Effluent NO3-N, mg/L
R2 Effluent NO2-N, mg/L
11/17/14 298.0 300 1.1 274 7
11/19/14 298.0 300 0.9 264 9
11/28/14 298.0 300 1.5 280 22
12/3/14 298.0 293 0.8 312 0.8
12/7/14 298.0 316 1.3 310 0.9
12/9/14 298.0 302 0.7 306 1.2
12/15/14 298.0 302 0.6 348 0.8
12/18/14 298.0 302 1.4 312 5
12/23/14 298.0 350 1.6 350 0.7
12/29/14 298.0 350 1.3 355 0.8
1/2/15 298.0 350 0.7 378 0.8
1/8/15 298.0 400 1.5 458 0.9
1/16/15 298.0 400 0.6 434 0.8
1/19/15 298.0 400 0.6 400 0.8
1/23/15 298.0 280 1.9 340 0.53
1/27/15 298.0 280 0.8 322 0.46
1/30/15 298.0 600 131 298 139
2/2/15 298.0 600 114 165 309
2/5/15 298.0 600 210 153 305
2/9/15 298.0 600 84 157 383
2/12/15 298.0 600 117 186 290
2/16/15 298.0 600 183 281 187
2/18/15 298.0 600 149 380 122
2/23/15 298.0 600 256 360 20
2/24/15 298.0 600 275 340 17

122
Figure 2.7
Relative Abundance (%)
8/26/13 R2 End of
Phase 1
8/19/13 R1 End of
Phase 1 Bacteria; Proteobacteria; Betaproteobacteria; Nitrosomonadales; Nitrosomonadaceae 23.7 7.5
Bacteria; Proteobacteria; Alphaproteobacteria; Rhizobiales; Phyllobacteriaceae 15.9 7.0
Bacteria; Proteobacteria; Betaproteobacteria; Burkholderiales; Comamonadaceae 14.5 41.5
Bacteria; Actinobacteria; Actinobacteria; Actinomycetales; Unknown 12.7 3.0
Bacteria; Actinobacteria; Actinobacteria; Actinomycetales; Microbacteriaceae 9.4 2.0
Bacteria; Proteobacteria; Alphaproteobacteria; Rhizobiales ; Bradyrhizobiaceae 7.3 5.5
Bacteria; Proteobacteria; Gammaproteobacteria; Xanthomonadales; Xanthomonadaceae 4.0 6.7
Bacteria; Bacteroidetes; Flavobacteriia; Flavobacteriales; Cryomorphaceae 2.0 0.1
Bacteria; Bacteroidetes; Sphingobacteriia; Sphingobacteriales; Unclassified 1.2 4.8
Bacteria; Bacteroidetes; Flavobacteriia; Flavobacteriales; Flavobacteriaceae 0.8 5.5
Bacteria; Proteobacteria; Alphaproteobacteria; Sphingomonadales; Sphingomonadaceae 0.6 2.1
Bacteria; Bacteroidetes; Unknown; Unknown; Unknown 0.3 6.2
Bacteria; Nitrospirae; Nitrospira; Nitrospirales; Nitrospiraceae 0.0 2.5
Other 7.5 5.7

123
Figure 2.8
Relative Abundance (%)
8/26/13 R2 End of Phase 1
11/15/13 R2 End of Phase 2
3/16/15 End of Phase 3
Proteobacteria; Betaproteobacteria ;Nitrosomonadales; Nitrosomonadaceae 23.7 0.6 15.8
Proteobacteria; Alphaproteobacteria; Rhizobiales; Phyllobacteriaceae 15.9 3.0 1.0
Proteobacteria; Betaproteobacteria; Burkholderiales; Comamonadaceae 14.5 26.9 11.9
Actinobacteria; Actinobacteria; Actinomycetales; Unclassified 12.7 0.8 0.0
Actinobacteria; Actinobacteria; Actinomycetales; Microbacteriaceae 9.4 10.2 11.1
Proteobacteria; Alphaproteobacteria; Rhizobiales; Bradyrhizobiaceae 7.3 0.4 14.7
Proteobacteria; Gammaproteobacteria; Xanthomonadales; Xanthomonadaceae 4.0 45.3 5.1
Bacteroidetes; Flavobacteriia; Flavobacteriales; Cryomorphaceae 2.0 0.1 0.3
Bacteroidetes; Flavobacteriia; Flavobacteriales; Flavobacteriaceae 0.8 2.0 3.4
Unclassified; Unclassified; Unclassified; Unclassified 0.1 0.1 18.7
Proteobacteria; Alphaproteobacteria; Caulobacterales; Caulobacteraceae 0.8 6.6 0.2
Bacteroidetes; Unclassified; Unclassified; Unclassified 0.1 0.1 0.3
Relative Abundance < 4% 8.5 4.0 17.5
Shannon Diversity Index 2.3 1.6 2.6

124
Figure 2.9
G (1/s) R1 Test Date 180.3 212.2 239.8 264.6 298.0 328.0 389.0
6/24/13 1.49 1.67 1.82 1.92 2.02 2.14 7/8/13 1.22 1.57 1.72 1.84 1.95 1.94 J values, g/(m2*d) 7/22/13 1.27 1.60 1.73 1.84 1.94 2.05
8/19/13 1.41 1.83 1.96 2.11 2.26 2.33
G (1/s)
R2 Test Date 180.3 212.2 239.8 264.6 298.0 328.0 389.0 7/1/13 12.30 16.60 18.00 19.90 21.40 22.40 J values, g/(m2*d) 7/15/13 11.40 16.10 18.20 19.80 21.00 22.50
8/26/13 12.70 18.20 21.10 23.30 24.80 26.20
Figure 2.10
Date Temp, C DO (mg/L) G (1/s) J (g/m2/d) 11/4/13 10.5 3.0 297 1.17 11/4/13 10.5 5.1 297 1.55 11/4/13 10.5 6.1 297 1.89 11/4/13 10.5 7.0 297 2.02 11/4/13 10.5 8.0 297 2.02 11/18/13 10.5 3.0 297 0.96 11/18/13 10.5 4.9 297 1.34 11/18/13 10.5 5.9 297 1.48 11/18/13 10.5 7.1 297 1.75 11/18/13 10.5 8.0 297 1.79 1/15/14 10.5 3.0 297 1.13 1/15/14 10.5 7.2 297 2.15 1/15/14 10.5 11.1 297 2.12 1/15/14 10.5 15.4 297 2.75 1/15/14 10.5 20.1 297 3.04
Figure 2.11
G (1/s) R1 Test Date 178 238 262 297 327 390
9/26/13 0.73 0.82 0.83 0.90 0.89 0.88 J g/(m2*d) 10/7/13 0.58 0.59 0.59 0.61 0.62 0.66
12/16/13 0.41 0.56 0.50 0.44 0.38 0.43

125
G (1/s) R2 Test Date 158 210 231 261 287 340
9/16/13 1.15 1.55 1.71 1.87 2.00 2.16 J
g/(m2*d) G (1/s)
178 238 262 297 327 390 10/13/13 1.39 1.90 2.04 2.25 2.39 2.46
J g/(m2*d)
12/1/13 1.67 2.04 2.15 2.33 2.43 2.53 12/20/13 1.46 1.95 2.06 2.06 2.13 2.24
G (1/s) 161 225 251 287 318 383
1/19/14 1.40 1.63 1.70 1.88 2.04 2.09 J
g/(m2*d)
Figure 2.12
G (1/s) R1 Test Date 180 240 265 298 328 389
5/28/14 2.27 1.92 2.02 1.98 2.10 2.29
J g/(m2*d)
6/23/14 2.87 2.60 6/23/14 2.11 2.89 2.64 6/26/14 2.34 2.56 2.58 6/26/14 2.09 2.26 2.42 7/17/14 2.19 2.72 2.79 7/17/14 2.00 2.44 2.85
G (1/s)
R2 Test Date 180 265 389 7/8/14 2.38 2.55 3.97
J g/(m2*d) 7/8/14 2.09 2.76 3.60 7/21/14 2.09 2.69 3.53 7/21/14 2.09 2.81 3.37

126
Appendix B: Chapter 3 Data
Table 3.2
Table 3.2. Optimized Compound Parameters in OSPE method
Compound
Prec Ion
(m/z)
Prod Ion (m/z) Frag (V) CE
(V) Cell Acc
(V) RT
(min)
ESI Positive
Atenolol 267.1 190.1 (145) 130 15 (20) 2 5.2
Atenolol-d7 274 190.1 130 15 2 5.2
Atrazine 218 176 (174) 140 15 (15) 2 7.6
Atrazine-d3 221 179 140 15 2 7.6 Benzophenone 183 105.1 85 15 2 8 Benzophenone-d10 183 110 85 15 2 8
Caffeine 195.1 138 (110.1) 104 16 (24) 2 5.7
Caffeine-13C3 198.1 140 104 16 2 5.7
Carbamazepine 237 194 (179) 120 15 (35) 2 7.2
Carbamazepine-d10 247 204 120 15 2 7.2
DEET 192 119 (91) 110 15 (30) 2 7.6
DEET-d6 198 119 110 15 2 7.6 Diphenylhydramine 256.2 167.1 (165.1) 60 4 (44) 2 7.1 Diphenylhydramine-d5 261.2 172.1 60 4 2 7.1
Diltiazem 415.2 178 (150) 130 24 (48) 2 7
Diltiazem-d3 418.2 178 130 24 2 7 Fluoxetine 310 148 90 5 2 7.5 Fluoxetine-d5 315 153 90 5 2 7.5
Hydrocortisone 363.2 327 (120.9) 130 13 (24) 2 6.9
Meprobamate 219 158 (55) 70 5 (20) 2 6.5 Meprobamate-d7 226 165 70 5 2 6.5
Norgestrel 313.2 91 (77.1) 130 60 (75) 2 6.2
Primidone 219.3 162.1 (91.1) 70 9 (25) 2 6.1 Primidone-d5 224 167 70 9 2 6.1
Propranolol 260 116 (56) 122 13 (29) 2 6.6
Simazine 202.1 132 (68.1) 72 16 (36) 2 7
Sulfamethoxazole 254 156 (92) 80 10 (30) 2 6.5
Sulfamethoxazole-d6 260 162 80 10 2 6.5 TCEP 285 222.8 95 10 2 7.5

127
Table 3.2. Optimized Compound Parameters in OSPE method
Compound
Prec Ion
(m/z)
Prod Ion (m/z) Frag (V) CE
(V) Cell Acc
(V) RT
(min)
TCEP-d12 297 232 95 10 2 7.5
TCPP 327 99 (81) 72 16 (70) 2 8.4
Testosterone 289 109 (97) 115 25 (25) 2 7.8
Trimethoprim 291 261 (230) 75 25 (25) 2 5.8
Trimethoprim-d3 294 264 75 25 2 5.8
ESI Negative
Benzotriazole 118 90.1 (50) 85 16 (28) 7 6.5
Benzotriazole-d4 122 94 85 16 7 6.5
Bisphenol A 227 212 (133) 115 11 (19) 7 7.7
Bisphenol A-13C12 239 224 115 11 7 7.7 Clofibric Acid 213 127 80 10 7 7.8 Diclofenac 294 250 (214) 75 4 (16) 7 8.6 Diclofenac-13C6 316 272.1 75 5 7 8.6 Gemfibrozil 249.2 121 75 6 7 9.2 Gemfibrozil-d6 255 121 75 6 7 9.2
Hydrochlorothiazide 296 268.9 (204.7) 130 10 (15) 7 5.9
Ibuprofen 205 161 50 0 7 8.8 Ibuprofen-d3 208 164 50 0 7 8.8 Naproxen 229 170 (169) 55 4 (24) 7 8 Naproxen-13C1d3 233 169 55 24 7 8 PFHxA 312.9 268.9 66 5 7 7.4 PFHxA-13C2 314.9 269.9 66 5 7 7.4 PFOA 412.9 368.9 (169) 86 5 (5) 7 8 PFOA-13C4 416.9 371.9 86 5 7 8
PFOS 498.9 99 (80) 210 50 (50) 7 9.2
PFOS-13C4 502.9 99 210 50 7 9.2 Propylparaben 179.1 137.1 (92) 80 7 (20) 7 7.7 Propylparaben-d4 183.1 141.1 80 7 7 7.7 Triclocarban 313 160 (126) 110 5 (25) 7 9.4 Triclocarban-13C6 318.9 159.9 110 5 7 9.4
Triclosan 289 (287) 37 (35) 75 5 (5) 7 9.4
Triclosan-13C12 299 35 75 5 7 9.4

128
Table 3.3
Table 3.3. Optimized source dependent parameters of mass spectrometer
Parameter ESI Positive ESI Negative
Gas Temperature (°C) 250 250 Gas Flow Rate (L/min) 11 11 Nebulizer (psi) 45 45 Sheath Gas Temperature (°C) 375 375 Sheath Gas Flow Rate (L/min) 12 12 Capillary (V) 4000 3500 Nozzle Voltage (V) 0 1500 Delta EMV (V) 400 400 * Samples were analyzed simultaneously in ESI+ and ESI- with fast polarity
switching Table 3.4
Table 3.4. LODs, MDLs and practical MRLs in ultrapure water for all target analytes Analyte LOD (ng/L) MDL (ng/L)
Acesulfame 5 10 Atenolol 1 2.5 Atrazine 0.2 0.3 Benzophenone 5 11.3 Bisphenol A 10 13.1 Caffeine 0.2 0.5 Carbamezapine 0.1# 0.1 Clofibric Acid 0.2 0.7 DEET 0.1 0.3 Dexamethasone 10 14 Diphenhydramine 0.5 0.9 Ditiazem 0.1 0.2 Fluoxetine 1 3 Gemfibrozil 0.2 0.5 Hydracortisone 5 9.3 Ibuprofen 0.5 1.9 Iohexol 25 50 Iopamidol 5 10 Iopromide 10 20 Meprobamate 0.2 0.4 Naproxen 1 2.5 Norgestrel 10 11.6 PFBA NA NA

129
Table 3.4. LODs, MDLs and practical MRLs in ultrapure water for all target analytes Analyte LOD (ng/L) MDL (ng/L)
PFHxA 1 3.6 PFOA 0.5 3 PFOS 5 6.1 Primidone 0.5 2 Propylparaben 1 1.4 Simazine 0.2 0.4 Sucralose 75 100 Sulfamethoxazole 0.2 0.5 TCEP 1 2.1 Testosterone 2.5 4.4 Triclocarban 0.5 1.1 Triclosan 1 2.6 Trimethoprim 0.1# 0.1
# assumed as lowest calibration standard (SNR>>3 at this concentration) $ adjusted for the blank
LOD: Limit of Detection (SNR>3) MDL: Method Detection Limit (SNR>10)
Table 3.5
Table 3.5. MRM Transitions of Analytes for UHPLC-MS/MS Analysis
Compounds MRM Transition
Fraga/Ceb (V) Surrogates MRM
Transition Fraga/Ceb (V)
ER agonists (ESI Negative)
Estriol 287.2 > 145.0 170/44
Estriol-13C3 287.2 > 171.2 170/40
Bisphenol A 227.1 > 212.0 117/16
Bisphenol A-13C12 239.2 > 224.1 109/16 227.1 > 133.0 117/24
Estrone 269.1 > 145.0 170/40
Estrone-13C6 275.2 > 144.9 160/40 269.1 > 183.1 170/35
17β-Estradiol 271.2 > 144.8 155/40
17β-Estradiol-13C3 274.2 > 148.0 175/40 271.2 > 183.0 155/42
17α-Estradiol 271.2 > 144.8 155/40
274.2 > 148.0 175/40 271.2 > 183.0 155/42
17α-Ethinylestradiol 295.2 > 145.0 155/44
17α-Ethynylestradiol-13C2 297.2 > 144.9 140/40 295.2 > 159.0 155/40

130
Table 3.5. MRM Transitions of Analytes for UHPLC-MS/MS Analysis
Compounds MRM Transition
Fraga/Ceb (V) Surrogates MRM
Transition Fraga/Ceb (V)
Other Hormones (ESI Positive)
Triamcinolone 395.2 > 375.1 95/4
395.2 > 225.1 95/12
Hydrocortisone 363.2 > 120.9 130/24
363.2 > 327.0 130/13
Prednisone 359.2 > 147.1 95/24
359.2 > 171.0 95/36
Dexamethasone 393.2 > 373.2 87/4
Dexamethasone-d4 397.2 > 359.6 87/5 393.2 > 355.2 87/5
Norethindrone 299.2 > 109.1 104/28
Norethindrone-d6 305.2 > 87.1 122/40 299.2 > 91.1 104/56
Testosterone 289.0 > 109.0 115/25
289.0 > 97.0 115/25
Norgestrel 313.2 > 91.0 130/60
Norgestrel-d6 319.2 > 91.0 130/60 313.2 > 77.1 130/75
a Fragmentor (Frag); b Collision Energy (CE)
Table 3.6
Table 3.6. MS Source Parameters
Parameter ESI Positive ESI Negative
Gas Temp (°C) 300 300 Gas Flow (L/min) 11 10 Nebulizer (psi) 45 45 Sheath Gas Heater Temp (°C) 375 300 Sheath Gas Flow (L/min) 11 11 Capillary Voltage (V) 4000 3500
Table 3.7
Table 3.7. MRLs of Analytes
Compounds MDLs (ng/L)
ER Agonists Estrone 0.1

131
Table 3.7. MRLs of Analytes
Compounds MDLs (ng/L)
17β-Estradiol 0.5 17α-Estradiol 0.5 17α-Ethinylestradiol 0.5 Estriol 0.2 Bisphenol A 0.2
AR Agonists Testosterone 0.2
PR Agonists Norethindrone 0.2 Norgestrel 0.2
GR Agonists Dexamethasone 0.1 Hydrocortisone 0.1 Prednisone 0.1 Triamcinolone 0.5
Figure 3.2
R1 Date R1 G, 1/s R1 Effluent
NH4-N, mg/L R1 Effluent
NO3-N, mg/L R1 Effluent
NO2-N, mg/L R1 Influent
NH4-N, mg/L 1/22/14 298 5.9 24.6 212 233 1/24/14 298 46 25.2 244 340 1/26/14 298 59 33.2 254 340 1/28/14 298 187 21.6 179 407 1/30/14 298 204 25.4 207 407 2/2/14 298 91 19.4 229 339 2/4/14 298 101 15.3 233 339 2/6/14 298 116 12 218 339 2/8/14 298 142 11.5 189 339
2/10/14 298 181 7.9 140 339 2/12/14 298 229 9.5 123 339 2/20/14 298 147
208
2/21/14 298 56
132 2/22/14 298 5.4
132
2/23/14 298 27.7 18.2 159 209

132
R1 Date R1 G, 1/s R1 Effluent
NH4-N, mg/L R1 Effluent
NO3-N, mg/L R1 Effluent
NO2-N, mg/L R1 Influent
NH4-N, mg/L 2/24/14 298 45 17.3 136 209 2/26/14 298 24.9 20.2 167 209 2/28/14 298 40 23.1 165 214 3/2/14 298 3.5 26.7 168 214 3/4/14 298 13 26.1 240 314 3/5/14 298 8.8
316
3/6/14 298 12 17 310 353 3/7/14 298 8
327
3/8/14 298 20.6 27.4 310 327 3/10/14 298 90
330
3/12/14 298 90
330 3/13/14 298 16.4 18.8 231 240 3/15/14 298 4.9 29.4 212 240 3/17/14 298 4.5 32.2 197 240 3/19/14 298 22.1 36.8 205 259 3/21/14 298 11.3 35.5 201 259 3/23/14 298 4.6 36 221 259 3/25/14 298 2.8 40.4 220 259 3/26/14 298 3.7
292
3/27/14 298 11.3 48 226 320 3/28/14 298 25.9
379
3/31/14 298 67 48.8 260 372 4/2/14 298 31 43.2 254 340 4/4/14 298 13.3 45.2 278 332 4/6/14 298 12 37.6 283 332 4/8/14 298 45 37.4 265 332
4/10/14 298 10.9 43.2 285 326 4/12/14 298 25.7 38.4 274 355 4/15/14 298 16.9 32.8 270 347 4/18/14 298 174 30.4 148 335 4/19/14 298 155
335
4/20/14 298 135
300 4/21/14 298 39
207
4/23/14 298 3.7 90 80 173 4/26/14 298 2 100 129 173 4/29/14 298 2.2 76 48 173 5/1/14 298 2.4 103.6 86 225 5/3/14 298 3 102 80 225 5/5/14 298 3.3 115.2 95 225 5/7/14 298 20.1 83.7 170 288
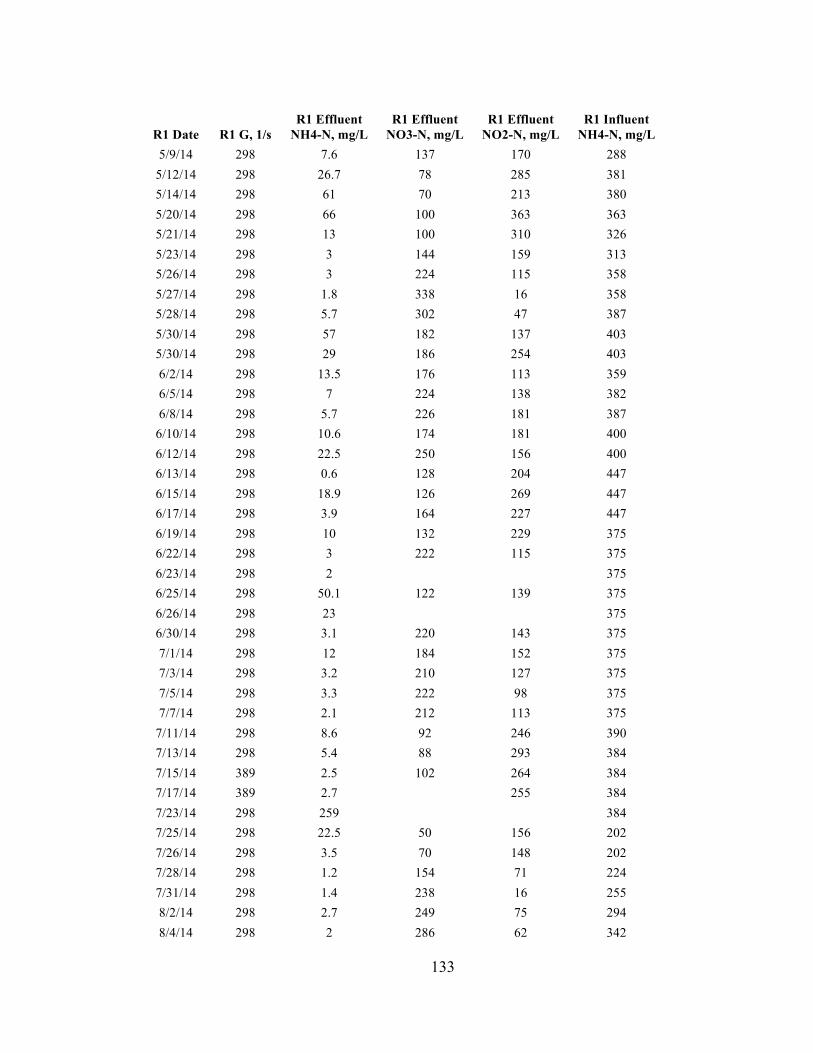
133
R1 Date R1 G, 1/s R1 Effluent
NH4-N, mg/L R1 Effluent
NO3-N, mg/L R1 Effluent
NO2-N, mg/L R1 Influent
NH4-N, mg/L 5/9/14 298 7.6 137 170 288
5/12/14 298 26.7 78 285 381 5/14/14 298 61 70 213 380 5/20/14 298 66 100 363 363 5/21/14 298 13 100 310 326 5/23/14 298 3 144 159 313 5/26/14 298 3 224 115 358 5/27/14 298 1.8 338 16 358 5/28/14 298 5.7 302 47 387 5/30/14 298 57 182 137 403 5/30/14 298 29 186 254 403 6/2/14 298 13.5 176 113 359 6/5/14 298 7 224 138 382 6/8/14 298 5.7 226 181 387
6/10/14 298 10.6 174 181 400 6/12/14 298 22.5 250 156 400 6/13/14 298 0.6 128 204 447 6/15/14 298 18.9 126 269 447 6/17/14 298 3.9 164 227 447 6/19/14 298 10 132 229 375 6/22/14 298 3 222 115 375 6/23/14 298 2
375
6/25/14 298 50.1 122 139 375 6/26/14 298 23
375
6/30/14 298 3.1 220 143 375 7/1/14 298 12 184 152 375 7/3/14 298 3.2 210 127 375 7/5/14 298 3.3 222 98 375 7/7/14 298 2.1 212 113 375
7/11/14 298 8.6 92 246 390 7/13/14 298 5.4 88 293 384 7/15/14 389 2.5 102 264 384 7/17/14 389 2.7
255 384
7/23/14 298 259
384 7/25/14 298 22.5 50 156 202 7/26/14 298 3.5 70 148 202 7/28/14 298 1.2 154 71 224 7/31/14 298 1.4 238 16 255 8/2/14 298 2.7 249 75 294 8/4/14 298 2 286 62 342

134
R1 Date R1 G, 1/s R1 Effluent
NH4-N, mg/L R1 Effluent
NO3-N, mg/L R1 Effluent
NO2-N, mg/L R1 Influent
NH4-N, mg/L 8/6/14 298 0.4 262 118 381 8/9/14 298 100
515
8/11/14 298 1.1 326 1.1 282 9/1/14 298 2.2 130 135 300 9/8/14 298 3.7 132 160 300
9/11/14 298 1.2 182 85 279 9/14/14 298 1.6 201 91 270 9/19/14 298 1.1 201 80 270 9/26/14 298 0.3 201 91 270 10/2/14 298 0.2 200 99 280 10/6/14 298 1.9 296 3 300
10/11/14 298 1.1 250 110 300 10/20/14 298 1.1 200 112 300 10/27/14 298 1.2 201 120 300 11/3/14 298 0.8 12 139 300 11/4/14 298 0.9 177 50 200 11/5/14 298 1.2 178 88 300 11/7/14 298 0.7 110 236 300 11/8/14 298 0.2 82 158 250 11/9/14 298 0.5 92 155 250
11/10/14 298 1.1 90 173 250 11/13/14 298 0.7 94 114 200 11/17/14 298 1 116 110 200 11/19/14 298 1 92 73 170 11/25/14 298 0.5 115 75 170 11/28/14 298 1.5 110 84 170 12/3/14 298 0.1 92 49.4 172 12/7/14 298 0.7 94 8.1 110 12/9/14 298 0.7 99 3 110
12/12/14 298 0.7 98 5 110 12/18/14 298 0.5 89 7 110 12/23/14 298 0.4 91 4.5 110 12/26/14 298 1.2 105 6.1 110 12/29/14 298 0.5 108 4 110
1/2/15 298 0.5 114 4 110 1/8/15 298 0.9 112 3.5 110
1/16/15 298 0.8 163 11.6 160 1/19/15 298 0.8 160 10 160 1/23/15 298 1.2 157 19.6 162 1/27/15 298 0.9 143 28.7 158

135
R1 Date R1 G, 1/s R1 Effluent
NH4-N, mg/L R1 Effluent
NO3-N, mg/L R1 Effluent
NO2-N, mg/L R1 Influent
NH4-N, mg/L 1/30/15 298 66 45 186 255 2/2/15 298 41 47 197 255 2/5/15 298 1.1 205 130 300 2/9/15 298 0.6 171 120 300
2/12/15 298 12 141 136 300 2/16/15 298 11 137 164 300 2/18/15 298 1.1 118 172 300 2/23/15 298 7 47 394 448 2/24/15 298 1 50 400 448 3/2/15 298 150 89 340 550 3/7/15 298 90 96 328 515
3/10/15 298 89 95 321 515 3/11/15 298 98 126 354 515 3/15/15 298 46 90 388 515 3/18/15 298 353 63 213 600 3/21/15 298 0.1 140 6 150 3/23/15 298 1.4 170 4 200 3/24/15 298 2.7 152 131 345 3/25/15 298 2.6 158 200 345 3/27/15 298 103 89 239 464 3/31/15 298 158 68 223 512 4/5/15 298 110 92 288 456
4/11/15 298 150 71 219 440 4/14/15 298 93 70 249 440 4/20/15 298 123 65 240 440
Figure 3.3
Dates G (1/s) R2 Effluent
NH4-N, mg/L R2 Effluent
NO3-N, mg/L R2 Effluent
NO2-N, mg/L R2 Influent
NH4-N, mg/L 1/22/14 298 6.4 7.5 295 304 1/24/14 298 105 9.9 313 434 1/26/14 298 154 10.5 293 434 1/28/14 298 124 13.2 309 434 1/30/14 298 104 8.4 329 434 2/2/14 298 89 4.1 326 415 2/4/14 298 87.2 6.8 340 415 2/6/14 298 66 6.3 368 415 2/8/14 298 82 4.9 351 415
2/10/14 298 71 4.7 357 415 2/12/14 298 51 7.6 401 458

136
Dates G (1/s) R2 Effluent
NH4-N, mg/L R2 Effluent
NO3-N, mg/L R2 Effluent
NO2-N, mg/L R2 Influent
NH4-N, mg/L 2/20/14 298 187
459
2/21/14 298 20
339 2/22/14 298 14
370
2/23/14 298 26.1
435 2/24/14 298 29 11.3 417 435 2/26/14 298 107 9.7 377 495 2/28/14 298 88 13.7 368 499 3/2/14 298 94 21.6 340 499 3/4/14 298 72 14.4 345 485 3/5/14 298 86
474
3/6/14 298 63 18.6 377 420 3/7/14 298 8
370
3/8/14 298 15.3 30 344 413 3/10/14 298 40
413
3/11/14 298 39.5 40 321 413 3/12/14 298 33
406
3/13/14 298 11.9 68.1 318 406 3/15/14 298 36.4 80.1 268 406 3/17/14 298 49 75.2 266 406 3/19/14 298 13.9 93.1 265 381 3/21/14 298 8.6 84.9 269 381 3/23/14 298 11.8 94.5 269 381 3/25/14 298 11.5 98.4 238 364 3/26/14 298 6.8
364
3/27/14 298 3.7 172.8 184 364 3/28/14 298 6
392
3/31/14 298 72 115.8 252 431 4/2/14 298 16 109.6 263 415 4/4/14 298 36.7 108 248 419 4/6/14 298 34 81.2 270 419 4/8/14 298 57 83.7 244 419
4/10/14 298 7.8 82 275 373 4/12/14 298 4 86.5 251 358 4/15/14 298 2.6 126.5 200 358 4/18/14 298 7 71.2 200 330 4/19/14 298 8
333
4/20/14 298 8
333 4/21/14 298 3
333
4/23/14 298 6.7 128 188 333 4/26/14 298 3.8 130 159 335 4/29/14 298 2.2 90 118.4 338 5/1/14 298 2.9 118.4 195 339 5/3/14 298 2.8 190 120 343 5/5/14 298 2.6 272.3 65 343 5/7/14 298 1 291.1 68 370 5/9/14 298 3.3 299 66 370
5/12/14 298 10.1 221 163 423 5/14/14 298 3.1 165 153 384 5/16/14 298 14.4 166 173 384 5/21/14 298 2 310 24 343 5/23/14 298 0 350 13 356

137
Dates G (1/s) R2 Effluent
NH4-N, mg/L R2 Effluent
NO3-N, mg/L R2 Effluent
NO2-N, mg/L R2 Influent
NH4-N, mg/L 5/26/14 298 3.1 292 151 394 5/27/14 298 1.6 375 28 394 5/30/14 298 8.2 322 100 410 6/2/14 298 6.4
126 410
6/5/14 298 2 400 20 413 6/8/14 298 2.2 390 15.7 365
6/10/14 298 5.9 356 40 374 6/12/14 298 1.4
374
6/15/14 298 1.2 7 360 376 6/17/14 298 1.6 8 380 376 6/19/14 298 1.3 400 5 420 6/22/14 298 10.6 196 195 420 6/26/14 298 2.6 268 145 425 6/30/14 298 2 356 105 425 7/1/14 298 2.1 348 48 425 7/3/14 298 1.9 378 17 425 7/5/14 298 1.9 392 8 425 7/7/14 298 0.9 402 6 425 7/8/14 298 1.3
461
7/11/14 298 69 164 154 459 7/13/14 298 6 196 179 399 7/15/14 298 1.2 374 5 399 7/17/14 298 1.7
6 399
7/19/14 298 0.9
7 399 7/21/14 298 1.8
8 399
7/23/14 298 0.01 190 131 397 7/25/14 298 30.7 174 190 413 7/26/14 298 14 189 205 413 7/28/14 298 4.3 190 195 408 7/31/14 298 6.3 200 221 448 8/2/14 298 11.7 198 259 486 8/4/14 298 5 189 273 493 8/6/14 298 43 168 285 512 8/9/14 298 50
512
8/11/14 298 1.1 326 8.2 324 8/18/14 298 0.8 250 1 242 8/30/14 298 300 209 230 715 9/5/14 298 0.5 244 1.2 242 9/8/14 298 0.5 248 1.1 242
9/11/14 298 0.4 278 1 277 9/14/14 298 0.4 273 7 277 9/15/14 298 0 300 1 277 9/19/14 298 334 180 209 770 10/6/14 298 1.1 242 1 250
10/11/14 298 1.1 250 110 370 10/13/14 298 0.2 256 0 250 10/20/14 298 1.3 240 1.3 243 10/23/14 298 181 187 274 660 10/26/14 298 0.5 246 11 240 11/3/14 298 123 180 288 660 11/4/14 298 138 178 285 660

138
Dates G (1/s) R2 Effluent
NH4-N, mg/L R2 Effluent
NO3-N, mg/L R2 Effluent
NO2-N, mg/L R2 Influent
NH4-N, mg/L 11/8/14 298 206 312 113 660 11/9/14 298 0.1 7 234 240
11/13/14 298 1.4 290 6 300 11/17/14 298 1.1 274 7 300 11/19/14 298 0.9 264 9 300 11/28/14 298 1.5 280 22 300 12/3/14 298 0.8 312 0.8 293 12/7/14 298 1.3 310 0.9 316 12/9/14 298 0.7 306 1.2 302
12/15/14 298 0.6 348 0.8 302 12/18/14 298 1.4 312 5 302 12/23/14 298 1.6 350 0.7 350 12/29/14 298 1.3 355 0.8 350
1/2/15 298 0.7 378 0.8 350 1/8/15 298 1.5 458 0.9 400
1/16/15 298 0.6 434 0.8 400 1/19/15 298 0.6 400 0.8 400 1/23/15 298 1.9 340 0.53 280 1/27/15 298 0.8 322 0.46 280 1/30/15 298 131 298 139 600 2/2/15 298 114 165 309 600 2/5/15 298 210 153 305 600 2/9/15 298 84 157 383 600
2/12/15 298 117 186 290 600 2/16/15 298 183 281 187 600 2/18/15 298 149 380 122 600 2/23/15 298 256 360 20 600 2/24/15 298 275 340 17 600 3/7/15 298 310 336 8 604
3/10/15 298 110 434 5 604 3/11/15 298 149 452 7 604 3/15/15 298 165 440 14 604 3/18/15 298 525 67 9 600 3/21/15 298 0.7 150 6 150 3/23/15 298 70 140 6 200 3/24/15 298 50 168 58 345 3/25/15 298 34.6 157 128 345 3/27/15 298 105 132 195 464 3/31/15 298 83 158 192 512 4/5/15 298 60 139 291 456
4/11/15 298 130 107 230 440 4/14/15 298 81 104 217 440 4/20/15 298 123 105 240 440 4/25/15 298 126 110 250 450 5/5/15 298 158 128 150 450 5/6/15 298 125
400
5/7/15 298 80
400 5/8/15 298 82 194 148 400
5/13/15 298 150 139 153 430 5/20/15 298 105 130 137 400 5/30/15 298 1 220 200 400

139
Figure 3.4
Concentration (ng/L, ppt)
Compound 4/6/15 3/8/15 03/08/15
DuP 6/5/15 06/05/15
Dup PFOA 23 <18 <16 <24 <23 Clofibric Acid <51 <33 <31 <17 30 Ditiazem 100 <210 <190 120 130 Meprobamate 130 140 140 150 150 Primidone 160 100 200 160 200 Triclocarban 310 170 190
Carbamezapine 220 260 270 280 290 Trimethoprim 210 310 330 330 330 Hydracortisone <280
370 270
TCEP
<580 <350 450 320 Bisphenol A <170 <440 560
DEET 500 220 220 2000 2000 Triclosan 1700 880 810
Diphenhydramine 270 >2500 >2500 1700 1700 Benzophenone >2500 <710 790 1200 1700 Atenolol 1200 1700 1200 1100 1200 Sulfamethoxazole 1500 1300 1400 1500 1500 Propylparaben 2200 1500 1700 1200 1200 Gemfibrozil 2100 2200 2200
TCPP
4400 2300 Naproxen >2500 >2500 >2500 19000 21000 Caffeine >2500 >2500 >2500 70000 77000 Propranolol
<34 <34
Fluoxetine <450
<160 <170 Dexamethasone <9.1 <540 <790
Atrazine <39 <44 <41 <39 <45 PFOS <14 <14 <14
Ibuprofen >2500 >2500 >2500 Prednisone
<56 <47 <200 <240
Testosterone <79 <110 <95 <510 <600 Simazine <16 <18 <16 <16 <18 > over range
< Below detection limit

140
Figure 3.5
Concentration (ppt, ng/L)
4/5/06
Fluocinolone acetonide 0.22 Dexamethasone 0.29 Betamethasone 0.57 Progesterone 3.7 Prednisone 4.49 17α-Ethynylestradiol < 0.5 Methylprednisolone 6.5 Corticosterone 9.8 17α-Estradiol 11.2 Prednisolone 12.3 17-Hydroxyprogesterone 21.2 Triamcinolone acetonide 22.9 17β-Estradiol 29.9 Testosterone 35.8 Estrone 54.1 Hydrocortisone 159 Estriol 166 Cortisone 228 Bisphenol A 395 Norethindrone < 0.2 Norgestrel < 0.2
Figure 3.6
Relative Abundance (Percent)
3/16/15 Synthetic
Feed
6/10/15 Primary
Effluent Feed Unclassified; Unclassified; Unclassified; Unclassified
18.69 6.52
Proteobacteria; Betaproteobacteria; Nitrosomonadales ;Nitrosomonadaceae
15.82 2.69
Proteobacteria; Alphaproteobacteria; Rhizobiales; Bradyrhizobiaceae
14.66 4.00

141
Relative Abundance (Percent)
3/16/15 Synthetic
Feed
6/10/15 Primary
Effluent Feed Proteobacteria; Betaproteobacteria; Burkholderiales; Comamonadaceae
11.86 26.55
Actinobacteria; Actinobacteria; Actinomycetales; Microbacteriaceae
11.15 5.00
Proteobacteria; Gammaproteobacteria; Xanthomonadales; Xanthomonadaceae
5.10 7.28
Bacteroidetes; Flavobacteriia; Flavobacteriales; Flavobacteriaceae
3.42 8.54
Proteobacteria; Alphaproteobacteria; Rhizobiales; Phyllobacteriaceae
1.02 2.05
Bacteroidetes; Unclassified; Unclassified; Unclassified
0.29 4.36
Bacteroidetes; Flavobacteriia; Flavobacteriales; Cryomorphaceae
0.28 8.80
Proteobacteria; Alphaproteobacteria; Caulobacterales; Caulobacteraceae
0.20 0.21
Actinobacteria; Actinobacteria; Actinomycetales; Unclassified
0.03 0.01
Relative Abundance < 4% 17.50 23.99
Shannon Diversity Index
2.58 2.87
Figure 3.7 - 3.8
time (hrs)
R2A (0 mg/L ATU)
R2B (0.1 mg/L ATU)
R2C (0.4mg/L ATU)
R2D (3 mg/L ATU)
Effluent Ammonia (mgN/L)
4/6/15 13:15 0 49.8 51.4 49.4 50.8 4/6/15 14:45 1.5 43.4 47.6 48.2 50.2 4/6/15 16:15 3 37.7 42 46 48.9 4/6/15 17:45 4.5 33.3 42.6 48.6 49.2 4/6/15 19:15 6 25.9 41 49 48.6
Effluent Nitrate (mgN/L)
4/6/15 13:15 0 4 4.6 3.1 4.1 4/6/15 14:45 1.5 5.8 6.3 5.4 8.4 4/6/15 16:15 3 7.3 8.3 7 10.8 4/6/15 17:45 4.5 9.5 11.3 8.7 13.9

142
time (hrs)
R2A (0 mg/L ATU)
R2B (0.1 mg/L ATU)
R2C (0.4mg/L ATU)
R2D (3 mg/L ATU)
4/6/15 19:15 6 10.9 14.4 9.8 15.4
Effluent Nitrite (mgN/L)
4/6/15 13:15 0 8.5 10.3 6.4 11.8 4/6/15 14:45 1.5 13 12.9 5.6 9.1 4/6/15 16:15 3 16.6 12.1 3.4 6.3 4/6/15 17:45 4.5 20.9 10.5 1.8 3.7 4/6/15 19:15 6 24.3 9.9 1 2.1
Effluent DOC (mgN/L)
4/6/15 13:15 0 50.32
47.56 4/6/15 14:45 1.5
41.80
4/6/15 16:15 3 40.13
38.19 4/6/15 17:45 4.5
29.40
4/6/15 19:15 6 33.22
23.70
Figure 3.9 - 3.10
Concentration (ppt, ng/L) Percent Removal
04/06/15 PE
R2A T = 6 hr
R2D T = 6 hr
R2A (Uninhibited)
R2D (Nitrification Inhibited)
Triclosan 1700 450 - 73.5% Propylparaben 2200 780 740 64.5% 66.4%
Triclocarban 310 110 200 64.5% 35.5% Trimethoprim 210 120 210 42.9% 0.0% Primidone 160 130 170 18.8% -6.3% PFOA 23 19 24 17.4% -4.3% Ditiazem 100 85 81 15.0% 19.0% Sulfamethoxazole 1500 1300 1300 13.3% 13.3% Gemfibrozil 2100 2000 2100 4.8% 0.0% Atenolol 1200 1200 1000 0.0% 16.7% DEET 500 500 490 0.0% 2.0% Meprobamate 130 130 130 0.0% 0.0% Carbamezapine 220 230 220 -4.5% 0.0% Diphenhydramine 270 310 590 -14.8% -118.5% 17β-Estradiol 29.90 < 1.0 < 1.0 96.6% 96.6% 17α-Estradiol 11.20 < 1.0 < 1.0 91.0% 91.0% Testosterone 35.80 3.10 4.40 91.3% 87.7% Estrone 54.10 37.50 42.10 30.7% 22.2% Estriol 166.00 130.50 81.60 21.4% 50.8%

143
Concentration (ppt, ng/L) Percent Removal
04/06/15 PE
R2A T = 6 hr
R2D T = 6 hr
R2A (Uninhibited)
R2D (Nitrification Inhibited)
Triamcinolone acetonide 22.90 20.80 21.60 9.2% 5.7% Hydrocortisone 159.00 147.00 145.00 7.5% 8.8% Fluocinolone acetonide 0.22 0.21 0.26 4.5% -18.2% Bisphenol A 395.00 403.00 397.00 -2.0% -0.5% Methylprednisolone 6.50 7.15 8.09 -10.0% -24.5% Dexamethasone 0.29 0.33 0.23 -13.8% 20.7% Betamethasone 0.57 0.65 0.68 -14.0% -19.3% Cortisone 228.00 328.00 417.00 -43.9% -82.9% 17-Hydroxyprogesterone 21.20 31.20 20.20 -47.2% 4.7% Prednisolone 12.30 28.60 43.20 -132.5% -251.2% Prednisone 4.49 11.60 17.20 -158.4% -283.1% Progesterone 3.70 15.50 12.10 -318.9% -227.0% Corticosterone 9.80 46.60 42.90 -375.5% -337.8%
Figure 3.11
Concentration (ppt, ng/L)
04/06/15 PE
04/06/15 Continuous
Reactor % Removal Corticosterone 9.8 < 0.20 98.0% 17β-Estradiol 29.9 < 1.0 96.7% Cortisone 228 8.87 96.1% Testosterone 35.8 1.5 95.8% Hydrocortisone 159 9.44 94.1% Estriol 166 < 10 94.0% 17α-Estradiol 11.2 < 1.0 91.1% Estrone 54.1 7.8 85.6% Prednisolone 12.3 2.56 79.2% 17-Hydroxyprogesterone 21.2 4.6 78.3% Progesterone 3.7 1.2 67.6% Dexamethasone 0.29 0.11 62.1% Prednisone 4.49 2.25 49.9% Methylprednisolone 6.5 3.32 48.9% Betamethasone 0.57 0.41 28.1% Triamcinolone acetonide 22.9 17.8 22.3% Fluocinolone acetonide 0.22 0.19 13.6% Bisphenol A 395 368 6.8%

144
Appendix C: Chapter 4 Data
Figure 4.2
mg/L-N mg/L
Influent Ammonia
Effluent Ammonia
Effluent Nitrate
Effluent Nitrite
Attached Volatile Solids
HDPE Reator 9/12/15 47 33.5 18.8 2.0
9/14/15 47 43.5 7.1 1.4 9/16/15 47 43.5 3.2 1.4 9/18/15 28.7 28.7 2.2 1.4 9/20/15 28.7 25.1 1.4 1.4 9/22/15 28.7 23 2.4 3.8 9/24/15 28.7 22.4 3.4 3.8 9/27/15 27.6 23.6 4.2 1.5 10/1/15 27.6 22.7 6.4 0.9 10/4/15 73 50 12.7 1.0 10/6/15 73 50 20.0 1.1 10/10/15 38 10 30.0 2.0 10/15/15 38 5.4 36.8 3.4 10/19/15 55 1.2 58.0 0.9 10/22/15 75.3 1.4 84.5 1.2 10/26/15 111.2 21.6 92.0 3.3 10/31/15 111 21.6 106.9 3.3 11/5/15 111 14.5 114.3 2.3 11/9/15 111 10 115.0 2.0 147
Nylon Reactor 9/12/15 47 38 8.9 1.4
9/14/15 47 45.8 2.3 1.3 9/16/15 47 46.7 0.8 0.9 9/18/15 28.7 28.7 0.6 0.8 9/20/15 28.7 27.7 0.6 1.8 9/22/15 28.7 23 1.0 2.9 9/24/15 28.7 24 1.2 3.9 9/27/15 27.6 24.1 1.5 2.7 10/1/15 27.6 24.2 2.3 2.3 10/4/15 73 48 6.5 3.2 10/6/15 73 44.7 15.1 3.5

145
mg/L-N mg/L
Influent Ammonia
Effluent Ammonia
Effluent Nitrate
Effluent Nitrite
Attached Volatile Solids
10/10/15 38 0.9 30.0 3.5 10/15/15 38 0.9 46.8 0.9 10/19/15 55 0.7 56.7 2.9 10/22/15 75.3 0.9 87.5 2.9 10/26/15 111 8.6 89.1 22.2 10/30/15 111 3.1 108.5 16.9 11/5/15 111 19.3 80.1 26.0 11/9/15 111 15 93.0 20.0 48
Figure 4.3
% Relative Abundance
10/26/15 Nylon
10/26/15 HDPE
Proteobacteria; Alphaproteobacteria; Rhizobiales; Rhizobiaceae
34.3 1.4
Proteobacteria; Alphaproteobacteria; Rhizobiales; Hyphomicrobiaceae
12.6 18.2
Proteobacteria; Alphaproteobacteria; Rhizobiales; Phyllobacteriaceae
5.8 3.8
Proteobacteria; Alphaproteobacteria; Rhizobiales; Bradyrhizobiaceae
5.0 2.8
Proteobacteria; Alphaproteobacteria; Sphingomonadales; Sphingomonadaceae
5.2 6.6
Proteobacteria; Betaproteobacteria; Burkholderiales; Comamonadaceae
8.5 4.9
Proteobacteria; Betaproteobacteria; Nitrosomonadales; Nitrosomonadaceae
3.8 0.6
Proteobacteria; Betaproteobacteria; Rhodocyclales; Rhodocyclaceae 2.5 5.9
Proteobacteria; Gammaproteobacteria; Xanthomonadales; Xanthomonadaceae 1.4 12.9
Actinobacteria; Actinobacteria; Actinomycetales; Microbacteriaceae 6.6 0.8
Bacteroidetes; Sphingobacteriia; Sphingobacteriales; Unclassified
0.9 3.3

146
% Relative Abundance
10/26/15 Nylon
10/26/15 HDPE
Bacteroidetes; Flavobacteriia; Flavobacteriales; Cryomorphaceae
0.3 6.6
Relative Abundance < 3% 6.3 24.3 Unclassified 6.8 8.0
Figure 4.4
Concentration (mg/L-N)
Influent Ammonia
Effluent Ammonia
Effluent Nitrate
Effluent Nitrite
HDPE 6/7/16 8.6 5.3 1.9 1.8
6/9/16 10.0 6.1 1.3 2.3 6/14/16 12.2 5.4 2.4 3.4 6/20/16 16.0 8.8 2.6 3.4 7/4/16 17.2 0.6 17.0 1.1 7/14/16 20.1 0.4 21.4 0.7 7/27/16 20.1 0.4 18.2 0.8 8/4/16 23.4 0.6 23.9 0.8 8/9/16 23.4 0.4 23.1 0.8 8/15/16 23.4 0.4 22.0 0.8 8/18/16 23.4 0.3 24.1 1.0 8/22/16 25.0 0.3 26.5 0.8 8/27/16 48.0 0.5 54.2 1.4 9/7/16 48.0 0.3 40.7 3.6 9/10/16 50.0 1.0 33.0 21.1 9/16/16 50.0 0.3 32.1 23.9 9/22/16 50.0 0.1 53.2 4.9 9/27/16 65.0 0.1 65.9 1.9 10/2/16 65.0 0.3 59.3 2.2 Nylon
6/7/16 8.6 3 4.8 1.2 6/9/16 10 6.1
6/14/16 12.2 0.77 18.3 0.6 6/20/16 16 8 7.0 5.3 7/4/16 17.2 0.6 20.9 1.5 7/14/16 20.1 0.3 7.5 3.2 7/27/16 20.1 0.5 17.7 0.8

147
Concentration (mg/L-N)
Influent Ammonia
Effluent Ammonia
Effluent Nitrate
Effluent Nitrite
8/4/16 23.4 0.4 24.8 0.8 8/9/16 23.4 0.4 24.5 0.7 8/15/16 23.4 0.4 24.4 0.8 8/18/16 23.4 0.2 23.6 0.9 8/22/16 25 0.2 25.6 1.1 8/27/16 48 0.9 54.1 2.9 9/7/16 48 0.2 41.2 1.5 9/10/16 50 0.1 54.0 1.6 9/16/16 50 0.3 54.6 2.5 9/22/16 50 0.4 51.2 3.0 9/27/16 65 0.2 53.4 2.1 10/2/16 65 0.1 77.7 2.2
Triclosan Calibration
Standard Concentration (mg/L)
Area (mAU*min)
0 0 5 10363.6
2.5 4535.6 1 2425.5
0.5 1094.9 RSQ 0.9926 Slope (mAU*min*L*mg-1) 2023
Caffeine Calibration
Standard Concentration (mg/L)
Area (mAU*min)
5 8889.44 2.5 4509.4 1 1928.18
0.25 404 0 0

148
RSQ 0.9996 Slope (mAU*min*L*mg-1) 1778
Figure 4.5
Removal Rate (ug/L*hr)
Nylon Biofilm
HDPE Biofilm
Caffiene 200 ug/L Test 1 12.2 2.4 Caffeine 80 ug/L Test 2* -0.2 -0.5 Triclosan 100 ug/L Test 1 58.9 28.2 Triclosan 100 ug/L Test 2 42.0 31.3
Figure 4.6
Sample Peak Area (mAu*min)
Concentration Measured
(mg/L)
Sample Volume
(mL)
Elution Volume
(mL)
Calculated Triclosan Sample
Concentraion (ug/L)
Before Dose 0 0 100 12 0 After After Dose 1435 0.718 100 12 86.1 After Dose Dup 1294 0.647 100 12 77.6 Rnylon T=1 1017 0.508 100 12 61.0 Rnylon T=61 303 0.152 100 12 18.2 Rnylon T=61 Dup 331 0.165 100 12 19.9 Rhdpe T=1 1218 0.609 100 12 73.1 Rhdpe T=1 Dup 1067 0.533 100 12 64.0 Rhdpe T=61 565 0.282 100 12 33.9 Rhdpe T=61 Dup 679 0.339 100 12 40.7
Time (min) Average Triclosan
Concentration (ug/L) Removal Nylon Biofilm
0 81.9 0.0% 1 61.0 25.5%
61 19.0 76.8% HDPE Biofilm
0 81.9 0.0% 1 68.5 16.3%
61 37.3 54.5%

149
Figure 4.7
Peak Area (mAu*min)
Concentration Measured
(mg/L)
Sample Volume
(mL)
Elution Volume
(mL)
Calculated Triclosan Sample
Concentraion (ug/L)
Before Dose 0 0.000 100 10 0.0 After After Dose 2231 1.115 100 10 111.5 After Dose Dup 2071 1.036 100 10 103.6 Rnylon T=1 1737 0.868 100 10 86.8 Rnylon T=1 1725 0.863 100 10 86.3 Rnylon T=61 1069 0.534 100 10 53.4 Rnylon T=61 Dup 1201 0.601 100 10 60.1 Rhdpe T=1 1783 0.892 100 10 89.2 Rhdpe T=1 Dup 1688 0.844 100 10 84.4 Rhdpe T=61 1626 0.813 100 10 81.3 Rhdpe T=61 Dup 1641 0.821 100 10 82.1
Time (min) Average Triclosan
Concentration (ug/L) Removal Nylon
0 107.5 0.0% 1 86.5 19.5%
61 56.7 47.2% HDPE
0 107.5 0.0% 1 86.8 19.3%
60 81.7 24.1%
Figure 4.8
Peak Area (mAu*min)
Concentration Measured
(mg/L)
Sample Volume
(mL)
Elution Volume
(mL)
Calculated Caffeine Sample
Concentraion (ug/L)
Before Dose 0 0.000 100 10 0.0 After After Dose 1454 0.814 100 10 81.4 After Dose Dup 1491 0.834 100 10 83.4 Rnylon T=1 1354 0.758 100 10 75.8 Rnylon T=1 1386 0.776 100 10 77.6 Rnylon T=61 1386 0.776 100 10 77.6 Rnylon T=61 Dup 1391 0.779 100 10 77.9
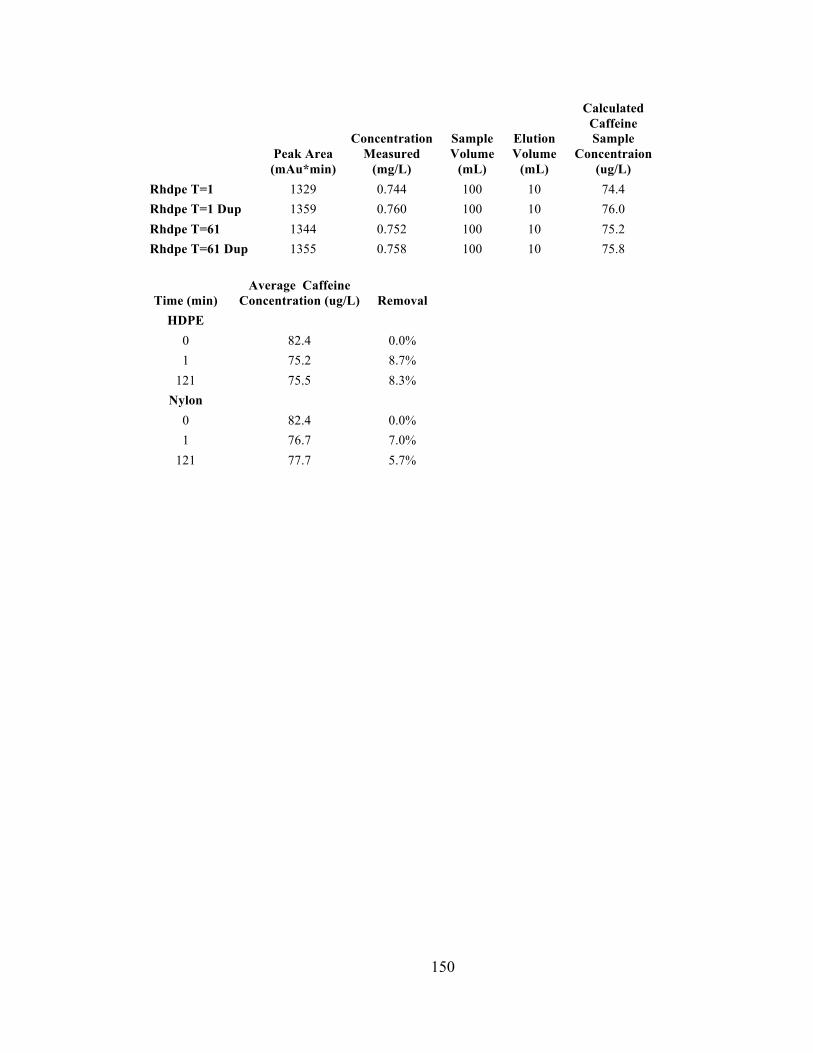
150
Peak Area (mAu*min)
Concentration Measured
(mg/L)
Sample Volume
(mL)
Elution Volume
(mL)
Calculated Caffeine Sample
Concentraion (ug/L)
Rhdpe T=1 1329 0.744 100 10 74.4 Rhdpe T=1 Dup 1359 0.760 100 10 76.0 Rhdpe T=61 1344 0.752 100 10 75.2 Rhdpe T=61 Dup 1355 0.758 100 10 75.8
Time (min) Average Caffeine
Concentration (ug/L) Removal HDPE
0 82.4 0.0% 1 75.2 8.7%
121 75.5 8.3% Nylon
0 82.4 0.0% 1 76.7 7.0%
121 77.7 5.7%
Related Documents