Review Article Mouse phenotyping Helmut Fuchs a,1 , Valérie Gailus-Durner a,1 , Thure Adler b , Juan Antonio Aguilar-Pimentel c , Lore Becker d , Julia Calzada-Wack e , Patricia Da Silva-Buttkus e , Frauke Neff e , Alexander Götz f , Wolfgang Hans a , Sabine M. Hölter g , Marion Horsch a , Gabi Kastenmüller h , Elisabeth Kemter i , Christoph Lengger a , Holger Maier a , Mikolaj Matloka j , Gabriele Möller j , Beatrix Naton a , Cornelia Prehn j , Oliver Puk g , Ildikó Rácz k , Birgit Rathkolb i , Werner Römisch-Margl h , Jan Rozman l , Rui Wang-Sattler m , Anja Schrewe n , Claudia Stöger a , Monica Tost e , Jerzy Adamski j,r , Bernhard Aigner i , Johannes Beckers a,s , Heidrun Behrendt o , Dirk H. Busch b , Irene Esposito e,t , Jochen Graw g , Thomas Illig m , Boris Ivandic n , Martin Klingenspor l , Thomas Klopstock d , Elisabeth Kremmer p , Martin Mempel c,q , Susanne Neschen a , Markus Ollert c , Holger Schulz f , Karsten Suhre h , Eckhard Wolf i , Wolfgang Wurst g,r , Andreas Zimmer k , Martin Hrabe ˇ de Angelis a,s,⇑ a Institute of Experimental Genetics, Helmholtz Zentrum München, German Research Center for Environmental Health, Ingolstädter Landstraße 1, 85764 München/Neuherberg, Germany b Institute for Medical Microbiology, Immunology, and Hygiene, Technische Universität München, Trogerstraße 30, 81675 München, Germany c Clinical Research Division of Molecular and Clinical Allergotoxicology, Department of Dermatology and Allergy, Technische Universität München, Biedersteiner Straße 29, 80802 München, Germany d Department of Neurology, Friedrich-Baur-Institut, Ludwig-Maximilians-Universität München, Ziemssenstraße 1, 80336 München, Germany e Institute of Pathology, Helmholtz Zentrum München, German Research Center for Environmental Health, Ingolstädter Landstraße 1, 85764 München/Neuherberg, Germany f Comprehensive Pneumology Center, Institute of Lung Biology and Disease, Helmholtz Zentrum München, German Research Center for Environmental Health, Ingolstädter Landstraße 1, 85764 München/Neuherberg, Germany g Institute of Developmental Genetics, Helmholtz Zentrum München, German Research Center for Environmental Health, Ingolstädter Landstraße 1, 85764 München/Neuherberg, Germany h Institute of Bioinformatics and Systems Biology, Helmholtz Zentrum München, German Research Center for Environmental Health, Ingolstädter Landstraße 1, 85764 München/ Neuherberg, Germany i Chair for Molecular Animal Breeding and Biotechnology, Gene Center, Ludwig-Maximilians-Universität München, Feodor Lynen-Straße 25, 81377 München, Germany j Institute of Experimental Genetics, Genome Analysis Center, Helmholtz Center Munich, German Research Center for Environment and Health, 85764 München/Neuherberg, Germany k Institute of Molecular Psychiatry, University of Bonn, Sigmund-Freud-Straße 25, 53105 Bonn, Germany l Molecular Nutritional Medicine, Else Kröner-Fresenius Center, Technische Universität München, Am Forum 5, D-85350 Freising-Weihenstephan, Germany m Institute of Epidemiology, Helmholtz Zentrum München, German Research Center for Environmental Health, Ingolstädter Landstraße 1, 85764 München/Neuherberg, Germany n Department of Medicine III, Division of Cardiology, University of Heidelberg, Otto-Meyerhof-Zentrum, Im Neuenheimer Feld 350, 69120 Heidelberg, Germany o Institute for Molecular Immunology, Helmholtz Zentrum München, German Research Center for Environmental Health, Marchioninistraße 25, 81377 Munich, Germany p Division of Environmental Dermatology and Allergy (KKG UDA), Helmholtz Zentrum München and Technische Universität München, 85764 Munich/Neuherberg, Germany q Department of Dermatology, Venerology, and Allergy University Medicine, George-August-Universität Göttingen, Robert-Koch-Straße 40, 37075 Göttingen, Germany r Lehrstuhl für Entwicklungsgenetik, Technische Universität München, Am Hochanger 8, 85350 Freising-Weihenstephan, Germany s Lehrstuhl für Experimentelle Genetik, Technische Universität München, Am Hochanger 8, 85350 Freising-Weihenstephan, Germany t Institute of Pathology, Technische Universität München, Ismaningerstraße 22, 81675 Munich, Germany article info Article history: Available online 12 August 2010 abstract Model organisms like the mouse are important tools to learn more about gene function in man. Within the last 20 years many mutant mouse lines have been generated by different methods such as ENU muta- genesis, constitutive and conditional knock-out approaches, knock-down, introduction of human genes, and knock-in techniques, thus creating models which mimic human conditions. Due to pleiotropic effects, one gene may have different functions in different organ systems or time points during develop- ment. Therefore mutant mouse lines have to be phenotyped comprehensively in a highly standardized manner to enable the detection of phenotypes which might otherwise remain hidden. The German Mouse Clinic (GMC) has been established at the Helmholtz Zentrum München as a phenotyping platform with 1046-2023/$ - see front matter Ó 2010 Elsevier Inc. All rights reserved. doi:10.1016/j.ymeth.2010.08.006 ⇑ Corresponding author at: Institute of Experimental Genetics, Helmholtz Zentrum München, German Research Center for Environmental Health, Ingolstädter Landstraße 1, 85764 München/Neuherberg, Germany. E-mail address: [email protected] (M. Hrabe ˇ de Angelis). 1 Contributed equally to the work. Methods 53 (2011) 120–135 Contents lists available at ScienceDirect Methods journal homepage: www.elsevier.com/locate/ymeth

Welcome message from author
This document is posted to help you gain knowledge. Please leave a comment to let me know what you think about it! Share it to your friends and learn new things together.
Transcript
Methods 53 (2011) 120–135
Contents lists available at ScienceDirect
Methods
journal homepage: www.elsevier .com/locate /ymeth
Review Article
Mouse phenotyping
Helmut Fuchs a,1, Valérie Gailus-Durner a,1, Thure Adler b, Juan Antonio Aguilar-Pimentel c, Lore Becker d,Julia Calzada-Wack e, Patricia Da Silva-Buttkus e, Frauke Neff e, Alexander Götz f, Wolfgang Hans a,Sabine M. Hölter g, Marion Horsch a, Gabi Kastenmüller h, Elisabeth Kemter i, Christoph Lengger a,Holger Maier a, Mikolaj Matloka j, Gabriele Möller j, Beatrix Naton a, Cornelia Prehn j, Oliver Puk g,Ildikó Rácz k, Birgit Rathkolb i, Werner Römisch-Margl h, Jan Rozman l, Rui Wang-Sattler m, Anja Schrewe n,Claudia Stöger a, Monica Tost e, Jerzy Adamski j,r, Bernhard Aigner i, Johannes Beckers a,s, Heidrun Behrendt o,Dirk H. Busch b, Irene Esposito e,t, Jochen Graw g, Thomas Illig m, Boris Ivandic n, Martin Klingenspor l,Thomas Klopstock d, Elisabeth Kremmer p, Martin Mempel c,q, Susanne Neschen a, Markus Ollert c,Holger Schulz f, Karsten Suhre h, Eckhard Wolf i, Wolfgang Wurst g,r, Andreas Zimmer k,Martin Hrabe de Angelis a,s,⇑a Institute of Experimental Genetics, Helmholtz Zentrum München, German Research Center for Environmental Health, Ingolstädter Landstraße 1,85764 München/Neuherberg, Germanyb Institute for Medical Microbiology, Immunology, and Hygiene, Technische Universität München, Trogerstraße 30, 81675 München, Germanyc Clinical Research Division of Molecular and Clinical Allergotoxicology, Department of Dermatology and Allergy, Technische Universität München, Biedersteiner Straße 29, 80802München, Germanyd Department of Neurology, Friedrich-Baur-Institut, Ludwig-Maximilians-Universität München, Ziemssenstraße 1, 80336 München, Germanye Institute of Pathology, Helmholtz Zentrum München, German Research Center for Environmental Health, Ingolstädter Landstraße 1, 85764 München/Neuherberg, Germanyf Comprehensive Pneumology Center, Institute of Lung Biology and Disease, Helmholtz Zentrum München, German Research Center for Environmental Health, Ingolstädter Landstraße1, 85764 München/Neuherberg, Germanyg Institute of Developmental Genetics, Helmholtz Zentrum München, German Research Center for Environmental Health, Ingolstädter Landstraße 1, 85764 München/Neuherberg,Germanyh Institute of Bioinformatics and Systems Biology, Helmholtz Zentrum München, German Research Center for Environmental Health, Ingolstädter Landstraße 1, 85764 München/Neuherberg, Germanyi Chair for Molecular Animal Breeding and Biotechnology, Gene Center, Ludwig-Maximilians-Universität München, Feodor Lynen-Straße 25, 81377 München, Germanyj Institute of Experimental Genetics, Genome Analysis Center, Helmholtz Center Munich, German Research Center for Environment and Health, 85764 München/Neuherberg, Germanyk Institute of Molecular Psychiatry, University of Bonn, Sigmund-Freud-Straße 25, 53105 Bonn, Germanyl Molecular Nutritional Medicine, Else Kröner-Fresenius Center, Technische Universität München, Am Forum 5, D-85350 Freising-Weihenstephan, Germanym Institute of Epidemiology, Helmholtz Zentrum München, German Research Center for Environmental Health, Ingolstädter Landstraße 1, 85764 München/Neuherberg, Germanyn Department of Medicine III, Division of Cardiology, University of Heidelberg, Otto-Meyerhof-Zentrum, Im Neuenheimer Feld 350, 69120 Heidelberg, Germanyo Institute for Molecular Immunology, Helmholtz Zentrum München, German Research Center for Environmental Health, Marchioninistraße 25, 81377 Munich, Germanyp Division of Environmental Dermatology and Allergy (KKG UDA), Helmholtz Zentrum München and Technische Universität München, 85764 Munich/Neuherberg, Germanyq Department of Dermatology, Venerology, and Allergy University Medicine, George-August-Universität Göttingen, Robert-Koch-Straße 40, 37075 Göttingen, Germanyr Lehrstuhl für Entwicklungsgenetik, Technische Universität München, Am Hochanger 8, 85350 Freising-Weihenstephan, Germanys Lehrstuhl für Experimentelle Genetik, Technische Universität München, Am Hochanger 8, 85350 Freising-Weihenstephan, Germanyt Institute of Pathology, Technische Universität München, Ismaningerstraße 22, 81675 Munich, Germany
a r t i c l e i n f o a b s t r a c t
Article history:Available online 12 August 2010
1046-2023/$ - see front matter � 2010 Elsevier Inc. Adoi:10.1016/j.ymeth.2010.08.006
⇑ Corresponding author at: Institute of Experimenta85764 München/Neuherberg, Germany.
E-mail address: [email protected] (M1 Contributed equally to the work.
Model organisms like the mouse are important tools to learn more about gene function in man. Withinthe last 20 years many mutant mouse lines have been generated by different methods such as ENU muta-genesis, constitutive and conditional knock-out approaches, knock-down, introduction of human genes,and knock-in techniques, thus creating models which mimic human conditions. Due to pleiotropiceffects, one gene may have different functions in different organ systems or time points during develop-ment. Therefore mutant mouse lines have to be phenotyped comprehensively in a highly standardizedmanner to enable the detection of phenotypes which might otherwise remain hidden. The German MouseClinic (GMC) has been established at the Helmholtz Zentrum München as a phenotyping platform with
ll rights reserved.
l Genetics, Helmholtz Zentrum München, German Research Center for Environmental Health, Ingolstädter Landstraße 1,
. Hrabe de Angelis).
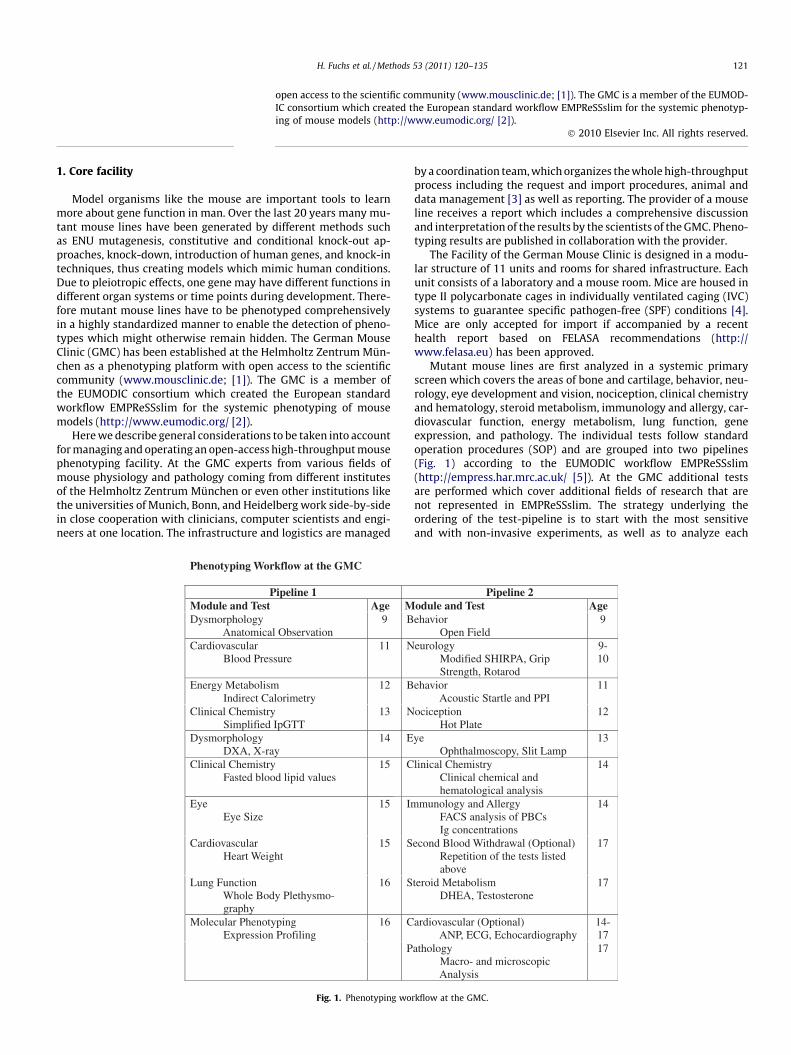
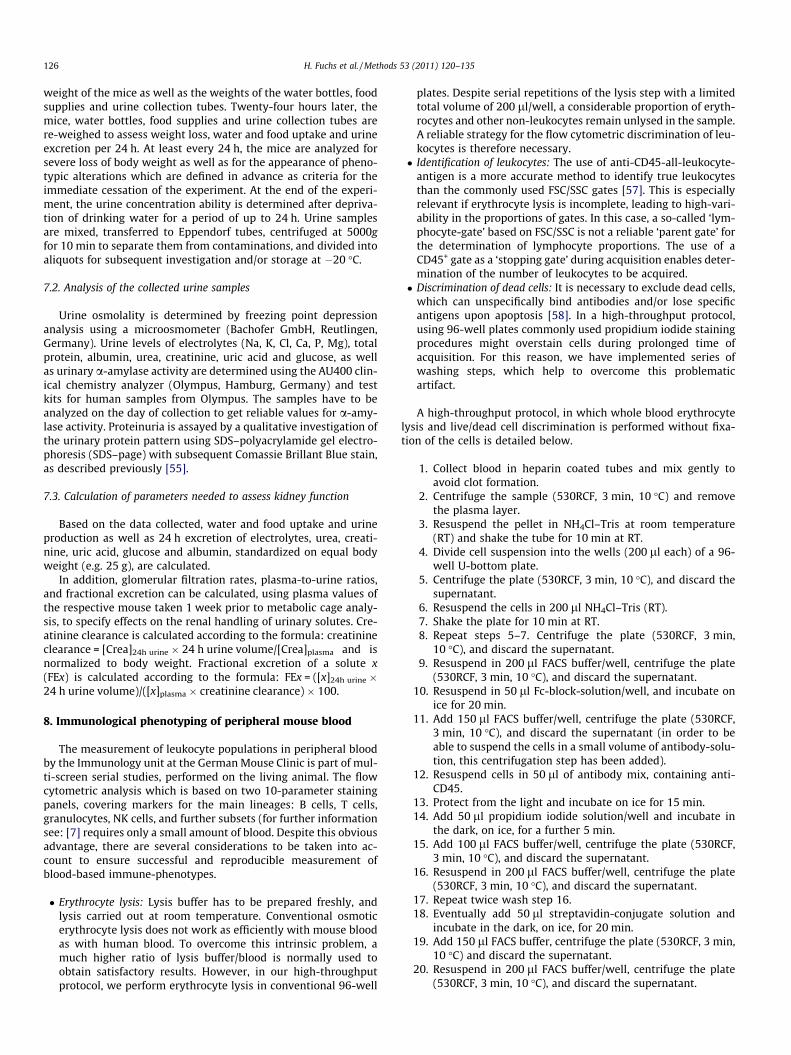
Phenotyping Wor
PModule and Test Dysmorphology AnatomicaCardiovascular Blood Pres
Energy Metabolism Indirect CaClinical Chemistry Simplified Dysmorphology DXA, X-raClinical Chemistry Fasted bloo
Eye Eye Size
Cardiovascular Heart Weig
Lung Function Whole Bod graphy Molecular Phenoty Expression
H. Fuchs et al. / Methods 53 (2011) 120–135 121
open access to the scientific community (www.mousclinic.de; [1]). The GMC is a member of the EUMOD-IC consortium which created the European standard workflow EMPReSSslim for the systemic phenotyp-ing of mouse models (http://www.eumodic.org/ [2]).
� 2010 Elsevier Inc. All rights reserved.
1. Core facility
Model organisms like the mouse are important tools to learnmore about gene function in man. Over the last 20 years many mu-tant mouse lines have been generated by different methods suchas ENU mutagenesis, constitutive and conditional knock-out ap-proaches, knock-down, introduction of human genes, and knock-intechniques, thus creating models which mimic human conditions.Due to pleiotropic effects, one gene may have different functions indifferent organ systems or time points during development. There-fore mutant mouse lines have to be phenotyped comprehensivelyin a highly standardized manner to enable the detection of pheno-types which might otherwise remain hidden. The German MouseClinic (GMC) has been established at the Helmholtz Zentrum Mün-chen as a phenotyping platform with open access to the scientificcommunity (www.mousclinic.de; [1]). The GMC is a member ofthe EUMODIC consortium which created the European standardworkflow EMPReSSslim for the systemic phenotyping of mousemodels (http://www.eumodic.org/ [2]).
Here we describe general considerations to be taken into accountfor managing and operating an open-access high-throughput mousephenotyping facility. At the GMC experts from various fields ofmouse physiology and pathology coming from different institutesof the Helmholtz Zentrum München or even other institutions likethe universities of Munich, Bonn, and Heidelberg work side-by-sidein close cooperation with clinicians, computer scientists and engi-neers at one location. The infrastructure and logistics are managed
kflow at the GMC
1enilepiAge M
l Observation 9 B
sure 11 N
lorimetry
12 B
IpGTT
13 N
y 14 E
d lipid values
15 C
15 Im
ht 15 S
y Plethysmo- 16 S
ping Profiling
16 C P
Fig. 1. Phenotyping wo
by a coordination team, which organizes the whole high-throughputprocess including the request and import procedures, animal anddata management [3] as well as reporting. The provider of a mouseline receives a report which includes a comprehensive discussionand interpretation of the results by the scientists of the GMC. Pheno-typing results are published in collaboration with the provider.
The Facility of the German Mouse Clinic is designed in a modu-lar structure of 11 units and rooms for shared infrastructure. Eachunit consists of a laboratory and a mouse room. Mice are housed intype II polycarbonate cages in individually ventilated caging (IVC)systems to guarantee specific pathogen-free (SPF) conditions [4].Mice are only accepted for import if accompanied by a recenthealth report based on FELASA recommendations (http://www.felasa.eu) has been approved.
Mutant mouse lines are first analyzed in a systemic primaryscreen which covers the areas of bone and cartilage, behavior, neu-rology, eye development and vision, nociception, clinical chemistryand hematology, steroid metabolism, immunology and allergy, car-diovascular function, energy metabolism, lung function, geneexpression, and pathology. The individual tests follow standardoperation procedures (SOP) and are grouped into two pipelines(Fig. 1) according to the EUMODIC workflow EMPReSSslim(http://empress.har.mrc.ac.uk/ [5]). At the GMC additional testsare performed which cover additional fields of research that arenot represented in EMPReSSslim. The strategy underlying theordering of the test-pipeline is to start with the most sensitiveand with non-invasive experiments, as well as to analyze each
2enilepiPodule and Test Age ehavior
Open Field 9
eurology Modified SHIRPA, Grip Strength, Rotarod
9-10
ehavior Acoustic Startle and PPI
11
ociception Hot Plate
12
ye Ophthalmoscopy, Slit Lamp
13
linical Chemistry Clinical chemical and hematological analysis
14
munology and Allergy FACS analysis of PBCs Ig concentrations
14
econd Blood Withdrawal (Optional) Repetition of the tests listed above
17
teroid Metabolism DHEA, Testosterone
17
ardiovascular (Optional) ANP, ECG, Echocardiography
14-17
ygolohtaMacro- and microscopic Analysis
17
rkflow at the GMC.

122 H. Fuchs et al. / Methods 53 (2011) 120–135
parameter at an age of the mouse where the parameter is most ro-bust. For example, we started the pipeline with the tests for behav-ior in order to test the reaction of the mice in the test situationusing experimentally naïve animals. The bone analysis is done atan age, when the skeleton is already mature to prevent the influ-ences of growth retardations.
The order of the primary phenotyping tests allows the consecu-tive analysis of more than 550 parameters in two cohorts of 10mice of each sex and genotype [6,7].
All phenotyping data as well as metadata for each single test(information about settings for machines, protocol versions, exper-imenter information etc.) is stored in our central database.
The cohort size of 10 mice per sex and genotype has turned outto be a good compromise between screening resolution androbustness of the tests on the one hand, and demand for resources(e.g. cage capacity, manpower, consumables) on the other side.
Data are statistically analyzed by two-way ANOVA with thefunctions of genotype and sex, as well as interactions of genotypeand sex. Data which are significant for the main factor genotypeare further analyzed by different post hoc comparisons.
Mouse lines showing an interesting phenotype are subjected toa more in-depth assessment using more time- and cost-intensivemeasurements. These ‘‘secondary” and ‘‘tertiary” screens are ar-ranged in tailor-made pipelines. For secondary screens, an addi-tional 520 parameters can be analyzed. In addition we haveimplemented a challenge platform which allows the standardizedtesting of environmental influences. Five test modules in the fieldsof diet, stress, activity, infection and immunity, and air are avail-able. In the following chapters we give an overview of selectedmethods and protocols used in first-line, secondary, and tertiaryphenotyping.
2. Dysmorphology, bone and cartilage
The skeleton is the third largest organ system in the humanbody and consists of bone and cartilage. Musculoskeletal diseasesincluding rheumatoid arthritis, osteoarthritis, osteoporosis, majorlimb trauma, and spinal disorders are the most frequent cause ofphysical disability for people in developed countries. The etiologyand pathological basis of skeletal diseases are diverse in nature.Studies of naturally occurring and engineered mutant mice haveled to a dramatic increase in the understanding of bone biology[8] and have in many cases been essential for the discovery andunderstanding of bone-related human diseases like osteoporosis[9], osteoarthritis [10], osteogenesis imperfecta [11], and scoliosis[12] or limb defects [13].
For a first-line screen, a broad spectrum of parameters involvingbone development, metabolism, and homeostasis should be cov-ered. Detailed protocols for screening for bone and cartilage phe-notypes in mice are described by Fuchs and coworkers [14].Morphological analysis of the mouse is the easiest way to obtainfirst-line information about skeletal malformations. We developeda 54-parameter protocol for dysmorphology analysis with a strongfocus on bone phenotypes [15]. We recommend applying this pro-tocol to mice which are 8 weeks or older, as in younger mice, somesubtle phenotypes will likely remain hidden. Subsequent to thedysmorphology checkup, animals should be analyzed by dual-en-ergy X-ray absorption (DXA) and X-ray imaging. Both techniquesenable a high-throughput non-invasive first-line phenotyping forbone and cartilage abnormalities. X-rays, having a wave length inthe range of 10 nm to 100 pm, penetrate soft tissues, but arestrongly attenuated by their bony counterparts. X-ray analysis isa reasonable technique for obtaining information about develop-mental disorders. X-ray applications can be used to diagnose vari-ous conditions like congenital bone diseases, joint dislocations,degenerative conditions, and metabolic bone diseases. X-ray imag-
ing of animals can be performed for example in a Faxitron X-rayModel MX-20 (Specimen Radiography System, Illinois, USA). Forimaging, the Faxitron system is used in combination with a digitalcamera or scanner like the NTB Digital X-ray Scanner EZ 40 (NTBGmbH, Diepholz, Germany). The system is run with settings: volt-age 25 kV with an integration time of 40 ms. Depending on the X-ray cabinet and the software scanner/camera system, settings maydiffer. The anesthetized mouse is fixed on an X-ray-permeableplate and placed in the machine. It is very important to alwaysposition the mouse in the same way, and to clearly define the startand end points of the measurements. Image capture and analysis iscarried out using a software support such as iX-Pect software.Analysis can be done qualitatively by visual inspection of theimages as well as quantitatively using the iX-Pect software rulertool. The image is carefully checked for the following parameters:skull shape, mandibles, maxilla, teeth, orbit, number of vertebrae(cervical, thoracic, lumbar, pelvic, sacral), vertebrae shape, numberof ribs, rib shape, scapulas, clavicle, pelvis, femur diameter, femurshape, tibia, fibula, humerus, ulna, radius, number of digits, com-pleteness of digits, subcutaneous fat and joints. For quality controla calibration of the system is carried out at monthly intervals.
DXA analysis is one of the most commonly used techniques forthe diagnosis of osteoporosis and bone mineralization defects. It isbased on the different absorption of X-rays by different organ sys-tems and is able to accurately discriminate between the skeletonand fatty and lean tissues [16]. DXA provides measures of bonemineral density (BMD), bone mineral content (BMC), fat mass(FM), and bone-free lean tissue mass (LTM). The major disadvan-tage of DXA is the area-based measurement of BMD data. A pDEXASabre X-ray Bone Densitometer (Norland Medical Systems Inc.,Basingstoke, Hampshire, UK, distributed by Stratec MedizintechnikGmbH, Pforzheim, Germany) can be used for dual-energy X-rayabsorptiometry (DXA). For quality control calibration of the systemis carried out daily using the QC and the QA phantoms delivered bythe manufacturer. Results from the quality control are recorded bythe system. After anesthesia, the weight and length of the mouseare recorded, and the mouse is placed in the analyzer. After a scoutscan, the area of interest is optimized and the measure scanstarted. The Histogram Averaging Width (HAW) is set to 0.02 g/cm2
with scan speed 20 mm/s and a resolution of 0.5 � 1.0 mm. Forthe analysis of the data, regions of interests must be defined. Thestandard analysis comprises a whole body analysis including andexcluding the head area. Mutants that demonstrate altered param-eters in the primary screen should be analyzed in a secondary testin more detail using tests that include micro-computed tomogra-phy (lCT) and peripheral quantitative computed tomography(pQCT), markers of bone metabolism and hormonal regulation,fracture/stress parameters, skeleton preparation and in vitro anal-ysis of bone cells to unravel and describe potential cellular causesof an observed bone alteration.
3. Behavioral phenotyping
Animal behavior can be viewed as the outward manifestation ofan orchestrated and complex functioning of the central nervous sys-tem (CNS) and of its interactions with the internal and externalenvironment. In the context of functional mouse genetics, behav-ioral phenotyping methods are applied to detect CNS dysfunctionsthat are relevant to human neuropsychiatric disorders such aspost-traumatic stress disorder, other anxiety disorders, depression,schizophrenia, autism, attention-deficit hyperactivity disorder,addiction, mental retardation, or motor, sensory or cognitive defi-cits related to neurodegenerative diseases like Parkinson’s Disease,Alzheimer’s Disease, Huntington’s Disease, Stroke or Prion Diseases.
Several factors can influence behavioral phenotyping results,and therefore need to be considered in the context of data

H. Fuchs et al. / Methods 53 (2011) 120–135 123
reproducibility [17]. Due to developmental and degenerative pro-cesses the age of the subject can play a role, as well as the timepoint of testing due to the circadian rhythms affecting many bio-logical processes. Therefore experimental subjects and controls ofthe same age should be tested concurrently; in the case of mutantsideally littermates should be used as controls. The major reason forlittermate controls is the fact that the genetic background canmarkedly influence a phenotype, which is best controlled for bythe use of littermates. Since phenotypes can vary between sexes,animals of both sexes must be analyzed. Because previous experi-ence of handling, experimental manipulations or drug injectionscan influence the performance of a subject in a particular test, itis desirable to use experimentally naïve subjects for each test whenmore than one test is to be employed. Practically, this approach in-creases the number of animals needed and is simply not feasiblewhen mouse mutants are used. As a solution to this problem whena series of tests is applied, the tests are usually ordered from thosewhich are considered the least stressful for the subject to thoseconsidered the most stressful [23]. In the GMC we test baselineunconditioned behaviors such as anxiety-related behavior first, be-cause we consider baseline anxiety most vulnerable to handlinginfluences by the experimentalist; then perform tests for general,spontaneous exploratory activity, followed by learning and mem-ory tests and, last, tests for motor coordination and reflexes, be-cause we consider the latter the most resistant to handlingexperience. However, when planning the test order for a mutantline, the age of the animals and known progressive sensory degen-erations of the genetic background strain, e.g. progressive sensori-neural hearing loss in the C57BL/6 background or retinaldegeneration in the C3H background, also have to be considered.This may lead to an earlier position in the test order for tests rely-ing on such senses to avoid eventual difficulties in distinguishingphenotypes from floor effects.
Likewise, in comprehensive phenotyping settings behavioralphenotyping is carried out first, before more invasive experimentalmanipulations are performed on the animals, and the experimentalhistory of the animals documented. In case of a positive phenotyp-ing result using such ‘‘test batteries”, the putative phenotypeshould be confirmed in a naive batch of subjects. Both, the exper-imentalist and the kind of equipment used are also known to influ-ence phenotyping results. Therefore careful descriptions ofexperimental procedures and thorough training of the experimen-talist are essential, as are precise (technical) specifications of the(automated) equipment. The more comprehensive the phenotyp-ing, the less likely are mis- or over-interpretations of individualdata sets. This is particularly important when screening for pheno-types in mutants of genes with unknown function(s). For example,locomotor, exploratory or emotional phenotypes may be con-founded or even caused by sensory deficits, skeletal malformationsor metabolic alterations, and thus do not automatically reflect ef-fects of brain function. Likewise, apparent cognitive phenotypesmay not be centrally mediated but may be caused by alterationsin sensory perception. Therefore it is important to exclude alterna-tive, non CNS-specific explanations for putative phenotypes.
Due to an abundance of behavioral phenotyping methods, wecan only give an overview of the most frequently used behavioraltests here. For more detailed information we refer the reader tocomprehensive guidebooks on mouse behavioral phenotypingmethodology (e.g. [18,19]). The modified Hole Board test [20] is acomprehensive behavioral overview test that an effectively be usedas a first test in a behavioral test battery [7]. To further evaluate apossible anxiety-related phenotype, the open field test, the light–dark box test, the elevated plus-maze, the zero-maze, and the so-cial interaction test are used (for review see [21]. To evaluatedepression-related behavior, the forced swim test and the tail sus-pension test are applied (for review see [22]. In hearing mice, sen-
sorimotor behavior and sensorimotor gating as an endophenotypeassociated with schizophrenia can effectively be analyzed by theacoustic startle reflex and its pre-pulse inhibition in a procedurecross-validated by EUMORPHIA (www.eumorphia.org) [23]. Forthe analysis of conditioned anxiety or fear learning, procedures likeActive avoidance, Contextual and cued fear conditioning or Fearpotentiated startle [24] are applied, in which the animals have tolearn the association between a conditioned stimulus and a mildfootshock. The Morris water-maze or the Radial arm maze are usedto assess spatial learning, reference memory and working memory,and appropriate versions of the T-maze and the Y-maze task arealso used to assess working memory. Social recognition tasks areapplied to analyze social memory and olfactory function, andobject recognition tasks are used to assess object memory[25–27]. Schedule controlled operant tasks can also be used toassess different aspects of learning and motivational behavior(e.g. [28]), and one such task, the five-choice serial reaction-timetask, has been developed to assess sustained and divided attention.
Once a working hypothesis is formed about the brain areas orneuronal circuits involved in the observed phenotype, the analysiscan ideally be complemented by both electrophysiological andfunctional neuroanatomical investigations, and appropriate phar-macological challenges for further clarification of the mechanism.
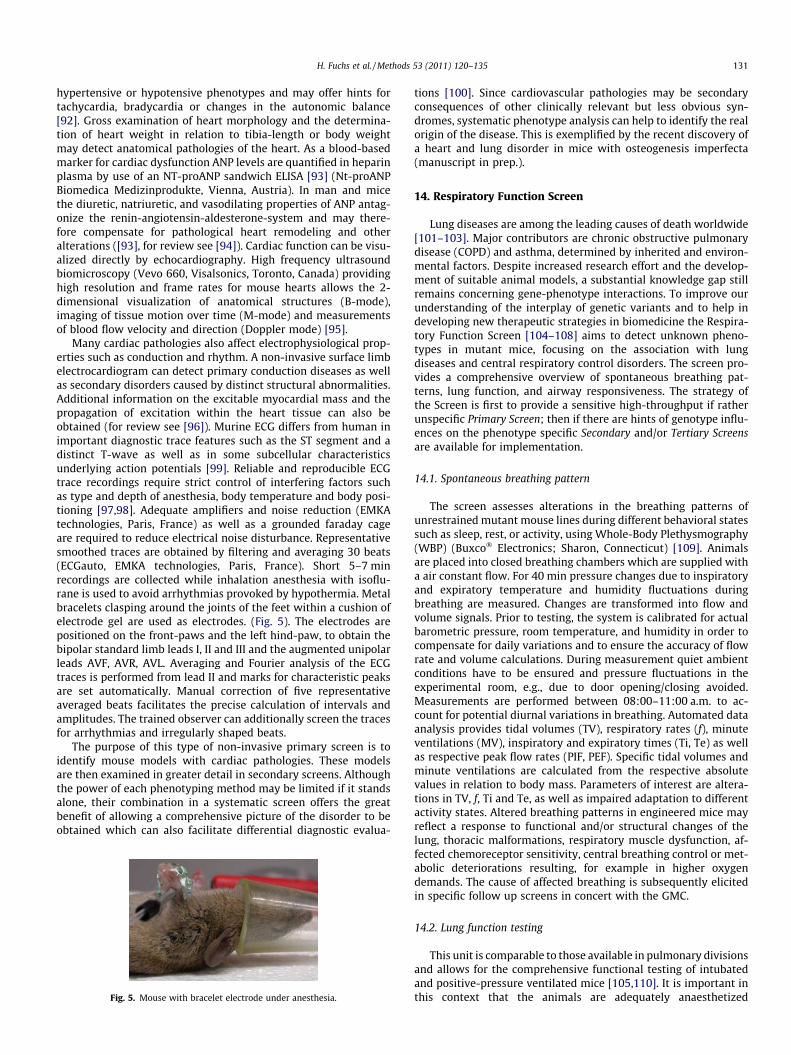
4. Neurological phenotyping
Neurological disorders are a major health problem. Neurode-generative diseases like Parkinson’s disease, amyotrophic lateralsclerosis or Huntington’s disease are still in need of suitabletherapeutic approaches. Animal models provide a useful tool forresearch into human diseases and their phenotypic characteriza-tion is a prerequisite for the analysis of assignable attributes ofhuman disease to respective mouse models as well as for theevaluation of therapeutic benefits [29].
Neurological phenotyping involves a comprehensive analysis ofsensory and autonomous functions, reflexes, motor functions andcoordination which should accompany the molecular analyses ofmutations in mouse models [19]. Primary phenotypic analysesusing protocols like SHIRPA cover overall health status as well asbasic functions [30]. Vision can be tested within these protocolsby simple tests like visual placing where a mouse is gradually low-ered towards a surface and should reach for the ground, but canequally be analyzed in more depth as described in the section onthe eye. A simple hearing test is a click-box test where a bodyflinch should be observed upon an acoustic stimulus, whilst; ad-vanced hearing analysis will include measuring the acoustic startlereflex and auditory brainstem response. Gait and posture as well asactivity and reactivity can be rated, and any obvious behavioralalterations recorded. Vestibular functions and balance can be rec-ognized in the primary analysis as cycling behavior and this canbe analyzed using a swim test in temperate water for max. 1 minunder close observation with subsequent warm-up. This first over-view can already reveal alterations in the mice that might interferewith subsequent tests. As tests that involve voluntary actions ofanimals are always influenced by a combination of behavioralattributes, including the responsiveness to the testing environ-ment, and the physical abilities of the mice to perform the tasks,careful evaluation of the results is required. Skeletal abnormalitiescan for example influence gait and might also impair locomotoractivity. To reduce data variation it is recommended to minimizeage ranges and to run appropriate controls.
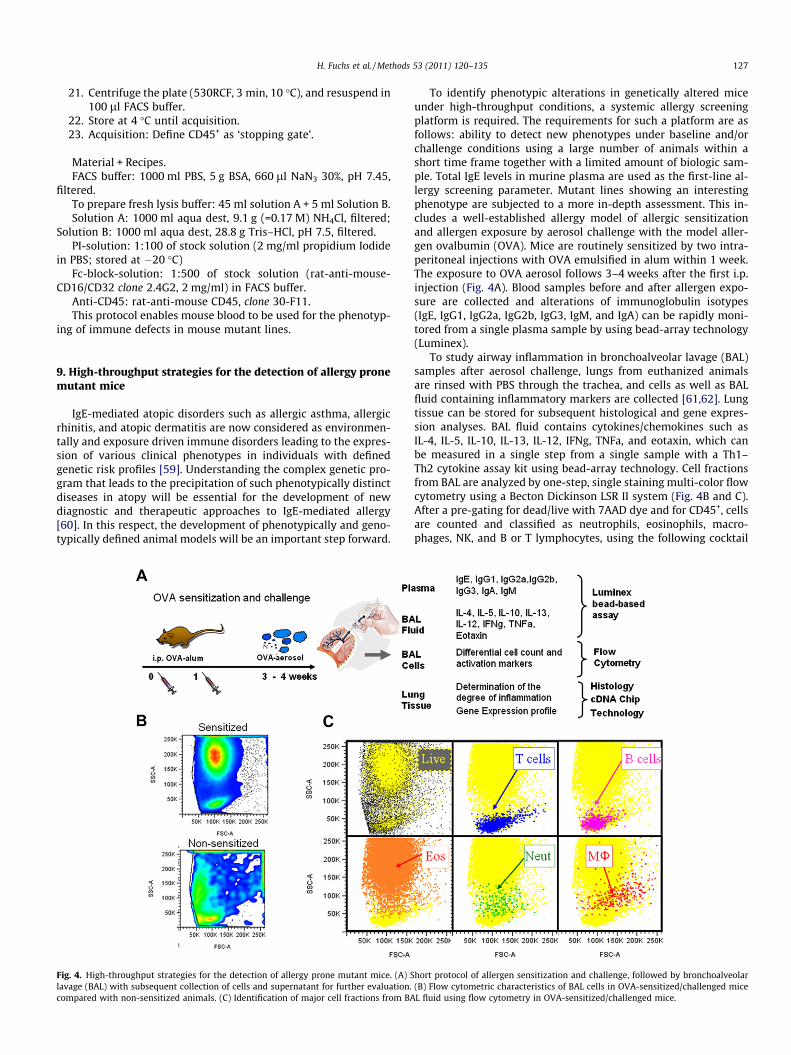
Muscle strength can be measured by recording the time amouse can hold onto an inverted grid. More detailed analysis ofmuscle strength is carried out with a force-meter using a mountedgrid. The mouse is lowered over the grid, attaches to it and is
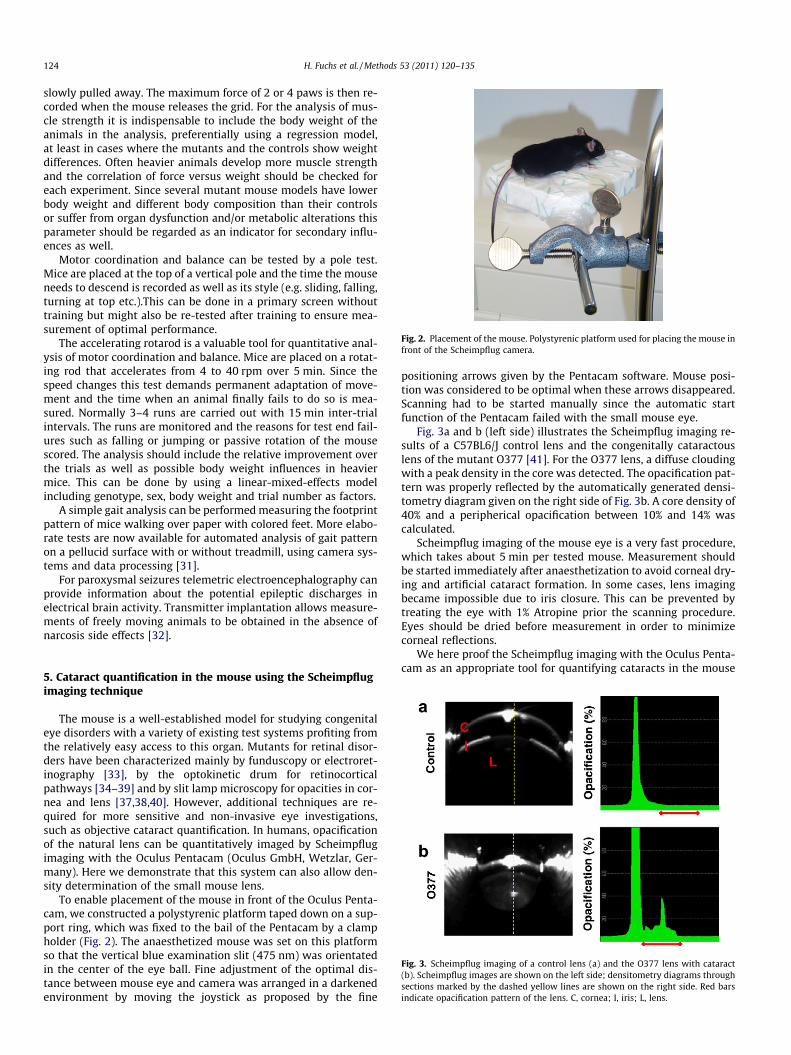
Fig. 2. Placement of the mouse. Polystyrenic platform used for placing the mouse infront of the Scheimpflug camera.
124 H. Fuchs et al. / Methods 53 (2011) 120–135
slowly pulled away. The maximum force of 2 or 4 paws is then re-corded when the mouse releases the grid. For the analysis of mus-cle strength it is indispensable to include the body weight of theanimals in the analysis, preferentially using a regression model,at least in cases where the mutants and the controls show weightdifferences. Often heavier animals develop more muscle strengthand the correlation of force versus weight should be checked foreach experiment. Since several mutant mouse models have lowerbody weight and different body composition than their controlsor suffer from organ dysfunction and/or metabolic alterations thisparameter should be regarded as an indicator for secondary influ-ences as well.
Motor coordination and balance can be tested by a pole test.Mice are placed at the top of a vertical pole and the time the mouseneeds to descend is recorded as well as its style (e.g. sliding, falling,turning at top etc.).This can be done in a primary screen withouttraining but might also be re-tested after training to ensure mea-surement of optimal performance.
The accelerating rotarod is a valuable tool for quantitative anal-ysis of motor coordination and balance. Mice are placed on a rotat-ing rod that accelerates from 4 to 40 rpm over 5 min. Since thespeed changes this test demands permanent adaptation of move-ment and the time when an animal finally fails to do so is mea-sured. Normally 3–4 runs are carried out with 15 min inter-trialintervals. The runs are monitored and the reasons for test end fail-ures such as falling or jumping or passive rotation of the mousescored. The analysis should include the relative improvement overthe trials as well as possible body weight influences in heaviermice. This can be done by using a linear-mixed-effects modelincluding genotype, sex, body weight and trial number as factors.
A simple gait analysis can be performed measuring the footprintpattern of mice walking over paper with colored feet. More elabo-rate tests are now available for automated analysis of gait patternon a pellucid surface with or without treadmill, using camera sys-tems and data processing [31].
For paroxysmal seizures telemetric electroencephalography canprovide information about the potential epileptic discharges inelectrical brain activity. Transmitter implantation allows measure-ments of freely moving animals to be obtained in the absence ofnarcosis side effects [32].
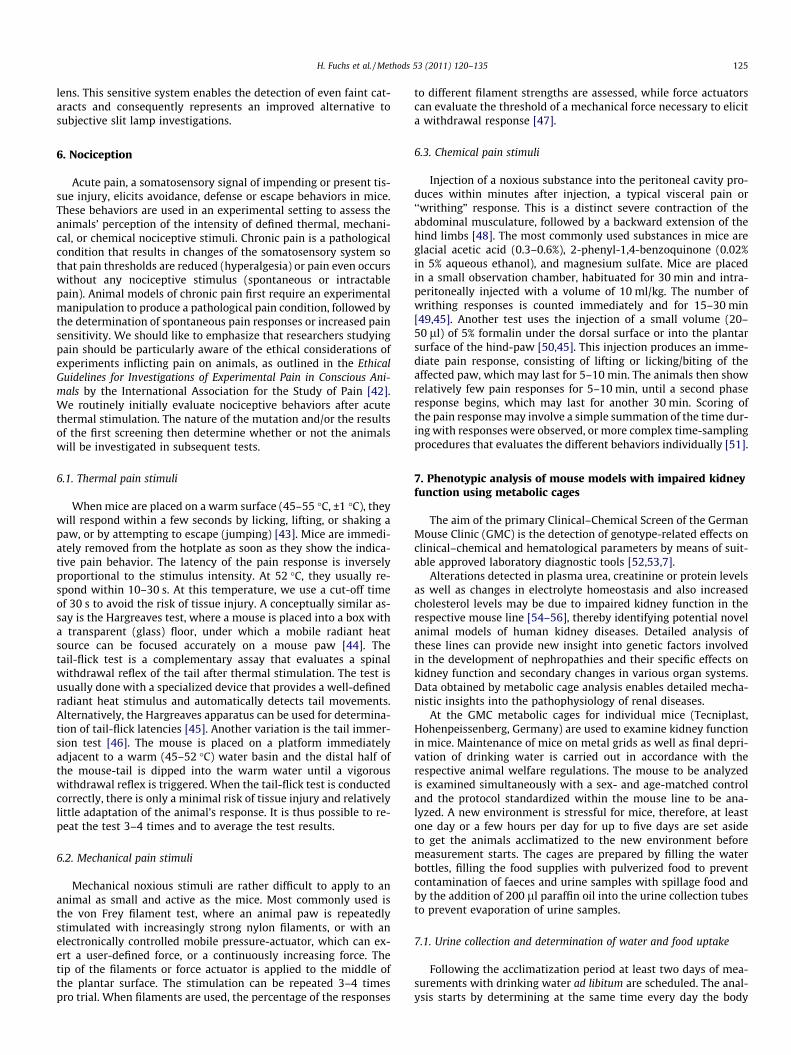
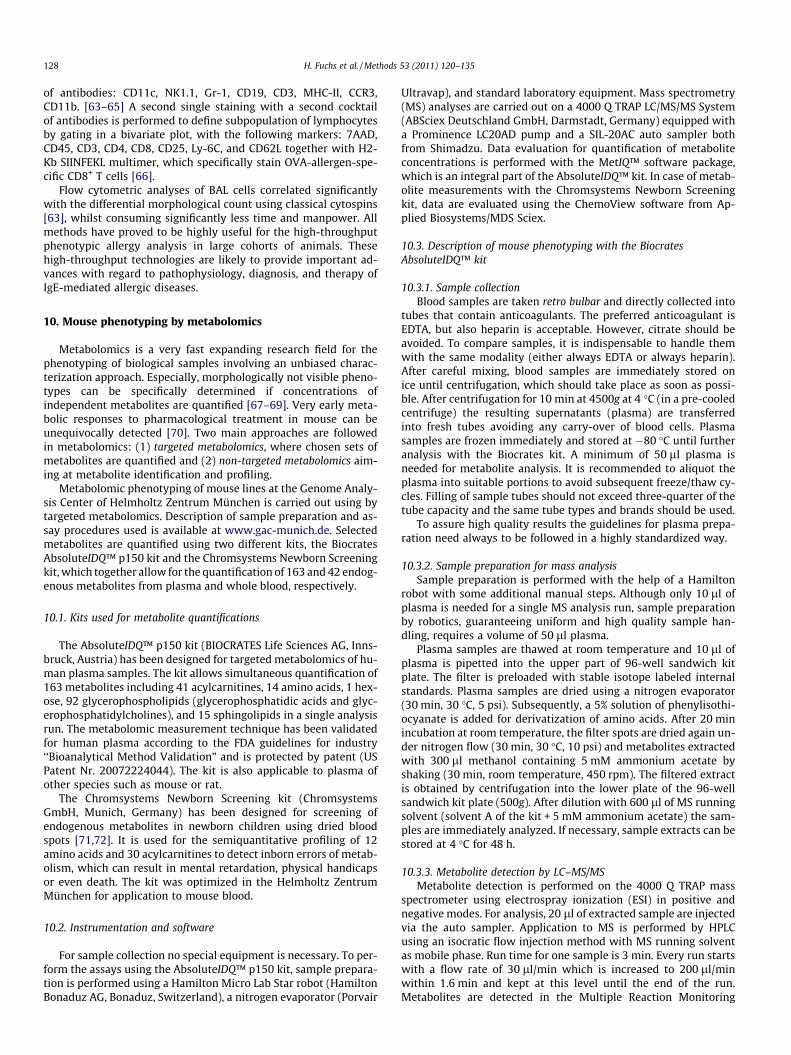
Fig. 3. Scheimpflug imaging of a control lens (a) and the O377 lens with cataract(b). Scheimpflug images are shown on the left side; densitometry diagrams throughsections marked by the dashed yellow lines are shown on the right side. Red barsindicate opacification pattern of the lens. C, cornea; I, iris; L, lens.
5. Cataract quantification in the mouse using the Scheimpflugimaging technique
The mouse is a well-established model for studying congenitaleye disorders with a variety of existing test systems profiting fromthe relatively easy access to this organ. Mutants for retinal disor-ders have been characterized mainly by funduscopy or electroret-inography [33], by the optokinetic drum for retinocorticalpathways [34–39] and by slit lamp microscopy for opacities in cor-nea and lens [37,38,40]. However, additional techniques are re-quired for more sensitive and non-invasive eye investigations,such as objective cataract quantification. In humans, opacificationof the natural lens can be quantitatively imaged by Scheimpflugimaging with the Oculus Pentacam (Oculus GmbH, Wetzlar, Ger-many). Here we demonstrate that this system can also allow den-sity determination of the small mouse lens.
To enable placement of the mouse in front of the Oculus Penta-cam, we constructed a polystyrenic platform taped down on a sup-port ring, which was fixed to the bail of the Pentacam by a clampholder (Fig. 2). The anaesthetized mouse was set on this platformso that the vertical blue examination slit (475 nm) was orientatedin the center of the eye ball. Fine adjustment of the optimal dis-tance between mouse eye and camera was arranged in a darkenedenvironment by moving the joystick as proposed by the fine
positioning arrows given by the Pentacam software. Mouse posi-tion was considered to be optimal when these arrows disappeared.Scanning had to be started manually since the automatic startfunction of the Pentacam failed with the small mouse eye.
Fig. 3a and b (left side) illustrates the Scheimpflug imaging re-sults of a C57BL6/J control lens and the congenitally cataractouslens of the mutant O377 [41]. For the O377 lens, a diffuse cloudingwith a peak density in the core was detected. The opacification pat-tern was properly reflected by the automatically generated densi-tometry diagram given on the right side of Fig. 3b. A core density of40% and a peripherical opacification between 10% and 14% wascalculated.
Scheimpflug imaging of the mouse eye is a very fast procedure,which takes about 5 min per tested mouse. Measurement shouldbe started immediately after anaesthetization to avoid corneal dry-ing and artificial cataract formation. In some cases, lens imagingbecame impossible due to iris closure. This can be prevented bytreating the eye with 1% Atropine prior the scanning procedure.Eyes should be dried before measurement in order to minimizecorneal reflections.
We here proof the Scheimpflug imaging with the Oculus Penta-cam as an appropriate tool for quantifying cataracts in the mouse
H. Fuchs et al. / Methods 53 (2011) 120–135 125
lens. This sensitive system enables the detection of even faint cat-aracts and consequently represents an improved alternative tosubjective slit lamp investigations.
6. Nociception
Acute pain, a somatosensory signal of impending or present tis-sue injury, elicits avoidance, defense or escape behaviors in mice.These behaviors are used in an experimental setting to assess theanimals’ perception of the intensity of defined thermal, mechani-cal, or chemical nociceptive stimuli. Chronic pain is a pathologicalcondition that results in changes of the somatosensory system sothat pain thresholds are reduced (hyperalgesia) or pain even occurswithout any nociceptive stimulus (spontaneous or intractablepain). Animal models of chronic pain first require an experimentalmanipulation to produce a pathological pain condition, followed bythe determination of spontaneous pain responses or increased painsensitivity. We should like to emphasize that researchers studyingpain should be particularly aware of the ethical considerations ofexperiments inflicting pain on animals, as outlined in the EthicalGuidelines for Investigations of Experimental Pain in Conscious Ani-mals by the International Association for the Study of Pain [42].We routinely initially evaluate nociceptive behaviors after acutethermal stimulation. The nature of the mutation and/or the resultsof the first screening then determine whether or not the animalswill be investigated in subsequent tests.
6.1. Thermal pain stimuli
When mice are placed on a warm surface (45–55 �C, ±1 �C), theywill respond within a few seconds by licking, lifting, or shaking apaw, or by attempting to escape (jumping) [43]. Mice are immedi-ately removed from the hotplate as soon as they show the indica-tive pain behavior. The latency of the pain response is inverselyproportional to the stimulus intensity. At 52 �C, they usually re-spond within 10–30 s. At this temperature, we use a cut-off timeof 30 s to avoid the risk of tissue injury. A conceptually similar as-say is the Hargreaves test, where a mouse is placed into a box witha transparent (glass) floor, under which a mobile radiant heatsource can be focused accurately on a mouse paw [44]. Thetail-flick test is a complementary assay that evaluates a spinalwithdrawal reflex of the tail after thermal stimulation. The test isusually done with a specialized device that provides a well-definedradiant heat stimulus and automatically detects tail movements.Alternatively, the Hargreaves apparatus can be used for determina-tion of tail-flick latencies [45]. Another variation is the tail immer-sion test [46]. The mouse is placed on a platform immediatelyadjacent to a warm (45–52 �C) water basin and the distal half ofthe mouse-tail is dipped into the warm water until a vigorouswithdrawal reflex is triggered. When the tail-flick test is conductedcorrectly, there is only a minimal risk of tissue injury and relativelylittle adaptation of the animal’s response. It is thus possible to re-peat the test 3–4 times and to average the test results.
6.2. Mechanical pain stimuli
Mechanical noxious stimuli are rather difficult to apply to ananimal as small and active as the mice. Most commonly used isthe von Frey filament test, where an animal paw is repeatedlystimulated with increasingly strong nylon filaments, or with anelectronically controlled mobile pressure-actuator, which can ex-ert a user-defined force, or a continuously increasing force. Thetip of the filaments or force actuator is applied to the middle ofthe plantar surface. The stimulation can be repeated 3–4 timespro trial. When filaments are used, the percentage of the responses
to different filament strengths are assessed, while force actuatorscan evaluate the threshold of a mechanical force necessary to elicita withdrawal response [47].
6.3. Chemical pain stimuli
Injection of a noxious substance into the peritoneal cavity pro-duces within minutes after injection, a typical visceral pain or‘‘writhing” response. This is a distinct severe contraction of theabdominal musculature, followed by a backward extension of thehind limbs [48]. The most commonly used substances in mice areglacial acetic acid (0.3–0.6%), 2-phenyl-1,4-benzoquinone (0.02%in 5% aqueous ethanol), and magnesium sulfate. Mice are placedin a small observation chamber, habituated for 30 min and intra-peritoneally injected with a volume of 10 ml/kg. The number ofwrithing responses is counted immediately and for 15–30 min[49,45]. Another test uses the injection of a small volume (20–50 ll) of 5% formalin under the dorsal surface or into the plantarsurface of the hind-paw [50,45]. This injection produces an imme-diate pain response, consisting of lifting or licking/biting of theaffected paw, which may last for 5–10 min. The animals then showrelatively few pain responses for 5–10 min, until a second phaseresponse begins, which may last for another 30 min. Scoring ofthe pain response may involve a simple summation of the time dur-ing with responses were observed, or more complex time-samplingprocedures that evaluates the different behaviors individually [51].
7. Phenotypic analysis of mouse models with impaired kidneyfunction using metabolic cages
The aim of the primary Clinical–Chemical Screen of the GermanMouse Clinic (GMC) is the detection of genotype-related effects onclinical–chemical and hematological parameters by means of suit-able approved laboratory diagnostic tools [52,53,7].
Alterations detected in plasma urea, creatinine or protein levelsas well as changes in electrolyte homeostasis and also increasedcholesterol levels may be due to impaired kidney function in therespective mouse line [54–56], thereby identifying potential novelanimal models of human kidney diseases. Detailed analysis ofthese lines can provide new insight into genetic factors involvedin the development of nephropathies and their specific effects onkidney function and secondary changes in various organ systems.Data obtained by metabolic cage analysis enables detailed mecha-nistic insights into the pathophysiology of renal diseases.
At the GMC metabolic cages for individual mice (Tecniplast,Hohenpeissenberg, Germany) are used to examine kidney functionin mice. Maintenance of mice on metal grids as well as final depri-vation of drinking water is carried out in accordance with therespective animal welfare regulations. The mouse to be analyzedis examined simultaneously with a sex- and age-matched controland the protocol standardized within the mouse line to be ana-lyzed. A new environment is stressful for mice, therefore, at leastone day or a few hours per day for up to five days are set asideto get the animals acclimatized to the new environment beforemeasurement starts. The cages are prepared by filling the waterbottles, filling the food supplies with pulverized food to preventcontamination of faeces and urine samples with spillage food andby the addition of 200 ll paraffin oil into the urine collection tubesto prevent evaporation of urine samples.
7.1. Urine collection and determination of water and food uptake
Following the acclimatization period at least two days of mea-surements with drinking water ad libitum are scheduled. The anal-ysis starts by determining at the same time every day the body
126 H. Fuchs et al. / Methods 53 (2011) 120–135
weight of the mice as well as the weights of the water bottles, foodsupplies and urine collection tubes. Twenty-four hours later, themice, water bottles, food supplies and urine collection tubes arere-weighed to assess weight loss, water and food uptake and urineexcretion per 24 h. At least every 24 h, the mice are analyzed forsevere loss of body weight as well as for the appearance of pheno-typic alterations which are defined in advance as criteria for theimmediate cessation of the experiment. At the end of the experi-ment, the urine concentration ability is determined after depriva-tion of drinking water for a period of up to 24 h. Urine samplesare mixed, transferred to Eppendorf tubes, centrifuged at 5000gfor 10 min to separate them from contaminations, and divided intoaliquots for subsequent investigation and/or storage at �20 �C.
7.2. Analysis of the collected urine samples
Urine osmolality is determined by freezing point depressionanalysis using a microosmometer (Bachofer GmbH, Reutlingen,Germany). Urine levels of electrolytes (Na, K, Cl, Ca, P, Mg), totalprotein, albumin, urea, creatinine, uric acid and glucose, as wellas urinary a-amylase activity are determined using the AU400 clin-ical chemistry analyzer (Olympus, Hamburg, Germany) and testkits for human samples from Olympus. The samples have to beanalyzed on the day of collection to get reliable values for a-amy-lase activity. Proteinuria is assayed by a qualitative investigation ofthe urinary protein pattern using SDS–polyacrylamide gel electro-phoresis (SDS–page) with subsequent Comassie Brillant Blue stain,as described previously [55].
7.3. Calculation of parameters needed to assess kidney function
Based on the data collected, water and food uptake and urineproduction as well as 24 h excretion of electrolytes, urea, creati-nine, uric acid, glucose and albumin, standardized on equal bodyweight (e.g. 25 g), are calculated.
In addition, glomerular filtration rates, plasma-to-urine ratios,and fractional excretion can be calculated, using plasma values ofthe respective mouse taken 1 week prior to metabolic cage analy-sis, to specify effects on the renal handling of urinary solutes. Cre-atinine clearance is calculated according to the formula: creatinineclearance = [Crea]24h urine � 24 h urine volume/[Crea]plasma and isnormalized to body weight. Fractional excretion of a solute x(FEx) is calculated according to the formula: FEx = ([x]24h urine �24 h urine volume)/([x]plasma � creatinine clearance) � 100.
8. Immunological phenotyping of peripheral mouse blood
The measurement of leukocyte populations in peripheral bloodby the Immunology unit at the German Mouse Clinic is part of mul-ti-screen serial studies, performed on the living animal. The flowcytometric analysis which is based on two 10-parameter stainingpanels, covering markers for the main lineages: B cells, T cells,granulocytes, NK cells, and further subsets (for further informationsee: [7] requires only a small amount of blood. Despite this obviousadvantage, there are several considerations to be taken into ac-count to ensure successful and reproducible measurement ofblood-based immune-phenotypes.
� Erythrocyte lysis: Lysis buffer has to be prepared freshly, andlysis carried out at room temperature. Conventional osmoticerythrocyte lysis does not work as efficiently with mouse bloodas with human blood. To overcome this intrinsic problem, amuch higher ratio of lysis buffer/blood is normally used toobtain satisfactory results. However, in our high-throughputprotocol, we perform erythrocyte lysis in conventional 96-well
plates. Despite serial repetitions of the lysis step with a limitedtotal volume of 200 ll/well, a considerable proportion of eryth-rocytes and other non-leukocytes remain unlysed in the sample.A reliable strategy for the flow cytometric discrimination of leu-kocytes is therefore necessary.� Identification of leukocytes: The use of anti-CD45-all-leukocyte-
antigen is a more accurate method to identify true leukocytesthan the commonly used FSC/SSC gates [57]. This is especiallyrelevant if erythrocyte lysis is incomplete, leading to high-vari-ability in the proportions of gates. In this case, a so-called ‘lym-phocyte-gate’ based on FSC/SSC is not a reliable ‘parent gate’ forthe determination of lymphocyte proportions. The use of aCD45+ gate as a ‘stopping gate’ during acquisition enables deter-mination of the number of leukocytes to be acquired.� Discrimination of dead cells: It is necessary to exclude dead cells,
which can unspecifically bind antibodies and/or lose specificantigens upon apoptosis [58]. In a high-throughput protocol,using 96-well plates commonly used propidium iodide stainingprocedures might overstain cells during prolonged time ofacquisition. For this reason, we have implemented series ofwashing steps, which help to overcome this problematicartifact.
A high-throughput protocol, in which whole blood erythrocytelysis and live/dead cell discrimination is performed without fixa-tion of the cells is detailed below.
1. Collect blood in heparin coated tubes and mix gently toavoid clot formation.
2. Centrifuge the sample (530RCF, 3 min, 10 �C) and removethe plasma layer.
3. Resuspend the pellet in NH4Cl–Tris at room temperature(RT) and shake the tube for 10 min at RT.
4. Divide cell suspension into the wells (200 ll each) of a 96-well U-bottom plate.
5. Centrifuge the plate (530RCF, 3 min, 10 �C), and discard thesupernatant.
6. Resuspend the cells in 200 ll NH4Cl–Tris (RT).7. Shake the plate for 10 min at RT.8. Repeat steps 5–7. Centrifuge the plate (530RCF, 3 min,
10 �C), and discard the supernatant.9. Resuspend in 200 ll FACS buffer/well, centrifuge the plate
(530RCF, 3 min, 10 �C), and discard the supernatant.10. Resuspend in 50 ll Fc-block-solution/well, and incubate on
ice for 20 min.11. Add 150 ll FACS buffer/well, centrifuge the plate (530RCF,
3 min, 10 �C), and discard the supernatant (in order to beable to suspend the cells in a small volume of antibody-solu-tion, this centrifugation step has been added).
12. Resuspend cells in 50 ll of antibody mix, containing anti-CD45.
13. Protect from the light and incubate on ice for 15 min.14. Add 50 ll propidium iodide solution/well and incubate in
the dark, on ice, for a further 5 min.15. Add 100 ll FACS buffer/well, centrifuge the plate (530RCF,
3 min, 10 �C), and discard the supernatant.16. Resuspend in 200 ll FACS buffer/well, centrifuge the plate
(530RCF, 3 min, 10 �C), and discard the supernatant.17. Repeat twice wash step 16.18. Eventually add 50 ll streptavidin-conjugate solution and
incubate in the dark, on ice, for 20 min.19. Add 150 ll FACS buffer, centrifuge the plate (530RCF, 3 min,
10 �C) and discard the supernatant.20. Resuspend in 200 ll FACS buffer/well, centrifuge the plate
(530RCF, 3 min, 10 �C), and discard the supernatant.
H. Fuchs et al. / Methods 53 (2011) 120–135 127
21. Centrifuge the plate (530RCF, 3 min, 10 �C), and resuspend in100 ll FACS buffer.
22. Store at 4 �C until acquisition.23. Acquisition: Define CD45+ as ‘stopping gate’.
Material + Recipes.FACS buffer: 1000 ml PBS, 5 g BSA, 660 ll NaN3 30%, pH 7.45,
filtered.To prepare fresh lysis buffer: 45 ml solution A + 5 ml Solution B.Solution A: 1000 ml aqua dest, 9.1 g (=0.17 M) NH4Cl, filtered;
Solution B: 1000 ml aqua dest, 28.8 g Tris–HCl, pH 7.5, filtered.PI-solution: 1:100 of stock solution (2 mg/ml propidium Iodide
in PBS; stored at �20 �C)Fc-block-solution: 1:500 of stock solution (rat-anti-mouse-
CD16/CD32 clone 2.4G2, 2 mg/ml) in FACS buffer.Anti-CD45: rat-anti-mouse CD45, clone 30-F11.This protocol enables mouse blood to be used for the phenotyp-
ing of immune defects in mouse mutant lines.
9. High-throughput strategies for the detection of allergy pronemutant mice
IgE-mediated atopic disorders such as allergic asthma, allergicrhinitis, and atopic dermatitis are now considered as environmen-tally and exposure driven immune disorders leading to the expres-sion of various clinical phenotypes in individuals with definedgenetic risk profiles [59]. Understanding the complex genetic pro-gram that leads to the precipitation of such phenotypically distinctdiseases in atopy will be essential for the development of newdiagnostic and therapeutic approaches to IgE-mediated allergy[60]. In this respect, the development of phenotypically and geno-typically defined animal models will be an important step forward.
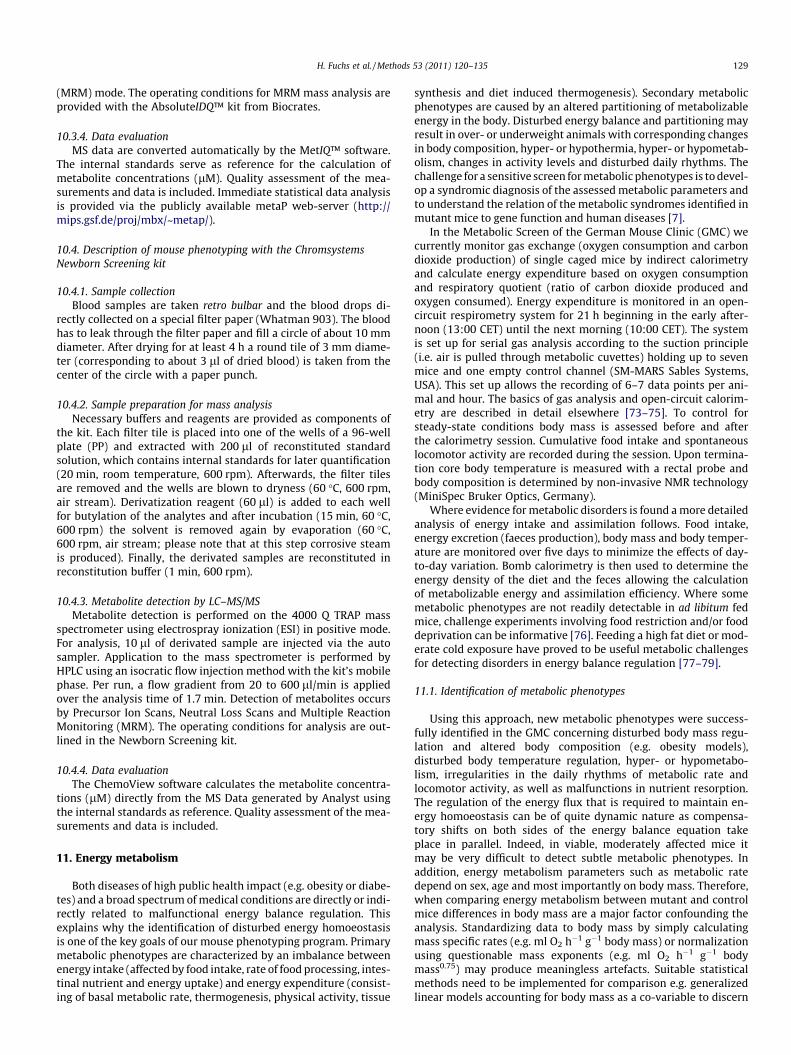
Fig. 4. High-throughput strategies for the detection of allergy prone mutant mice. (A) Slavage (BAL) with subsequent collection of cells and supernatant for further evaluation.compared with non-sensitized animals. (C) Identification of major cell fractions from BA
To identify phenotypic alterations in genetically altered miceunder high-throughput conditions, a systemic allergy screeningplatform is required. The requirements for such a platform are asfollows: ability to detect new phenotypes under baseline and/orchallenge conditions using a large number of animals within ashort time frame together with a limited amount of biologic sam-ple. Total IgE levels in murine plasma are used as the first-line al-lergy screening parameter. Mutant lines showing an interestingphenotype are subjected to a more in-depth assessment. This in-cludes a well-established allergy model of allergic sensitizationand allergen exposure by aerosol challenge with the model aller-gen ovalbumin (OVA). Mice are routinely sensitized by two intra-peritoneal injections with OVA emulsified in alum within 1 week.The exposure to OVA aerosol follows 3–4 weeks after the first i.p.injection (Fig. 4A). Blood samples before and after allergen expo-sure are collected and alterations of immunoglobulin isotypes(IgE, IgG1, IgG2a, IgG2b, IgG3, IgM, and IgA) can be rapidly moni-tored from a single plasma sample by using bead-array technology(Luminex).
To study airway inflammation in bronchoalveolar lavage (BAL)samples after aerosol challenge, lungs from euthanized animalsare rinsed with PBS through the trachea, and cells as well as BALfluid containing inflammatory markers are collected [61,62]. Lungtissue can be stored for subsequent histological and gene expres-sion analyses. BAL fluid contains cytokines/chemokines such asIL-4, IL-5, IL-10, IL-13, IL-12, IFNg, TNFa, and eotaxin, which canbe measured in a single step from a single sample with a Th1–Th2 cytokine assay kit using bead-array technology. Cell fractionsfrom BAL are analyzed by one-step, single staining multi-color flowcytometry using a Becton Dickinson LSR II system (Fig. 4B and C).After a pre-gating for dead/live with 7AAD dye and for CD45+, cellsare counted and classified as neutrophils, eosinophils, macro-phages, NK, and B or T lymphocytes, using the following cocktail
hort protocol of allergen sensitization and challenge, followed by bronchoalveolar(B) Flow cytometric characteristics of BAL cells in OVA-sensitized/challenged miceL fluid using flow cytometry in OVA-sensitized/challenged mice.
128 H. Fuchs et al. / Methods 53 (2011) 120–135
of antibodies: CD11c, NK1.1, Gr-1, CD19, CD3, MHC-II, CCR3,CD11b. [63–65] A second single staining with a second cocktailof antibodies is performed to define subpopulation of lymphocytesby gating in a bivariate plot, with the following markers: 7AAD,CD45, CD3, CD4, CD8, CD25, Ly-6C, and CD62L together with H2-Kb SIINFEKL multimer, which specifically stain OVA-allergen-spe-cific CD8+ T cells [66].
Flow cytometric analyses of BAL cells correlated significantlywith the differential morphological count using classical cytospins[63], whilst consuming significantly less time and manpower. Allmethods have proved to be highly useful for the high-throughputphenotypic allergy analysis in large cohorts of animals. Thesehigh-throughput technologies are likely to provide important ad-vances with regard to pathophysiology, diagnosis, and therapy ofIgE-mediated allergic diseases.
10. Mouse phenotyping by metabolomics
Metabolomics is a very fast expanding research field for thephenotyping of biological samples involving an unbiased charac-terization approach. Especially, morphologically not visible pheno-types can be specifically determined if concentrations ofindependent metabolites are quantified [67–69]. Very early meta-bolic responses to pharmacological treatment in mouse can beunequivocally detected [70]. Two main approaches are followedin metabolomics: (1) targeted metabolomics, where chosen sets ofmetabolites are quantified and (2) non-targeted metabolomics aim-ing at metabolite identification and profiling.
Metabolomic phenotyping of mouse lines at the Genome Analy-sis Center of Helmholtz Zentrum München is carried out using bytargeted metabolomics. Description of sample preparation and as-say procedures used is available at www.gac-munich.de. Selectedmetabolites are quantified using two different kits, the BiocratesAbsoluteIDQ™ p150 kit and the Chromsystems Newborn Screeningkit, which together allow for the quantification of 163 and 42 endog-enous metabolites from plasma and whole blood, respectively.
10.1. Kits used for metabolite quantifications
The AbsoluteIDQ™ p150 kit (BIOCRATES Life Sciences AG, Inns-bruck, Austria) has been designed for targeted metabolomics of hu-man plasma samples. The kit allows simultaneous quantification of163 metabolites including 41 acylcarnitines, 14 amino acids, 1 hex-ose, 92 glycerophospholipids (glycerophosphatidic acids and glyc-erophosphatidylcholines), and 15 sphingolipids in a single analysisrun. The metabolomic measurement technique has been validatedfor human plasma according to the FDA guidelines for industry‘‘Bioanalytical Method Validation” and is protected by patent (USPatent Nr. 20072224044). The kit is also applicable to plasma ofother species such as mouse or rat.
The Chromsystems Newborn Screening kit (ChromsystemsGmbH, Munich, Germany) has been designed for screening ofendogenous metabolites in newborn children using dried bloodspots [71,72]. It is used for the semiquantitative profiling of 12amino acids and 30 acylcarnitines to detect inborn errors of metab-olism, which can result in mental retardation, physical handicapsor even death. The kit was optimized in the Helmholtz ZentrumMünchen for application to mouse blood.
10.2. Instrumentation and software
For sample collection no special equipment is necessary. To per-form the assays using the AbsoluteIDQ™ p150 kit, sample prepara-tion is performed using a Hamilton Micro Lab Star robot (HamiltonBonaduz AG, Bonaduz, Switzerland), a nitrogen evaporator (Porvair
Ultravap), and standard laboratory equipment. Mass spectrometry(MS) analyses are carried out on a 4000 Q TRAP LC/MS/MS System(ABSciex Deutschland GmbH, Darmstadt, Germany) equipped witha Prominence LC20AD pump and a SIL-20AC auto sampler bothfrom Shimadzu. Data evaluation for quantification of metaboliteconcentrations is performed with the MetIQ™ software package,which is an integral part of the AbsoluteIDQ™ kit. In case of metab-olite measurements with the Chromsystems Newborn Screeningkit, data are evaluated using the ChemoView software from Ap-plied Biosystems/MDS Sciex.
10.3. Description of mouse phenotyping with the BiocratesAbsoluteIDQ™ kit
10.3.1. Sample collectionBlood samples are taken retro bulbar and directly collected into
tubes that contain anticoagulants. The preferred anticoagulant isEDTA, but also heparin is acceptable. However, citrate should beavoided. To compare samples, it is indispensable to handle themwith the same modality (either always EDTA or always heparin).After careful mixing, blood samples are immediately stored onice until centrifugation, which should take place as soon as possi-ble. After centrifugation for 10 min at 4500g at 4 �C (in a pre-cooledcentrifuge) the resulting supernatants (plasma) are transferredinto fresh tubes avoiding any carry-over of blood cells. Plasmasamples are frozen immediately and stored at �80 �C until furtheranalysis with the Biocrates kit. A minimum of 50 ll plasma isneeded for metabolite analysis. It is recommended to aliquot theplasma into suitable portions to avoid subsequent freeze/thaw cy-cles. Filling of sample tubes should not exceed three-quarter of thetube capacity and the same tube types and brands should be used.
To assure high quality results the guidelines for plasma prepa-ration need always to be followed in a highly standardized way.
10.3.2. Sample preparation for mass analysisSample preparation is performed with the help of a Hamilton
robot with some additional manual steps. Although only 10 ll ofplasma is needed for a single MS analysis run, sample preparationby robotics, guaranteeing uniform and high quality sample han-dling, requires a volume of 50 ll plasma.
Plasma samples are thawed at room temperature and 10 ll ofplasma is pipetted into the upper part of 96-well sandwich kitplate. The filter is preloaded with stable isotope labeled internalstandards. Plasma samples are dried using a nitrogen evaporator(30 min, 30 �C, 5 psi). Subsequently, a 5% solution of phenylisothi-ocyanate is added for derivatization of amino acids. After 20 minincubation at room temperature, the filter spots are dried again un-der nitrogen flow (30 min, 30 �C, 10 psi) and metabolites extractedwith 300 ll methanol containing 5 mM ammonium acetate byshaking (30 min, room temperature, 450 rpm). The filtered extractis obtained by centrifugation into the lower plate of the 96-wellsandwich kit plate (500g). After dilution with 600 ll of MS runningsolvent (solvent A of the kit + 5 mM ammonium acetate) the sam-ples are immediately analyzed. If necessary, sample extracts can bestored at 4 �C for 48 h.
10.3.3. Metabolite detection by LC–MS/MSMetabolite detection is performed on the 4000 Q TRAP mass
spectrometer using electrospray ionization (ESI) in positive andnegative modes. For analysis, 20 ll of extracted sample are injectedvia the auto sampler. Application to MS is performed by HPLCusing an isocratic flow injection method with MS running solventas mobile phase. Run time for one sample is 3 min. Every run startswith a flow rate of 30 ll/min which is increased to 200 ll/minwithin 1.6 min and kept at this level until the end of the run.Metabolites are detected in the Multiple Reaction Monitoring
H. Fuchs et al. / Methods 53 (2011) 120–135 129
(MRM) mode. The operating conditions for MRM mass analysis areprovided with the AbsoluteIDQ™ kit from Biocrates.
10.3.4. Data evaluationMS data are converted automatically by the MetIQ™ software.
The internal standards serve as reference for the calculation ofmetabolite concentrations (lM). Quality assessment of the mea-surements and data is included. Immediate statistical data analysisis provided via the publicly available metaP web-server (http://mips.gsf.de/proj/mbx/~metap/).
10.4. Description of mouse phenotyping with the ChromsystemsNewborn Screening kit
10.4.1. Sample collectionBlood samples are taken retro bulbar and the blood drops di-
rectly collected on a special filter paper (Whatman 903). The bloodhas to leak through the filter paper and fill a circle of about 10 mmdiameter. After drying for at least 4 h a round tile of 3 mm diame-ter (corresponding to about 3 ll of dried blood) is taken from thecenter of the circle with a paper punch.
10.4.2. Sample preparation for mass analysisNecessary buffers and reagents are provided as components of
the kit. Each filter tile is placed into one of the wells of a 96-wellplate (PP) and extracted with 200 ll of reconstituted standardsolution, which contains internal standards for later quantification(20 min, room temperature, 600 rpm). Afterwards, the filter tilesare removed and the wells are blown to dryness (60 �C, 600 rpm,air stream). Derivatization reagent (60 ll) is added to each wellfor butylation of the analytes and after incubation (15 min, 60 �C,600 rpm) the solvent is removed again by evaporation (60 �C,600 rpm, air stream; please note that at this step corrosive steamis produced). Finally, the derivated samples are reconstituted inreconstitution buffer (1 min, 600 rpm).
10.4.3. Metabolite detection by LC–MS/MSMetabolite detection is performed on the 4000 Q TRAP mass
spectrometer using electrospray ionization (ESI) in positive mode.For analysis, 10 ll of derivated sample are injected via the autosampler. Application to the mass spectrometer is performed byHPLC using an isocratic flow injection method with the kit’s mobilephase. Per run, a flow gradient from 20 to 600 ll/min is appliedover the analysis time of 1.7 min. Detection of metabolites occursby Precursor Ion Scans, Neutral Loss Scans and Multiple ReactionMonitoring (MRM). The operating conditions for analysis are out-lined in the Newborn Screening kit.
10.4.4. Data evaluationThe ChemoView software calculates the metabolite concentra-
tions (lM) directly from the MS Data generated by Analyst usingthe internal standards as reference. Quality assessment of the mea-surements and data is included.
11. Energy metabolism
Both diseases of high public health impact (e.g. obesity or diabe-tes) and a broad spectrum of medical conditions are directly or indi-rectly related to malfunctional energy balance regulation. Thisexplains why the identification of disturbed energy homoeostasisis one of the key goals of our mouse phenotyping program. Primarymetabolic phenotypes are characterized by an imbalance betweenenergy intake (affected by food intake, rate of food processing, intes-tinal nutrient and energy uptake) and energy expenditure (consist-ing of basal metabolic rate, thermogenesis, physical activity, tissue
synthesis and diet induced thermogenesis). Secondary metabolicphenotypes are caused by an altered partitioning of metabolizableenergy in the body. Disturbed energy balance and partitioning mayresult in over- or underweight animals with corresponding changesin body composition, hyper- or hypothermia, hyper- or hypometab-olism, changes in activity levels and disturbed daily rhythms. Thechallenge for a sensitive screen for metabolic phenotypes is to devel-op a syndromic diagnosis of the assessed metabolic parameters andto understand the relation of the metabolic syndromes identified inmutant mice to gene function and human diseases [7].
In the Metabolic Screen of the German Mouse Clinic (GMC) wecurrently monitor gas exchange (oxygen consumption and carbondioxide production) of single caged mice by indirect calorimetryand calculate energy expenditure based on oxygen consumptionand respiratory quotient (ratio of carbon dioxide produced andoxygen consumed). Energy expenditure is monitored in an open-circuit respirometry system for 21 h beginning in the early after-noon (13:00 CET) until the next morning (10:00 CET). The systemis set up for serial gas analysis according to the suction principle(i.e. air is pulled through metabolic cuvettes) holding up to sevenmice and one empty control channel (SM-MARS Sables Systems,USA). This set up allows the recording of 6–7 data points per ani-mal and hour. The basics of gas analysis and open-circuit calorim-etry are described in detail elsewhere [73–75]. To control forsteady-state conditions body mass is assessed before and afterthe calorimetry session. Cumulative food intake and spontaneouslocomotor activity are recorded during the session. Upon termina-tion core body temperature is measured with a rectal probe andbody composition is determined by non-invasive NMR technology(MiniSpec Bruker Optics, Germany).
Where evidence for metabolic disorders is found a more detailedanalysis of energy intake and assimilation follows. Food intake,energy excretion (faeces production), body mass and body temper-ature are monitored over five days to minimize the effects of day-to-day variation. Bomb calorimetry is then used to determine theenergy density of the diet and the feces allowing the calculationof metabolizable energy and assimilation efficiency. Where somemetabolic phenotypes are not readily detectable in ad libitum fedmice, challenge experiments involving food restriction and/or fooddeprivation can be informative [76]. Feeding a high fat diet or mod-erate cold exposure have proved to be useful metabolic challengesfor detecting disorders in energy balance regulation [77–79].
11.1. Identification of metabolic phenotypes
Using this approach, new metabolic phenotypes were success-fully identified in the GMC concerning disturbed body mass regu-lation and altered body composition (e.g. obesity models),disturbed body temperature regulation, hyper- or hypometabo-lism, irregularities in the daily rhythms of metabolic rate andlocomotor activity, as well as malfunctions in nutrient resorption.The regulation of the energy flux that is required to maintain en-ergy homoeostasis can be of quite dynamic nature as compensa-tory shifts on both sides of the energy balance equation takeplace in parallel. Indeed, in viable, moderately affected mice itmay be very difficult to detect subtle metabolic phenotypes. Inaddition, energy metabolism parameters such as metabolic ratedepend on sex, age and most importantly on body mass. Therefore,when comparing energy metabolism between mutant and controlmice differences in body mass are a major factor confounding theanalysis. Standardizing data to body mass by simply calculatingmass specific rates (e.g. ml O2 h�1 g�1 body mass) or normalizationusing questionable mass exponents (e.g. ml O2 h�1 g�1 bodymass0.75) may produce meaningless artefacts. Suitable statisticalmethods need to be implemented for comparison e.g. generalizedlinear models accounting for body mass as a co-variable to discern

130 H. Fuchs et al. / Methods 53 (2011) 120–135
effects of genotype and body mass on energy metabolism [80–82,74,75]. To circumvent these difficulties metabolic rate is some-times expressed per gram lean mass. This normalization proce-dure, however, neglects the low but significant metabolic activityof adipose tissue in obese mice. The metabolic screen at the GMCis aiming at the detection of more subtle differences in energymetabolism which requires a combined analysis of multiple meta-bolic parameters resulting in a differential syndromic diagnosis ofgenotype dependant alterations.
12. Diabetes Screen
Impaired Glucose Tolerance (IGT) and elevated fasting plasmaglucose concentrations in a mouse mutant – as e.g. determinedin the GMC Clinical Chemistry and Metabolism Screens – might re-sult from an (1) impaired capacity of pancreatic b-cells to ade-quately secrete insulin in response to glucose and/or (2) insulinresistance The latter is defined as the decreased sensitivity orresponsiveness of target tissues such as liver, skeletal muscle, adi-pose tissue, brain, or heart to the metabolic action of insulin[83,84]. Both pathophysiological conditions have been linked totype 2 diabetes, the metabolic syndrome, atherosclerosis, and car-diovascular disease. The primary aim of the newly establishedGMC Diabetes Screen is to quantify and localize defects in insulinaction and/or b-cell dysfunction in mouse mutants by applicationof the glucose clamp technique [85]. Insights from the DiabetesScreen will help to apply a new focus on further in-depth studiesthat aim to identify novel molecular parthomechanisms involvedin the development of type 2 diabetes and related disorders.
12.1. Surgical procedure and preparations for glucose clampexperiments
A silicone catheter (Helix Mark Silastic Silicone Tubing, ID.012”/.31 mm – OD.025”/.64 mm, Hugo Sachs, March, Germany), filledwith heparinized 0.9% NaCl is inserted .2400/6 mm (mice with bodymass ranging from 25 to 40 g) into the left external jugular vein.The catheter is fixed in position via ligatures, the vein distal tocatheter entry ligated and the catheter end tightly sealed. The cath-eter end is subcutaneously tunneled to the contralateral side andthen to the back of the animal where it is adjusted under the skin.Surgery is carried out in fed mice under surgical anesthesia (i.p.ketamine/xylazine = 80/10 mg/kg body weight) and post-surgicalrecovery (body mass re-gain, feeding/drinking, etc.) is carefullymonitored. Anticipation of hypothermia and providing moisteneddiet in the initial post-surgical days accelerates recovery. If appli-cable, mice should be matched for body mass/body fat contentand female mice in addition for estrous cycle state as body compo-sition (fat-lean mass) and estradiol/progesterone fluctuations af-fect insulin-mediated glucose turnover [86].
Seven days after surgery, recovered, overnight fasting (mini-mum 6 h), conscious mice are placed in restrainers (Opti-Lab, Mu-nich, Germany) set on top of heating pads. The subcutaneouslylocated catheter end, accessible via attached silk protruding froma small interscapular skin incision, is connected to two 1 cc syrin-ges placed in a microdialysis pump (CMA 402, Solna, Sweden) via a3-way connector (Small Parts Inc., Miramar, Florida, USA). Forimmediate measurement of plasma glucose concentrations (Glu-cometer Ascensia Elite, Bayer, Leverkusen, Germany) tail-tip bloodsamples are collected in heparinized CB300 LH Microvettes (Sar-stedt, Nürnbrecht, Germany).
12.2. Euglycemic-hyperinsulinemic clamp
This test determines the amount of glucose necessary to com-pensate for raised plasma insulin concentrations without causing
hypoglycemia. Briefly, by means of a primed-continuous insulininfusion (e.g. 2.5–10 mU/kg min�1, Humulin-R, Eli Lilly, Indianapo-lis, concentration adjusted to mouse model’s expected insulin sen-sitivity and containing 5% donor mouse plasma) insulin levels areacutely raised and maintained at a physiological level until min120 as previously described [87–90]. The resulting decline in plas-ma glucose concentration is counteracted by a 20% glucose infu-sion at a variable rate to maintain euglycemia (usually basalglycemic range). The steady-state glucose infusion rate (GINF)equals whole body glucose utilization and is considered an indexof an organism’s insulin sensitivity to exogenous insulin adminis-tration. To assess whole body glucose turnover, a continuous[3-3H] glucose infusion (0.1 lCi/min, Biotrend, Cologne, Germany)is administered during a 120 min basal tracer equilibration periodand continued throughout the subsequent euglycemic-hyperinsu-linemic clamp. Insulin-stimulated glucose uptake in individual tis-sues is estimated after i.v. injection of a 2-deoxy-D-[1-14C]glucosebolus (2-[1-14C]DG, 10 lCi, Biotrend, Cologne, Germany) at stea-dy-state min 75. Plasma [3-3H]glucose, 3H2O (measurement ofwhole-body glycolysis rate) and 2-[14C]DG concentrations betweenclamp min 77.5 and 120, and plasma [3-3H]glucose in addition inthe final 10 min of the basal period are measured in deproteinizedplasma samples (Somogyi filtrates). The experiment is terminatedby an i.v. ketamine/xylazine injection and individual tissues areimmediately dissected and freeze-clamped with specialized tongspre-cooled in liquid nitrogen. The rate of whole body glucose turn-over is calculated as the ratio of [3-3H]glucose infusion rate (dpm/min) and plasma [3-3H]glucose specific activity (dpm/min lmol)during ‘‘steady-state”. Hepatic [3-3H]glucose production (HGP) isdetermined by subtracting the ‘‘steady-state” GINF from the rateof whole body glucose turnover. 2-[1-14C]DG uptake in insulin tar-get tissues is calculated from plasma 2-[1-14C]DG area under thecurve between min 77.5 and 120 and tissue 2-[1-14C]DG-6-phos-phate content (measurement of tissue-specific insulin-stimulatedglucose uptake) as described previously [91].
12.3. Hyperglycemic clamp
This test measures pancreatic b-cell sensitivity in response toelevations in plasma glucose. By means of a primed, 5–10% i.v. glu-cose infusion plasma glucose concentrations are acutely raisedabove baseline concentrations. Following the determination ofthe plasma glucose concentration (see above) target hyperglyce-mia (e.g. 300 mg/dl) is maintained by adjusting the GINF. Insulin,secreted from pancreatic b-cells in response to physiologicalhyperglycemia is quantified in plasma samples (UltrasensitiveMouse Insulin ELISA #10-1150-01, Mercodia, Uppsala, Sweden)and indicates b-cell sensitivity. Steady-state GINF can be used toassess peripheral whole body glucose homeostasis.
13. Cardiovascular phenotyping
Since Cardiovascular diseases (CDV) remain one of the mostprevalent disorders and a leading cause of death, the comprehen-sive/efficient cardiovascular phenotyping of mutant mouse modelsremains an ongoing task for the identification of novel candidatedisease genes. Finding suitable animal models for these often com-plex diseases provides opportunities for new therapeutic ap-proaches and for investigations of the underlying pathogenesis.
A primary first-line screening for cardiovascular abnormalitiesinvolves the non-invasive determination of blood pressure andheart rate in the caudal artery of the tail of the consciousmouse. After one initial training day, arterial blood pressure ismeasured over 4 days using a computerized tail-cuff inflationsystem (MC4000, Hatteras Instruments, Cary, USA). This detects
H. Fuchs et al. / Methods 53 (2011) 120–135 131
hypertensive or hypotensive phenotypes and may offer hints fortachycardia, bradycardia or changes in the autonomic balance[92]. Gross examination of heart morphology and the determina-tion of heart weight in relation to tibia-length or body weightmay detect anatomical pathologies of the heart. As a blood-basedmarker for cardiac dysfunction ANP levels are quantified in heparinplasma by use of an NT-proANP sandwich ELISA [93] (Nt-proANPBiomedica Medizinprodukte, Vienna, Austria). In man and micethe diuretic, natriuretic, and vasodilating properties of ANP antag-onize the renin-angiotensin-aldesterone-system and may there-fore compensate for pathological heart remodeling and otheralterations ([93], for review see [94]). Cardiac function can be visu-alized directly by echocardiography. High frequency ultrasoundbiomicroscopy (Vevo 660, Visalsonics, Toronto, Canada) providinghigh resolution and frame rates for mouse hearts allows the 2-dimensional visualization of anatomical structures (B-mode),imaging of tissue motion over time (M-mode) and measurementsof blood flow velocity and direction (Doppler mode) [95].
Many cardiac pathologies also affect electrophysiological prop-erties such as conduction and rhythm. A non-invasive surface limbelectrocardiogram can detect primary conduction diseases as wellas secondary disorders caused by distinct structural abnormalities.Additional information on the excitable myocardial mass and thepropagation of excitation within the heart tissue can also beobtained (for review see [96]). Murine ECG differs from human inimportant diagnostic trace features such as the ST segment and adistinct T-wave as well as in some subcellular characteristicsunderlying action potentials [99]. Reliable and reproducible ECGtrace recordings require strict control of interfering factors suchas type and depth of anesthesia, body temperature and body posi-tioning [97,98]. Adequate amplifiers and noise reduction (EMKAtechnologies, Paris, France) as well as a grounded faraday cageare required to reduce electrical noise disturbance. Representativesmoothed traces are obtained by filtering and averaging 30 beats(ECGauto, EMKA technologies, Paris, France). Short 5–7 minrecordings are collected while inhalation anesthesia with isoflu-rane is used to avoid arrhythmias provoked by hypothermia. Metalbracelets clasping around the joints of the feet within a cushion ofelectrode gel are used as electrodes. (Fig. 5). The electrodes arepositioned on the front-paws and the left hind-paw, to obtain thebipolar standard limb leads I, II and III and the augmented unipolarleads AVF, AVR, AVL. Averaging and Fourier analysis of the ECGtraces is performed from lead II and marks for characteristic peaksare set automatically. Manual correction of five representativeaveraged beats facilitates the precise calculation of intervals andamplitudes. The trained observer can additionally screen the tracesfor arrhythmias and irregularly shaped beats.
The purpose of this type of non-invasive primary screen is toidentify mouse models with cardiac pathologies. These modelsare then examined in greater detail in secondary screens. Althoughthe power of each phenotyping method may be limited if it standsalone, their combination in a systematic screen offers the greatbenefit of allowing a comprehensive picture of the disorder to beobtained which can also facilitate differential diagnostic evalua-
Fig. 5. Mouse with bracelet electrode under anesthesia.
tions [100]. Since cardiovascular pathologies may be secondaryconsequences of other clinically relevant but less obvious syn-dromes, systematic phenotype analysis can help to identify the realorigin of the disease. This is exemplified by the recent discovery ofa heart and lung disorder in mice with osteogenesis imperfecta(manuscript in prep.).
14. Respiratory Function Screen
Lung diseases are among the leading causes of death worldwide[101–103]. Major contributors are chronic obstructive pulmonarydisease (COPD) and asthma, determined by inherited and environ-mental factors. Despite increased research effort and the develop-ment of suitable animal models, a substantial knowledge gap stillremains concerning gene-phenotype interactions. To improve ourunderstanding of the interplay of genetic variants and to help indeveloping new therapeutic strategies in biomedicine the Respira-tory Function Screen [104–108] aims to detect unknown pheno-types in mutant mice, focusing on the association with lungdiseases and central respiratory control disorders. The screen pro-vides a comprehensive overview of spontaneous breathing pat-terns, lung function, and airway responsiveness. The strategy ofthe Screen is first to provide a sensitive high-throughput if ratherunspecific Primary Screen; then if there are hints of genotype influ-ences on the phenotype specific Secondary and/or Tertiary Screensare available for implementation.
14.1. Spontaneous breathing pattern
The screen assesses alterations in the breathing patterns ofunrestrained mutant mouse lines during different behavioral statessuch as sleep, rest, or activity, using Whole-Body Plethysmography(WBP) (Buxco� Electronics; Sharon, Connecticut) [109]. Animalsare placed into closed breathing chambers which are supplied witha air constant flow. For 40 min pressure changes due to inspiratoryand expiratory temperature and humidity fluctuations duringbreathing are measured. Changes are transformed into flow andvolume signals. Prior to testing, the system is calibrated for actualbarometric pressure, room temperature, and humidity in order tocompensate for daily variations and to ensure the accuracy of flowrate and volume calculations. During measurement quiet ambientconditions have to be ensured and pressure fluctuations in theexperimental room, e.g., due to door opening/closing avoided.Measurements are performed between 08:00–11:00 a.m. to ac-count for potential diurnal variations in breathing. Automated dataanalysis provides tidal volumes (TV), respiratory rates (f), minuteventilations (MV), inspiratory and expiratory times (Ti, Te) as wellas respective peak flow rates (PIF, PEF). Specific tidal volumes andminute ventilations are calculated from the respective absolutevalues in relation to body mass. Parameters of interest are altera-tions in TV, f, Ti and Te, as well as impaired adaptation to differentactivity states. Altered breathing patterns in engineered mice mayreflect a response to functional and/or structural changes of thelung, thoracic malformations, respiratory muscle dysfunction, af-fected chemoreceptor sensitivity, central breathing control or met-abolic deteriorations resulting, for example in higher oxygendemands. The cause of affected breathing is subsequently elicitedin specific follow up screens in concert with the GMC.
14.2. Lung function testing
This unit is comparable to those available in pulmonary divisionsand allows for the comprehensive functional testing of intubatedand positive-pressure ventilated mice [105,110]. It is important inthis context that the animals are adequately anaesthetized

132 H. Fuchs et al. / Methods 53 (2011) 120–135
throughout the measurement period and that the respiratory mus-cles are relaxed by the use of an appropriate muscle relaxant. Set-tings for respiratory flow and volume can be adapted in 10 ll stepsto account for the physiological limitation of each mouse. Lung func-tion measurements include volumetric units like lung size (totallung capacity) and subunits such as dead space volume. Mechanicalproperties defined include the respiratory system’s resistance, andstatic and dynamic lung compliance. Intrapulmonary gas mixingand alveolar-capillary gas transfer (diffusing capacity) can be as-sessed from respiratory gases and the test gases helium and carbonmonoxide. Overall, the screen allows for the detection of restrictiveor obstructive lung diseases as well as for alterations of tissuemechanical properties in genetically engineered mice.
14.3. Ventilatory response to hypoxia and hypercapnia
Blood CO2 and O2 content tightly controls breathing; increasedpartial pressure of CO2 (hypercapnia) or decreased partial pressureof O2 (hypoxia) immediately results in increased ventilatory efforts– mediated via peripheral and central chemoreceptors. Assessingthe response to both conditions by Whole-Body Plethysmographyis a well-established method of detecting disturbances in respira-tory regulation [111]. Animals undergo challenge to hypercapnicconditions (3%, 5%, 8% CO2, 7 mins each). After a recovery periodof 15 min mice are exposed to either hypoxic conditions (10%, 8%O2), or a combination of both (8% O2 and 3% CO2, 7 min each). Ven-tilatory responses defined by the parameters introduced in the pri-mary screen are determined under stable breathing conditionsduring the 6th and 7th minute respectively and allow for the dis-tinct assessment of respiratory regulation. Adequate measurementdepends on ensuring that only hypercapnic/hypoxic challenge thatcauses the ventilatory responses in each animal – therefore it isimportant to guarantee therefore quiet ambient conditions andto avoid other extrinsic stimuli such as random noise.
15. Molecular phenotyping
Microarray-based gene expression profiling as an approach tomolecularly phenotype organs of MMLs at the transcript level iscurrently not part of the EMPReSSslim protocol, since it is deemedtoo labor and cost-intensive. However, by combining the system-atic collection of a set of organs with a biased selection of organsfor gene expression analyses based on knowledge about gene func-tions, we have been able to demonstrate that the primary molecu-lar phenotyping screen of the GMC is at least as efficient as otherGMC screens [112].
We use a close to genome-wide microarray [113,114] with21.000 sequenced probes (mouse arrayTAG library supplementedwith about 600 custom probes) spotted with Telechem steal pinsusing a Microgrid TAS robot. A full description of our microarrayplatform is available through the GEO database (GPL 4937). Forthe primary screen a panel of 10 organs from each of four mutantand four wild-type male mice per MML is collected at the age of18 weeks (80 organ samples per MML and wt control). To mini-mize the influence of circadian rhythm on gene expression, miceare killed by asphyxiation in CO2 gas between 9 and 12 am. Organsare immediately dissected in the following order: pancreas, spleen,liver, kidney, femoral muscle, testis, heart, lung, thymus and brain.All organs are instantly snap frozen and stored in liquid nitrogenuntil RNA isolation. Only pancreas is treated with an RNA stabiliza-tion reagent (RNAlater, Qiagen) and subsequently stored at -80 �C.
Protocols for the isolation of total RNA are optimized for each ofthe collected tissue. Brain, spleen, kidney, and lung are thawed inbuffer containing chaotropic salt (Qiagen, Hilden, Germany)whereas liver, testis, pancreas, heart, femoral muscle and thymus
are treated with Trizol before RNA isolation (Invitrogen, Karlsruhe,Germany). After homogenizing the organs (Heidolph PolytronHomogenizer Typ 10F, Schwabach, Germany) total RNA is isolatedaccording to manufacturer’s protocols using a RNeasy Midi Kit(Qiagen). To check the RNA integrity 1 lg total RNA is run on form-aldehyde agarose gels and the concentration is calculated fromOD260/280 readings.
Following a modified TIGR protocol [112,115] two independentdual-color hybridizations are performed in a dye-swap experimentfor each mutant mouse. As control a pool of total RNAs of the cor-responding wild-type organ is used as reference. The dual-color(Cy3/Cy5) hybridizations of mutant and wild-type (wt) samplesare automated and standardized using a hybridization station(HS 4800, Tecan) [116]. The dataset for the analysis of one organthus results from eight hybridized microarrays, respectively, fourpairs of dye-swap hybridizations. We use the TIGR Microarray DataAnalysis System (MIDAS) for normalization [117] and SAM for theidentification of significantly regulated genes [118]. For the identi-fication of pathways and gene functions of differentially expressedgenes we rely on several software tools (BiblioSphere Pathway Edi-tion, Panther classification system, or EASE) [119–121]. These toolswere used for the identification of statistically over-representedgene ontology (GO) terms (biological processes or molecular func-tions) among the regulated genes.
Previously, we analyzed data from 74 MMLs and 1875 micro-array experiments in order to demonstrate the efficiency of sys-tematic genome-wide expression profiling for the identificationof molecular phenotypes in organs of mammalian model organ-isms [122–127]. We found statistically significant altered gene reg-ulation in about 56% of the analyzed MMLs in the primarymolecular phenotyping screen of the GMC [112]. As secondaryscreens we offer the analysis of organs at different ages or of addi-tional organs that are not included in our routine set.
16. Pathology
Genetically engineered mice have become indispensable toolsfor cancer research, and for the identification of genes involvedin human diseases. A complete phenotyping of a mouse model isa challenge for which most research laboratories are not prepared.The GMC was designed to offer a large-scale, standardized andcomprehensive phenotype analysis of mouse mutants to the scien-tific community. The pathology screen within the GMC plays a piv-otal role in the final analysis of mouse models. The morphologicalphenotype helps to establish an eventual correlation between thefunctional abnormalities found in other screens and the observedanatomical changes. This helps to understand how genetic altera-tions influence the development of human diseases [6].
A histological analysis should always be performed in combina-tion with a precise macroscopic examination. For routine screeningprocedures within a primary screening pipeline, the use of six maleand six female mutants as well as the same number of control ani-mals for macroscopic analysis will result in sufficient informationfor evaluation of the phenotype of the mutant line.
It is important that the mice are received alive to avoid autolyticchanges of the tissues that may impair further histological exami-nation. The mice are sacrificed with CO2. The skin is opened in theventral midline and in the direction of the extremities. The muscu-lar abdominal wall is cut open in the midline and along the lowermargin of the rib cage. The aorta is cut beside the adrenal to getserum samples and to exsanguinate the animal. The serum sam-ples are conserved at �20 �C. Tails are stored at �70 �C for furthergenetic analysis. The organs of the visceral cavity are exenteratedaltogether and the brain is removed from the cranium. The heartis weighed and the heart weight is then normalized to tibia-length,

H. Fuchs et al. / Methods 53 (2011) 120–135 133
which represents a more constant and reliable parameter thanbody weight [128]. Objective findings, such as size measurements(weight), color, consistency and shape evaluation of the organsgive a first impression about possible malformations and can lateron help to interpret the alterations. In the analysis of the micro-scopic anatomy of tissues, it is important that the organs are fixedin 4% neutrally buffered formalin immediately after dissection.Afterwards the samples are processed and embedded in paraffin.The microscopical examination starts with the analysis of tissuesections of all organs stained with haematoxylin and eosin(H&E). The H&E staining has the ability to demonstrate an enor-mous number of different tissue structures and most diagnosescan be made using this staining [129–131]. However, in some in-stances special stains are necessary in order to achieve a precisediagnosis.
The microscopic observation of the stained tissues is limited bythe maximum resolution of the light microscope in which dis-tances less than 0.3 lm cannot be examined. In some instances itis necessary to observe even smaller structures. Transmission elec-tron microscopy (TEM) has the fundamental advantage of disclos-ing the substructure and ultrastructure of individual cells [132],and for example, is an important diagnostic tool in renal diseaseswhen a glomerulonephritis or an autoimmune disorder is sus-pected [133]. TEM can therefore prove particularly useful whenconventional light microscopy allows only identification of minorabnormalities despite clear evidence of disease [134].
Occasionally, morphological and clinical data are not of them-selves enough to reach a conclusive diagnosis by means of a tissuesection. In such cases immunohistochemistry has become a crucialtechnique. It is used for the identification of specific and highlyselective cellular epitopes in routinely processed paraffin-embed-ded or in frozen tissues using an antibody and an appropriatelabeling system. A very good example is the use of immunohisto-chemistry for the classification of lymphomas and leukemias. Dif-ferent antibodies, recognizing specific antigens expressed byparticular cell types (myeloperoxidase, B220, CD79a etc.), areavailable to allow precise diagnosis and classification of haemato-poetic neoplasias [135,136]. In addition, specific antibodies can beused to demonstrate cellular processes, like proliferation (Ki67)and apoptosis (activated caspase 3) or the presence of a geneticevent, such as p53 mutations [137–139]. The immunohistochemi-cal analysis can be combined with quantitative image analysisusing dedicated software. After staining with the appropriate mar-ker, positive and negative cells can be easily detected and countedto obtain statistically usable data.
Another useful tool in pathology as well as in research is virtualslide microscopy. It offers the scientific community the potential ofacquiring complete slides at high magnification, allowing diagno-sis, analysis and archiving of samples for discussion both remotelyand during online conferences. Since virtual slide images can bestored in such a way as to permit instant, controlled, access any-where in the world. It is an excellent tool for remote diagnosis (tel-ediagnostics), second-opinion consultations and discussions.
In the past few years laser microdissection has become a popu-lar technology enabling researchers to focus on particular parts ofthe tissue on a slide. The desired cell populations are cut out andextracted from tissue sections or cytological preparations [140].The objective is the elimination or minimization of contaminationfrom adjacent cells present in tissues or cytological samples. Afterthe laser dissection, the cells can be utilized for the analysis ofDNA, RNA or protein expression.
Acknowledgments
We would like to thank Reinhard Seeliger, Miriam Backs, NicoleBoche, Sabrina Bothur, Ralf Fischer, Michaela Grandl, Tamara
Halex, Sabine Holthaus, Elfi Holupirek, Constanze König, MariaKugler, Albert Langer, Katrin Laube, Astrid Markert, JacquelineMüller, Elenore Samson, Sandra Schädler, Florian Schleicher, Dani-ela Schmidt, Waldemar Schneider, Ann-Elisabeth Schwarz, AnettSeelig, Bettina Sperling, Waltraud Stettinger, Lucie Thurmann,Susanne Wittich, Anja Wohlbier and Claudia Zeller as well as theGMC animal caretaker team for expert technical help. This workhas been funded by the BMBF (NGFNplus Grant, 01GS08156,01GS0850, 01GS0851, 01GS0852, 01GS0868, 01GS0869,01GS0853, and 01GS0854) and by an EU grant (EUMODIC, LSHG-2006-037188, German Mouse Clinic).
References
[1] V. Gailus-Durner, H. Fuchs, L. Becker, I. Bolle, M. Brielmeier, J. Calzada-Wack,R. Elvert, N. Ehrhardt, C. Dalke, T.J. Franz, E. Grundner-Culemann, S.Hammelbacher, S.M. Hölter, G. Hölzlwimmer, M. Horsch, A. Javaheri, S.Kalaydjiev, M. Klempt, E. Kling, S. Kunder, C. Lengger, T. Lisse, T. Mijalski, B.Naton, V. Pedersen, C. Prehn, G. Przemeck, I. Racz, C. Reinhard, P. Reitmeir, I.Schneider, A. Schrewe, R. Steinkamp, C. Zybill, J. Adamski, J. Beckers, H.Behrendt, J. Favor, J. Graw, G. Heldmaier, H. Höfler, B. Ivandic, H. Katus, P.Kirchhof, M. Klingenspor, T. Klopstock, A. Lengeling, W. Müller, F. Ohl, M.Ollert, L. Quintanilla-Martinez, J. Schmidt, H. Schulz, E. Wolf, W. Wurst, A.Zimmer, D.H. Busch, M. Hrabé de Angelis, Nat. Methods 2 (2005) 403–404.
[2] S.D. Brown, P. Chambon, M. Hrabé de Angelis, Eumorphia Consortium Nat.Genet. 37 (2005) 1155.
[3] H. Maier, C. Lengger, B. Simic, H. Fuchs, V. Gailus-Durner, M. Hrabé de Angelis,BMC Bioinform. 9 (2008) 169.
[4] M. Brielmeier, H. Fuchs, G. Przemeck, V. Gailus-Durner, M. Hrabé de Angelis, J.Schmidt, in: J.-L. Guenet, C. Herweg (Eds.) Laboratory Animals Science – Basisand Strategy for Animal Experimentation, Vol. 11, Proceedings of the 8thFELASA Symposium, Laboratory Animals Ltd., Aachen, 2002, pp. 19–22.
[5] A.-M. Mallon, A. Blake, J.M. Hancock, Nucl. Acids Res. 36 (2008) D715–D718.[6] H. Fuchs, V. Gailus-Durner, T. Adler, J.A. Pimentel, L. Becker, I. Bolle, M.
Brielmeier, J. Calzada-Wack, C. Dalke, N. Ehrhardt, N. Fasnacht, B. Ferwagner,U. Frischmann, W. Hans, S.M. Hölter, G. Hölzlwimmer, M. Horsch, A. Javaheri,M. Kallnik, E. Kling, C. Lengger, H. Maier, I. Moßbrugger, C. Mörth, B. Naton, U.Nöth, B. Pasche, C. Prehn, G. Przemeck, O. Puk, I. Rácz, B. Rathkolb, J. Rozman,K. Schäble, R. Schreiner, A. Schrewe, C. Sina, R. Steinkamp, F. Thiele, M.Willershäuser, R. Zeh, J. Adamski, D.H. Busch, J. Beckers, H. Behrendt, H.Daniel, I. Esposito, J. Favor, J. Graw, G. Heldmaier, H. Höfler, B. Ivandic, H.Katus, M. Klingenspor, T. Klopstock, A. Lengeling, M. Mempel, W. Müller, S.Neschen, M. Ollert, L. Quintanilla-Martinez, P. Rosenstiel, J. Schmidt, S.Schreiber, K. Schughart, H. Schulz, E. Wolf, W. Wurst, A. Zimmer, M. Hrabé deAngelis, Curr. Pharm. Biotechnol. 10 (2009) 236–243.
[7] V. Gailus-Durner, H. Fuchs, T. Adler, J.A. Pimentel, L. Becker, I. Bolle, Calzada-Wack, C. Dalke, N. Ehrhardt, B. Ferwagner, W. Hans, S.M. Hölter, G.Hölzlwimmer, M. Horsch, A. Javaheri, M. Kallnik, E. Kling, C. Lengger, I.Moßbrugger, C. Mörth, B. Naton, C. Prehn, O. Puk, B. Rathkolb, J. Rozman, A.Schrewe, F. Thiele, J. Adamski, B. Aigner, H. Behrend, D.H. Busch, J. Favor, J.Graw, G. Heldmaier, B. Ivandic, H. Katus, M. Klingenspor, T. Klopstock, M.Ollert, L. Quintanilla-Martinez, H. Schulz, E. Wolf, W. Wurst, M. Hrabé deAngelis, second ed., in: R. Kühn, W. Wurst (Eds.), Gene Knockout Protocols,vol. 530, Humana Press, Totowa, NJ, 2009, pp. 463–509.
[8] G. Karsenty, E.F. Wagner, Dev. Cell 2 (2002) 389–406.[9] S.H. Ralston, B. de Crombrugghe, Genes Dev. 20 (2006) 2492–2506.
[10] K. Abe, H. Fuchs, T. Lisse, W. Hans, M. Hrabé de Angelis, Mamm. Genome 17(2006) 915–926.
[11] F. Rauch, F.H. Glorieux, Lancet 363 (2004) 1377–1385.[12] P.F. Giampietro, R.D. Blank, C.L. Raggio, S. Merchant, F.S. Jacobsen, T.
Faciszewski, S.K. Shukla, A.R. Greenlee, C. Reynolds, D.B. Schowalter, Clin.Med. Res. 1 (2003) 125–136.
[13] F.V. Mariani, G.R. Martin, Nature 423 (2003) 19–25.[14] H. Fuchs, T. Lisse, K. Abe, M. Hrabé de Angelis, in: M. Hrabé de Angelis, P.
Chambon, S. Browns (Eds.), Phenotyping of the Laboratory Mouse, Wiley-VCH, Weinheim, 2006, pp. 35–86.
[15] H. Fuchs, K. Schughart, E. Wolf, R. Balling, M. Hrabé de Angelis, Mamm.Genome 11 (2000) 528–530.
[16] J.A. Sorenson, P.R. Duke, S.W. Smith, Med. Phys. 16 (1989) 75–80.[17] D. Wahlsten, Physiol. Behav. 73 (2001) 695–704.[18] W.E. Crusio, R.T. Gerlai (Eds.), Handbook of Molecular-Genetic Techniques for
Brain and Behavior Research, Elsevier Science B.V., Amsterdam, 1999.[19] J.N. Crawley, What’s wrong with my mouse? Behavioral phenotyping of
transgenic and knockout mice, second ed., John Wiley & Sons Inc., Hoboken,New Jersey, 2007.
[20] F. Ohl, F. Holsboer, R. Landgraf, Behav. Res. Meth. Instr. Comp. 33 (2001) 392–397.
[21] C. Belzung, G. Griebel, Behav. Brain Res. 125 (2001) 141–149.[22] J.F. Cryan, A. Holmes, Nat. Rev. Drug Discov. 4 (2005) 775–790.[23] S. Mandillo, V. Tucci, S.M. Hölter, H. Meziane, M.A. Banchaabouchi, M. Kallnik,
H.V. Lad, P.M. Nolan, A.M. Ouagazzal, E.L. Coghill, K. Gale, E. Golini, S. Jacquot,W. Krezel, A. Parker, F. Riet, I. Schneider, D. Marazziti, J. Auwerx, S.D. Brown,
134 H. Fuchs et al. / Methods 53 (2011) 120–135
P. Chambon, N. Rosenthal, G. Tocchini-Valentini, W. Wurst, Physiol. Genom.34 (2008) 243–255.
[24] W. Falls, in: Crawley, J. (Ed.), Current Protocols in Neuroscience, Unit 8.11B.1-8.11B.16. John Wiley & Sons Inc., Hoboken, NY, USA, 2002.
[25] K. Richter, G. Wolf, M. Engelmann, Learn. Mem. 12 (2005) 407–413.[26] D. Genoux, U. Haditsch, M. Knobloch, A. Michalon, D. Storm, I. Mansuy,
Nature 418 (2002) 970–975.[27] R. Feil, S.M. Hölter, K. Weindl, W. Wurst, S. Langmesser, A. Gerling, S. Feil, U.
Albrecht, Commun. Integr. Biol. 2 (4) (2009) 1–4. July/August.[28] S.M. Hölter, M. Kallnik, W. Wurst, G. Marsicano, B. Lutz, C.T. Wotjak, Eur. J.
Pharmacol. 510 (2005) 69–74.[29] M. Hafezparast, A. Ahmad-Annuar, N.W. Wood, S.J. Tabrizi, E.M. Fisher, Lancet
Neurol. 1 (2002) 215–224.[30] D.C. Rogers, E.M. Fisher, S.D. Brown, J. Peters, A.J. Hunter, J.E. Martin, Mamm.
Genome. 8 (1997) 711–713.[31] M.S. LeDoux (Ed.), Animal Models of Movement Disorders, Academic Press/
Elsevier, Amsterdam, The Netherlands, 2004.[32] I. Schneider, W.S. Tirsch, T. Faus-Kessler, L. Becker, E. Kling, R.L. Busse, A.
Bender, B. Feddersen, J. Tritschler, H. Fuchs, V. Gailus-Durner, K.H. Englmeier,M. Hrabé de Angelis, T. Klopstock, J. Neurosci. Methods 157 (2006) 82–90.
[33] C. Dalke, J. Graw, Exp. Eye Res. 81 (2005) 502–512.[34] G.W. Balkema, N.J. Mangini, L.H. Pinto, J.W. Vanable Jr., Invest. Ophthalmol.
Vis. Sci. 25 (1984) 795–800.[35] R.M. Douglas, N.M. Alam, B.D. Silver, T.J. McGill, W.W. Tschetter, G.T. Prusky,
Vis. Neurosci. 22 (2005) 677–684.[36] J.S. Stahl, J. Neurophysiol. 91 (2004) 2066–2078.[37] C. Thaung, K. Arnold, I.J. Jackson, P.J. Coffey, Neurosci. Lett. 325 (2002) 21–24.[38] C. Thaung, K. West, B.J. Clark, L. McKie, J.E. Morgan, K. Arnold, P.M. Nolan, J.
Peters, A.J. Hunter, S.D. Brown, I.J. Jackson, S.H. Cross, Hum. Mol. Genet. 11(2002) 755–767.
[39] O. Puk, C. Dalke, M. Hrabé de Angelis, J. Graw, Front. Biosci. 13 (2008) 6269–6275.
[40] J. Graw, J. Löster, Int. J. Dev. Biol. 48 (2004) 1031–1044.[41] K. Ganguly, J. Favor, A. Neuhäuser-Klaus, R. Sandulache, O. Puk, J. Beckers, M.
Horsch, S. Schädler, D. Vogt-Weisenhorn, W. Wurst, J. Graw, Invest.Ophthalmol. Vis. Sci. 49 (2008) 1533–1541.
[42] P.D. Wall, Pain 54 (1993) 239.[43] J.S. Mogil, S.G. Wilson, K. Bon, S.E. Lee, K. Chung, P. Raber, J.O. Pieper, H.S.
Hain, J.K. Belknap, L. Hubert, G.I. Elmer, J.M. Chung, M. Devor, Pain 80 (1999)67–82.
[44] K. Hargreaves, R. Dubner, F. Brown, C. Flores, J. Joris, Pain 32 (1988) 77–88.
[45] I. Racz, B. Schütz, O.M. Abo-Salem, A. Zimmer, Neuroreport 16 (2005) 2025–2028.
[46] A. Zimmer, E. Valjent, M. König, A.M. Zimmer, P. Robledo, H. Hahn, O.Valverde, R. Maldonado, J. Neurosci. 21 (2001) 9499–9505.
[47] H.A. Hofmann, J. De Vry, A. Siegling, P. Spreyer, D. Denzer, Eur. J. Pharmacol.470 (2003) 17–25.
[48] C. VanderWende, S. Margolin, Fed. Proc. 15 (1956) 494.[49] C.C. Chen, A. Zimmer, W.H. Sun, J. Hall, M.J. Brownstein, A. Zimmer, Proc. Natl.
Acad. Sci. USA 99 (2002) 8992–8997.[50] M. König, A.M. Zimmer, H. Steiner, P.V. Holmes, J.N. Crawley, M.J. Brownstein,
A. Zimmer, Nature 383 (1996) 535–538.[51] C.A. Porro, M. Cavazzuti, Prog. Neurobiol. 41 (1993) 565–607.[52] B. Rathkolb, T. Decker, E. Fuchs, D. Soewarto, C. Fella, S. Heffner, W. Pargent, R.
Wanke, R. Balling, M. Hrabé de Angelis, H.J. Kolb, E. Wolf, Mamm. Genome. 11(2000) 543–546.
[53] M. Klempt, B. Rathkolb, B. Aigner, E. Wolf, in: M. Hrabé de Angelis, P.Chambon, S. Brown (Eds.), Standards of Mouse Model Phenotyping, Wiley-VCH, Weinheim, Germany, 2006, pp. 87–107.
[54] M. Mohr, M. Klempt, B. Rathkolb, M. Hrabé de Angelis, E. Wolf, B. Aigner, J.Lipid Res. 45 (2004) 2132–2137.
[55] B. Rathkolb, T.V. Tran, M. Klempt, M. Hrabé de Angelis, R. Wanke, E. Wolf, B.Aigner, Nephron. Exp. Nephrol. 100 (2005) e143–e149.
[56] B. Aigner, B. Rathkolb, N. Herbach, E. Kemter, C. Schessl, M. Klaften, M.Klempt, M. Hrabé de Angelis, R. Wanke, E. Wolf, Am. J. Physiol. Renal Physiol.292 (2007) F1560–F1567.
[57] J.L. Weaver, D.D. Broud, Toxicol. Mech. Methods 12 (2002) 95–118.[58] D. Diaz, A. Pietro, H. Barcenilla, J. Monserrat, P. Pietro, M.A. Sánchez, E. Reyes,
M.P. Hernandez-Fuentes, A. De la Hera, A. Orfao, M. Alvarez-Mon, J. Leuk Biol.76 (2004) 609–615.
[59] J.F. Bach, N. Engl. J. Med. 347 (2002) 911–920.[60] S. Weidinger, C. Gieger, E. Rodriguez, H. Baurecht, M. Mempel, N. Klopp, H.
Gohlke, S. Wagenpfeil, M. Ollert, J. Ring, H. Behrendt, J. Heinrich, N. Novak, T.Bieber, U. Kramer, D. Berdel, A. von Berg, C.P. Bauer, O. Herbarth, S. Koletzko,H. Prokisch, D. Mehta, T. Meitinger, M. Depner, E. von Mutius, L. Liang, M.Moffatt, W. Cookson, M. Kabesch, H.E. Wichmann, T. Illig, PLoS Genet. 4(2008) e1000166.
[61] F. Alessandrini, H. Schulz, S. Takenaka, B. Lentner, E. Karg, H. Behrendt, T.Jakob, J. Allergy Clin. Immunol. 117 (2006) 824–830.
[62] T. Jakob, F. Alessandrini, J. Gutermuth, G. Köllisch, A. Javaheri, A. Aguilar, M.Mempel, J. Ring, M. Ollert, H. Behrendt, in: M. Hrabé de Angelis, P. Chambon,S. Brown (Eds.), Standards of Mouse Model Phenotyping, Wiley-VCH,Weinheim, Germany, 2006, pp. 253–282.
[63] L.S. van Rijt, H. Kuipers, N. Vos, D. Hijdra, H.C. Hoogsteden, B.N. Lambrecht, J.Immunol. Methods 288 (2004) 111–121.
[64] W.W. Stevens, T.S. Kim, L.M. Pujanauski, X. Hao, T.J. Braciale, J. Immunol.Methods 327 (2007) 63–74.
[65] P.A. Smith, L.M. Kohli, K.L. Wood, C.A. Hage, H.L. Twigg 3rd, K.S. Knox,Cytometry B Clin. Cytom. 70 (2006) 170–178.
[66] P. Klenerman, V. Cerundolo, P.R. Dunbar, Nat. Rev. Immunol. 2 (2002) 263–272.[67] C.H. Gieger, L. Geistlinger, E. Altmaier, M. Hrabé de Angelis, F. Kronenberg, T.
Meitinger, H.W. Mewes, H.E. Wichmann, K.M. Weinberger, J. Adamski, T. Illig,K. Suhre, PLOS Genet. 4 (2008) e1000282.
[68] R. Wang-Sattler, Y. Yu, K. Mittelstrass, E. Lattka, E. Altmaier, C.H. Gieger, K.H.Ladwig, N. Dahmen, P. Hao, L. Liu, Y. Li, H.E. Wichmann, K.M. Weinberger, J.Adamski, K. Suhre, T. Illig, PLOS One 3 (2008) e3863.
[69] E. Altmaier, G. Kastenmüller, W. Römisch-Margl, B. Thorand, K.M.Weinberger, J. Adamski, T. Illig, A. Döring, K. Suhre, Mol. Nutr. Food Res. 53(11) (2009) 1357–1365.
[70] E. Altmaier, S.L. Ramsay, A. Graber, H.W. Mewes, K.M. Weinberger, K. Suhre,Endocrinology 149 (2008) 3478–3489.
[71] D. Chace, T.A. Kalas, E.W. Naylor, Clin. Chem. 49 (2003) 1797–1817.[72] M.S. Rashed, M.P. Bucknall, D. Little, A. Awad, M. Jacob, M. Alamoudi, M.
Alwattar, P.T. Ozandi, Clin. Chem. 43 (1997) 1129–1141.[73] G. Heldmaier, S. Steinlechner, J. Comp. Physiol. 142 (1981) 429–437.[74] J.R. Arch, D. Hislop, S.J. Wang, J.R. Speakman, Int. J. Obes. 30 (2006) 1322–
1331.[75] J.R.B. Lighton, Measuring Metabolic Rates – A Manual for Scientists, Oxford
University Press, New York, 2008.[76] G. Haemmerle, A. Lass, R. Zimmermann, G. Gorkiewicz, C. Meyer, J. Rozman,
G. Heldmaier, R. Maier, C. Theussl, S. Eder, D. Kratky, E.F. Wagner, M.Klingenspor, G. Höfler, R. Zechner, Science 312 (2006) 734–737.
[77] D.E. Cummings, E.P. Brandon, J.V. Planas, K. Motamed, R.L. Idzerda, G.S.McKnight, Nature 382 (1996) 622–626.
[78] S. Enerbäck, A. Jacobsson, E.M. Simpson, C. Guerra, H. Yamashita, M.E. Harper,L.P. Kozak, Nature 387 (1997) 90–94.
[79] A. Chadt, K. Leicht, A. Deshmukh, L.Q. Jiang, S. Scherneck, U. Bernhardt, T.Dreja, H. Vogel, K. Schmolz, R. Kluge, J.R. Zierath, C. Hultschig, R.C. Hoeben, A.Schürmann, H.G. Joost, H. Al-Hasani, Nat. Genet. 40 (2008) 1354–1359.
[80] C.W.E. Meyer, M. Klingenspor, J. Rozman, G. Heldmaier, Obesity Res. 12(2004) 1509–1518.
[81] C.W. Meyer, R. Elvert, A. Scherag, N. Ehrhardt, V. Gailus-Durner, H. Fuchs, H.Schäfer, M. Hrabé de Angelis, G. Heldmaier, M. Klingenspor,Naturwissenschaften 94 (2007) 401–406.
[82] C.W. Meyer, J. Neubronner, J. Rozman, G. Stumm, A. Osanger, C. Stoeger, M.Augustin, J. Grosse, M. Klingenspor, G. Heldmaier, J. Comp. Physiol. B 177(2007) 183–192.
[83] R.A. DeFronzo, Diabetologia 35 (1992) 389–397.[84] G. Reaven, Diabetes Metab. Rev. 9 (Suppl.) (1993) 5–12.[85] R.A. DeFronzo, J.D. Tobin, R. Andres, Am. J. Physiol. 237 (1979) E214–E223.[86] S. Morimoto, M.A. Cerbón, A. Alvarez-Alvarez, G. Romero-Navarro, V. Díaz-
Sánchez, Life sci. 68 (2001) 2979–2985.[87] S. Neschen, K. Morino, J. Dong, Y. Wang-Fischer, G.W. Cline, A.J. Romanelli, J.C.
Rossbacher, I.K. Moore, W. Regittnig, D.S. Munoz, J.H. Kim, G.I. Shulman,Diabetes 56 (2007) 1034–1041.
[88] H.S. Jürgens, S. Neschen, S. Ortmann, S. Scherneck, K. Schmolz, G. Schüler, S.Schmidt, M. Blüher, S. Klaus, D. Perez-Tilve, M.H. Tschöp, A. Schürmann, H.G.Joost, Diabetologia 50 (2007) 1481–1489.
[89] S. Neschen, K. Morino, L.E. Hammond, D. Zhang, Z.-X. Liu, A.J. Romanelli, G.W.Cline, R.L. Pongratz, X.-M. Zhang, C.S. Choi, R.A. Coleman, G.I. Shulman, CellMetab. 2 (2005) 55–65.
[90] J.M. Ren, B.A. Marshall, M.M. Mueckler, M. McCaleb, J.M. Amatruda, G.I.Shulman, J. Clin. Invest. 95 (1995) 429–432.
[91] K. Ohshima, N.S. Shargill, T.M. Chan, G.A. Bray, Am. J. Physiol. 246 (1984)E193–E197.
[92] K.L. Svenson, M.A. Bogue, L.L. Peters, J. Appl. Physiol. 94 (2003) 1650–1659(discussion 1673).
[93] F. Schoensiegel, R. Bekeredjian, A. Schrewe, D. Weichenhan, N. Frey, H.A.Katus, B.T. Ivandic, Comp. Med. 57 (2007) 546–553.
[94] A. Clerico, F.A. Recchia, C. Passino, M. Emdin, Am. J. Physiol. Heart Circ.Physiol. 290 (2006) H17–H29.
[95] Y.Q. Zhou, F.S. Foster, B.J. Nieman, L. Davidson, X.J. Chen, R.M. Henkelman,Physiol. Genomics 18 (2004) 232–244.
[96] X.H. Wehrens, S. Kirchhoff, P.A. Doevendans, Cardiovasc. Res. 45 (2000) 231–237.
[97] G.O. Appleton, Y. Li, G.E. Taffet, C.J. Hartley, L.M. Michael, M.L. Entman, R.Roberts, D.S. Khoury, J. Interv. Card. Electrophysiol. 11 (2004) 5–14.
[98] M. Mohan, B. Anandh, D.P. Thombre, S.G. Surange, A.S. Chakrabarty, Indian J.Physiol. Pharmacol. 31 (1987) 211–217.
[99] S. Danik, C. Cabo, C. Chiello, S. Kang, A.L. Wit, J. Coromilas, Am. J. Physiol.Heart Circ. Physiol. 283 (2002) H372–H381.
[100] C. Passino, R. Poletti, M. Fontana, G. Vergaro, C. Prontera, A. Gabutti, A.Giannoni, M. Emdin, A. Clerico, Clin. Chem. Lab. Med. 46 (2008) 1515–1523.
[101] European Respiratory Society, European Lung Foundation. The EuropeanLung White Book, 2003, ERSJ Ltd, Sheffield, UK.
[102] WHO Particulate Matter and Air Pollution, 2005. <http://www.euro.who.int/document/mediacentre/fs0405e.pdf>.
[103] WHO Mortality Data, 2006. <http://www.who.int/whosis/mort/en/>.[104] K. Ganguly, T. Stoeger, S.C. Wesselkamper, C. Reinhard, M.A. Sartor, M.
Medvedovic, C.R. Tomlinson, I. Bolle, J.M. Mason, G.D. Leikauf, H. Schulz,Physiol. Genomics 31 (2007) 410–421.

H. Fuchs et al. / Methods 53 (2011) 120–135 135
[105] C. Reinhard, G. Eder, H. Fuchs, A. Ziesenis, J. Heyder, H. Schulz, Mamm.Genome 13 (2003) 429–437.
[106] C. Reinhard, B. Meyer, H. Fuchs, T. Stoeger, G. Eder, F. Ruschendorf, J. Heyder,P. Nurnberg, M. Hrabé de Angelis, H. Schulz, Am. J. Respir. Crit. Care Med. 171(2005) 880–888.
[107] C.G. Tankersley, Curr. Opin. Pulm. Med. 5 (1999) 344–348.[108] C.G. Tankersley, R.S. Fitzgerald, R.C. Levitt, W.A. Mitzner, S.L. Ewart, S.R.
Kleeberger, J. Appl. Physiol. 82 (1997) 874–881.[109] J.E. Drorbaugh, W.O. Fenn, Pediatrics 16 (1955) 81–87.[110] H. Schulz, C. Johner, G. Eder, A. Ziesenis, P. Reitmeier, J. Heyder, R. Balling,
Acta Physiol. Scand. 174 (2002) 367–375.[111] C.G. Tankersley, Respir. Physiol. Neurobiol. 135 (2003) 167–178.[112] M. Horsch, S. Schädler, V. Gailus-Durner, H. Fuchs, H. Meyer, M. Hrabé de
Angelis, J. Beckers, Proteomics 8 (2008) 1248–1256.[113] M. Schena, D. Shalon, R.W. Davis, P.O. Brown, Science 270 (1995) 467–
470.[114] L.H. Augenlicht, M.Z. Wahrman, H. Halsey, L. Anderson, J. Taylor, M. Lipkin,
Cancer Res. 47 (1987) 6017–6021.[115] P. Hegde, R. Qi, K. Abernathy, C. Gay, S. Dharap, R. Gaspard, J. Hughes, E.
Snesrud, N. Lee, J. Quackenbush, Biotechniques 29 (2000) 548–550. 52-4 56passim.
[116] A.L. Drobyshev, C. Machka, M. Horsch, M. Seltmann, V. Liebscher, M. Hrabé deAngelis, J. Beckers, Nucl. Acids Res. 31 (2003) E1-1.
[117] J. Quackenbush, Nat. Genet. 32 (Suppl.) (2002) 496–501.[118] G. Chu, B. Narasimhan, R. Tibshirani, V. Tusher, 2007. <http://www-
stat.stanford.edu/~tibs/SAM/index.html>.[119] G. Dennis Jr., B.T. Sherman, D.A. Hosack, J. Yang, W. Gao, H.C. Lane, R.A.
Lempicki, Genome Biol. 4 (2003) P3.[120] M. Scherf, A. Epple, T. Werner, Brief Bioinform. 6 (2005) 287–297.[121] P.D. Thomas, M.J. Campbell, A. Kejariwal, H. Mi, B. Karlak, R. Daverman, K.
Diemer, A. Muruganujan, A. Narechania, Genome Res. 13 (2003) 2129–2141.[122] T. Söker, C. Dalke, O. Puk, T. Floss, L. Becker, I. Bolle, J. Favor, W. Hans, S.M.
Hölter, M. Horsch, M. Kallnik, E. Kling, C. Mörth, A. Schrewe, C. Stigloher, S.Topp, V. Gailus-Durner, B. Naton, J. Beckers, H. Fuchs, B. Ivandic, T. Klopstock,H. Schulz, E. Wolf, W. Wurst, L. Bally-Cuif, M. Hrabé de Angelis, J. Graw, BMCDev. Biol. 8 (2008) 118.
[123] S.M. Hölter, C. Dalke, M. Kallnik, L. Becker, M. Horsch, A. Schrewe, J. Favor, T.Klopstock, J. Beckers, B. Ivandic, V. Gailus-Durner, H. Fuchs, M. Hrabé deAngelis, J. Graw, W. Wurst, Front Biosci. 13 (2008) 5810–5823.
[124] K. Ganguly, J. Favor, A. Neuhauser-Klaus, R. Sandulache, O. Puk, J. Beckers, M.Horsch, S. Schädler, D. Vogt Weisenhorn, W. Wurst, J. Graw, Invest.Ophthalmol. Vis. Sci. 49 (2008) 1533–1541.
[125] C. Machka, M. Kersten, M. Zobawa, A. Harder, M. Horsch, T. Halder, F. Lottspeich,M. Hrabé de Angelis, J. Beckers, Gene Expr. Patterns 6 (2005) 94–101.
[126] A.D. Greenwood, M. Horsch, A. Stengel, I. Vorberg, G. Lutzny, E. Maas, S.Schädler, V. Erfle, J. Beckers, H. Schatzl, C. Leib-Mösch, J. Mol. Biol. 349 (2005)487–500.
[127] M. Horsch, C.V. Recktenwald, S. Schädler, M. Hrabé de Angelis, B. Seliger, J.Beckers, Br. J. Cancer 100 (2009) 656–662.
[128] F.C. Yin, H.A. Spurgeon, K. Rakusan, M.L. Weisfeldt, E.G. Lakatta, Am. J. Physiol.243 (1982) H941–H947.
[129] K.D. Sorensen, S. Kunder, L. Quintanilla-Martinez, J. Sorensen, J. Schmidt, F.S.Pedersen, Virology 362 (2007) 179–191.
[130] J. Favor, C.J. Gloeckner, D. Janik, M. Klempt, A. Neuhäuser-Klaus, W. Pretsch,W. Schmahl, L. Quintanilla-Fend, Genetics 175 (2007) 725–736.
[131] I. Wilson, M. Gamble, in: J.D. Bancroft, M. Gamble (Eds.), Theory and Practiceof Histological Techniques 5th ed., Churchill Livingstone, Edinburgh, London,New York, Oxford, Philadelphia, St. Louis, Sydney, Toronto, 2000.
[132] B. Galeano, R. Klootwijk, I. Manoli, M. Sun, C. Ciccone, D. Darvish, M.F. Starost,P.M. Zerfas, V.J. Hoffmann, S. Hoogstraten-Miller, D.M. Krasnewich, W.A.Gahl, M. Huizing, J. Clin. Invest. 117 (2007) 1585–1594.
[133] B. Qiao, J. Wu, Y.W. Chu, Y. Wang, D.P. Wang, H.S. Wu, S.D. Xiong,Rheumatology 44 (2005) 1108–1114.
[134] J.W. Stirling, M. Coleman, A. Thomas, A.E. Woods, J. Cell Pathol. 4 (1999) 223–243.
[135] S. Kunder, J. Calzada-Wack, G. Hölzlwimmer, J. Müller, C. Kloss, W. Howat, J.Schmidt, H. Höfler, M. Warren, L. Quintanilla-Martinez, Toxicol. Pathol. 35(2007) 366–375.
[136] M. Kremer, L. Quintanilla-Martinez, J. Nährig, C. von Schilling, F. Fend,Virchows Arch. 447 (2005) 920–937.
[137] Y. Otha, K. Ichimura, Ann. Otol. Rhinol. Laryngol. 109 (2000) 1046–1048.[138] D. Vyas, C.M. Robertson, P.E. Stromberg, J.R. Martin, W.M. Dunne, C.W.
Houchen, T.A. Barrett, A. Ayala, M. Perl, T.G. Buchman, C.M. Coopersmith,Histopathology 22 (2007) 623–630.
[139] S.E. Skalicky, K. Ow, M. Hannan, P.J. Russell, P.J. Crowe, J.L. Yang, AnticancerRes. 27 (2007) 973–978.
[140] S.S. Potter, H.A. Hartman, K.M. Kwan, R.R. Behringer, L.T. Patterson, Genesis45 (2007) 432–439.
Related Documents


![Zimmermann Et Al (P Reeh) 2009 Phenotyping Sensory Nerve Endings in Vitro in the Mouse Protocol]](https://static.cupdf.com/doc/110x72/55720ccd497959fc0b8c4c00/zimmermann-et-al-p-reeh-2009-phenotyping-sensory-nerve-endings-in-vitro-in-the-mouse-protocol.jpg)