Mott Community College Board of Trustees January 26, 2009 BUDGET WORKSHOP

Mott Community College Board of Trustees January 26, 2009 BUDGET WORKSHOP.
Dec 16, 2015
Welcome message from author
This document is posted to help you gain knowledge. Please leave a comment to let me know what you think about it! Share it to your friends and learn new things together.
Transcript

Mott Community CollegeBoard of Trustees
January 26, 2009
BUDGET WORKSHOP
2
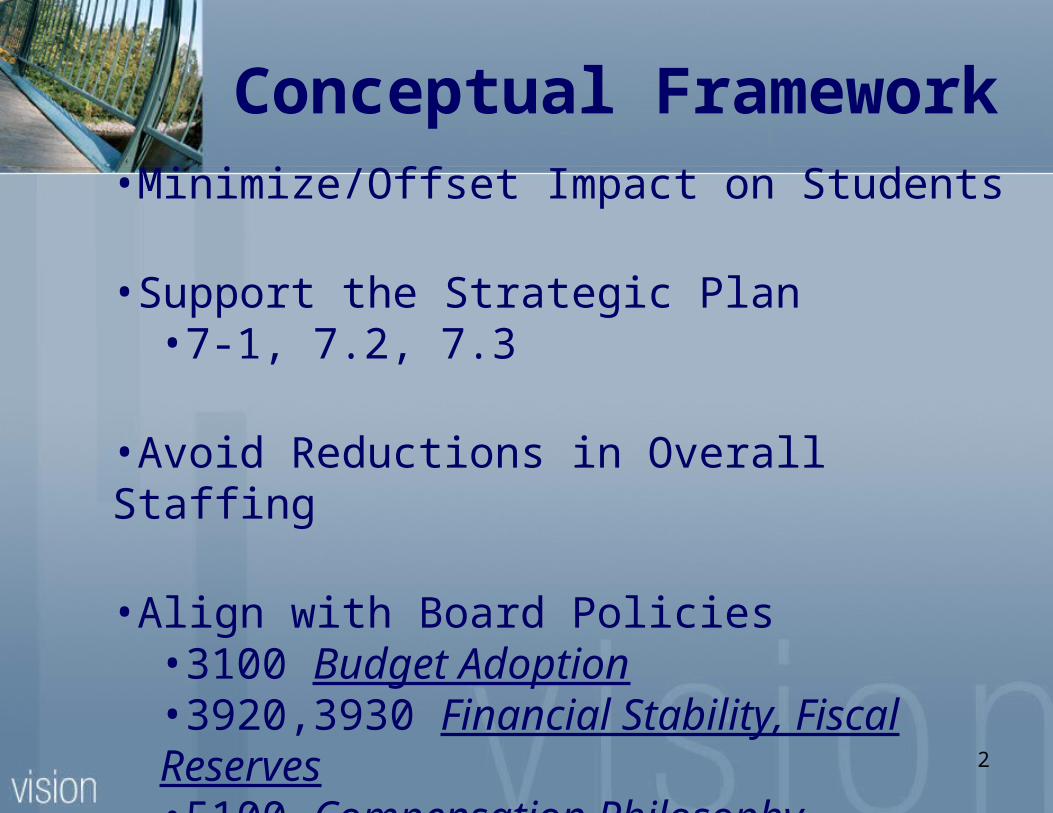
Conceptual Framework
•Minimize/Offset Impact on Students
•Support the Strategic Plan•7-1, 7.2, 7.3
•Avoid Reductions in Overall Staffing
•Align with Board Policies•3100 Budget Adoption•3920,3930 Financial Stability, Fiscal Reserves•5100 Compensation Philosophy

3
7-YEAR FORECAST

4
MCC Major Revenue Trends
Tuition, Property Taxes, State Aid
$10,000,000
$12,500,000
$15,000,000
$17,500,000
$20,000,000
$22,500,000
$25,000,000
$27,500,000
$30,000,000
Tuition and Fees Property Taxes State Appropriations

5
State Aid vs. Student FTE
$12,000,000
$12,500,000
$13,000,000
$13,500,000
$14,000,000
$14,500,000
$15,000,000
$15,500,000
$16,000,000
$16,500,000
$17,000,000
4500
5000
5500
6000
6500
State Appropriations Student FTE

6Note: the forecast illustrates pro forma data if current trends were to continue. The college is obligated to balance its budget each year and will take necessary steps to do so.
Initial Proposed Forecasts:>>>>>>>>>>>>>>>>>>>>>>>>>
Budget Budget
07-08 07-08 08-09 09-10 10-11 11-12 12-13 13-14Revenues
Tuition and Fees 24.5 25.4 25.9 26.5 27.1 28.2 29.3 30.5
Property Taxes 24.0 24.5 25.5 26.4 27.4 28.2 28.9 29.5 State Appropriations 14.6 16.2 15.2 15.5 15.7 15.9 16.2 16.4 All Others 4.3 4.4 4.4 4.5 4.6 4.7 4.8 4.9
Total Revenue: 67.4 70.5 71.0 72.9 74.8 77.0 79.2 81.3
Revenue Increases:>>> 4.6% .07% 2.7% 2.7% 3.0% 2.8% 2.6%
Expenditures
Salaries 37.0 36.3 37.1 38.6 39.6 40.6 41.6 42.7 Fringe Benefits 14.6 14.5 15.2 16.2 17.2 18.1 19.1 20.1
All Others 15.6 19.5 18.3 19.0 19.7 20.6 21.6 22.5
Total Expend.: 67.2 70.3 70.6 73.8 76.5 79.3 82.3 85.3
Expend. Increases:>>> 4.6% 4.8% 4.7% 3.7% 3.7% 3.7% 3.7%
Surplus/(Deficit): 0.2 0.2 .4 (1.0) (1.7) (2.3) (3.1) (4.1)
Fund Balance - End: 6.5 6.5 6.9 5.9 4.2 1.9 (1.2) (5.2)
7-YEAR OPERATING FORECAST (in millions), as of December 2007

7
Property Tax Revenue Comparison
$20,000,000
$25,000,000
$30,000,000
$35,000,000
7 - Year Forecast Historical Average Trend $35.4 million cumulative effect
8
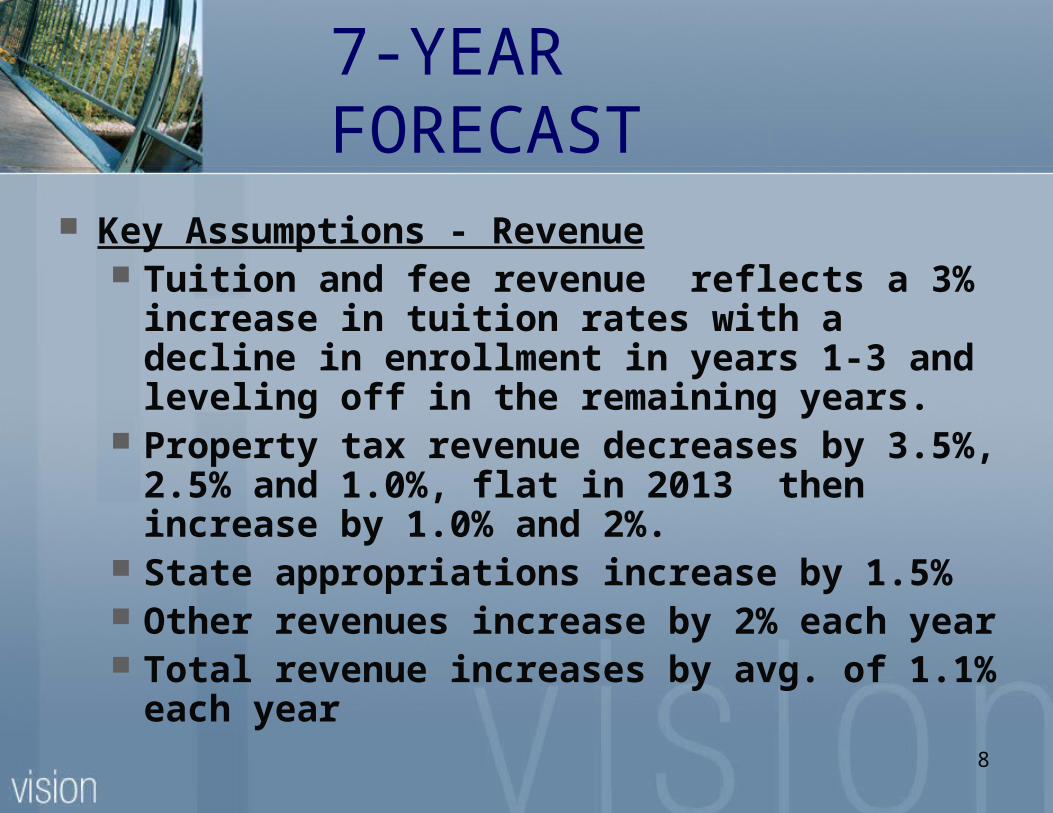
Key Assumptions - Revenue Tuition and fee revenue reflects a 3%
increase in tuition rates with a decline in enrollment in years 1-3 and leveling off in the remaining years.
Property tax revenue decreases by 3.5%, 2.5% and 1.0%, flat in 2013 then increase by 1.0% and 2%.
State appropriations increase by 1.5% Other revenues increase by 2% each
year Total revenue increases by avg. of 1.1%
each year
7-YEAR FORECAST

9
Key Assumptions - Expenses Salaries and wages increase by avg. of
2.5% each year Fringe benefits increase by avg. of 5.5%
each year Utilities and Insurance increase by 8.5%
each year Other expenses increase by avg. of 2.2%
each year Total expenses increase by avg. of 3.1%
each year
7-YEAR FORECAST

10
Summary Projected General Fund Deficit would be $35
Million at end of FY14-15, if current trends continued (Revenue growth of 1.1% vs. expenditure growth of 3.1%)
Continued focus on reserve funding and maintaining flexibility continues to be key
Long-term strategy of managing compensation costs continues as it represents the largest portion of our budget
7-YEAR FORECAST

11
7–YEAR OPERATING FORECAST (in millions) as of December 2008
Forecasts:>>>>>>>>>>>>>>>>>>>>>>>>>>>>>>>>>Initial
Budget 08-09
Amended Budget 08-09 09-10 10-11 11-12 12-13 13-14 14-15
RevenuesTuition and Fees 26.4 27.6 26.7 27.0 27.8 28.7 29.5 30.4
Property Taxes 24.4 24.4 23.6 23.0 22.8 22.3 23.0 23.4
State Appropriations 15.2 15.2 15.4 15.6 15.9 16.1 16.3 16.6
All Others 4.3 4 4.3 4.5 4.5 4.6 4.7 4.8Total Revenue: 70.3 71.2 70.0 70.1 71.0 72.1 73.6 75.2
Revenue Increases:>>> 1.2% -0.4% 0.0% 1.3% 1.6% 2.0% 2.3%
ExpendituresSalaries 36.8 36.7 37.7 38.7 39.6 40.6 41.6 42.7
Fringe Benefits 14.8 14.8 15.6 16.5 17.4 18.4 19.4 20.4
All Others 18.5 19.5 19.2 19.7 20.4 21.1 21.8 22.6Total Expend.: 70.1 71.0 72.5 74.9 77.4 80.1 82.8 85.7
Expend. Increases:>>> 1.2% 3.3% 3.4% 3.4% 3.4% 3.4% 3.5%Surplus/(Deficit): 0.2 0.2 (2.4) (4.8) (6.5) (8.0) (9.3) (10.5)
Fund Balance - End: 6.8 6.8 4.0 (0.8) (7.2) (15.2) (24.5) (34.9)
Note: the forecast illustrates proforma data if current trends were to continue. The College isobligated to balance its budget each year and will take neccesary steps to do so.

12
FUTURE OUTLOOK: Key Issues
1. State Aid revenue – barely keeping with inflationary rates. Latest state revenue consensus estimates $950 million budget shortfall in 2009 and 2010
2. Tuition and fee revenue – have enjoyed increases over the past 5 years - we can not reasonably expect the same level of increases to continue
3. MPSERS Retirement Rate – Current rate is 16.54% tied significantly to stock market fluctuations – we anticipate an above inflationary increase.
4. Property tax revenues - expected to decrease significantly over the next 2-3 years.
5. Reserve Funding – increased emphasis in light of above economic factors
6. 2007-2012 Strategic Planning through AQIP requires continuous improvement methods

13
08-09 AMENDED BUDGET:General Fund
14
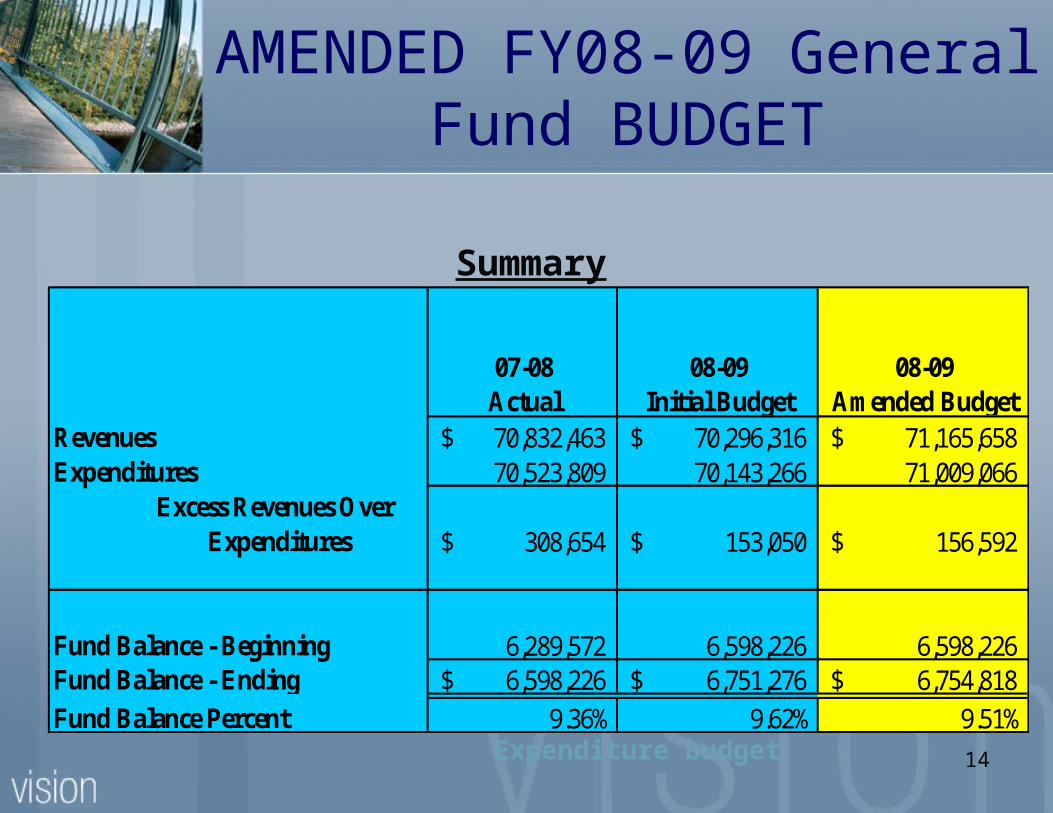
AMENDED FY08-09 General Fund BUDGET
Summary
Target = 5% - 10% of Expenditure budget
07-08 Actual
08-09 Initial Budget
08-09 Amended Budget
Revenues 70,832,463$ 70,296,316$ 71,165,658$ Expenditures 70,523,809 70,143,266 71,009,066
Excess Revenues OverExpenditures 308,654$ 153,050$ 156,592$
Fund Balance - Beginning 6,289,572 6,598,226 6,598,226 Fund Balance - Ending 6,598,226$ 6,751,276$ 6,754,818$
Fund Balance Percent 9.36% 9.62% 9.51%

15
AMENDED 08-09 General Fund BUDGET
REVENUES:
•Tuition & Fees +$1.1 million, +4.3% adj. –credit-side enrollment up for Winter 2009 and Fall 2008
•Property Taxes no significant change
•State Aid no significant change
•Other Revenue -$278 thousand, mainly due to reduction in investment earnings
=Overall upward amendment to revenue is $869 thousand, +1.24% change

16
AMENDED FY08-09 General Fund BUDGET
EXPENDITURES and TRANSFERS:
• Amended upward by $865 thousand, +1.23% change:
•Contracted Services $359 thousand – Mainly due to increase in contracted services for expanded workforce development activities.
•Transfers $600 thousand – funding to 72 Maintenance and Replacement Reserve in line with Board Policy requirements, continued additional funding in reserves to stabilize long-term projected deficit in accordance with Strategic Planning and Balanced Approach in budgeting

17
AMENDED FY08-09 General Fund BUDGET
NET RESULTS OF AMENDMENT:
FUND BALANCE : No significant change, $3K better than June Initial Budget
6/30/09 projected to end with $156K surplus, for total of $6.8 million

18
ONGOING BUDGETIMPLICATIONS

19
Budget Constraints
a) Four employee groups contracts unsettled
b) MPSERS rate expected to increase above inflationary levels
c) State Aid for 2008-09, 2.9% increase-possible mid-year cuts
d) Decrease in property tax values (TV)
-State Equalized Value (SEV) vs. Taxable Value (TV)
a) Enrollment trend also flattening

20
Minimum Reserves as Required By Board Policy #3930
General Operating (01) ReserveRequired 5-10% of annual operating expenses08-09 Amended Budget shows reserve of 9.5%
Maintenance & Replacement Fund (72)Required 1-3% of College depreciated assets or $3M$600K transfer made in current Amended Budget $1.875M total reserve after 600K transferAdditional amount needed to meet minimum $1.125M

21
Rainy Day (02) Budget Stabilization Required 1% of annual operating expenses 08-09 Budget reflects $900 thousand Meets minimum funding requirements
Building & Site Fund (78) Required 1-3% of College depreciated assets 08-09 Budget reflects $4.5M Meets minimum funding requirements after
estimated set-aside for contract settlement contingencies
Minimum Reserves as Required By Board Policy #3930

22
Operating Reserves
General Fund Reserve $6.8 millionRainy Day Reserve (Board Designated) .9 million
Total Operating Reserves $7.7 million
Or approximately 6 weeks of operating needs
Likely possibilities on the horizon MPSERS rate increases by 1.5% $ ( .8) million Lost GM Voucher Revenues (1/2 of total) $ ( .5) million Salary increases from contract settlements $(1.0) million
Total reduction in reserves $(2.3) millionNet reserves become $5.4 million or 4 weeks of operating needs

PHYSICAL PLANT and
CAPITAL FUNDING

24
Link to Mission and Strategic Plans
MCC’s mission statement directs the college to…
“maintain its campuses, state-of-the-art equipment, and other physical resources that support quality higher education. The college will provide the appropriate services, programs, and facilities to help students reach their maximum potential.”

25
Comprehensive Planning Process
Five-Year Campus Master Plans – Submitted Annually to State DMB
Independent Facilities Assessments –Identification of Building Deficiencies and Backlog of Deferred Maintenance Projects
Technology Plans – Life-Cycle Replacement and Upgrade Needs
Enrollment Trends, Strategic and Curricular Plans and Priorities
Input from Management Team, Faculty, Staff, Community

26
Capital Funding
Funding Sources : $45 M Voted Bond Authority Passed June 2004 -$15 M Series 2004 was spent from 2004-2006 -$15 M Series 2006 was spent by April 2008 -$15 M Series 2008 to be spent by April 2011
+$13 M Commitment of Operating Funds +$ 7 M projected from Student Tech. Fees=$65 M Secured from now through 2011$4 M approved from State Capital Outlay
Future needs will require ongoing deferral and continued requests for voted bond authority and state capital outlay assistance

27
Debt Portion of Property Taxes
MCC levied the same rate—0.50 of a mill—for many years, through the 2000 tax year.
The rate was increased to 0.85 in 2001, and has decreased to 0.69 since then.
MCC has committed no increase to the taxpayers
2001 0.85
2002 0.82
2003 0.75
2004 0.69
2005 0.69
2006 0.69
2007 0.69
2008 0.69
Tax Year Debt Levy

MCC Board of Trustees Board Workshop January 26, 2009
Larry Gawthrop, Interim Chief Financial Officer
810-762-0525, [email protected]
Questions or Comments?For More Information:
Details are provided with Board Resolution 1.20
Related Documents