MOTIVATIONS TO TWEET: A USES AND GRATIFICATIONS PERSPECTIVE OF TWITTER USE DURING A NATURAL DISASTER by ELIZABETH MARIE MAXWELL J. SUZANNE HORSLEY, COMMITTEE CHAIR WILLIAM J. GONZENBACH ROSANNA E. GUADAGNO A THESIS Submitted in partial fulfillment of the requirements for the degree of Master of Arts in the Department of Advertising and Public Relations in the Graduate School of The University of Alabama TUSCALOOSA, ALABAMA 2012

Welcome message from author
This document is posted to help you gain knowledge. Please leave a comment to let me know what you think about it! Share it to your friends and learn new things together.
Transcript

MOTIVATIONS TO TWEET: A USES AND GRATIFICATIONS PERSPECTIVE
OF TWITTER USE DURING A NATURAL DISASTER
by
ELIZABETH MARIE MAXWELL
J. SUZANNE HORSLEY, COMMITTEE CHAIR WILLIAM J. GONZENBACH ROSANNA E. GUADAGNO
A THESIS
Submitted in partial fulfillment of the requirements for the degree of Master of Arts in the Department of Advertising and Public Relations
in the Graduate School of The University of Alabama
TUSCALOOSA, ALABAMA
2012

Copyright Elizabeth Marie Maxwell 2012 ALL RIGHTS RESERVED

ii
ABSTRACT
On April 27, 2011, Tuscaloosa, Alabama, was struck by an EF-4 tornado. This research
investigates how students at The University of Alabama used Twitter during the warning, impact
and recovery stages of the disaster. The warning stage refers to the time before the disaster. The
impact stage refers to the time during the disaster, and the recovery stage refers to the time after
the disaster. Specifically, this research studies four motivations to use Twitter— social,
entertainment, status seeking, and information. Each category was studied to understand when
people who were motivated by the need to socialize, to entertain, to gain status or to gather
information were actively tweeting in connection with the tornado. By using a mixed design
ANOVA, the researcher found that students were tweeting significantly more during the
recovery stage, which included Twitter use, during the weeks after the tornado. The researcher
was interested in knowing which motivation produced the most Twitter use. The social,
entertainment, and information motivations produced roughly the same amount of Twitter use.
The status motivation did not produce as much Twitter use during the natural disaster. The
results suggest that those motivated by social, entertainment or information needs tweet more
during the impact and recovery stage. The most Twitter use occurs in the weeks after the disaster
during the recovery stage.
iii
LIST OF ABBREVIATIONS AND SYMBOLS
M Mean: the sum of a set of measurements divided by the number of
measurements in the set
p Probability associated with the occurrence under the null hypothesis of a
value as extreme as or more extreme than the observed value
Wilks’ λ Wilks’ Lambda probability distribution
F(x, y) F with x and y degrees of freedom
n Number of cases in subsample
r Pearson product-moment correlation
CI Confidence Interval
Grp. Group

iv
ACKNOWLEDGMENTS
I am happy to have this opportunity to thank the many individuals that helped me form
this thesis. This journey would have never been completed without the help of my committee,
the Advertising and Public Relations faculty, friends and family. Many thanks go to my
committee. Thank you Dr. Gonzenbach and Dr. Guadagno for always having an office door open
and giving help when it was asked. Most importantly, I want to thank Dr. Horsley for being my
committee chair. Thank you for your invaluable insight and constant encouragement. Without
your direction, I probably would still be working on my proposal. I would like to take this
opportunity to also thank The University of Alabama's Advertising and Public Relations
Department. Throughout my time at the University they have inspired me to be involved and
grow as a person. I would have never attempted graduate school or my thesis without their
support. I would like to especially thank Mrs. Jade Abernathy and Mrs. Cheryl Parker. Thank
you for hiring me so many years ago. Without that opportunity, I don't think I would be where I
am today.
Finally, I want to extend my sincerest thanks to my family and friends. Thank you for
your support and listening ears. I would also like to thank you for keeping me on track and
always holding me accountable for my work ethic. I hope you enjoy your much deserved break
from listening to me obsess about Twitter and/or natural disasters.
This adventure would never been completed without all of your prayers, guidance,
support, and encouragement. I am indebted to you all. Thank you.

v
CONTENTS
ABSTRACT ..........................................................................................................................ii
LIST OF ABBREVIATIONS AND SYMBOLS .................................................................iii
ACKNOWLEDGMENTS ....................................................................................................iv
LIST OF TABLES ................................................................................................................vi
1. INTRODUCTION ............................................................................................................1
2. LITERATURE REVIEW .................................................................................................5
3. THEORY ..........................................................................................................................18
4. METHOD .........................................................................................................................27
5. RESULTS .........................................................................................................................32
6. DISCUSSION ...................................................................................................................50
REFERENCES .....................................................................................................................57
APPENDIX A........................................................................................................................61
APPENDIX B ........................................................................................................................74

vi
LISTS OF TABLES
1. Correlations of Information Motivations Variables ..........................................................35
2. Pairwise Comparison of Simple Effects for Social Motivation Categories ......................38
3. Pairwise Comparison of Social Motivation Simple Effects for Time ..............................39
4. Pairwise Comparison of Motivation Group and Time ......................................................40
5. Social Motivation Groups' Mean Scores over Three Stages .............................................41
6. Pairwise Comparison of Simple Effects for Entertainment Motivation Categories .........42
7. Pairwise Comparison of Entertainment Motivation Simple Effects for Time ..................42
8. Pairwise Comparison of Motivation Group and Time ......................................................43
9. Entertainment Motivation Groups' Mean Scores over Three Stages ................................44
10. Pairwise Comparison of Simple Effects for Information Motivation Categories ...........45
11. Pairwise Comparison of Information Motivation Simple Effects for Time ...................46
12. Pairwise Comparison of Motivation Group and Time ....................................................47
13. Information Motivation Groups' Mean Scores over Three Stages .................................47
14. Social Motivated Users Mean Score ...............................................................................48
15. Entertainment Motivated Users Mean Score ..................................................................49
16. Information Motivated Users Mean Score ......................................................................49

1
Introduction
The mundane task of calling home became impossible for many college students on the
night of April 27, 2011. Around 5:10 p.m. that day, Tuscaloosa, Alabama, was hit by an EF-4
tornado. The tornado was more than a mile wide and created a six-mile path of destruction. The
tornado resulted in 53 fatalities and more than 1,200 injured individuals (Morton, 2012).
According to Meredith Lynch, public relations coordinator for the City of Tuscaloosa's Incident
Command, the storm left 12% of the city in ruin (2011). City buildings were damaged, along
with 600 businesses and thousands of residential structures. On that April day, Tuscaloosa
became one of the most popular news stories both nationally and internationally. Tuscaloosa,
Alabama, is home to the thousands of students who attend the University of Alabama. The
destruction left many of the students and citizens of Tuscaloosa unable to use traditional forms of
communication to reach loved ones or find information about the recent storm. Cell phone
service was nonexistent for many during that time because the city communication towers were
destroyed by the fatal storm (Lynch, 2011). The only way many residents communicated their
safety to loved ones was through the use of their smart phones' Internet capability. Because of
this event, and others like it, the use of social networks during disastrous events has become an
emerging field of study. The April tornado provided the researcher a way to study social
networking and crisis communication during a natural disaster.
Previous research has identified three stages of a disaster known as the warning, impact
and recovery stages (Vieweg, Hughes, Starbird & Palen, 2010). Disaster communication is

2
unique during each stage. A combination of traditional media and nontraditional media is
normally used to help distribute information, but recently nontraditional methods are becoming
more useful during disasters. One nontraditional medium, backchannel communication, is made
up of the unofficial peer-to-peer communication that occurs through social networks, text
messaging, blogs, wikis and apps (Mersham, 2010). "Backchannel" refers to unofficial peer-to-
peer communication that is in contrast with the official or "formal" communications to the public.
Backchannel communication does not include the information sent out by emergency officials; it
comes from the individuals affected by the disaster. In a study about social media use during a
wildfire, residents and emergency workers were able to track the expansion and path of wildfires
because social media gave the public an outlet to voice what they were experiencing (Vieweg,
Palen, Liu, Hughes & Sutton, 2008). Similarly, social networks were a prominent backchannel
medium that was used in Tuscaloosa on April 27, 2011. Because it was one of the few forms of
communication that residents were able to use, the use of social networks will be the focus of
this thesis.
Although people use backchannels to publicize important but unofficial information,
individuals exchange information for different reasons. Some look to give assistance where it is
needed. Others might just be curious about the events or try to use them for their own capital
gain. By studying the social media activity after the 2007 Virginia Tech shootings, researchers
were able to explain that not all social media users have the same motivations during a disaster
(Hughes, Palen, Sutton, Liu & Vieweg, 2008). This thesis will explore the needs for using social
media during the 2011 tornado as well as help explain social media use at different stages of the
disaster.

3
The uses and gratifications theory developed by Elihu Katz provides the foundation for
the thesis research. This theory focuses on the actions of the audience in regards to its media use
(Severin & Tankard, 2001). During a disaster, the actions of the public shape the resolution to
the problem. If a person has the opportunity to inform other individuals of a hazardous situation,
they can save lives and property from damage. But from Hughes' (2008) research, it is known
that not all people act in proactive ways during a disaster. To help capitalize on individuals' help
seeking and minimize the influence of exploiters, this research attempts to understand the
motivations of individuals during all phases of a disaster.
Because of its growing popularity among young adults and its real time nature, Twitter
was the social network chosen for this research. Twitter is a social networking site that allows
users to produce 140 character bursts of information that are called tweets ("About Twitter,
2012"). Twitter was developed in 2006 to be an outlet for individuals to say what they were
doing in the allotted amount of characters. Twitter gave users the ability to share moments of
their lives as they were happening (Williams, 2009). The advantage of being able to send updates
in real time led Twitter to be a source of valuable information during natural disasters. Eight
percent of Internet users are Twitter users (Smith, 2010). The social networking site is popular
among young adults, which makes The University of Alabama student population appropriate
participants for this study. Because the motivations to use Twitter during a natural disaster have
not been studied in depth, this thesis focused on college students' motivations to use Twitter
during an actual disaster.
In this thesis, the use of Twitter on April 27, 2011, and the weeks after were examined
and studied through an online survey. The survey examined individual needs for using the social
networking site Twitter. The survey focused on University of Alabama students and their

4
motivations. Each stage of the disaster — warning, impact and recovery — was studied to help
inform communicators of the unique needs of each stage. Lastly, the research sought to better
understand the connections between social media use during a disaster and how it affects later
social media use.
The research adds valuable knowledge to the communication field. Results from this
study create a better understanding of how people use social media, specifically Twitter, during a
natural disaster. Unlike the current research that is available, this research focused on the use of
the social networking site Twitter. Twitter has more than 100 million active users, but has not
been as extensively studied as other social networks (Bosker, 2011). A better understanding of
Twitter use during a disaster can help improve disaster communication efforts among disaster
response organizations such as the Federal Emergency Management Agency (FEMA) and the
American Red Cross. To better understand the motivations for using Twitter during a disaster, it
is first important to understand disaster communication as a whole. In the next chapter, disaster
communication and social networks will be given an in-depth look and will provide a strong base
for this research to build upon.

5
Literature Review
Disaster Response
When a disaster occurs it is followed by a surge of communication. There is a necessity
for the public to be informed so they are able to keep themselves safe. The Centers for Disease
Control and Prevention (CDC) outlines five phases of a crisis communication life cycle. At each
phase – pre-crisis, initial, maintenance, resolution, and evaluation – communication is necessary
(Reynolds, 2002). The first phase, known as the pre-crisis phase, is the time when alert
messages should be tested, and the public should be made aware of how to prepare for a disaster.
The next phase is the initial phase. During this time, the public is informed of the impending risk
in the simplest form and given information about the course of action during the emergency. The
third phase is known as the maintenance phase. This phase is when misinformation is corrected,
feedback is gathered, and the public more accurately understands the crisis. Next is the resolution
phase. This is when current alerts are improved. This creates a smoother process if the
emergency should occur again. The last phase is the evaluation phase. At this time, a frank look
is taken at the communication plan that was set up for the disaster. Lessons are learned and
documented so that mistakes will not happen in the future. There is no set time for how long
each phase should last. All the phases depend upon the emergency that has occurred (Reynolds,
2002). To simplify the phases, disaster communication can be boiled down to three stages known
as warning, impact and recovery. The warning stage includes the pre-crisis phase. The impact
stage is a combination of the initial and maintenance phase. The recovery stage is made up of the

6
resolution and evaluation phase. Disaster communication covers all stages of a disaster
including the warning, impact and recovery stages (Vieweg, Hughes, Starbird & Palen, 2010).
During a disaster, information can be communicated through traditional media as well as
online media. On-site and online communication becomes more intertwined during times of
disasters (Veil, Buehner & Palenchar, 2011). During a crisis or disaster, a variety of messages
need to be communicated to different individuals. There are many reasons individuals converge
around disaster events looking for information (Hughes, Palen, Sutton, Liu & Vieweg, 2008).
Many are contacting loved ones to let them know they are safe. Others are looking for more
information about the disaster. Some look to help and offer relief.
Research by Hughes, Palen, Sutton, Liu, & Vieweg (2008) pointed to seven roles of
individuals who converge around a disaster. These individuals could be helpers, anxious
individuals, returnees, supporters, mourners, curious onlookers, or exploiters. The differing
communication gives an indication of individuals' motivations during a disaster. The research
indicates how individuals are different in their information pursuits, yet they all are looking for
information about one event. The research mentioned above examined two disasters: the
September 11, 2001, attack on the World Trade Centers and the April 16, 2007, Virginia Tech
shootings. These disasters offered researchers an opportunity to learn why individuals come
together in an emergency. The types of individuals and their information preference help
communicators decide what information is necessary for the public's safety and how the
information should be disseminated. For this research, these roles help the researcher better
understand the motivations for engaging in emergency communication.
The first type of individual is the helper. This person likes to help first responders and
victims. These individuals are spreading information about the event often before official reports

7
are produced. Online helpers report personal and property safety. During the Virginia Tech
shooting, students at the university made Facebook groups that created a central site where
family members could find out if their loved ones were safe (Hughes et al., 2008). The speed of
the Internet aids helpers because it helps disaster communication occur in a shorter amount of
time. Some social networking sites provide real time information on disasters. This information
informs helpers on what tasks they could do to help with relief work in the immediate future
(Nguyen, 2011).
The second type of audience for disaster communication is the people looking for loved
ones: the anxious ones. They are not directly affected by the disaster but are worried about the
safety of loves ones who have been hit by the disaster. The anxious individuals are on the outside
of the disaster looking in. This type can be satisfied with both active and passive forms of
communication. During the Virginia Tech shootings, students were using email, instant
messaging, and Facebook groups as a way to let everyone know they were safe (Hughes, Palen,
Sutton, Liu & Vieweg, 2008). The act of joining a Facebook group was enough to pacify worried
friends and families. By simply joining the group, their families, who are a part of the anxious
group, were able to deduce that their students were alive and safe.
Individuals who have left the area prior to the disaster and are looking to return make up
the group known as returners. Online sites and applications are aiding these individuals by giving
them information they normally would not receive until they get on-site. During Hurricane
Katrina, Google Maps provided aerial and satellite images that allowed many to see the state of
their own homes and neighborhoods (Hughes, Palen, Sutton, Liu & Vieweg, 2008). This allowed
returners to know the status of their property before they went back to their homes.

8
During a disaster, there are individuals who are not directly affected, but still want to
show their support. Supporters are involved with disaster communication by showing gratitude
toward disaster responders and giving support to the individuals affected by the disaster. These
individuals can communicate by using social media such as groups on Facebook or creating
hashtags for Twitter. When they spread their support they are also spreading news and
information about the disaster. After the Virginia Tech shooting, Facebook groups were created
that showed support for the community. These groups had titles such as Praying for Virginia
Tech, Supporting Virginia Tech, and Protect the dignity of the Virginia Tech victims! (Hughes,
Palen, Sutton, Liu & Vieweg, 2008). By joining these groups, the members communicated their
support.
Disaster communication also involves mourners. People come together on social
networking sites to mourn the ones lost and the damage that has been done. Mourners are the
ones who hold vigils and memorials at the site of the disaster. Mourners can also come together
virtually to remember the disaster. After the Virginia Tech shootings, one user of a social forum
known as Second Life created a virtual graveyard that replicated the real life memorial (Hughes,
Palen, Sutton, Liu & Vieweg, 2008). Other users could create flowers, candles, poetry, and other
items to place at the gravestones that contained the victims’ names and short biographies about
them. These vigils, both virtual and physical, give all mourners, no matter where their location,
an outlet to pay their respects.
The last two types of individuals that will converge onto disaster sites are exploiters and
curious onlookers. Both of these groups have no initial connection with the disaster and add
nothing productive to the communication surrounding the events. Exploiters use the disaster for
personal gain (Hughes, Palen, Sutton, Liu & Vieweg, 2008). These individuals might set up fake

9
relief funds and solicit mourners, helpers, and supporters to give to their falsified organizations.
By utilizing the attention surrounding the disaster, exploiters collect funds from the generous
public. Curious onlookers still have no connection to the disaster but their intentions are
benevolent in comparison with exploiters. The onlookers will converge onto a physical and
virtual disaster site to satisfy their curiosity. Although the intrigued people can get in the way of
clean up or upset those who have been affected, they neither receive nor look for personal gain.
It is only natural that disaster breeds curiosity (Hughes, Palen, Sutton, Liu & Vieweg, 2008).
These individuals are looking to learn more about the disaster from a first responder point of
view. By using the Internet and social networking sites, the onlookers can get a better
understanding of the disaster from pictures and reading eyewitness accounts. The abundant
content on the Internet after a disaster helps keep these individuals from the actual disaster site.
The researchers Hughes, Palen, Sutton, Liu, and Vieweg (2008) created a better image of
the individuals who make up a disaster's communication audience. These individuals are the
ones who look to both traditional and nontraditional media to find information about the disaster
and how they can help. The varied audience explains that different people involve themselves
with disaster communication for various reasons. This research expands upon the types explored
above by examining use of a particular type of communication channel during a disaster.
Social media
Lately there has been a growing acceptance of using social networking sites (SNS) during
emergencies (Vieweg, Hughes, Starbird & Palen, 2010; Hoover, 2011; Yates & Paquette, 2011;
Mersham, 2010). Social media use is commonplace, and as such, it is becoming a leading source
for breaking news. According to an August 2011 research report by the Pew Research Center,
adoption of SNS had doubled in three years. Of adult Internet users, 65% use social networking
10
sites (Madden & Zickuhr, 2011). This is the first time that over half of adult Internet users
interact on social networking sites. Due to this growth, social media is the third most important
tool on the Internet for disaster preparedness and response ("Facebook DC live," 2011).
According to a recent survey conducted by the American Red Cross, 60% of the general
population receives disaster related news online. Of the general public, 23% receives news
information from Facebook (18%) and Twitter (5%) (Harman, 2011). Younger and college-
educated individuals are more likely to use social networking during these times (Smith, 2010).
Social networking sites are being repurposed to help in disaster relief. When traditional forms of
communication are down, other channels are there to be used (Harman, 2011). From the 2010
earthquake in Haiti, FEMA learned that all forms of communication are not lost during a disaster.
During the earthquake, survivors and rescue workers used text messaging, email and social
media to connect with others during the chaotic time (Hoover, 2011). Social media provides
communication outlets when other channels are unavailable (Silverman, 2010).
In the past, communication after a disaster was lacking timeliness. Social networks allow
the audience to be the content producers. This leads to social media providing information before
official information can be released. Although it is a common concern that false information can
easily be spread and negatively affect individuals, Mersham (2010) explained that the unofficial
reports from individuals using social media can be more accurate and beneficial than nonexistent
official reports. Mersham studied disaster communication during the 2009 tsunami threat in
New Zealand. During the threat of a tsunami, citizens utilized unofficial peer-to-peer
communication known as backchannel communications. This type of communication can occur
over a variety of media such as social networking sites, text messaging, blogs, wikis, and other
web forums (Mersham, 2010).

11
Social media is not exclusively used to find information. From its survey, the Red Cross
learned that individuals believe that social networks will work as a call for help. The Red Cross
survey was conducted by telephone and online to better understand the perceptions of social
media use during a disaster. In the study, the results from individuals who took the survey over
the phone reflected the general population. The survey was also disseminated via the Internet to
collect data from the online population. If they were to be unable to reach the EMS through
traditional media, 22% of the general population and 26% of the online population would try an
online channel to receive help. Nearly a quarter, 24%, of the general population would use SNS
to let their loved ones know they were safe. Of individuals who already use the online sites, 30%
would definitely use SNS to contact their loved ones. Those who use social media during a
disaster not only believe their voice will be heard, but they also believe action will occur. At
least one third of both the general and online populations believe not only that help will come but
that it will arrive within an hour of the message being posted. The public thinks it is important
for emergency response teams to actively use and monitor their online presences. Although the
general and online population believe that these online sites should be monitored, 65% of the
online population and 46% of the general population doubt that they are (Harman, 2011). The
Red Cross survey revealed that the public believes social media can be an active part in disaster
response.
Using social networking sites adds a human connection to communications about the
disaster. The new media adds visuals and interactivity to a topic (Veil, Buehner & Palenchar,
2011). In one study it was discovered that during an emergency, people affected by the event
would post to social media and provide information about the emergency including a detailed
location of the event (Palen et al., 2010). Sometimes these posts are accompanied by images of

12
the disaster. The images provide a first hand assessment that can be placed with other eyewitness
accounts to create a more complete view of the disaster. It is useful at all stages of an emergency
including warning, impact and recovery stages.
Social networking sites prove that they are beneficial by the number of people they reach.
By using social media, important information is sent directly to the people. The Boston Public
Health Clinic used social media as a way to reach its public during the H1N1 outbreak. The
clinic used its Twitter and Facebook accounts to provide supplemental information about the
outbreak. While official reports sent through traditional media listed the sites of vaccination
clinics, its Twitter account informed followers of when there was no wait at the clinic. This
encouraged followers to get vaccinated. Even though it was helpful, the use of social media has
not replaced Boston Public Health Clinic's traditional forms of media. Television is the medium
that most people turn to in an emergency, and social media is a supplement to that and other
traditional media (Tucker, 2011).
Because there has been an increase in acceptance of social media use during disasters,
organizations have included social media in their response plans. FEMA has learned that the
public reports better assessments of the current situation than many FEMA agencies could
(Hoover, 2011). FEMA administrator Craig Fugate explained that the public could be a resource
for FEMA and other emergency agencies because it is creating a better situational awareness.
Fugate stated that using social media is a great way to "free the data" (Hoover, 2011). FEMA is
working on adapting various social media platforms to spread news about emergency
preparedness and disaster relief (Hoover, 2011).

13
According to Nielsen research, the top social network that Americans use is Facebook,
closely followed by blogs, Tumblr, Twitter and LinkedIn ("State of the," 2011). Of adult Internet
users, 15% are using Twitter (Smith & Brenner, 2012). This social networking activity is popular
among young adults, minorities, and individuals who live in urban and suburban areas. Of young
adults between the ages of 18-24, 31% are Twitter users. Of Twitter users, one third of them
check the site daily or multiple times per day, but nearly half, 48%, check the site every few
weeks or less (Smith, 2010). Of the social networks listed, Twitter will be the primary focus of
this thesis.
Twitter is a microblogging website that allows users to create messages no longer than
140 characters. The short messages are referred to as Tweets. With this particular social
networking site, users can create tweets, reply to other tweets, send direct messages to
individuals, retweet other tweets, share pictures, share websites, and create hashtags to aid in
search for information. Twitter users follow individuals, organizations, and corporations from
whom they like to receive updates. Tweets can be received and sent through email, text
messaging, instant messaging, the Internet, and other third-party applications (Hughes & Palen,
2009). When users visit Twitter, they see multiple tweets that have been sent publicly by the
individuals, organizations, or corporations that they follow. Individuals initially used Twitter as
a platform to mention simple musings to a group of peers (Williams, 2009). Due to Twitter's
real-time nature, the social networking site has been utilized for other reasons. Twitter is now
being used as an additional platform to address customer service, as a source for breaking news,
and as an aid for job searching, to name a few (Gannon, 2011).
14
Another emerging use for Twitter is the use of Twitter for good (Gannon, 2011). For
example, during the London riots in 2011, Twitter users were able to use the Twitter search
feature to locate where the riots were occurring. During this time, many people who were not
signed up with Twitter used the site as their main search engine. A constant stream of updates
helped keep many residents safe (Gannon, 2011). Alternately, mobile technology also helped in
the organization of these riots. The London riots were organized using Blackberry messaging.
This type of messaging is similar to an individual updating his or her Facebook status or tweeting
(Ladhani, 2011).
One in five Twitter users post personal updates at least once a day. News stories and
updates are also popular posts. Of all Twitter users, 55% share links to news stories (Smith,
2010). Even with a small percent of people on Twitter, Mark Jones, the global communities
editor at Reuters, stated that although the audience is not on Twitter, the news is ("The people
formerly," 2011). Twitter changes how news is gathered and spread. The news is no longer
gathered only by journalists. Readers and viewers are able to add to the information pool. This
gives rise to "horizontal media," referring to the public's ability to share links via Twitter and
other SNS, allowing for larger numbers of people to receive information without the involvement
of traditional media. People become their own broadcast network by sending tweets. Besides
sending unique tweets, Twitter also allows users to retweet information. Retweeting means a
person can send his or her followers a tweet that was originally posted by another user. Starbird
and Palen (2010) specify the act of retweeting as an informal way for one user to recommend
information to another user. A little over half (53%) of users retweet material (Smith, 2010). The
recommendation system that each individual user has developed to decide which information to

15
pass along is used for all tweets, pictures, videos, news articles, or even jokes. Retweeting lets
users pass on information they deem important.
During an emergency the majority of tweets that are retweeted originate from users who
were near the disaster. One study reported that 10% of all emergency-related tweets that are sent
by local individuals are retweets. Starbird and Palen (2010) indicated that although information
is being passed around on Twitter, the initial information comes from local media and
emergency management agencies. The information that is spread during an emergency on
Twitter is not all valued the same. The broader audience is made up of curious onlookers who
look for information in a voyeuristic manner, focusing on journalists’ accounts of the transpiring
events. They are retweeting sensational headlines, pictures and stories. The local audience is
using Twitter to distribute information that is important or helpful to them locally. Research that
studies retweeting behavior is another way to see how Twitter is a social medium that serves a
diverse group of users in an assortment of ways.
In Vieweg, Hughes, Starbird, and Palen's (2010) research, they compared tweets that
were sent during two different emergencies, the Red River Floods and the Oklahoma Grassfires
that both occurred in the spring of 2009. The information that users tweeted was similar but
varied depending on the type of emergency. Of tweets about the Oklahoma fires, 40% included
geolocation information, while only 18% of the tweets about the Red River floods contained the
same information (Vieweg, Hughes, Starbird & Palen, 2010). This suggests that Twitter allows
for very detailed and specific information to be disseminated to a specific audience. It also
allows for general information to reach a wider audience. Twitter's constant stream of real-time
information allows for communication during the warning, impact and recovery stages. Each
phase of the disaster saw tweets containing information that could be divided into two categories:

16
community-related information and personal information. Not all tweets about an emergency
will have the same message and objectives, but they will help add to the information pool.
Previous research shows that after a natural disaster, such as the one that affected
Tuscaloosa, there is an increase in Twitter adoption rates. Hughes and Palen (2009) discovered
that during hurricanes Gustav and Ike, as well as during the Republican and Democratic national
conventions, there was an increase of new active users to Twitter compared to a general sample
around the same time. The individuals that joined Twitter around the time of the events and
posted about the events were more likely to be active users in the future compared to the general
sample. This suggests that when individuals personally experience the usefulness of Twitter, they
are likely to adopt the technology and be long-term users. In their research, they discuss that
people can be "information hubs" that collect and distribute information and people can
"participate" in the information pool in a nonessential way (p. 6). Their study focused primarily
on the active users and their role as information hubs. This thesis further investigates the
motivations for using Twitter after a natural disaster and looks at all users of Twitter, not just
active users.
Previous research has looked at the motivations that result in using Facebook, but there is
little research addressing the motivations of using Twitter. During a disaster, helpers, anxious
individuals, returnees, supporters, mourners, curious onlookers, and exploiters have various
motivations for their communication. Social networking sites provide a platform for all their
voices. Of social networking sites, Twitter allows responders to give information in real time
that aids emergency communication unlike any other social network. This research expands upon
the knowledge of Twitter and its users' motivations.
17
As using social media during a disaster becomes more common, so too does its
popularity as a topic for communication research. This thesis focuses on the use of Twitter
during a natural disaster by utilizing the uses and gratifications theory to create a better
understanding of the motivations of disaster communication. This theory helps explain how
various motivations produce different actions among social media users during a natural disaster.
The next chapter describes the uses and gratifications theory and explores its fit for social media
research.

18
Theory
Most communication theories primarily focus on what the media portrays to the public.
Elihu Katz challenged researchers to, instead, think about how people contribute to the media.
With this simple question, Katz paved the way for the uses and gratification theory.
Many believed that communication research was dying. Katz (1959) breathed new life
into it by posing new questions. In his earliest article, discussing the new way to approach how
people and the media interact, he cites studies by Berelson (1949), Riley and Riley (1951), and
Herzog (1944). In Berelson's study, Berelson took advantage of a newspaper strike in
Philadelphia and watched how it affected people’s media use. In Riley and Riley's study, the
researchers studied how children use adventure stories when they are playing make believe. The
last study is Herzog's work with women who watched soap operas. Herzog was able to list
reasons why women were watching daily radio serials, programs we would now categorize as
soap operas. Herzog's 1944 article was the first published research that examined media
gratifications in-depth (Baran & Davis, 2003). From these studies, Katz was able to explain that
people use a variety of media for different reasons (Severin & Tankard, 2001).
Katz, Blumler, and Gurevitch (1974) initially outlined the objectives of the uses and
gratifications theory. First, the theory should explain how people use the media to reward their
own needs. Second, the theory should help researchers understand an audience member's media
behaviors. Finally, the theory should identify functions or consequences as a result of needs,
motives and behaviors. The theory focuses on the origin of needs and the expectation of a media
outlet to satisfy those needs.

19
As media usage has changed, Rosenberg (1974) and Katz and his collaborators (1974)
simplified the tenets of uses and gratifications. The initial tenets have been revised and are now
modeled in a contemporary view that is grounded in five assumptions. The first assumption is
that the choice of media is a conscious choice that an individual makes. They purposely choose a
medium with an objective to be achieved. The second is the assumption that the audience is
active. A person will select the medium because it will satisfy his or her need. The audience has
to believe there is a link between desire and the media reward (Severin & Tankard, 2001). The
third belief is that a user's previous media use shapes how he or she uses media in the future. The
assumption is that they will use the previous knowledge about a medium to choose one that will
result in gratification. The fourth assumption is that an audience is at the mercy of its own
psychological and social factors. The medium chosen will satisfy desires based on these factors.
This assumption also explains that other forms of media are competing to satisfy an individual.
The audience has to choose a medium that is competing with other sources to fulfill the desired
need (Severin & Tankard, 2001). The audience is able to choose the best qualifying media to
fulfill its desire. The fifth and last assumption is that people can be more influential than the
media. It is through a person's initiative that the patterns and consequences of media use are
decided (Bryant & Zillmann, 2002). The combination of these five basic assumptions creates the
base of the uses and gratifications theory.
The reason that individuals use different media has been studied at length. There are
several needs that users would like to satisfy. Some needs are universal, while others can be very
unique. McQuail, Blumler, and Brown (1972) suggest four categories of classification. The first
type of need that an individual may have is a diversion need. These individuals are looking for an
entertaining escape from their daily routine. The next type of need is a personal relationship

20
need. This need looks to media as a stand-in companion. The third type of classification is
personal identity. This need manifests itself as looking for self-understanding in media. The last
classification that the researchers describe is the surveillance category. This category represents
needs for individuals to find information, especially the information that might affect them
personally.
Although these are very representative, Katz, Gurevitch and Haas (1973) saw mass media
as a way to connect or disconnect with others. They created a list of five categories that classify
an individual's needs that lead them to using mass media. These categories are a simplification of
35 psychological traits that individuals possess. The first category is cognitive needs. Almost
everyone has a need at one point in his or her life to acquire new information. The individual
who is trying to act on a cognitive need is looking for some kind of understanding. The second
type of need is an affective need. This is the need to find an emotional and/or pleasurable
experience. The third type of need is the personal integrative need. This reflects the need many
individuals have to validate themselves. These people are interested in strengthening their
credibility, among others. The fourth type is the social integrative need. The social integrative
need explores the social connectivity need that individuals have. This is the need people have to
strengthen their contacts with family and friends. The last need is the tension release need. This
is most like McQuail, Blumler, and Brown’s (1972) diversion type. The tension release need is
the need that some individuals have to escape their own realities. They are welcoming diversions
into their life. The five categories give broad groupings of motivational factors (Severin &
Tankard, 2001). These five categories provide the media needs that are studied in this research.

21
Criticisms
Over the years, the uses and gratification theory has not been immune to criticism. Some
believe that the needs that are created only rationalize an individual’s media use instead of
producing a cause and effect relationship. The theory could be flawed because it doesn't account
for social status in relationship with media choice. The theory relies on psychological concepts.
For the uses and gratification theory to be a valid theory, researchers expect an individual to
develop a need and find an appropriate media to fulfill it by their own choosing. Often media
reflects the world-view, causing information to be skewed. Although the individual might be
choosing his or her own readings, he or she is actually consuming preferred reading. This
criticism will not affect this particular thesis, since in this thesis we will be focusing on one
incident. Instead of studying general media uses and gratifications, this study will focus on the
communication needs that surrounded the disaster. The research subjects for this study were
purposely looking for material that might otherwise be labeled as "preferred reading." Another
criticism states that media use could not be based on need and instead be a habitual pastime
(Severin & Tankard, 2001). Lee and Ma (2011), who will be discussed later in this chapter,
discovered that individuals who visited some social networking sites (SNS) habitually were
likely to visit the same sites to share news stories, despite what their actual need may be.
Uses and Gratifications in Research
Uses and gratifications theory is an appropriate theory to use when studying social media.
The two-way nature of social networking sites requires an audience to actively choose the
medium it wants as well as to decide how it will use that medium (Park, Kee & Valenzuela,
2009). Social media varies from traditional media because of the action it requires of the
audience. Instead of an individual simply reading a newspaper or watching a television program,

22
a user is now able to connect and interact with other people on social networking sites. The
individual has the ability to choose how involved he or she wants to be with the medium as well
as how it will best serve him or her. In this thesis, the researcher focused on the audience actions
and what needs they were fulfilling. The research focused on one SNS, Twitter. This theory can
help create an understanding of an audience's information needs and media use.
Facebook Features
Although the uses and gratifications theory has been used to study SNS, little research
has been done on one SNS channel to look at all the features and what needs motivate a user to
use one feature over another. Smock, Ellison, Lamp and Wohn's (2011) research studied the
motivations for using different features of the social networking site Facebook. Facebook is a
SNS that helps build bridges between online and offline communications. Many SNS have
multiple features like commenting on friends' posts, favoriting/liking posts, replying to friends'
posts, adding pictures, and sharing music or videos, to name a few. The SNS Facebook is seen as
a collection of tools that are used for different needs. Of the SNS features, the researchers
explored the uses and gratifications for status updates, comments, wall posts, private messages,
chat, and groups. The study goes beyond general usage and gives insight into nine motives for
using Facebook. These motives include habitual pastime, cool and new trend, entertainment,
information sharing, escapism, companionship, professional advancement, social interaction, and
meeting new people. These motivations are the basis for this thesis research.
The research questions by Smock, Ellison, Lamp and Wohn's (2011) assessed what
motivations result in the use of specific features. Results from the study showed significant
results for certain motivations linked to certain features. The expressive information sharing
motivation was significantly linked with the status update feature. The comment feature was

23
most used by Facebook users who were looking for entertainment, companionship and general
social interaction. General social interaction was also a predictor for writing on friends’ walls,
along with the need for professional advancement and using the social media feature as a
habitual pastime. Two significant predictors were discovered for using private messages. People
use private messages for professional advancement and social interaction. The last two features,
Facebook chat and Facebook groups, were significantly predicted by the motivation of social
interaction. Expressive information sharing joined the need for social interaction as a predictor
for using the Facebook groups’ feature. The study also found significant demographic difference
in the use of features. Age and race demographics will not be a focused part of this thesis
research.
Smock, Ellison, Lampe and Wohn (2011) questioned if the listed motivations were the
same for general use. They discovered that only three of the needs listed—relaxing entertainment,
expressive information sharing, and social interaction—predicted general Facebook use. This
research found that individuals choose their SNS and the specific features on it to fulfill their
specific needs. To follow this study's approach, this thesis research focused on the specific
motivations of using Twitter.
Facebook Groups
The uses and gratifications theory has been used to study how individuals might choose
specific features of social media. Park, Kee and Valenzuela (2009) studied how an individual’s
need might affect his or her use of Facebook groups. Specifically, the researchers were looking
at how Facebook groups are linked with political and civic engagement. This study identifies the
needs for using Facebook groups. Some argue that specific uses and gratifications on SNS may
produce different social outcomes. For example, one study discovered that information pursuits

24
lead to more social involvement than entertainment motivations. Just as needs produce various
results, the selected media offers varied rewards. The gratifications achieved by using online
groups could be vastly different than the gratifications received from another SNS or even other
features on the same SNS. Online groups, through their networks, have the ability to strengthen
social contacts, community engagement, and attachment. Through their research, Park, Kee, and
Valenzuela (2009) have compiled a list of four primary goals for participating in Facebook
groups: socializing, entertainment, self-status seeking, and information. These are no different
than the basic needs many media users attempt to fulfill.
By joining Facebook groups, members met these needs in different ways. The research
studied college students and how they used the groups. Individuals who used the group feature to
fulfill a socializing need commonly used groups to put together meetings and get peer support.
They were looking for a sense of community. To fulfill the entertainment gratification, students
used groups for amusement. They benefitted from the leisure and enjoyment the groups provided.
The individuals who had information motivations generally used the groups to learn about on
and off campus events. They also used the group function to learn about new products or
services. Finally, students were likely to use Facebook groups to maintain their personal and
social status. These individuals felt that joining groups would make them look cooler and help
develop their career (Park, Kee & Valenzuela, 2009).
There were also significant results found among the various individuals who were studied.
Park, Kee, and Valenzuela (2009) found significant results that increased the understanding of
why undergraduates use the group feature. The younger students were joining groups for
socializing. They were likely to engage in the groups for entertainment needs. They also joined
groups because they felt pressured by their friends. If they joined the groups, they were making

25
their social status increase among friends. The research explains that although groups are one
feature of the SNS Facebook, they offer different rewards. This research will not just look at the
needs that result in the general use of Twitter, but instead will examine the motivations of using a
myriad of Twitter features during a disaster.
Social Networks and News Sharing
Lee and Ma's (2011) research also addressed other predictors for sharing news stories on
SNS. Like prior research, they studied the following needs: information seeking, socializing,
entertainment, and status seeking. The information seeking, socializing and status seeking
gratifications were all significant predictors of users sharing news on social media sites. It seems
likely for information seekers to post news. Information seekers are likely to post news stories so
that the stories will be available for future retrieval when information is needed. Sharing content
meets both the needs of the individual as well as the individuals that are in the user's social
network. Socializers spread news stories in hopes that it will lead to potential social relationships.
The anticipation of such relationships is the motivating force to share a news story. Sharing news
stories on social media sites is also motivated by the status seeking need. The need to improve
one's status comes from the desire to increase credibility, self-esteem and self-confidence. By
sharing news over a social media site, an individual helps others gain access to information that
they may find relevant. Users hope that by sharing relevant stories they may earn a place as an
opinion leader among their friends.
The current study expanded upon the previous studies. The research creates a better
understanding of the general motivations to use Twitter. The uses and gratifications theory was
used to understand how individuals’ needs during the April 27, 2011, tornado were fulfilled
through Twitter. Evidence from previous research made clear that this theory is appropriate to

26
apply to this phenomenon. The next chapter will explain how the uses and gratifications theory
was used to test students’ participation in using Twitter during a natural disaster.

27
Methods
After consulting past research and extensive reading on various communication theories,
the researcher developed five research questions that were explored in the thesis research. By
exploring the following research questions, the base of knowledge about social networking
during a natural disaster was expanded. The research questions focused on Twitter use before,
during, and after the April 27, 2011, tornado that ripped through Tuscaloosa.
RQ1: At which stage were Twitter users motivated by the need for socialization most likely to
tweet?
RQ2: At which stage were Twitter users motivated by the need for entertainment most likely to
tweet?
RQ3: At which stage were Twitter users motivated by the status seeking need most likely to
tweet?
RQ4: At which stage were Twitter users motivated by the need for information most likely to
tweet?
RQ5: Which motivation produced the most Twitter use?
From the literature review, it is understood that crisis communication can be divided into
three stages — warning, impact, and recovery (Vieweg, Hughes, Starbird & Palen, 2010).
Twitter use during the three stages was studied in this research. The first stage is known as the
warning stage and includes the crisis communication used before a disaster. For this study,
communication during the warning stage was defined as all the communication that occurred the
week before the tornado hit until 5:10 p.m. on April 27, 2011. The next stage studied was the
28
impact stage. The impact stage was defined as all communication that occurred during the
tornado and immediately after. For this research, the impact stage reflects all social network use
from 5:10p.m. on April 27, 2011, until 72 hours later on April 30, 2011. The last stage of crisis
communication was the recovery stage. This study focuses on recovery communication that
occurred in the weeks after the tornado, from April 30, 2011, until May 14, 2011. During that
time, recovery communication was at its peak. The three stages of crisis communication are
appropriately represented in this study beginning the week before April 27, 2011, until the end of
May 2011.
For this study, information was collected through an online survey (see Appendix).
Survey research has advantages that led the researcher to choose the survey method for this study.
Using a survey reaches a large number of participants without incurring a large cost (Wimmer &
Dominick, 2010). The survey easily gathers information from a variety of individuals. The
survey measured Twitter use during the warning, impact and recovery stage of the April 27,
2011, tornado. The survey also measured a user's motivations for using Twitter. Smock, Ellison,
Lamp and Wohn (2011) outlined nine motives for using Facebook features. The motives they
studied are using Facebook as a habitual pastime and as a cool and new trend as well as for
entertainment, information sharing, escapism, companionship, professional advancement, social
interaction, and meeting new people. These specific motivations have not previously been
applied to Twitter use. Because Facebook and Twitter are similar social networking sites, the
researcher used the same motivations and applied them to Twitter.
The nine motives from Smock, Ellison, Lamp and Wohn's (2011) research were divided
into four categories that serve as the independent variables for this study. The first motivation
category is the social category. This motivational category measured how often an individual

29
uses Twitter for companionship, social interaction, and for meeting new people. The next
motivational category measured how much a person uses Twitter to increase his or her status.
The status seeking motivation was measured by asking questions pertaining to using Twitter for
professional advancement and as a way to keep up with the social network trend. The third
motivation that affects users was the need to find information and be informed. Survey questions
determined if the Twitter user was using the social networking site to stay informed about the
latest local, national, and international news. The last motivational category was the
entertainment motivation. This motivation includes users who are moved to use Twitter as a
habitual pastime, a form of entertainment, and as a way to escape everyday life. The four
motivational categories include all nine motivations from Smock, Ellison, Lampe and Wohn
(2011), but are applied to the understudied social network Twitter.
The study focused on University of Alabama students because they fit the demographics
of a prime Twitter user (Smith & Brenner, 2012). Students at The University of Alabama were in
close proximity to the tornado. Students were recruited to participate in the survey through The
University of Alabama's Institute of Communication and Information Research (ICIR). The
survey was placed in the ICIR study bank where students at The University of Alabama were
recruited to take the survey. Using the ICIR allowed teachers to offer credit for students who
participate in studies. The teachers directed his or her students to the research study bank. From
there, the students were able to choose this study's survey and participate in it. The researcher
also utilized snowball sampling research methods. This method was chosen because the
researcher was still a student at The University of Alabama and connected with other students on
social networking sites who fit the research criteria. The survey was promoted through the
30
researcher's Facebook and Twitter accounts. Facebook 'friends' and Twitter 'followers' were
invited to pass the survey on to individuals that fit the sample criteria.
The researcher also used an email campaign and emailed more than 340 teachers on
campus. The teachers were invited to send the survey out to their students. Five teachers offered
students extra credit if they participated in the survey. No students were forced to take the survey.
Students were allowed to opt out of the survey at any time for any reason without consequence.
Students were only given extra credit one time even if they were offered credit in multiple
classes. This helped deter students from taking the survey multiple times.
The credit incentive increased response rates and helped the researcher find a sufficient
amount of data. The survey was available for five weeks. The University of Alabama has
approximately 31,000 students on campus ("Quick facts: demographics," 2012). According to
Raosoft's sample size calculator, to have a 95% confidence level, a sample around 380 is
necessary ("Sample size calculator," 2004). This survey reached more than 600 students. By
offering an incentive, the researcher was able to find an adequate number of participants.
Once the researcher received the survey data, descriptive statistics were used to get a
better understanding of the participant population. Then the researcher used mixed design
ANOVA to study the significance of the user's motivations and his or her Twitter activity during
the warning, impact and recovery stage. Participants were labeled high, medium, or low users
depending on how much they were motivated by one of the four motivations. High motivated
individuals were students who scored between 4-5 on the motivation score. Medium motivated
users had motivation scores between 3 and 3.99. Low motivated individuals scored below 3. The
high, medium, and low respondents of each motive were compared to each stage using a mixed
design ANOVA. The ANOVA brought to light significant findings among the individuals
31
motivated and their disposition to use Twitter during the various stages. The last research
question was answered by comparing means of Twitter use during each stage.
Although this study only scratches the surface of Twitter use during an emergency, the
research leads to a better understanding of crisis communication; specifically, how the public
participates in disaster communication through Twitter. The survey addresses motivations as
well as how Twitter was used during a tornado by questioning students living near the disaster
area. The results from this research will open the doors to future research into Twitter and all
social network use during an emergency. In the next chapter, results from the survey will be
analyzed, as well as a discussion of what the results mean for the future of social media and
crisis communication research.

32
Results
Participants were invited to take a short survey over a 35-day span during March 2012
and the first week of April 2012. It was administered nearly a year after the April 27 disaster. By
the end of the 35 days, 580 surveys were completed. The survey respondents were made up of
both males (21%) and females (79%). Of the University of Alabama campus, females make up
54% of the student body ("Quick facts: demographics", 2012). The majority of participants were
Caucasian (81%) followed by African American (11%), and Hispanic (3%). The individuals
surveyed were almost evenly distributed among freshmen (18%), sophomore (27%), junior
(23%), senior (21%), and graduate (10%) standing. Of those surveyed, a majority used Facebook
(96%) and/or Twitter (82%).
The reasons to join Twitter varied among the individuals, but most participants cited
friend/ family suggested (61%) as the reason they joined. Individuals also joined Twitter to stay
informed (35%) and to follow influential figures (31%). Of the individuals surveyed, 31% joined
Twitter after April 27, 2012.
Twitter scores were taken on a five-point scale, where “one” represented using Twitter
never and “five” represented using Twitter very often. Twitter was used during each stage with a
mean varying between 2.56-2.79. This means that on average, over the three stages of disaster,
Twitter was used rarely to sometimes. Twitter was never the most used instrument during the
natural disaster. During the warning stage, 76% of individuals found their information from the
TV. The next largest segment (66%) used ‘word of mouth’ to gather information. Twitter was

33
the fifth largest instrument used by students to find information during the warning stage (37%
of people surveyed used Twitter during the warning stage).
The impact stage showed an increase of students gathering information. The majority of
students (77%) used ‘word of mouth’ as a way to find information about the storm after it hit
Tuscaloosa. Social networks (not including Twitter) were the second largest tool people used
(68%). Again, Twitter was the fifth most used way of finding information. The individuals who
used Twitter increased from 37% to 50% during the impact stage.
The recovery stage saw an increase of individuals using the TV (86%), social networks
(77%) and ‘word-of-mouth’ (74%) to gather information, but the percentage of individuals using
Twitter (50%) during that stage remained the same.
Correlations
Before the researcher ran analysis on the data, it was important to condense motivations
variables to produce motivation scores. These scores would help reflect how motivated the
participants were. The participants’ motivations were calculated using 18 questions to gauge the
use of four motivations. The results from these questions were separated based upon which
motivation they represented. Two questions studied how socially motivated the individuals were
and another two questioned how much they were motivated by a status seeking need. The
entertainment motivation was measured with eight questions and the information motivation
with six.
To make the data easier to analyze, motivation questions were collapsed together to
create motivation scale scores. Before the questions could be collapsed, it was important for the
researcher to check the correlation of each motivation questioned. The researcher used Cohen's
(1988) guidelines to decide if the correlations were large enough. In Cohen's guidelines, large

34
correlations are labeled as any correlation with r = .50 to r = 1. For this study, if the correlation
was larger than r = .45, that variable was included in the motivation scale score.
The first correlation tested the two variables that were used to measure an individual's
social motivation. Using a Cronbach's alpha coefficient, the motivation questions were tested for
reliability. The social motivation had a Cronbach's alpha coefficient of .843. Missing cases were
excluded pairwise. After using Pearson product-movement correlation coefficient, it was
discovered the social motivation’s two variables had a strong positive correlation (r = .732, n =
575, p < .0005). The two social motivation questions were collapsed to create a social
motivation score.
The entertainment motivation consisted of eight different variables. The motivations had
a Cronbach's alpha coefficient of .932. Again the researcher used Pearson product-movement
correlation to test the strength of the eight correlations. The analysis revealed that seven of the
eight variables had large correlations r = .573 or higher. One variable had medium sized
correlation (EntM2/EntM8 r = .434, n = 570, p < .0005). EntM2 reflects the question that asks
participants if they use Twitter to look up information about brands. EntM8 asks if the
participant uses Twitter to pass the time. Using Twitter to follow brands and to pass the time did
not have a high correlation with each other. Since the EntM2 variable had a correlation below r
= .45, the variable was discarded and the other variables left were collapsed to create a strong
entertainment motivation scale.
Correlations were next tested between the two status motivation variables. Again, the
missing cases were excluded pairwise and a Pearson product-movement correlation coefficient
was used. The first status motivation question and the second status motivation question
produced a strong positive correlation (r = .565, n =570, p < .0005). The status variables were

35
collapsed to create a status motivation score. The motivations had a Cronbach's alpha coefficient
of .721.
The last correlation measured six variables that created the information motivation scale
score. Each motivation was tested against each other. The motivations had a Cronbach's alpha
coefficient of .897. Just as with the other motivations, using a Pearson- product movement
correlation coefficient, all the motivations had a correlation of r = .47 or higher. Some
motivations were more strongly correlated than others. All the information motivation
correlations are illustrated in Table 1.
Table 1
Correlations Information Motivations Variables
Information Motivations InfoM1 InfoM2 InfoM3 InfoM4 InfoM5 InfoM6
Info1 Pearson
Correlation 1 .648 .530 .727 .644 .483 Sig. (2-tailed) .000 .000 .000 .000 .000 N 574 571 570 570 569 567
Info2 Pearson
Correlation .648 1 .563 .632 .623 .496 Sig. (2-tailed) .000 .000 .000 .000 .000 N 571 574 570 570 570 569
Info3 Pearson
Correlation. .530 .563 1 .478 .545 .470 Sig. (2-tailed) .000 .000 .000 .000 .000 N 570 570 573 569 568 566
Info4 Pearson
Correlation .727 .632 .478 1 .721 .515 Sig. (2-tailed) .000 .000 .000 .000 .000 N 570 570 569 574 572 571
Info5 Pearson
Correlation .644 .623 .545 .721 1 .744 Sig. (2-tailed) .000 .000 .000 .000 .000 N 569 569 568 572 573 571
Info6 Pearson
Correlation .483 .496 .470 .515 .744 1 Sig. (2-tailed) .000 .000 .000 .000 .000
Info
rmat
ion
Mot
ivat
ion
N 567 567 567 571 571 571

36
All motivations were strongly correlated except for four correlations between
InfoM1/InfoM6, InfoM2/InfoM6, InfoM3/InfoM4, and InfoM3/InfoM6. Those motivations had
medium correlations. The medium correlations will be included in the analysis because they all
had a correlation above r = .45.
Mixed Design ANOVA
A majority of individuals who used Twitter around the time of the tornado were most
likely users who already visited Twitter at least once a day (68%). By using a mixed design
ANOVA the researcher compared Twitter use during the warning, impact and recovery stages of
the tornado disaster. For the first four research questions, the researcher used a mixed design
ANOVA to discover which stage individuals motivated by a particular need used Twitter most.
To conduct this analysis, the researcher collapsed Twitter use during each stage. Each
stage asked three questions about Twitter use. The first question examined how often the
individual used Twitter during that stage. The next question asked how often the individual sent
original Tweets. The last question asked how often the user retweeted information. The
researcher used a Pearson product-movement correlation for each stage. Missing cases were
excluded pairwise. For the warning stage, each question about Twitter use yielded a significant
strong correlation r = .804 of higher (WTU/WOT r = .872, n = 579, p < .0005) (WTU/WRT r
= .804, n = 579, p < .0005)(WOT/WRT r = .820, n = 579, p < .0005). The impact stage also
produced significant strong correlations of r = .836 or higher (ITU/IOT r = .836, n = 574, p
< .0005) (ITU/IRT r = .836 n = 573, p < .0005)(IOT/IRT r = .853, n = 572, p < .0005). The
recovery stage has significant positive results as well. The correlations for this stage were the
strongest with r = .876 or higher (RTU/ROT r = .915, n = 575, p < .0005) (RTU/RRT r = .876, n
= 570, p < .0005)(ROT/RRT r = .891, n = 572, p < .0005). Because each stages’ Twitter use

37
questions had strong correlations, the researcher was able to collapse the Twitter use questions to
create a warning, impact and recovery stage Twitter use score. This score was used as the Twitter
variable in the mixed design ANOVA analysis.
To answer the research questions using a mixed design ANOVA, three variables are
necessary for this analysis. The first two variables are categorical independent between-subjects
variables. Taking each motivation score and grouping scores into low, medium and high
motivation categories created the first variable. For instance, individuals who scored between 0
and 2.99 on their social motivation score were labeled as low motivated. Individuals who scored
between 3 and 3.99 were medium motivated. Lastly, those who scored between 4 and 5 were
high motivated by the social motivation. The second categorical independent between subjects
variable is the three stages of warning, impact, and recovery. The third variable needed for the
analysis was one continuous dependent variable. Twitter use scores during the three stages
served as the dependent variable for this study.
Motivations to Tweet
Social motivation
The first research question asks at which stage Twitter users were motivated by the need
for socialization most likely to tweet. To answer this question, a mixed design ANOVA was used
to analyze the relationship between those who were motivated by the need to socialize and their
Twitter use during the warning, impact and recovery stages. Subjects were divided into high,
medium, and low motivated groups based on their scores on the social motivation scale (hi n =
236, med n = 152, lo n = 168). There was a significant main effect for time, Wilks’ λ = .909, F(2,
552) = 27.62, p < .000. This effect for time is a moderate effect with the partial eta squared
= .091. The results showed that over the three stages, Twitter use increased. There was also a

38
main effect found for social motivation F(2, 553) = 167.81, p < .000. This effect showed that the
more motivated someone was by the need for socialization, the more they tweeted. The effect for
social motivation was a large effect with the partial eta squared = .378. There was a small but
significant interaction effect between time and social motivation, Wilks’ λ = .974, F(4, 1104) =
27.62, p = .006, partial eta squared = .013.
The small interaction between time and social motivation was further investigated to
examine the simple effects. There were significant simple effects found for the pairwise
comparisons of the social motivation measure. The results can be seen in Table 2. All
interactions between the motivation categories were significant. Each motivation category had
significantly different means (Lo motivated M = 1.45, Med motivated M = 2.86, Hi motivated M
= 3.42).
Table 2
Pairwise Comparison of Simple Effects for Social Motivation Categories
Social Grp (a)
Social Grp (b)
Mean Diff. (a-b) Std. Error Sig. 95% CI
Lo Med -1.410 .121 .000 [-1.647, -1.173] Hi -1.975 .109 .000 [-2.189, -1.761]
Med Lo 1.410 .121 .000 [1.173, 1.647] Hi -.566 .112 .000 [-.786, -.345]
Hi Lo 1.975 .109 .000 [1.761, 2.189] Med .566 .112 .000 [.345, .786]
The next simple effect that was examined was time. Again, all pairwise comparisons
comparing Twitter use over the three time periods were significant. These results can be seen in
Table 3. The results conclude that Twitter use continued to increase over the three time periods

39
for those who had a social motivation (warning stage M = 2.48, impact stage M = 2.56, recovery
stage M = 2.69).
Table 3
Pairwise Comparison of Social Motivation Simple Effects for Time
Time (a) Time (b) Mean Diff.
(a-b) Std. Error Sig. 95% CI Warning Stage Impact Stage -.096 .036 .008 [-.167, -.025]
Recovery Stage -.212 .031 .000 [-.273, -.152] Impact Stage Warning Stage .096 .036 .008 [.025, .167]
Recovery Stage -.117 .027 .000 [-.170, -.063] Recovery Stage Warning Stage .212 .031 .000 [.152, .273]
Impact Stage .117 .027 .000 [.063, .170]
The next pairwise comparison compared high, medium, and low motivated groups to
each other during the three stages. All interactions were significant p < .0005. Results can be
examined in Table 4.
The analysis was conducted to find out at which stage individuals were motivated by the
need to socialize most likely to tweet. From the analysis it is understood that those motivated by
the need to socialize were tweeting more during the recovery stage. Twitter use increased over
the three stages. Individuals who were categorized as medium and high- motivated reported on
average using Twitter "sometimes" during the recovery stage (med M = 3.01, hi M = 3.58). The
breakdown of Twitter use by social motivation group and disaster stage can be seen in Table 5.
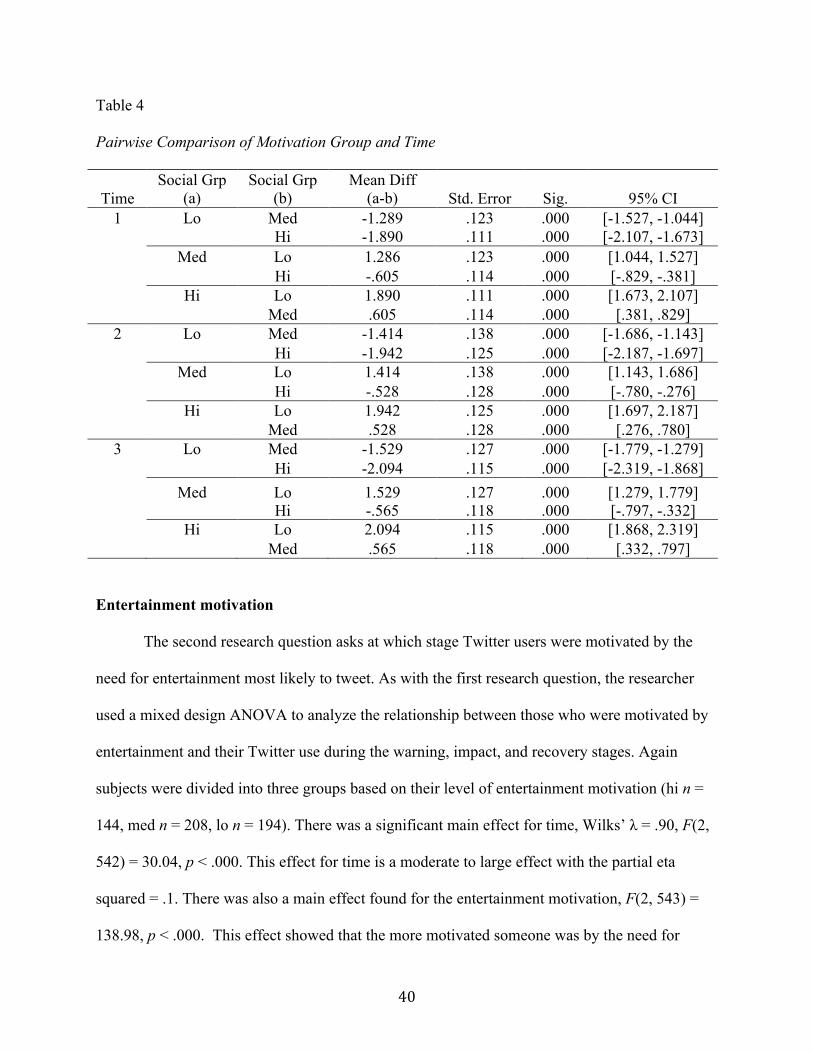
40
Table 4
Pairwise Comparison of Motivation Group and Time
Time Social Grp
(a) Social Grp
(b) Mean Diff
(a-b) Std. Error Sig. 95% CI 1 Lo Med -1.289 .123 .000 [-1.527, -1.044] Hi -1.890 .111 .000 [-2.107, -1.673] Med Lo 1.286 .123 .000 [1.044, 1.527] Hi -.605 .114 .000 [-.829, -.381] Hi Lo 1.890 .111 .000 [1.673, 2.107] Med .605 .114 .000 [.381, .829] 2 Lo Med -1.414 .138 .000 [-1.686, -1.143] Hi -1.942 .125 .000 [-2.187, -1.697] Med Lo 1.414 .138 .000 [1.143, 1.686] Hi -.528 .128 .000 [-.780, -.276] Hi Lo 1.942 .125 .000 [1.697, 2.187] Med .528 .128 .000 [.276, .780] 3 Lo Med -1.529 .127 .000 [-1.779, -1.279] Hi -2.094 .115 .000 [-2.319, -1.868] Med Lo 1.529 .127 .000 [1.279, 1.779] Hi -.565 .118 .000 [-.797, -.332] Hi Lo 2.094 .115 .000 [1.868, 2.319] Med .565 .118 .000 [.332, .797]
Entertainment motivation
The second research question asks at which stage Twitter users were motivated by the
need for entertainment most likely to tweet. As with the first research question, the researcher
used a mixed design ANOVA to analyze the relationship between those who were motivated by
entertainment and their Twitter use during the warning, impact, and recovery stages. Again
subjects were divided into three groups based on their level of entertainment motivation (hi n =
144, med n = 208, lo n = 194). There was a significant main effect for time, Wilks’ λ = .90, F(2,
542) = 30.04, p < .000. This effect for time is a moderate to large effect with the partial eta
squared = .1. There was also a main effect found for the entertainment motivation, F(2, 543) =
138.98, p < .000. This effect showed that the more motivated someone was by the need for
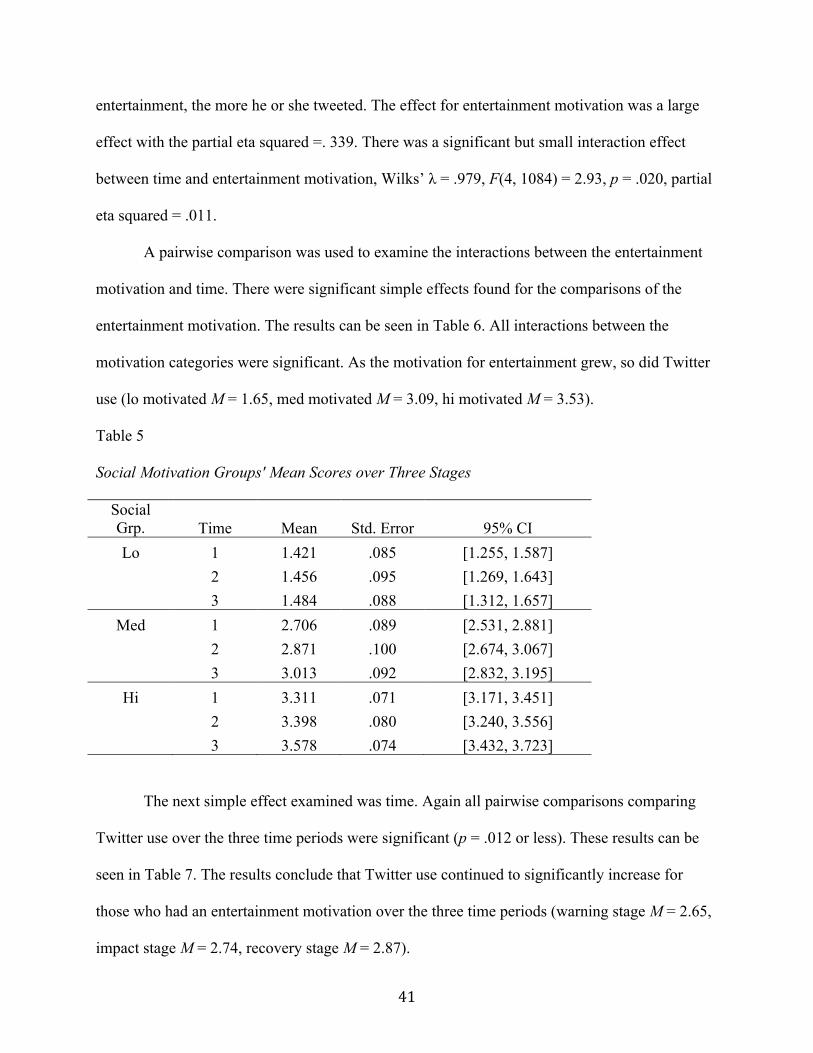
41
entertainment, the more he or she tweeted. The effect for entertainment motivation was a large
effect with the partial eta squared =. 339. There was a significant but small interaction effect
between time and entertainment motivation, Wilks’ λ = .979, F(4, 1084) = 2.93, p = .020, partial
eta squared = .011.
A pairwise comparison was used to examine the interactions between the entertainment
motivation and time. There were significant simple effects found for the comparisons of the
entertainment motivation. The results can be seen in Table 6. All interactions between the
motivation categories were significant. As the motivation for entertainment grew, so did Twitter
use (lo motivated M = 1.65, med motivated M = 3.09, hi motivated M = 3.53).
Table 5
Social Motivation Groups' Mean Scores over Three Stages
Social Grp. Time Mean Std. Error 95% CI Lo 1 1.421 .085 [1.255, 1.587]
2 1.456 .095 [1.269, 1.643] 3 1.484 .088 [1.312, 1.657]
Med 1 2.706 .089 [2.531, 2.881] 2 2.871 .100 [2.674, 3.067] 3 3.013 .092 [2.832, 3.195]
Hi 1 3.311 .071 [3.171, 3.451] 2 3.398 .080 [3.240, 3.556] 3 3.578 .074 [3.432, 3.723]
The next simple effect examined was time. Again all pairwise comparisons comparing
Twitter use over the three time periods were significant (p = .012 or less). These results can be
seen in Table 7. The results conclude that Twitter use continued to significantly increase for
those who had an entertainment motivation over the three time periods (warning stage M = 2.65,
impact stage M = 2.74, recovery stage M = 2.87).

42
Table 6
Pairwise Comparison of Simple Effects for Entertainment Motivation Categories
Entertain Grp (a)
Entertain Grp (b)
Mean Diff. (a-b) Std. Error Sig. 95% CI
Lo Med -1.439 .111 .000 [-1.657, -1.220] Hi -1.884 .123 .000 [-2.125, -1.643]
Med Lo 1.439 .111 .000 [1.220, 1.657] Hi -.445 .121 .000 [-.683, -.208]
Hi Lo 1.884 .123 .000 [1.643, 2.125] Med .445 .121 .000 [.208, .683]
Table 7
Pairwise Comparison of Entertainment Motivation Simple Effects for Time
Time (a) Time (b) Mean
Diff. (a-b) Std.
Error Sig. 95% CI Warning Stage Impact Stage -.092 .036 .012 [-.163, -.020]
Recovery Stage -.218 .031 .000 [-.279, -.157] Impact Stage Warning Stage .092 .036 .012 [.020, .163]
Recovery Stage -.126 .027 .000 [-.180, -.073] Recovery Stage Warning Stage .218 .031 .000 [.157, .279]
Impact Stage .126 .027 .000 [.073, .180]
Table 8 shows the next pairwise comparison that compared high, medium, and low
motivated groups to each other during the three stages. All interactions were significant at p
= .005 or less.
The analysis was conducted to discover at which stage individuals motivated by the need
for entertainment were most likely to tweet. Individuals who were categorized as medium and
high motivated both reported on average using Twitter "sometimes" during the impact stage
(med M = 3.1, hi M = 3.49) and recovery stage (med M = 3.21, hi M = 3.70). Compared to the

43
social motivation, individuals motivated by the need for entertainment used Twitter more during
the three stages. The analysis also showed that those motivated by the need for entertainment
were tweeting significantly more during the recovery stage. The breakdown of Twitter use by
entertainment motivation group and disaster stage can be seen in Table 9.
Table 8
Pairwise Comparison of Motivation Group and Time
Time Entertain Grp (a)
Entertain Grp (b)
Mean Diff (a-b)
Std. Error Sig. 95% CI
1 Lo Med -1.342 .113 .000 [-1.564, -1.121] Hi -1.807 .124 .000 [-2.051, -1.562] Med Lo 1.342 .113 .000 [1.121, 1.564] Hi -.464 .123 .000 [-.705, -.223] Hi Lo 1.807 .124 .000 [1.562, 2.051] Med .464 .123 .000 [.223, .705] 2 Lo Med -1.462 .126 .000 [-1.709, -1.214] Hi -1.843 .139 .000 [-2.116, -1.571] Med Lo 1.462 .126 .000 [1.214, 1.709] Hi -.382 .137 .005 [-.651, -.113] Hi Lo 1.843 .139 .000 [1.571, 2.116] Med .382 .137 .005 [.113, .651] 3 Lo Med -1.512 .118 .000 [-1.744, -1.281] Hi -2.002 .130 .000 [-2.257, -1.747] Med Lo 1.512 .118 .000 [1.281, 1.744] Hi -.490 .128 .000 [-.741, -.239] Hi Lo 2.002 .130 .000 [1.747, 2.257] Med .490 .128 .000 [.239, .741]
Status seeking motivation
The third research question (during which stage were Twitter users who were motivated
by status most likely to tweet) was analyzed using a mixed design ANOVA examining the status
motivation over the three stages. Subjects were divided into three groups based on their level of
status-seeking motivation (hi n = 50 med n = 114, lo n = 388). Most of the respondents had a low
motivation. There was a moderate, significant main effect for time, Wilks’ λ = .914, F(2, 548) =

44
25.64, p < .000, partial eta squared = .086. There was also a main effect found for the status
motivation, F(2, 549) =138.67, p < .000. This effect shows that the more motivated someone
was by status seeking, the more they tweeted. The effect for status motivation was a moderate
effect with the partial eta squared =. 090. There was no significant interaction effect found
between time and the status-seeking motivation, Wilks’ λ = .986, F(4, 1096) = 1.97, p = .098.
Although Twitter use increased over time, there was no significant difference between use during
the three stages. It is no surprise that the interaction was not significant because the effect size
was small, partial eta squared = .007. Because the interaction was not significant, pairwise
comparisons were not necessary.
Table 9
Entertainment Motivation Groups' Mean Scores over Three Stages
Entertain Grp. Time Mean Std. Error 95% CI Lo 1 1.603 .081 [1.444, 1.763]
2 1.643 .091 [1.465, 1.821] 3 1.699 .085 [1.533, 1.866]
Med 1 2.946 .078 [2.791, 3.100] 2 3.104 .087 [2.932, 3.276] 3 3.212 .082 [3.051, 3.372]
Hi 1 3.410 .094 [3.224, 3.595] 2 3.486 .105 [3.280, 3.693] 3 3.701 .098 [3.508, 3.895]
Information Motivation
The last motivation that was examined in this research was the information motivation.
Just like the previous three motivations, a mixed design ANOVA was used to analyze the
relationship between those who were motivated by the need for information and their Twitter use
during the warning, impact and recovery stages. Survey participants were placed in categories

45
based on their motivation scores (hi n = 81, med n = 229, lo n = 231). There was a significant
main effect for time, Wilks’ λ = .905, F(2, 537) = 28.21, p < .000. This effect for time is a
moderate effect with the partial eta squared = .095. The results showed that over the three stages,
Twitter use increased. There was a main effect found for information motivation, F(2, 538) =
137.01, p < .000. This effect explained that the more motivated someone was by the need for
information, the more they tweeted. The effect for information motivation was a large effect with
the partial eta squared = .337. There was a small but significant interaction effect between time
and social motivation, Wilks’ λ = .975, F(4, 1074) = 3.39, p = .009, partial eta squared = .012.
The small interaction between time and information motivation was further investigated
to examine the simple effects. There were significant effects found for the pairwise comparisons
of the information motivation measured. The results can be seen in Table 10. All interactions
between the motivation categories were significant p = .003 or less. The more individuals are
motivated by the need for information, the more they tweet (lo motivated M = 1.78, med
motivated M = 3.24, hi motivated M = 3.68).
Table 10
Pairwise Comparison of Information Motivation Simple Effects for Motivation Categories
Info Grp (a)
Info Grp (b)
Mean Diff. (a-b) Std. Error Sig. 95% CI
Lo Med -1.459 .104 .000 [-1.663, -1.255] Hi -1.896 .144 .000 [-2.178, -1.614]
Med Lo 1.459 .104 .000 [1.255, 1.663] Hi -.437 .144 .003 [-.719, -.154]
Hi Lo 1.896 .144 .000 [1.614, 2.178] Med .437 .144 .003 [.154, .719]

46
The next simple effect that was examined was time. Again all pairwise comparisons
were significant. These results can be seen in Table 11. The results conclude that Twitter use
continued to significantly increase for those who had an information motivation over the three
time periods (warning stage M = 2.79, impact stage M = 2.88, recovery stage M = 3.02)
Table 11
Pairwise Comparison of Information Motivation Simple Effects for Time
Time (a) Time (b) Mean
Diff. (a-b) Std.
Error Sig. 95% CI Warning Stage Impact Stage -.096 .040 .017 [-.175, -.017]
Recovery Stage -.238 .035 .000 [-.306, -.170] Impact Stage Warning Stage .096 .040 .017 [.017, .175]
Recovery Stage -.142 .031 .000 [-.202, -.081] Recovery Stage Warning Stage .238 .035 .000 [.170, .306]
Impact Stage .142 .031 .000 [.081, .202]
The next pairwise comparison compared high, medium, and low motivated groups to
each other during the three stages. All interactions were significant p = .015 or less. Results can
be examined in Table 12.
The analysis was conducted to find out at which stage individuals who were motivated by
the need for information were most likely to tweet. The analysis showed those motivated by the
need for information were tweeting more during the recovery stage. During all three stages,
medium and highly motivated individuals on average tweeted ‘sometimes.’ The use of Twitter
by both categories increased over the three disaster stages. The highest Twitter use of medium
(M = 3.39) and high (M = 3.85) users was seen in the recovery stage. The breakdown of Twitter
use by information motivation group and disaster stage can be seen in Table 13.

47
Table 12
Pairwise Comparison of Motivation Group and Time
Time Info Grp
(a) Info Grp
(b) Mean Diff
(a-b) Std. Error Sig. 95% CI 1 Lo Med -1.337 .106 .000 [-1.546, -1.128] Hi -1.792 .147 .000 [-2.081, -1.503] Med Lo 1.337 .106 .000 [1.128, 1.546] Hi -.455 .147 .002 [-.744, -.166] Hi Lo 1.792 .147 .000 [1.503, 2.081] Med .455 .147 .002 [.166, .744] 2 Lo Med -1.484 .117 .000 [-1.714, -1.254] Hi -1.882 .162 .000 [-2.200, -1.563] Med Lo 1.484 .117 .000 [1.254, 1.714] Hi -.397 .162 .015 [-.716, -.079] Hi Lo 1.882 .162 .000 [1.563, 2.200] Med .397 .162 .015 [.079, .716] 3 Lo Med -1.556 .109 .000 [-1.771, -1.341] Hi -2.014 .152 .000 [-2.311, -1.716] Med Lo 1.556 .109 .000 [1.341, 1.771] Hi -.458 .152 .003 [-.756, -.160] Hi Lo 2.014 .152 .000 [1.716, 2.311] Med .458 .152 .003 [.160, .756]
Table 13
Information Motivation Groups' Mean Scores over Three Stages
Social Grp. Time Mean Std. Error 95% CI Lo 1 1.743 .075 [1.596, 1.890]
2 1.760 .083 [1.598, 1.923] 3 1.834 .077 [1.682, 1.986]
Med 1 3.080 .075 [2.932, 3.228] 2 3.245 .083 [3.082, 3.407] 3 3.390 .078 [3.238, 3.542]
Hi 1 3.535 .127 [3.286, 3.784] 2 3.642 .139 [3.368, 3.916] 3 3.848 .130 [3.592, 4.104]

48
Motivations that produced the most Twitter use
To answer the last research question "Which motivation produced the most Twitter use?”
the researcher collapsed the motivation scores for the social, entertainment, and information
motivation. The status seeking motivation was not used because its results were not found
significant over the three stages. Unlike collapsing the motivations into high, medium and low
motivation, the researcher collapsed the scores to reflect whether an individual was motivated or
not. If an individual scored a three or higher on the motivation scale, they were deemed
motivated by that particular motivation. The researcher also collapsed the warning stage Twitter
use, impact stage Twitter use and recovery stage Twitter use to create a general Twitter use score
for the individual. General Twitter use scores were compared between individuals who were
motivated and those who were not. The entire mean comparisons can be examined in Table 14-
16. The results show that the information motivation produced the most Twitter use, but the
entertainment motivation and social motivation were not far behind.
Most results from this study were significant and shed more light on the use of social
media during natural disasters. In the next section, the researcher will explain what these findings
mean for disaster communication.
Table 14
Social Motivated Users Mean Score
Social Motivation
Mean
N
Std. Deviation
Yes 3.2073 388 1.20371
No 1.4537 168 .81753
Total 2.6775 556 1.36420

49
Table 15
Entertainment Motivated Users Mean Score
Entertain Motivation
Mean
N
Std. Deviation
Yes 3.2693 352 1.00865
No 1.6483 194 1.20371
Total 2.6933 546 1.36834
Table 16
Information Motivated Users Mean Score
Info Motivation
Mean
N
Std. Deviation
Yes 3.3523 310 1.16839
No 1.7792 231 1.05320
Total 2.6806 541 1.363389 .

50
Discussion
April 27, 2011, is a day that will live forever in the minds of many college students who
attended The University of Alabama in the Spring of 2011. Students were thrown into a situation
that many had never experienced. Students were without power and cell phone service for hours
to days after the storm. The research studied how they used Twitter during this time. The results
show that no matter what motivated an individual or how motivated they were, Twitter use
increased over the warning, impact and recovery phase. The research also addresses what
motivated the students to use Twitter during that time.
From the results, it is evident that level of motivation and what motivates a person
produces significantly different Twitter use. Three of the motivations studied — social,
entertainment, and information — showed significantly more Twitter use during the recovery
stage compared to the warning and impact phase. The status-seeking motivation did not show
any significant interaction results between the motivation and time of Twitter use. Other survey
questions back up these results. When students were asked why they used Twitter during the
recovery stage, only 9% selected the status motivation option "pass on information about
volunteer opportunities.” During the recovery stage, students reported using Twitter to find ways
to help family, friends, and their community (20%), to get information about recovery efforts
(18%), and to divert their attention (12%).
The last research question asked which motivation produced the most Twitter use.
Results show that the social, entertainment and information motivation produce roughly the same
amount of Twitter use. The research studied Twitter use at each stage and asked individuals the

51
reason they used Twitter during that stage. During the warning stage, 44% of individuals
surveyed used Twitter to pass the time. This suggests that during the warning stage, users were
motivated by entertainment. After the storm and during the impact stage, individuals were using
Twitter to find updates about the storm (30%), suggesting they were satisfying an information
motivation. Social, information and entertainment motivations were used during the recovery
stage. As previously mentioned, students were using Twitter to find ways to help, gather
information about recovery efforts and to divert their attention.
From the results, those motivated by a status-seeking need are not using Twitter as much
during a disaster. This could be because during a disaster those who are motivated by the status
seeking motivation are often exploiters who were not directly affected by the disaster. When
participants were asked at each stage how they were using Twitter, the status seeking motivation
answers were "Find out the status of school and work," "Report about damage," and "Pass on
information about volunteer opportunities." The status seeking motivation answer was
consistently chosen the least. The status seeking motivation may not have been used as often
during this disaster because students did not look to gain anything out of this disaster. Instead,
students were trying to survive it.
Two qualitative questions were asked and shed more light on why the three motivations
produced more Twitter use than the status motivation. The two qualitative questions were
analyzed following Strauss' four basic guidelines (Berg, 2007). The two questions revealed that
many of the students were only able to use their phones after the storm. Before the storm, they
were getting storm information by word of mouth. Friends and family were informing students
about the pending storm. The students let the information come to them. They were not getting
their information from Twitter. Twitter was not a lifeline at that point; instead, it was a means

52
for entertainment. It was not until after the storm hit that students began actively looking for
information. This is likely what led to an increase of Twitter use. Students located in Tuscaloosa
during the impact stage used any way possible to see the tornado damage. According to their
open-ended questions, students were talking with neighbors, making phone calls and using their
phone's Internet capabilities. During that time it may not have been that the students were using
Twitter intentionally, but that it was available when they needed it.
The open-ended questions also explained why students motivated by social,
entertainment, and information motivation used Twitter more during the recovery stage than the
previous two stages. After the tornado hit campus, students were encouraged to leave campus
and finals were canceled (Reed, 2011). This was because of power outages on campus and the
water not being safe to drink (Brown, 2011). The answers from the open-ended questions explain
that many students left campus. They moved from homes and dorms without power to residences
that did whether this was staying with friends or moving back home. Because the students now
had power and no exams to study for, they were able to spend more time on the Internet. Many
of the participants did not always stay home after they moved. After moving, many students
came back to volunteer around Tuscaloosa after hearing about ways they could help.
Contributions
This research has set the path for more research into disaster communication and Twitter
use. During the three stages, Twitter was never the most used media outlet during the disaster,
but it was consistently used. By the impact and recovery stage, 50% of individuals surveyed
were using Twitter during the disaster. Twitter was useful even if an individual was not an active
user. Even though students were not actively trying to use Twitter specifically, it was one of the
easiest ways for students to connect in a world from which they had become unplugged.

53
This thesis explains that students did not use Twitter during the warning stage as much as
they used word-of-mouth. From the open-ended questions, this thesis learned that many students
learned about the incoming storm from their parents or other word-of-mouth sources. For
emergency agencies to get warning alerts out, Twitter should not be used alone during the
warning stage. Emergency response communicators should feel confident about using Twitter to
disseminate information during a disaster and after the disaster occurs. Students were looking
for information on Twitter after the tornado hit.
From the open-ended questions it was understood that many students had to relocate,
often more than once, after the storm (moving to houses with power, moving home, moving to
volunteer). By using Twitter and following other social media updates by emergency agencies,
students were able to stay connected with updates to find the information they needed. It was an
easy way for students to find information no matter where they were located.
Unlike other social media and disaster related studies, this thesis questioned individual's
use of social networking to find volunteer opportunities. Because the information was readily
available on social networks sites, students spent time volunteering on campus in the aftermath
of the storm. Students were free from exams and able to devote time that would have been spent
on schoolwork on volunteer efforts instead.
This research also showed that different motivations produce a variety of Twitter use
during a natural disaster. Students are motivated differently and, depending on the need they are
trying to fulfill, they use Twitter differently during each stage of disaster. For instance, the use of
Twitter to satisfy the need for information increased during the impact and recovery stage. This
could be because students relied on word of mouth to inform them about the storm. Some
students even mentioned that parents were the first to inform them about the storm and that they

54
would not have known about it otherwise. Communicators should be aware that for these college
students, it was not a priority to find information about the storm before it hit, even if it was
tweeted out to them.
Emergency agencies should not rely on social media during the warning stage of a
disaster. One of the most important points from this study is that college students used word of
mouth most during the warning stage of the disaster than they used Twitter. Since the disaster
occurred over a year ago, students are taking active roles by constantly informing themselves
about the possibility of bad weather. Instead of waiting for a disaster to rouse a target into
informing themselves about a disaster, communicators should use word-of mouth to get disaster
messages across to students. Alerting parents to call students may be more affective than
tweeting a warning to a complacent target.
Limitations
Like all research studies, limitations do occur. This research, although it is insightful,
could have produced more accurate results if it had been conducted within six months of the
natural disaster. Many of the students who were on campus during the tornado graduated before
the survey was distributed. Because these students were not on campus, they were not contacted
for this research. By conducting the research earlier, open-ended answers may have been more
detailed and more accurate.
To gain a better insight to the significant results, it would have been advantageous for the
researcher to also conduct in-depth interviews. With interviews, a clearer picture could be
created to better define who had a high social, status, information, or entertainment motivation.
The researcher could have used a survey in the beginning and then conducted interviews based
on those results. The researcher could have gained an even better understanding of how those

55
individuals are motivated and why they are motivated. In-depth interviews may help the
researcher better understand their Twitter use.
The research is also limited due to its specialized population. The results only reflect one
college campus's student body during one type of disaster. The results cannot be generalized to
other populations because this research specifically studied college students. The general adult
population would not necessarily behave in the same way as college students. Other populations
may be motivated differently and use Twitter in a way unlike the college population that was
questioned in this study. In the future, a researcher can gain a better outlook by conducting
research on a variety of campuses and populations threatened by natural disasters or non-natural
disasters.
The research is also limited due to the type of disaster. Disaster communication is unique
based on the disaster type. A tornado sometimes involves little communication during the
warning stage, unlike a hurricane, which could be in the warning stage for weeks. For an
emergency agency to deliver proper alert messages, each disaster type needs properly tailored
messages that correlate with the disaster and the audience it is trying to reach. This research only
studied one disaster type and one target audience.
Future Research
In the future, researchers could expand upon the findings of this thesis by studying other
college campuses during natural disasters. This research focuses on The University of Alabama
student body during a tornado. The results may have been different if a hurricane, fire, or even a
non-natural disaster occurred. A greater understanding of the link between natural disasters and
social media use could be gained by further investigation. By comparing information use during
56
natural and non-natural disasters, significant differences for natural disasters could be noticed
and addressed. This would enhance communication efforts for future disaster responses.
Because the research confirms that different motivations produce different Twitter use,
future research could concentrate on why individuals' motivations affect their social media use
during natural disasters. New studies could be conducted that survey a single motivation and its
effect on Twitter use. By singling out a motivation, the researcher could learn which emergency
messages resonate with the different motivations. Future research on the motivations could also
expose additional motivations like fear and a survival motivation that would be special to
disaster communication. This would advance the current knowledge of social media use.
Studies should not just stop with a look into natural disasters, political conventions, other
disasters and public service notices. In all cases information is necessary and it would be
beneficial to note who is delivering the messages and if they are being heard. From this thesis it
was noted that not all messages are heard. Twitter research has a promising future and will only
create a more efficient communication platform for emergency agencies to use.

57
REFERENCES
About Twitter. (2012). Retrieved from https://twitter.com/about Baran, S. J., & Davis, D. K. (2003). Mass communication theory, foundations, ferment, and
future. Wadsworth Pub Co. Berelson, B., (1949). What 'missing the newspaper' means. In P.F. Lazarsfeld & F N. Stanton, (Eds.) Communications Research 1948-9, New York, Duell, Sloan and Pearce. Berg, B. (2007). Qualitative research methods for the social sciences. (6th ed.). Bosker, B. (2011, September 08). Twitter finally shares key stats: 40 percent of active users are
lurkers. The Huffington Post. Retrieved from http://www.huffingtonpost.com/2011/09/08/twitter-stats_n_954121.html?ref=email_share
Brown, R. (2011, April 29). Tornado puts an end to a university's school year. The New York
Times. Retrieved from http://www.nytimes.com/2011/04/30/us/30campus.html?_r=2&scp=1&sq=University of Alabama&st=cse
Bryant, J., & Zillmann, D. (2002). Media effects, advances in theory and research. Mahwah, NJ:
Lawrence Erlbaum. Facebook DC live: Social media's role in disaster preparedness and response [Web]. (2011).
Retrieved from http://www.livestream.com/facebookdclive/video?clipId=pla_285514e7-3131-45ed-abb8-eb3726b47fc1
Gannon, E. (2011, August 24). Five growing uses for Twitter. Retrieved from
http://www.edelmandigital.com/2011/08/24/five-growing-uses-for-twitter/ Harman, W. (2011, August 24). How do you use social media in emergencies? [Web log
message]. Retrieved from http://redcrosschat.org/2011/08/24/how-do-you-use-social-media-in-emergencies/
Herzog, H. (1944). Motivations and gratifications of daily serial listeners. In W. Schramm,
(Ed.), The Process and Effects of Mass Communication. 50-55. Urbana: University of Illinois Press.
Hoover, J. N. (2011, January 19). FEMA to use social media for emergency response.
Information Week, Retrieved from http://www.informationweek.com/news/government/info-management/229000918?queryText=fema to use social media.

58
Hughes, A. L., & Palen, L. (2009, May). Twitter adoption and use in mass convergence and emergency events. Proceedings of the Information Systems for Crisis Response and Management Conference (ISCRAM 2009). Gothenburg, Sweden.
Hughes, A. L., Palen, L., Sutton, J., Liu, S. B., & Vieweg, S. (2008, May). "Sight-seeing" in
disaster: An examination of on-line social convergence. Proceedings of the Information Systems for Crisis Response and Management Conference (ISCRAM 2008), Washington DC
Katz, E., (1959). Mass communication research and the study of popular culture: An editorial
note on a possible future for this journal. Studies in Public Communication, (2), 1-6. Katz, E., Blumler, J.G., & Gurevitch, M. (1974). Utilization of mass communication by the individual. In J. G. Blumler & E. Katz (Eds.), The uses of mass communications: Current perspectives on gratifications research, 19-32. Beverly Hills, CA: Sage. Katz, E., Gurevitch, M., & Haas, H., (1973). On the use of the mass media for important things. American Sociological Review, (38), 164-181. Ladhani, N. (2011). While organizing will never be the same. Social Policy, 41(3), 71. Lee, C. S., & Ma, L. (2011). News sharing in social media: The effects of gratifications and prior
experience. Computers in Human Behavior, doi: 10.1016/j.chb.2011.10.002 Lynch, M. (2011, September 28). Interview by E. Maxwell [Personal Interview]. Madden, M., & Zickuhr, K. (2011, August 26). 65% of online adults use social networking sites.
Retrieved from http://www.pewinternet.org/Reports/2011/Social-Networking-Sites.aspx McQuail, D., Blumler, J.G., & Brown, J.R. (1972). The television audience: A revised perspective. In D. McQuail, (Ed.), Sociology of Mass Communications, 135-165. Haramondsworth, Eng.:Penguin. Mersham, G. (2010). Social media and public information management: The September 2009
tsunami threat to New Zealand. Media International Australia, (137), 130-143. Morton, J. (2012, March 19). Tuscaloosa tornado death toll rises to 53 with addition of 87-year-
old women. Tuscaloosa News. Retrieved from http://www.tuscaloosanews.com/article/20120319/NEWS/120319703?p=2&tc=pg
Nguyen, T. (2011, August 26). After disasters, social media struggles to keep up with
expectations. Retrieved from http://dailycaller.com/2011/08/26/after-disasters-social-media-struggles-to-keep-up-with-expectations/

59
Palen, L., Anderson, K. M., Mark, G., Martin, J., Sicker, D., Palmer, M., & Grunwald, D. (2010, April). A vision for technology-mediated support for public participation & assistance in mass emergencies & disasters. Proceedings of Acm-bcs visions of computer science.
Park, N., Kee, K. F., & Valenzuela, S. B. (2009). Being immersed in social networking
environment: Facebook groups, uses and gratifications, and social outcomes. CyberPsychology & Behavior, 12(6), 729-733.
Quick facts: demographics. (2012). Retrieved from http://quickfacts.ua.edu/demographics.html Riley, M. W., & J.W. Riley, Jr. (1951). A sociological approach to communications research. Public Opinion Quarterly, (15), 445-460. Reed, J. (2011, April 28). UA encourages students to leave campus. The Crimson White.
Retrieved from http://cw.ua.edu/2011/04/28/ua-encourages-students-to-leave-campus/ Reynolds, B. (2002, September). Crisis and emergency risk communication. Retrieved from
http://www.bt.cdc.gov/cerc/pdf/CERC-SEPT02.pdf Rosenberg, K.E. (1974). Uses and gratifications: A paradigm outlines. In J.G. Blumler & E. Katz
(Eds.), The uses of mass communications: Current perspectives on gratifications research, 269-286. Beverly Hills, CA: Sage.
Sample size calculator. (2004). Retrieved from http://www.raosoft.com/samplesize.html Severin, W., & Tankard, J. (2001). Communication theories: Origins, methods, and uses in the
mass media. (5 ed.). New York: Longman. Silverman, M. (2010, February 27). Twitter helps find missing family member after Chile
earthquake. Retrieved from http://mashable.com/2010/02/27/twitter-missing-person-chile/
Smith, A. (2010, December 09). Who tweets?. Retrieved from
http://pewresearch.org/pubs/1821/twitter-users-profile-exclusive-examination. Smith, A. D. & Brenner, J. (2012, May 31). Twitter use 2012. Retrieved from
http://www.pewinternet.org/~/media//Files/Reports/2012/PIP_Twitter_Use_2012.pdf Smock, A. D., Ellison, N. B., Lampe, C., & Wohn, D. Y. (2011). Facebook toolkit: A uses and
gratification approach to unbundling feature use. Computers in Human Behavior, 27(6), 2322-2329.
Starbird, K., & Palen, L. (2010, May). Pass it on?: Retweeting in mass emergency. Proceedings
of the Information Systems for Crisis Response and Management Conference (ISCRAM 2010), Seattle, WA.

60
State of the media: The social media report. (2011). Retrieved from http://blog.nielsen.com/nielsenwire/social/
The people formerly known as the audience. (2011, July 09). The Economist, 399(8741), 9-12. Tucker, C. (2011). Social media, texting play new role in response to disasters. Nation's Health,
41(4), 1-18. Veil, S. R., Buehner, T., & Palenchar, M. J. (2011). A work-in-progress literature review:
Incorporating Social Media in Risk and Crisis communication. Journal of Contingencies and Crisis Management, 19(2), 110-122.
Vieweg, S., Hughes, A. L., Starbird, K., & Palen, L. (2010, April). Microblogging during two
natural hazards events: What Twitter may contribute to situational awareness. Paper presented at CHI 2010. Atlanta, GA.
Vieweg, S., Palen, L., Liu, S. B., Hughes, A. L., & Sutton, J. (2008, May). Collective intelligence
in disaster: Examination of the phenomenon in the aftermath of the 2007 Virginia Tech shooting. Proceedings of the Information Systems for Crisis Response and Management Conference (ISCRAM 2008), Washington, DC.
Williams, E. (Performer) (2009). Evan Williams on listening to Twitter users [Web]. Retrieved
from http://www.ted.com/talks/lang/eng/evan_williams_on_listening_to_twitter_users.html
Wimmer, R. D., & Dominick, J. R. (2010). Mass media research, an introduction. Wadsworth
Pub Co. Yates, D., & Paquette, S. (2011). Emergency knowledge management and social media
technologies: A case study of the 2010 Haitian earthquake. International Journal of Information Management, 31(1), 6-13.

61
APPENDIX A
Survey Questions:
For questions 1-5, reflect back to the week before the tornado hit Tuscaloosa on April 27, 2011.
Answer the following questions about your behavior during that time.
1. During the week before the tornado hit Tuscaloosa, where did you find information about the
incoming storm? Select all that apply.
TV
Online News Sites
Social Networks (i.e. Facebook, MySpace)
Newspapers
Word of Mouth
Radio
UA alerts
Other ____________________

62
2. During the week before the tornado hit Tuscaloosa, how often did you use Twitter?
Very Often
Often
Sometimes
Rarely
Never
3. During the week before the tornado hit Tuscaloosa, did you post original tweets?
Very Often
Often
Sometimes
Rarely
Never
4. During the week before the tornado hit Tuscaloosa, did you retweet other tweets?
Very Often
Often
Sometimes
Rarely
Never

63
5. During the week before the tornado hit Tuscaloosa, what was your primary reason for using
Twitter. Select one.
See what friends and family were doing to prepare for the storm
Find out the status of work or classes
Find updates about the storm
Pass the time
Did not use Twitter
Other
For questions 6-10, think back to April 27, 2011 and the first 72 hours (i.e. 3 days) after the
tornado.
6. In the first 72 hours after the tornado, where did you find information about the disaster?
Select all that apply.
TV
Online News Sites
Social Networks (i.e. Facebook, MySpace)
Newspapers
Word of Mouth
Radio
UA alerts
Other ____________________

64
7. In the first 72 hours (i.e.3 days ) after the tornado, how often did you use Twitter?
Very Often
Often
Sometimes
Rarely
Never
8. In the first 72 hours (i.e.3 days ) after the tornado, how often did you post original tweets?
Very Often
Often
Sometimes
Rarely
Never
9. In the first 72 hours (i.e.3 days ) after the tornado, how often did you retweet other tweets?
Very Often
Often
Sometimes
Rarely
Never

65
10. In the first 72 hours (i.e.3 days ) after the tornado, what was your primary reason for using
Twitter? Select one.
Find updates about the storm destruction
Let loved ones know you were safe
Watch videos and look at pictures of the storm
Report about damage in Tuscaloosa
Did not use Twitter
Other ____________________
Following the initial 72 hours, for questions 11-15 think now about the first four weeks after the
storm.
11. In the weeks after the storm, where did you find information about the disaster? Select all
that apply.
TV
Online News Sites
Social Networks (i.e. Facebook, MySpace)
Newspapers
Word of Mouth
Radio
UA alerts
Other ____________________
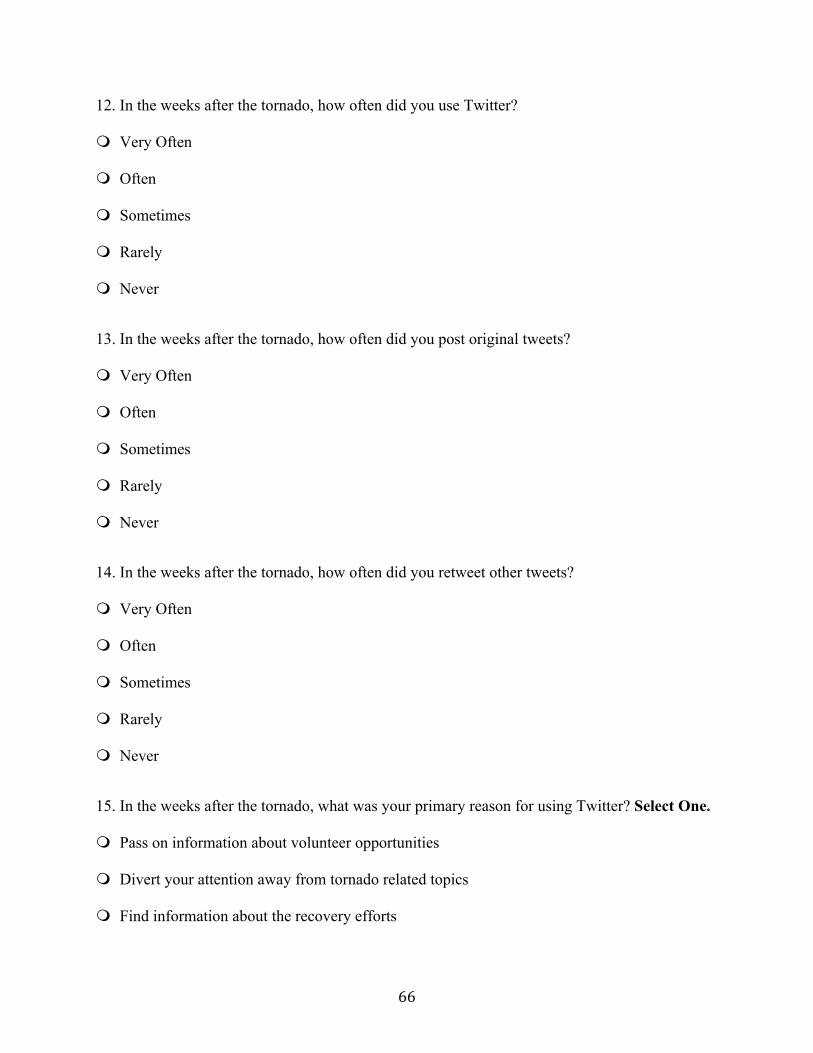
66
12. In the weeks after the tornado, how often did you use Twitter?
Very Often
Often
Sometimes
Rarely
Never
13. In the weeks after the tornado, how often did you post original tweets?
Very Often
Often
Sometimes
Rarely
Never
14. In the weeks after the tornado, how often did you retweet other tweets?
Very Often
Often
Sometimes
Rarely
Never
15. In the weeks after the tornado, what was your primary reason for using Twitter? Select One.
Pass on information about volunteer opportunities
Divert your attention away from tornado related topics
Find information about the recovery efforts

67
Find ways to help your family, friends, community (through volunteering, donations, find
shelters)
Did not use Twitter
Other
For question 16-28 think about your general use of Twitter.
16. How often do you visit Twitter?
More than 3 Times a Day
2-3 Times a Day
Once a Day
2-3 Times a Week
Once a Week
Less than Once a Week
Never
17. Why did you join Twitter? Select all that apply.
Required for a class
Friend or family suggested
Teacher or colleague suggested
To stay informed
To follow influential figures like athletes, actors, politicians, designers and journalists
Other ____________________
18. Do you use Twitter to keep in touch with friends?
Very Often

68
Often
Sometimes
Rarely
Never
19. When using Twitter, do you feel like you are part of a community?
Very Often
Often
Sometimes
Rarely
Never
20. Do you use Twitter to advance your career opportunities?
Very Often
Often
Sometimes
Rarely
Never
21. Do you use Twitter for school-related work?
Very Often
Often
Sometimes
Rarely
Never

69
22. Do you use Twitter to receive information about campus news?
Very Often
Often
Sometimes
Rarely
Never
23. Do you use Twitter to pass information (pictures websites, articles, blogs, etc.) to friends?
Very Often
Often
Sometimes
Rarely
Never
24. Do you use Twitter to find reviews for other products or services?
Very Often
Often
Sometimes
Rarely
Never
25. Do you use Twitter to find the most recent local, national or international news?
Very Often Often Sometimes Rarely Never Local
National International

70
26. Do you use Twitter for entertainment?
Very Often
Often
Sometimes
Rarely
Never
27. How often do you use Twitter to find information about:
Very Often Often Sometimes Rarely Never Brands Music
Celebrities Sports Movies
Television
28. Do you use Twitter to pass the time?
Very Often
Often
Sometimes
Rarely
Never
29. Do you use any of the following social networking sites? Select all that apply.
MySpace

71
Google+
Friendster
Other
30. Were you in Tuscaloosa, Ala. during the April 27, 2011 tornado?
Yes
No
31. Did you have a Twitter account before April 27, 2011?
Yes
No
Unsure
32. The next two questions refer to your personal experience with the tornado that occurred in
Tuscaloosa on April 27, 2011. In the space below briefly explain your experience that day.
______________________________________________________________________________
______________________________________________________________________________
33. After the storm, what did you do? Were you affected, did you leave your home, did you do
nothing, did you help volunteer or did you do something else?
______________________________________________________________________________
______________________________________________________________________________

72
34. What is your gender?
Male
Female
35. What is your race?
White/Caucasian
African American
Hispanic
Asian
Native American
Pacific Islander
Other ____________________
36. What is your major?
__________________________________________________________

73
37. What year are you?
Freshman
Sophomore
Junior
Senior
Graduate Student
38. Which state do you consider your home state?
____________________________________________
If not from the United States, what country do you consider your home country?
___________________

74
APPENDIX B IRB Approval Letter:

75

76
77

78
Related Documents