Welcome! Motivational interviewing for the prevention of alcohol misuse in young adults: What's the evidence? You will be placed on hold until the webinar begins. The webinar will begin shortly, please remain on the line.

Welcome message from author
This document is posted to help you gain knowledge. Please leave a comment to let me know what you think about it! Share it to your friends and learn new things together.
Transcript
Welcome!Motivational interviewing for
the prevention of alcohol
misuse in young adults:
What's the evidence?
You will be placed on hold until the webinar begins.
The webinar will begin shortly, please remain on the line.

Poll Questions: Consent
• Participation in the webinar poll questions is voluntary
• Names are not recorded and persons will not be identified in any way
• Participation in the anonymous polling questions is accepted as an
indication of your consent to participate
Benefits:
• Results inform improvement of the current and future webinars
• Enable engagement; stimulate discussion. This session is intended for
professional development. Some data may be used for program evaluation
and research purposes (e.g., exploring opinion change)
• Results may also be used to inform the production of systematic reviews
and overviews
Risks: None beyond day-to-day living
After Today
• The PowerPoint presentation and audio recording will be made available
• These resources are available at: – PowerPoint:
http://www.slideshare.net/HealthEvidence
– Audio Recording: https://www.youtube.com/user/healthevidence/videos
3

What’s the evidence?
Foxcroft D, Coombes L, Wood S, Allen D,
Almeida Santimano N, & Moreira M. (2016).
Motivational interviewing for the prevention of
alcohol misuse in young adults. Cochrane
Database of Systematic Reviews, 2016(7),
CD007025.
http://www.healthevidence.org/view-
article.aspx?a=motivational-interviewing-
prevention-alcohol-misuse-young-adults-
29645
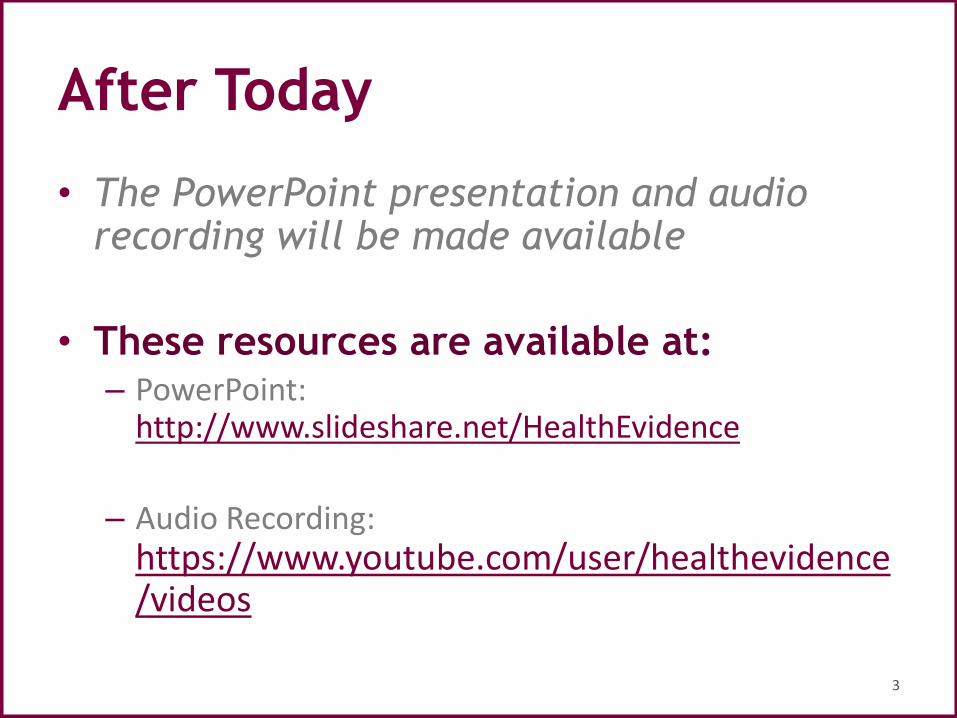
• Use CHAT to post comments /
questions during the webinar
– ‘Send’ questions to All (not
privately to ‘Host’)
• Connection issues
– Recommend using a wired
Internet connection (vs.
wireless)
• WebEx 24/7 help line
– 1-866-229-3239
Participant Side Panel in WebExHousekeeping

Housekeeping (cont’d)
• Audio
– Listen through your speakers
– Go to ‘Communicate > Audio Broadcast’
• WebEx 24/7 help line
– 1-866-229-3239

Poll Question #1
How many people are watching
today’s session with you?
A. Just me
B. 2-3
C. 4-5
D. 6-10
E. >10
The Health Evidence™ Team
Maureen Dobbins
Scientific Director
Heather Husson
Manager
Susannah Watson
Project Coordinator
Students:
Emily Belita
(PhD candidate)
Jennifer Yost
Assistant ProfessorOlivia Marquez
Research Coordinator
Emily Sully
Research AssistantLiz Kamler
Research Assistant
Zhi (Vivian) Chen
Research Assistant
Research Assistants:
Claire Howarth
Rawan Farran
Kristin Read
Research Coordinator

What is www.healthevidence.org?
Evidence
Decision
Making
inform

Why use www.healthevidence.org?
1. Saves you time
2. Relevant & current evidence
3. Transparent process
4. Supports for EIDM available
5. Easy to use

A Model for Evidence-
Informed Decision Making
National Collaborating Centre for Methods and Tools. (revised 2012). A
Model for Evidence-Informed Decision-Making in Public Health (Fact
Sheet). [http://www.nccmt.ca/pubs/FactSheet_EIDM_EN_WEB.pdf]

Stages in the process of
Evidence-Informed Public Health
National Collaborating Centre for Methods and Tools. Evidence-Informed
Public Health. [http://www.nccmt.ca/eiph/index-eng.html]
Poll Question #2
Have you heard of PICO(S) before?
A.Yes
B.No

Searchable Questions Think “PICOS”
1.Population (situation)
2.Intervention (exposure)
3.Comparison (other group)
4.Outcomes
5.Setting

How often do you use Systematic Reviews
to inform a program/services?
A.Always
B.Often
C.Sometimes
D.Never
E.I don’t know what a systematic review is
Poll Question #3

President, European Society for Prevention Research
(EUSPR), Professor of Community Psychology and Public
Health, Department of Psychology, Social Work and
Public Health, Oxford Brookes University
David Foxcroft


Alcohol consumption is
harmful• Globally, harmful use of alcohol results in approximately 3.3
million deaths each year.
• Around 9% of deaths between the ages of 15 and 29 years are attributable to alcohol, mainly resulting from car accidents, homicides, suicides and drownings.
• Hazardous drinking levels for men (consuming over 40 g/day) doubles the risk of liver disease, raised blood pressure, some cancers and violent death.
• For women, over 24 g/day average alcohol consumption increases the risk for developing liver disease and breast cancer.
Sources: Corrao 1999; Edwards 1994; Greenfield 2001; Thakker 1998; WHO 2011, 2014.

Types of prevention
• Form: Universal or Targeted
Selective Indicated
• Function: Environmental or Individual
Skills Knowledge
Source: Gordon 1983; US IoM 1994, 2009; Foxcroft 2013, 2014

Motivational Interviewing (MI)
• Miller (1995) defined MI as “a directive, client-centred counselling style for eliciting behaviour change by helping clients to explore and resolve ambivalence”.
• ’Motivational Interviewing’ pertains both to a style of relating to others and a set of techniques to facilitate that process. Its five tenets include:
– adopting an empathic, non-judgemental stance;
– listening reflectively;
– developing discrepancy;
– rolling with resistance and avoiding argument;
– supporting efficacy to change.
• The most widely used adaptation of MI is motivational enhancement therapy (MET), which combines MI components with personal feedback of assessment results (Miller 1993).
Sources: Miller 1993, 1995.

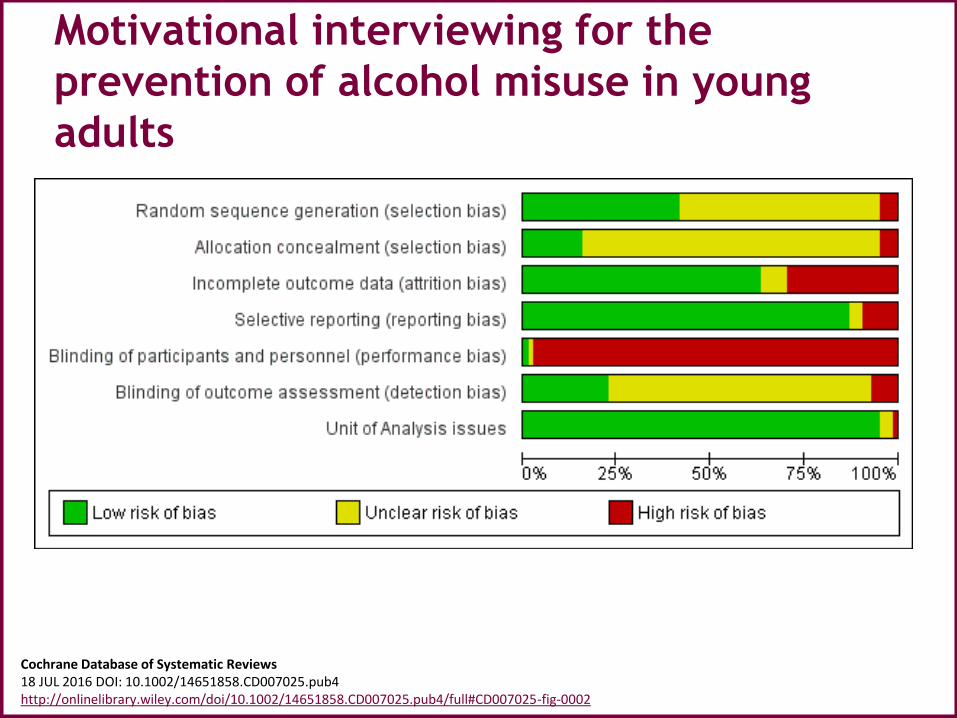
Motivational interviewing for the
prevention of alcohol misuse in young
adults
Cochrane Database of Systematic Reviews18 JUL 2016 DOI: 10.1002/14651858.CD007025.pub4http://onlinelibrary.wiley.com/doi/10.1002/14651858.CD007025.pub4/full#CD007025-fig-0001
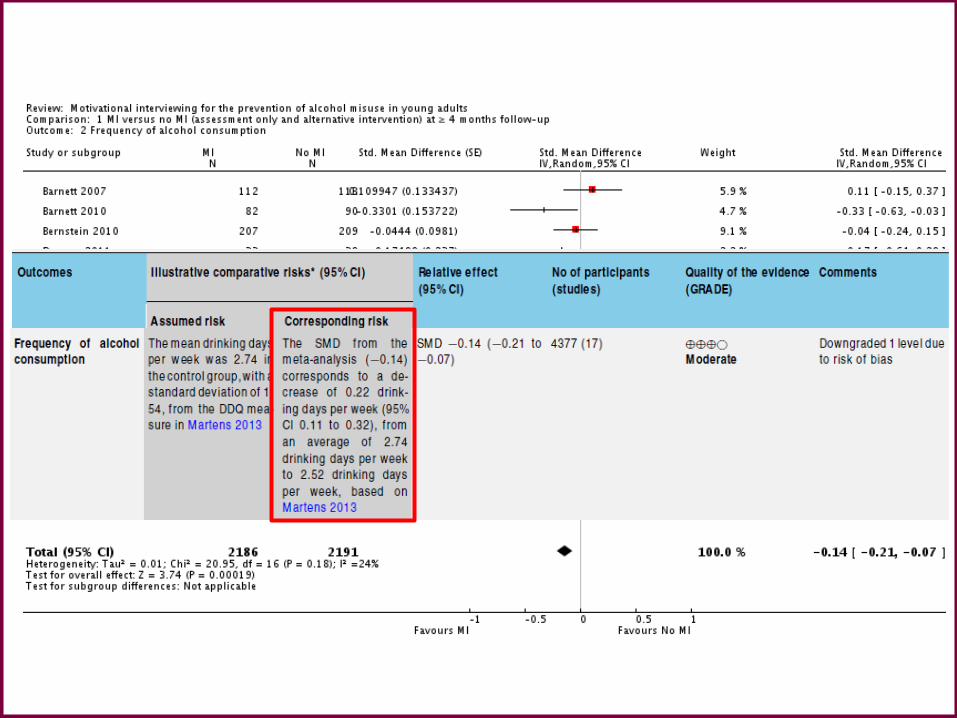
Motivational interviewing for the
prevention of alcohol misuse in young
adults
Cochrane Database of Systematic Reviews18 JUL 2016 DOI: 10.1002/14651858.CD007025.pub4http://onlinelibrary.wiley.com/doi/10.1002/14651858.CD007025.pub4/full#CD007025-fig-0002

Funnel plots for potential publication
bias


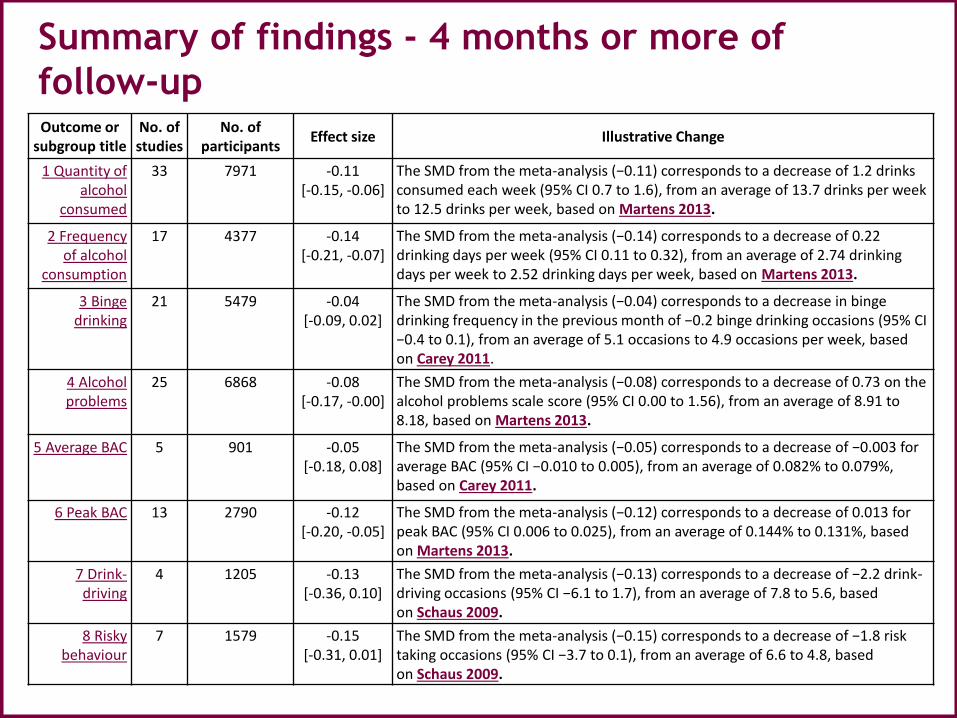
Summary of findings - 4 months or more of
follow-upOutcome or
subgroup titleNo. of studies
No. of participants
Effect size Illustrative Change
1 Quantity of alcohol
consumed
33 7971 -0.11 [-0.15, -0.06]
The SMD from the meta-analysis (−0.11) corresponds to a decrease of 1.2 drinks consumed each week (95% CI 0.7 to 1.6), from an average of 13.7 drinks per week to 12.5 drinks per week, based on Martens 2013.
2 Frequency of alcohol
consumption
17 4377 -0.14 [-0.21, -0.07]
The SMD from the meta-analysis (−0.14) corresponds to a decrease of 0.22 drinking days per week (95% CI 0.11 to 0.32), from an average of 2.74 drinking days per week to 2.52 drinking days per week, based on Martens 2013.
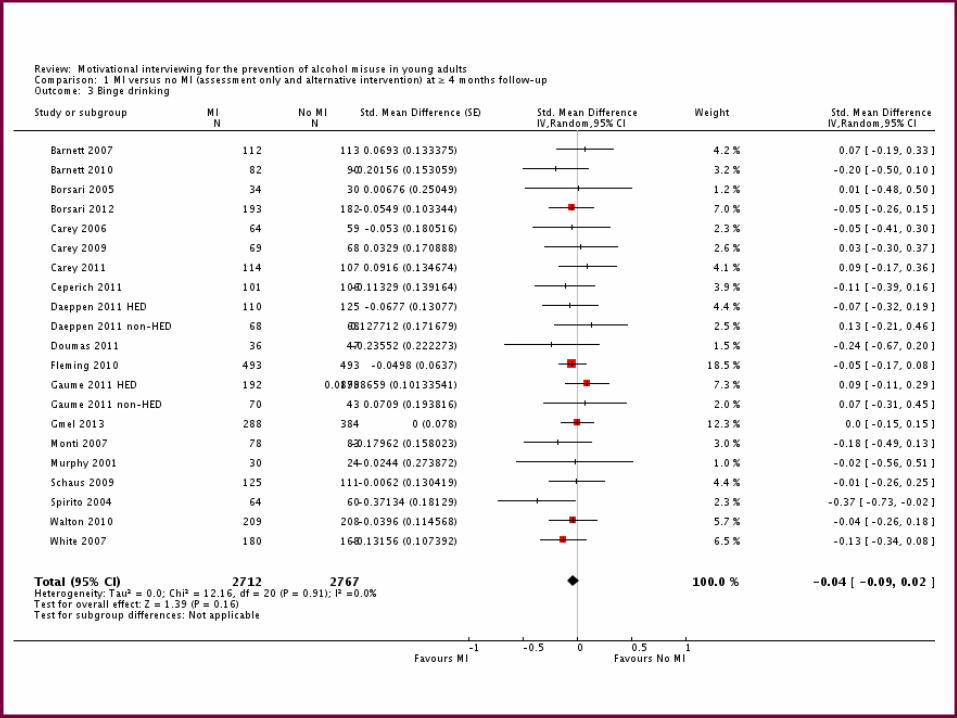
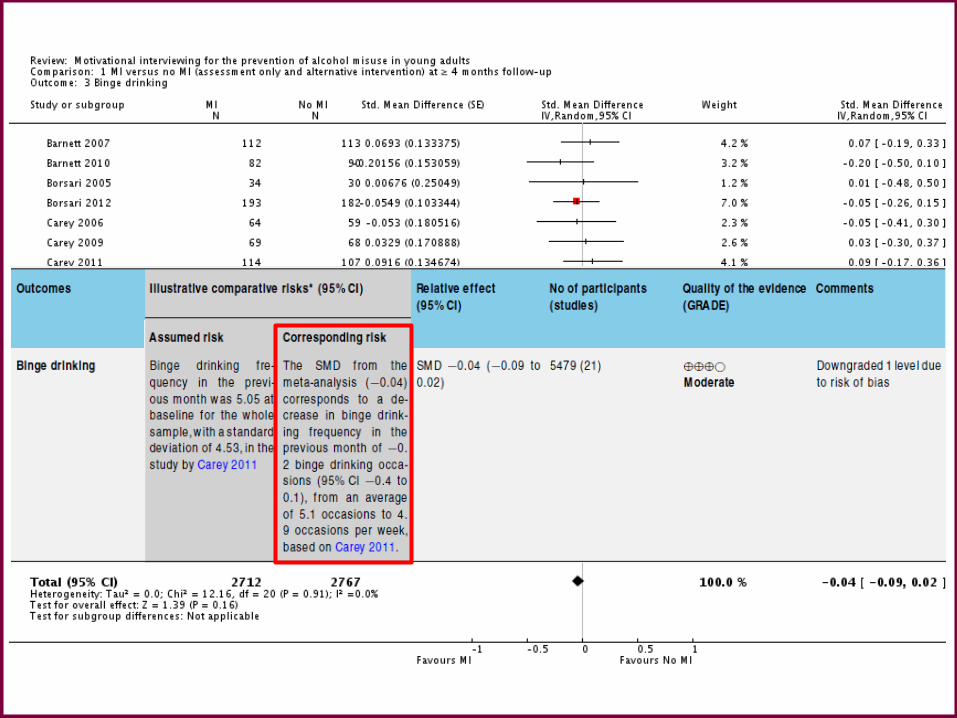
3 Binge drinking
21 5479 -0.04 [-0.09, 0.02]
The SMD from the meta-analysis (−0.04) corresponds to a decrease in binge drinking frequency in the previous month of −0.2 binge drinking occasions (95% CI −0.4 to 0.1), from an average of 5.1 occasions to 4.9 occasions per week, based on Carey 2011.
4 Alcohol problems
25 6868 -0.08 [-0.17, -0.00]
The SMD from the meta-analysis (−0.08) corresponds to a decrease of 0.73 on the alcohol problems scale score (95% CI 0.00 to 1.56), from an average of 8.91 to 8.18, based on Martens 2013.
5 Average BAC 5 901 -0.05 [-0.18, 0.08]
The SMD from the meta-analysis (−0.05) corresponds to a decrease of −0.003 for average BAC (95% CI −0.010 to 0.005), from an average of 0.082% to 0.079%, based on Carey 2011.
6 Peak BAC 13 2790 -0.12 [-0.20, -0.05]
The SMD from the meta-analysis (−0.12) corresponds to a decrease of 0.013 for peak BAC (95% CI 0.006 to 0.025), from an average of 0.144% to 0.131%, based on Martens 2013.
7 Drink-driving
4 1205 -0.13 [-0.36, 0.10]
The SMD from the meta-analysis (−0.13) corresponds to a decrease of −2.2 drink-driving occasions (95% CI −6.1 to 1.7), from an average of 7.8 to 5.6, based on Schaus 2009.
8 Risky behaviour
7 1579 -0.15 [-0.31, 0.01]
The SMD from the meta-analysis (−0.15) corresponds to a decrease of −1.8 risk taking occasions (95% CI −3.7 to 0.1), from an average of 6.6 to 4.8, based on Schaus 2009.
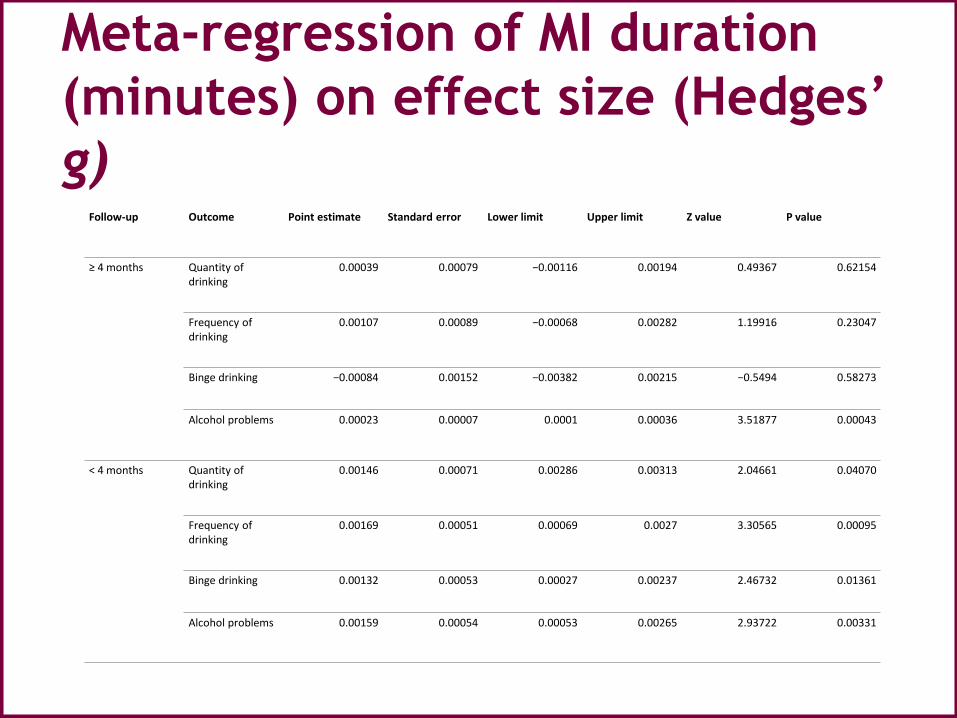
Meta-regression of MI duration
(minutes) on effect size (Hedges’
g)Follow-up Outcome Point estimate Standard error Lower limit Upper limit Z value P value
≥ 4 months Quantity of drinking
0.00039 0.00079 −0.00116 0.00194 0.49367 0.62154
Frequency of drinking
0.00107 0.00089 −0.00068 0.00282 1.19916 0.23047
Binge drinking −0.00084 0.00152 −0.00382 0.00215 −0.5494 0.58273
Alcohol problems 0.00023 0.00007 0.0001 0.00036 3.51877 0.00043
< 4 months Quantity of drinking
0.00146 0.00071 0.00286 0.00313 2.04661 0.04070
Frequency of drinking
0.00169 0.00051 0.00069 0.0027 3.30565 0.00095
Binge drinking 0.00132 0.00053 0.00027 0.00237 2.46732 0.01361
Alcohol problems 0.00159 0.00054 0.00053 0.00265 2.93722 0.00331

Meta-regression of MI duration
(minutes) on effect size (Hedges’
g)
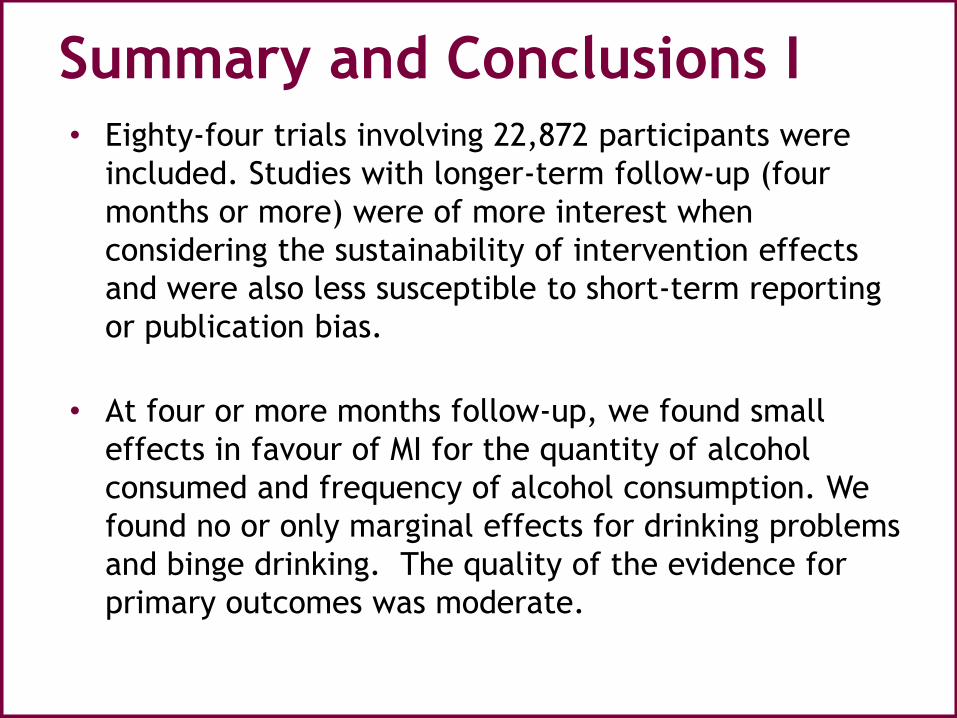
Summary and Conclusions I• Eighty-four trials involving 22,872 participants were
included. Studies with longer-term follow-up (four
months or more) were of more interest when
considering the sustainability of intervention effects
and were also less susceptible to short-term reporting
or publication bias.
• At four or more months follow-up, we found small
effects in favour of MI for the quantity of alcohol
consumed and frequency of alcohol consumption. We
found no or only marginal effects for drinking problems
and binge drinking. The quality of the evidence for
primary outcomes was moderate.

Summary and Conclusions II• Our interpretation of these results is that, although we
found some effects, the effect sizes are small and unlikely to
be of any meaningful benefit in practice. For example, we
estimate that for quantity of drinking at four or more
months, the SMD from the meta-analysis (−0.11) corresponds
(approximately) to an average decrease in the number of
drinks consumed each week from around 13.7 drinks/week
to 12.5 drinks/week.
• Similarly, for frequency of drinking at four or more months,
the SMD from the meta-analysis (−0.14) corresponds
(approximately) to an average decrease in the number of
days/week alcohol was consumed from 2.74 days to 2.52
days. For alcohol problems, the SMD from the meta-analysis
(−0.08) corresponds to a decrease in the alcohol problems
scale score (the 69-point RAPI scale was used by Martens
2013) from 8.91 to 8.18.
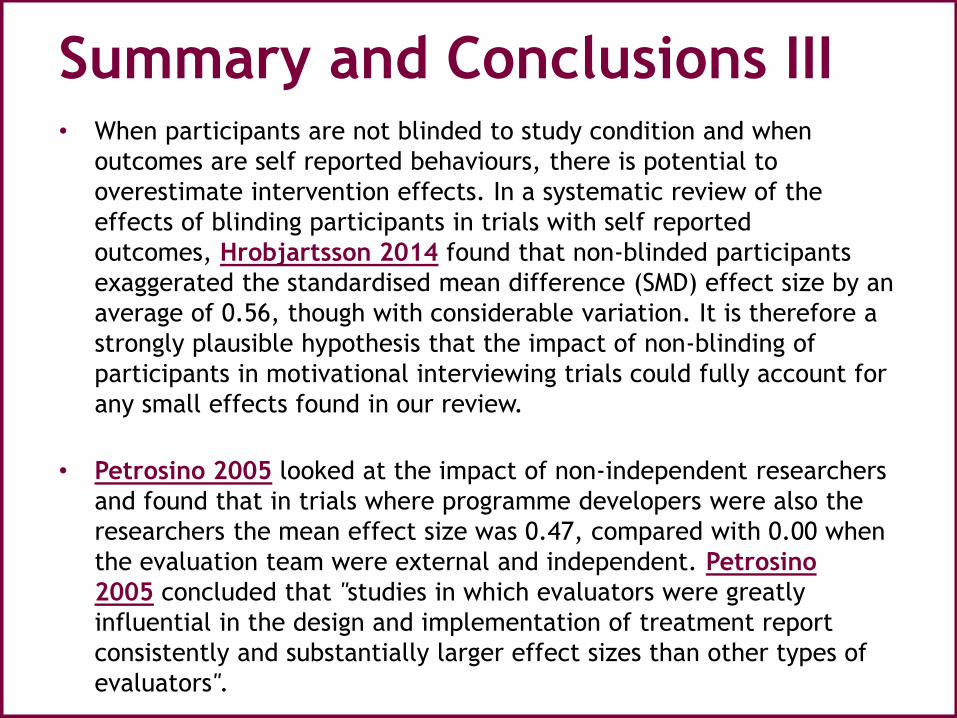
Summary and Conclusions III• When participants are not blinded to study condition and when
outcomes are self reported behaviours, there is potential to
overestimate intervention effects. In a systematic review of the
effects of blinding participants in trials with self reported
outcomes, Hrobjartsson 2014 found that non-blinded participants
exaggerated the standardised mean difference (SMD) effect size by an
average of 0.56, though with considerable variation. It is therefore a
strongly plausible hypothesis that the impact of non-blinding of
participants in motivational interviewing trials could fully account for
any small effects found in our review.
• Petrosino 2005 looked at the impact of non-independent researchers
and found that in trials where programme developers were also the
researchers the mean effect size was 0.47, compared with 0.00 when
the evaluation team were external and independent. Petrosino
2005 concluded that "studies in which evaluators were greatly
influential in the design and implementation of treatment report
consistently and substantially larger effect sizes than other types of
evaluators".

Summary and Conclusions IV• Further analyses showed that there was no clear
relationship between the duration of the MI
intervention (in minutes) and effect size. Subgroup
analyses revealed no clear subgroup effects on longer-
term outcomes (four or more months) for assessment
only versus alternative intervention controls; for
university/college versus other settings; or for higher
risk versus all/low risk students.
• We suggest that these achieved effect sizes would fall
short, by some margin, of a minimally important
clinical difference (MCID) if further research were to
identify an MCID for alcohol misuse in young adults.

Poll Question #4
The information presented today was
helpful
A.Strongly agree
B.Agree
C.Neutral
D.Disagree
E.Strongly disagree

What can I do now?
Visit the website; a repository of over 5,000+ quality-rated systematic reviews
related to the effectiveness of public health interventions. Health Evidence™ is
FREE to use.
Register to receive monthly tailored registry updates AND monthly newsletter to
keep you up to date on upcoming events and public health news.
Tell your colleagues about Health Evidence™: helping you use best evidence to
inform public health practice, program planning, and policy decisions!
Follow us @HealthEvidence on Twitter and receive daily public health review-
related Tweets, receive information about our monthly webinars, as well as
announcements and events relevant to public health.
Encourage your organization to use Health Evidence™ to search for and apply
quality-rated review level evidence to inform program planning and policy
decisions.
Contact us to suggest topics or provide feedback.
Poll Question #5
What are your next steps? [Check all
that apply]
A.Access the full text systematic review
B.Access the quality assessment for the
review on www.healthevidence.org
C.Consider using the evidence
D.Tell a colleague about the evidence

Thank you!
Contact us:
For a copy of the presentation please visit:
http://www.healthevidence.org/webinars.aspx
Related Documents