University of Montana University of Montana ScholarWorks at University of Montana ScholarWorks at University of Montana Graduate Student Theses, Dissertations, & Professional Papers Graduate School 2013 Motivation and Education: Performance, Commitment, and Motivation and Education: Performance, Commitment, and Satisfaction among Pharmacy Students Satisfaction among Pharmacy Students Michael Dustin King The University of Montana Follow this and additional works at: https://scholarworks.umt.edu/etd Let us know how access to this document benefits you. Recommended Citation Recommended Citation King, Michael Dustin, "Motivation and Education: Performance, Commitment, and Satisfaction among Pharmacy Students" (2013). Graduate Student Theses, Dissertations, & Professional Papers. 682. https://scholarworks.umt.edu/etd/682 This Thesis is brought to you for free and open access by the Graduate School at ScholarWorks at University of Montana. It has been accepted for inclusion in Graduate Student Theses, Dissertations, & Professional Papers by an authorized administrator of ScholarWorks at University of Montana. For more information, please contact [email protected].

Welcome message from author
This document is posted to help you gain knowledge. Please leave a comment to let me know what you think about it! Share it to your friends and learn new things together.
Transcript
University of Montana University of Montana
ScholarWorks at University of Montana ScholarWorks at University of Montana
Graduate Student Theses, Dissertations, & Professional Papers Graduate School
2013
Motivation and Education: Performance, Commitment, and Motivation and Education: Performance, Commitment, and
Satisfaction among Pharmacy Students Satisfaction among Pharmacy Students
Michael Dustin King The University of Montana
Follow this and additional works at: https://scholarworks.umt.edu/etd
Let us know how access to this document benefits you.
Recommended Citation Recommended Citation King, Michael Dustin, "Motivation and Education: Performance, Commitment, and Satisfaction among Pharmacy Students" (2013). Graduate Student Theses, Dissertations, & Professional Papers. 682. https://scholarworks.umt.edu/etd/682
This Thesis is brought to you for free and open access by the Graduate School at ScholarWorks at University of Montana. It has been accepted for inclusion in Graduate Student Theses, Dissertations, & Professional Papers by an authorized administrator of ScholarWorks at University of Montana. For more information, please contact [email protected].
MOTIVATION AND EDUCATION: PERFORMANCE, COMMITMENT, AND
SATISFACTION AMONG PHARMACY STUDENTS
By
MICHAEL DUSTIN KING
B.A., The University of Montana, Missoula, MT, 2011
Thesis
presented in partial fulfillment of the requirements
for the degree of
Master of Arts
in Sociology, Inequality and Social Justice
The University of Montana
Missoula, MT
Spring 2013
Approved by:
Sandy Ross, Dean of the Graduate School
Graduate School
Kathy J. Kuipers, Ph.D., Chair
Department of Sociology
Daisy Rooks, Ph.D.
Department of Sociology
Mark Cracolice, Ph.D.
Department of Chemistry and Biochemistry
ii
King, Michael, M.A., Spring 2013 Sociology
Motivation and Education: Performance, Commitment, and Satisfaction among Pharmacy
Students
Chairperson: Kathy J. Kuipers, Ph.D.
This study examines the relationship between academic motivation and three different
educational outcomes: academic performance, commitment, and satisfaction. This research
explores these relationships by focusing on pharmacy students at The University of Montana.
Pharmacy students tend to be driven by relatively high levels of external motivations (e.g.,
motivated by money or prestige), especially when compared to other health profession students.
In contrast to previous work that simply describes the motivations of students, I uncover the links
between motivation and various educational outcomes. This investigation contributes to a better
understanding of motivations and their impact on education, especially among the specific
population being studied.
Drawing upon self-determination theory, I argue that intrinsic or internal motivations will
be related to positive educational outcomes, while extrinsic or external motivations will be
related to negative educational outcomes. I used a survey to collect data from the entire
population of pharmacy students (from first-year pre-pharmacy students through fourth-year
pharmacy students) at The University of Montana during spring semester of 2013. I use ordinary
least squares regression to show the direction and extent of relationships between my variables.
Results show that motivation is related to the educational outcome variables included in this
study, although not in all cases and not always in the predicted direction. I found that internal
motivation is positively related to both overall academic commitment and academic satisfaction.
Additionally, I show that external motivation is negatively related to academic satisfaction, but
positively related to commitment. Finally, results indicate that neither internal nor external
motivations are significantly related to academic performance. I address the implications of these
findings for pharmacy students and pharmacy schools as well as suggest directions for future
research on the topic.
iii
ACKNOWLEDGEMENTS
I want to first recognize my committee as a whole and say that I was truly lucky to be
able to bring together three of the people I respect most at The University of Montana.
Individually, I am greatly in debt to Kathy Kuipers for agreeing to be my chair for this thesis.
Her patience and understanding through this entire process was greatly needed and always
appreciated. My methods and writing were heavily strengthened by Kathy’s expertise and her
influence is reflected throughout this entire thesis.
Second, I would like to thank Daisy Rooks, not only for her service on this committee,
but for her guidance and support throughout my time at UM. Whether it was about classes,
research, writing, graduate school applications, or whatever other issues I brought through her
door, Daisy always seemed to have the best ideas and feedback. This is something I can only
hope to emulate someday.
Third, Mark Cracolice deserves acknowledgement for far more than just being on this
committee. It is not often that a sociologist gets to thank a chemist, but I can honestly say that
during the last six years, Mark has fundamentally influenced my approach to thinking, learning,
and teaching. These skills not only served me well in the chemistry department, but have made
me a significantly stronger researcher and scholar.
I would also like to recognize the rest of the sociology department at UM for supplying
me the tools and skills necessary to complete this thesis. I would especially like to acknowledge
Dusten Hollist for providing numerous research opportunities, which have made my time at UM
all the more valuable. My fellow students in both the sociology and chemistry departments have
provided me countless hours of support and feedback, without which I could not have finished. I
especially want to thank Cassie Sheets for agreeing to read many long and boring drafts of this
thesis.
Finally, my friends and family have been incredibly supportive. I owe a lot of my sanity
to them, even if they still don’t really understand what sociology is.
iv
TABLE OF CONTENTS
Acknowledgements ................................................................................................................... iii
1. Introduction .............................................................................................................................1
2. Background and Literature ......................................................................................................5
Theoretical Background ...........................................................................................................5
Academic Motivation ..............................................................................................................9
Academic Motivation and Health Professions .................................................................... 10
Academic Performance .......................................................................................................... 13
Academic Commitment ......................................................................................................... 15
Academic Satisfaction ........................................................................................................... 17
3. Data and Measures ................................................................................................................ 20
Research Design .................................................................................................................... 20
Sample .................................................................................................................................. 21
Procedures for Survey Implementation .................................................................................. 22
Survey Instrument Design...................................................................................................... 25
Dependent Variable Measures ............................................................................................... 27
Independent Variable Measures ............................................................................................. 29
Control/Demographic Variables ............................................................................................ 30
Method of Analysis ............................................................................................................... 31
4. Analysis and Results ............................................................................................................. 32
Descriptive Measures by Year in School ................................................................................ 32
Hypotheses 1a & 1b: Regulation and Performance ................................................................. 34
Hypotheses 2a & 2b: Regulation and Commitment ................................................................ 36
Hypotheses 3a & 3b: Regulation and Satisfaction .................................................................. 44
Summary of Results............................................................................................................... 45
5. Discussion and Conclusion .................................................................................................... 47
Limitations and Future Research ............................................................................................ 51
Conclusion ............................................................................................................................ 54
Appendix A: Survey Instrument ................................................................................................ 57
Appendix B: Online Survey Communications ........................................................................... 59
References ................................................................................................................................ 61
1
1. INTRODUCTION
Nearly all people have their own, distinctly unique, motivations for their behavior.
Sometimes we can relate easily to other people because their motivations are in line with our
own. Other times, we can barely comprehend what drives the people around us. Education is one
realm where people vary greatly in their motivations. Some students go to school because there
is some sort of obligation or expectation that it is the proper thing for them to do. Others are
there because they believe it will help them obtain something they wouldn’t otherwise be able to
achieve (e.g., status, money, prestige). Some students are driven simply by their pleasure for
learning and exploring new topics. It is logical that these different types of students might have
systematically different approaches to and experiences in college.
Why do some students want to pursue a career in the health professions? Medical
students often talk about their motivations in terms of helping people or pursuing intellectual
interests in the sciences. Some studies have categorized the majority of medical students as
humanitarians (Reissman et al. 1960) or altruistic (Draper and Louw 2007), meaning they were
driven by a desire to help people. Similarly, studies of nursing students’ motivation have found
that those students commonly describe a desire to care for people or a desire to receive a broad
education (Bengtsson and Ohlsson 2010). Dentistry students are a little bit different in their
motivations. For instance, one study (Gallagher, Clarke, and Wilson 2008) found that dentistry
students still expressed a desire to help people, but were also partially drawn to the field because
of its combination of science, medicine, and art.
Compared to these other health profession students, pharmacy students stand out. In
response to questions about why they pursue a pharmacy career, my students have typically cited
motivations such as: ―I don’t want to be in school forever,‖ ―There are a lot of available jobs,‖ or
2
even, ―You don’t work very much and you make a lot of money.‖ While these might stand in
stark contrast to motivations of other health profession students, pharmacy students are not
necessarily wrong. According to the Bureau of Labor Statistics (BLS 2012), pharmacists can
expect to earn a median annual income of $111,570, or approximately $54 per hour.
Furthermore, the projected ten-year growth of pharmacy careers is expected to be 25%, which
translates into nearly 70,000 in employment changes (new jobs created, or old jobs opening up).
These numbers can be compared to an overall median annual income of only $33,840 for the
U.S. labor market and a job growth rate of only 14%. Thus, for students who are seeking
financial security or job availability upon graduation, the pharmacy profession is highly
appealing.
Compared to other health professions, pharmacy is also unique in its educational
requirements. Medicine, dentistry, and physical therapy each require a bachelor’s degree before
admission to their respective professional programs. Furthermore, medicine and dentistry both
require a minimum of four years of education after completion of a bachelor’s degree. This does
not even include the internships, residencies, and fellowships that can continue for up to eight
additional years, especially in advanced medical specialties (meaning it can take up to 16 years
of post-secondary training to become a highly specialized physician). Currently in the United
States, new pharmacists are required to have a professional doctorate to practice pharmacy. The
Doctor of Pharmacy (Pharm.D.) degree is awarded after four years of professional school and is
more akin to a J.D. (law), M.D. (medicine), or D.D.S. (dentistry) than it is to an academic
doctorate such as a Ph.D. or an Ed.D. However, pharmacy schools are unique in not requiring
incoming students to have a prior post-secondary degree. While it is common for students
beginning pharmacy school to have previously received a bachelor’s degree (or even an
3
advanced degree), students also have the option of spending their first two years of college
pursuing a pre-pharmacy curriculum that meets the prerequisites for admission to pharmacy
school. This means that many students pursue a pharmacy education immediately out of high
school and, within six years, graduate with a professional doctorate with no prior college degrees
required.
One crude way to compare these different health professions is to look at their earning
power per year of education. For instance, the BLS (2012) reported that primary care physicians
earn a median annual income of $202,392. At a minimum, these primary care doctors receive 11
years of post-secondary training before they are able to practice independently. Thus, for each
year of post-secondary education, primary care physicians can expect to earn an additional
$18,399. This can be compared to dentistry at $18,365 and physical therapy at $10,901.
Pharmacists, however top other health professions by making roughly $18,595 per year of post-
secondary education they receive. In terms of a simple cost-benefit analysis, pharmacy school
makes sense for many students, especially those who excel in the sciences.
It is important to note that the point of this thesis is not to suggest that pharmacists make
more than they deserve. In fact, pharmacists play a crucial, if often unseen, role in a patient’s
healthcare. Furthermore, the four years of their education that they spend in pharmacy school are
not easy (even the two years of pre-pharmacy curriculum involve some of the most rigorous
courses on a college campus). However, pharmacy school and the career of pharmacy do offer a
model through which we can explore a number of important questions. What role does
motivation play in a student’s education? Does it make a difference if students are driven by
personal interests and a desire to help people, or if they are driven by the expectations of high
4
salary and relatively easy work? Are there more important factors than a student’s academic
motivation when trying to predict educational outcomes?
Some research suggests that students who are driven by internal/personal reasons will
experience more positive educational outcomes (Gottfried 1982; Vallerand and Bissonnette
1992). Conversely, similar research suggests that people motivated by external forces (e.g.,
money, power, prestige) will experience more negative educational outcomes (Rascati 1989;
Vallerand and Bissonnette 1992). If motivation has such an important impact on educational
outcomes, we might be able to predict what makes ―good‖ students good. Furthermore, a better
understanding of students’ educational outcomes might be used to predict future experiences in
the profession, especially in terms of job commitment and satisfaction. This thesis examines
pharmacy students to explore these relationships and to try to answer the questions outlined
above. Additionally, this research goes beyond the scope and methodological limitations of past
studies by including participants from all levels of pharmacy education and doing more than just
describing the common motivations of pharmacy students. Specifically, this research examines
the relationships among academic motivation, performance, satisfaction, and commitment. The
following section provides a detailed theoretical background, an overview of prior literature on
academic motivation, and a statement of each of the hypotheses to be tested.
5
2. BACKGROUND AND LITERATURE
Theoretical Background
One of the most powerful theories used in studying motivations is self-determination
theory (SDT), originally developed by Deci and Ryan (1985). At its core, SDT is based upon the
idea of individuals making their own choices. Thus, SDT makes the critical distinction between
autonomous and controlled motivation. In autonomously motivated situations, individuals are
acting on their own volition. Conversely, controlled motivation refers to acts done in response to
forces that are external to the individual (Deci and Ryan 2008). Deci and Ryan suggest that
humans not only have the capacity for self-determined behavior, but that there is a fundamental
need for self-determination. This is particularly important because they suggest that there will be
an overarching trend toward more intrinsically motivated behavior because it is marked by
higher levels of choice and self-determination. In discussing this trend toward intrinsic behavior,
Deci and Ryan go beyond the intrinsic-extrinsic dichotomy that is commonly used and instead
propose a self-determination scale. This scale ranges from wholly internally regulated (intrinsic)
behavior on one end to wholly externally regulated (extrinsic) behavior on the other and will be
discussed in more detail below.
SDT’s utility is increased by its ability to be used in different situations. Deci and Ryan
(1985) and many others have discussed the application of SDT in the workplace and sports.
Gagné and Deci (2005) provided a historical review of workplace motivation theory and research
using SDT as an overarching framework. In general, the authors reported that workplaces where
autonomy support (a prerequisite for internal regulation) is made a priority by management,
worker satisfaction, organizational commitment, and positive work outcomes were noticeably
improved. Similarly, in their review of sport motivation research, Pelletier et al. (1995) identify
6
motivation as influencing persistence, positive emotions, and greater interests in and satisfaction
with sports.
However, SDT it is not limited to these realms. In fact, there is an extensive body of work
that has applied SDT to education (Baker 2004; Deci et al. 1991; Mitchell 2012; Williams et al.
1997; Williams, Saizow, and Ryan 1999). Overall, SDT suggests that internal regulation is
central to learning, growth, and intellectual challenge, which are some of the core components of
any education (Williams et al. 1997). Furthermore, and perhaps more importantly, SDT predicts
that the more internally regulated an individual is, the more positive his or her experiences in
various contexts (such as education) will be. Specifically, Vallerand and Bissonnette (1992)
discussed internal regulation’s positive effect on interest, creativity, cognitive flexibility, and
conceptual learning. Conversely, they argue, environments that produce externally regulated
individuals ―appear to be less positive both in terms of affect and performance‖ (Vallerand and
Bissonnette 1992:602).
As previously mentioned, SDT does not identify between intrinsic and extrinsic
motivation as two competing ideas. Instead, it identifies them as two different components of a
self-determination scale. In-between the two extremes exist motivations that are characterized by
a mixture of intrinsic and extrinsic motivations. Specifically, Deci and Ryan (1985) labeled four
different stages along the motivational continuum. In order of increasing self-determined
regulation, the stages are: external regulation, introjected regulation, identified regulation, and
internal regulation.
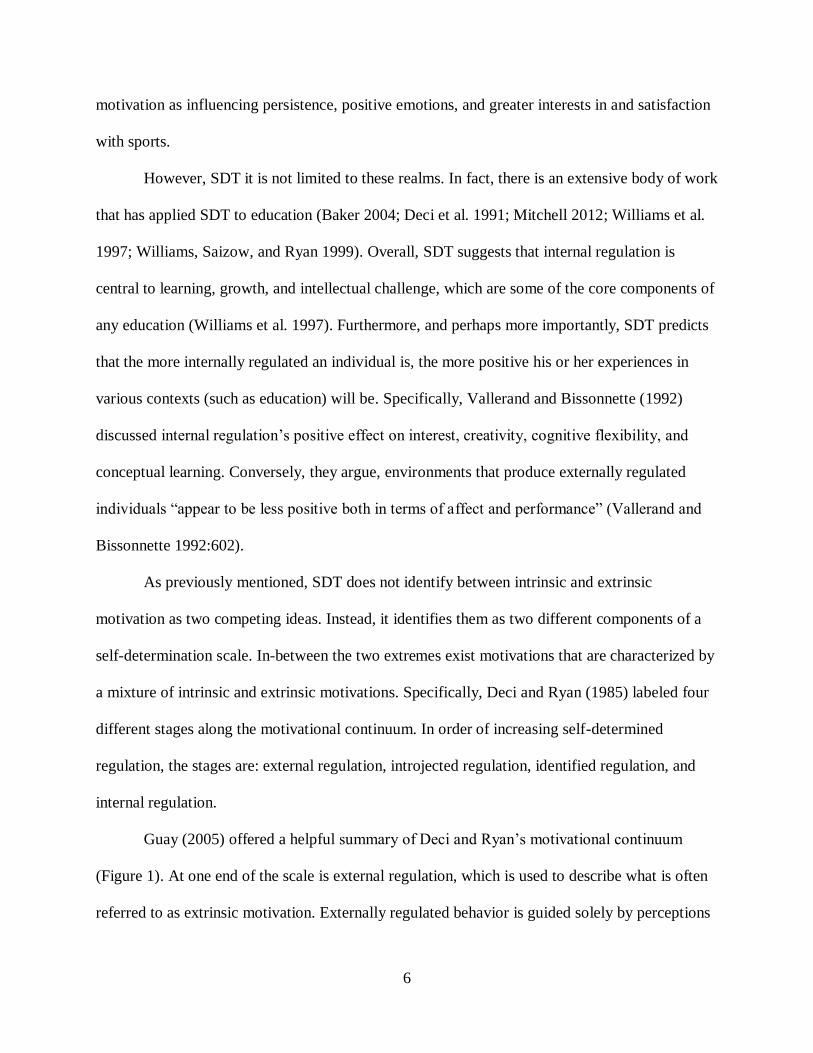
Guay (2005) offered a helpful summary of Deci and Ryan’s motivational continuum
(Figure 1). At one end of the scale is external regulation, which is used to describe what is often
referred to as extrinsic motivation. Externally regulated behavior is guided solely by perceptions
7
of rewards and constraints external to the individual. The next category, introjected regulation,
―refers to behaviors that are in part internalized by the person‖ (Guay 2005:79). These are closer
to wholly extrinsic motivations because they are only regulated by the internalization of some
external force. The most common forms of introjected regulation are shame and guilt (Deci and
Ryan 1985). The third category, identified regulation, is more similar to wholly intrinsic
motivation and ―refers to behaviors that are performed by choice because the individual judges
them to be important‖ (Guay 2005:79). Thus, adhering to social norms because of an internalized
belief in those norms (e.g., going to college because it will assist in getting a job) falls under the
category of identified motivation. The final category is internal regulation. Internal regulation is
what is commonly referred to as intrinsic motivation and comprises the ―innate, natural
propensity to engage one’s interests and exercise one’s capacities, and in so doing, to seek and
conquer optimal challenges‖ (Deci and Ryan 1985:43). In other words, internal regulation is
behind actions that individuals perform purely out of personal pleasure and/or satisfaction.
Figure 1. Self-Determination Theory
Beyond the categorizations described above, individual researchers often choose to group
certain categories together in different ways (summarized above in Figure 1). For instance, some
research focuses on the distinction between autonomous and controlled motivation. In this
conceptualization, internal and identified regulation are grouped together and characterized by a
8
relatively high level of autonomy. Similarly, introjected and external regulation are grouped
together and characterized by less autonomy and more external control. Other researchers choose
to take a more historical approach by using the intrinsic/extrinsic distinctions. In this conception,
the only true form of intrinsic motivation is internal regulation. Identified, introjected, and
external regulation are each characterized by some level of external influence and are grouped
under the category of extrinsic motivation. There is one final category of motivation posited by
SDT—amotivation. As represented in Figure 1, amotivation is separated from the rest of the self-
determination continuum as being neither autonomous or controlled, nor intrinsic or extrinsic.
Instead, ―individuals are amotivated when they perceive a lack of contingency between their
behavior and outcomes‖ (Vallerand and Bissonnette 1992:602). In an effort to be consistent, the
rest of this thesis will use Deci and Ryan’s language of internally and externally regulated
behavior instead of the more ambiguous intrinsic and extrinsic motivations or autonomous and
controlled motivations.
Finally, this thesis focuses on the extremes of the SDT continuum because I believe they
best represent what is commonly seen in pharmacy students. While introjected and identified
regulation are undoubtedly important, in my experiences, pharmacy students express such
motivations much less frequently. For instance, they are much less likely to admit pursuing a
pharmacy education out of guilt or to please somebody (as would be consistent with introjected
regulation), or because they believe it is important to go to college (as would be consistent with
identified regulation). Instead, they commonly cite expectations of future rewards or they express
internal interests and satisfaction with the field or related disciplines. It is important to note that I
am not trying to reduce SDT back to the base intrinsic-extrinsic dichotomy, but simply direct this
research toward the most commonly voiced motivations of pharmacy students.
9
Academic Motivation
As already stated, SDT theory has been applied to many different contexts. In support of
the theory, a number of scales have been developed to measure motivation across different
situations. Of particular interest to this study is the Academic Motivation Scale (AMS)
developed by Vallerand et al. (1992). The scale, originally developed in French, has since been
translated and used widely in studying student motivation. The instrument asks respondents to
indicate how well certain statements describe their academic motivations, which are then
translated into measures of different motivational types as described by SDT.
The AMS has not only been used extensively, but has been validated by a number of
researchers (Cokley et al. 2001; Fairchild et al. 2005; Vallerand and Bissonnette 1992). Even
since its translation into English, the AMS has largely been used in Canadian research. However,
Cokley et al. (2001) and Fairchild et al. (2005) both made a concerted effort to test the validity of
the AMS in the United States. In each study, researchers found support for the original factor
structure proposed by Vallerand et al. (1992). However, both American studies suggested
caution must be used in making comparisons between U.S. and Canadian populations and
interpreting U.S. results, in general. This is not to say that the AMS should not be used with a
U.S. population, but this limitation should be addressed when interpreting and discussing the
results.
It is also important to note that SDT is not the only framework available to study
motivation (see Perrot et al. 2001 for a short review of other motivational theories). Next to SDT,
the most common motivational conception is based on the work of Dweck (1986) and Archer
(1994). In their achievement motivation theory, performance oriented individuals seek to
demonstrate competence or ability in exchange for praise or rewards. Conversely, mastery
10
orientated individuals’ actions are directed more towards demonstrating comprehension and
competence (Perrot et al. 2001). Despite differences in phrasing (and complexity of the theories),
Archer and Dweck’s conception of motivation is not entirely incompatible with SDT. Perrot et
al. (2001) even go as far as to suggest that performance and mastery orientations are simply
different conceptualizations of SDT’s controlled and autonomous motivations, respectively.
While achievement motivation theory provides a compelling alternative, its differences from
SDT, especially as they relate to this thesis, are not significant enough to warrant using it as a
framework instead of SDT. Furthermore, since previous researchers have dismissed SDT in
favor of achievement motivation theory because of their similarities (Perrot et al. 2001), there is
no reason to believe one theory should be used in favor of the other.
Academic Motivation and Health Professions
Much of the research using SDT has focused on secondary education or general college
education (Baker 2004; Cokley et al. 2001; Lavigne, Vallerand, and Miquelon 2007; Lin,
McKeachie, and Kim 2001). While a substantial body of research has also examined various
health profession students and their motivations, for the most part, SDT has not been used
extensively in studying those students. For instance, in one study of Israeli nursing students,
researchers found that the lack of interest in the career was because it is not a particularly
financially rewarding, respected or powerful position (Ben Natan and Becker 2010). In a
separate study of Swedish nursing students, researchers found that students commonly reported
an interest in caring for people and a desire for ―broad and deep learning‖ (Bengtsson and
Ohlsson 2010:154). Additionally, Bengtsson and Ohlsson found that both medical and nursing
students reported intrinsic factors to be the most important for their learning.
11
The field of dentistry has also been the subject of a small body of research on student
motivation. Gallagher and colleagues (2008) qualitatively examined the reasons students in the
United Kingdom choose to pursue a dentistry education. Overall, the researchers found similar
motivations as other studies of dental students including a desire for higher status, financial
benefits, job security, job flexibility, and job independence. However, the researchers also
discovered that their sample was more likely to report quality of life factors as being important in
their career choice. Whether this finding was applicable only to their participants, their school,
dental students in general, or all health profession students is still unclear.
Finally, the field of medicine has also been the subject of motivation research. In one of
the most comprehensive motivation studies of health profession students, Perrot et al. (2001)
sought to measure motivation among medical, nursing, and pharmacy students. Instead of SDT,
this study chose to use Archer’s achievement motivation theory described earlier. This study
yielded a number of noteworthy findings. First, the authors reported differences in each of the
three groups studied in terms of motivation. While researchers found that at least half of each
group had a mastery orientation (the rough equivalent of internal regulation in SDT), the
pharmacy sample had the smallest proportion of mastery oriented students (50%). Furthermore,
pharmacy students were the most likely group to exhibit performance orientation (42% of
students). While Perrot and her colleagues did not attempt to directly measure any impacts of
these motivations, they did simultaneously measure preferred learning strategies among students.
While broad, deep (metacognitive) learning strategies were overwhelmingly preferred among all
types of students, pharmacy students were the most likely group to report a preference for non-
cognitive learning strategies. Based on this research, there is no way to infer a causal
relationship, but the connection between students’ motivation and preferred learning strategy is
12
noteworthy, nonetheless. Finally, the authors note the tendency for health profession students’
motivations to change over time. Because of this, it is particularly important to avoid a snapshot
of one small group of students at one period in time.
In addition to the combined study of health profession students, pharmacy student
motivation has been the subject of some targeted research. Hastings and colleagues used
Archer’s achievement motivation theory to explore how pharmacy students’ motivations
changed over the course of the professional program. Overall, they found a noticeable decrease
in mastery orientation (arguably Archer’s equivalent of internal regulation) over the course of the
pharmacy curriculum (Hastings et al. 2001; Hastings, West, Hong 2005). In this shift away from
mastery orientation, students were significantly more likely to care only about passing the class
and significantly less likely to choose a difficult assignment where mistakes were expected, but
meaningful learning was greater (Hastings et al. 2001).
In discussing the factors that influence student’s choice to pursue a pharmacy education,
Keshishian et al. (2010) provide a brief historical overview of pharmacy education research. As
early as 1963, pharmacy students were shown to overwhelminghly choose their educational path
for practical reasons such as a desire to earn a high salary. This desire for a high salary has been
persistent throughout decades of research on pharmacy student motivation. At various times in
the past fifty years, earning potential has also been joined by desires for job security,
occupational prestige, career flexibility, and helping people.
In a separate, qualitative study of pharmacy students’ experiences, the certainty of
obtaining a job after graduation was one of the most common motivations discussed by
respondents (Taylor and Harding 2007). Beyond job security, Taylor and Harding also
discovered two unconventional motivations for pursuing a pharmacy education. First, they found
13
that pharmacy was a second choice for many students in their study. In fact, students who had
failed to successfully enter medical or dental school often settled for pharmacy school as a
relatively similar option. Finally, students often discussed family tradition when discussing their
motivations. Instead of reasons more salient to the individual, participants often cited family
members’ careers in pharmacy as being influential in their own choices.
Despite prior research examining pharmacy student motivation, there are still a number
of unanswered questions. First, most studies up to this point have been simply descriptive in
nature. Instead of looking at the impact of motivation on a student’s education, researchers have
opted to describe the most common motivations. Another limitation of existing research on
pharmacy student motivation is the relatively narrow scope of past studies. Some studies have
focused solely on undergraduates (Keshishian et al. 2010), while others have focused on a single
year of the professional program (Hastings et al. 2001). These not only limit the number of
respondents available, but limit any direct comparisons between pre-pharmacy and pharmacy
students as well as differences between years within each of those groups. Finally, those
researchers who have used any sort of theoretical framework have largely overlooked SDT. SDT
is particularly useful in researching this population, especially because of the long-standing
evidence that pharmacy students are commonly motivated by expectations of money and
prestige. Archer’s achievement motivation theory, while powerful in its own way, does not place
as much of an emphasis on the impact of external influences as SDT.
Academic Performance
Academic performance is a heavily studied topic. Historically, the most common
measure of academic performance has been grade point average (GPA). GPA is a composite
score based on numerical assignments to letter grades. For instance, an A grade generally is
14
equivalent to 4.0 GPA points. These points are then weighted by the credits a student is taking.
Thus, four or five credit courses weigh more heavily on the GPA calculation than one or two
credit courses. Within academic performance studies, research concerning GPA and its
predictive power are very common (Allen and Bond 2001; Kuncel et al. 2005; Latif and Stull
2001). One of the reasons GPA is such a heavily studied topic is because it is commonly used to
predict future performance by graduate and professional schools as well as potential employers.
It is also commonly used as a performance measure because the uniformity of the score and its
ability to be used to compare different students. At most universities, GPA is measured on a 4.0
scale, so relative comparisons between disciplines, programs, and schools can be made.
The relationship between student motivation and academic performance is also a heavily
studied subject (Baker 2004; Gottfried 1982; Lin et al. 2001). For instance, Gottfried (1982)
found that individual students’ levels of internal regulation often vary across different subjects.
Furthermore, students who were internally regulated in certain subjects showed higher
achievement in those subjects. Different kinds of motivation are not completely incompatible,
either. In fact, Lin et al. (2001) found that having some level of external regulation in addition to
high levels of internal regulation leads to higher grades in school. Not all studies have found a
relationship between motivation and academic performance, though. Despite expectations
otherwise, Cokley et al. (2001) found that GPA was not significantly correlated with internal
regulation. Additionally, Baker (2004) found that there were no relationships between any kind
of motivation and academic performance.
Even though many researchers have studied this relationship, there is still no definitive
conclusion about the connection between motivation and academic performance. Furthermore,
no studies have specifically used SDT to examine the interaction between motivation and
15
academic performance among pharmacy students. Despite inconclusive prior research, SDT does
predict that higher levels of internal regulation should be linked to better educational outcomes
and higher levels of learning. If this is true, high internal regulation should translate directly into
better performance in school. Similarly, because external regulation has been tied to negative
educational experiences, it follows that those who are highly externally regulated will not
perform as well as those who are more internally regulated. Regarding academic performance,
the following hypotheses will be tested:
H1a: Students who exhibit high levels of internal regulation will have higher levels of
academic performance.
H1b: Students who exhibit high levels of external regulation will have lower levels of
academic performance.
Academic Commitment
Commitment is a particularly salient topic in education right now. In the most recent
numbers available from The University of Montana, only 21.7% of incoming freshmen
graduated within four years. This number is substantially improved if the time period is
lengthened to six years (47.8%), but still disturbingly low (The University of Montana 2012).
Better understanding student commitment may be helpful in introducing and implementing
programs to help improve graduation rates at UM and beyond.
Commitment is also a complex and multidimensional construct. Like motivation, it has
been studied in a variety of settings from the workplace to the family. Surprisingly, not much
work has been done on commitment in an academic context. Some studies have examined the
closely related concept of persistence in education (Lavigne et al. 2007; Vallerand, Fortier, and
Guay 1997) and self-reported commitment to finishing college (Woosley and Shepler 2011).
16
Vallerand et al. (1997) used SDT as a model in their examination of drop-out behavior in high
school and found dropouts were much more likely to exhibit lower levels of internal regulation.
Until relatively recently, though, a comprehensive examination of academic commitment had not
been attempted. Hellman and Williams-Miller (2005) reviewed previous attempts to measure and
study commitment in education with the ultimate goal of developing an educational commitment
scale. What they found is that research has traditionally focused on social and academic
integration as a means to improve commitment. More recently, research has suggested
commitment is more complicated than being committed or not. And while some studies have
explored commitment from a multidimensional perspective, Hellman and Williams-Miller
(2005) argue that prior conceptualizations of commitment were not complete enough nor
substantially built upon theory.
In the development of their own commitment measure, Hellman and Williams-Miller
argue that educational commitment is a multidimensional construct consisting of three different
kinds of commitment: continuance commitment, affective commitment, and normative
commitment. Continuance commitment refers to the likelihood that students will continue to
pursue their education. In its most basic form, it is based on the availability of viable alternatives
and the cost-benefit analyses that are made when deciding between continuing an education and
choosing an alternative. Affective commitment refers to the emotional bond that develops
between an individual and his or her educational institution. Affective commitment is built upon
identity theory and is influenced by how well a student identifies with his or her institution. The
more students identify with their institutions, the more committed they will be to maintaining
those connections. Finally, normative commitment refers to the ―sense of obligation and
conformity to what is valued by one’s referent group‖ (Hellman and Williams-Miller 2005:23).
17
In other words, normative commitment is related to pleasing the individuals closest to you or
trying to meet other’s expectations. Taken together, all three sub-dimensions can be used as a
general measure of academic commitment.
Despite the body of literature that examines academic commitment, there are no studies
that explore a direct relationship between student motivation and general commitment. Through
a combination of SDT and Hellman and Williams-Miller’s commitment ideas, I will directly
examine these two variables. Furthermore, little research has looked at academic commitment in
pharmacy programs. It is worth noting, however, that in terms of career commitment, one study
found that pharmacy students who indicated a desire to earn a high salary had lower commitment
scores than other students (Rascati 1989). This finding, paired with the link between persistence
and internal regulation (Vallerand et al. 1997) suggest a relationship between academic
motivation and academic commitment. Extrapolating from prior research, it is reasonable to
predict that students who are internally regulated will have greater overall commitment to their
education. Conversely, higher levels of external regulation may lead to lower levels of
commitment in the immediate setting (as opposed to commitment toward reaching an end goal).
Regarding academic commitment, the following hypotheses will be tested:
H2a: Students who exhibit high levels of internal regulation will have higher levels of
academic commitment.
H2b: Students who exhibit high levels of external regulation will have lower levels of
academic commitment.
Academic Satisfaction
Like commitment, satisfaction is a difficult idea to conceptualize. Especially for
education, satisfaction encompasses a large variety of components. Because of this, there is little
18
research that has specifically examined students’ satisfaction with their education. Some research
(Lo 2010) has approached student satisfaction by studying it at the classroom level, specifically
regarding satisfaction with instructors and course policies. Perhaps the most widespread measure
of student satisfaction comes from end-of-term teaching evaluations. It is not uncommon for
students to express satisfaction (or dissatisfaction) with more than just the instructor and the
course on these evaluations, though. Other topics that emerge from teaching evaluations include
perceptions of administration, complaints about university policies, and even commentary on the
physical learning environment (e.g., room, furniture, etc.).
Because so many factors can influence student satisfaction, it is important to approach the
topic systematically and at a more holistic level. Some of the first researchers to attempt this
were Clemes, Gan, and Kao (2008), who examined student satisfaction from a service quality
perspective. Drawing heavily from marketing research, they identified a number of different
components that influence overall academic satisfaction including perceptions of teaching
quality, evaluations of the physical education facilities, and perceptions of personal gain as a
result of education. They argue that these three components make up perceptions of the quality
of a given service (in this case, education), which is then directly related to overall satisfaction.
Dating as far back as the 1960s, internally regulated behaviors have been shown to
increase levels of employee satisfaction (Saleh and Hyde 1969). As with commitment, though,
there appears to be a void in current research regarding the relationship between student
motivation and academic satisfaction. Following Deci and Ryan (1985), the more internally
regulated students are, the more positively they should view their academic experiences. While
there appears to be no direct examination of this relationship in education, motivation has long
been tied to employee satisfaction with work. A similar relationship can be predicted for students
19
and their overall satisfaction with school. Regarding academic satisfaction, the following
hypotheses will be tested:
H3a: Students who exhibit high levels of internal regulation will have higher levels of
academic satisfaction.
H3b: Students who exhibit high levels of external regulation will have lower levels of
academic satisfaction.
In the following section, I provide a detailed outline of the research methods used to test
these hypotheses, including information about participants, survey design and implementation,
and variable creation.
20
3. DATA AND MEASURES
Research Design
In order to test each of the hypotheses presented above, I employed a survey design. A
survey allowed for a large number of participants to be reached relatively easily. Furthermore,
surveys allow for consistency and comparability between individual participants. Survey
respondents consisted of students at all levels of pharmacy education at The University of
Montana. As discussed earlier, this includes students who are enrolled in the two-year pre-
pharmacy curriculum and those who have shown an interest in pursuing pharmacy as a career.
Additionally, it includes students who have enrolled in the four-year professional pharmacy
program.
I used two different survey methods for this project—paper-and-pencil surveys and an
online survey. Each version asked the exact same questions in the same order. The paper
versions of the survey were distributed to students in the first five years of the six-year pharmacy
curriculum during regularly scheduled courses. Because the final year of pharmacy education
involves clinical rotations at various sites in and around Montana, it is impossible to locate all of
the students as they move from one location to another. Thus, I designed an online version of the
survey and distributed it to those students.
Before I distributed the survey to the entire body of student respondents, it was pre-tested
by ten students. Using feedback from these pre-tests, I made minor revisions to make the survey
more cohesive and understandable. I also received institutional review board approval for the
research and permission from the assistant dean of the pharmacy school to distribute the survey
prior to data collection. Data collection took place during the first month of the Spring 2013
semester.
21
Sample
To provide a comprehensive picture of pharmacy education, it was necessary to survey
students at all levels of pharmacy education. The traditional pharmacy education model is a six-
year, post-secondary program that culminates in the Pharm.D. degree. The first two years are
commonly referred to as pre-pharmacy, during which students are still considered
undergraduates. Coursework involves a series of preparation courses including general and
organic chemistry, physics, biology, social science, and others. Sometime during their second
year in the pre-pharmacy program, students apply to the professional program. Upon acceptance
into the professional pharmacy program, students spend their first three years as a cohort taking
courses on campus. The final year of the professional program involves no on-campus
coursework. Instead, students complete nine months of clinical rotations at various clinical sites
in the region.
I identified a total of six courses to survey in order to capture nearly all students pursuing
a pharmacy education. Introductory courses in general and organic chemistry were identified as
the best way to reach pre-pharmacy students. Because all pre-pharmacy students are required to
take these courses, and only one section of each course is offered per semester, it is reasonable to
assume that all pre-pharmacy students will be enrolled in either general or organic chemistry. In
the spring semester, both the first and second semester of general chemistry are offered and were
both included in my sampling. In order to capture students in their first three years of
professional pharmacy school, I identified one course per year in which all students from that
year were enrolled. This included two pharmacy practice courses and one pharmacy ethics
course. Finding courses in which all students of a given cohort took together streamlined the data
22
collection process and limited the amount of time I was interrupting regularly scheduled
coursework.
For these first five years of pharmacy education (the two years of pre-pharmacy and the
first three years of professional school), I contacted individual professors and introduced them to
the project. Upon obtaining permission to distribute surveys in their classes, I scheduled time to
visit their courses during the first week of the spring semester. Nearly all faculty members who
were contacted were open to the idea and supportive of my data collection.
As mentioned above, the final year of professional school posed a problem because
students do not attend regularly scheduled courses on campus. Geographically, they are widely
dispersed across the region taking part in clinical rotations. Unlike distributing the survey in a
classroom, I could not easily speak to the entire group to explain the research and directly hand
out surveys. Instead, I received support from the pharmacy school to send out an email on my
behalf explaining the research and providing students with a link to the online version of the
survey.
Procedures for Survey Implementation
I distributed surveys during single visits to each of the courses identified above. In order
to obtain a higher response rate, surveys were completed as soon as they were handed out and
immediately collected by myself or an assistant. The three pre-pharmacy courses that I surveyed
posed somewhat of a problem during data collection. Because they are general survey courses,
not all students taking the courses are pre-pharmacy students. The courses surveyed are also
required for chemistry majors, pre-medicine students, and other pre-health profession students.
To account for this, I created a slightly more generic version of the paper-and-pencil survey. I
made only minor changes that consisted mostly of replacing pharmacy student and pharmacy
23
education with college student and college education, respectively. This allowed me to distribute
the survey to everybody in these general courses. Ultimately, I excluded respondents who
indicated that they were not pre-pharmacy students from the final analysis.
I distributed the paper version of the survey to approximately 600 students. Of these, 323
indicated that they were pre-pharmacy or pharmacy students. There are a few issues that may
have influenced the total number of completed surveys returned to me and the representativeness
of the sample. First, on any given day of my data collection, there were probably a number of
potential respondents who were not in attendance. The number of these students was probably
relatively small, especially considering I collected the data during the first week of the semester
when students tend to have good attendance records. A second problem with representativeness
stems from students simply choosing not to fill out a survey. As is common practice with
surveys, I informed students that their participation was completely voluntary and they had no
obligation to complete the survey. I attempted to mitigate students choosing not to complete the
survey by being present for data collection instead of distributing the surveys and returning to
collect them later or having students return them to me via mail. One final problem influencing
response rates and representativeness is unique to the pre-pharmacy students. Many students in
the courses I chose to survey may not have identified explicitly as a pre-pharmacy students, even
though pharmacy is a career they are seriously considering. This means that those students may
not be included in the analysis.
I distributed the online version of the questionnaire to the entire fourth-year professional
student cohort—a group of 64 students. Because online surveys have a lower response rate than
in-person surveys, I took further steps to increase the response rate. Specifically, I followed up
with students who received the original survey link via email from the pharmacy school to
24
encourage them to complete the survey if they hadn’t already. The first reminder was sent out
through the fourth-year pharmacy students’ Facebook page with the help from the page
administrator. This was easier than asking the pharmacy school to send out a reminder email on
my behalf or requesting student email addresses from the pharmacy school so I could send out a
reminder. Furthermore, given the popularity of social networking sites, it was likely that a
reminder sent through Facebook would be just as effective in reaching students (if not more so)
than a reminder sent via email. However, the Facebook reminder only produced results for three
additional respondents. Instead of sending out another reminder via Facebook, I contacted an
administrative assistant in the pharmacy school who agreed to send out a final reminder on my
behalf. This final reminder produced an additional 12 responses. Copies of the original contact
email and each of these follow-up reminders for the online survey can be seen in Appendix B.
In the cover letter of the survey, students were ensured that their confidentiality would be
maintained. This was achieved primarily by not asking any potentially identifying information in
the survey. However, I also took further steps to ensure confidentiality including explicitly
asking respondents to not write their names on their surveys and collecting the surveys as soon as
students finished.
Unfortunately, response rates for this project are difficult to calculate, especially for the
two pre-pharmacy years. On the whole, the university does not keep comprehensive records on
pre-pharmacy students. There is, in fact, no requirement that students declare as pre-pharmacy to
later be accepted by the professional program. Because of this, it is difficult to say exactly how
many pre-pharmacy students potentially could have filled out the survey and compare it to how
many actually did. A total of 370 surveys were filled out by students in the pre-pharmacy classes
I surveyed out of a total enrollment of 456. As mentioned above, though, only a fraction of those
25
students who filled out a survey in these courses were pre-pharmacy students. Additionally, a
small number of students were in more than one of the courses I surveyed, further complicating
the calculation of response rates. In the end, the number of pharmacy surveys that I collected is
the most meaningful number. The exact numbers of pre-pharmacy surveys filled out by first- and
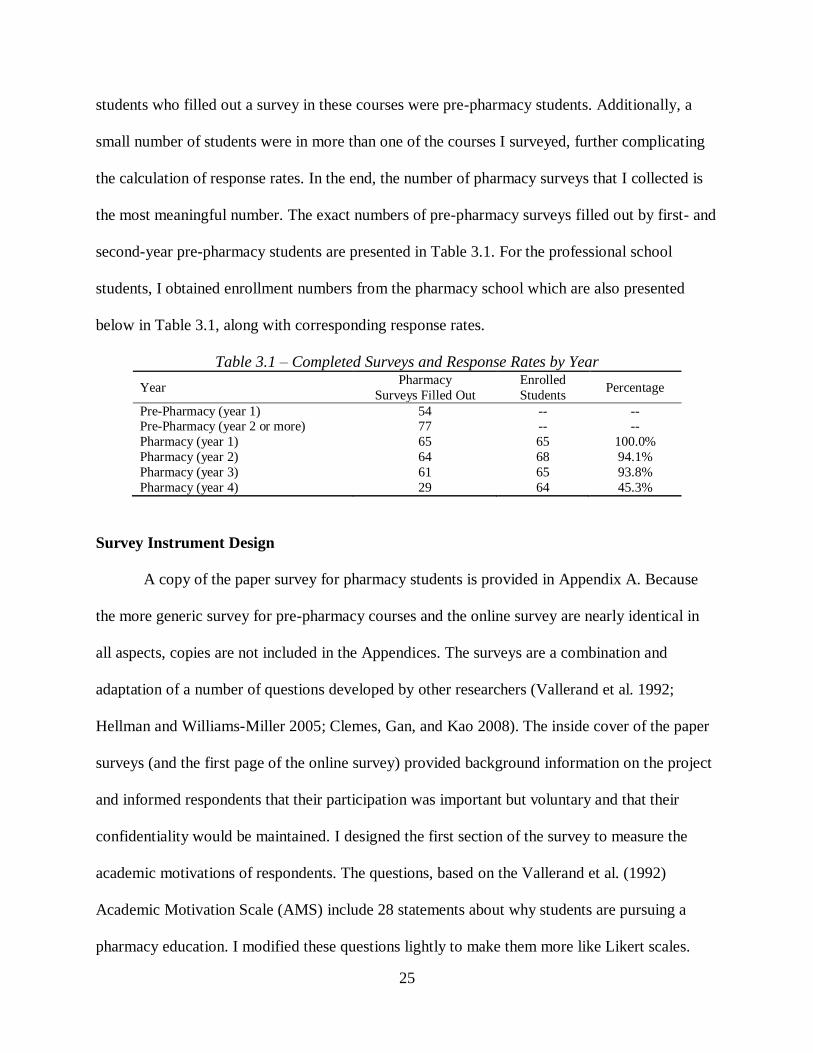
second-year pre-pharmacy students are presented in Table 3.1. For the professional school
students, I obtained enrollment numbers from the pharmacy school which are also presented
below in Table 3.1, along with corresponding response rates.
Table 3.1 – Completed Surveys and Response Rates by Year
Year Pharmacy
Surveys Filled Out
Enrolled
Students Percentage
Pre-Pharmacy (year 1) 54 -- -- Pre-Pharmacy (year 2 or more) 77 -- --
Pharmacy (year 1) 65 65 100.0%
Pharmacy (year 2) 64 68 94.1%
Pharmacy (year 3) 61 65 93.8%
Pharmacy (year 4) 29 64 45.3%
Survey Instrument Design
A copy of the paper survey for pharmacy students is provided in Appendix A. Because
the more generic survey for pre-pharmacy courses and the online survey are nearly identical in
all aspects, copies are not included in the Appendices. The surveys are a combination and
adaptation of a number of questions developed by other researchers (Vallerand et al. 1992;
Hellman and Williams-Miller 2005; Clemes, Gan, and Kao 2008). The inside cover of the paper
surveys (and the first page of the online survey) provided background information on the project
and informed respondents that their participation was important but voluntary and that their
confidentiality would be maintained. I designed the first section of the survey to measure the
academic motivations of respondents. The questions, based on the Vallerand et al. (1992)
Academic Motivation Scale (AMS) include 28 statements about why students are pursuing a
pharmacy education. I modified these questions lightly to make them more like Likert scales.
26
Originally, each question asked students how much each reason for attending college
corresponded to them (from ―Does not correspond at all‖ to ―Corresponds exactly‖). I adapted
each reason for attending college into a statement that respondents were asked to indicate much
they agreed or disagreed with each statement (from ―Completely agree‖ to ―Completely
disagree‖). Sample statements included, ―I experience pleasure and satisfaction while learning
new things‖ and ―This education will help me obtain a more prestigious job later on.‖ These 28
statements were broken into two groups of 14 to help break up the monotony of a 28 item
question. In between the two groups were three open-ended questions allowing students to
provide more detailed information on their motivations, their career goals, and people who have
influenced their choice to pursue a pharmacy education.
Following the section on motivation, the survey included two more multi-item
questions—one to measure academic commitment and the other to measure academic
satisfaction. Like the motivation questions, I derived these scales from previous research
(Hellman and Williams-Miller 2005; Clemes et al. 2008). The final section of the survey asked
respondents to provide their grade point average from the previous semester and respond to a
number of demographic questions.
As previously mentioned, I thoroughly pre-tested both versions of the survey prior to data
collection taking place. The paper survey was initially pre-tested in the fall of 2012 with five
individuals who did not know each other. Some of these pre-testers were familiar with the
pharmacy program and some were not. I did not include any pharmacy students in my pre-testing
in an attempt to not influence potential future respondents. After each pre-tester had completed
the survey, I conducted a short interview to discuss any complications or problems that they had
27
encountered. Based on the first five pre-tests and the feedback received, I made minor revisions
to both the paper survey and the internet survey.
Once pre-testing had finished with the paper survey, I repeated the same process with the
internet survey. Four more pre-testers were given access to the online survey and asked to
provide feedback on the presentation of the survey and any complications that may have arisen.
After discussing the survey with each of these pre-testers, I made adjustments to both the internet
survey as well as to the paper survey. The last few pre-testers had little if any feedback to
provide, suggesting the surveys were ready for full implementation.
Dependent Variable Measures
Performance
Academic performance was measured by question 10 on the paper survey which asked
students to report their GPA from their last semester of classes. Last semester GPA was used
because it was the most recent measure of student performance and was better able to speak to
the relationship between current motivation and current performance (as opposed to measuring
cumulative GPA). If students were not able to provide an exact GPA, the survey asked them to
provide their credit load and grade for each course from the last semester (from which I could
then calculate students’ GPA from their most recent semester). At The University of Montana,
GPA is measured on a 4.0 scale. For this research, higher GPA scores represent a proxy for
higher levels of student performance.
Commitment
I measured academic commitment through question 6 on the paper survey. These 13
indicators were first developed by Hellman and Williams-Miller (2005) and asked students about
the strength of ties to their educational institution, viable alternatives to school, and sense of
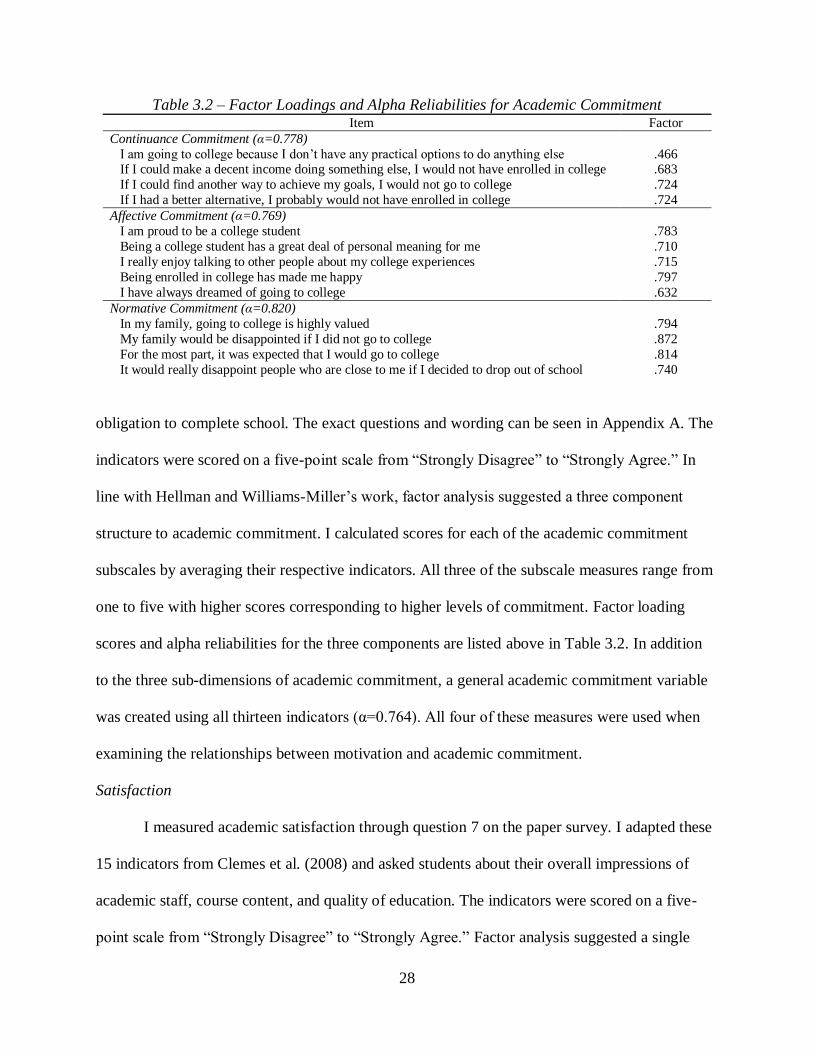
28
Table 3.2 – Factor Loadings and Alpha Reliabilities for Academic Commitment Item Factor
Continuance Commitment (α=0.778)
I am going to college because I don’t have any practical options to do anything else .466 If I could make a decent income doing something else, I would not have enrolled in college .683
If I could find another way to achieve my goals, I would not go to college .724
If I had a better alternative, I probably would not have enrolled in college .724
Affective Commitment (α=0.769)
I am proud to be a college student .783
Being a college student has a great deal of personal meaning for me .710
I really enjoy talking to other people about my college experiences .715
Being enrolled in college has made me happy .797
I have always dreamed of going to college .632
Normative Commitment (α=0.820)
In my family, going to college is highly valued .794
My family would be disappointed if I did not go to college .872
For the most part, it was expected that I would go to college .814
It would really disappoint people who are close to me if I decided to drop out of school .740
obligation to complete school. The exact questions and wording can be seen in Appendix A. The
indicators were scored on a five-point scale from ―Strongly Disagree‖ to ―Strongly Agree.‖ In
line with Hellman and Williams-Miller’s work, factor analysis suggested a three component
structure to academic commitment. I calculated scores for each of the academic commitment
subscales by averaging their respective indicators. All three of the subscale measures range from
one to five with higher scores corresponding to higher levels of commitment. Factor loading
scores and alpha reliabilities for the three components are listed above in Table 3.2. In addition
to the three sub-dimensions of academic commitment, a general academic commitment variable
was created using all thirteen indicators (α=0.764). All four of these measures were used when
examining the relationships between motivation and academic commitment.
Satisfaction
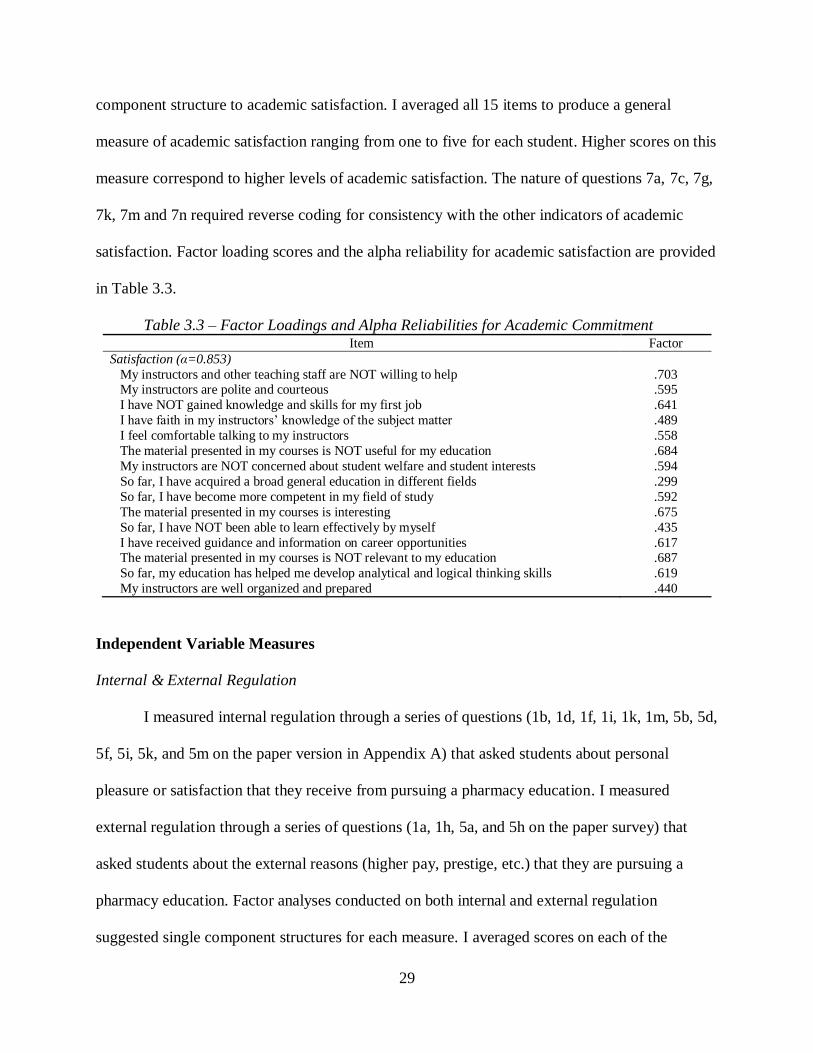
I measured academic satisfaction through question 7 on the paper survey. I adapted these
15 indicators from Clemes et al. (2008) and asked students about their overall impressions of
academic staff, course content, and quality of education. The indicators were scored on a five-
point scale from ―Strongly Disagree‖ to ―Strongly Agree.‖ Factor analysis suggested a single
29
component structure to academic satisfaction. I averaged all 15 items to produce a general
measure of academic satisfaction ranging from one to five for each student. Higher scores on this
measure correspond to higher levels of academic satisfaction. The nature of questions 7a, 7c, 7g,
7k, 7m and 7n required reverse coding for consistency with the other indicators of academic
satisfaction. Factor loading scores and the alpha reliability for academic satisfaction are provided
in Table 3.3.
Table 3.3 – Factor Loadings and Alpha Reliabilities for Academic Commitment Item Factor
Satisfaction (α=0.853)
My instructors and other teaching staff are NOT willing to help .703 My instructors are polite and courteous .595
I have NOT gained knowledge and skills for my first job .641
I have faith in my instructors’ knowledge of the subject matter .489
I feel comfortable talking to my instructors .558
The material presented in my courses is NOT useful for my education .684
My instructors are NOT concerned about student welfare and student interests .594
So far, I have acquired a broad general education in different fields .299
So far, I have become more competent in my field of study .592
The material presented in my courses is interesting .675
So far, I have NOT been able to learn effectively by myself .435
I have received guidance and information on career opportunities .617 The material presented in my courses is NOT relevant to my education .687
So far, my education has helped me develop analytical and logical thinking skills .619
My instructors are well organized and prepared .440
Independent Variable Measures
Internal & External Regulation
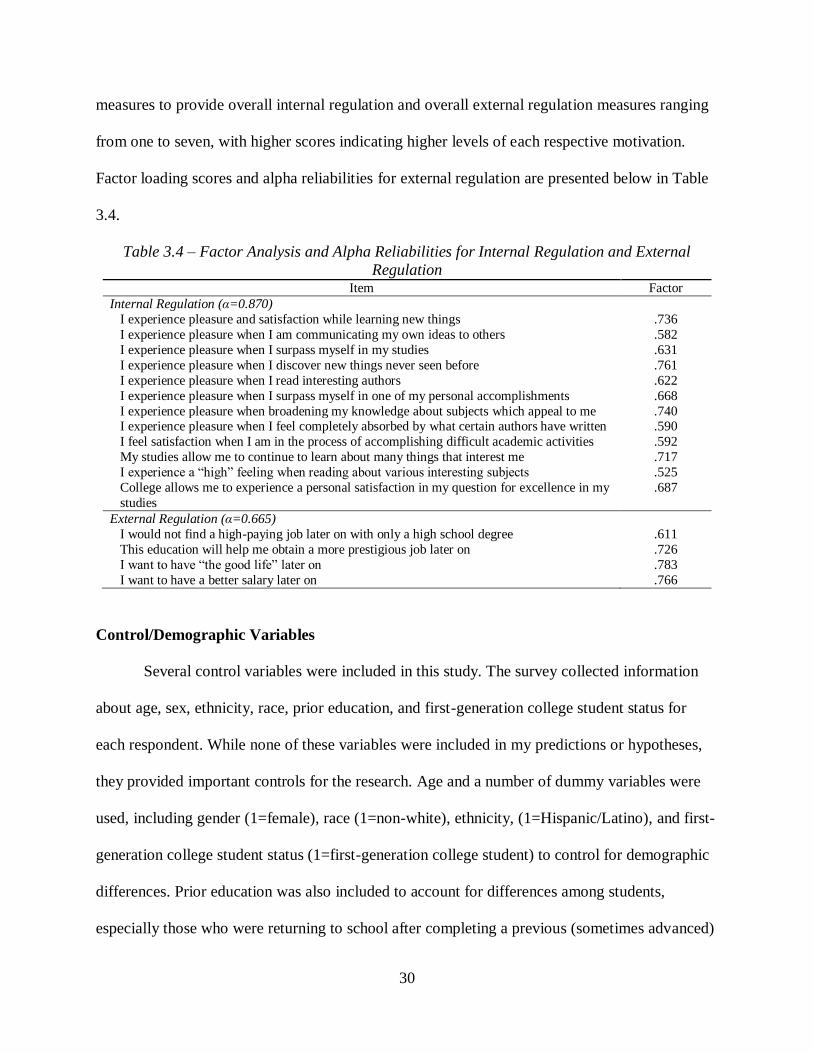
I measured internal regulation through a series of questions (1b, 1d, 1f, 1i, 1k, 1m, 5b, 5d,
5f, 5i, 5k, and 5m on the paper version in Appendix A) that asked students about personal
pleasure or satisfaction that they receive from pursuing a pharmacy education. I measured
external regulation through a series of questions (1a, 1h, 5a, and 5h on the paper survey) that
asked students about the external reasons (higher pay, prestige, etc.) that they are pursuing a
pharmacy education. Factor analyses conducted on both internal and external regulation
suggested single component structures for each measure. I averaged scores on each of the
30
measures to provide overall internal regulation and overall external regulation measures ranging
from one to seven, with higher scores indicating higher levels of each respective motivation.
Factor loading scores and alpha reliabilities for external regulation are presented below in Table
3.4.
Table 3.4 – Factor Analysis and Alpha Reliabilities for Internal Regulation and External
Regulation Item Factor
Internal Regulation (α=0.870)
I experience pleasure and satisfaction while learning new things .736
I experience pleasure when I am communicating my own ideas to others .582
I experience pleasure when I surpass myself in my studies .631
I experience pleasure when I discover new things never seen before .761
I experience pleasure when I read interesting authors .622
I experience pleasure when I surpass myself in one of my personal accomplishments .668
I experience pleasure when broadening my knowledge about subjects which appeal to me .740 I experience pleasure when I feel completely absorbed by what certain authors have written .590
I feel satisfaction when I am in the process of accomplishing difficult academic activities .592
My studies allow me to continue to learn about many things that interest me .717
I experience a ―high‖ feeling when reading about various interesting subjects .525
College allows me to experience a personal satisfaction in my question for excellence in my
studies
.687
External Regulation (α=0.665)
I would not find a high-paying job later on with only a high school degree .611
This education will help me obtain a more prestigious job later on .726
I want to have ―the good life‖ later on .783
I want to have a better salary later on .766
Control/Demographic Variables
Several control variables were included in this study. The survey collected information
about age, sex, ethnicity, race, prior education, and first-generation college student status for
each respondent. While none of these variables were included in my predictions or hypotheses,
they provided important controls for the research. Age and a number of dummy variables were
used, including gender (1=female), race (1=non-white), ethnicity, (1=Hispanic/Latino), and first-
generation college student status (1=first-generation college student) to control for demographic
differences. Prior education was also included to account for differences among students,
especially those who were returning to school after completing a previous (sometimes advanced)
31
degree. Prior education was coded as a dummy variable distinguishing between those with only a
high school diploma and those with a post-secondary degree (1=prior post-secondary degree).
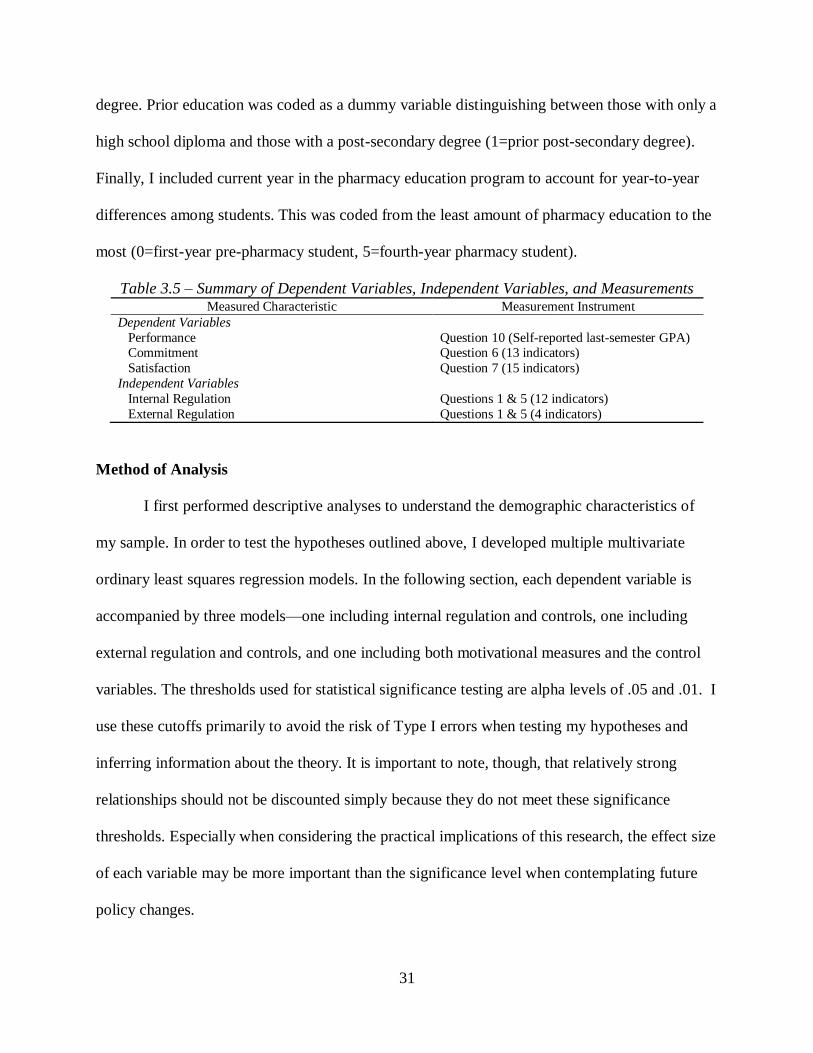
Finally, I included current year in the pharmacy education program to account for year-to-year
differences among students. This was coded from the least amount of pharmacy education to the
most (0=first-year pre-pharmacy student, 5=fourth-year pharmacy student).
Table 3.5 – Summary of Dependent Variables, Independent Variables, and Measurements Measured Characteristic Measurement Instrument
Dependent Variables
Performance Question 10 (Self-reported last-semester GPA) Commitment Question 6 (13 indicators)
Satisfaction Question 7 (15 indicators)
Independent Variables
Internal Regulation Questions 1 & 5 (12 indicators)
External Regulation Questions 1 & 5 (4 indicators)
Method of Analysis
I first performed descriptive analyses to understand the demographic characteristics of
my sample. In order to test the hypotheses outlined above, I developed multiple multivariate
ordinary least squares regression models. In the following section, each dependent variable is
accompanied by three models—one including internal regulation and controls, one including
external regulation and controls, and one including both motivational measures and the control
variables. The thresholds used for statistical significance testing are alpha levels of .05 and .01. I
use these cutoffs primarily to avoid the risk of Type I errors when testing my hypotheses and
inferring information about the theory. It is important to note, though, that relatively strong
relationships should not be discounted simply because they do not meet these significance
thresholds. Especially when considering the practical implications of this research, the effect size
of each variable may be more important than the significance level when contemplating future
policy changes.
32
4. ANALYSIS AND RESULTS
Descriptive Measures by Year in School
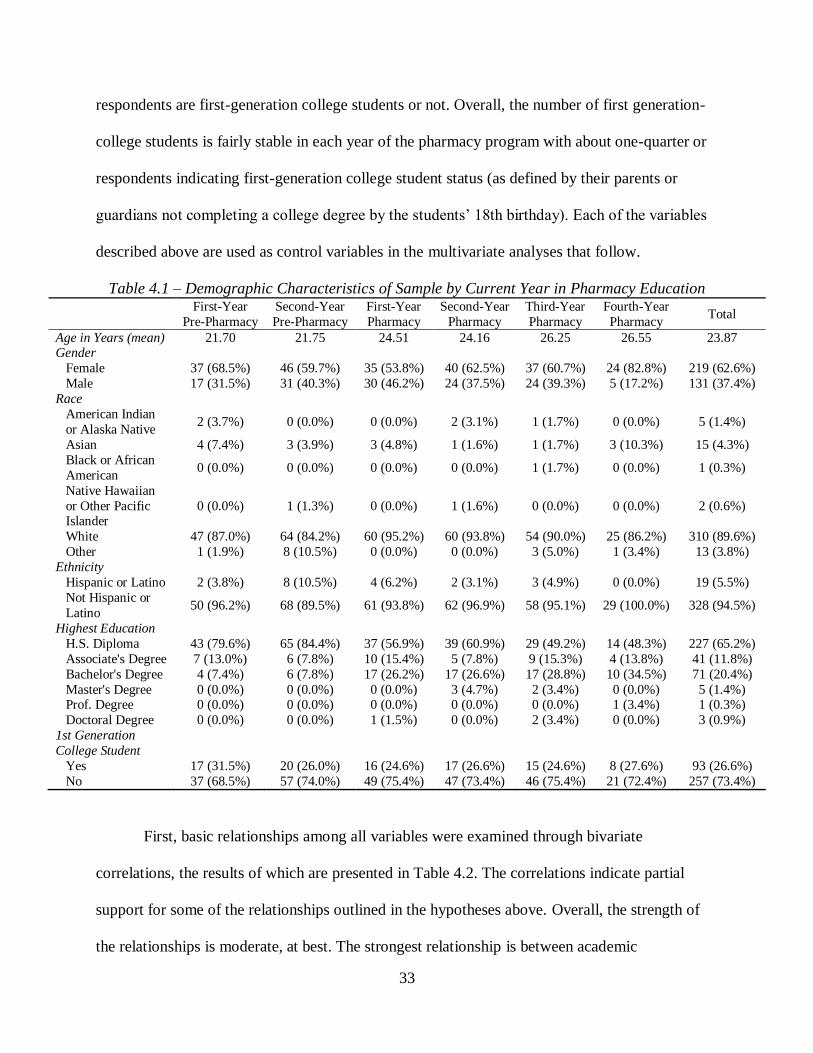
Descriptive statistics for pre-pharmacy and pharmacy students who completed the survey
are provided in Table 4.1. Overall, the sample is comprised of slightly older participants than
what might be expected, with an average age of nearly 24 (if we consider an incoming freshman
to be 18 years of age, the average age of this group should theoretically be 21). Over one half of
respondents are 22 years of age or younger and less than ten percent of respondents are over the
age of 30. The sample is made up of nearly two-thirds women and one-third men. The overall
proportion of females is slightly inflated by the fourth-year pharmacy students because female
students from that year were much more likely to respond to the survey than their male
counterparts (83% of respondents for fourth-year pharmacy students were female while only
17% were male). The overall ratio of females to males is not surprising as the dominance of
females in the pre-pharmacy has been noted for the past several years. Unsurprisingly, the
sample contained very few ethnic or racial minorities. Slightly over five percent of the sample
identified as Hispanic or Latino and only 10 percent of the sample consisted of non-white
students. Black students and Native Hawaiian or Pacific Islander students were the most
underrepresented racial groups with only one and two students, respectively.
Nearly two-thirds of the respondents have only a high school diploma or equivalent.
Students in the professional program are more likely than those in the pre-professional program
to have a post-secondary degree, the most common being a bachelor’s degree. Only four students
indicated that they have previously received a professional degree or doctorate. This clearly
indicates that the most common path for pharmacy students is to pursue the program
immediately after high school. Table 4.1 also presents information about whether survey
33
respondents are first-generation college students or not. Overall, the number of first generation-
college students is fairly stable in each year of the pharmacy program with about one-quarter or
respondents indicating first-generation college student status (as defined by their parents or
guardians not completing a college degree by the students’ 18th birthday). Each of the variables
described above are used as control variables in the multivariate analyses that follow.
Table 4.1 – Demographic Characteristics of Sample by Current Year in Pharmacy Education
First-Year
Pre-Pharmacy
Second-Year
Pre-Pharmacy
First-Year
Pharmacy
Second-Year
Pharmacy
Third-Year
Pharmacy
Fourth-Year
Pharmacy Total
Age in Years (mean) 21.70 21.75 24.51 24.16 26.25 26.55 23.87 Gender
Female 37 (68.5%) 46 (59.7%) 35 (53.8%) 40 (62.5%) 37 (60.7%) 24 (82.8%) 219 (62.6%)
Male 17 (31.5%) 31 (40.3%) 30 (46.2%) 24 (37.5%) 24 (39.3%) 5 (17.2%) 131 (37.4%)
Race
American Indian
or Alaska Native 2 (3.7%) 0 (0.0%) 0 (0.0%) 2 (3.1%) 1 (1.7%) 0 (0.0%) 5 (1.4%)
Asian 4 (7.4%) 3 (3.9%) 3 (4.8%) 1 (1.6%) 1 (1.7%) 3 (10.3%) 15 (4.3%)
Black or African
American 0 (0.0%) 0 (0.0%) 0 (0.0%) 0 (0.0%) 1 (1.7%) 0 (0.0%) 1 (0.3%)
Native Hawaiian
or Other Pacific Islander
0 (0.0%) 1 (1.3%) 0 (0.0%) 1 (1.6%) 0 (0.0%) 0 (0.0%) 2 (0.6%)
White 47 (87.0%) 64 (84.2%) 60 (95.2%) 60 (93.8%) 54 (90.0%) 25 (86.2%) 310 (89.6%)
Other 1 (1.9%) 8 (10.5%) 0 (0.0%) 0 (0.0%) 3 (5.0%) 1 (3.4%) 13 (3.8%)
Ethnicity
Hispanic or Latino 2 (3.8%) 8 (10.5%) 4 (6.2%) 2 (3.1%) 3 (4.9%) 0 (0.0%) 19 (5.5%)
Not Hispanic or
Latino 50 (96.2%) 68 (89.5%) 61 (93.8%) 62 (96.9%) 58 (95.1%) 29 (100.0%) 328 (94.5%)
Highest Education
H.S. Diploma 43 (79.6%) 65 (84.4%) 37 (56.9%) 39 (60.9%) 29 (49.2%) 14 (48.3%) 227 (65.2%)
Associate's Degree 7 (13.0%) 6 (7.8%) 10 (15.4%) 5 (7.8%) 9 (15.3%) 4 (13.8%) 41 (11.8%)
Bachelor's Degree 4 (7.4%) 6 (7.8%) 17 (26.2%) 17 (26.6%) 17 (28.8%) 10 (34.5%) 71 (20.4%)
Master's Degree 0 (0.0%) 0 (0.0%) 0 (0.0%) 3 (4.7%) 2 (3.4%) 0 (0.0%) 5 (1.4%) Prof. Degree 0 (0.0%) 0 (0.0%) 0 (0.0%) 0 (0.0%) 0 (0.0%) 1 (3.4%) 1 (0.3%)
Doctoral Degree 0 (0.0%) 0 (0.0%) 1 (1.5%) 0 (0.0%) 2 (3.4%) 0 (0.0%) 3 (0.9%)
1st Generation
College Student
Yes 17 (31.5%) 20 (26.0%) 16 (24.6%) 17 (26.6%) 15 (24.6%) 8 (27.6%) 93 (26.6%)
No 37 (68.5%) 57 (74.0%) 49 (75.4%) 47 (73.4%) 46 (75.4%) 21 (72.4%) 257 (73.4%)
First, basic relationships among all variables were examined through bivariate
correlations, the results of which are presented in Table 4.2. The correlations indicate partial
support for some of the relationships outlined in the hypotheses above. Overall, the strength of
the relationships is moderate, at best. The strongest relationship is between academic
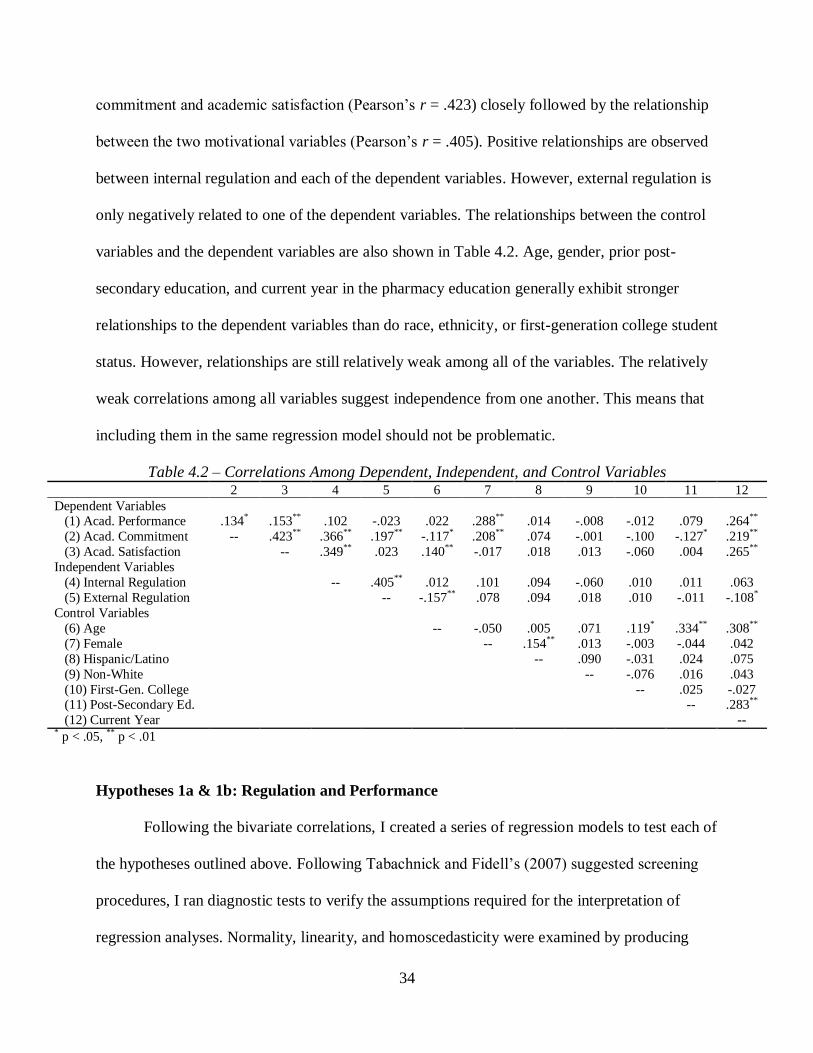
34
commitment and academic satisfaction (Pearson’s r = .423) closely followed by the relationship
between the two motivational variables (Pearson’s r = .405). Positive relationships are observed
between internal regulation and each of the dependent variables. However, external regulation is
only negatively related to one of the dependent variables. The relationships between the control
variables and the dependent variables are also shown in Table 4.2. Age, gender, prior post-
secondary education, and current year in the pharmacy education generally exhibit stronger
relationships to the dependent variables than do race, ethnicity, or first-generation college student
status. However, relationships are still relatively weak among all of the variables. The relatively
weak correlations among all variables suggest independence from one another. This means that
including them in the same regression model should not be problematic.
Table 4.2 – Correlations Among Dependent, Independent, and Control Variables 2 3 4 5 6 7 8 9 10 11 12
Dependent Variables (1) Acad. Performance .134* .153** .102 -.023 .022 .288** .014 -.008 -.012 .079 .264**
(2) Acad. Commitment -- .423** .366** .197** -.117* .208** .074 -.001 -.100 -.127* .219**
(3) Acad. Satisfaction -- .349** .023 .140** -.017 .018 .013 -.060 .004 .265**
Independent Variables
(4) Internal Regulation -- .405** .012 .101 .094 -.060 .010 .011 .063
(5) External Regulation -- -.157** .078 .094 .018 .010 -.011 -.108*
Control Variables
(6) Age -- -.050 .005 .071 .119* .334** .308**
(7) Female -- .154** .013 -.003 -.044 .042
(8) Hispanic/Latino -- .090 -.031 .024 .075
(9) Non-White -- -.076 .016 .043
(10) First-Gen. College -- .025 -.027 (11) Post-Secondary Ed. -- .283**
(12) Current Year -- * p < .05, ** p < .01
Hypotheses 1a & 1b: Regulation and Performance
Following the bivariate correlations, I created a series of regression models to test each of
the hypotheses outlined above. Following Tabachnick and Fidell’s (2007) suggested screening
procedures, I ran diagnostic tests to verify the assumptions required for the interpretation of
regression analyses. Normality, linearity, and homoscedasticity were examined by producing
35
histograms and scatterplots of residuals for each statistical model. None of these plots indicated
any gross violations of the assumptions. Additionally, I checked for autocorrelation of errors by
calculating the Durbin-Watson statistic for each model. None of these values indicated that
autocorrelation was a concern. I also examined tolerance and variance inflation factor scores for
the models, which indicated that multicollinearity was likely not a problem. Finally, influential
outliers were screened by calculating Cook’s distance scores for all cases in each model. No
Cook’s distance values exceeded 1.00, suggesting no specific cases were highly influential.
The first two hypotheses predicted the influence of motivation on academic performance.
Specifically, I predicted that higher levels of internal regulation would be related to higher levels
of student performance. Conversely, higher levels of external regulation were predicted to be
related to lower levels of student performance. Table 4.3 shows the results for both Hypotheses
1a and 1b. The model including only internal regulation and the control variables is presented as
Model 1. This model accounts for 13% of the variation in academic performance (as measured
by last-semester GPA). While the relationship between internal regulation and performance is
positive, the standardized coefficient is relatively small compared to other variables in the model
(β = .069).
The regression model that includes only external regulation and the control variables,
presented as Model 2, accounts for about 13% (Adjusted R2 = .125) of the variation in academic
performance. As predicted, the relationship between external regulation and academic
performance is negative. However, the standardized coefficient indicates an extremely weak
relationship (β = -.014). Hypotheses 1a and 1b are not supported because neither of the
independent variables are shown to be statistically significant predictors of students’ academic
performance when the control variables are accounted for. However, both models do show that
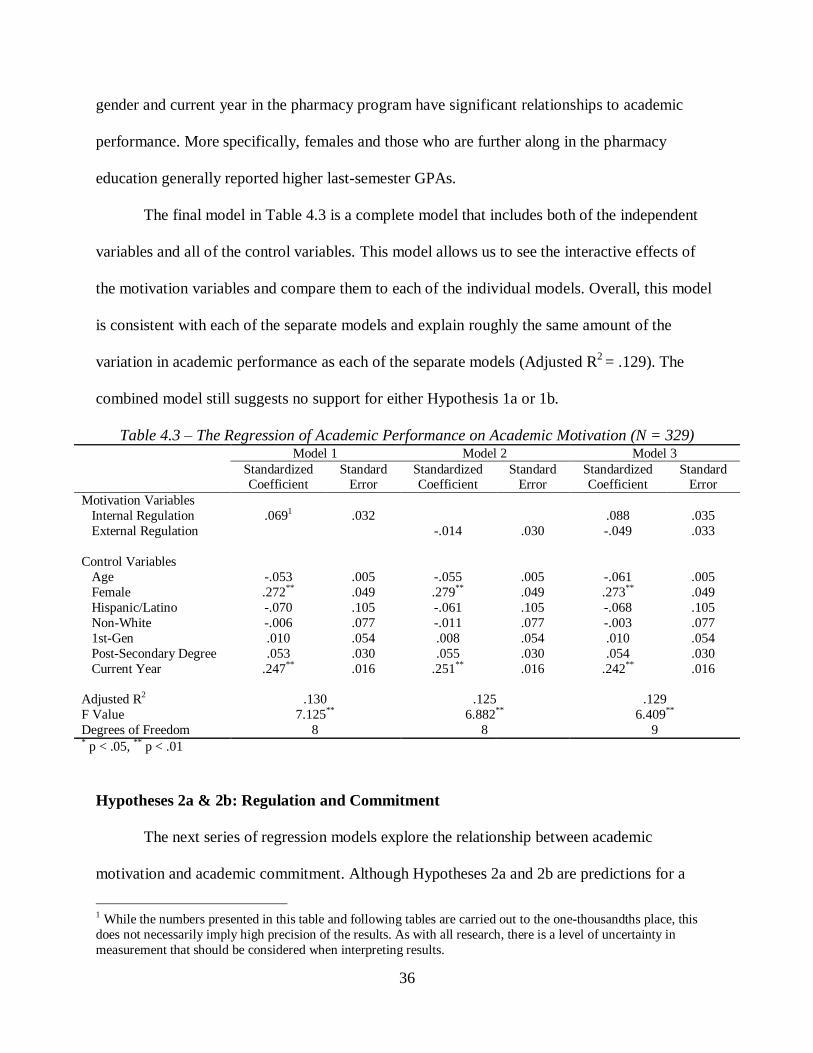
36
gender and current year in the pharmacy program have significant relationships to academic
performance. More specifically, females and those who are further along in the pharmacy
education generally reported higher last-semester GPAs.
The final model in Table 4.3 is a complete model that includes both of the independent
variables and all of the control variables. This model allows us to see the interactive effects of
the motivation variables and compare them to each of the individual models. Overall, this model
is consistent with each of the separate models and explain roughly the same amount of the
variation in academic performance as each of the separate models (Adjusted R2 = .129). The
combined model still suggests no support for either Hypothesis 1a or 1b.
Table 4.3 – The Regression of Academic Performance on Academic Motivation (N = 329) Model 1 Model 2 Model 3
Standardized Coefficient
Standard Error
Standardized Coefficient
Standard Error
Standardized Coefficient
Standard Error
Motivation Variables
Internal Regulation .0691 .032 .088 .035
External Regulation -.014 .030 -.049 .033
Control Variables
Age -.053 .005 -.055 .005 -.061 .005
Female .272** .049 .279** .049 .273** .049
Hispanic/Latino -.070 .105 -.061 .105 -.068 .105
Non-White -.006 .077 -.011 .077 -.003 .077
1st-Gen .010 .054 .008 .054 .010 .054
Post-Secondary Degree .053 .030 .055 .030 .054 .030
Current Year .247** .016 .251** .016 .242** .016
Adjusted R2 .130 .125 .129
F Value 7.125** 6.882** 6.409**
Degrees of Freedom 8 8 9 * p < .05, ** p < .01
Hypotheses 2a & 2b: Regulation and Commitment
The next series of regression models explore the relationship between academic
motivation and academic commitment. Although Hypotheses 2a and 2b are predictions for a
1 While the numbers presented in this table and following tables are carried out to the one-thousandths place, this
does not necessarily imply high precision of the results. As with all research, there is a level of uncertainty in
measurement that should be considered when interpreting results.
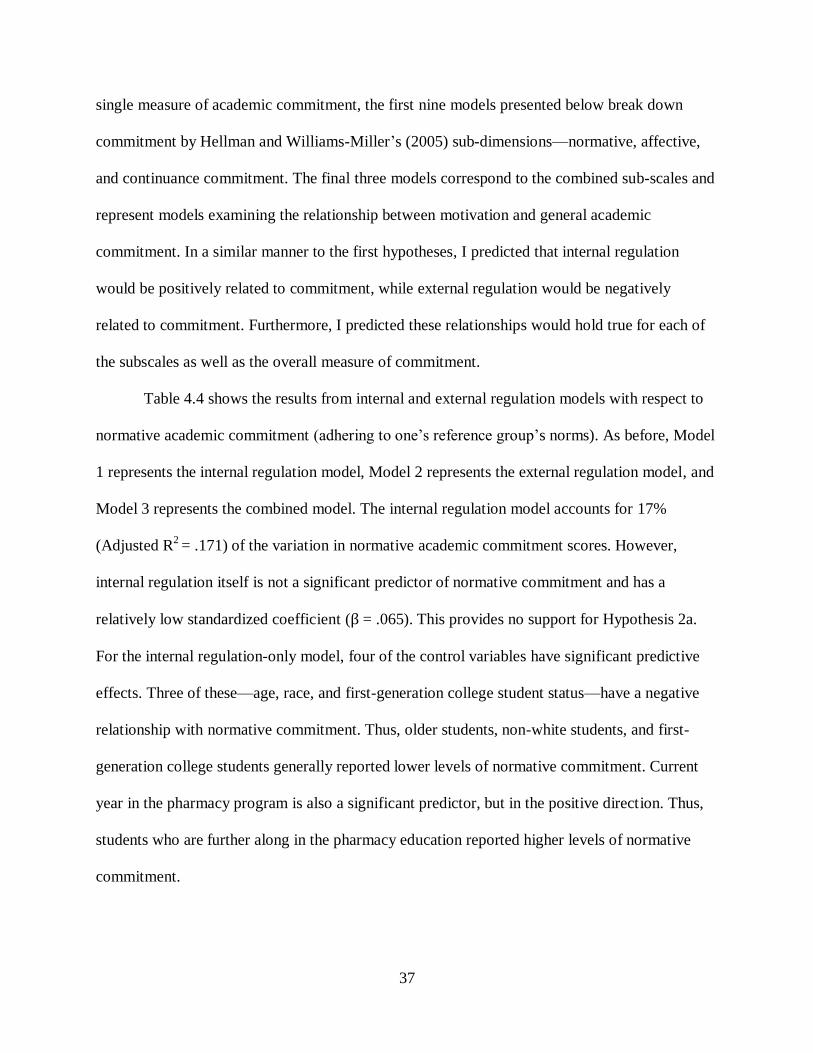
37
single measure of academic commitment, the first nine models presented below break down
commitment by Hellman and Williams-Miller’s (2005) sub-dimensions—normative, affective,
and continuance commitment. The final three models correspond to the combined sub-scales and
represent models examining the relationship between motivation and general academic
commitment. In a similar manner to the first hypotheses, I predicted that internal regulation
would be positively related to commitment, while external regulation would be negatively
related to commitment. Furthermore, I predicted these relationships would hold true for each of
the subscales as well as the overall measure of commitment.
Table 4.4 shows the results from internal and external regulation models with respect to
normative academic commitment (adhering to one’s reference group’s norms). As before, Model
1 represents the internal regulation model, Model 2 represents the external regulation model, and
Model 3 represents the combined model. The internal regulation model accounts for 17%
(Adjusted R2 = .171) of the variation in normative academic commitment scores. However,
internal regulation itself is not a significant predictor of normative commitment and has a
relatively low standardized coefficient (β = .065). This provides no support for Hypothesis 2a.
For the internal regulation-only model, four of the control variables have significant predictive
effects. Three of these—age, race, and first-generation college student status—have a negative
relationship with normative commitment. Thus, older students, non-white students, and first-
generation college students generally reported lower levels of normative commitment. Current
year in the pharmacy program is also a significant predictor, but in the positive direction. Thus,
students who are further along in the pharmacy education reported higher levels of normative
commitment.
38
The external regulation model (Model 2 in Table 4.4) accounts for about one-quarter
(Adjusted R2 = .230) of the variation in normative commitment. Not only is this higher than what
the internal regulation-only model is able to account for, but the standardized coefficient of
external regulation itself is noticeably large. However, the relationship is in the opposite
direction from what was predicted, lending no support to Hypothesis 2b. Thus, students who
reported higher levels of external regulation were also more likely to report higher levels of
normative commitment. Similar to the internal regulation model, age, race, and first-generation
college student status all have statistically significant negative relationships with normative
commitment, while current year in the program has a significant positive relationship.
Table 4.4 – The Regression of Normative Commitment on Academic Motivation (N = 342) Model 1 Model 2 Model 3
Standardized Coefficient
Standard Error
Standardized Coefficient
Standard Error
Standardized Coefficient
Standard Error
Motivation Variables
Internal Regulation .065 .058 -.053 .062
External Regulation .255 .051 .277 .056
Control Variables
Age -.368** .008 -.331** .008 -.328** .008
Female .063 .089 .053 .086 .057 .086
Hispanic/Latino .025 .194 .012 .186 .016 .187
Non-White -.103* .140 -.114* .134 -.119* .135
1st-Gen -.119* .098 -.125** .094 -.126** .094
Post-Secondary Degree -.059 .056 -.064 .054 -.064 .054
Current Year .125* .029 .148** .028 .153** .028
Adjusted R2 .171 .230 .230
F Value 9.774** 13.744** 12.324**
Degrees of Freedom 8 8 9 * p < .05, ** p < .01
Model 3 in Table 4.4 includes both of the independent variables as well as the control
variables. It is notable that Model 3 differs only slightly from the external regulation-only model.
The standardized coefficient for external regulation increases only slightly in the combined
model (as compared to the external regulation-only model) and the adjusted R2 does not change.
39
This suggests that including information about a student’s internal regulation does nothing to
strengthen our model for normative commitment.
Table 4.5 shows the results from regression models for affective academic commitment
(commitment resulting from identification with the university). Again, Model 1 represents the
internal regulation-only model, Model 2 represents the external regulation-only model, and
Model 3 represents the complete model. The internal regulation-only model accounts for about
one-quarter (Adjusted R2 = .266) of the variation in affective academic commitment scores.
Additionally, internal regulation itself is a statistically significant predictor of affective
commitment with a relatively high standardized coefficient (β = .481), lending support to
Hypothesis 2a. Prior post-secondary education and current year in the pharmacy program are
also significant predictors of affective commitment, albeit in opposite directions. Specifically,
students who already held a higher education degree generally reported lower levels of affective
commitment than those without a higher education degree. Similar to each of the previous
models, students who are further along in the pharmacy education reported higher levels of
affective commitment.
The external regulation-only model (also presented in Table 4.5) accounts for 10%
(Adjusted R2 = .104) of the variation in affective commitment scores. While the amount of
variance accounted for is lower than the internal regulation model, the predictive power of
external regulation itself is larger than internal regulation. As in the normative commitment
model, though, external regulation’s relationship is in the opposite direction from what was
predicted, lending no support to Hypothesis 2b. Thus, students who reported higher levels of
external regulation were also more likely to report higher levels of affective commitment. As
was true with the corresponding internal regulation model, students with a prior post-secondary

40
degree were more likely to report lower affective commitment scores and those who are further
along in the pharmacy program reported higher levels of affective commitment.
The complete model for affective commitment is very similar to Model 1 (the model that
only included internal regulation and control variables). More importantly, when internal and
external regulation are included in the same model, the standardized coefficient for external
regulation is significantly reduced. This suggests that having information about a student’s
external regulation does little to help predict his or her affective commitment when internal
regulation scores are controlled for. Additionally, the combined model shows no improvement
over the internal regulation-only model in terms of the amount of explained variance in affective
commitment scores.
Table 4.5 – The Regression of Affective Commitment on Academic Motivation (N = 342) Model 1 Model 2 Model 3
Standardized Coefficient
Standard Error
Standardized Coefficient
Standard Error
Standardized Coefficient
Standard Error
Motivation Variables
Internal Regulation .481** .039 .452** .043
External Regulation .262 .039 .068 .039
Control Variables
Age .023 .006 .060 .006 .033 .006
Female .047 .060 .076 .066 .046 .060
Hispanic/Latino -.056 .131 -.026 .144 -.058 .131
Non-White .082 .094 .038 .104 .078 .094
1st-Gen .043 .066 .029 .073 .041 .066
Post-Secondary Degree -.152** .038 -.147** .042 -.153** .038
Current Year .159** .020 .210** .022 .166** .020
Adjusted R2 .266 .104 .267
F Value 16.432** 5.967** 14.826**
Degrees of Freedom 8 8 9 * p < .05, **p < .01
The results from the last sub-dimension of the academic commitment scale—continuance
commitment (commitment in light of viable alternatives)—are provided in Table 4.6. Model 1,
the internal regulation-only model, accounts for 14% of the variation in continuance commitment
scores. This is relatively low compared to the internal regulation model for affective
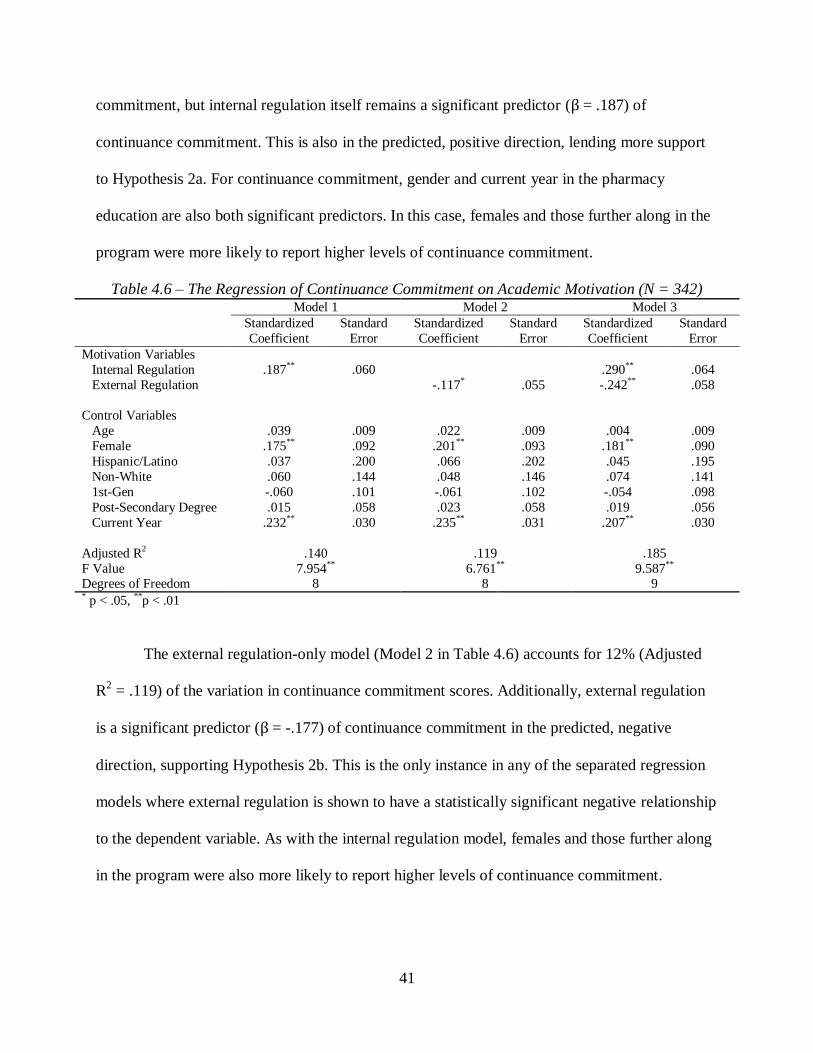
41
commitment, but internal regulation itself remains a significant predictor (β = .187) of
continuance commitment. This is also in the predicted, positive direction, lending more support
to Hypothesis 2a. For continuance commitment, gender and current year in the pharmacy
education are also both significant predictors. In this case, females and those further along in the
program were more likely to report higher levels of continuance commitment.
Table 4.6 – The Regression of Continuance Commitment on Academic Motivation (N = 342) Model 1 Model 2 Model 3
Standardized
Coefficient
Standard
Error
Standardized
Coefficient
Standard
Error
Standardized
Coefficient
Standard
Error
Motivation Variables
Internal Regulation .187** .060 .290** .064
External Regulation -.117* .055 -.242** .058
Control Variables
Age .039 .009 .022 .009 .004 .009
Female .175** .092 .201** .093 .181** .090
Hispanic/Latino .037 .200 .066 .202 .045 .195
Non-White .060 .144 .048 .146 .074 .141
1st-Gen -.060 .101 -.061 .102 -.054 .098
Post-Secondary Degree .015 .058 .023 .058 .019 .056
Current Year .232** .030 .235** .031 .207** .030
Adjusted R2 .140 .119 .185
F Value 7.954** 6.761** 9.587** Degrees of Freedom 8 8 9 * p < .05, **p < .01
The external regulation-only model (Model 2 in Table 4.6) accounts for 12% (Adjusted
R2 = .119) of the variation in continuance commitment scores. Additionally, external regulation
is a significant predictor (β = -.177) of continuance commitment in the predicted, negative
direction, supporting Hypothesis 2b. This is the only instance in any of the separated regression
models where external regulation is shown to have a statistically significant negative relationship
to the dependent variable. As with the internal regulation model, females and those further along
in the program were also more likely to report higher levels of continuance commitment.
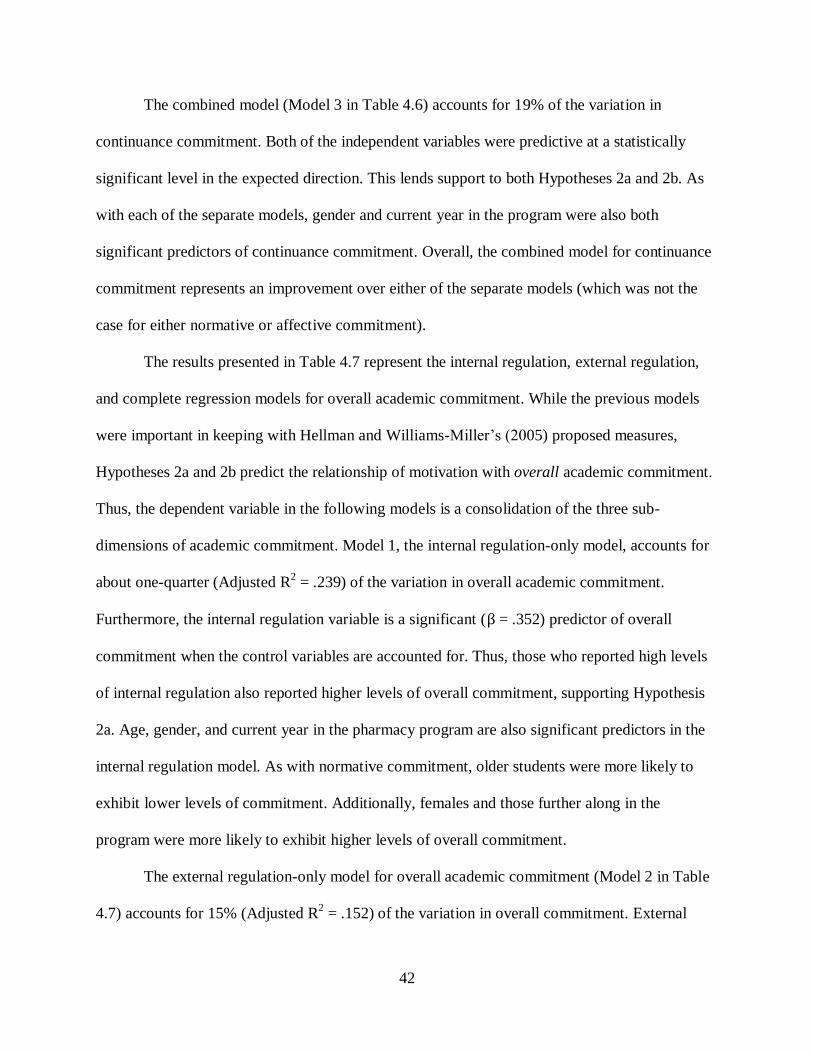
42
The combined model (Model 3 in Table 4.6) accounts for 19% of the variation in
continuance commitment. Both of the independent variables were predictive at a statistically
significant level in the expected direction. This lends support to both Hypotheses 2a and 2b. As
with each of the separate models, gender and current year in the program were also both
significant predictors of continuance commitment. Overall, the combined model for continuance
commitment represents an improvement over either of the separate models (which was not the
case for either normative or affective commitment).
The results presented in Table 4.7 represent the internal regulation, external regulation,
and complete regression models for overall academic commitment. While the previous models
were important in keeping with Hellman and Williams-Miller’s (2005) proposed measures,
Hypotheses 2a and 2b predict the relationship of motivation with overall academic commitment.
Thus, the dependent variable in the following models is a consolidation of the three sub-
dimensions of academic commitment. Model 1, the internal regulation-only model, accounts for
about one-quarter (Adjusted R2 = .239) of the variation in overall academic commitment.
Furthermore, the internal regulation variable is a significant (β = .352) predictor of overall
commitment when the control variables are accounted for. Thus, those who reported high levels
of internal regulation also reported higher levels of overall commitment, supporting Hypothesis
2a. Age, gender, and current year in the pharmacy program are also significant predictors in the
internal regulation model. As with normative commitment, older students were more likely to
exhibit lower levels of commitment. Additionally, females and those further along in the
program were more likely to exhibit higher levels of overall commitment.
The external regulation-only model for overall academic commitment (Model 2 in Table
4.7) accounts for 15% (Adjusted R2 = .152) of the variation in overall commitment. External
43
regulation is a stronger predictor of overall commitment than many other variables in the model,
albeit in the opposite direction (β = .191 from what was predicted, offering no support for
Hypothesis 2b. The control variables in the external regulation model mirror those for the
internal regulation model. Age is shown to have a statistically significant negative relationship
with overall commitment, while females and those further along in the program are shown to
have higher levels of overall commitment.
Model 3, the combined model, is nearly identical to the internal regulation-only model.
When internal and external regulation are included in the same model, there is no additional
variance explained from the internal regulation-only model (Adjusted R2 = .239 for both Model 1
and Model 3). Furthermore, when external regulation is included in the combined model, its
relationship with overall commitment is largely mitigated. Overall, this suggests that internal
regulation is a more important predictor of overall academic commitment than external
regulation is.
Table 4.7 – The Regression of Overall Commitment on Academic Motivation (N = 342) Model 1 Model 2 Model 3
Standardized
Coefficient
Standard
Error
Standardized
Coefficient
Standard
Error
Standardized
Coefficient
Standard
Error
Motivation Variables
Internal Regulation .352** .033 .331** .037
External Regulation .191 .032 .049 .033
Control Variables
Age -.157**
.005 -.130* .005 -.150
** .005
Female .145** .051 .166** .054 .144** .051
Hispanic/Latino .005 .111 .027 .117 .004 .111
Non-White .015 .080 -.017 .085 .012 .081
1st-Gen -.072 .056 -.082 .059 -.073 .056
Post-Secondary Degree -.093 .032 -.089 .034 -.094 .032
Current Year .258** .017 .295** .018 .263** .017
Adjusted R2 .239 .152 .239 F Value 14.381** 8.644** 12.868**
Degrees of Freedom 8 8 9 * p < .05, **p < .01
44
Hypotheses 3a & 3b: Regulation and Satisfaction
Finally, the models for Hypotheses 3a and 3b are presented in Table 4.8. These
hypotheses predict the relationships between academic motivation and academic satisfaction.
Like the other hypotheses, I predicted that internal regulation would have a positive relationship
with academic satisfaction while external regulation would have a negative relationship. The
internal regulation-only model is presented as Model 1 and accounts for 19% of the variation in
academic satisfaction. Furthermore, there is support for Hypothesis 3a since internal regulation
(β = .355) is a significant predictor of academic satisfaction, even when the control variables are
accounted for. Like each of the previous models, current year in the pharmacy program is also a
significant predictor of the dependent variable with students who are further along in the
program reporting higher levels of satisfaction.
Model 2 in Table 4.8 shows the relationship between external regulation and academic
satisfaction when control variables are accounted for. Overall, the model is not very powerful—
accounting for only 7% of the variation in academic performance. Furthermore, external
regulation in this model is not a significant predictor of academic satisfaction. In fact, with a
positive standardized coefficient ( , there is no support for Hypothesis 3b, which
suggested that the relationship between external regulation and academic satisfaction would be
negative. The only significant predictor of academic satisfaction in the external regulation model
is current year in the program, with more advanced students reporting greater levels of
satisfaction.
The combined model (Model 3) represents an improvement over either of the separate
models. Overall, the combined model accounts for 20% (Adjusted R2 = .199) of the variation in
academic commitment scores. Additionally, both internal and external regulation are shown to be
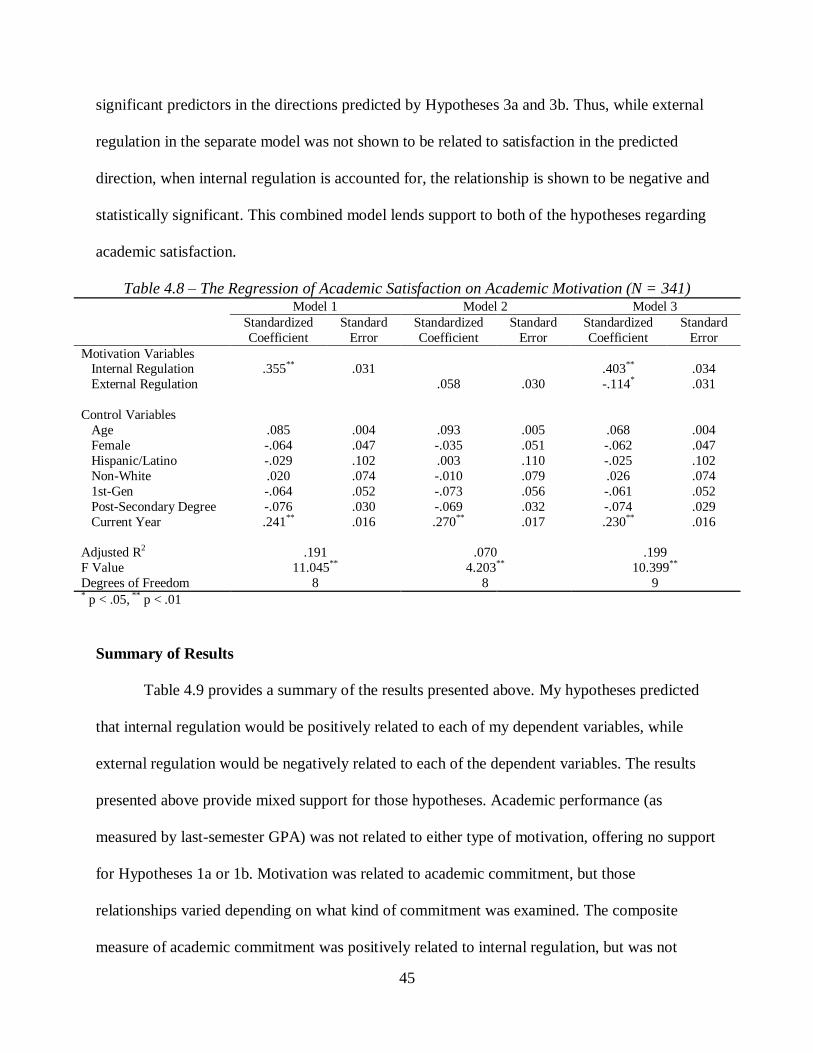
45
significant predictors in the directions predicted by Hypotheses 3a and 3b. Thus, while external
regulation in the separate model was not shown to be related to satisfaction in the predicted
direction, when internal regulation is accounted for, the relationship is shown to be negative and
statistically significant. This combined model lends support to both of the hypotheses regarding
academic satisfaction.
Table 4.8 – The Regression of Academic Satisfaction on Academic Motivation (N = 341) Model 1 Model 2 Model 3
Standardized
Coefficient
Standard
Error
Standardized
Coefficient
Standard
Error
Standardized
Coefficient
Standard
Error
Motivation Variables Internal Regulation .355** .031 .403** .034
External Regulation .058 .030 -.114* .031
Control Variables
Age .085 .004 .093 .005 .068 .004
Female -.064 .047 -.035 .051 -.062 .047
Hispanic/Latino -.029 .102 .003 .110 -.025 .102
Non-White .020 .074 -.010 .079 .026 .074
1st-Gen -.064 .052 -.073 .056 -.061 .052
Post-Secondary Degree -.076 .030 -.069 .032 -.074 .029
Current Year .241** .016 .270** .017 .230** .016
Adjusted R2 .191 .070 .199
F Value 11.045** 4.203** 10.399**
Degrees of Freedom 8 8 9 * p < .05, ** p < .01
Summary of Results
Table 4.9 provides a summary of the results presented above. My hypotheses predicted
that internal regulation would be positively related to each of my dependent variables, while
external regulation would be negatively related to each of the dependent variables. The results
presented above provide mixed support for those hypotheses. Academic performance (as
measured by last-semester GPA) was not related to either type of motivation, offering no support
for Hypotheses 1a or 1b. Motivation was related to academic commitment, but those
relationships varied depending on what kind of commitment was examined. The composite
measure of academic commitment was positively related to internal regulation, but was not
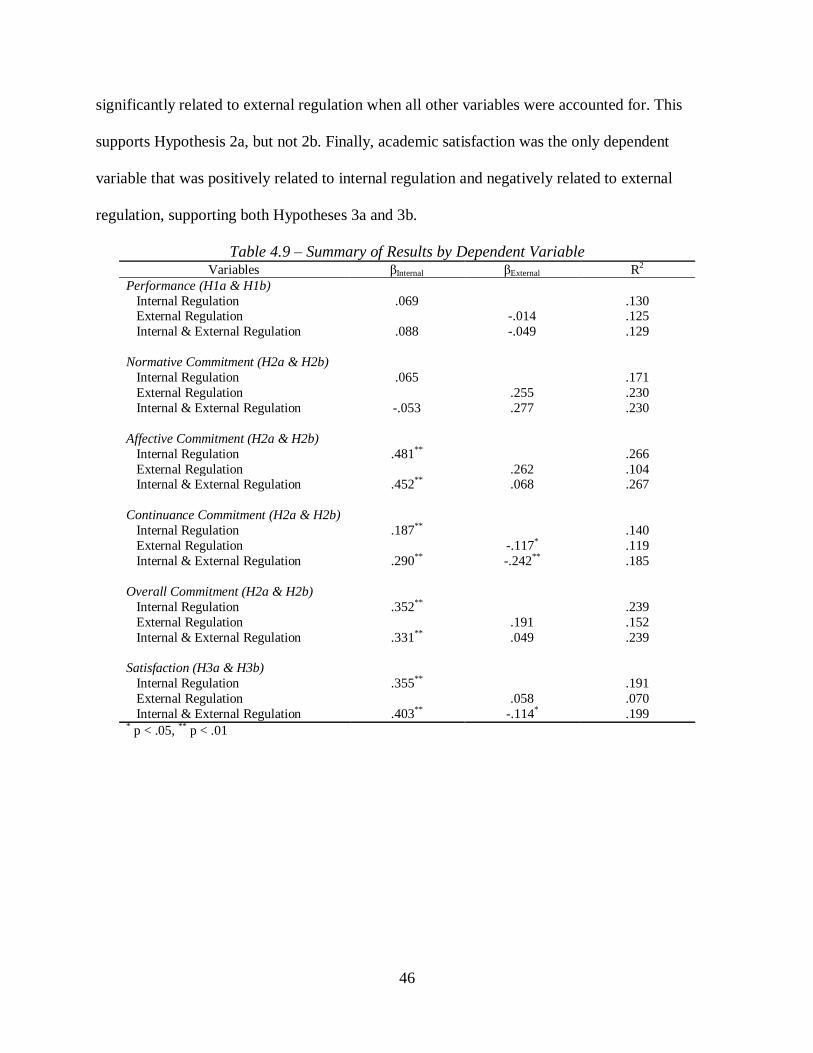
46
significantly related to external regulation when all other variables were accounted for. This
supports Hypothesis 2a, but not 2b. Finally, academic satisfaction was the only dependent
variable that was positively related to internal regulation and negatively related to external
regulation, supporting both Hypotheses 3a and 3b.
Table 4.9 – Summary of Results by Dependent Variable Variables βInternal βExternal R2
Performance (H1a & H1b)
Internal Regulation .069 .130 External Regulation -.014 .125
Internal & External Regulation .088 -.049 .129
Normative Commitment (H2a & H2b)
Internal Regulation .065 .171
External Regulation .255 .230
Internal & External Regulation -.053 .277 .230
Affective Commitment (H2a & H2b)
Internal Regulation .481** .266
External Regulation .262 .104 Internal & External Regulation .452** .068 .267
Continuance Commitment (H2a & H2b)
Internal Regulation .187** .140
External Regulation -.117* .119
Internal & External Regulation .290** -.242** .185
Overall Commitment (H2a & H2b)
Internal Regulation .352** .239
External Regulation .191 .152
Internal & External Regulation .331** .049 .239
Satisfaction (H3a & H3b)
Internal Regulation .355** .191
External Regulation .058 .070
Internal & External Regulation .403** -.114* .199 * p < .05, ** p < .01
47
5. DISCUSSION AND CONCLUSION
This study provides mixed results for self-determination theory as it relates to education,
at least among pharmacy students. Overall, support for my hypotheses is somewhat dependent on
which statistical model is examined. For instance, some hypotheses were supported when
examining the separate models of internal and external regulation for each dependent variable.
Some hypotheses, though, were only supported in the models that contained both motivational
variables and all of the control variables. In some respects, the separate models provide a more
detailed analysis of the relationships, especially the relative impacts of the independent
motivational variables as compared to the control variables. However, since both internal and
external regulation can influence the dependent variables, there is some reason to believe they
should be included in the same model. Both ways of calculating and presenting the models are
included in the results primarily because they allow for interesting comparisons.
Interestingly, results based on the separate and combined models were sometimes very
different. In some models, the effects of one of the independent variables were largely mitigated
when it was included in the same model as the other independent variable. Additionally, the
explained variance in the combined model was sometimes no greater than one of the separate
models. This suggests that the addition of the second independent variable does little to nothing
to improve the model. This phenomenon was particularly interesting because it varied by
dependent variable on whether the internal or external regulation variable was a more important
predictor. For example, the combined affective and overall commitment models were very
similar to each of their internal regulation-only models. On the other hand, the combined
normative commitment model was almost identical to the external regulation-only model for
normative commitment. This suggests that different kinds of motivation can have differential
48
impacts on different kinds of commitment. The nature of the commitment measures in this study
makes this phenomenon apparent, but it may be true for other educational outcomes as well.
Further research is clearly necessary to better understand why internal and external regulation
differentially impact educational outcomes. Perhaps additional measures of performance and
satisfaction could be examined to see if those variables are differentially related to different
kinds of motivation. By examining more measures, possible trends may be identified to explain
when and why internal (or external) regulation is more important.
Outside of these differences in separate and combined regression models, a number of
other findings are noteworthy. The first set of hypotheses predicted the relationship between
motivation and academic performance. Overall, these were not supported in either the separate or
the combined models. Hypothesis 1a predicted that higher levels of internal regulation would be
related to higher levels of academic performance, while Hypothesis 1b predicted that higher
levels of external regulation would be related to lower levels of academic performance. Neither
internal regulation nor external regulation was shown to have significant predictive abilities
regarding students’ GPAs. Despite not supporting the hypotheses, these findings are actually
consistent with some prior research that has shown little to no link between motivation and
academic performance (Cokley et al. 2001; Baker 2004).
One possible explanation for these findings is related to the way academic performance
was measured. After much debate, I eventually decided that GPA was the best measure because
of the need for a standardized measure for between-year comparisons. Instead of measuring
cumulative GPA, though, the survey asked students to report their last-semester GPA.
Specifically, the question asked, ―What is your GPA from last semester?‖ Despite the question
being relatively well received during pretesting, it later became clear that the question could still
49
be interpreted as asking about cumulative GPA. The fact that this question may have been
interpreted differently by different students may help explain the lack of support for my
hypotheses.
In each of the statistical models examining academic performance, the only statistically
significant predictors were gender and current year in the pharmacy education. Females and
those further along in the program were much more likely to report higher GPAs. Exactly why
women tend to perform higher in the courses in this study might be due to any number of reasons
including advanced developmental maturity or better study habits. One possible explanation for
the relationship between current year and performance is that the pharmacy program becomes
easier over time, bringing up average grades. While this alone seems unlikely, it is possible that
as students advance through the program, they generally mature and become better students.
Often it takes some adjustment time to figure out exactly what needs to be done to succeed at
school. The longer students have been in the program, the better they are likely to be at this.
Another possible explanation is that the pre-pharmacy program consists of a number of ―weed
out‖ courses. Furthermore, pre-pharmacy students at UM are a particularly resilient group who
will often retake courses multiple times to reach the threshold for acceptance into pharmacy
school. If they are retaking a course, it is likely that their last-semester GPA is going to be
relatively low. Finally, it is also true that the better students tend to get accepted into the
professional program which might help explain why those in later years reported higher GPAs.
The second set of hypotheses, those examining the relationship between motivation and
academic commitment, received mixed support. Hypothesis 2a predicted that higher levels of
internal regulation would result in higher levels of academic commitment. This hypothesis was
supported by the composite measure of academic commitment as well as two of the three
50
subscales of commitment. The only commitment measure not shown to be related to internal
regulation was normative commitment. Since normative commitment is related to adhering to
reference group norms, this might suggest that pharmacy students’ reference groups do not place
high value on internal rewards such as intellectual pleasure or satisfaction.
Hypothesis 2b, which predicted that the more externally regulated a student is, the less
commitment he or she would exhibit, was generally not supported by my results. While external
regulation and overall academic commitment were shown to be related at a statistically
significant level in the external regulation-only model, their relationship was in the opposite
direction than predicted. Upon reflection, this is not necessarily inconsistent with general logic.
If students are mostly motivated by some external force (e.g., money or prestige), it is not
surprising that they are highly committed to taking the necessary steps to reach those goals. In
this case, it is necessary to finish pharmacy school to become a pharmacist. However, when
external regulation was included in the combined model, its predictive power was substantially
decreased. Additionally, including information about students’ external regulation scores in the
regression model did nothing to improve the explained variance in overall academic commitment
scores. While this does not support the hypothesis that external regulation would have a negative
relationship with commitment, it does suggest that internal regulation is more important in
predicting a student’s academic commitment.
Even if we examine academic commitment broken down into its three subscales, only
one subscale supports Hypothesis 2b. Continuance commitment in both the external regulation-
only model and the combined model was negatively related to external regulation, as predicted.
This suggests that students who are looking for a high paying career (or other external rewards)
realize there are other ways to achieve their goals. Exactly why they choose to pursue pharmacy
51
could be due to any number of variables not included in these models. Perhaps it is a simple cost-
benefit analysis of the time required to obtain the Pharm.D. degree versus the benefits of the
career (as outlined in the Introduction to this thesis). Or perhaps these students have a preference
for science-related fields. Further research that explores motivations outside of the SDT typology
may be necessary to definitively make any conclusions regarding the relationship between
continuance commitment and academic motivation.
The final set of hypotheses predicted the relationships between motivation and academic
satisfaction. In the separate models, internal regulation was a significant predictor of academic
satisfaction in the predicted direction, while external regulation was not. However, when I
included both variables in the same model, internal regulation maintained its positive
relationship with academic satisfaction, while external regulation was shown to be negatively
related to satisfaction, as the hypotheses predicted. Thus, when I accounted for both types of
motivation and all of the control variables, Hypotheses 3a and 3b were both supported. Exactly
why external regulation was only negatively related to satisfaction in the combined model is
unclear and further research would be necessary to fully explore the relationship. While
diagnostic statistics suggest no mathematical anomalies with these models, replication is
necessary to test whether this is unique to my subjects or true for all pharmacy students.
Limitations and Future Research
While this study went beyond previous studies by including students at all levels of the
pharmacy education in the sample and examining the relationships between motivation and
various educational outcomes, there are still possible limitations that must be acknowledged.
First and foremost, this study uses subjects only from The University of Montana. The
demographics of UM are very different from other campuses and universities in other regions of
52
the nation. The sample in this study was nearly 90% white. Future research could broaden the
scope of this project by including other schools of pharmacy and other institutions where
students pursue a pre-pharmacy curriculum in order to provide a more geographically and
racially diverse sample. This would provide a more representative sample of students from which
broader generalizations could be made.
As with most survey research, there should also be some hesitation when interpreting
self-reported data. In general, students may not read questions fully or even misunderstand
questions. Some of the data collected in this study (especially GPA) may have been improved by
collecting it from university records instead of having students self-report. While more accurate,
obtaining such records is not always easy, especially when confidentiality is considered. Finally,
the nature of the data collection may have encouraged some students to finish the survey as
quickly as possible. Since the survey was distributed at the end of most classes, there was some
incentive for students to finish quickly so they could leave early. This may have contributed to
not reading questions fully or answering dishonestly. The ideal time to distribute the survey is
probably at the beginning of a class, but this is also the most disruptive and time consuming.
In addition to concerns about the validity of self-report data, it is also important to
address the general validity of all of the measures used. As previously mentioned, my
measurement of internal and external regulation came from the pre-established academic
motivation scale (AMS). The AMS has been used extensively and validated by a number of
researchers, suggesting it does in fact measure the motivational constructs outlined in SDT.
However, I adapted the scale slightly, rewording questions and changing the response categories.
While these changes were not drastic, prior tests of validity may no longer apply. It is also
important to address the fact that, despite researchers validating the AMS in American
53
populations, the instrument was developed with a Canadian population in mind. Whether the
differences between the two populations are large enough to warrant any serious problems is
questionable, but some researchers have suggested that this potential limitation at least be
acknowledged (Cokley et al. 2001).
The measures of commitment and satisfaction used in this study also came from
established scales, but neither had been used as extensively as the AMS. Following the pre-
testing of the instrument, I assessed the face validity of these two scales (and the rest of the
survey) through debriefing interviews with participants. Pre-testers generally indicated that the
measures accurately represented what they were intended to measure. Furthermore, factor
analysis of my commitment measures suggested a similar factor structure to the Hellman and
Williams-Miller (2005) commitment scale. However, with so little research done using these
questions, it is difficult to say to what extent they are accurately measuring academic
commitment. A similar situation exists with the satisfaction scale. Factor analysis suggested a
single component measure, but this only indicates that each of the items measured something
similar. Ultimately, further studies that explicitly validate the measures as well as replicate and
reproduce similar findings will strengthen our inferential abilities regarding these relationships.
The use of GPA as a measure of performance was briefly mentioned above, but requires
further discussion. Despite being calculated and reported in a manner that allows for
comparisons between groups, how grades are assigned varies drastically by course. Depending
on which courses a student takes (or who teaches those courses), his or her GPA could be
dramatically impacted. Additionally, in many programs, grading tends to become more relaxed
in later years. This means that the GPA of students in later years may be artificially inflated and
not an accurate representation of true academic performance. Future research should seriously
54
evaluate how well GPA measures performance and consider using other options for measuring
performance.
Finally, many of the regression models presented above produced relatively low R2
values. This suggests that there are many other factors beyond motivation and the control
variables that are related to students’ academic performance, commitment, and satisfaction.
While it was not the goal of this research to necessarily suggest that motivation was the defining
factor in students’ educational outcomes, it may be helpful to further explore what other
variables are related to each of my dependent variables. For instance, social characteristics of
each respondent such as family support, past experiences with pharmacy and other health
professions, and personal interests are not well represented in this study. Additionally, cognitive
variables such as intelligence or developmental ability may help explain more variation in my
dependent variables, especially performance (which motivation was not significantly related to).
In addition to addressing some of these limitations, future research that offers a direct
comparison of pharmacy students to other health professions is necessary. The purpose of this
thesis was not to draw conclusions about how pharmacy students relate to other health
professions students, but, as outlined in the introduction, there are noticeable differences. While
other health profession students are not necessarily completely devoid of external motivations,
there is a relatively clear difference between pharmacy and similar professions. Exactly what
these differences in motivation mean for each respective group’s education and future careers is
not clear at this point. Comprehensive research that includes students from multiple health
professions and institutions might allow for direct comparisons to be made.
Conclusion
55
Despite some of the limitations described, the results do have important implications.
Even without support for many of my hypotheses, a lot can still be said about the impacts of
motivation on education. For instance, in nearly all cases, internal regulation was more positively
related to each educational outcome than external regulation. Even though external regulation
was not shown to have a negative relationship with most of the dependent variables, internal
regulation was shown to be a more positive predictor in nearly all cases. This suggests that
pharmacy students who have high levels of internal regulation will also generally have higher
academic commitment and satisfaction. In short, externally regulated students are not necessarily
―bad,‖ but internally regulated students seem to be better.
While these results do not provide explicit support for self-determination theory, they do
suggest that an effort should be made to promote internal regulation among students. One way to
do this is by providing an autonomy supportive environment. This means that either focus should
be taken away from external rewards or incentives, or more emphasis should be placed on
individual autonomy and supporting individual interests. By promoting the idea of autonomy
among students, they are more likely to see the internal rewards in what they are doing. Ideally,
students would then develop more internally regulated motivations, which tend to be related to
more positive outcomes (at least commitment and satisfaction in this study). Pharmacy programs
are at a distinct disadvantage in this realm because the external rewards for a pharmacy career
are so apparent and influential. Thus, advisors and professors have to work harder to provide an
environment which supports and encourages students to recognize the internal rewards that the
pharmacy education and profession offers. This is especially important for pre-pharmacy
students who may only see pharmacy as a way to make good money. Any way that pharmacy
programs can promote the internally rewarding aspects of the pharmacy career and actually have
56
students buy into the idea should help produce more positive outcomes for students in school and
in their future careers.
There is more work to be done to fully understand exactly how motivation is related to
various educational outcomes. Even though motivations are not the only contributing factor to
students’ educational experiences and outcomes, this research shows that they do play an
important role. Better understanding these relationships can strengthen our conceptions of higher
education and allow faculty and advisors to provide students the best education possible. The
findings presented above place us one step closer to this goal and will be useful for informing
and advancing future research in the area.
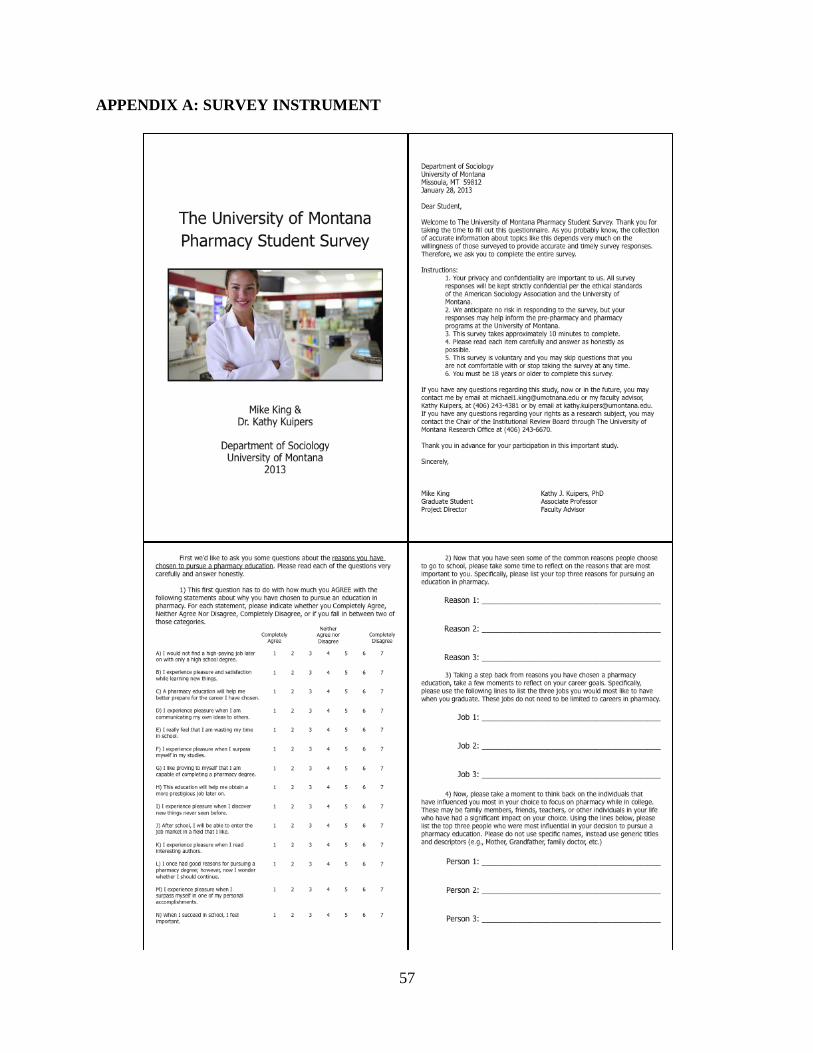
57
APPENDIX A: SURVEY INSTRUMENT
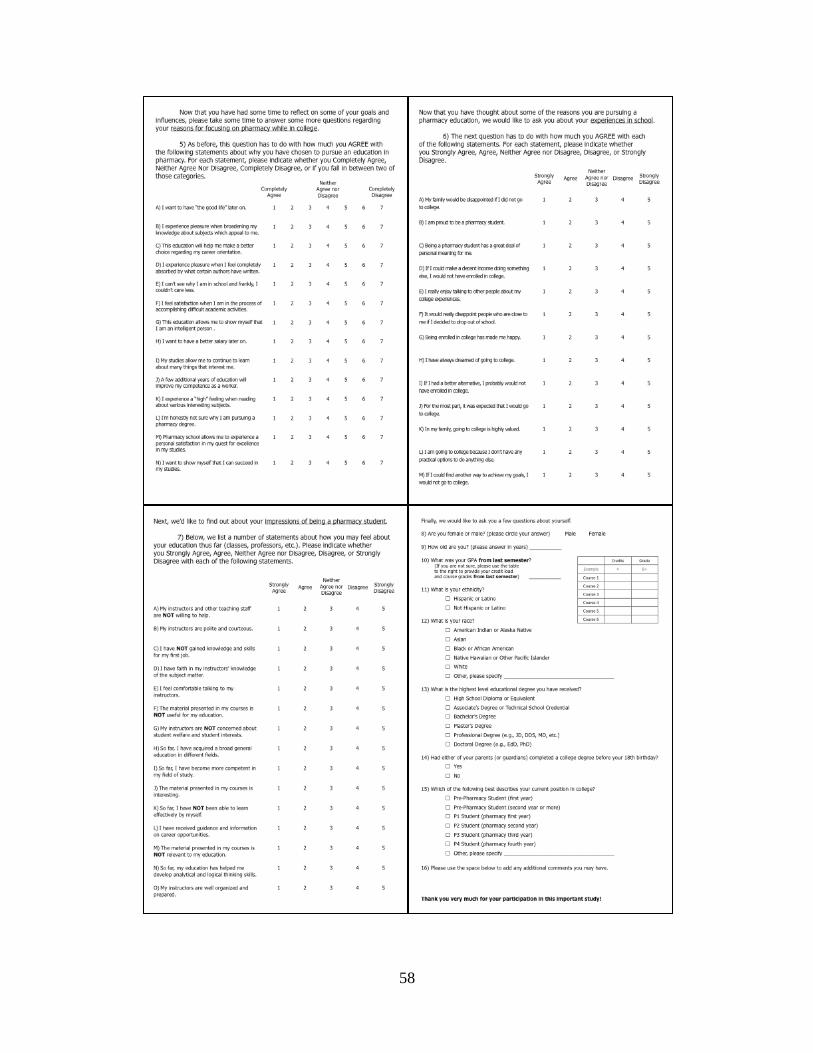
58
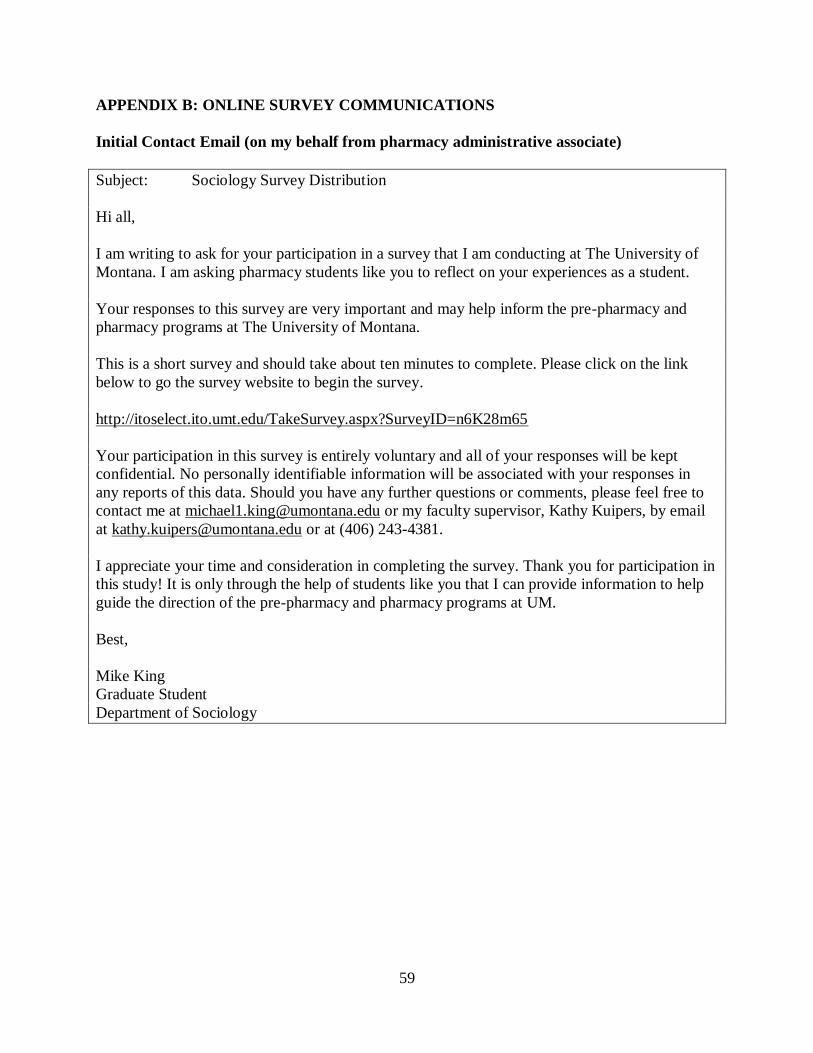
59
APPENDIX B: ONLINE SURVEY COMMUNICATIONS
Initial Contact Email (on my behalf from pharmacy administrative associate)
Subject: Sociology Survey Distribution
Hi all,
I am writing to ask for your participation in a survey that I am conducting at The University of
Montana. I am asking pharmacy students like you to reflect on your experiences as a student.
Your responses to this survey are very important and may help inform the pre-pharmacy and
pharmacy programs at The University of Montana.
This is a short survey and should take about ten minutes to complete. Please click on the link
below to go the survey website to begin the survey.
http://itoselect.ito.umt.edu/TakeSurvey.aspx?SurveyID=n6K28m65
Your participation in this survey is entirely voluntary and all of your responses will be kept
confidential. No personally identifiable information will be associated with your responses in
any reports of this data. Should you have any further questions or comments, please feel free to
contact me at [email protected] or my faculty supervisor, Kathy Kuipers, by email
at [email protected] or at (406) 243-4381.
I appreciate your time and consideration in completing the survey. Thank you for participation in
this study! It is only through the help of students like you that I can provide information to help
guide the direction of the pre-pharmacy and pharmacy programs at UM.
Best,
Mike King
Graduate Student
Department of Sociology
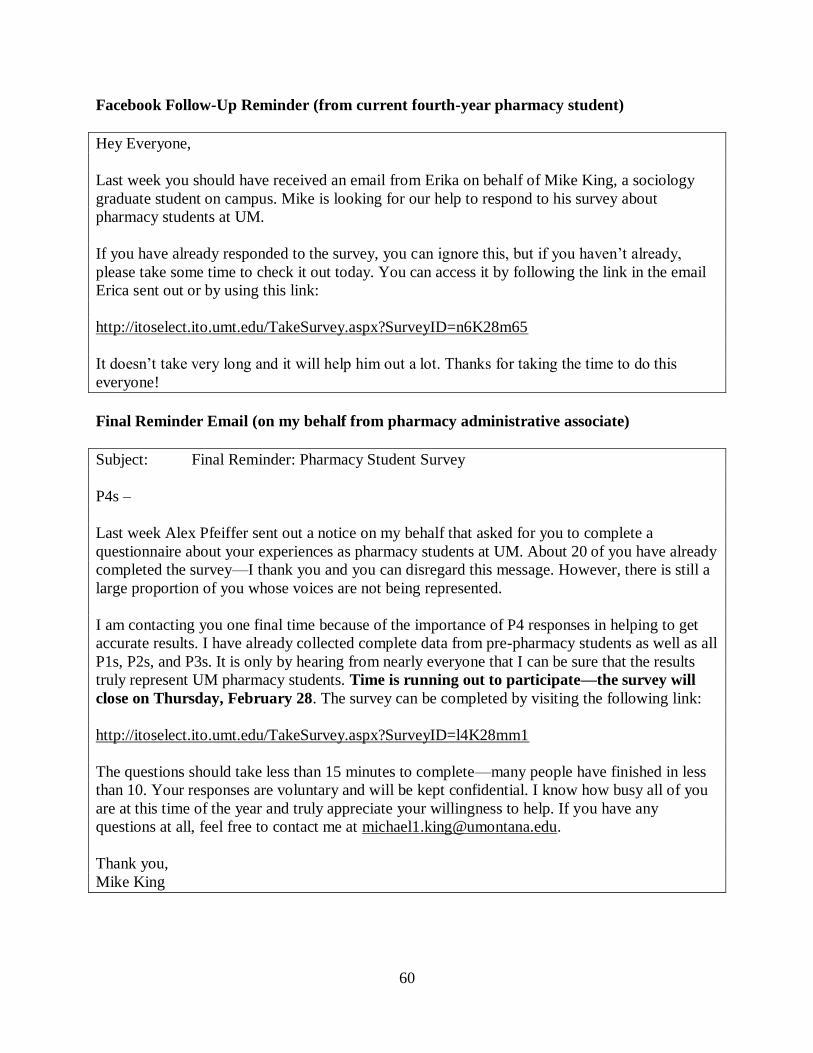
60
Facebook Follow-Up Reminder (from current fourth-year pharmacy student)
Hey Everyone,
Last week you should have received an email from Erika on behalf of Mike King, a sociology
graduate student on campus. Mike is looking for our help to respond to his survey about
pharmacy students at UM.
If you have already responded to the survey, you can ignore this, but if you haven’t already,
please take some time to check it out today. You can access it by following the link in the email
Erica sent out or by using this link:
http://itoselect.ito.umt.edu/TakeSurvey.aspx?SurveyID=n6K28m65
It doesn’t take very long and it will help him out a lot. Thanks for taking the time to do this
everyone!
Final Reminder Email (on my behalf from pharmacy administrative associate)
Subject: Final Reminder: Pharmacy Student Survey
P4s –
Last week Alex Pfeiffer sent out a notice on my behalf that asked for you to complete a
questionnaire about your experiences as pharmacy students at UM. About 20 of you have already
completed the survey—I thank you and you can disregard this message. However, there is still a
large proportion of you whose voices are not being represented.
I am contacting you one final time because of the importance of P4 responses in helping to get
accurate results. I have already collected complete data from pre-pharmacy students as well as all
P1s, P2s, and P3s. It is only by hearing from nearly everyone that I can be sure that the results
truly represent UM pharmacy students. Time is running out to participate—the survey will
close on Thursday, February 28. The survey can be completed by visiting the following link:
http://itoselect.ito.umt.edu/TakeSurvey.aspx?SurveyID=l4K28mm1
The questions should take less than 15 minutes to complete—many people have finished in less
than 10. Your responses are voluntary and will be kept confidential. I know how busy all of you
are at this time of the year and truly appreciate your willingness to help. If you have any
questions at all, feel free to contact me at [email protected].
Thank you,
Mike King
61
REFERENCES
Allen, David D. and C.A. Bond. 2001. ―Prepharmacy Predictors of Success in Pharmacy School:
Grade Point Averages, Pharmacy College Admissions Test, Communication Abilities,
and Critical Thinking Skills.‖ Pharmacotherapy 21(7):842–849.
Archer, Jennifer. 1994. ―Achievement Goals as a Measure of Motivation in University Students.‖
Contemporary Educational Psychology 19:430–446.
Baker, Sarah R. 2004. ―Intrinsic, Extrinsic, and Amotivational Orientations: Their Role in
University Adjustment, Stress, Well-Being, and Subsequent Academic Performance.‖
Current Psychology 23(3):189–202.
Ben Natan, Merav and Fainna Becker. 2010. ―Israelis’ Perceived Motivation for Choosing a
Nursing Career.‖ Nurse Education Today 30(4):308–13.
Bengtsson, Mariette, and Bodil Ohlsson. 2010. ―The Nursing and Medical Students Motivation
to Attain Knowledge.‖ Nurse Education Today 30(2):150–156.
Brint, Steven G., Mark Riddle, Lori Turk-Bicakci, and Charles S. Levy. 2005. ―From the Liberal
to the Practical Arts in American Colleges and Universities: Organizational Analysis and
Curricular Change.‖ The Journal of Higher Education 76(2):151–180.
Bureau of Labor Statistics. 2012. ―Occupational Outlook Handbook, 2012-2013 Edition,
Pharmacists.‖ Washington, DC: Department of Labor. Retrieved May 7, 2012
(http://www.bls.gov/ooh/healthcare/pharmacists.htm).
Clemes, Michael D., Christopher E .C. Gan, and Tzu-Hui Kao. 2007. ―University Student
Satisfaction: An Empirical Analysis.‖ Journal of Marketing for Higher Education
17(2):292–325.
62
Cokley, Kevin O., Naijean Bernard, Dana Cunningham, and Janice Motoike. 2001. ―A
Psychometric Investigation of the Academic Motivation Scale Using a United States
Sample.‖ Measurement and Evaluation in Counseling and Development 34:109–119.
Deci, Edward L. and Richard M. Ryan. 1985. Intrinsic Motivation and Self-Determination in
Human Behavior. New York: Plenum Press.
Deci, Edward L. and Richard M. Ryan. 2008. ―Facilitating Optimal Motivation and
Psychological Well-Being Across Life’s Domains.‖ Canadian Psychology 49(1):14–23.
Deci, Edward L., Robert J. Vallerand, Luc G. Pelletier, and Richard M. Ryan. 1991. ―Motivation
and Education: The Self-Determination Perspective.‖ Educational Psychologist 26(3 &
4):325–346.
Draper, Catherine, and Graham Louw. 2007. ―Choosing a Career in Medicine: The Motivations
of Medical Students from the University of Cape Town.‖ Education for Primary Care
18:338–345.
Dweck, Carol S. 1986. ―Motivational Processes Affecting Learning.‖ American Psychologist
41(10):1040–1048.
Fairchild, Amanda J., S. Jeanne Horst, Sara J. Finney, and Kenneth E. Barron. 2005. ―Evaluating
Existing and New Validity Evidence for the Academic Motivation Scale.‖ Contemporary
Educational Psychology 30(3):331–358.
Gagne, Marylene and Edward L. Deci. 2005. ―Self-Determination Theory and Work
Motivation.‖ Journal of Organizational Behavior 26:331–362.
Gallagher, J. W. Clarke and N. Wilson. 2008. ―Understanding the Motivation: A Qualitative
Study of Dental Students’ Choice of Professional Career.‖ European Journal of Dental
Education 12(2):89–98.
63
Gottfried, Adele Eskeles. 1982. ―Relationships Between Academic Intrinsic Motivation and
Anxiety In Children and Young Adolescents.‖ Journal of School Psychology 20(3):205–
215.
Guay, Frédéric. 2005. ―Motivations Underlying Career Decision-Making Activities: The Career
Decision-Making Autonomy Scale (CDMAS).‖ Journal of Career Assessment 13(1):77–
97.
Hastings, Jan K., Donna S. West, L. J. Perrot, and Linda A. Deloney. 2001. ―Pharmacy Student
Motivation: Phase 1 of a Longitudinal Study.‖ American Journal of Pharmaceutical
Education 65:254–258.
Hastings, Jan K., Donna S. West, and Song Hee Hong. 2005. ―Changes in Pharmacy Student
Motivation During Progression Through the Curriculum.‖ American Journal of
Pharmaceutical Education 69(2):251–255.
Hellman, Chan M. and Janice Williams-Miller. 2005. ―A JARCC Toolbox Article -
Development of a Multidimensional Educational Commitment Scale.‖ Journal of Applied
Research in the Community College 13(1):19–30.
Keshishian, Flora. 2010. ―Factors Influencing Pharmacy Students’ Choice of Major and its
Relationship to Anticipatory Socialization.‖ American Journal of Pharmaceutical
Education 74(4):75.
Keshishian, Flora, Joseph M. Brocavich, R. Thomas Boone, and Somnath Pal. 2010. ―Motivating
Factors Influencing College Students’ Choice of Academic Major.‖ American Journal of
Pharmaceutical Education 74(3):46.
Kuncel, Nathan R., Marcus Credé, Lisa L. Thomas, David M. Klieger, Stephanie N. Seiler, and
Sang E. Woo. 2005. ―A Meta-Analysis of the Validity of the Pharmacy College
64
Admission Test (PCAT) and Grade Predictors of Pharmacy Student Performance.‖
American Journal of Pharmaceutical Education 69(3):339–347.
Latif, David A. and Richard Stull. 2001. ―Relationship between an Annual Examination to
Assess Student Knowledge and Traditional Measures of Academic Performance.‖
American Journal of Pharmaceutical Education 65:346–349.
Lavigne, Genevieve L., Robert J. Vallerand, and Paule Miquelon. 2007. ―A Motivational Model
of Persistence in Science Education: A Self-Determination Theory Approach.‖ European
Journal of Psychology of Education 22(3):351–369.
Lin, Yi-Guang, Wilbert J. McKeachie, and Yung Che Kim. 2001. ―College Student Intrinsic
and/or Extrinsic Motivation and Learning.‖ Learning and Individual Differences
13(3):251–258.
Lo, Celia C. 2010. ―How Student Satisfaction Factors Affect Perceived Learning.‖ Journal of the
Scholarship of Teaching and Learning 10(1):47–54.
Mitchell, Ashley. 2012. ―An Analysis of Intrinsic and Extrinsic Factors of Student Motivation
and Academic Performance.‖ MA Thesis, Southern University and A&M College.
Pelletier, Luc G. et al. 1995. ―Toward a New Measure of Intrinsic Motivation, Extrinsic
Motivation, and Amotivation in Sports: The Sport Motivation Scale (SMS).‖ Journal of
Sport & Exercise Psychology 17:35–53.
Perrot, L. J., Linda A. Deloney, Jan K. Hastings, Shelia Savell, and Mildred Savidge. 2001.
―Measuring Student Motivation in Health Professions’ Colleges.‖ Advances in Health
Sciences Education 6:193–203.
Rascati, Karen L. 1989. ―Career Choice, Plans, and Commitment of Pharmacy Students.‖
American Journal of Pharmaceutical Education 53(3):228-234.

65
Reissman, Leonard, Ralph V. Platou, S. H. Sledge, and D. H. Malone. 1960. ―The Motivation
and Socialization of Medical Students.‖ Journal of Health and Human Behavior
1(3):174–182.
Saleh, S. D. and John Hyde. 1969. ―Intrinsic vs Extrinsic Orientation and Job Satisfaction.‖
Occupational Psychology 43:47–53.
Tabachnick, Barbara G. and Linda S. Fidell. 2007. Using Multivariate Statistics. Boston, MA:
Pearson Education, Inc.
Taylor, Kevin and Geoffrey Harding. 2007. ―The Pharmacy Degree: The Student Experience of
Professional Training.‖ Pharmacy Education 7(1):83–88.
The Office of University Planning, Budgeting, and Analysis. 2012. Data Digest 2011-2012.
Missoula, MT.
Vallerand, R. J. et al. 1992. ―The Academic Motivation Scale: A Measure of Intrinsic, Extrinsic,
and Amotivation in Education.‖ Educational and Psychological Measurement
52(4):1003–1017.
Vallerand, Robert J. and Robert Bissonnette. 1992. ―Intrinsic, Extrinsic, and Amotivational
Styles as Predictors of Behavior: A Prospective Study.‖ Journal of Personality
60(3):599–620.
Vallerand, Robert J., Michelle S. Fortier, and Frédéric Guay. 1997. ―Self-Determination and
Persistence in a Real-Life Setting: Toward a Motivational Model of High School
Dropout.‖ Journal of Personality and Social Psychology 72(5):1161–1176.
Williams, Geoffrey C., Ronald B. Saizow, and Richard M. Ryan. 1999. ―The Importance of Self-
Determination Theory for Medical Education.‖ Academic Medicine 74(9):992–995.
66
Williams, Geoffrey C., Ronald Saizow, Lisa Ross, and Edward L. Deci. 1997. ―Motivation
Underlying Career Choice for Internal Medicine and Surgery.‖ Social Science &
Medicine 45(11):1705–1713.
Woosley, Sherry A. and Dustin K. Shepler. 2011. ―Understanding the Early Integration
Experiences of First-Generation College Students.‖ College Student Journal 45(4):700–
714.
Related Documents


