Jacksonville State University Jacksonville State University JSU Digital Commons JSU Digital Commons Research, Publications & Creative Work Faculty Scholarship & Creative Work 7-4-2020 Motivating Language and Employee Outcomes: A Multinational Motivating Language and Employee Outcomes: A Multinational Investigation Investigation Cau Ngoc Nguyen Wei Ning Albi Alikaj Quoc Nam Tran Follow this and additional works at: https://digitalcommons.jsu.edu/fac_res Part of the Management Sciences and Quantitative Methods Commons

Welcome message from author
This document is posted to help you gain knowledge. Please leave a comment to let me know what you think about it! Share it to your friends and learn new things together.
Transcript
Jacksonville State University Jacksonville State University
JSU Digital Commons JSU Digital Commons
Research, Publications & Creative Work Faculty Scholarship & Creative Work
7-4-2020
Motivating Language and Employee Outcomes: A Multinational Motivating Language and Employee Outcomes: A Multinational
Investigation Investigation
Cau Ngoc Nguyen
Wei Ning
Albi Alikaj
Quoc Nam Tran
Follow this and additional works at: https://digitalcommons.jsu.edu/fac_res
Part of the Management Sciences and Quantitative Methods Commons

Motivating language and employee outcomes: a
multinational investigation Cau Ngoc Nguyen
Faculty of Economics and Business, Hoa Sen University, Ho Chi Minh City, Vietnam
Wei Ning and Albi Alikaj Department of Management and Marketing, Jacksonville State University,
Jacksonville, Alabama, USA, and
Quoc Nam Tran Faculty of Economics and Business, Hoa Sen University,
Ho Chi Minh City, Vietnam
Employee outcomes
Received 4 February 2020
Revised 17 May 2020
Accepted 4 July 2020
Abstract
Purpose – This study aims to examine the impact of managerial use of motivating language on employee absenteeism, turnover intention, job satisfaction and job performance for employees from three nations: India, the USA and Vietnam.
Design/methodology/approach – Data is collected from 614 employees working in India, the USA and Vietnam. A variance-based partial least squares structural equation modeling technique is used to test the hypotheses. In addition, a statistical test is used to examine the statistical differences in the results across the three nations.
Findings – The findings are consistent with the motivating language theory, in that managerial use of motivating language can be an effective strategy in motivating employees. Specifically, motivating language is found to significantly decrease employee absenteeism and turnover intention, as well as significantly increase job satisfaction and performance across the three nations. The effect sizes indicate that, across all samples, motivating language has a medium effect for all employee outcomes, except absenteeism, which is shown to have a small effect size. Moreover, the results indicate that employees in different cultures perceive and interpret the leader’s use of motivating language in different ways. Whereas motivating language may receive greater success in promoting workers’ job performance in eastern cultures, it is also more effective in retaining employees in western cultures.
Originality/value – The study adds to the literature in three major ways. First, it provides evidence for two understudied relationships: motivating language and absenteeism and motivating language and turnover intention. Second, it assesses the generalizability of the motivating language theory by investigating data from India, the USA and Vietnam. Finally, this paper offers a statistical comparison of the three samples to analyze how the relationship between motivating language and worker outcomes differ among the three samples.
Keywords Job performance, Leadership, Absenteeism, Cross-national, Turnover intention,
Job satisfaction, Motivating language
Paper type Research paper
Introduction
Leader communication has long been identified as a critical factor in superior employee motivation and performance (Levering, 1990; Mayfield and Mayfield, 2002;
Management Research Review
© Emerald Publishing Limited
2040-8269
DOI 10.1108/MRR-02-2020-0071
The current issue and full text archive of this journal is available on Emerald Insight at:
https://www.emerald.com/insight/2040-8269.htm
MRR Robbins and Judge, 2016). Motivating language (ML) is one leader communication strategy
that can impact such employee psychological states, and in turn, have positive outcomes for
the employee, the manager, the organization, along with its stakeholders and customers
included (Mayfield and Mayfield, 2018). The extant ML literature has documented that the
leader’s use of ML can significantly increase an employee’s job satisfaction (Mayfield and Mayfield, 2006, 2010; Mayfield et al., 1998; Sharbrough et al., 2006), team performance
(Wang et al., 2009), employee performance (Mayfield and Mayfield, 2006, 2010; Mayfield
et al., 1998), innovation (Mayfield and Mayfield, 2004), intent to stay (Mayfield and Mayfield,
2007), absenteeism (Mayfield and Mayfield, 2009) and communication satisfaction
(Majovski, 2007; Sharbrough et al., 2006).
Given the positive effect that ML can have on employees, one major issue in the literature
of ML remains the generalizability of its effect on worker outcomes (Mayfield and Mayfield,
2018). More specifically, most of the studies linking ML to different worker outcomes have
been conducted in western countries, and there is a scarcity in the number of studies that use
eastern samples. Furthermore, the few studies that have examined the relationship of ML to
different employee outcomes in eastern cultures have found results that were inconsistent
with those found in western cultures (Krause, 2013; Wang et al., 2009). Therefore,
researchers have called for a shift of the ML literature from western settings to eastern
settings to further examine the effect of ML on worker outcomes (Mayfield and Mayfield,
2018).
As such, the purpose of this study is twofold. We first contribute to the generalizability
of the relationship between ML and key worker outcomes by investigating western and
eastern samples. More specifically, we examine the relationship between ML and
employee absenteeism, turnover intention, job satisfaction and job performance, and we
do so by collecting data from employees located in three different countries: India, the
USA and Vietnam. The management literature increasingly seeks to improve the
generalizability of management phenomena by replicating studies in different contexts
(Harzing, 2016; Hubbard et al., 1998), and we argue that the selection of these three
countries would strongly contribute to the generalizability of the relationship between ML
and worker outcomes given that we individually examine in this study one sample
characterized by western culture (USA) and two samples characterized by eastern cultures
(India and Vietnam).
Second, we conduct a statistical comparison of the three samples to analyze how the
relationships between ML and worker outcomes differ among the three samples. The three
countries have strong cultural differences from one another (Hofstede, 2003), and we expect
these differences to play an important role in how effective ML is on employees. We further
expect that most of the differences will appear between the US sample and either one of the
eastern countries, and we do not expect major differences when we compare the two eastern
countries with one another. A comparison of these three samples would provide us with a
better understanding of the effect of ML on the four employee outcomes and attitudes
examined in this study. Figure 1 shows the conceptual model proposed in this study.
Therefore, the remainder of the paper is structured as follows. We first present the
literature review of ML, and then we develop the hypotheses. The first four hypotheses are
related to the direct relationship of ML with the four employee outcomes, while the other
four hypotheses are related to the comparison of these relationships among the three
countries. Next, the methodology used to test the proposed model is presented. Lastly, we
provide a discussion of the results followed by the theoretical and practical implications,
limitations and concluding remarks.
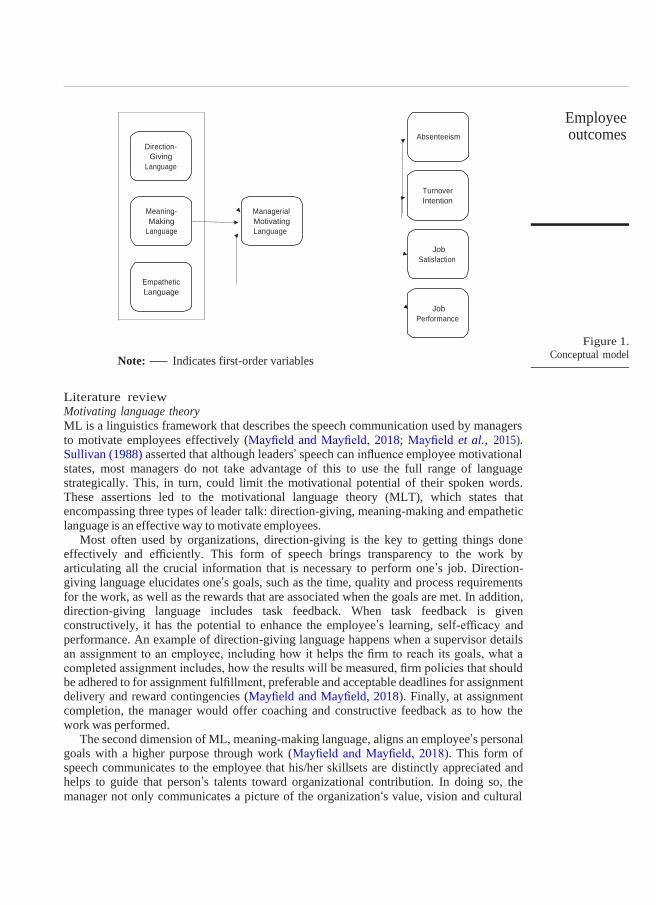
Employee outcomes Absenteeism
Turnover
Intention
Managerial
Motivating
Language
Job
Satisfaction
Job
Performance
Figure 1.
Conceptual model Note: Indicates first-order variables
Literature review Motivating language theory
ML is a linguistics framework that describes the speech communication used by managers
to motivate employees effectively (Mayfield and Mayfield, 2018; Mayfield et al., 2015). Sullivan (1988) asserted that although leaders’ speech can influence employee motivational
states, most managers do not take advantage of this to use the full range of language strategically. This, in turn, could limit the motivational potential of their spoken words. These assertions led to the motivational language theory (MLT), which states that encompassing three types of leader talk: direction-giving, meaning-making and empathetic
language is an effective way to motivate employees. Most often used by organizations, direction-giving is the key to getting things done
effectively and efficiently. This form of speech brings transparency to the work by articulating all the crucial information that is necessary to perform one’s job. Direction- giving language elucidates one’s goals, such as the time, quality and process requirements
for the work, as well as the rewards that are associated when the goals are met. In addition, direction-giving language includes task feedback. When task feedback is given constructively, it has the potential to enhance the employee’s learning, self-efficacy and
performance. An example of direction-giving language happens when a supervisor details an assignment to an employee, including how it helps the firm to reach its goals, what a completed assignment includes, how the results will be measured, firm policies that should be adhered to for assignment fulfillment, preferable and acceptable deadlines for assignment delivery and reward contingencies (Mayfield and Mayfield, 2018). Finally, at assignment completion, the manager would offer coaching and constructive feedback as to how the
work was performed. The second dimension of ML, meaning-making language, aligns an employee’s personal
goals with a higher purpose through work (Mayfield and Mayfield, 2018). This form of speech communicates to the employee that his/her skillsets are distinctly appreciated and helps to guide that person’s talents toward organizational contribution. In doing so, the
manager not only communicates a picture of the organization‘s value, vision and cultural
Direction-
Giving
Language
Meaning-
Making
Language
Empathetic
Language

MRR norms, but also relays to their workers that their work contributes to the bigger picture. Meaning-making language is often informal and conveyed through stories or metaphors. An example of this type of language usage could be a manager speaking of how even the
president of the company attends training sessions held by the firm. This message to the employee would imply that learning and skill development is valued by the organization and relay information to the employee that the firm strives to be a “learning organization,” and that participation at these training events is paramount to the firm success.
Empathetic language, the last dimension of ML, conveys support and compassion for an
employee to relay genuine care for an employee‘s well-being (Mayfield and Mayfield, 2018). It represents the manager’s ability to gain an employee’s perspective and emotionally
connect with the individual. Through empathetic language, a manager can bond with a worker in various circumstances. Some examples include congratulating an employee when he/she performs a challenging task, or in a negative situation, such as giving reassurance to the employee when setbacks or delays occur on a task project. The scope of empathetic language is not limited to job events. It can include words of support, compassion or shared happiness for personal life events. For example, words of heartfelt concern for an individual’s family tragedy. Another type of empathetic message would be to congratulate
an employee on their child’s acceptance into college. A visual depiction of the three dimensions discussed in ML is presented in Figure 2.
For optimal effect, MLT relies on four basic underlying assumptions. First, the leader must match their words with their actions – they must “walk the talk.” The leader’s credibility comes from the actions that reflect their spoken messages. In cases of incongruity, employees tend to interpret leader speech within a behavioral context and rely on actions in lieu of words (Mayfield and Mayfield, 2018). Therefore, any discrepancy
between the leader’s talk and his/her actions, the talk will be considered “cheap talk,” and employees will instead emulate the leader’s behavior rather than following the spoken
directions (Mayfield and Mayfield, 2018). The leader’s capability to “walk the talk” requires the embodiment of both speech and actions because together, they represent the leader’s
intentions (Holmes, 2012; Holmes and Parker, 2017). This assertion is empirically supported in a recent study of educational leadership (Holmes and Parker, 2017). Specifically,
Figure 2.
ML model
Employee outcomes
Holmes and Parker (2017) found results indicating that behavioral integrity and credibility
are required for ML to occur.
Second, ML covers most of leader-to-follower work-related verbal communication. While
other motivational speech models focus solely on direction-giving language and assume that
one’s only need is to understand the current information and informed of new directions, ML
acknowledges that the leader’s role is more complex. According to MLT, a leader must not
only reduce any uncertainties by providing information, but he/she must also make meaning
out of the workplace and make better connections with his/her followers by showing
empathy. Third, even though the scope of ML is limited to leader talk, followers must accurately
interpret the intended ML messages. In other words, the follower must correctly understand
what message the leader is trying to convey. The responsibility rests on both parties to
ensure that the messages are clearly interpreted to make progress and reach organizational
goals. The leader’s responsibility is to inquire whether the message is conveyed, but at the
same time, the followers must make sure that the information is well understood. Most
communication issues arise from inaccuracies and misunderstanding between the two
parties; however, these can be eliminated if the leader receives feedback from the followers
(Robbins et al., 2016). Lastly, the three dimensions of ML must be integrated to achieve
optimal results. Holmes (2012) emphasized that the three dimensions (direction-giving,
meaning-making and empathetic language) should be used in coordination and strategically
integrated to create synergy.
Motivating language and absenteeism
There have been relatively few studies studying the ML–absenteeism relationship (Mayfield
and Mayfield, 2018). From an extensive review of the literature, Mayfield and Mayfield
(2018) found only two papers testing this relationship. The studies testing this relationship
in the USA (Krause, 2013; Mayfield and Mayfield, 2009) have found significant negative
relationships; however, there were no meaningful relationships found on the Singaporean
sample (Krause, 2013). For the US results, the effect sizes between the two variables place its
strength at the 50th percentile in organizational behavior and human resource management.
Mayfield and Mayfield (2018) found that an employee receiving high ML from his/her
manager has a 62% chance of exhibiting less absent behaviors relative to an employee
receiving low ML communications. Moreover, they found that when a manager uses high
ML with his/her employee, the employee will have high absenteeism only 39% of the time
compared to 61% of the time with low ML use. Therefore, we expect:
H1. There is a significant and negative relationship between the manager’s use of ML
and employees’ absenteeism.
Motivating language and turnover intention
Turnover intention has typically been studied with two complementary variables. Intent-to-
stay measures the likelihood that an individual remains with the organization, whereas
intent-to-turnover measures the likelihood that one leaves. Mayfield and Mayfield (2018)
uncovered three studies linking ML to turnover intention. They found that the median
relationship among the studies showed a strength that puts it in the 60th percentile of
organizational behavior and human resource investigations. They also found that an
employee receiving high ML communications from their manager has a 65% chance of

MRR having stronger intent-to-stay compared to an employee receiving lower ML
communications. Thus, we posit:
H2. There is a significant and negative relationship between the manager’s use of ML
and employees’ turnover intention.
Motivating language and job satisfaction
The relationship between ML and job satisfaction has been extensively studied. From a
thorough review of the literature, Mayfield and Mayfield (2018) uncovered 12 studies
examining this relationship. They found that all studies showed a positive and fairly strong
relationship between the two variables, ranging from 0.35–0.65. Combined, Mayfield and
Mayfield (2018) found results indicating that an individual receiving high ML
communications is 70% more likely to be satisfied with his/her job relative to an individual receiving low ML communications. Hence, we hypothesize:
H3. There is a significant and positive relationship between the manager’s use of ML
and employees’ job satisfaction.
Motivating language and job performance
ML and its relationship with job performance has been largely stable across different
contexts and measures (Mayfield and Mayfield, 2018). Mayfield and Mayfield (2018)
combined the existing empirical investigations to uncover some interesting insights. First,
they found that the probability superior score is 60%. This is interpreted to show that a
randomly selected individual receiving high-ML communications is 60% more likely to have
higher job performance than a randomly selected individual receiving low-ML
communications. Second, they found that the relationship between ML and job performance
is higher than 40% of other tested relationships in the organizational behavior and human
resource literatures. Finally, their results showed that 59% of people receiving high ML
communications have high-performance ratings compared to the 41% of people receiving
low ML communications. Based on the empirical evidence in the literature, the following hypothesis is
developed:
H4. There is a significant and positive relationship between the manager’s use of ML
and employees’ job performance.
Motivating language in different cultures
We expect that, among the three countries, there would be a difference in the strengths of the
relationships between a leader’s use of ML and employee outcomes. These differences can
arise from a number of factors. For instance, employees in Asian countries are less likely to
be absent from their organizations because of an element in their culture that places a
disproportionate emphasis on internal social harmony in a group (Felfe and Yan, 2009; Johns
and Xie, 1998). Therefore, given the fact that employees in collectivist cultures respond more
favorably to managerial practices that promote social harmony than those in individualistic
cultures, we expect that managers’ use of ML may have a stronger effect on absenteeism for
Indian and Vietnamese samples as opposed to the US sample. Thus, we posit:
Employee outcomes
H5. The negative relationship between ML and absenteeism will be stronger for the Vietnamese and Indian samples than for the US sample.
In addition, cultural differences may also play a role in the degree of employee turnover intention. For instance, employees in Asian cultures are characterized by a higher degree of
normative commitment, which makes them less likely to think about leaving their organization. On the other hand, US employees are less attached to a single company and are more likely to think about switching companies if they think it will benefit their professional development (Hofstede et al., 2010). Therefore, a leader’s use of ML will have a
stronger effect in retaining US employees as opposed to employees from India or Vietnam who are more likely to feel that their professional development does not involve jumping from company to company. As such, we hypothesize:
H6. The negative relationship between ML and turnover intention will be weaker for the Vietnamese and Indian samples than for the US sample.
Moreover, employees from different cultures may have varying expectations regarding what constitutes a satisfying job. For example, when it comes to organizational communication, in high power-distance cultures, the communication about how the job should be done is
more unidirectional, in which managers tell followers how to perform their jobs, and followers are expected to perform the tasks as directed by the managers, whereas in low power-distance cultures, employees are more likely to ask for suggestions from their employees, thus giving employees a higher degree of empowerment in decision-making processes (Madlock, 2012). Therefore, it is likely that employees in high power-distance cultures would feel more comfortable with a job environment in which the unidirectional communication between leaders and followers is more motivational, whereas low power-
distance employees may find more satisfaction in other aspects of the job, such as when providing suggestions and contributing to the decision-making process. Therefore, we posit:
H7. The positive relationship between ML and job satisfaction will be stronger for the Vietnamese and Indian samples than for the US sample.
When it comes to job performance, US employees tend to accumulate the information and knowledge necessary to perform the job from a wider range of sources, which makes them rely less on their managers telling them how to do the job. Whereas employees from India or
Vietnam may rely more on their managers as opposed to other sources such as formal training programs (Thang and Quang, 2007; Yadapadithaya and Stewart, 2003). Therefore, given that employees from India and Vietnam consider their managers to be a more important source of information and knowledge when it comes to learning how to perform their jobs, their performance may be more strongly affected than US employees when leaders use ML. Hence, we make the following hypothesis:
H8. The positive relationship between ML and job performance will be stronger for the Vietnamese and Indian samples than for the US sample.
Methodology Sample
Participants for this study were drawn from the Mechanical Turk website. This website provides a mechanism for posting job assignments. The postings can be completed by individuals across the world for a specified amount of compensation. This potential

MRR respondent pool is a useful method of recruiting participants for experiments or psychological surveys (Nguyen et al., 2016). Huff and Tingley (2015) investigated the demographic characteristics of US Mechanical Turk workers and found that these respondents’ characteristics were consistent with the work characteristics of the general US working population. In addition, several researchers (Buhrmester et al., 2016) have verified that the Mechanical Turk responses are generalizable to the population. Moreover, Peer et al. (2014) found that the worker reputation feedback mechanism instituted on the Mechanical Turk website provided a strong motivation for respondents to conscientious and accurate answers in research settings.
The respondents were recruited by posting a solicitation for workers in three countries: India, the USA and Vietnam. The respondents were provided a monetary incentive of US $0.50 for survey completion about their workplace environment. The average completion times were 18 min for Indian respondents, 16 min for respondents from the USA and 19 min for Vietnamese respondents. The solicitation was for 200 respondents from each country, which surpasses the minimum standard sample size of 160 set forth by Kock and Hadaya (2018). In the end, 201 people completed the survey for the Indian sample, 206 for the US sample and 207 for the Vietnamese sample.
Across the three samples, the majority of respondents were men: 55% in India, 62% in the USA and 72% in Vietnam. The average age of respondents in India is about 27, which is younger than the average respondent in both the USA (about 34) and Vietnam (about 31). In addition, US respondents varied more in age (standard deviation = 10.88) compared to both India (standard deviation = 4.82) and Vietnam (standard deviation = 7.40). The median respondent’s full-time experience was ten years for India, 11.5 years for the USA and 11 years for Vietnam. The respondents from the three countries reported a variety of job types. For India, respondents self-classified as having skilled labor (57%), with 37% choosing highly skilled/professional jobs and 6% choosing unskilled labor as their job classification. The majority of US respondents are classified as having highly skilled/professional jobs (55%), followed by skilled labor (36%) and unskilled labor (9%). The respondents from Vietnam reported 48% each for highly skilled/professional jobs and skilled labor.
Statistical technique
The proposed model was analyzed using a partial least squares structural equation modeling (PLS-SEM). This technique allows for simultaneous testing of a proposed model’s fit with collected data, the significance of the relationships between variables and the strength of those relationships. PLS-SEM analysis is well suited for exploring such behavioral interactions as the hypothesized synergistic relationships between ML’s components (Schumacker and Lomax, 2004) and is consistent with previous ML research (Mayfield and Mayfield, 2007, 2009). PLS-SEM is used for the investigation for several reasons. First, this technique allows for simultaneous estimation of two or more relationships among variables (Shook et al., 2004). Second, this method allows for the estimation of latent variables. Third, this type of analysis generally produces more valid estimations because it controls for measurement error (Dion, 2008). Lastly, the relatively small sample sizes and a large number of items produced an unfavorable item-to-cases ratio. Therefore, we rely on PLS-SEM because of its relaxed requirements on sample and data distribution (Kock, 2017).
Measurements
Independent variable. Managerial use of ML was measured by the ML 24-item scale (Mayfield et al., 1995). The instrument’s reliability and validity have been tested in various
Employee outcomes
studies (Mayfield et al., 1995, 1998; Mayfield and Mayfield, 2016). The scale is comprised of subscales that ask the respondent how often his/her supervisor uses direction-giving language, meaning-making language and empathetic language. The indicators were measured on a five-point Likert scale, ranging from 1 = very seldom to 5 = always. ML is a second-order latent variable that is modeled as reflective to minimize measurement error from perceptual statements and reduce collinearity (Gefen, et al., 2000; Schumacker and Lomax, 2004).
Dependent variables. Turnover intention is measured with a five-item scale developed by Bozeman and Perrewé (2001). This scale uses a five-point Likert scale ranging from 1 = strongly disagree to 5 = strongly agree. Absenteeism is measured using an existing attitude toward absenteeism scale (Mayfield and Mayfield, 2009). This scale uses a ten-item scale developed by Mayfield and Mayfield (2009). Job satisfaction is operationalized with a five-item scale developed by Hackman and Oldham (1974). Absenteeism and job satisfaction are also measured on a five-point Likert scale, ranging 1 = strongly disagree to 5 = strongly agree. Job performance is measured with a nine-item scale developed by Mayfield and Mayfield (2006). This scale was an adaptation of Mott’s team performance measurement (Mott, 1972), and it has been shown to have high correlations with multiple performance measures. This scale uses a seven-point Likert scale, ranging from 1 = below average to 7 = excellent, to ascertain an individual’s performance relative to his or her co-worker’s performance. These scales can be found in Appendix 1 (in English) and Appendix 2 (in Vietnamese).
Survey translation
A standard back-translation process consistent with the recommendations of Brislin (1970) to administer the survey for the respondents from Vietnam was used for this study. The instrument was first translated from English to Vietnamese by the researcher, a Vietnamese-American fluent in both languages. In addition, a second fluent English and Vietnamese speaker, a college provost at a college in Ho Chi Minh City, Vietnam, back- translated the survey from Vietnamese to English. The two versions were compared and discussed to minimize any significant changes in translations. No major alterations in meanings were found between the two versions. To validate this, a third person, fluent in English and Vietnamese, currently an assistant professor in English at a university in South Vietnam analyzed whether there was any loss of meaning as a result of the translation or the back-translation. She confirmed that both versions of the survey still hold the same meaning.
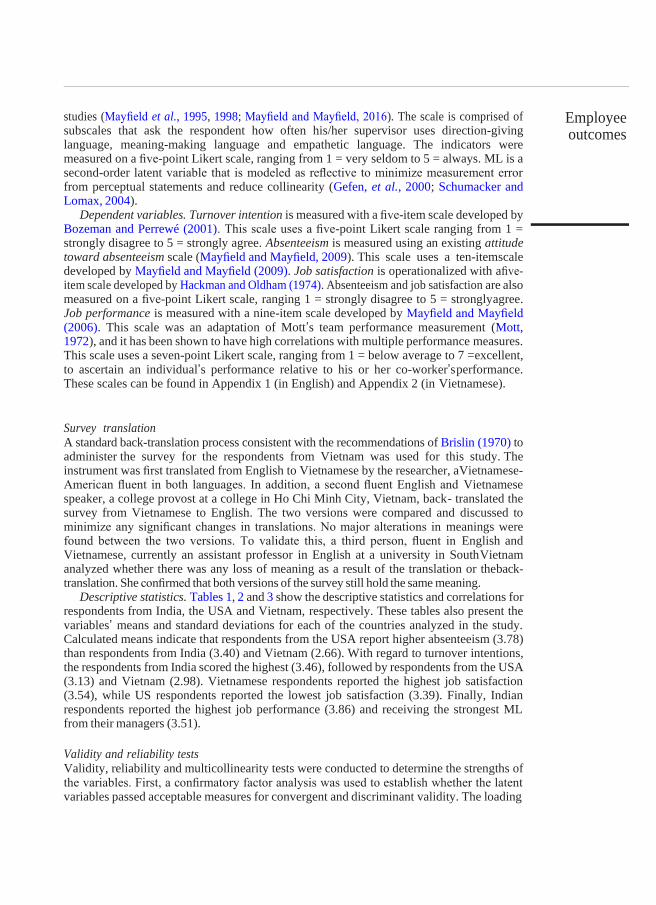
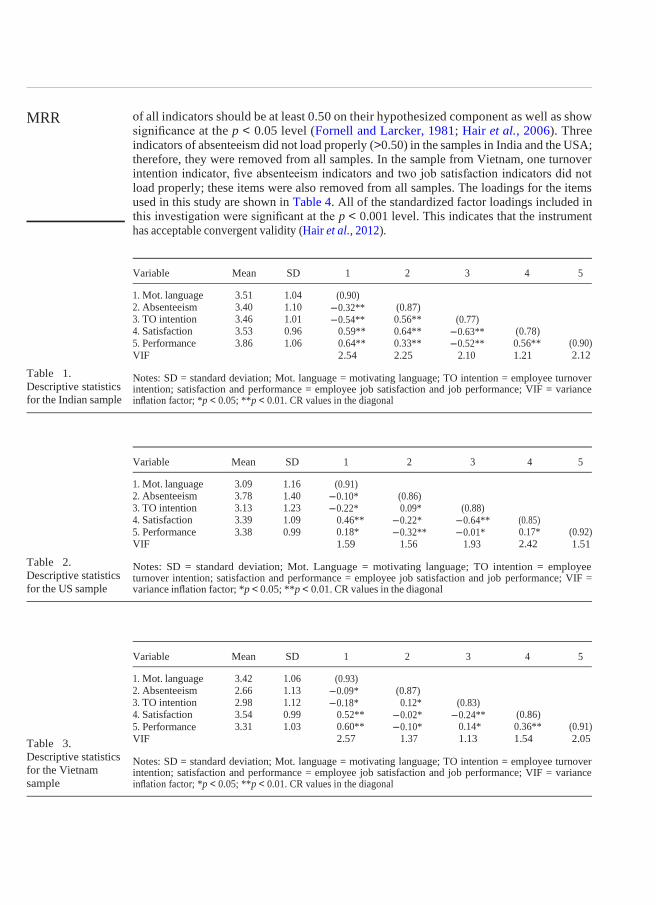
Descriptive statistics. Tables 1, 2 and 3 show the descriptive statistics and correlations for respondents from India, the USA and Vietnam, respectively. These tables also present the variables’ means and standard deviations for each of the countries analyzed in the study. Calculated means indicate that respondents from the USA report higher absenteeism (3.78) than respondents from India (3.40) and Vietnam (2.66). With regard to turnover intentions, the respondents from India scored the highest (3.46), followed by respondents from the USA (3.13) and Vietnam (2.98). Vietnamese respondents reported the highest job satisfaction (3.54), while US respondents reported the lowest job satisfaction (3.39). Finally, Indian respondents reported the highest job performance (3.86) and receiving the strongest ML from their managers (3.51).
Validity and reliability tests
Validity, reliability and multicollinearity tests were conducted to determine the strengths of the variables. First, a confirmatory factor analysis was used to establish whether the latent variables passed acceptable measures for convergent and discriminant validity. The loading
MRR of all indicators should be at least 0.50 on their hypothesized component as well as show significance at the p < 0.05 level (Fornell and Larcker, 1981; Hair et al., 2006). Three
indicators of absenteeism did not load properly (>0.50) in the samples in India and the USA; therefore, they were removed from all samples. In the sample from Vietnam, one turnover intention indicator, five absenteeism indicators and two job satisfaction indicators did not
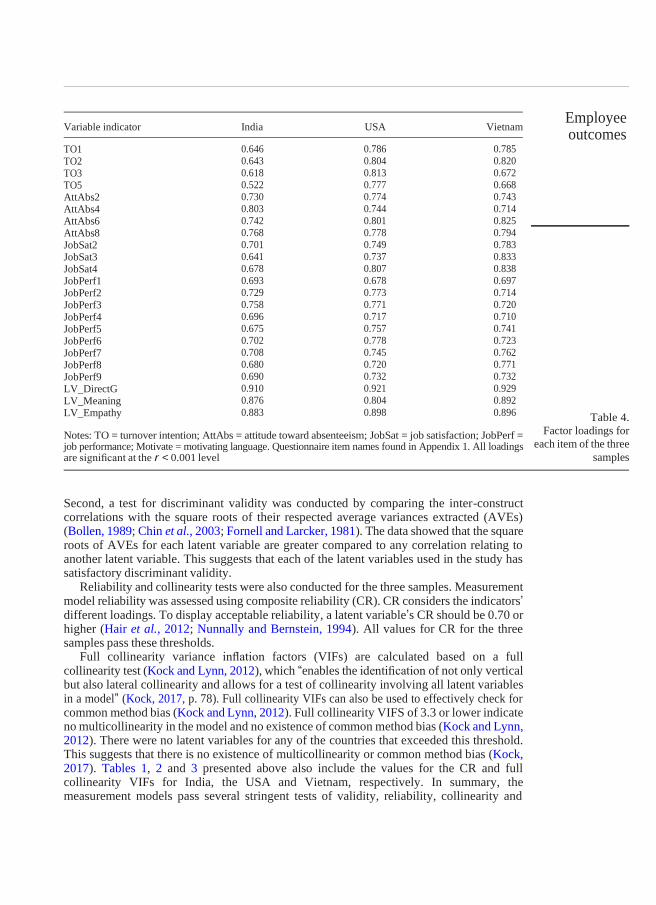
load properly; these items were also removed from all samples. The loadings for the items used in this study are shown in Table 4. All of the standardized factor loadings included in this investigation were significant at the p < 0.001 level. This indicates that the instrument has acceptable convergent validity (Hair et al., 2012).
Variable Mean SD 1 2 3 4 5
1. Mot. language 2. Absenteeism 3. TO intention 4. Satisfaction 5. Performance VIF
3.51 3.40 3.46 3.53 3.86
1.04 1.10 1.01 0.96 1.06
(0.90)
-0.32** (0.87) 0.56** 0.64** 0.33** 2.25
-0.54** (0.77) 0.59** 0.64** 2.54
-0.63** (0.78) 0.56** 1.21
-0.52** (0.90) 2.12 2.10
Table 1.
Descriptive statistics
for the Indian sample
Notes: SD = standard deviation; Mot. language = motivating language; TO intention = employee turnover intention; satisfaction and performance = employee job satisfaction and job performance; VIF = variance inflation factor; *p < 0.05; **p < 0.01. CR values in the diagonal
Variable Mean SD 1 2 3 4 5
1. Mot. language 2. Absenteeism 3. TO intention 4. Satisfaction 5. Performance VIF
3.09 3.78 3.13 3.39 3.38
1.16 1.40 1.23 1.09 0.99
(0.91) -0.10* (0.86)
0.09* -0.22* (0.88) 0.46** -0.22* -0.64** (0.85)
0.17* 2.42
0.18* 1.59
-0.32** -0.01* (0.92) 1.51 1.56 1.93
Table 2.
Descriptive statistics
for the US sample
Notes: SD = standard deviation; Mot. Language = motivating language; TO intention = employee turnover intention; satisfaction and performance = employee job satisfaction and job performance; VIF = variance inflation factor; *p < 0.05; **p < 0.01. CR values in the diagonal
Variable Mean SD 1 2 3 4 5
1. Mot. language 2. Absenteeism 3. TO intention 4. Satisfaction
5. Performance VIF
3.42 2.66 2.98 3.54 3.31
1.06 1.13 1.12 0.99 1.03
(0.93) -0.09* (0.87)
0.12* -0.18* (0.83) 0.52** -0.02* -0.24** (0.86)
0.36** 1.54
0.60** 2.57
-0.10* 0.14* 1.13
(0.91) 2.05 1.37 Table 3.
Descriptive statistics
for the Vietnam
sample
Notes: SD = standard deviation; Mot. language = motivating language; TO intention = employee turnover intention; satisfaction and performance = employee job satisfaction and job performance; VIF = variance inflation factor; *p < 0.05; **p < 0.01. CR values in the diagonal
Employee outcomes
Variable indicator India USA Vietnam
TO1 TO2 TO3 TO5 AttAbs2 AttAbs4 AttAbs6 AttAbs8 JobSat2 JobSat3 JobSat4 JobPerf1 JobPerf2 JobPerf3 JobPerf4 JobPerf5 JobPerf6 JobPerf7 JobPerf8 JobPerf9 LV_DirectG LV_Meaning LV_Empathy
0.646 0.643 0.618 0.522 0.730 0.803 0.742 0.768 0.701 0.641 0.678 0.693 0.729 0.758 0.696 0.675 0.702 0.708 0.680 0.690 0.910 0.876 0.883
0.786 0.804 0.813 0.777 0.774 0.744 0.801 0.778 0.749 0.737 0.807 0.678 0.773 0.771 0.717 0.757 0.778 0.745 0.720 0.732 0.921 0.804 0.898
0.785 0.820 0.672 0.668 0.743 0.714 0.825 0.794 0.783 0.833 0.838 0.697 0.714 0.720 0.710 0.741 0.723 0.762 0.771 0.732 0.929 0.892 0.896
Table 4.
Factor loadings for
each item of the three
samples
Notes: TO = turnover intention; AttAbs = attitude toward absenteeism; JobSat = job satisfaction; JobPerf = job performance; Motivate = motivating language. Questionnaire item names found in Appendix 1. All loadings are significant at the r < 0.001 level
Second, a test for discriminant validity was conducted by comparing the inter-construct correlations with the square roots of their respected average variances extracted (AVEs) (Bollen, 1989; Chin et al., 2003; Fornell and Larcker, 1981). The data showed that the square roots of AVEs for each latent variable are greater compared to any correlation relating to another latent variable. This suggests that each of the latent variables used in the study has satisfactory discriminant validity.
Reliability and collinearity tests were also conducted for the three samples. Measurement model reliability was assessed using composite reliability (CR). CR considers the indicators’ different loadings. To display acceptable reliability, a latent variable’s CR should be 0.70 or higher (Hair et al., 2012; Nunnally and Bernstein, 1994). All values for CR for the three samples pass these thresholds.
Full collinearity variance inflation factors (VIFs) are calculated based on a full collinearity test (Kock and Lynn, 2012), which “enables the identification of not only vertical but also lateral collinearity and allows for a test of collinearity involving all latent variables in a model” (Kock, 2017, p. 78). Full collinearity VIFs can also be used to effectively check for common method bias (Kock and Lynn, 2012). Full collinearity VIFS of 3.3 or lower indicate no multicollinearity in the model and no existence of common method bias (Kock and Lynn, 2012). There were no latent variables for any of the countries that exceeded this threshold. This suggests that there is no existence of multicollinearity or common method bias (Kock, 2017). Tables 1, 2 and 3 presented above also include the values for the CR and full collinearity VIFs for India, the USA and Vietnam, respectively. In summary, the measurement models pass several stringent tests of validity, reliability, collinearity and
MRR common method bias. This indicates that the results of the SEM can be trusted and are free from data measurement problems (Kline, 2015; Schumacker and Lomax, 2004).
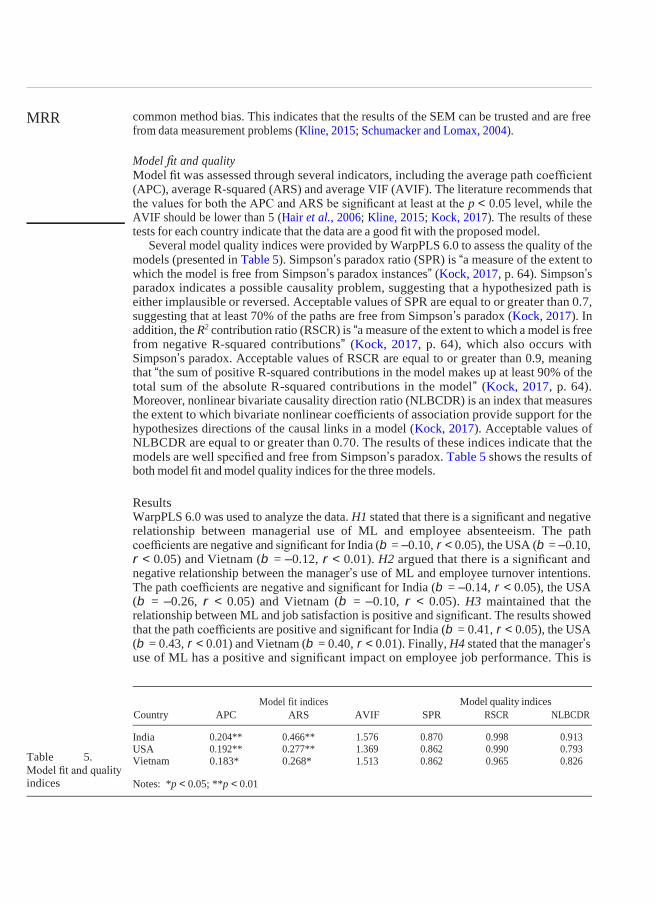
Model fit and quality
Model fit was assessed through several indicators, including the average path coefficient (APC), average R-squared (ARS) and average VIF (AVIF). The literature recommends that the values for both the APC and ARS be significant at least at the p < 0.05 level, while the AVIF should be lower than 5 (Hair et al., 2006; Kline, 2015; Kock, 2017). The results of these tests for each country indicate that the data are a good fit with the proposed model.
Several model quality indices were provided by WarpPLS 6.0 to assess the quality of the models (presented in Table 5). Simpson’s paradox ratio (SPR) is “a measure of the extent to which the model is free from Simpson’s paradox instances” (Kock, 2017, p. 64). Simpson’s paradox indicates a possible causality problem, suggesting that a hypothesized path is either implausible or reversed. Acceptable values of SPR are equal to or greater than 0.7, suggesting that at least 70% of the paths are free from Simpson’s paradox (Kock, 2017). In addition, the R2 contribution ratio (RSCR) is “a measure of the extent to which a model is free from negative R-squared contributions” (Kock, 2017, p. 64), which also occurs with Simpson’s paradox. Acceptable values of RSCR are equal to or greater than 0.9, meaning that “the sum of positive R-squared contributions in the model makes up at least 90% of the total sum of the absolute R-squared contributions in the model” (Kock, 2017, p. 64). Moreover, nonlinear bivariate causality direction ratio (NLBCDR) is an index that measures the extent to which bivariate nonlinear coefficients of association provide support for the hypothesizes directions of the causal links in a model (Kock, 2017). Acceptable values of NLBCDR are equal to or greater than 0.70. The results of these indices indicate that the models are well specified and free from Simpson’s paradox. Table 5 shows the results of both model fit and model quality indices for the three models.
Results WarpPLS 6.0 was used to analyze the data. H1 stated that there is a significant and negative relationship between managerial use of ML and employee absenteeism. The path coefficients are negative and significant for India (b = –0.10, r < 0.05), the USA (b = –0.10, r < 0.05) and Vietnam (b = –0.12, r < 0.01). H2 argued that there is a significant and negative relationship between the manager’s use of ML and employee turnover intentions. The path coefficients are negative and significant for India (b = –0.14, r < 0.05), the USA (b = –0.26, r < 0.05) and Vietnam (b = –0.10, r < 0.05). H3 maintained that the relationship between ML and job satisfaction is positive and significant. The results showed that the path coefficients are positive and significant for India (b = 0.41, r < 0.05), the USA (b = 0.43, r < 0.01) and Vietnam (b = 0.40, r < 0.01). Finally, H4 stated that the manager’s use of ML has a positive and significant impact on employee job performance. This is
Model fit indices
ARS
Model quality indices
Country APC AVIF SPR RSCR NLBCDR
India USA Vietnam
0.204** 0.192** 0.183*
0.466** 0.277** 0.268*
1.576 1.369 1.513
0.870 0.862 0.862
0.998 0.990 0.965
0.913 0.793 0.826 Table 5.
Model fit and quality
indices Notes: *p < 0.05; **p < 0.01

Employee outcomes
supported as the path coefficients are significant for India (b = 0.31, r < 0.01), the USA
(b = 0.22, r < 0.05) and Vietnam (b = 0.37, r < 0.01).
Table 6 provides a summary of path coefficients and effect sizes for each country sample.
These effect sizes were also calculated in WarpPLS 6.0. These are similar to Cohen’s (1988)
f2 coefficients. They are calculated using a different procedure, but they have a similar
interpretation (Kock, 2017). The effect sizes indicated by path coefficients can be interpreted
as small, medium or large. The values that are recommended are 0.02, 0.15 and 0.35,
respectively (Cohen, 1988). Any coefficients below 0.02 indicate that the relationship is too
weak to be considered relevant (Kock, 2017). The results show medium effect sizes for all of
the paths in all of the samples, except for the ML-absenteeism link for Vietnam. Although it
passes the relevancy check (Kock, 2017), the effect is small (Cohen, 1988).
Table 7 depicts the comparison of path coefficients estimated for each sample using the
Satterthwaite method. H5 states that the negative relationship between ML and absenteeism
will be stronger for the Vietnamese and Indian samples than for the US sample. This hypothesis, however, is not supported by the results, as there is no significant difference in
the path coefficients of the ML–absenteeism linkage across all three samples. H6 indicates
that the negative relationship between ML and turnover intention will be weaker for the
Vietnamese and Indian samples than for the US sample. The test results are
India USA Vietnam
Path Coefficient Effect size Coefficient Effect size Coefficient Effect size
ML
Absenteeism Turnover intention Job satisfaction Job performance
-0.10* 0.04 0.18 0.24 0.21
-0.10* 0.13 0.19 0.21 0.26
-0.12** 0.02 0.22 0.21 0.24
-0.14* -0.26* -0.10* 0.41* 0.31**
0.43** 0.22*
0.40** 0.37** Table 6.
Path coefficients and
effect sizes Notes: *p < 0.05; **p < 0.01
Satterthwaite method
Path Coefficient SE Coefficient SE t-value p-value
USA Vietnam ML
Absenteeism Turnover intention Job satisfaction Job performance
ML Absenteeism Turnover intention Job satisfaction Job performance
ML Absenteeism Turnover intention Job satisfaction Job performance
-0.10 0.07 0.07 0.06 0.02
-0.12 0.07 0.07 0.06 0.07
0.20 0.42 0.05 0.40 0.02
-0.26 -0.10 -1.62 0.43 0.22
India
0.40 0.37
Vietnam
0.25 -2.06
0.23 -0.10 0.07
0.07 0.07 0.07
-0.12 0.07 0.07 0.06 0.07
0.41 0.33 0.47 0.26
-0.14 -0.10 -0.44 0.41 0.31
USA
0.40 0.37
India
-0.08 -0.65
0.00 Table 7.
Country comparison
using the
Satterthwaite method
-0.10 0.07 0.06 0.06 0.02
-0.10 0.07 0.07 0.07 0.07
0.50 0.09 0.43 0.07
-0.26 -0.14 -1.21 0.43 0.22
0.41 0.31
0.18 -1.42

MRR supportive of this hypothesis; the path coefficients of ML–turnover intention association vary significantly between the US and Vietnamese samples and between the Indian and US samples. More importantly, the relationship between ML and turnover intention appears to be significantly weaker for the Vietnamese and Indian samples.
Similarly, we proposed in our H7 that the positive relationship between ML and job satisfaction will be stronger for the Vietnamese and Indian samples than for the US sample. The results of the data analysis lend no support for this hypothesis because there is no significant difference between any two pairs of ML–job satisfaction path coefficients across the three samples. Lastly, H8 states that the positive relationship between ML and job performance will be stronger for the Vietnamese and Indian samples than for the US sample. As the results show, ML is associated with job performance with varying magnitudes across the three samples such that this relationship appears to be significantly stronger for the Vietnamese and Indian samples. Hence, H8 is supported.
Discussion and conclusions
The current study contributes to the ongoing scholarly discussion about how leader communication styles affect employee outcomes across cultures. Although prior studies present extensive evidence that ML is positively and significantly associated with several desirable outcomes such as job satisfaction, organizational commitment and job performance (Mayfield and Mayfield, 2002; Mayfield et al., 1998; Sharbrough et al., 2006), it is noted in this growing literature that the effectiveness of ML across nations has been questioned. Studies focusing on ML in countries outside the USA reported results
inconsistent with those obtained in the USA (Krause, 2013; Wang et al., 2009). This inconsistency, if left unaddressed, may hinder further conceptualizing and theorizing on leader communication and significantly impede practitioners from generating managerial implications for their daily operations. To narrow this research gap, the current study aims to further this line of ML study by:
expanding ML research into Asian cultures that have received little attention; and
offering a theoretical explanation for varying effects of ML across nations.
•
•
It is our belief that the inconsistent findings presented in prior studies are, in part, due to cultural differences. Culture potentially determines what employees expect from their leaders in a leader–member exchange. Therefore, it is reasonable and worthwhile to examine ML in light of cultural differences.
To establish the cross-cultural generalizability of the construct of ML, this study tested whether ML elicits predicted employee outcomes in three samples: India, Vietnam and the USA. The results demonstrate that, despite a moderate difference in magnitude, ML is significantly positively associated with job satisfaction and job performance and negatively with absenteeism and turnover intention in all three samples. The result of H1–H4 is largely consistent across those three samples in terms of direction and magnitude. In addition, the path coefficients obtained in our study are in line with the estimates presented in previous ML studies (Mayfield and Mayfield, 2018). Based on the results, it appears that the relationships between ML and employee outcomes examined in this study are generalizable across eastern and western cultures.
We also expect the magnitude of ML’s influence on employee outcomes would be different across those three samples. It is hypothesized that ML would have a greater effect on turnover intention for the US than for Indian and Vietnamese employees. On the other hand, ML is expected to have a stronger association with absenteeism, job satisfaction and job performance for the Indian and Vietnamese samples than for the US sample. The

Employee outcomes
analytic results reveal that there is a moderate difference in the magnitude in the relationships of ML with turnover intention and job performance. Consistent with our hypothesis, ML appears to be more positively associated with job performance for Indian
and Vietnamese employees and more negatively related to turnover intention for US employees. This finding supports our view that employees in different cultures perceive and interpret the leader’s use of ML in different ways. Whereas ML may receive greater success in promoting workers’ job performance in eastern cultures, it is also more effective in
retaining employees in western cultures. In summary, the findings presented in this study highlight the necessity of adopting a cultural perspective when conceptualizing ML in an international context.
The practical implications of this study are twofold. First, the finding that ML is significantly linked to desirable employee outcomes across the three samples proves that the
effectiveness of ML transcends beyond national borders; leaders in different cultures can rely on ML in promoting job satisfaction and performance and reduce absenteeism and turnover intention. Such results suggest that it would be beneficial for firms to implement training programs for their managers to learn how to use spoken language in a strategic way to improve employee attitudes and behaviors. Second, the finding also reminds managers to be cautious when applying ML in different cultures because ML appears to be less influential in promoting job performance in the USA and reducing turnover intention in India and Vietnam.
This study does have some limitations. These limitations may serve as fruitful avenues for future investigations. First, there is no temporal separation between the variables in the models. Incorporating longitudinal data in future research can provide some validation to the causal ordering of ML and the employee outcomes. Second, this study relied on the employees’ perspective of their manager’s extent of ML use and self-reported performance.
Future studies should collect and analyze data from the manager’s perspective of his/her ML use and the employee’s performance to assess if the models yield comparable effects. Third,
a mixed-methods approach for data collection (i.e. qualitative and quantitative) may offer a richer understanding of the models.
Effective adoption of ML is paramount for managers in today’s rapidly changing business environment. Improved leader communication can help motivate employees in various ways to help the organization’s aspirations for better performance. A better
understanding and adoption of ML can be one useful tool to be better equipped to attain such goals.
Note
1. This scale has been released under a Creative Commons Attribution 4.0 International (CC BY 4.0) license by Jacqueline and Milton Mayfield. For full information go to https://creativecommons. org/licenses/by/4.0/.
References
Bollen, K.A. (1989), Structural Equations with Latent Variables Wiley, John Wiley, New York, NY.
Bozeman, D.P. and Perrewé, P.L. (2001), “The effect of item content overlap on organizational
commitment questionnaire–turnover cognitions relationships”, Journal of Applied Psychology, Vol. 86 No. 1, pp. 161-173.
Brislin, R.W. (1970), “Back-translation for cross-cultural research”, Journal of Cross-Cultural Psychology, Vol. 1 No. 3, pp. 185-216.
MRR Buhrmester, M., Kwang, T. and Gosling, S.D. (2016), “Amazon’s Mechanical Turk: a new source of
inexpensive, yet high-quality data?”, in Kazdin A.E. (Ed.), Methodological Issues and Strategies
in Clinical Research, American Psychological Association, Washington, DC, pp. 133-139.
Chin, W.W., Marcolin, B.L. and Newsted, P.R. (2003), “A partial least squares latent variable modeling
approach for measuring interaction effects: results from a Monte Carlo simulation study and an
electronic-mail emotion/adoption study”, Information Systems Research, Vol. 14 No. 2, pp.
189-217.
Cohen, J. (1988), Statistical Power for the Social Sciences, Laurence Erlbaum and Associates, Hillsdale,
NJ.
Dion, P.A. (2008), “Interpreting structural equation modeling results: a reply to Martin and Cullen”, Journal of Business Ethics, Vol. 83 No. 3, pp. 365-368.
Felfe, J. and Yan, W.H. (2009), “The impact of workgroup commitment on organizational citizenship
behaviour, absenteeism and turnover intention: the case of Germany and China”, Asia Pacific
Business Review, Vol. 15 No. 3, pp. 433-450.
Fornell, C. and Larcker, D.F. (1981), “Evaluating structural equation models with unobservable
variables and measurement error”, Journal of Marketing Research, Vol. 18 No. 1, pp. 39-50.
Gefen, D., Straub, D. and Boudreau, M.C. (2000), “Structural equation modeling and regression:
guidelines for research practice”, Communications of the Association for Information Systems,
Vol. 4 No. 1, pp. 7-41.
Hackman, J.R. and Oldham, G.R. (1974), The Job Diagnostic Survey: An Instrument for the Diagnosis of
Jobs and the Evaluation of Job Redesign Projects, Yale University, New Haven, CT.
Hair, J.F., Sarstedt, M., Ringle, C.M. and Mena, J.A. (2012), “An assessment of the use of partial least
squares structural equation modeling in marketing research”, Journal of the Academy of
Marketing Science, Vol. 40 No. 3, pp. 414-433.
Hair, J.F., Black, W.C., Babin, B.J., Anderson, R.E. and Tatham, R.L. (2006), Multivariate Data Analysis,
Pearson Prentice Hall, Upper Saddle River, NJ.
Harzing, A.-W. (2016), “Why replication studies are essential: learning from failure and success”, Cross
Cultural and Strategic Management, Vol. 23 No. 4, pp. 563-568.
Hofstede, G. (2003), Culture’s Consequences: Comparing Values, Behaviors, Institutions and
Organizations across Nations, Sage publications, Thousand Oaks, CA.
Hofstede, G., Hofstede, G.J. and Minkov, M. (2010), “Cultures and organizations: software of the mind”, Revised and Expanded, McGraw-Hill, New York, NY.
Holmes, W.T. (2012), The Motivating Language of Principals: A Sequential Transformative Strategy,
University of NV Las Vegas, Las Vegas, NV.
Holmes, W.T. and Parker, M.A. (2017), “Communication: empirically testing behavioral integrity and
credibility as antecedents for the effective implementation of motivating language”, International
Journal of Business Communication, Vol. 54 No. 1, pp. 70-82.
Hubbard, R., Vetter, D.E. and Little, E.L. (1998), “Replication in strategic management: Scientific testing
for validity, generalizability, and usefulness”, Strategic Management Journal, Vol. 19 No. 3,
pp. 243-254.
Huff, C. and Tingley, D. (2015), “Who are these people?” Evaluating the demographic characteristics
and political preferences of MTurk survey respondents”, Research and Politics, Vol. 2 No. 1,
pp. 1-12.
Johns, G. and Xie, J.L. (1998), “Perceptions of absence from work: People’s republic of China versus
Canada”, Journal of Applied Psychology, Vol. 83 No. 4, pp. 515-530.
Kline, R.B. (2015), Principles and Practice of Structural Equation Modeling, Guilford publications,
New York, NY.
Kock, N. (2017), WarpPLS User Manual: Version 6.0, ScriptWarp Systems, Laredo, TX.
Employee outcomes
Kock, N. and Hadaya, P. (2018), “Minimum sample size estimation in PLS-SEM: the inverse square root
and gamma-exponential methods”, Information Systems Journal, Vol. 28 No. 1, pp. 227-261.
Kock, N. and Lynn, G. (2012), “Lateral collinearity and misleading results in variance-based SEM: an illustration and recommendations”, Journal of the Association for Information Systems, Vol. 13 No. 7, pp. 546-580.
Krause, J.A. (2013), Motivating Language Theory: A Cross-Cultural Comparison, University of Buffalo, New York, NY.
Levering, R. (1990), A Great Place to Work, Avon Books, New York, NY.
Madlock, P.E. (2012), “The influence of power distance and communication on Mexican workers”, Journal of Business Communication, Vol. 49 No. 2, pp. 169-184.
Majovski, I.P. (2007), “Motivating language – ML as a tool in superior-subordinate relations during organisational change: a case study in Macedonia”, CEA Journal of Economics, Vol. 2 No. 2, pp. 5-17.
Mayfield, J. and Mayfield, M. (2002), “Leader communication strategies critical paths to improving employee commitment”, American Business Review, Vol. 20 No. 2, pp. 89-94.
Mayfield, M. and Mayfield, J. (2004), “The effects of leader communication on worker innovation”, American Business Review, Vol. 22 No. 2, pp. 46-51.
Mayfield, J. and Mayfield, M. (2006), “The benefits of leader communication on part-time worker outcomes: a comparison between part-time and full-time employees using motivating language”, Journal of Business Strategies, Vol. 23 No. 2, pp. 131-153.
Mayfield, J. and Mayfield, M. (2007), “The effects of leader communication on a worker’s intent to stay: an investigation using structural equation modeling”, Human Performance, Vol. 20 No. 2, pp. 85-102.
Mayfield, J. and Mayfield, M. (2009), “The role of leader motivating language in employee absenteeism”, Journal of Business Communication, Vol. 46 No. 4, pp. 455-479.
Mayfield, J. and Mayfield, M. (2010), “Leader-level influence on motivating language: a two-level model
investigation on worker performance and job satisfaction”, Competitiveness Review, Vol. 20 No. 5, pp. 407-422.
Mayfield, J. and Mayfield, M. (2018), Motivating Language Theory: Effective Leader Talk in the Workplace, Springer, New York, NY.
Mayfield, M. and Mayfield, J. (2016), “The effects of leader motivating language use on employee decision making”, International Journal of Business Communication, Vol. 53 No. 4, pp. 465-484.
Mayfield, J., Mayfield, M. and Kopf, J. (1995), “Motivating language: Exploring theory with scale
development”, Journal of Business Communication, Vol. 32 No. 4, pp. 329-344.
Mayfield, J., Mayfield, M. and Kopf, J. (1998), “The effects of leader motivating language on subordinate performance and satisfaction”, Human Resource Management, Vol. 37 Nos 3/4, pp. 235-248.
Mayfield, J., Mayfield, M. and Sharbrough, W.C. III (2015), “Strategic vision and values in top leaders’ communications: motivating language at a higher level”, International Journal of Business Communication, Vol. 52 No. 1, pp. 97-121.
Mott, P.E. (1972), The Characteristics of Effective Organizations, Harper and Row, New York, NY.
Nguyen, C.N., Mayfield, J. and Mayfield, M. (2016), “The rapport between perceived organizational support for development and worker outcomes”, in Warkentin M. (Ed.), Models and Applications in the Decision Sciences: Best Papers from the 2015 Annual Conference, FT Press, Upper Saddle River, NJ, pp. 315-374.
Nunnally, J.C. and Bernstein, I.H. (1994), Psychometric Theory, McGraw-Hill, New York, NY.
Peer, E., Vosgerau, J. and Acquisti, A. (2014), “Reputation as a sufficient condition for data quality on amazon Mechanical Turk”, Behavior Research Methods, Vol. 46 No. 4, pp. 1023-1031.
Robbins, S.P. and Judge, T.A. (2016), Organizational Behavior, Pearson Prentice Hall, Boston, MA.
MRR Robbins, S.P., Coulter, M. and DeCenzo, D.A. (2016), Fundamentals of Management, Pearson Prentice
Hall, Boston, MA.
Schumacker, R.E. and Lomax, R.G. (2004), A Beginner’s Guide to Structural Equation Modeling,
Lawrence Erlbaum Associates, Mahwah, NJ.
Sharbrough, W.C., Simmons, S.A. and Cantrill, D.A. (2006), “Motivating language in industry its impact
on job satisfaction and perceived supervisor effectiveness”, Journal of Business Communication,
Vol. 43 No. 4, pp. 322-343.
Shook, C.L., Ketchen, D.J. and Hult, G.T.M. (2004), “An assessment of the use of structural equation
modeling in strategic management research”, Strategic Management Journal, Vol. 25 No. 4, pp.
397-404.
Sullivan, J.J. (1988), “Three roles of language in motivation theory”, Academy of Management Review,
Vol. 13 No. 1, pp. 104-115.
Thang, N.N. and Quang, T. (2007), “International briefing 18: Training and development in Vietnam”, International Journal of Training and Development, Vol. 11 No. 2, pp. 139-149.
Wang, C.-W., Hsieh, C.-T., Fan, K.-T. and Menefee, M.L. (2009), “Impact of motivating language on team
creative performance”, Journal of Computer Information Systems, Vol. 50 No. 1, pp. 133-140.
Yadapadithaya, P. and Stewart, J. (2003), “Corporate training and development policies and practices: a
cross-national study of India and Britain”, International Journal of Training and Development,
Vol. 7 No. 2, pp. 108-123.
Appendix 1. Survey instrument in English
The questions below were answered on a five-point Likert scale ranging from “1- Strongly Disagree”
to “5- Strongly Agree”.
Turnover Intention
(1)
(2)
(3)
(4)
I will probably look for a new job in the near future.
At the present time, I am actively searching for another job in a different organization.
I do NOT intend to quit my job.
It is unlikely that I will actively look for a different organization to work for in the next year.
Attitude toward Absenteeism
(1)
(2)
(3)
(4)
(5)
(6)
(7)
(8)
(9)
(10)
I never miss work.
I miss work far more often than my co-workers.
I would only miss work under very exceptional circumstances.
I have been reprimanded for the number of my absences.
I take pride in not missing work.
I am often absent from work.
I feel bad if I have to miss work.
I don’t care if I have to miss work.
I feel like I have let my company down if I miss work.
I enjoy days when I am absent from work.
Job Satisfaction
(1) People on this job often think of quitting.
Employee outcomes
(2)
(3)
(4)
(5)
Most people on this job are very satisfied with the job.
I am generally satisfied with the kind of work I do in this job.
Generally speaking, I am very satisfied with this job.
I frequently think of quitting this job.
The questions below were answered on a five-point Likert scale ranging from “1- Below Average” to “5- Excellent”.
Job Performance
(1) Which of the following selections best describes how your supervisor rated you on your
last formal performance evaluation?
How does your level of production quantity compare to that of your colleagues’
productivity levels?
How does the quality of your products or services compare to your colleagues’ output?
How efficiently do you work compared to your colleagues? In other words, how well do
you use available resources (money, people, equipment, etc.)?
Compared to your colleagues, how good are you at preventing or minimizing potential
work problems before they occur?
Compared to your colleagues, how effective are you with keeping up with changes that
could affect the way you work?
How quickly do you adjust to work changes compared to your colleagues?
How well would you rate yourself compared to your colleagues in adjusting to new
work changes?
How well do you handle work place emergencies (such as crisis deadlines, unexpected
personnel issues, resource allocation problems, etc.) compared to your colleagues?
(2)
(3)
(4)
(5)
(6)
(7)
(8)
(9)
The questions below were answered on a five-point Likert scale ranging from “1- Very Seldom” to “5- Always”.
Motivating Language[1]
Direction-Giving Language
(1)
(2)
(3)
(4)
(5)
(6)
(7)
(8)
My supervisor provides useful explanations of what I must do at my job.
My supervisor effectively guides me on how to do my job.
My supervisor gives me easy to understand instructions about my work.
My supervisor provides useful tips on how to improve my work.
My supervisor clarifies what it is I must do to receive rewards (additional).
My supervisor gives me clear instructions on how to solve work problems.
My supervisor provides specific information about how I am being evaluated.
My supervisor provides relevant information regarding upcoming changes that may
affect my work.
My supervisor provides relevant information regarding previous changes that affect my work.
My supervisor shares with me news about organizational achievements and financial
conditions.
(9)
(10)
Meaning-Making Language
(1) My supervisor tells me stories about past notable organizational events.
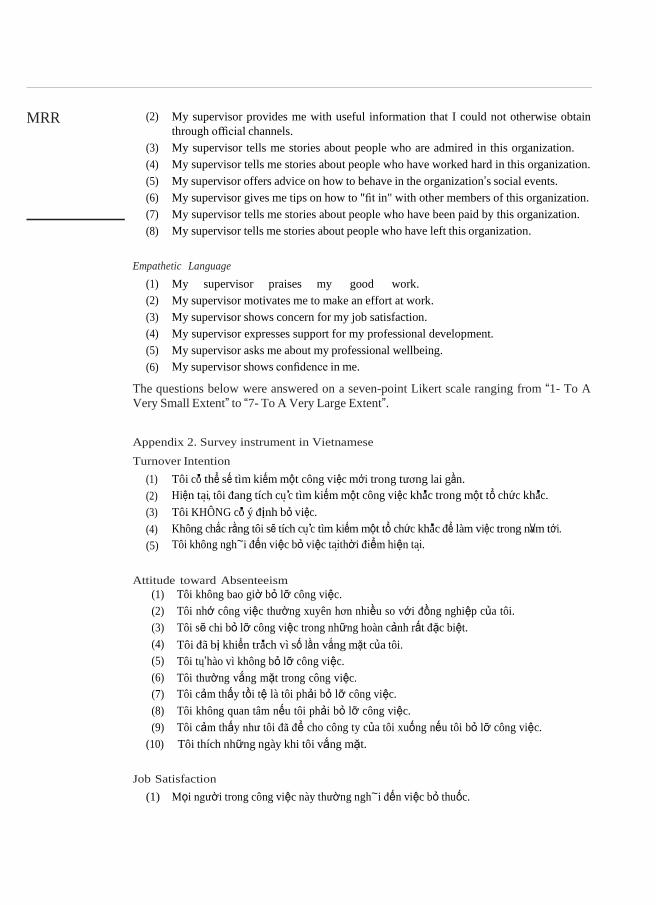
MRR (2) My supervisor provides me with useful information that I could not otherwise obtain
through official channels.
My supervisor tells me stories about people who are admired in this organization.
My supervisor tells me stories about people who have worked hard in this organization.
My supervisor offers advice on how to behave in the organization’s social events.
My supervisor gives me tips on how to "fit in" with other members of this organization.
My supervisor tells me stories about people who have been paid by this organization.
My supervisor tells me stories about people who have left this organization.
(3)
(4)
(5)
(6)
(7)
(8)
Empathetic Language
(1)
(2)
(3)
(4)
(5)
(6)
My supervisor praises my good work.
My supervisor motivates me to make an effort at work.
My supervisor shows concern for my job satisfaction.
My supervisor expresses support for my professional development.
My supervisor asks me about my professional wellbeing.
My supervisor shows confidence in me.
The questions below were answered on a seven-point Likert scale ranging from “1- To A
Very Small Extent” to “7- To A Very Large Extent”.
Appendix 2. Survey instrument in Vietnamese
Turnover Intention
(1) Tôi c'o thể sế tìm kiếm một công việc mới trong tương lai gần.
(2) Hiện tai, tôi đang tích cu’c tìm kiếm một công việc kh'ac trong một tổ chức kh'ac.
(3) Tôi KHÔNG c'o ý định bỏ việc.
(4) Không chắc rằng tôi sẽ tích cu’c tìm kiếm một tổ chức kh'ac để làm việc trong nVam tới.
Tôi không ngh~i đến việc bỏ việc taithời điểm hiện tai. (5)
Attitude toward Absenteeism
(1)
(2)
(3)
(4)
(5)
(6)
(7)
(8)
(9)
(10)
Tôi không bao giờ bỏ lỡ công việc.
Tôi nhớ công việc thường xuyên hơn nhiều so với đồng nghiệp của tôi.
Tôi sẽ chi bỏ lỡ công việc trong những hoàn cảnh rất đặc biệt.
Tôi đã bị khiển tr'ach vì số lần vắng mặt của tôi.
Tôi tu’hào vì không bỏ lỡ công việc.
Tôi thường vắng mặt trong công việc.
Tôi cảm thấy tồi tệ là tôi phải bỏ lỡ công việc.
Tôi không quan tâm nếu tôi phải bỏ lỡ công việc.
Tôi cảm thấy như tôi đã để cho công ty của tôi xuống nếu tôi bỏ lỡ công việc.
Tôi thích những ngày khi tôi vắng mặt.
Job Satisfaction
(1) Mọi người trong công việc này thường ngh~i đến việc bỏ thuốc.

Employee outcomes
(2) Hầu hết mọi người trong công việc này đều rất hài lòng với công việc.
Tôi thường hài lòng với loaicông việc tôi làm trong công việc này. (3)
(4) N'oi chung, tôi rất hài lòng với công việc này.
(5) Tôi thường ngh~i đến việc từ bỏ công việc này.
Job Performance
(1) Lu’a chọn nào sau đây mô tả đúng nhất c'ach gi'am s'at viên của banxếp hang bantrong
lần đ'anh gi'a hiệu suất chính thức cuối cùng của ban?
Mức sản lượng của ban so với mức sản lượng của đồng nghiệp của bannhư thế nào?
Chất lượng sản phẩm hoặc dịch vu của ban so với sản lượng của đồng nghiệp như thế
nào?
Banlàm việc hiệu quả như thế nào so với c'ac đồng nghiệp của ban? N'oi c'ach kh'ac, ban
sử dung tài nguyên sẵn c'o như thế nào (tiền bac, con người, thiết bị, v.v . . .)?
So với c'ac đồng nghiệp của ban, banc'o thể ngVan ngừa hoặc giảm thiểu c'ac vấn đề công việc
tiềm nVang trước khi chúng xảy ra như thế nào?
So với c'ac đồng nghiệp của ban, banc'o hiệu quả như thế nào với việc theo kịp những
thay đổi c'o thể ảnh hưởng đến c'ach banlàm việc?
Banđiều chinh nhanh như thế nào để thay đổi công việc so với c'ac đồng nghiệp của
ban?
Banđ'anh gi'a chính mình như thế nào so với c'ac đồng nghiệp của bantrong việc điều
chinh c'ac thay đổi công việc mới?
Làm thế nào để banxử lý c'ac trường hợp khẩn cấp nơi làm việc (như thời hankhủng
hoảng, c'ac vấn đề nhân su’bất ngờ, c'ac vấn đề phân bổ nguồn lu’c, vv) so với c'ac đồng
nghiệp của ban ?
(2)
(3)
(4)
(5)
(6)
(7)
(8)
(9)
Motivating Language
Direction-Giving Language
C'ac ví dudưới đây cho thấy c'ac c'ach kh'ac nhau mà người gi'am s'at của banliên lacvới ban. Vui lòng
chọn câu trả lời thể hiện tốt nhất nhận thức của banvà đ'anh dấu chúng bằng dấu X.
Người gi'am s'at của tôi cung cấp c'ac giải thích hữu ích về những gì tôi phải làm trong
công việc của tôi.
Người gi'am s'at của tôi hướng dẫn tôi c'ach thu’c hiện công việc của tôi một c'ach hiệu
quả.
Người gi'am s'at của tôi cho tôi dễ hiểu c'ac hướng dẫn về công việc của tôi.
Người gi'am s'at của tôi cung cấp c'ac mẹo hữu ích về c'ach cải thiện công việc của tôi.
Người gi'am s'at của tôi làm rõ những gì tôi phải làm để nhận phần thưởng (bổ sung).
Gi'am s'at viên của tôi cung cấp cho tôi hướng dẫn rõ ràng về c'ach giải quyết vấn đề
công việc.
Gi'am s'at viên của tôi cung cấp thông tin cu thể về c'ach tôi đang được đ'anh gi'a.
Gi'am s'at viên của tôi cung cấp thông tin liên quan về c'ac thay đổi sắp tới c'o thể ảnh
hưởng đến công việc của tôi.
Gi'am s'at viên của tôi cung cấp thông tin liên quan về c'ac thay đổi trước đ'o ảnh hưởng
đến công việc của tôi.
(1)
(2)
(3)
(4)
(5)
(6)
(7)
(8)
(9)
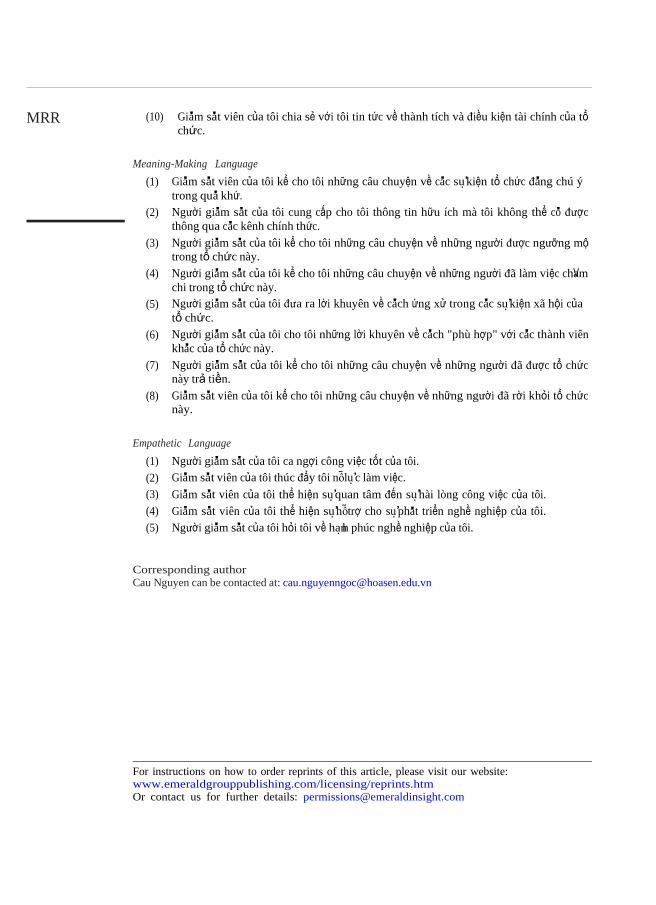
MRR (10) Gi'am s'at viên của tôi chia sẻ với tôi tin tức về thành tích và điều kiện tài chính của tổ chức.
Meaning-Making Language
(1) Gi'am s'at viên của tôi kể cho tôi những câu chuyện về c'ac su’kiện tổ chức đ'ang chú ý
trong qu'a khứ.
Người gi'am s'at của tôi cung cấp cho tôi thông tin hữu ích mà tôi không thể c'o được
thông qua c'ac kênh chính thức.
Người gi'am s'at của tôi kể cho tôi những câu chuyện về những người được ngưỡng mộ trong tổ chức này.
Người gi'am s'at của tôi kể cho tôi những câu chuyện về những người đã làm việc chVam
chi trong tổ chức này.
Người gi'am s'at của tôi đưa ra lời khuyên về c'ach ứng xử trong c'ac su’kiện xã hội của
tổ chức.
Người gi'am s'at của tôi cho tôi những lời khuyên về c'ach "phù hợp" với c'ac thành viên
kh'ac của tổ chức này.
Người gi'am s'at của tôi kể cho tôi những câu chuyện về những người đã được tổ chức
này trả tiền.
Gi'am s'at viên của tôi kể cho tôi những câu chuyện về những người đã rời khỏi tổ chức
này.
(2)
(3)
(4)
(5)
(6)
(7)
(8)
Empathetic Language
(1)
(2)
(3)
(4)
(5)
Người gi'am s'at của tôi ca ngợi công việc tốt của tôi.
Gi'am s'at viên của tôi thúc đẩy tôi nôlu’c làm việc.
Gi'am s'at viên của tôi thể hiện su’quan tâm đến su’hài lòng công việc của tôi.
Gi'am s'at viên của tôi thể hiện su’hôtrợ cho su’ph'at triển nghề nghiệp của tôi.
Người gi'am s'at của tôi hỏi tôi về hanh phúc nghề nghiệp của tôi.
Corresponding author
Cau Nguyen can be contacted at: [email protected]
For instructions on how to order reprints of this article, please visit our website: www.emeraldgrouppublishing.com/licensing/reprints.htm Or contact us for further details: [email protected]
Related Documents