sTrGT f TrfrIfffi fi g.€q rifrTm "ffi 'W J#[K @ $"qqqqqa srqsfrdr fuenr u.q.Tr{. *.:+r$lNSs Kt (7L/2s.2) of Social Consumption in India Education Key Indicators i(T.g.T[€f . t! Ei dtt NSS 7l't Round 1rairt - qF zo14l (January- June 2014) 8{f{f, gccFl{ Government of India Hifrffir 3ik +'r{mff 6rdrq{n dTrffi Ministry of Statistics and Programme Implementation {r"grq qFEqt s{em o.rqtd?T National Sample SurveyOffice qn 2015 June 2015

Welcome message from author
This document is posted to help you gain knowledge. Please leave a comment to let me know what you think about it! Share it to your friends and learn new things together.
Transcript
sTrGT f TrfrIfffi fi g.€q rifrTm
"ffi'W
J#[K@
$"qqqqqa
srqsfrdrfuenr
u.q.Tr{. *.:+r$l NSs Kt (7L/2s.2)
of Social Consumption in IndiaEducation
Key Indicators
i(T.g.T[€f . t! Ei dttNSS 7l't Round
1rairt - qF zo14l(January- June 2014)
8{f{f, gccFl{
Government of India
Hifrffir 3ik +'r{mff 6rdrq{n dTrffiMinistry of Statistics and Programme Implementation
{r"grq qFEqt s{em o.rqtd?TNational Sample Survey Office
qn 2015June 2015
qFrfi?r4
sc-fiq sffi{r? rtsrsT ({T.s.Fr.} * fl{ffi'fiFartil {rrarfHffi :q*lta' s"$eror *sr fi ft}ffi'qftfiq
* faf*.raT frirr61 fS fu flrefrfrr aq, rqffiiffi .y?sTcrs, {rrd fr1 f&at ar* frfgffi d*c{n$ryqfsati'ft, l?telT .K arq', ittft * ffi'fi vrSlr gl,T f; | tr'fiFT :qq}-rr .lndsfrl, ffift-frnt{rr 3fk
F{'drq ft rt a€n fdflrtr +R-sift {ffi, ffilqmh$, ryTiffaa-ftn' $,t-{ kfirai ryrn :ndf
f&q*sflrntr'fi iiewrd *f pryc *'dtc qr frsr ff.r I t
rlrs$q' cftqs} {rtrwT rfirdffi t':ttrt 71q *T 1wraft - qn, 2014) * fideflrr * qtfi' fiiT?T
* rq * 'Trieflffi'm :crTta:ftTq{r rK rrffi Trsfrj-ffiS ${etuT fuui I nq{ qft-{s}'€r{eTsr mrufi-glr 4
ftfi"s Eqt * sdfi'f$qst cR vffeiq, 35d dt{ t'{Ffi6 1ss0 - qtr 1981), 4?* at{ (EFfi$ 19s6 - qdr
19871, 52* dk tgm$ 199s - {dr 1996) :tfs O+t dlr gfirs 2AA7 - wi 2008) d" tuqTl s$fr
{rrq sqffi{t 3it{ liEr qrsq qil (}isa'r?T e?i ffiI-cr{ r_dFT vqtr, ti$at6, am rqi ;p'n sfr* asn
merd*q eil aten.tt * cS fiq $ m's gqrtr $Fnr{ * sffiaal *'ntaq ryr rrffgsr Endffifl'* sTra
ffi?Tr B' r
Trrfr'q sB"{r? H{qigr srqhrq ffi ;16 sfla rqrs w A fu sqdprqcnsft fi rnarfirq'
JiqeTB{t ai Xn 6ri *, 6'q', Sr6a fir* ft'XiT 6}fr *'sfi' Ed' t 3i?t-{ nrev +i#m+t * rcr fr
s"'trc-Tur cfrTrrq eirfr qr Ar iild I fff6l tara * rn-S gv 3lt{ vd?{$r h gu+ fruffiEtr s} Tq?rdfl
6-flfr A' a"6.Frs{, frTEF ffi srfl 6rm * 616l Erd*, rrr.trq ffiq?t €&firr arrqfr?rq trfrqqfrEst Jrffi * $t?rn q{'e1T{iT fr qrrqrffi*' Sqei|rr *' qg qittr*': ft}cfl' arfiFfi'erar&-w;nfr aTa * r\ p r ( t I
sfefq 3rfiYsFrT fr?rT rysya"T ram 1v+r$r:rrfl f Tr6m'rr q*{ffi', +r&{oT-Ifitrr ffitTffit dqr lrg Rrft8 fls'ru srfr ar ont ftq| I s-?r d'fir4 rn$rr ((rqffifrgD * et-d Ehrd RTqr ffibffq Hftffiff q* enkgf fuqr emr t riargr fr?Trq-r ffir groftrya qr qrS $#iaF fttrr{rd q}Trrr
tffirdb * fu{r I Trfi"F{q ('?f erEffiF{ qgrrr (Sfigf) * rrfarur:d;ftfr ffifr"{T an{q'pn.l1 d'va:*qzra+r +TS ftmT r
# Tifurr *,Bfuq wqt * qg-qfq rrdrarl-d qarq a*** fu oray sfrfr?i s..ffargr * trtdT t a,14 rs * :iuryar illT qaFd' dt{ qF-fi's'siftcn#rq rt#r tvqr'€Til ST .iriaie :n*nfr { rfi gffi ffie d &'m firi' d' effffifr u.c,w.qr, h frffiffi wrT?rt *' *rft'sftrfr 'refir fr,t rr*qrn$'fr sfr smfiT mrfr { r
# 3{nn il:r$ ifl ft' arr fuq}* d"$arefit, frfH"i#rffiii, ma"rffi rft* ritr*a?at h frs';srtrft fftr* t*str $€ ft*fr* fr ftq""TqFt, ykqlff ;tera',r ffi€ & ffi Jrtr q66 *' qtffi *fiq* gW* qir ffirrrfrr Fr
4fffiqF, 2015
l:rrrc"frm #hctryfffr&rs ud rya"ffiffi} 34ffi1,
qrsftq sff6?i q#errr ffirqiprq

Foreword
The surveys on social consumption relating to education, conducted by the NationalSample Survey Office (NSSO) are the primary sources of data on various indicators oneducation scenario of the country; like literacy rates, attendance ratios, incentives receivedby the students, expenditure incurred for the purpose of education etc .. These are used forplanning, policy formulation, and decision support and as input for further analytical studiesby various Government organizations, academicians, researchers and scholars.
2. National Sample Survey Office (NSSO) conducted a nation-wide survey on 'SocialConsumption: Education' as a part of its 7lstround Qanuary-June 2014) survey in the wholeIndian Territory. The previous NSS rounds, during which the survey on similar subject wastaken up, are the 35th round Quly 1980-June 1981), 42nd round Quly 1986-June 1987), 52nd
round Quly 1995-June 1996) and the 64th round Quly 2007-June 2008). All the StateGovernments and Union Territories (except Andaman ts: Nicobar Islands, Chandigarh,Dadra ts: Nagar Haveli and Lakshadweep) also participated in the survey programme with atleast on equal matching sample size basis.
3. It has been the persistent endeavour of NSSO to bring out its survey results in theform of Key Indicators within one year of completion of field work of the survey to meettimely requirement of its users. With this aim and with a view to make available the salientresults of the survey, well in advance of the release of detailed report, NSSO is bringing outthis document 'Key Indicators of Social Consumption in India: Education' based on Centralsample data.
4. The Survey Design and Research Division (SDRD) undertook the development ofsurvey instruments and the preparation of this document. Field work of the survey wascarried out by the Field Operations Division (FOD) in which the central samples werecovered. The data processing and tabulation work was handled by the Data ProcessingDivision (DPD) of NSSO. The Coordination and Publication Division (CPD) coordinatedvarious activities pertaining to the survey.
S. I am highly thankful to the Chairman and Members of the Working Group for NSS7lst round and National Statistical Commission (NSC) for providing their valuable guidanceat various stages of the survey. I would also like to appreciate efforts made by the officers ofthe different Divisions of NSSO involved in preparation of this document.
6. I hope this Key Indicator document will be found useful by planners, policy makers,academicians and researchers. Suggestions for improvement in content, layout and otheraspects of this document will be highly appreciated.
New DelhiJune, 2015
~J7(Arnarjee] Kaur)
Director General &, Chief Executive OfficerNational Sample Survey Office
NSS KI (71/25.2): Key Indicators of Social Consumption in India: Education
CONTENTS
Chapter One1. Introduction 1-41.1 Background 11.2 Objective of the survey 11.3 Comparability with previous round survey 21.4 Report of the 71st round Survey on Social Consumption: Education 31.5 Contents of this Document 3Chapter Two2. Main Features of the Survey 5-72.1 Schedules of enquiry 52.2 Scope and Coverage 52.3 Sample size 62.4 Reference period 62.5 Quintile class of UMPCE 6Chapter Three3. Summary of Findings 8-273.1 Introduction 83.2 Estimated population 83.3 Literacy rates among population 83.4 Accessibility of nearest primary, upper primary and secondary school 93.5 Completed level of education 93.6 Attendance and enrolment 113.7 Attendance ratios 123.8 Participation in education 143.9 Current attendance by type of education 153.10 Pattern of current attendance 163.11 Attendance by type of courses 163.12 Type of institution attended 173.13 Incentives received 183.14 Private coaching 193.15 Students staying in hostel 203.16 Private expenditure on education 203.17 Average expenditure on education 213.18 Never-enrolment and discontinuance of education 243.19 The education-discontinued population: age at dropping out/discontinuance 253.20 The education-discontinued population - reasons for discontinuance or dropping out 253.21 Reason for never-enrolment 263.22 Access to computer and internet 26Appendix AState Tables A-1-A-33Appendix BConcepts and Definitions B-1-B-8Appendix CNote on Sample Design and Estimation Procedure C-1-C-7Appendix DSchedule 25.2: Social Consumption: Education D-1-D-8
Contents
NSS KI (71/25.2): Key Indicators of Social Consumption: Education in India
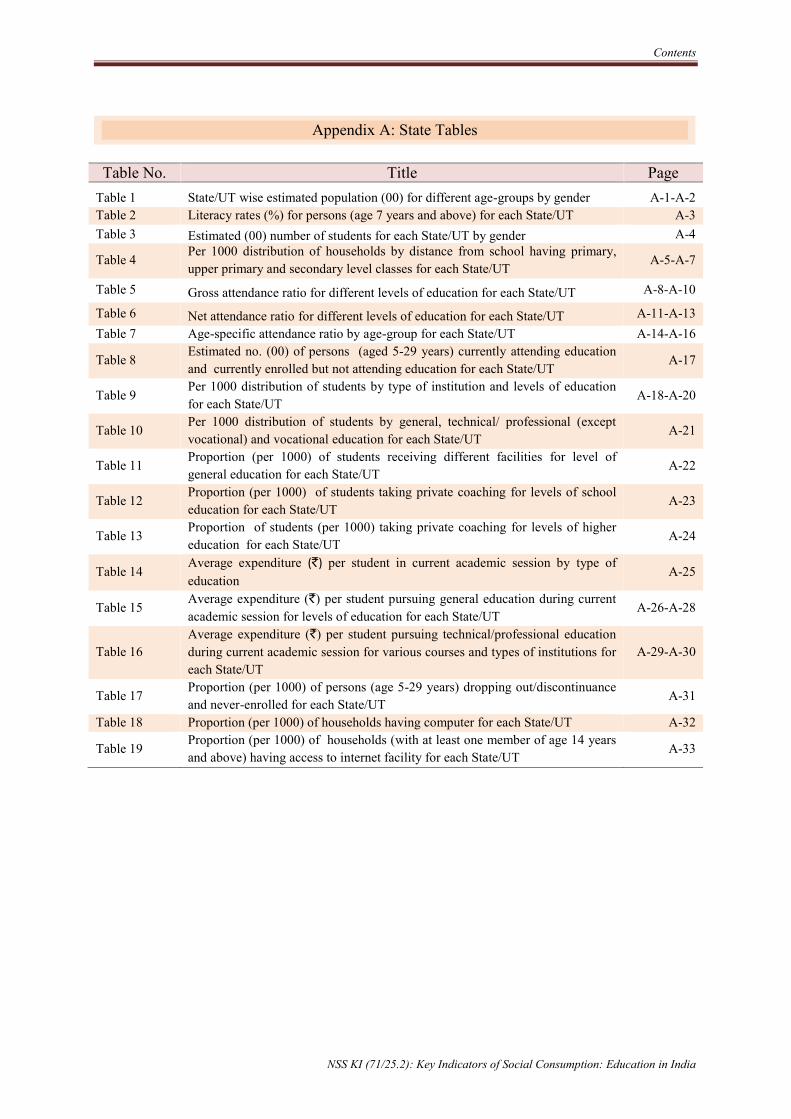
Table No. Title PageTable 1 State/UT wise estimated population (00) for different age-groups by gender A-1-A-2Table 2 Literacy rates (%) for persons (age 7 years and above) for each State/UT A-3Table 3 Estimated (00) number of students for each State/UT by gender A-4
Table 4Per 1000 distribution of households by distance from school having primary,upper primary and secondary level classes for each State/UT
A-5-A-7
Table 5 Gross attendance ratio for different levels of education for each State/UT A-8-A-10
Table 6 Net attendance ratio for different levels of education for each State/UT A-11-A-13Table 7 Age-specific attendance ratio by age-group for each State/UT A-14-A-16
Table 8Estimated no. (00) of persons (aged 5-29 years) currently attending educationand currently enrolled but not attending education for each State/UT
A-17
Table 9Per 1000 distribution of students by type of institution and levels of educationfor each State/UT
A-18-A-20
Table 10Per 1000 distribution of students by general, technical/ professional (exceptvocational) and vocational education for each State/UT
A-21
Table 11Proportion (per 1000) of students receiving different facilities for level ofgeneral education for each State/UT
A-22
Table 12Proportion (per 1000) of students taking private coaching for levels of schooleducation for each State/UT
A-23
Table 13Proportion of students (per 1000) taking private coaching for levels of highereducation for each State/UT
A-24
Table 14Average expenditure (`) per student in current academic session by type ofeducation
A-25
Table 15Average expenditure (`) per student pursuing general education during currentacademic session for levels of education for each State/UT
A-26-A-28
Table 16Average expenditure (`) per student pursuing technical/professional educationduring current academic session for various courses and types of institutions foreach State/UT
A-29-A-30
Table 17Proportion (per 1000) of persons (age 5-29 years) dropping out/discontinuanceand never-enrolled for each State/UT
A-31
Table 18 Proportion (per 1000) of households having computer for each State/UT A-32
Table 19Proportion (per 1000) of households (with at least one member of age 14 yearsand above) having access to internet facility for each State/UT
A-33
Appendix A: State Tables

NSS KI (71/25.2): Key Indicators of Social Consumption in India: Education
Abbreviations
Abbreviation DescriptionAAR Age-specific Attendance RatioGAR Gross Attendance RatioHS Higher SecondaryIT Information TechnologyKI Key Indicatorn.k. Not Knownn.r. Not ReportedNAR Net Attendance RatioNSS National Sample SurveyPG Post GraduationUMPCE Usual Monthly Per Capita Consumer ExpenditureUT Union Territories

Chapter1Introduction


NSS KI (71/25.2): Key Indicators of Social Consumption in India: Education 1
Chapter One
Introduction
“Literacy is a human right”-UNESCO
1.1 Background
1.1.1 The National Sample Survey Office (NSSO), Ministry of Statistics and ProgrammeImplementation (MOSPI), Government of India, since its inception in 1950 has beenconducting nationwide integrated large scale sample surveys, employing scientific samplingmethods, to generate data and statistical indicators on diverse socio-economic aspects. TheNSS surveys are conducted by interviewing sample households selected through a scientificdesign and cover practically the entire geographical area of Indian Territory.
1.1.2 In its 71st round of survey, conducted during the period 1st January, 2014 to 30th June,2014 (in this Key Indicator (KI) document this period is referred to as 2014), NSSO carriedout a survey on ‘Social Consumption: Education’. The last survey on this subject wasconducted during 64th round of NSS (July 2007-June 2008). Key indicators of education inIndia in 2014, based on the results of NSS 71st round survey, are presented here.
1.2 Objective of the Survey
1.2.1 The foundation of the society is based on education. It brings economic and socialprosperity. One can appositely say, a strong nation can be built by ensuring that each citizenof that nation is educated. In most of the countries, the government spends substantial amounton the creation as well as the functioning of the educational infrastructure. But to avail suchfacilities individuals too have to incur expenditure in the form of course fees, examinationfees, cost of books and stationery etc. While information on the expenditure incurred bygovernments is available from budget documents, there is an increasing role of non-government organisations as well as individuals in the education sector. The generation ofinformation on education and the expenditure by individuals through a specialised survey,therefore, has special significance in the contemporary context.
1.2.2 NSSO had conducted an all-India household survey on education during the periodJanuary – June 2014. The purpose of the survey was to collect information on participation ofpersons aged 5-29 years in pursuit of education in the country; the extent of use ofeducational infrastructure, facilities and incentives provided by the government and privatesectors and its impact on current attendance status of population in the educationalinstitutions; private expenditure incurred by households on education and the extent ofeducational wastage in terms of dropping-out and discontinuance, and its causes.
1.2.3 Increasing use of information technology in every sphere of day-to-day life at presentseems to be one giant leap for the country. So it stands to reason that more importance has tobe placed on computer literacy as education and computer now go with hand-in-hand. This
Chapter One
2 NSS KI (71/25.2): Key Indicators of Social Consumption in India: Education
survey also captured some information on various facets of ability to operate computer alongwith possession of computer in the household and access to internet facility for a 14 plus agedmember of a household.
1.2.4 NSSO conducted first all-India survey on social consumption in its 35th round(July1980 - June 1981) to obtain data on nature & quantum of benefits received by the peoplefrom public expenditure on various services such as health services (including massimmunisation and family welfare programmes), educational services, public distribution, etc.Subsequently, the subject of social consumption was covered by the NSSO in its 42nd round(July 1986 - June 1987) and 52nd round (July 1995 - June 1996) and 64th round (July 2007-June 2008). These surveys were conducted on the same lines as the 35th round survey withsome modifications in subject coverage. The surveys covered both qualitative andquantitative aspects of educational services received by households. Qualitative aspectsincluded literacy, educational level attained, current attendance/enrolment, drop-out, reasonfor drop-out, etc. Quantitative aspects of educational services included expenditure incurredby households in availing themselves of these services with its break-up into tuition fees,transport costs, etc. In NSS 47th round (July-December 1991), data on qualitative aspects ofeducational services were collected. This apart, person-wise information on literacy andeducational attainment was collected for each surveyed household in all the householdsurveys of NSSO.
1.2.5 These indicators on education are required for planning, policy formulation anddecision making at various levels within the government and outside. The results of thesurvey are likely to be used by the Ministry of Human Resource Development, Department ofElectronics and Information Technology etc. apart from private data users and policy makers.
1.3 Comparability with previous round survey
1.3.1 Though the survey on ‘Social Consumption: Education’ conducted in 2014 wasbroadly similar to that undertaken in the 64th round of NSS, keeping in mind the fieldexperiences of earlier round and to fulfil the requirements of the stakeholders somemodifications or additions were made in the concepts and definitions.
a. It has to be kept in mind for comparability of data with previous round that the surveyperiod for the current round is of six months (January-June 2014), whereas it was ofone year in NSS 64th round (July 2007- June 2008).
b. In 64th round two items of information, viz. number of dependants studying away fromhome, and amount sent to them, were considered in the block on householdcharacteristics. However, in this round dependants staying in hostel, away from home,for the purpose of study, were considered as household members unlike the previousround.
c. Information on expenditure on education was collected for only one basic courseinstead of at most two courses as was done in the 64th round.

Introduction
NSS KI (71/25.2): Key Indicators of Social Consumption in India: Education 3
d. No specific item to capture information on vocational education was incorporated inthis round. As per Ministry of Human Resource Development, vocational education isa part of the professional/technical education. According to this Ministry’s guidelines,professional/technical education generally pertains to higher education, but in case ofschool education (i.e. up to secondary level) it is considered vocational education.Therefore, though no separate code for vocational course had been kept in this survey,it can be obtained as a part of technical/professional education from the captured data.
e. Structures of course codes and level of current attendance codes in the block related toeducation particulars on basic course have been simplified.
f. In NSS 64th round, the structures of primary and upper primary levels were asfollowed in different States/UTs. But for this round, classes I-V for primary level andVI-VII for upper primary level respectively are taken uniformly irrespective of thepractices followed in States/UTs.
g. For type of institution, government and local bodies had been merged as governmentinstitutions in this round.
h. Information on usual household consumer expenditure (`) in a month was collectedthrough a single question, in place of the five questions in earlier round.
i. Some new items of enquiry such as language mainly spoken at home, whether takingprivate coaching and purpose of taking private coaching had been included to captureinformation on important contemporary issues on education.
j. As per requirement of Department of Electronics & IT, few items on access and useof computer were included in demographic block and in block on householdcharacteristics.
k. Few items of expenditure were clubbed in this round compared to earlier round.
1.4 Report of the 71st round Survey on Social Consumption: Education
1.4.1 The results of the NSS surveys are released in reports based on a comprehensivetabulation of subject parameters and important indicators in various cross-classificationsgenerated from the central sample data. Besides this document on key indicators, the detailedresults of the survey are planned to be released in one report- “Education in India, 2014”.
1.5 Contents of this Document
1.5.1 This document brings out the key results of NSS 71st round within a year ofcompletion of field work of the survey to facilitate decision support, policy inferences andsocio-economic analysis. It is presented in three chapters and four appendices. The present isthe introductory chapter (Chapter One). Chapter Two figures out features of the survey onSocial Consumption: Education together with its conceptual framework. A brief summary ofthe significant information on key indicators is presented in Chapter Three. Appendix Aprovides the State/UT tables on key indicators. Notes on concepts and definitions used in thissurvey are illustrated in details in Appendix B. Details of sample design and estimationprocedure are given in Appendix C and lastly in Appendix D, the schedule of enquiry(Schedule 25.2) which was canvassed at the selected households is provided.
Chapter One
4 NSS KI (71/25.2): Key Indicators of Social Consumption in India: Education
1.5.2 The indicators presented in this document are primarily related to:
a. Literacy ratesb. Current attendancec. Participation in educationd. Educational expendituree. Drop-outs and discontinuancef. Access and ability to operate Computer
1.5.3 It is important to note that some estimates for the smaller States/UTs and at somedetailed levels in the statements or in State tables (in Appendix A) may be subject to highsampling fluctuations as such estimates may be based on very small sample sizes. In somecells of appendix tables zero figures are reported, which are due to either zero sample vales orvery small sample values. Therefore, such estimates should be used and interpreted with duecare.
1.5.4 The rural and urban figures in this document are related to persons/students from ruraland from urban areas respectively; and not relating to the places where the students studied.
1.5.5 In this survey, information was collected on the places of hostel where the studentswere staying in terms of State code to determine the State where the hostel was located. SinceTelangana was not a separate State at the beginning of the survey, no specific code wasassigned for the State of Telangana in the Schedule of enquiry. Thus, the location of thehostel could not be separated for the State of Telangana on the basis of available information.
Chapter2Main Features of the Survey


NSS KI (71/25.2): Key Indicators of Social Consumption in India: Education 5
Chapter two
Main features of the survey
2. 1 Schedules of enquiry
2.1.1 The schedule of enquiry on Social Consumption: Education (Schedule 25.2) wasdesigned to collect information on (a) participation of persons aged 5-29 years in the pursuitof education, (b) private expenditure incurred on the education of household membersincluding those who are residents of Students’ hostel at the time of survey, (c) extent ofeducational wastage and their causes in terms of dropout and discontinuance and (d) ITliteracy of persons aged 14 years and above.
2.2 Scope and Coverage
2.2.1 Geographical coverage: The survey covered the whole of the Indian Union.
2.2.2 Population coverage: The following rules were adhered to determine populationcoverage:
1. Under-trial prisoners in jails and indoor patients of hospitals, nursing homes etc., wereexcluded, but residential staff therein were listed. The persons of the first categorywere considered as members of their parent households and were counted there.Convicted prisoners undergoing sentence were outside the coverage of the survey.
2. Floating population, i.e., persons without any normal residence were not listed. Buthouseholds residing in open space, roadside shelter, under a bridge, etc., more or lessregularly in the same place, were listed.
3. Neither the foreign nationals nor their domestic servants were listed, if by definitionthe latter belonged to the foreign national's household. If, however, a foreign nationalbecame an Indian citizen for all practical purposes, he or she was covered.
4. Persons residing in barracks of military and paramilitary forces (like police, BSF, etc.)were kept outside the survey coverage due to difficulty in conduct of survey therein.However, civilian population residing in their neighbourhood, including the familyquarters of service personnel, were covered.
5. Orphanages, rescue homes, ashrams and vagrant houses were outside the surveycoverage. However, persons staying in old age homes, ashrams/hostels (other thanstudents) and the residential staff (other than monks/ nuns) of these ashrams werelisted. For orphanages, although orphans were not listed, the persons looking afterthem and staying there were considered for listing.
6. In this particular survey, students residing in the students’ hostels were excluded fromthe hostel as they were considered as members of the household to which theybelonged before moving to the hostel. However, residential staff were listed in thehostel.

Chapter Two
6 NSS KI (71/25.2): Key Indicators of Social Consumption in India: Education
2.3 Sample size
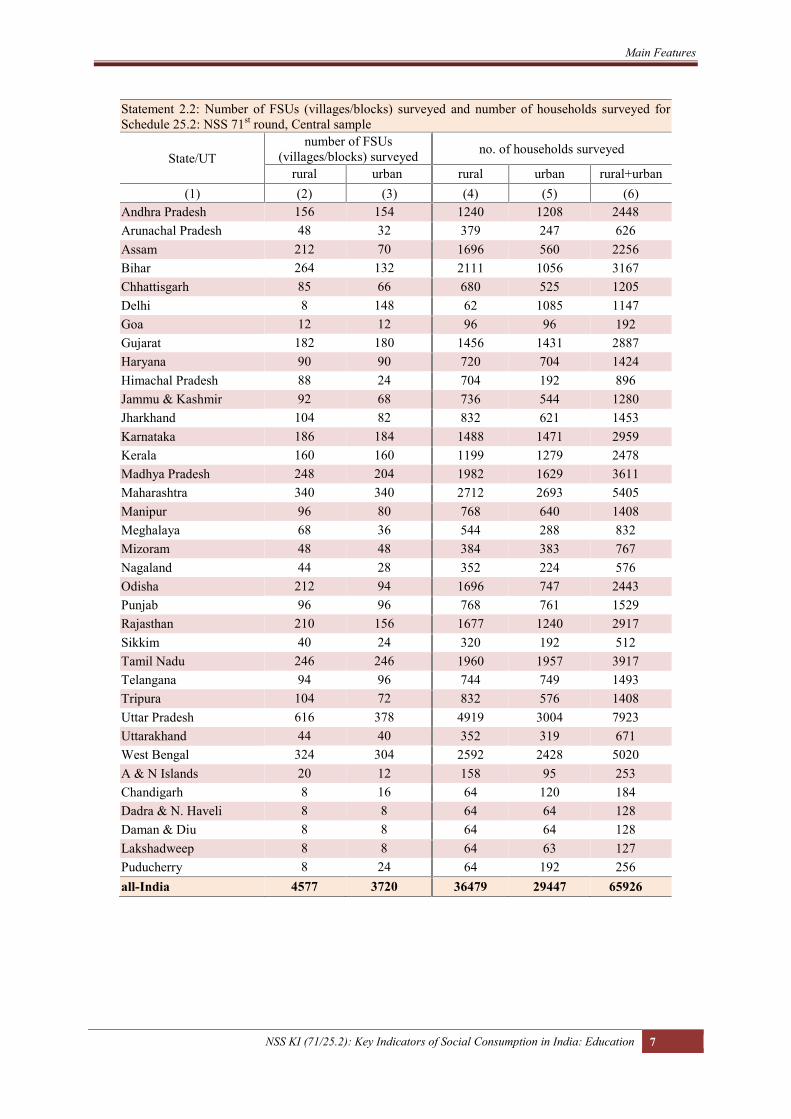
2.3.1 First-stage units: A total of 4577 villages were surveyed in rural India and thenumber of urban blocks surveyed was 3720 as First-stage units (FSUs) in NSS 71st round forthe central sample at all-India level. In addition to these, ‘State samples’ were also surveyedby State/UT Governments who participated in this survey. The results presented in thisdocument are solely based on the central samples. State/UT wise FSUs surveyed in centralsamples are given in Statement 2.2.
2.3.2 Second-stage units: Stratification of the households was done on the basis of havingany student (aged 5-29 years) receiving technical/professional or general education (detailsare given in Appendix C). For this particular survey, 8 households were selected from eachsample village/block. The total number of households in which Schedule 25.2 was canvassed,was 36479 and 29447 in rural and urban India respectively. State/UT-wise number ofhouseholds in which Schedule 25.2 was canvassed is given in Statement 2.2.
2.4 Reference period
2.4.1 The estimates presented in this KI are based on data collected during 01.01.2014 to30.06.2014, a period of six months. Therefore, these estimates may be taken as on31.03.2014, the mid-point of the six-month period.
2.4.2 Expenditure on education is related to current academic session of study of a studentfor the basic course only. If the current academic session spanned over 12 months, then it wasrestricted to 12 months period.
2.5 Quintile class of UMPCE
2.5.1 This refers to the 5 quintile classes of the rural/Urban all-India distribution (estimateddistribution) of households by UMPCE. In the tables, the different quintile classes arereferred to simply as 1 (lowest quintile class), 2, 3, 4 and 5 (highest quintile class).
2.5.2 Following Statement 2.1 shows the lower and upper limits of the all-India quintiles tohave an idea of level of living of the households belonging to these quintile classes.
Statement 2.1: Lower and upper limits of UMPCE in differentquintile classes for each sector
quintileclassof UMPCE
UMPCE (`)
rural urban
lower limit upper limit lower limit upper limit(1) (2) (3) (4) (5)1 0 786 0 12002 786 1000 1200 16673 1000 1286 1667 22504 1287 1667 2250 33335 1667 - 3333 -
Main Features
NSS KI (71/25.2): Key Indicators of Social Consumption in India: Education 7
Statement 2.2: Number of FSUs (villages/blocks) surveyed and number of households surveyed forSchedule 25.2: NSS 71st round, Central sample
State/UTnumber of FSUs
(villages/blocks) surveyed no. of households surveyed
rural urban rural urban rural+urban(1) (2) (3) (4) (5) (6)
Andhra Pradesh 156 154 1240 1208 2448Arunachal Pradesh 48 32 379 247 626Assam 212 70 1696 560 2256Bihar 264 132 2111 1056 3167Chhattisgarh 85 66 680 525 1205Delhi 8 148 62 1085 1147Goa 12 12 96 96 192Gujarat 182 180 1456 1431 2887Haryana 90 90 720 704 1424Himachal Pradesh 88 24 704 192 896Jammu & Kashmir 92 68 736 544 1280Jharkhand 104 82 832 621 1453Karnataka 186 184 1488 1471 2959Kerala 160 160 1199 1279 2478Madhya Pradesh 248 204 1982 1629 3611Maharashtra 340 340 2712 2693 5405Manipur 96 80 768 640 1408Meghalaya 68 36 544 288 832Mizoram 48 48 384 383 767Nagaland 44 28 352 224 576Odisha 212 94 1696 747 2443Punjab 96 96 768 761 1529Rajasthan 210 156 1677 1240 2917Sikkim 40 24 320 192 512Tamil Nadu 246 246 1960 1957 3917Telangana 94 96 744 749 1493Tripura 104 72 832 576 1408Uttar Pradesh 616 378 4919 3004 7923Uttarakhand 44 40 352 319 671West Bengal 324 304 2592 2428 5020A & N Islands 20 12 158 95 253Chandigarh 8 16 64 120 184Dadra & N. Haveli 8 8 64 64 128Daman & Diu 8 8 64 64 128Lakshadweep 8 8 64 63 127Puducherry 8 24 64 192 256all-India 4577 3720 36479 29447 65926
Chapter3Summary of Findings

NSS KI (71/25.2): Key Indicators of Social Consumption in India: Education 8
Chapter ThreeChapter three
Summary of Findings
3. 1 Introduction
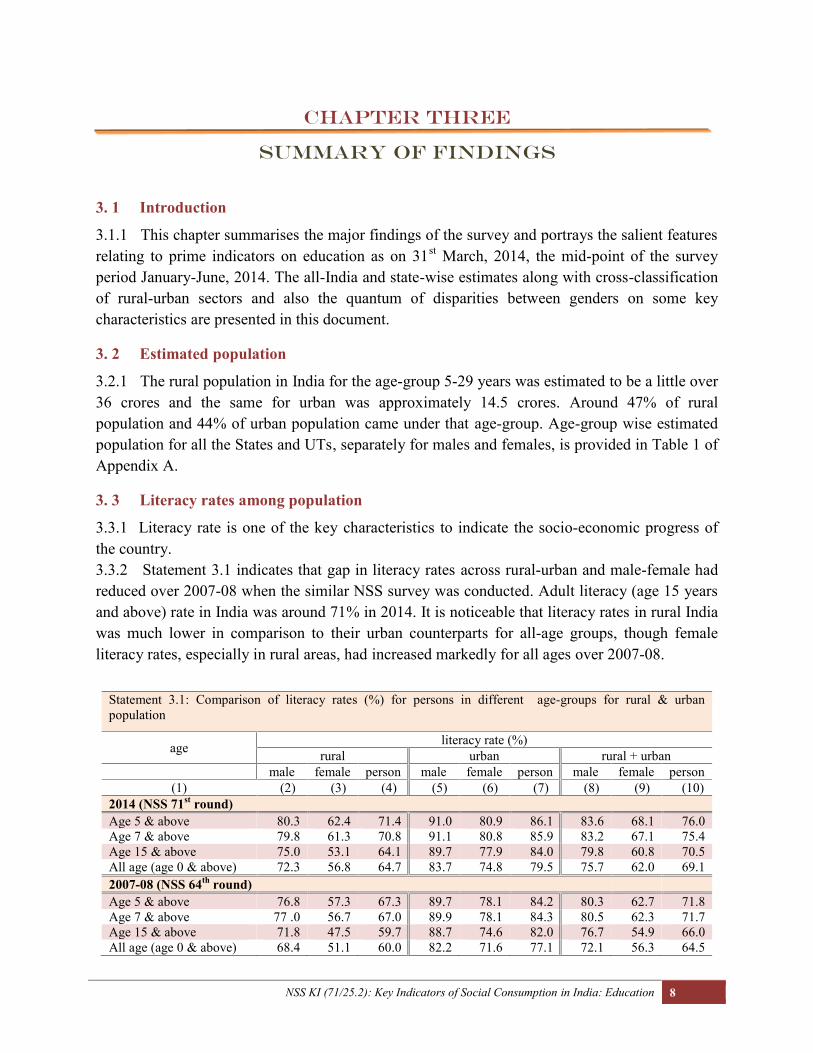
3.1.1 This chapter summarises the major findings of the survey and portrays the salient featuresrelating to prime indicators on education as on 31st March, 2014, the mid-point of the surveyperiod January-June, 2014. The all-India and state-wise estimates along with cross-classificationof rural-urban sectors and also the quantum of disparities between genders on some keycharacteristics are presented in this document.
3. 2 Estimated population
3.2.1 The rural population in India for the age-group 5-29 years was estimated to be a little over36 crores and the same for urban was approximately 14.5 crores. Around 47% of ruralpopulation and 44% of urban population came under that age-group. Age-group wise estimatedpopulation for all the States and UTs, separately for males and females, is provided in Table 1 ofAppendix A.
3. 3 Literacy rates among population
3.3.1 Literacy rate is one of the key characteristics to indicate the socio-economic progress ofthe country.3.3.2 Statement 3.1 indicates that gap in literacy rates across rural-urban and male-female hadreduced over 2007-08 when the similar NSS survey was conducted. Adult literacy (age 15 yearsand above) rate in India was around 71% in 2014. It is noticeable that literacy rates in rural Indiawas much lower in comparison to their urban counterparts for all-age groups, though femaleliteracy rates, especially in rural areas, had increased markedly for all ages over 2007-08.
Statement 3.1: Comparison of literacy rates (%) for persons in different age-groups for rural & urbanpopulation
age literacy rate (%)rural urban rural + urban
male female person male female person male female person(1) (2) (3) (4) (5) (6) (7) (8) (9) (10)
2014 (NSS 71st round)Age 5 & above 80.3 62.4 71.4 91.0 80.9 86.1 83.6 68.1 76.0Age 7 & above 79.8 61.3 70.8 91.1 80.8 85.9 83.2 67.1 75.4Age 15 & above 75.0 53.1 64.1 89.7 77.9 84.0 79.8 60.8 70.5All age (age 0 & above) 72.3 56.8 64.7 83.7 74.8 79.5 75.7 62.0 69.12007-08 (NSS 64th round)Age 5 & above 76.8 57.3 67.3 89.7 78.1 84.2 80.3 62.7 71.8Age 7 & above 77 .0 56.7 67.0 89.9 78.1 84.3 80.5 62.3 71.7Age 15 & above 71.8 47.5 59.7 88.7 74.6 82.0 76.7 54.9 66.0All age (age 0 & above) 68.4 51.1 60.0 82.2 71.6 77.1 72.1 56.3 64.5
Chapter Three
9 NSS KI (71/25.2): Key Indicators of Social Consumption in India: Education
3.3.3 For age 7 years and above detailed State/UT wise literacy rates are available in Table 2 ofAppendix A. Meghalaya, Mizoram, Nagaland, Kerala, Goa, Delhi, Chandigarh andLakshadweep had more than 90% of literates in 7+ age groups. Rural female literacy rates (for7+ age) in Andhra Pradesh, Telangana, Bihar, Jharkhand, Rajasthan, Madhya Pradesh and UttarPradesh were still low in comparison to all-India average.
3. 4 Accessibility of nearest primary, upper primary and secondary school
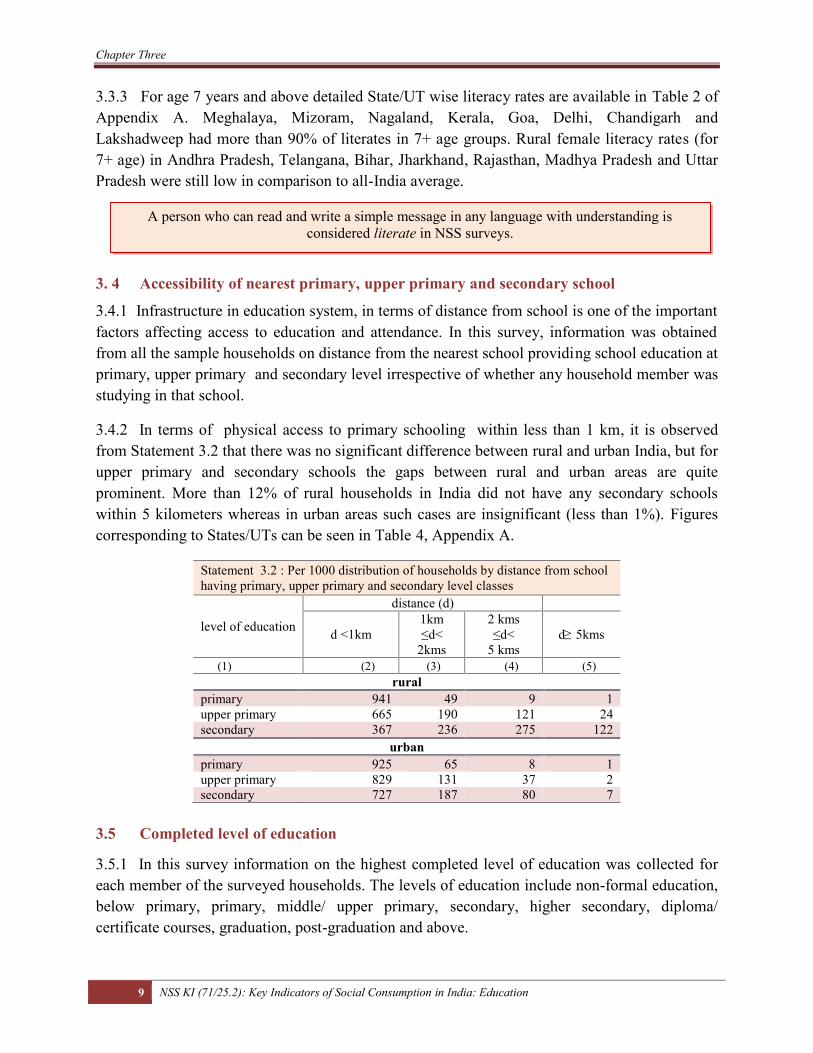
3.4.1 Infrastructure in education system, in terms of distance from school is one of the importantfactors affecting access to education and attendance. In this survey, information was obtainedfrom all the sample households on distance from the nearest school providing school education atprimary, upper primary and secondary level irrespective of whether any household member wasstudying in that school.
3.4.2 In terms of physical access to primary schooling within less than 1 km, it is observedfrom Statement 3.2 that there was no significant difference between rural and urban India, but forupper primary and secondary schools the gaps between rural and urban areas are quiteprominent. More than 12% of rural households in India did not have any secondary schoolswithin 5 kilometers whereas in urban areas such cases are insignificant (less than 1%). Figurescorresponding to States/UTs can be seen in Table 4, Appendix A.
Statement 3.2 : Per 1000 distribution of households by distance from schoolhaving primary, upper primary and secondary level classes
level of education
distance (d)
d <1km1km≤d<
2kms
2 kms≤d<
5 kmsd≥ 5kms
(1) (2) (3) (4) (5)rural
primary 941 49 9 1upper primary 665 190 121 24secondary 367 236 275 122
urbanprimary 925 65 8 1upper primary 829 131 37 2secondary 727 187 80 7
3.5 Completed level of education
3.5.1 In this survey information on the highest completed level of education was collected foreach member of the surveyed households. The levels of education include non-formal education,below primary, primary, middle/ upper primary, secondary, higher secondary, diploma/certificate courses, graduation, post-graduation and above.
A person who can read and write a simple message in any language with understanding isconsidered literate in NSS surveys.

Summary of Findings
NSS KI (71/25.2): Key Indicators of Social Consumption in India: Education 10
3.5.2 The distribution of population for age 5 years and above across levels of education isindicated in Statement 3.3. No major differences were observed between male and femalepersons in urban areas up to the level of higher secondary but such differences are noticeable inrural areas. The rural-urban and male-female disparities accentuate at higher education levels ofgraduation and above. The proportion of persons having completed the level of graduation andabove was much less in rural areas (only 4.5% for males and 2.2% for females), in comparison tourban areas (17% for males and 13% for females).
Statement 3.3: Per 1000 distribution of persons (aged 5 years and above) by completed level ofeducation
level of education rural urban rural + urbanmale female male female male female
(1) (2) (3) (4) (5) (6) (7)not literate 198 376 90 190 165 320literatewithout schooling 8 6 5 6 7 6up to primary 377 336 285 280 349 319upper primary 173 130 157 143 168 134secondary 118 80 150 133 128 96higher secondary 71 45 114 102 85 62diploma 11 5 30 14 17 8graduation 37 18 126 96 64 42post-graduation and above 8 4 43 35 18 14all (incl. n.r.) 1000 1000 1000 1000 1000 1000
n.r. stands for not reported
3.5.3 The distribution of entire adult (age 15 years and above) males and females of the countryby completed level of education can be seen at a glance from Fig. 1. This reveals wide disparity
not only in theproportion ofliterates acrossgenders, but also inthe completededucational levelsamong literates withthe increase in levelof education. Theadult literate femalesof the country wasabout 61% comparedto 80% males andabout 25% of adultfemales among the
female literates had completed at least higher secondary (excluding diploma). For males it wasabout 27%.
20.2
0.8
7.713.1
17.816.3
11.1
2.28.4
2.4 39.1
0.6
7.312
13.2
11.8
7.91
5.3 1.7
Fig1: Percentage distribution of population (age 15 years andabove) by completed level of eduction
not literate
without formal schooling
below primary
priamry
upper primary
secondary
higher secondary
diploma
graduation
post graduation and above
male
female

Chapter Three
11 NSS KI (71/25.2): Key Indicators of Social Consumption in India: Education
3.6 Attendance and enrolment
3.6.1 Current attendance status refers to whether a person is currently attending any educationalinstitution or not. Current attendance necessarily implies current enrolment but not the vice-versa. Persons, who were temporarily not attending due to reasons like illness, vacation etc. weretreated as currently attending in this survey. Same treatment was applicable for the persons, whowere awaiting their results after completing a particular course and certain to take admission inany further course during the current year (2014).
3.6.2 While every person, who is attending an educational institution, is necessarily enrolled inthat institution it may so happen that a person, who has enrolled in current academicsession/year, is not currently attending the institution. In order to identify those persons, whowere enrolled but currently not attending or never attended, their latest enrolment status wasnoted.
3.6.3 Statement 3.4 reveals that a very few of the persons, aged 5-29 years, were currentlyenrolled but not attending the educational institutions. There was no noticeable rural-urbandisparity observed among the persons currently attending educational institutions, but genderdisparity can be observed in rural areas with 58.7% of males and 53% of females in the 5-29 age-group reported to be attending education.
Statement 3.4: Percentage distribution of current enrolment status of persons (aged 5-29 years)
status rural urban rural + urbanmale female male female male female
(1) (2) (3) (4) (5) (6) (7)currently not enrolled 39.4 45.1 41.5 44.2 40.0 44.8currently enrolledattending 58.7 53.0 57.0 54.6 58.2 53.5not attending 1.4 1.2 1.3 1.1 1.4 1.2all (incl. n.r.) 100.0 100.0 100.0 100.0 100.0 100.0
Note: Figures for sum of currently not enrolled and currently enrolled but not attending in Statement 3.4 may notexactly match with figures of currently not attending in Statement 3.5 due to rounding.
3.6.4 It can be illustrated from Statement 3.5 that about 7% males and 12% females had notstepped into the country’s education system at all, while another 34% were found to have beenenrolled at some time but currently not attending any educational institutions. In rural areas thepercentages of never enrolled in age group 5-29 years were approximately double than that oftheir urban counterparts.
Statement 3.5: Percentage distribution of attendance status of persons (aged 5-29 years)
status rural urban rural + urbanmale female male female male female
(1) (2) (3) (4) (5) (6) (7)currently attending 58.7 53.0 57.0 54.6 58.2 53.5currently not attendingever enrolled 32.7 32.5 38.1 38.4 34.3 34.2never enrolled 8.1 14.0 4.6 6.7 7.1 11.9all (incl. n.r.) 100.0 100.0 100.0 100.0 100.0 100.0

Summary of Findings
NSS KI (71/25.2): Key Indicators of Social Consumption in India: Education 12
3.7 Attendance ratios
3.7.1 Attendance ratios are taken as important indicators for providing insight about theproportion of a population currently attending educational institutions. Gross attendance ratio,net attendance ratio and age-specific attendance ratio are taken as three principal indicators.
3.7.2 School education is divided into primary, middle or upper primary, secondary and highersecondary levels. In most states these terms refer to Classes I-V, VI-VIII, IX-X and XI-XIIrespectively for which the corresponding official age-groups are taken as 6-10, 11-13, 14-15 and16-17 years respectively.
3.7.3 In this document, all the ratios, up to higher secondary level, are exclusive of diploma/certificate courses. Additional information is given for post higher secondary level includingdiploma/certificate courses of level graduation and above to have comparability with the resultsof previous round.
3.7.4 Gross Attendance Ratio (GAR)
3.7.4.1 In the gross attendance ratio, for a particular level of education, the denominator consistsof all persons in the official age-group for that level, whether attending or not, while thenumerator consists of the persons who are studying in that particular level (including personsoutside the official age-group). Therefore, it can work out to be more than 100 as well in somecases. Refer to Appendix B for concepts and definition of GAR.
3.7.4.2 In Statement 3.6a, gross attendance ratio has been presented for all the broad populationcategories, i.e. rural, urban, male and female. For level primary to higher secondary, GAR was91% and 88% for rural males and females respectively, marginally lower as compared to 93%for both males and females in urban sector. However a sharp decline can be noticed in GARfrom higher secondary level onwards.
3.7.4.3 In a large number of States, up to the level of higher secondary, the ratios were more than100 in almost all the population categories (Reference: Table 5, Appendix A), which wouldindicate presence of under-aged and over-aged students in the school education. This ratiodescribes the attendance in school education in totality and therefore has special significance.
Statement 3.6a: Gross attendance ratio (%) for different levels of education
level of education rural urban rural + urbanmale female male female male female
(1) (2) (3) (4) (5) (6) (7)primary 102 100 102 102 102 100upper primary 91 88 93 88 92 88secondary 86 84 90 94 87 87higher secondary 63 58 73 75 66 63primary to highersecondary 91 88 93 93 91 89
above higher secondary 12 9 18 18 14 12

Chapter Three
13 NSS KI (71/25.2): Key Indicators of Social Consumption in India: Education
3.7.4.4 The level of participation at various stages of school education varies significantly acrossdifferent quintile classes of usual monthly per capita consumer expenditure i.e. UMPCE(Statement 3.6b). In both rural and urban India, while only 67% people in the lowest UMPCEquintile class participated in secondary education, it increased to 105% and 111% respectivelyfor rural and urban for the highest UMPCE quintile class. This disparity was increased further athigher secondary level in both the sectors.
Statement 3.6b: Gross attendance ratio (%) for different levels of education for quintile classes of UMPCElevel of education
quintile class ofUMPCE primary upper primary secondary higher
secondary
primary to&
highersecondary
above highersecondary
(1) (2) (3) (4) (5) (6) (7)rural
1 99 81 67 38 82 42 99 91 81 48 87 53 101 94 86 57 90 94 103 94 91 70 93 125 107 91 105 89 99 21
all (2014) 101 90 85 61 90 11all (2007-08 ) 105 82 66 40 84 9
urban1 100 82 67 41 82 62 101 89 92 65 91 103 105 97 100 78 98 164 105 96 103 92 100 245 101 94 111 99 101 33
all (2014) 102 91 92 74 93 18all (2007-08 ) 103 90 85 63 90 23
3.7.4.5 Noticeable improvement was seen in GAR from the 64th round NSS survey, especially inrural areas, where the GARs increased appreciably beyond upper primary level. Figures suggestthat in urban India, GAR had also improved by a fair margin at higher secondary level.
3.7.5 Net Attendance Ratio (NAR)
3.7.5.1 For the country as a whole, 84% male and 83% female children in the age-group 6-10,the official age-group for Classes I-V, were reported to be attending primary classes. There wasno major rural-urban or male-female disparity observed in the survey year at all-India level tillelementary level (primary and upper primary). At higher secondary and post higher secondarylevels, rural-urban differentiation was more pronounced than gender-wise variation. Refer toAppendix B for concepts and definition of NAR and Table 6 in Appendix A for State/UTfigures.
For each class-group, GAR is the ratio of the number of persons in the class-group to the numberpersons in the corresponding official age-group. This ratio can be more than 100.
Summary of Findings
NSS KI (71/25.2): Key Indicators of Social Consumption in India: Education 14
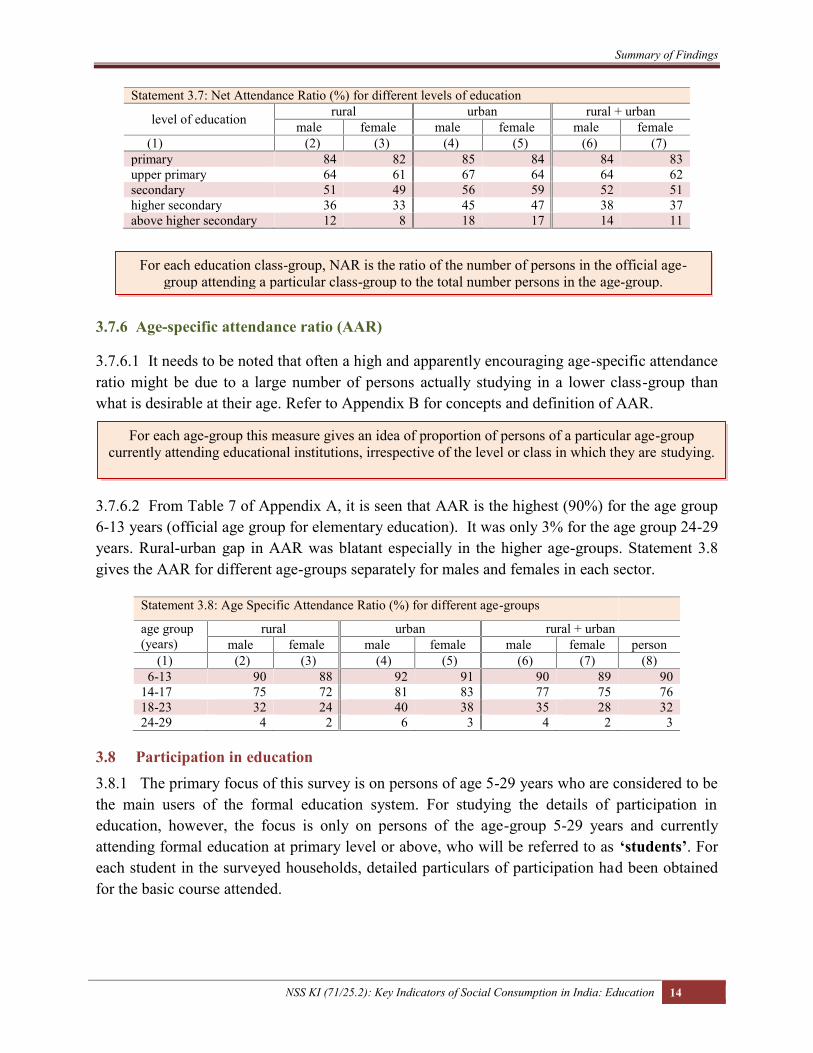
Statement 3.7: Net Attendance Ratio (%) for different levels of education
level of education rural urban rural + urbanmale female male female male female
(1) (2) (3) (4) (5) (6) (7)primary 84 82 85 84 84 83upper primary 64 61 67 64 64 62secondary 51 49 56 59 52 51higher secondary 36 33 45 47 38 37above higher secondary 12 8 18 17 14 11
3.7.6 Age-specific attendance ratio (AAR)
3.7.6.1 It needs to be noted that often a high and apparently encouraging age-specific attendanceratio might be due to a large number of persons actually studying in a lower class-group thanwhat is desirable at their age. Refer to Appendix B for concepts and definition of AAR.
3.7.6.2 From Table 7 of Appendix A, it is seen that AAR is the highest (90%) for the age group6-13 years (official age group for elementary education). It was only 3% for the age group 24-29years. Rural-urban gap in AAR was blatant especially in the higher age-groups. Statement 3.8gives the AAR for different age-groups separately for males and females in each sector.
Statement 3.8: Age Specific Attendance Ratio (%) for different age-groups
age group(years)
rural urban rural + urbanmale female male female male female person
(1) (2) (3) (4) (5) (6) (7) (8)6-13 90 88 92 91 90 89 90
14-17 75 72 81 83 77 75 7618-23 32 24 40 38 35 28 3224-29 4 2 6 3 4 2 3
3.8 Participation in education3.8.1 The primary focus of this survey is on persons of age 5-29 years who are considered to bethe main users of the formal education system. For studying the details of participation ineducation, however, the focus is only on persons of the age-group 5-29 years and currentlyattending formal education at primary level or above, who will be referred to as ‘students’. Foreach student in the surveyed households, detailed particulars of participation had been obtainedfor the basic course attended.
For each education class-group, NAR is the ratio of the number of persons in the official age-group attending a particular class-group to the total number persons in the age-group.
For each age-group this measure gives an idea of proportion of persons of a particular age-groupcurrently attending educational institutions, irrespective of the level or class in which they are studying.
Chapter Three
15 NSS KI (71/25.2): Key Indicators of Social Consumption in India: Education
3.8.2 In this document information is provided on some key features which will be helpful inunderstanding the broad characteristics about participation of students in country’s formalsystem of education. These are:
type of current education (general/ technical and professional),level of current attendance (primary/ upper primary/ secondary etc.),type of institution attended (government/ private aided/ private unaided),
3.9 Current attendance by type of education3.9.1 Education is broadly classified into two categories in this survey (i) general and (ii)technical/ professional (Details are given in Appendix B). Though no separate information onvocational education was collected, it can be easily obtained separately as a part of technicaleducation.
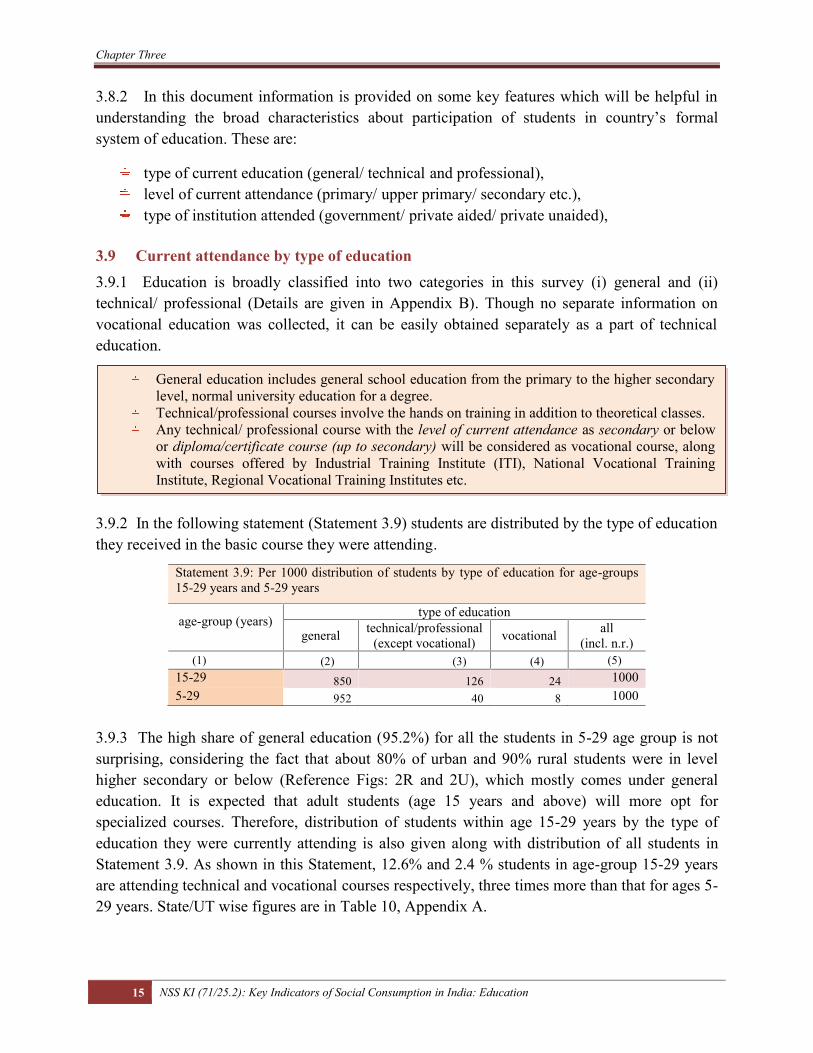
3.9.2 In the following statement (Statement 3.9) students are distributed by the type of educationthey received in the basic course they were attending.
Statement 3.9: Per 1000 distribution of students by type of education for age-groups15-29 years and 5-29 years
age-group (years)type of education
general technical/professional(except vocational) vocational all
(incl. n.r.)(1) (2) (3) (4) (5)
15-29 850 126 24 10005-29 952 40 8 1000
3.9.3 The high share of general education (95.2%) for all the students in 5-29 age group is notsurprising, considering the fact that about 80% of urban and 90% rural students were in levelhigher secondary or below (Reference Figs: 2R and 2U), which mostly comes under generaleducation. It is expected that adult students (age 15 years and above) will more opt forspecialized courses. Therefore, distribution of students within age 15-29 years by the type ofeducation they were currently attending is also given along with distribution of all students inStatement 3.9. As shown in this Statement, 12.6% and 2.4 % students in age-group 15-29 yearsare attending technical and vocational courses respectively, three times more than that for ages 5-29 years. State/UT wise figures are in Table 10, Appendix A.
General education includes general school education from the primary to the higher secondarylevel, normal university education for a degree.Technical/professional courses involve the hands on training in addition to theoretical classes.Any technical/ professional course with the level of current attendance as secondary or belowor diploma/certificate course (up to secondary) will be considered as vocational course, alongwith courses offered by Industrial Training Institute (ITI), National Vocational TrainingInstitute, Regional Vocational Training Institutes etc.

Summary of Findings
NSS KI (71/25.2): Key Indicators of Social Consumption in India: Education 16
3.10 Pattern of current attendance
3.10.1 Distribution of students by level of current attendance is briefed separately for rural andurban sectors in Figs. 2R and 2U.
3.10.2 Among rural persons, 44% of students were at primary level while another 22% were atupper primary level. In the urban areas the proportion of persons in the primary classes wasabout 36%, while the proportion of students at graduation and above (including diploma ofvarious levels) was nearly double of the corresponding rural proportions.
3.11 Attendance by type of courses
3.11.1 In Statement 3.9 it is observed that majority of the students were opting for generaleducation, than technical/vocational education. Statement 3.10a provided the distribution ofstudents by gender, separately for the different courses they were currently attending.
Statement 3.10a: Percentage distribution of students by gender pursuing general andtechnical /professional courses
course male female total(1) (2) (3) (4)
generalup to class X 54.2 45.8 100.0humanities 49.9 50.1 100.0science 59.5 40.5 100.0commerce 56.6 43.4 100.0technical/professionalmedicine 35.3 64.7 100.0engineering 75.2 24.8 100.0law 63.9 36.2 100.0management 62.3 37.7 100.0IT/computer courses 61.1 38.9 100.0courses from ITI/ recognised vocationalinstitutes
82.8 17.2 100.0
others* 51.1 48.9 100.0*includes agriculture, education, chartered accountancy & similar courses and any other coursesnot mentioned elsewhere
44%
22%
15%9%
8% 2%
Fig. 2R: Percentage distribution ofstudents by level of current attendance in
rural sectorprimary
upper
secondary
higher secondary
graduation &abovediploma
36%
20%14%
11%
15% 4%
Fig 2U: Percentage distribution of studentsby level of current attendance in urban
sectorprimary
upper
secondary
higher secondary
graduation &abovediploma
Chapter Three
17 NSS KI (71/25.2): Key Indicators of Social Consumption in India: Education
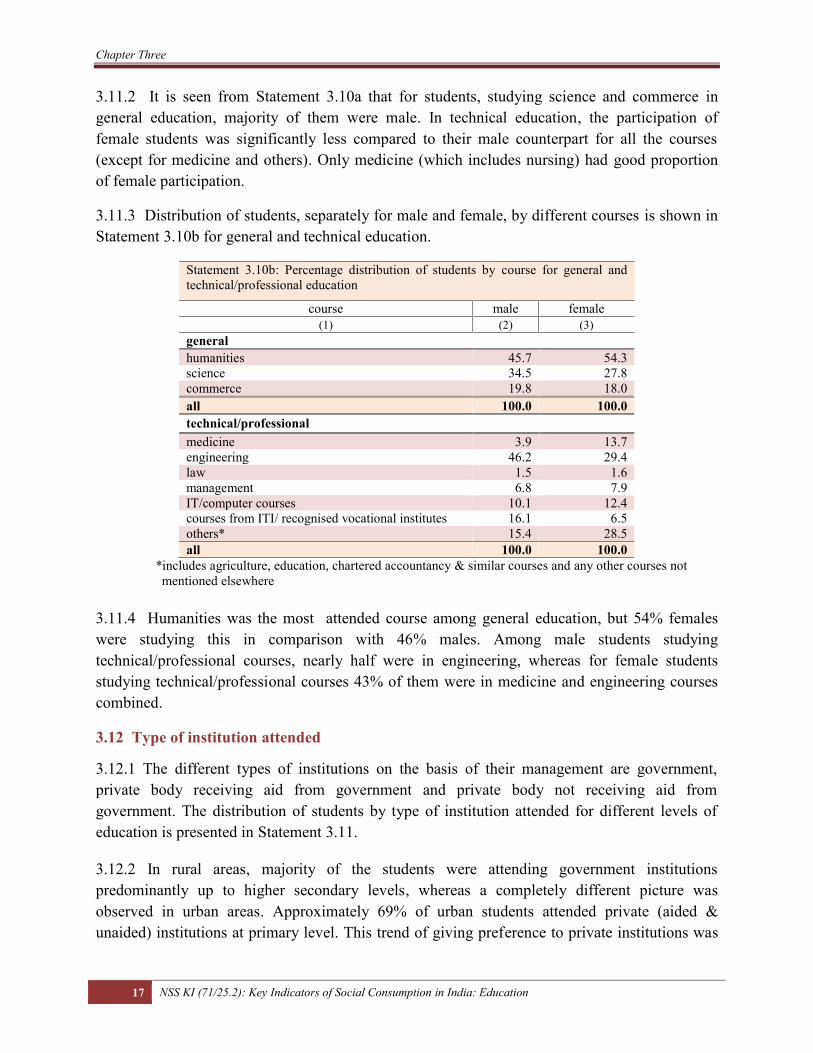
3.11.2 It is seen from Statement 3.10a that for students, studying science and commerce ingeneral education, majority of them were male. In technical education, the participation offemale students was significantly less compared to their male counterpart for all the courses(except for medicine and others). Only medicine (which includes nursing) had good proportionof female participation.
3.11.3 Distribution of students, separately for male and female, by different courses is shown inStatement 3.10b for general and technical education.
Statement 3.10b: Percentage distribution of students by course for general andtechnical/professional education
course male female(1) (2) (3)
generalhumanities 45.7 54.3science 34.5 27.8commerce 19.8 18.0all 100.0 100.0technical/professionalmedicine 3.9 13.7engineering 46.2 29.4law 1.5 1.6management 6.8 7.9IT/computer courses 10.1 12.4courses from ITI/ recognised vocational institutes 16.1 6.5others* 15.4 28.5all 100.0 100.0
*includes agriculture, education, chartered accountancy & similar courses and any other courses notmentioned elsewhere
3.11.4 Humanities was the most attended course among general education, but 54% femaleswere studying this in comparison with 46% males. Among male students studyingtechnical/professional courses, nearly half were in engineering, whereas for female studentsstudying technical/professional courses 43% of them were in medicine and engineering coursescombined.
3.12 Type of institution attended
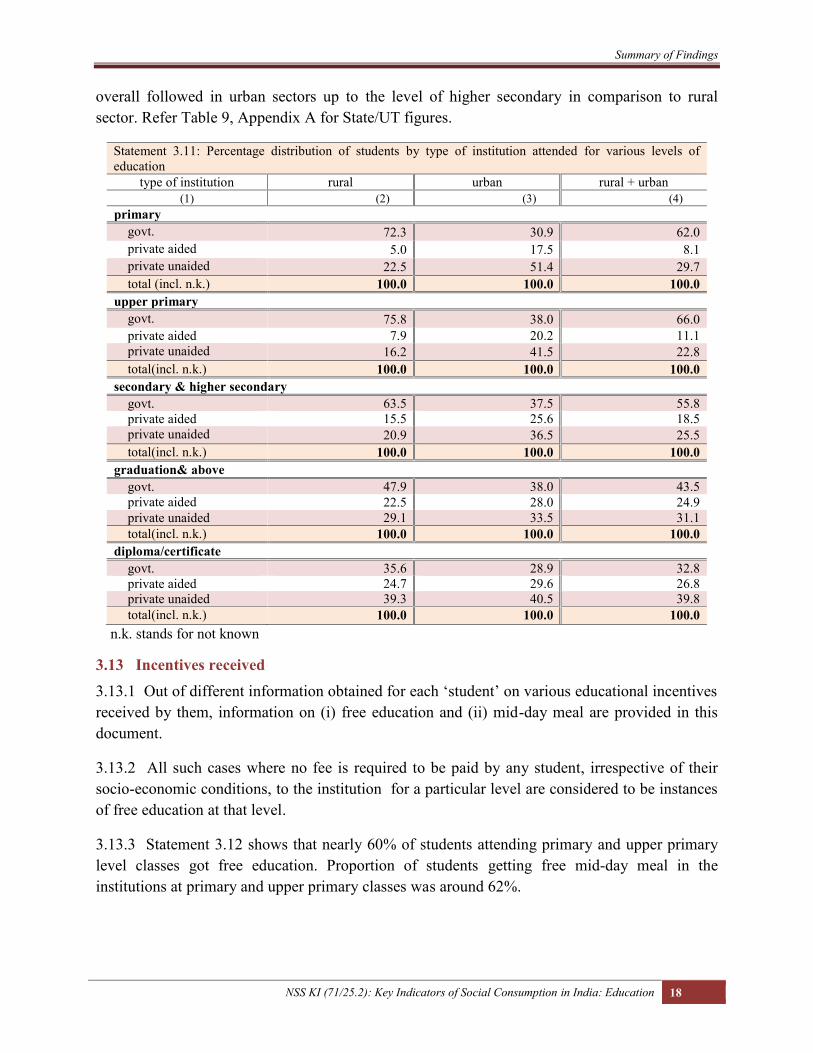
3.12.1 The different types of institutions on the basis of their management are government,private body receiving aid from government and private body not receiving aid fromgovernment. The distribution of students by type of institution attended for different levels ofeducation is presented in Statement 3.11.
3.12.2 In rural areas, majority of the students were attending government institutionspredominantly up to higher secondary levels, whereas a completely different picture wasobserved in urban areas. Approximately 69% of urban students attended private (aided &unaided) institutions at primary level. This trend of giving preference to private institutions was
Summary of Findings
NSS KI (71/25.2): Key Indicators of Social Consumption in India: Education 18
overall followed in urban sectors up to the level of higher secondary in comparison to ruralsector. Refer Table 9, Appendix A for State/UT figures.
Statement 3.11: Percentage distribution of students by type of institution attended for various levels ofeducation
type of institution rural urban rural + urban(1) (2) (3) (4)
primarygovt. 72.3 30.9 62.0private aided 5.0 17.5 8.1private unaided 22.5 51.4 29.7total (incl. n.k.) 100.0 100.0 100.0
upper primarygovt. 75.8 38.0 66.0private aided 7.9 20.2 11.1private unaided 16.2 41.5 22.8total(incl. n.k.) 100.0 100.0 100.0
secondary & higher secondarygovt. 63.5 37.5 55.8private aided 15.5 25.6 18.5private unaided 20.9 36.5 25.5total(incl. n.k.) 100.0 100.0 100.0
graduation& abovegovt. 47.9 38.0 43.5private aided 22.5 28.0 24.9private unaided 29.1 33.5 31.1total(incl. n.k.) 100.0 100.0 100.0
diploma/certificategovt. 35.6 28.9 32.8private aided 24.7 29.6 26.8private unaided 39.3 40.5 39.8total(incl. n.k.) 100.0 100.0 100.0
n.k. stands for not known
3.13 Incentives received3.13.1 Out of different information obtained for each ‘student’ on various educational incentivesreceived by them, information on (i) free education and (ii) mid-day meal are provided in thisdocument.
3.13.2 All such cases where no fee is required to be paid by any student, irrespective of theirsocio-economic conditions, to the institution for a particular level are considered to be instancesof free education at that level.
3.13.3 Statement 3.12 shows that nearly 60% of students attending primary and upper primarylevel classes got free education. Proportion of students getting free mid-day meal in theinstitutions at primary and upper primary classes was around 62%.
Chapter Three
19 NSS KI (71/25.2): Key Indicators of Social Consumption in India: Education
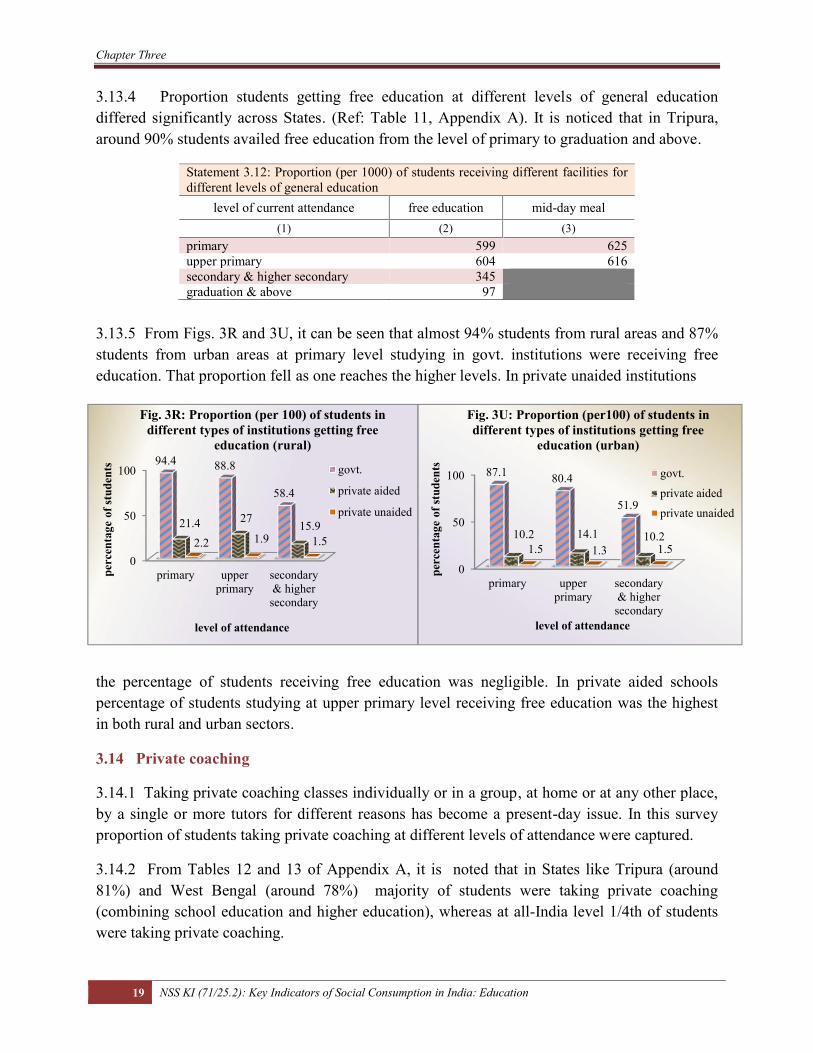
3.13.4 Proportion students getting free education at different levels of general educationdiffered significantly across States. (Ref: Table 11, Appendix A). It is noticed that in Tripura,around 90% students availed free education from the level of primary to graduation and above.
Statement 3.12: Proportion (per 1000) of students receiving different facilities fordifferent levels of general education
level of current attendance free education mid-day meal(1) (2) (3)
primary 599 625upper primary 604 616secondary & higher secondary 345graduation & above 97
3.13.5 From Figs. 3R and 3U, it can be seen that almost 94% students from rural areas and 87%students from urban areas at primary level studying in govt. institutions were receiving freeeducation. That proportion fell as one reaches the higher levels. In private unaided institutions
the percentage of students receiving free education was negligible. In private aided schoolspercentage of students studying at upper primary level receiving free education was the highestin both rural and urban sectors.
3.14 Private coaching
3.14.1 Taking private coaching classes individually or in a group, at home or at any other place,by a single or more tutors for different reasons has become a present-day issue. In this surveyproportion of students taking private coaching at different levels of attendance were captured.
3.14.2 From Tables 12 and 13 of Appendix A, it is noted that in States like Tripura (around81%) and West Bengal (around 78%) majority of students were taking private coaching(combining school education and higher education), whereas at all-India level 1/4th of studentswere taking private coaching.
0
50
100
primary upperprimary
secondary& highersecondary
94.4 88.8
58.4
21.4 27 15.92.2 1.9 1.5
perc
enta
ge o
f stu
dent
s
level of attendance
Fig. 3R: Proportion (per 100) of students indifferent types of institutions getting free
education (rural)
govt.
private aided
private unaided
0
50
100
primary upperprimary
secondary& highersecondary
87.1 80.4
51.9
10.2 14.1 10.21.5 1.3 1.5
perc
enta
ge o
f stu
dent
s
level of attendance
Fig. 3U: Proportion (per100) of students indifferent types of institutions getting free
education (urban)
govt.
private aided
private unaided
Summary of Findings
NSS KI (71/25.2): Key Indicators of Social Consumption in India: Education 20
3.15 Students staying in hostel
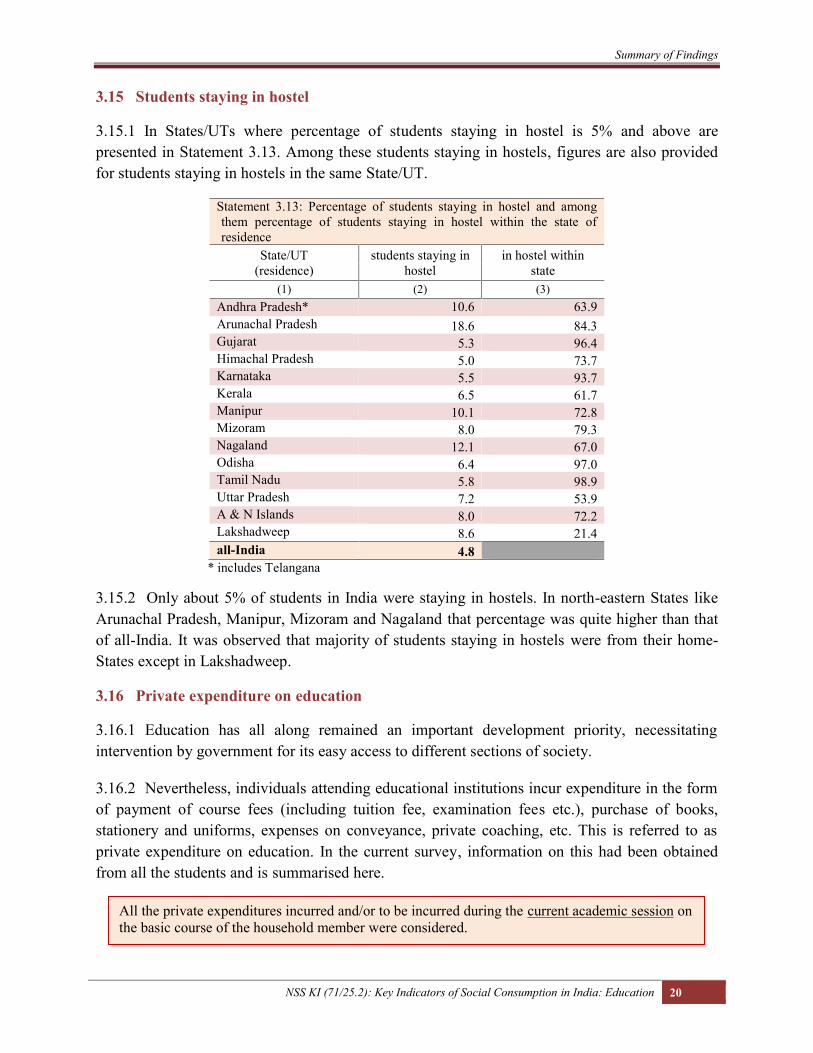
3.15.1 In States/UTs where percentage of students staying in hostel is 5% and above arepresented in Statement 3.13. Among these students staying in hostels, figures are also providedfor students staying in hostels in the same State/UT.
Statement 3.13: Percentage of students staying in hostel and amongthem percentage of students staying in hostel within the state ofresidence
State/UT(residence)
students staying inhostel
in hostel withinstate
(1) (2) (3)Andhra Pradesh* 10.6 63.9Arunachal Pradesh 18.6 84.3Gujarat 5.3 96.4Himachal Pradesh 5.0 73.7Karnataka 5.5 93.7Kerala 6.5 61.7Manipur 10.1 72.8Mizoram 8.0 79.3Nagaland 12.1 67.0Odisha 6.4 97.0Tamil Nadu 5.8 98.9Uttar Pradesh 7.2 53.9A & N Islands 8.0 72.2Lakshadweep 8.6 21.4all-India 4.8
* includes Telangana
3.15.2 Only about 5% of students in India were staying in hostels. In north-eastern States likeArunachal Pradesh, Manipur, Mizoram and Nagaland that percentage was quite higher than thatof all-India. It was observed that majority of students staying in hostels were from their home-States except in Lakshadweep.
3.16 Private expenditure on education
3.16.1 Education has all along remained an important development priority, necessitatingintervention by government for its easy access to different sections of society.
3.16.2 Nevertheless, individuals attending educational institutions incur expenditure in the formof payment of course fees (including tuition fee, examination fees etc.), purchase of books,stationery and uniforms, expenses on conveyance, private coaching, etc. This is referred to asprivate expenditure on education. In the current survey, information on this had been obtainedfrom all the students and is summarised here.
All the private expenditures incurred and/or to be incurred during the current academic session onthe basic course of the household member were considered.

Chapter Three
21 NSS KI (71/25.2): Key Indicators of Social Consumption in India: Education
3.17 Average expenditure on education
3.17.1 The average annual private expenditure in general, technical and vocational education ispresented in Statement 3.14 in comparison with NSS 64th round (2007-08).
Statement 3.14: Average expenditure (`) per student by type of education
yeartype of education
general technical/professional(except vocational) vocational
(1) (2) (3) (4)2014 6788 62841 276762007-08 2461 32112 14881
3.17.2 In this round, average expenditure on technical/professional and vocational educationwere about 9 times and 4 times respectively than that on general education. In 2007-08 thosewere 13 times and 6 time respectively. Detailed State/UT wise average expenditure for thesethree types of education is given in Table 14 in Appendix A. It is to be mentioned that in Stateslike Delhi, Chandigarh, Haryana the average expenditure in general education was more thandouble of the national average.
3.17.3 Expenditure on general education3.17.3.1 From Statement 3.15 it is observed that with increase in level of current attendance (notconsidering diploma) the expenditure was seen to increase. The rural-urban differentiationnarrowed down at the higher levels of general education. At primary level, expenditure perstudent in urban areas was `10083, more than four times than that in rural areas. It is noted that atgraduation and post-graduation level, average expenditure for female students is more than theirmale counterparts in rural areas. State/UT wise figures for different levels are provided in Table15 in Appendix A.
Statement 3.15: Average expenditure (`) per student pursuing general education atdifferent levels
gender primary upperprimary secondary HS graduate PG and
above diploma
(1) (2) (3) (4) (5) (6) (7) (8)rural
male 3061 3603 5568 9820 11306 13017 15209female 2512 2813 4534 8012 11813 16715 10706person 2811 3242 5100 9031 11527 14604 13422
urbanmale 10604 11864 13781 21681 17480 19090 23040female 9489 10940 13284 18442 16161 16565 21249person 10083 11446 13547 20179 16771 17744 21947
rural + urbanmale 4895 5775 7805 13511 13324 15417 16920female 4273 4922 7049 11509 13649 16641 14918person 4610 5386 7459 12619 13478 15999 15997
Summary of Findings
NSS KI (71/25.2): Key Indicators of Social Consumption in India: Education 22
3.17.3.2 Average expenditure at different levels for studying in different type of institutions isanother significant issue of this survey. A huge difference is found in average educationalexpenditure between the schools run by government and the private ones (Statement 3.16). Evendifference in the expenditure pattern between students from rural and urban areas was prominent.At primary level average expenditure varied between 6-7 times for urban and rural sectorsbetween govt. and private aided schools.
Statement 3.16: Average expenditure (`) per student pursuing general education by level ofattendance and type of institution
level of attendance
type of institutionrural urban
govt. privateaided
privateunaided govt. private
aidedprivateunaided
(1) (2) (3) (4) (5) (6) (7)primary 965 6452 7907 2149 11881 14242upper primary 1605 6013 9514 3358 12074 18553secondary 3328 5896 11222 5540 14096 21565higher secondary 6056 10803 13988 9668 20066 30810graduate 8753 11730 17093 11560 16993 26380post graduate and above 11403 14224 25372 13580 20978 29661diploma 10603 14935 20976 12184 19059 46445
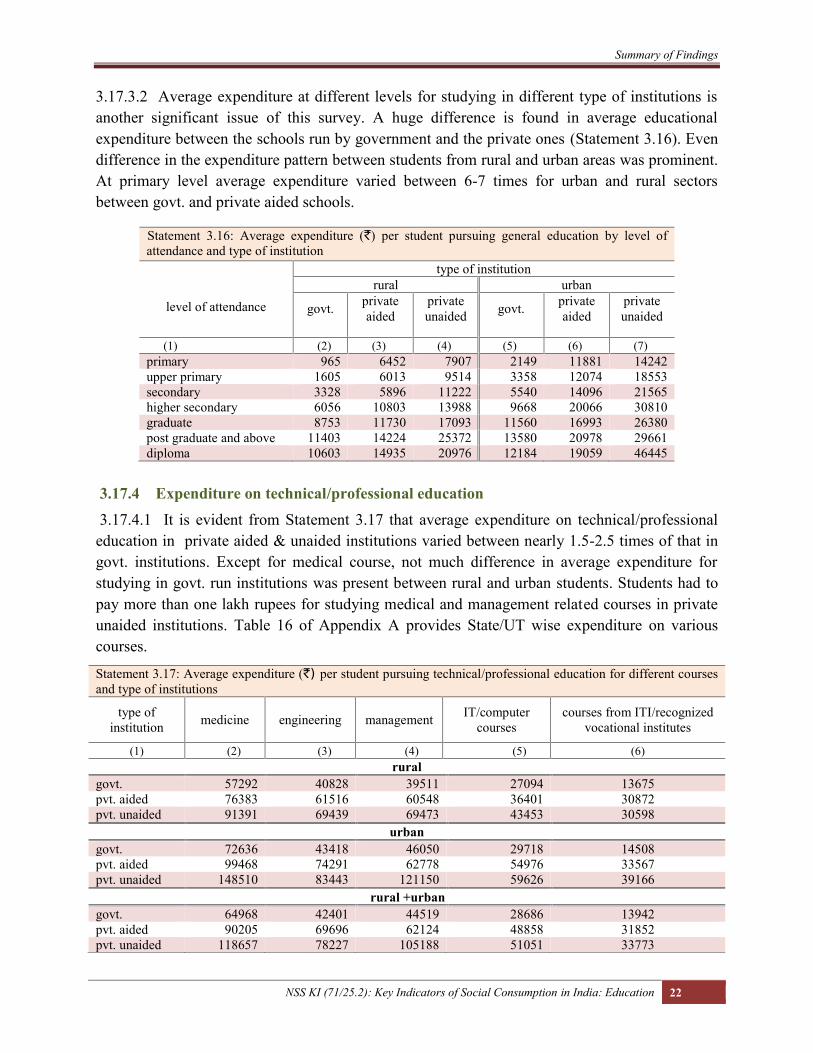
3.17.4 Expenditure on technical/professional education3.17.4.1 It is evident from Statement 3.17 that average expenditure on technical/professional
education in private aided & unaided institutions varied between nearly 1.5-2.5 times of that ingovt. institutions. Except for medical course, not much difference in average expenditure forstudying in govt. run institutions was present between rural and urban students. Students had topay more than one lakh rupees for studying medical and management related courses in privateunaided institutions. Table 16 of Appendix A provides State/UT wise expenditure on variouscourses.
Statement 3.17: Average expenditure (`) per student pursuing technical/professional education for different coursesand type of institutions
type ofinstitution medicine engineering management IT/computer
coursescourses from ITI/recognized
vocational institutes
(1) (2) (3) (4) (5) (6)rural
govt. 57292 40828 39511 27094 13675pvt. aided 76383 61516 60548 36401 30872pvt. unaided 91391 69439 69473 43453 30598
urbangovt. 72636 43418 46050 29718 14508pvt. aided 99468 74291 62778 54976 33567pvt. unaided 148510 83443 121150 59626 39166
rural +urbangovt. 64968 42401 44519 28686 13942pvt. aided 90205 69696 62124 48858 31852pvt. unaided 118657 78227 105188 51051 33773
Chapter Three
23 NSS KI (71/25.2): Key Indicators of Social Consumption in India: Education
3.17.5 Components of private expenditure on education3.17.5.1 The private education expenditure is composed of different items of educationalexpenditure, viz. course fees; books, stationery and uniform; transport; private coaching; etc.
3.17.5.2 The share of each of the above components in average expenditure has been presentedin Statement 3.18 below for general and technical courses.
Statement 3.18: Major components of expenditure and their share(%) in total expenditure
component of expenditure generaleducation
technical/professionaleducation (including
vocational)(1) (2) (3)
course fee 46 73books, stationery etc. 22 10transport 11 6private coaching 15 3other expenditure 5 8total 100 100average expenditure (`)per course
6788 57094
3.17.5.3 The lion’s share in average expenditure was contributed by course fees for all types ofeducation (46% for general and 73% for technical), followed by books and stationery. Forstudents attending general courses, 15% was spent on private coaching.
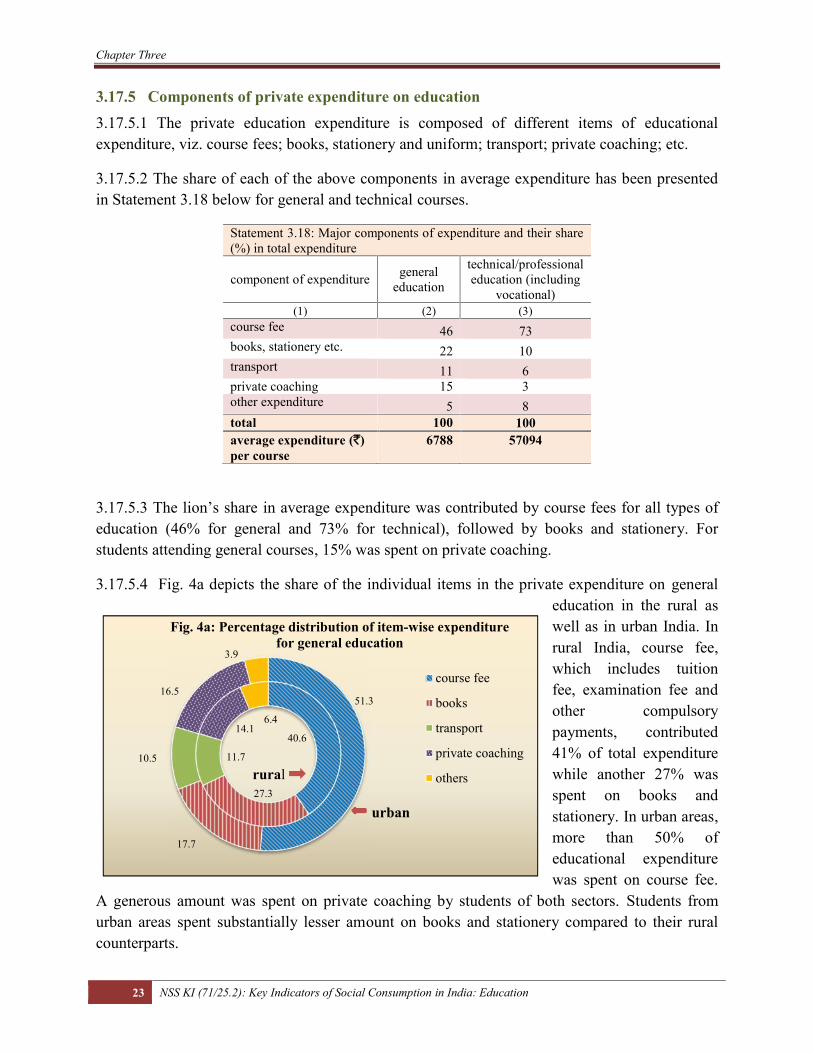
3.17.5.4 Fig. 4a depicts the share of the individual items in the private expenditure on generaleducation in the rural aswell as in urban India. Inrural India, course fee,which includes tuitionfee, examination fee andother compulsorypayments, contributed41% of total expenditurewhile another 27% wasspent on books andstationery. In urban areas,more than 50% ofeducational expenditurewas spent on course fee.
A generous amount was spent on private coaching by students of both sectors. Students fromurban areas spent substantially lesser amount on books and stationery compared to their ruralcounterparts.
40.6
27.3
11.7
14.16.4
51.3
17.7
10.5
16.5
3.9
Fig. 4a: Percentage distribution of item-wise expenditurefor general education
course fee
books
transport
private coaching
othersrural
urban

Summary of Findings
NSS KI (71/25.2): Key Indicators of Social Consumption in India: Education 24
3.17.5.5 Fig. 4b focuses on the component-wise share in technical/ professional education. Itcan be seen that coursefee alone contributednearly 3/4th of the totalshare in urban sector andmore than 2/3rd in ruralsector. It is also observedthat approximately 6% oftotal expenditure wasspent on transport. Shareof private coaching intechnical education (2%-3% for rural and urban)was very less in technicaleducation in comparison with general education (around 15%).
3.18 Never-enrolment and discontinuance of education
3.18.1 This section focuses on persons of age 5 - 29 years who were not currently attending anyeducational institution according to the current survey. Such persons had varying status ofparticipation in the education system in the past. A section of them had never been enrolled inany educational institution and in that sense had not entered the education system of the country.Others had been enrolled at some point in the past, but were not currently attending anyinstitution, either because they had completed their desired level of education or because theycould not complete education for some reason.
3.18.2 Never-enrolment and dropping out are two critical issues plaguing the education systemof our country. Their dimension can be gauged from the following statements.
Statement 3.19a: Proportion (per 1000) of persons (age 5-29 years) dropping out/discontinued educationand never-enrolled for quintile classes of UMPCE
quintile class ofUMPCE
rural urbanproportion of
droppingout/discontinuance
proportion of neverenrolled
proportion ofdropping
out/discontinuance
proportion ofnever enrolled
(1) (2) (3) (4) (5)1 297 155 360 1242 326 121 406 693 338 116 406 444 339 86 383 215 334 59 360 9
all 326 109 383 56all (2007-08) 327 158 390 80
3.18.3 Statement 3.19a shows how the proportion of dropping out/discontinuance and never-enrolled persons changed with change in household’s living standards as measured by household
69.911.3
6.292.3 10.2
74.3
9.5
6.2
3.16.9
Fig. 4b: Percentage distribution of item-wise expenditurefor technical/professional education
course fee
books
transport
private coaching
othersrural
urban
Chapter Three
25 NSS KI (71/25.2): Key Indicators of Social Consumption in India: Education
usual monthly per capita consumer expenditure (UMPCE). It can be observed that the proportionof never enrolled persons (age 5-29 years) fell steeply from nearly 16% in the poorest quintileclass to only 6% in the richest quintile class in rural India. In urban India too, the percentagedropped from 12% to 1% from the bottom to the top quintile classes of UMPCE.
3.18.4 The proportion of never enrolled persons in the year 2014 had reduced by approximately30% over the year 2007-08 which is inspiring. The overall picture for proportion of droppingout/discontinuance, both in rural and urban areas had not changed significantly over time as wellas over UMPCE classes.
3.18.5 The proportions of dropping out/discontinuance in Statement 3.19a are among thepersons between age 5-29 years and not among the ever-enrolled persons of age 5-29 years inrespective UMPCE classes.
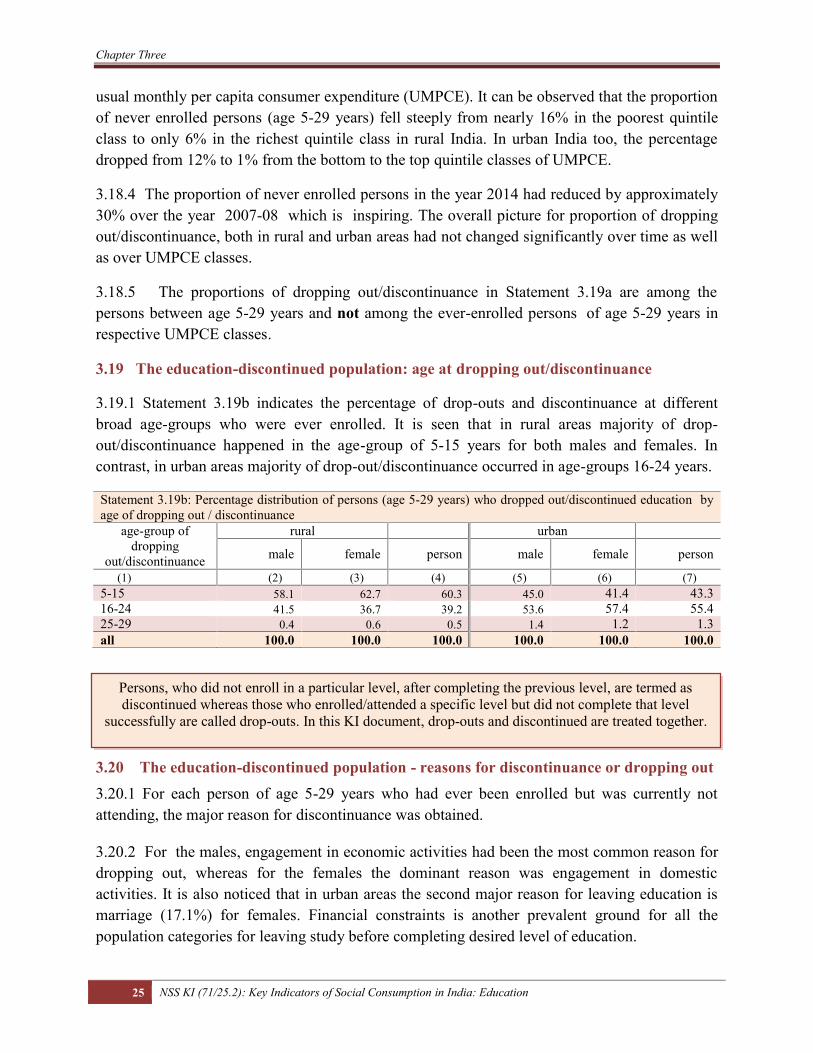
3.19 The education-discontinued population: age at dropping out/discontinuance
3.19.1 Statement 3.19b indicates the percentage of drop-outs and discontinuance at differentbroad age-groups who were ever enrolled. It is seen that in rural areas majority of drop-out/discontinuance happened in the age-group of 5-15 years for both males and females. Incontrast, in urban areas majority of drop-out/discontinuance occurred in age-groups 16-24 years.
Statement 3.19b: Percentage distribution of persons (age 5-29 years) who dropped out/discontinued education byage of dropping out / discontinuance
age-group ofdropping
out/discontinuance
rural urban
male female person male female person
(1) (2) (3) (4) (5) (6) (7)5-15 58.1 62.7 60.3 45.0 41.4 43.316-24 41.5 36.7 39.2 53.6 57.4 55.425-29 0.4 0.6 0.5 1.4 1.2 1.3all 100.0 100.0 100.0 100.0 100.0 100.0
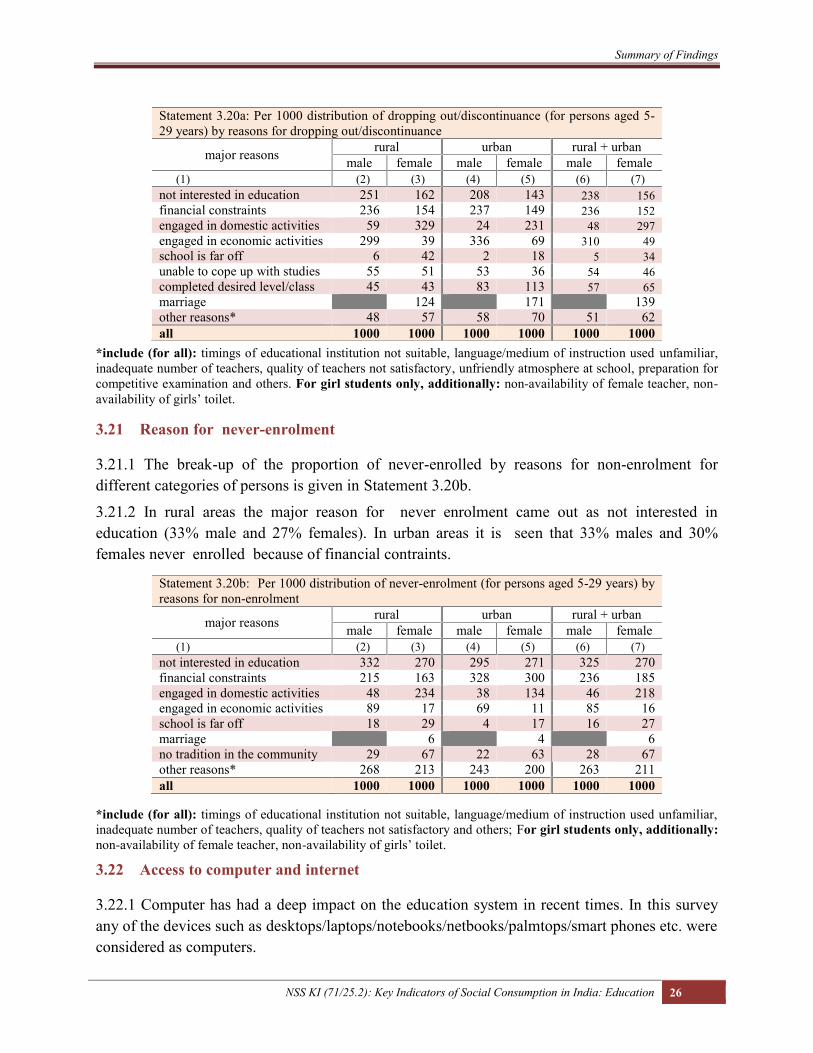
3.20 The education-discontinued population - reasons for discontinuance or dropping out3.20.1 For each person of age 5-29 years who had ever been enrolled but was currently notattending, the major reason for discontinuance was obtained.
3.20.2 For the males, engagement in economic activities had been the most common reason fordropping out, whereas for the females the dominant reason was engagement in domesticactivities. It is also noticed that in urban areas the second major reason for leaving education ismarriage (17.1%) for females. Financial constraints is another prevalent ground for all thepopulation categories for leaving study before completing desired level of education.
Persons, who did not enroll in a particular level, after completing the previous level, are termed asdiscontinued whereas those who enrolled/attended a specific level but did not complete that level
successfully are called drop-outs. In this KI document, drop-outs and discontinued are treated together.
Summary of Findings
NSS KI (71/25.2): Key Indicators of Social Consumption in India: Education 26
*include (for all): timings of educational institution not suitable, language/medium of instruction used unfamiliar,inadequate number of teachers, quality of teachers not satisfactory, unfriendly atmosphere at school, preparation forcompetitive examination and others. For girl students only, additionally: non-availability of female teacher, non-availability of girls’ toilet.
3.21 Reason for never-enrolment
3.21.1 The break-up of the proportion of never-enrolled by reasons for non-enrolment fordifferent categories of persons is given in Statement 3.20b.
3.21.2 In rural areas the major reason for never enrolment came out as not interested ineducation (33% male and 27% females). In urban areas it is seen that 33% males and 30%females never enrolled because of financial contraints.
*include (for all): timings of educational institution not suitable, language/medium of instruction used unfamiliar,inadequate number of teachers, quality of teachers not satisfactory and others; For girl students only, additionally:non-availability of female teacher, non-availability of girls’ toilet.
3.22 Access to computer and internet
3.22.1 Computer has had a deep impact on the education system in recent times. In this surveyany of the devices such as desktops/laptops/notebooks/netbooks/palmtops/smart phones etc. wereconsidered as computers.
Statement 3.20a: Per 1000 distribution of dropping out/discontinuance (for persons aged 5-29 years) by reasons for dropping out/discontinuance
major reasons rural urban rural + urbanmale female male female male female
(1) (2) (3) (4) (5) (6) (7)not interested in education 251 162 208 143 238 156financial constraints 236 154 237 149 236 152engaged in domestic activities 59 329 24 231 48 297engaged in economic activities 299 39 336 69 310 49school is far off 6 42 2 18 5 34unable to cope up with studies 55 51 53 36 54 46completed desired level/class 45 43 83 113 57 65marriage 124 171 139other reasons* 48 57 58 70 51 62all 1000 1000 1000 1000 1000 1000
Statement 3.20b: Per 1000 distribution of never-enrolment (for persons aged 5-29 years) byreasons for non-enrolment
major reasons rural urban rural + urbanmale female male female male female
(1) (2) (3) (4) (5) (6) (7)not interested in education 332 270 295 271 325 270financial constraints 215 163 328 300 236 185engaged in domestic activities 48 234 38 134 46 218engaged in economic activities 89 17 69 11 85 16school is far off 18 29 4 17 16 27marriage 6 4 6no tradition in the community 29 67 22 63 28 67other reasons* 268 213 243 200 263 211all 1000 1000 1000 1000 1000 1000
Chapter Three
27 NSS KI (71/25.2): Key Indicators of Social Consumption in India: Education
3.22.2 Tables 18 and 19 of Appendix A show the proportion of households having computer andaccess to internet facility respectively. It is observed that only 6% of rural households and 29%of urban household possessed computer. In the households where at least one member of age 14years and above was present was asked about the access to use internet facility (not necessarilyhaving the facility possessed by the household). The fact is that 27% of Indian households (16%rural and 49% urban) had access to internet facility in the survey year, 2014.
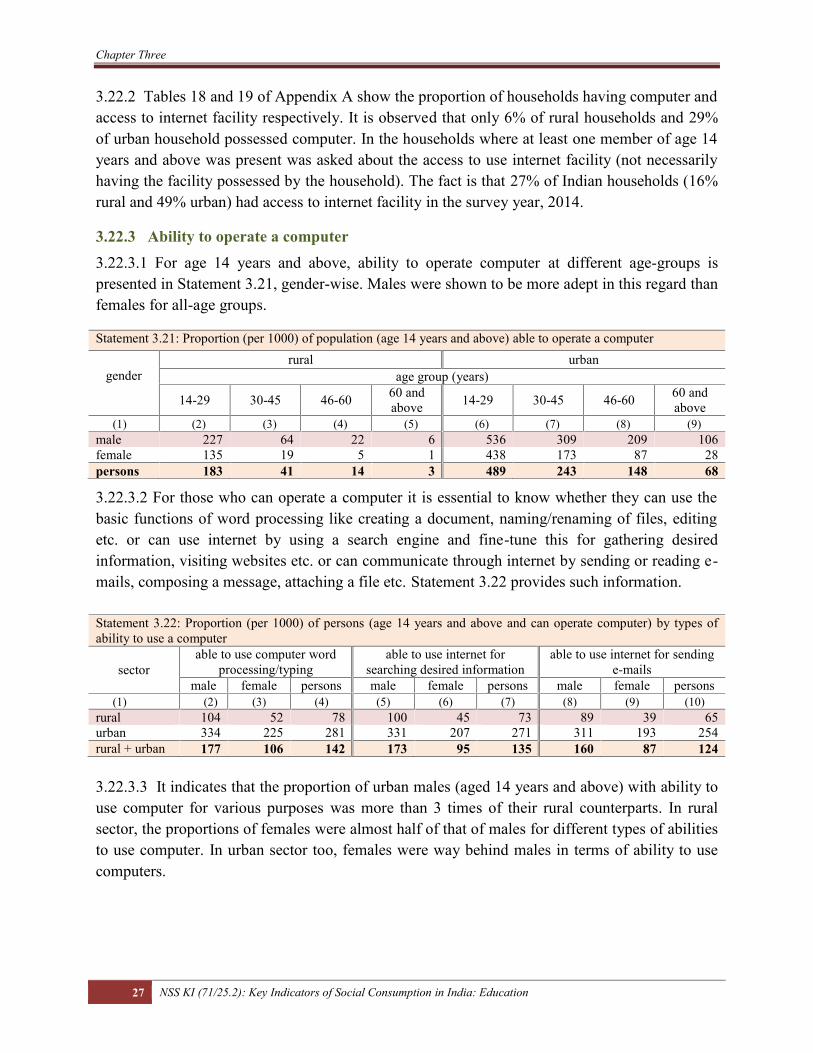
3.22.3 Ability to operate a computer3.22.3.1 For age 14 years and above, ability to operate computer at different age-groups ispresented in Statement 3.21, gender-wise. Males were shown to be more adept in this regard thanfemales for all-age groups.
Statement 3.21: Proportion (per 1000) of population (age 14 years and above) able to operate a computer
genderrural urban
age group (years)
14-29 30-45 46-60 60 andabove 14-29 30-45 46-60 60 and
above(1) (2) (3) (4) (5) (6) (7) (8) (9)
male 227 64 22 6 536 309 209 106female 135 19 5 1 438 173 87 28persons 183 41 14 3 489 243 148 68
3.22.3.2 For those who can operate a computer it is essential to know whether they can use thebasic functions of word processing like creating a document, naming/renaming of files, editingetc. or can use internet by using a search engine and fine-tune this for gathering desiredinformation, visiting websites etc. or can communicate through internet by sending or reading e-mails, composing a message, attaching a file etc. Statement 3.22 provides such information.
Statement 3.22: Proportion (per 1000) of persons (age 14 years and above and can operate computer) by types ofability to use a computer
sectorable to use computer word
processing/typingable to use internet for
searching desired informationable to use internet for sending
e-mailsmale female persons male female persons male female persons
(1) (2) (3) (4) (5) (6) (7) (8) (9) (10)rural 104 52 78 100 45 73 89 39 65urban 334 225 281 331 207 271 311 193 254rural + urban 177 106 142 173 95 135 160 87 124
3.22.3.3 It indicates that the proportion of urban males (aged 14 years and above) with ability touse computer for various purposes was more than 3 times of their rural counterparts. In ruralsector, the proportions of females were almost half of that of males for different types of abilitiesto use computer. In urban sector too, females were way behind males in terms of ability to usecomputers.

Appendix AState Tables


State Tables Appendix A
NSS KI (71/25.2): Key Indicators of Social Consumption in India: Education A-1
Table 1: State/UT wise estimated population (00) for different age-groups by gender rural
State/UTage-groups (in years)
5 6-10 11-13 14-15 16-17 18-24 25-29 5-29male female male female male female male female male female male female male female male female
(1) (2) (3) (4) (5) (6) (7) (8) (9) (10) (11) (12) (13) (14) (15) (16) (17)Andhra Pradesh 2797 2337 13473 11510 8203 9035 6073 4081 6375 4498 19203 19081 14939 11947 71063 62488Arunachal Pradesh 95 79 501 559 274 229 257 259 283 215 553 443 325 377 2289 2162Assam 2057 1560 15882 10800 7821 5324 5742 4287 4213 3476 15036 13332 10517 10410 61269 49188Bihar 11237 7985 65279 56188 31790 25526 23415 17297 18453 14171 48800 41353 23267 29185 222242 191707Chhattisgarh 1772 1269 11080 9920 6422 6077 5141 4992 4487 2739 11962 10721 6866 6942 47730 42659Delhi 112 0 218 141 140 80 46 56 96 54 323 239 359 248 1295 820Goa 68 34 74 264 62 189 43 91 53 92 240 273 269 254 811 1197Gujarat 1876 1836 16974 15465 10248 8258 6771 5546 6997 5817 22194 18646 8645 9469 73708 65036Haryana 1377 713 8892 7111 5279 4263 3105 3068 2790 3158 10855 11175 7296 4771 39595 34260Himachal Pradesh 296 432 2322 2481 1705 1434 1030 917 1373 1200 3462 3195 1890 2375 12077 12035Jammu & Kashmir 456 253 5255 3899 2973 2387 2103 1561 1933 1665 5170 4627 2912 2327 20801 16719Jharkhand 2898 2700 17653 13971 9378 7315 5973 4476 5348 4792 14228 14322 8367 9888 63845 57465Karnataka 2217 1950 15546 15110 8829 8716 6419 5595 5872 5425 20590 22680 14659 13068 74132 72545Kerala 1624 916 6068 5977 4624 4884 2720 3377 3166 2907 8832 10095 5750 6309 32785 34464Madhya Pradesh 4074 4547 29246 27103 17870 18226 13326 10767 9944 9547 33426 31141 21280 20408 129166 121739Maharashtra 3505 4046 28187 19440 16014 15166 10985 8319 10841 8847 37509 32336 19376 22969 126418 111122Manipur 78 30 1076 732 414 390 303 252 310 234 1065 835 658 801 3904 3274Meghalaya 146 115 1458 1265 546 707 570 547 495 533 1724 1681 992 1118 5931 5965Mizoram 11 18 277 317 200 183 96 106 77 69 349 355 178 173 1189 1221Nagaland 43 58 676 745 559 354 368 391 202 243 647 866 615 818 3110 3475Odisha 1395 3040 16741 14223 10540 9365 7999 7460 5524 6470 22654 20568 11942 12686 76794 73812Punjab 1122 925 7094 6801 5336 3389 3130 2916 2861 2273 12033 8325 5888 6271 37464 30898Rajasthan 5053 3516 32960 25738 15875 14959 12805 11385 9452 7956 31345 31884 16955 17193 124447 112631Sikkim 38 10 259 227 101 99 127 96 106 97 218 223 164 183 1013 936Tamil Nadu 2004 1374 14819 12268 9965 9814 6685 5837 6989 4460 16736 18648 12439 14932 69638 67334Telangana 1226 638 8357 5962 5248 5028 4395 2672 4463 2963 13553 10346 6104 7457 43346 35065Tripura 405 182 1648 1065 793 562 770 509 387 200 1257 1660 872 1152 6134 5329Uttar Pradesh 16996 15204 104872 91779 54850 45098 38545 33115 34587 29509 100147 88102 44988 43446 394984 346253Uttarakhand 391 258 4340 3204 2363 1873 1736 1049 1362 1012 4350 2602 1495 2722 16038 12721West Bengal 4187 3833 29570 28454 18512 17353 11343 12676 11241 9995 39067 37098 21193 23735 135113 133144A & N Islands 13 13 59 47 37 71 22 41 24 48 136 143 89 106 381 470Chandigarh 7 1 16 21 13 12 5 6 4 7 29 10 19 21 92 78Dadra & N. Haveli 66 5 105 114 41 51 19 34 11 22 85 107 131 53 458 384Daman & Diu 8 0 13 15 11 19 21 16 13 14 35 36 15 11 115 110Lakshadweep 0 0 5 5 5 5 3 2 3 1 14 12 6 6 35 31Puducherry 46 0 210 118 145 42 17 56 44 107 216 206 393 203 1071 732all-India 69700 59878 461203 393041 257189 226482 182109 153855 160380 134817 498046 457363 271852 284034 1900479 1709470
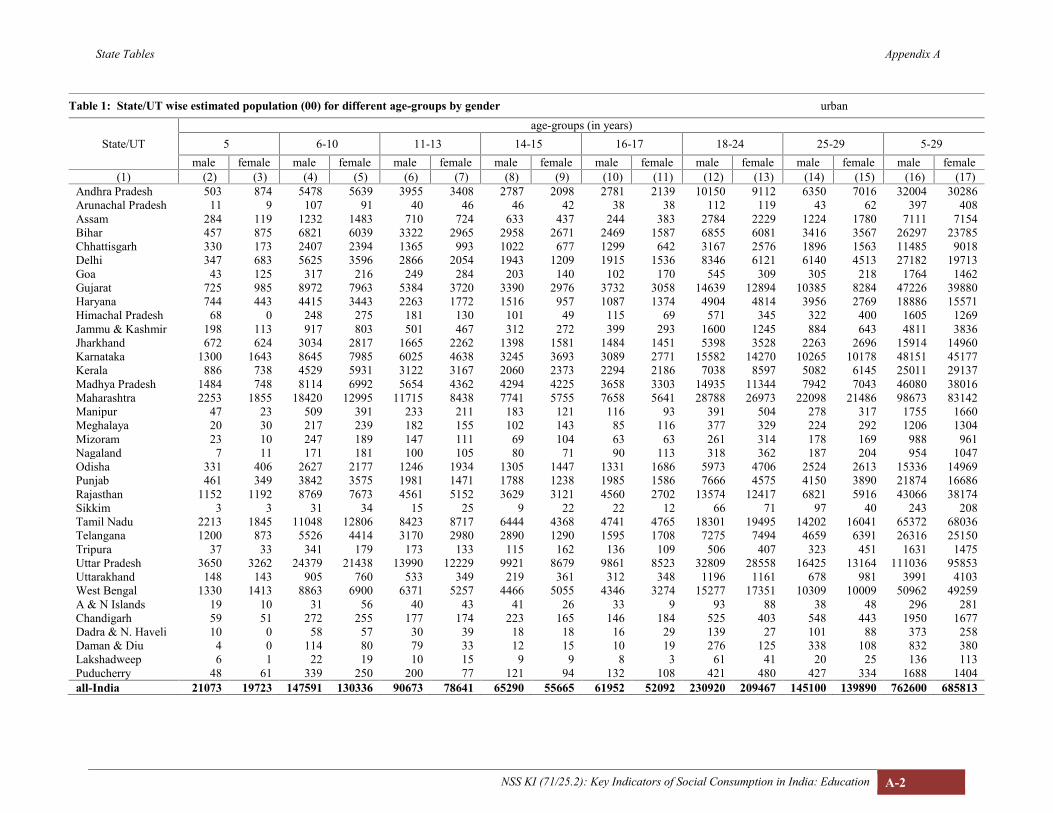
State Tables Appendix A
NSS KI (71/25.2): Key Indicators of Social Consumption in India: Education A-2
Table 1: State/UT wise estimated population (00) for different age-groups by gender urban
State/UTage-groups (in years)
5 6-10 11-13 14-15 16-17 18-24 25-29 5-29male female male female male female male female male female male female male female male female
(1) (2) (3) (4) (5) (6) (7) (8) (9) (10) (11) (12) (13) (14) (15) (16) (17)Andhra Pradesh 503 874 5478 5639 3955 3408 2787 2098 2781 2139 10150 9112 6350 7016 32004 30286Arunachal Pradesh 11 9 107 91 40 46 46 42 38 38 112 119 43 62 397 408Assam 284 119 1232 1483 710 724 633 437 244 383 2784 2229 1224 1780 7111 7154Bihar 457 875 6821 6039 3322 2965 2958 2671 2469 1587 6855 6081 3416 3567 26297 23785Chhattisgarh 330 173 2407 2394 1365 993 1022 677 1299 642 3167 2576 1896 1563 11485 9018Delhi 347 683 5625 3596 2866 2054 1943 1209 1915 1536 8346 6121 6140 4513 27182 19713Goa 43 125 317 216 249 284 203 140 102 170 545 309 305 218 1764 1462Gujarat 725 985 8972 7963 5384 3720 3390 2976 3732 3058 14639 12894 10385 8284 47226 39880Haryana 744 443 4415 3443 2263 1772 1516 957 1087 1374 4904 4814 3956 2769 18886 15571Himachal Pradesh 68 0 248 275 181 130 101 49 115 69 571 345 322 400 1605 1269Jammu & Kashmir 198 113 917 803 501 467 312 272 399 293 1600 1245 884 643 4811 3836Jharkhand 672 624 3034 2817 1665 2262 1398 1581 1484 1451 5398 3528 2263 2696 15914 14960Karnataka 1300 1643 8645 7985 6025 4638 3245 3693 3089 2771 15582 14270 10265 10178 48151 45177Kerala 886 738 4529 5931 3122 3167 2060 2373 2294 2186 7038 8597 5082 6145 25011 29137Madhya Pradesh 1484 748 8114 6992 5654 4362 4294 4225 3658 3303 14935 11344 7942 7043 46080 38016Maharashtra 2253 1855 18420 12995 11715 8438 7741 5755 7658 5641 28788 26973 22098 21486 98673 83142Manipur 47 23 509 391 233 211 183 121 116 93 391 504 278 317 1755 1660Meghalaya 20 30 217 239 182 155 102 143 85 116 377 329 224 292 1206 1304Mizoram 23 10 247 189 147 111 69 104 63 63 261 314 178 169 988 961Nagaland 7 11 171 181 100 105 80 71 90 113 318 362 187 204 954 1047Odisha 331 406 2627 2177 1246 1934 1305 1447 1331 1686 5973 4706 2524 2613 15336 14969Punjab 461 349 3842 3575 1981 1471 1788 1238 1985 1586 7666 4575 4150 3890 21874 16686Rajasthan 1152 1192 8769 7673 4561 5152 3629 3121 4560 2702 13574 12417 6821 5916 43066 38174Sikkim 3 3 31 34 15 25 9 22 22 12 66 71 97 40 243 208Tamil Nadu 2213 1845 11048 12806 8423 8717 6444 4368 4741 4765 18301 19495 14202 16041 65372 68036Telangana 1200 873 5526 4414 3170 2980 2890 1290 1595 1708 7275 7494 4659 6391 26316 25150Tripura 37 33 341 179 173 133 115 162 136 109 506 407 323 451 1631 1475Uttar Pradesh 3650 3262 24379 21438 13990 12229 9921 8679 9861 8523 32809 28558 16425 13164 111036 95853Uttarakhand 148 143 905 760 533 349 219 361 312 348 1196 1161 678 981 3991 4103West Bengal 1330 1413 8863 6900 6371 5257 4466 5055 4346 3274 15277 17351 10309 10009 50962 49259A & N Islands 19 10 31 56 40 43 41 26 33 9 93 88 38 48 296 281Chandigarh 59 51 272 255 177 174 223 165 146 184 525 403 548 443 1950 1677Dadra & N. Haveli 10 0 58 57 30 39 18 18 16 29 139 27 101 88 373 258Daman & Diu 4 0 114 80 79 33 12 15 10 19 276 125 338 108 832 380Lakshadweep 6 1 22 19 10 15 9 9 8 3 61 41 20 25 136 113Puducherry 48 61 339 250 200 77 121 94 132 108 421 480 427 334 1688 1404all-India 21073 19723 147591 130336 90673 78641 65290 55665 61952 52092 230920 209467 145100 139890 762600 685813

State Tables Appendix A
NSS KI (71/25.2): Key Indicators of Social Consumption in India: Education A-3
Table 2: Literacy rates (%) for persons (age 7 years and above) for each State/UT
State/UTliteracy rate (%)
rural urban rural + urbanmale female persons male female persons male female persons
(1) (2) (3) (4) (5) (6) (7) (8) (9) (10)Andhra Pradesh 69.6 50.5 60 87.3 75.1 81.1 75.4 58.2 66.8Arunachal Pradesh 75.8 70 72.9 95.1 89.4 92.2 78.9 73.2 76.3Assam 88.7 81.1 85.1 93.8 89.1 91.6 89.4 82.1 85.9Bihar 75.7 54.2 65.5 86.2 72.2 79.5 76.9 56.2 67Chhattisgarh 80.3 60 70.4 91.6 76.2 84.3 82.7 63.1 73.1Delhi 95.8 79.1 88.9 93.3 86.5 90.2 93.5 86.1 90.3Goa 96.9 88.2 92.2 94.3 86.1 90.4 95.1 87.1 91.1Gujarat 84.1 63.4 74 94 82.2 88.5 88.4 70.8 79.9Haryana 83.2 62 72.9 90.9 76.6 84.4 85.7 66.8 76.6Himachal Pradesh 92 76.2 84.1 98.7 87.2 93.2 92.8 77.4 85.1Jammu & Kashmir 83.1 62.5 73.3 85.4 70.6 78.3 83.5 64.2 74.4Jharkhand 77 55.2 66.4 89.5 77.5 83.7 79.6 59.9 70.3Karnataka 76.3 60.7 68.5 91.7 81.5 86.8 82.5 68.6 75.5Kerala 97.1 91.9 94.4 97.6 94.8 96.1 97.4 93.2 95.2Madhya Pradesh 77.4 54.3 66.2 92.4 78.6 86 81.4 60.7 71.3Maharashtra 87.2 70.3 78.8 93.9 86 90.2 90.2 77 83.8Manipur 92.1 81.4 87 96.5 87.5 92 93.5 83.5 88.6Meghalaya 93.2 92.5 92.9 99.6 94.6 96.9 94.3 93 93.6Mizoram 95.5 91.1 93.2 99.6 99.4 99.6 97.4 94.8 96.2Nagaland 97.5 93.3 95.4 98.4 95 96.7 97.6 93.7 95.7Odisha 81.3 65.8 73.6 91.2 77.2 84.1 83.2 67.8 75.5Punjab 79.9 66.8 73.6 91.2 85 88.3 84 73.4 79Rajasthan 77.7 49.4 63.7 88.2 68 78.6 80.7 54.1 67.6Sikkim 90 87.6 88.8 94.3 92.9 93.5 90.7 88.5 89.7Tamil Nadu 81.9 64.7 73 92.1 82.7 87.4 86.9 73.7 80.2Telangana 68.8 47 58 89.8 76.8 83.4 76.8 58.3 67.7Tripura 91 83.6 87.5 93.8 87 90.5 91.7 84.4 88.2Uttar Pradesh 77.8 56.5 67.6 84.4 72.5 78.8 79.2 60.1 70.1Uttarakhand 91.5 74.6 83.7 94.3 85.4 90.1 92.1 77.2 85.1West Bengal 78.7 68.3 73.6 91.4 85 88.4 82.7 73.3 78.3A & N Islands 82.9 78.9 81 93.8 89.1 91.5 87.2 82.9 85Chandigarh 91.5 66.1 80.2 96.6 93.7 95.4 96.4 92.6 94.7Dadra & Nagar Haveli 79.4 57.2 68.2 94.3 86.4 91.1 87 69.6 79Daman & Diu 89 73.2 81.1 86.1 95.9 89.4 86.4 90 87.8Lakshadweep 98.7 92.4 95.7 95.4 87.9 91.7 96.1 88.7 92.7Puducherry 93.4 77.8 85.9 94.7 84.2 89.4 94.4 82 88.4all-India 79.8 61.3 70.8 91.1 80.8 85.9 83.2 67.1 75.4
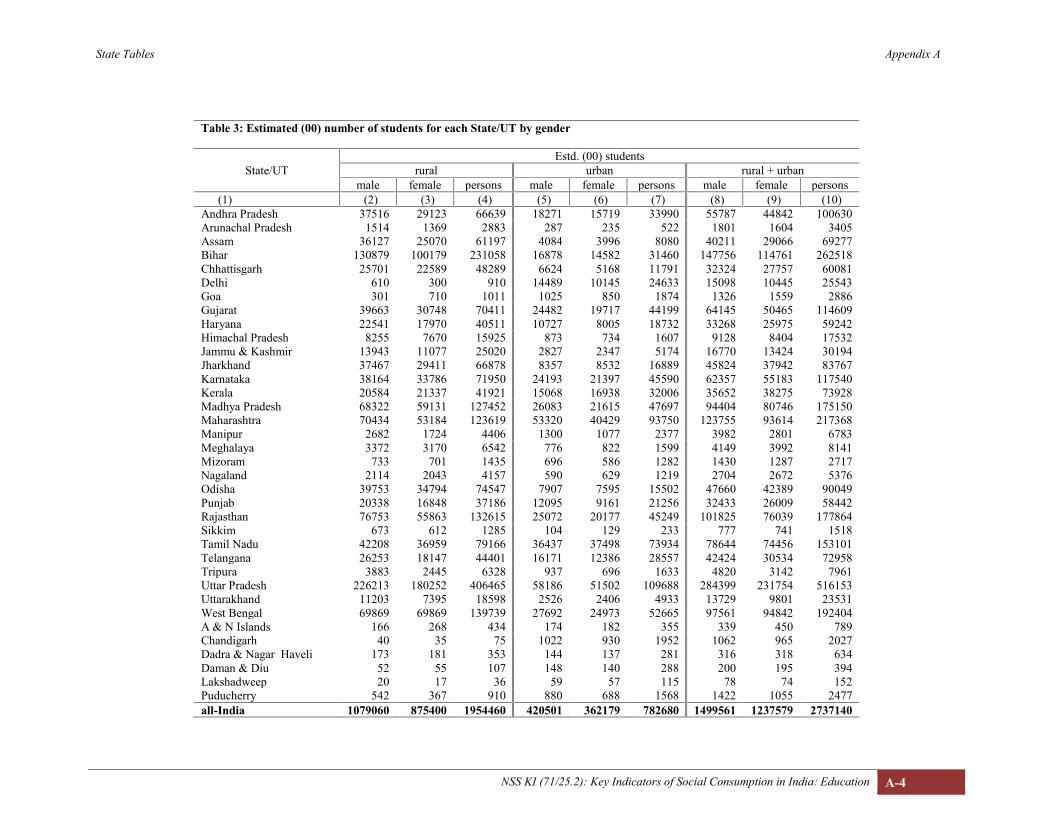
State Tables Appendix A
NSS KI (71/25.2): Key Indicators of Social Consumption in India: Education A-4
Table 3: Estimated (00) number of students for each State/UT by gender
State/UTEstd. (00) students
rural urban rural + urbanmale female persons male female persons male female persons
(1) (2) (3) (4) (5) (6) (7) (8) (9) (10)Andhra Pradesh 37516 29123 66639 18271 15719 33990 55787 44842 100630Arunachal Pradesh 1514 1369 2883 287 235 522 1801 1604 3405Assam 36127 25070 61197 4084 3996 8080 40211 29066 69277Bihar 130879 100179 231058 16878 14582 31460 147756 114761 262518Chhattisgarh 25701 22589 48289 6624 5168 11791 32324 27757 60081Delhi 610 300 910 14489 10145 24633 15098 10445 25543Goa 301 710 1011 1025 850 1874 1326 1559 2886Gujarat 39663 30748 70411 24482 19717 44199 64145 50465 114609Haryana 22541 17970 40511 10727 8005 18732 33268 25975 59242Himachal Pradesh 8255 7670 15925 873 734 1607 9128 8404 17532Jammu & Kashmir 13943 11077 25020 2827 2347 5174 16770 13424 30194Jharkhand 37467 29411 66878 8357 8532 16889 45824 37942 83767Karnataka 38164 33786 71950 24193 21397 45590 62357 55183 117540Kerala 20584 21337 41921 15068 16938 32006 35652 38275 73928Madhya Pradesh 68322 59131 127452 26083 21615 47697 94404 80746 175150Maharashtra 70434 53184 123619 53320 40429 93750 123755 93614 217368Manipur 2682 1724 4406 1300 1077 2377 3982 2801 6783Meghalaya 3372 3170 6542 776 822 1599 4149 3992 8141Mizoram 733 701 1435 696 586 1282 1430 1287 2717Nagaland 2114 2043 4157 590 629 1219 2704 2672 5376Odisha 39753 34794 74547 7907 7595 15502 47660 42389 90049Punjab 20338 16848 37186 12095 9161 21256 32433 26009 58442Rajasthan 76753 55863 132615 25072 20177 45249 101825 76039 177864Sikkim 673 612 1285 104 129 233 777 741 1518Tamil Nadu 42208 36959 79166 36437 37498 73934 78644 74456 153101Telangana 26253 18147 44401 16171 12386 28557 42424 30534 72958Tripura 3883 2445 6328 937 696 1633 4820 3142 7961Uttar Pradesh 226213 180252 406465 58186 51502 109688 284399 231754 516153Uttarakhand 11203 7395 18598 2526 2406 4933 13729 9801 23531West Bengal 69869 69869 139739 27692 24973 52665 97561 94842 192404A & N Islands 166 268 434 174 182 355 339 450 789Chandigarh 40 35 75 1022 930 1952 1062 965 2027Dadra & Nagar Haveli 173 181 353 144 137 281 316 318 634Daman & Diu 52 55 107 148 140 288 200 195 394Lakshadweep 20 17 36 59 57 115 78 74 152Puducherry 542 367 910 880 688 1568 1422 1055 2477all-India 1079060 875400 1954460 420501 362179 782680 1499561 1237579 2737140

State Tables Appendix A
NSS KI (71/25.2): Key Indicators of Social Consumption in India: Education A-5
Table 4 : Per 1000 distribution of households by distance from school having primary, upper primary and secondary level classes for each State/UTrural
State/UT
primary upper primary secondary
distance (d)
d <1km1km d<2kms
2kms d<5kms
d 5kmsall
(incl.n.r.)
d <1km1km d<2kms
2kms d<5kms
d 5kmsall
(incl.n.r.)
d <1km1km d<2kms
2kms d<5kms
d 5kmsall
(incl.n.r.)
(1) (2) (3) (4) (5) (6) (7) (8) (9) (10) (11) (12) (13) (14) (15) (16)Andhra Pradesh 979 20 2 0 1000 681 138 135 47 1000 513 144 192 151 1000Arunachal Pradesh 858 69 40 32 1000 608 141 97 155 1000 168 140 256 435 1000Assam 872 114 11 2 1000 496 303 181 20 1000 167 342 379 112 1000Bihar 955 38 5 3 1000 687 207 90 15 1000 262 299 299 139 1000Chhattisgarh 972 28 0 0 1000 666 126 176 31 1000 399 139 372 90 1000Delhi 1000 0 0 0 1000 771 229 0 0 1000 656 229 115 0 1000Goa 835 87 79 0 1000 473 318 209 0 1000 320 304 259 116 1000Gujarat 962 31 7 0 1000 810 88 86 16 1000 438 97 292 174 1000Haryana 978 6 16 0 1000 851 48 89 12 1000 758 70 126 46 1000Himachal Pradesh 707 256 27 10 1000 379 366 236 20 1000 258 329 315 98 1000Jammu & Kashmir 940 39 21 0 1000 782 95 81 42 1000 450 243 163 144 1000Jharkhand 959 33 8 0 1000 514 248 192 46 1000 210 276 316 198 1000Karnataka 960 30 9 1 1000 733 175 63 29 1000 452 214 234 100 1000Kerala 625 294 78 3 1000 398 366 202 33 1000 270 293 379 58 1000Madhya Pradesh 989 11 0 0 1000 716 155 115 14 1000 341 131 301 227 1000Maharashtra 962 33 5 0 1000 662 132 164 42 1000 440 150 259 150 1000Manipur 888 101 11 0 1000 684 224 77 16 1000 464 112 190 234 1000Meghalaya 935 63 2 0 1000 605 220 175 0 1000 191 236 340 232 1000Mizoram 959 20 0 8 1000 947 20 0 24 1000 694 87 31 176 1000Nagaland 991 9 0 0 1000 927 29 4 40 1000 508 286 79 128 1000Odisha 941 48 11 0 1000 697 186 95 22 1000 273 268 334 124 1000Punjab 984 15 1 0 1000 706 233 62 0 1000 464 308 225 3 1000Rajasthan 934 54 13 0 1000 773 124 90 13 1000 536 173 211 80 1000Sikkim 879 74 47 0 1000 689 156 139 16 1000 424 223 280 74 1000Tamil Nadu 944 40 16 0 1000 618 182 152 48 1000 368 228 258 145 1000Telangana 1000 0 0 0 1000 763 55 135 47 1000 619 110 173 98 1000Tripura 807 177 13 0 1000 676 258 62 0 1000 404 300 257 37 1000Uttar Pradesh 952 43 5 0 1000 761 159 71 9 1000 322 282 286 110 1000Uttarakhand 817 145 37 0 1000 546 249 194 12 1000 310 291 266 134 1000West Bengal 928 67 5 0 1000 389 398 190 23 1000 264 392 287 56 1000A & N Islands 502 395 90 13 1000 309 412 227 52 1000 262 235 370 134 1000Chandigarh 1000 0 0 0 1000 1000 0 0 0 1000 876 124 0 0 1000Dadra & N. Haveli 990 10 0 0 1000 627 363 10 0 1000 393 321 69 217 1000Daman & Diu 882 118 0 0 1000 882 118 0 0 1000 586 218 196 0 1000Lakshadweep 941 59 0 0 1000 784 209 7 0 1000 523 236 43 198 1000Puducherry 994 6 0 0 1000 727 34 239 0 1000 488 170 145 198 1000all-India 941 49 9 1 1000 665 190 121 24 1000 367 236 275 122 1000estd. hhd (00) 1576915 82479 15034 1081 1675546 1113474 318717 202959 40365 1675546 615622 394984 460512 204367 1675546
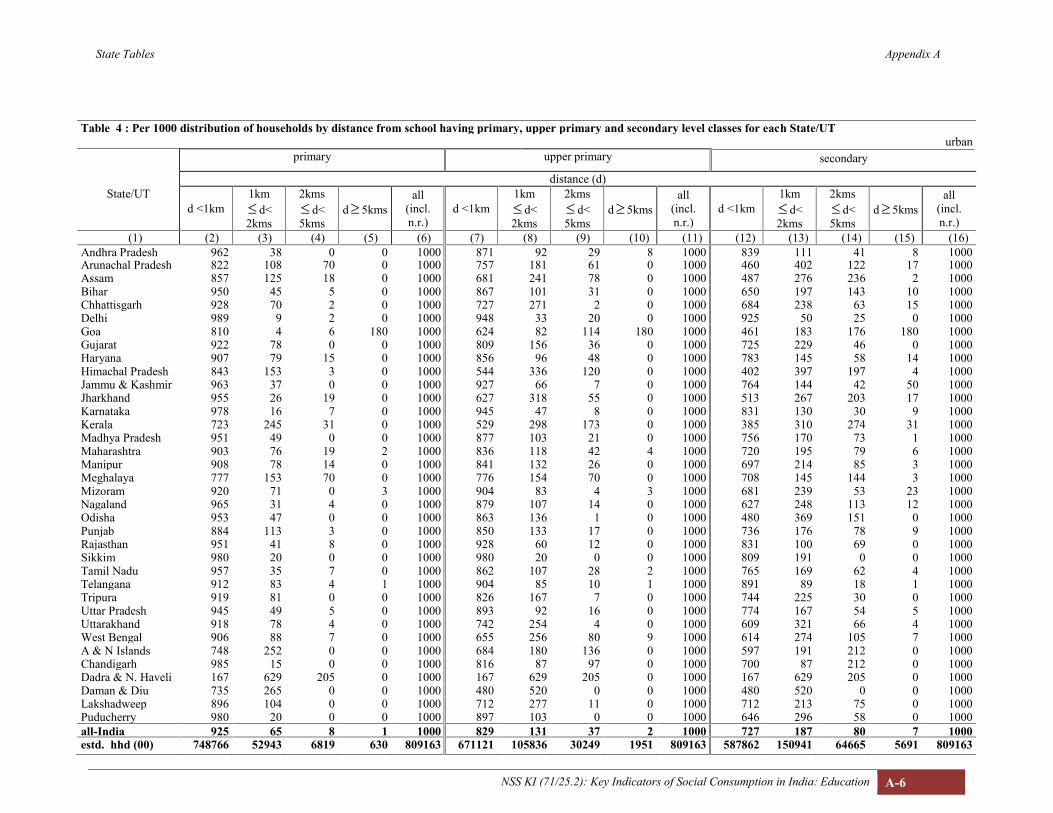
State Tables Appendix A
NSS KI (71/25.2): Key Indicators of Social Consumption in India: Education A-6
Table 4 : Per 1000 distribution of households by distance from school having primary, upper primary and secondary level classes for each State/UTurban
primary upper primary secondary
distance (d)State/UT
d <1km1km d<2kms
2kms d<5kms
d 5kmsall
(incl.n.r.)
d <1km1km d<2kms
2kms d<5kms
d 5kmsall
(incl.n.r.)
d <1km1km d<2kms
2kms d<5kms
d 5kmsall
(incl.n.r.)
(1) (2) (3) (4) (5) (6) (7) (8) (9) (10) (11) (12) (13) (14) (15) (16)Andhra Pradesh 962 38 0 0 1000 871 92 29 8 1000 839 111 41 8 1000Arunachal Pradesh 822 108 70 0 1000 757 181 61 0 1000 460 402 122 17 1000Assam 857 125 18 0 1000 681 241 78 0 1000 487 276 236 2 1000Bihar 950 45 5 0 1000 867 101 31 0 1000 650 197 143 10 1000Chhattisgarh 928 70 2 0 1000 727 271 2 0 1000 684 238 63 15 1000Delhi 989 9 2 0 1000 948 33 20 0 1000 925 50 25 0 1000Goa 810 4 6 180 1000 624 82 114 180 1000 461 183 176 180 1000Gujarat 922 78 0 0 1000 809 156 36 0 1000 725 229 46 0 1000Haryana 907 79 15 0 1000 856 96 48 0 1000 783 145 58 14 1000Himachal Pradesh 843 153 3 0 1000 544 336 120 0 1000 402 397 197 4 1000Jammu & Kashmir 963 37 0 0 1000 927 66 7 0 1000 764 144 42 50 1000Jharkhand 955 26 19 0 1000 627 318 55 0 1000 513 267 203 17 1000Karnataka 978 16 7 0 1000 945 47 8 0 1000 831 130 30 9 1000Kerala 723 245 31 0 1000 529 298 173 0 1000 385 310 274 31 1000Madhya Pradesh 951 49 0 0 1000 877 103 21 0 1000 756 170 73 1 1000Maharashtra 903 76 19 2 1000 836 118 42 4 1000 720 195 79 6 1000Manipur 908 78 14 0 1000 841 132 26 0 1000 697 214 85 3 1000Meghalaya 777 153 70 0 1000 776 154 70 0 1000 708 145 144 3 1000Mizoram 920 71 0 3 1000 904 83 4 3 1000 681 239 53 23 1000Nagaland 965 31 4 0 1000 879 107 14 0 1000 627 248 113 12 1000Odisha 953 47 0 0 1000 863 136 1 0 1000 480 369 151 0 1000Punjab 884 113 3 0 1000 850 133 17 0 1000 736 176 78 9 1000Rajasthan 951 41 8 0 1000 928 60 12 0 1000 831 100 69 0 1000Sikkim 980 20 0 0 1000 980 20 0 0 1000 809 191 0 0 1000Tamil Nadu 957 35 7 0 1000 862 107 28 2 1000 765 169 62 4 1000Telangana 912 83 4 1 1000 904 85 10 1 1000 891 89 18 1 1000Tripura 919 81 0 0 1000 826 167 7 0 1000 744 225 30 0 1000Uttar Pradesh 945 49 5 0 1000 893 92 16 0 1000 774 167 54 5 1000Uttarakhand 918 78 4 0 1000 742 254 4 0 1000 609 321 66 4 1000West Bengal 906 88 7 0 1000 655 256 80 9 1000 614 274 105 7 1000A & N Islands 748 252 0 0 1000 684 180 136 0 1000 597 191 212 0 1000Chandigarh 985 15 0 0 1000 816 87 97 0 1000 700 87 212 0 1000Dadra & N. Haveli 167 629 205 0 1000 167 629 205 0 1000 167 629 205 0 1000Daman & Diu 735 265 0 0 1000 480 520 0 0 1000 480 520 0 0 1000Lakshadweep 896 104 0 0 1000 712 277 11 0 1000 712 213 75 0 1000Puducherry 980 20 0 0 1000 897 103 0 0 1000 646 296 58 0 1000all-India 925 65 8 1 1000 829 131 37 2 1000 727 187 80 7 1000estd. hhd (00) 748766 52943 6819 630 809163 671121 105836 30249 1951 809163 587862 150941 64665 5691 809163
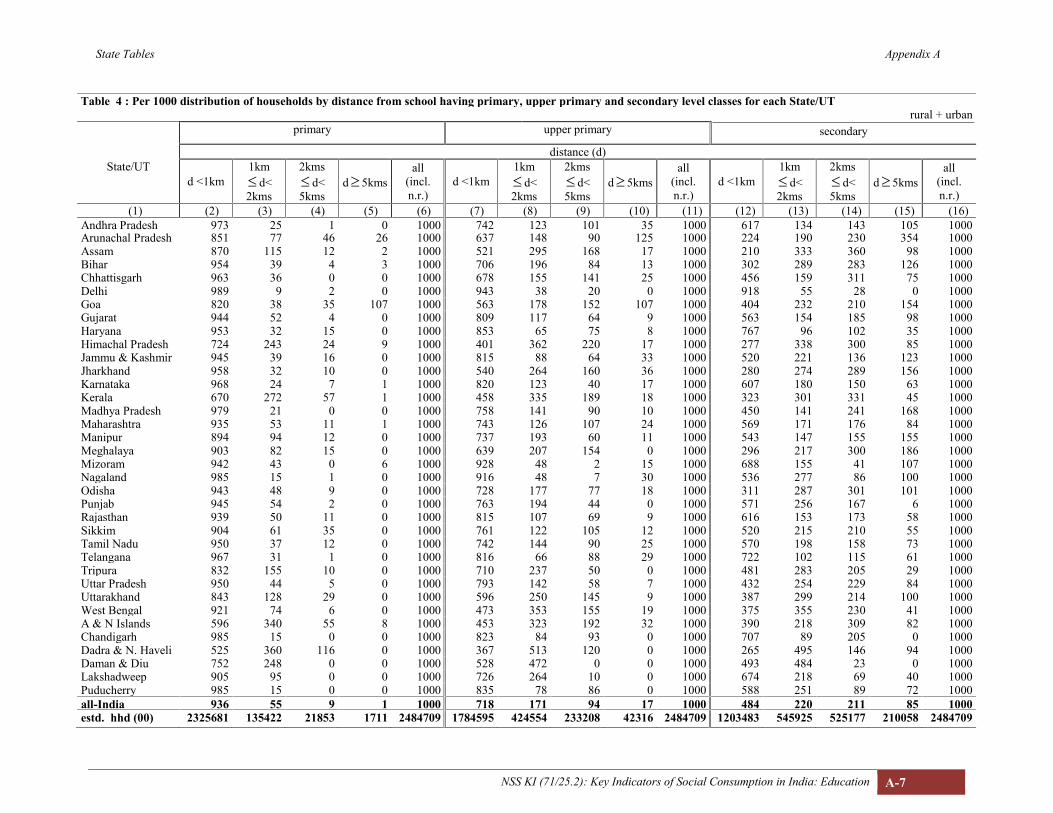
State Tables Appendix A
NSS KI (71/25.2): Key Indicators of Social Consumption in India: Education A-7
Table 4 : Per 1000 distribution of households by distance from school having primary, upper primary and secondary level classes for each State/UTrural + urban
primary upper primary secondary
distance (d)State/UT
d <1km1km d<2kms
2kms d<5kms
d 5kmsall
(incl.n.r.)
d <1km1km d<2kms
2kms d<5kms
d 5kmsall
(incl.n.r.)
d <1km1km d<2kms
2kms d<5kms
d 5kmsall
(incl.n.r.)
(1) (2) (3) (4) (5) (6) (7) (8) (9) (10) (11) (12) (13) (14) (15) (16)Andhra Pradesh 973 25 1 0 1000 742 123 101 35 1000 617 134 143 105 1000Arunachal Pradesh 851 77 46 26 1000 637 148 90 125 1000 224 190 230 354 1000Assam 870 115 12 2 1000 521 295 168 17 1000 210 333 360 98 1000Bihar 954 39 4 3 1000 706 196 84 13 1000 302 289 283 126 1000Chhattisgarh 963 36 0 0 1000 678 155 141 25 1000 456 159 311 75 1000Delhi 989 9 2 0 1000 943 38 20 0 1000 918 55 28 0 1000Goa 820 38 35 107 1000 563 178 152 107 1000 404 232 210 154 1000Gujarat 944 52 4 0 1000 809 117 64 9 1000 563 154 185 98 1000Haryana 953 32 15 0 1000 853 65 75 8 1000 767 96 102 35 1000Himachal Pradesh 724 243 24 9 1000 401 362 220 17 1000 277 338 300 85 1000Jammu & Kashmir 945 39 16 0 1000 815 88 64 33 1000 520 221 136 123 1000Jharkhand 958 32 10 0 1000 540 264 160 36 1000 280 274 289 156 1000Karnataka 968 24 7 1 1000 820 123 40 17 1000 607 180 150 63 1000Kerala 670 272 57 1 1000 458 335 189 18 1000 323 301 331 45 1000Madhya Pradesh 979 21 0 0 1000 758 141 90 10 1000 450 141 241 168 1000Maharashtra 935 53 11 1 1000 743 126 107 24 1000 569 171 176 84 1000Manipur 894 94 12 0 1000 737 193 60 11 1000 543 147 155 155 1000Meghalaya 903 82 15 0 1000 639 207 154 0 1000 296 217 300 186 1000Mizoram 942 43 0 6 1000 928 48 2 15 1000 688 155 41 107 1000Nagaland 985 15 1 0 1000 916 48 7 30 1000 536 277 86 100 1000Odisha 943 48 9 0 1000 728 177 77 18 1000 311 287 301 101 1000Punjab 945 54 2 0 1000 763 194 44 0 1000 571 256 167 6 1000Rajasthan 939 50 11 0 1000 815 107 69 9 1000 616 153 173 58 1000Sikkim 904 61 35 0 1000 761 122 105 12 1000 520 215 210 55 1000Tamil Nadu 950 37 12 0 1000 742 144 90 25 1000 570 198 158 73 1000Telangana 967 31 1 0 1000 816 66 88 29 1000 722 102 115 61 1000Tripura 832 155 10 0 1000 710 237 50 0 1000 481 283 205 29 1000Uttar Pradesh 950 44 5 0 1000 793 142 58 7 1000 432 254 229 84 1000Uttarakhand 843 128 29 0 1000 596 250 145 9 1000 387 299 214 100 1000West Bengal 921 74 6 0 1000 473 353 155 19 1000 375 355 230 41 1000A & N Islands 596 340 55 8 1000 453 323 192 32 1000 390 218 309 82 1000Chandigarh 985 15 0 0 1000 823 84 93 0 1000 707 89 205 0 1000Dadra & N. Haveli 525 360 116 0 1000 367 513 120 0 1000 265 495 146 94 1000Daman & Diu 752 248 0 0 1000 528 472 0 0 1000 493 484 23 0 1000Lakshadweep 905 95 0 0 1000 726 264 10 0 1000 674 218 69 40 1000Puducherry 985 15 0 0 1000 835 78 86 0 1000 588 251 89 72 1000all-India 936 55 9 1 1000 718 171 94 17 1000 484 220 211 85 1000estd. hhd (00) 2325681 135422 21853 1711 2484709 1784595 424554 233208 42316 2484709 1203483 545925 525177 210058 2484709
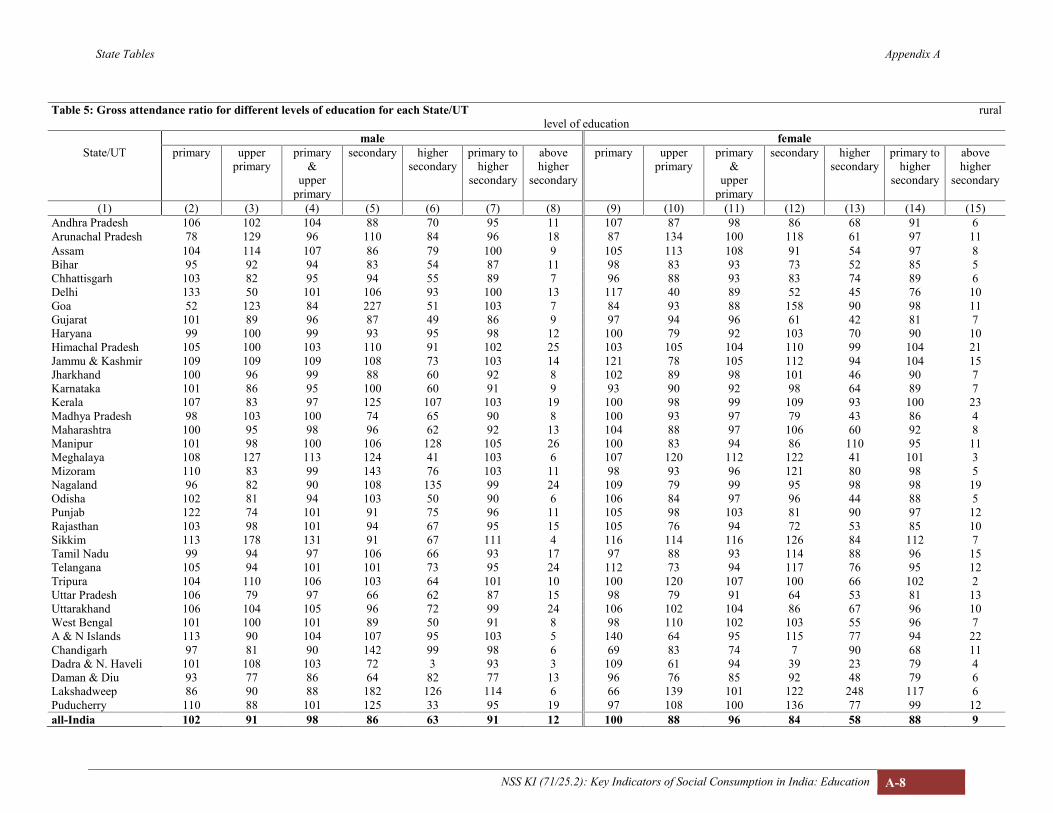
State Tables Appendix A
NSS KI (71/25.2): Key Indicators of Social Consumption in India: Education A-8
Table 5: Gross attendance ratio for different levels of education for each State/UT rurallevel of education
male femaleState/UT primary upper
primaryprimary
&upper
primary
secondary highersecondary
primary tohigher
secondary
abovehigher
secondary
primary upperprimary
primary&
upperprimary
secondary highersecondary
primary tohigher
secondary
abovehigher
secondary
(1) (2) (3) (4) (5) (6) (7) (8) (9) (10) (11) (12) (13) (14) (15)Andhra Pradesh 106 102 104 88 70 95 11 107 87 98 86 68 91 6Arunachal Pradesh 78 129 96 110 84 96 18 87 134 100 118 61 97 11Assam 104 114 107 86 79 100 9 105 113 108 91 54 97 8Bihar 95 92 94 83 54 87 11 98 83 93 73 52 85 5Chhattisgarh 103 82 95 94 55 89 7 96 88 93 83 74 89 6Delhi 133 50 101 106 93 100 13 117 40 89 52 45 76 10Goa 52 123 84 227 51 103 7 84 93 88 158 90 98 11Gujarat 101 89 96 87 49 86 9 97 94 96 61 42 81 7Haryana 99 100 99 93 95 98 12 100 79 92 103 70 90 10Himachal Pradesh 105 100 103 110 91 102 25 103 105 104 110 99 104 21Jammu & Kashmir 109 109 109 108 73 103 14 121 78 105 112 94 104 15Jharkhand 100 96 99 88 60 92 8 102 89 98 101 46 90 7Karnataka 101 86 95 100 60 91 9 93 90 92 98 64 89 7Kerala 107 83 97 125 107 103 19 100 98 99 109 93 100 23Madhya Pradesh 98 103 100 74 65 90 8 100 93 97 79 43 86 4Maharashtra 100 95 98 96 62 92 13 104 88 97 106 60 92 8Manipur 101 98 100 106 128 105 26 100 83 94 86 110 95 11Meghalaya 108 127 113 124 41 103 6 107 120 112 122 41 101 3Mizoram 110 83 99 143 76 103 11 98 93 96 121 80 98 5Nagaland 96 82 90 108 135 99 24 109 79 99 95 98 98 19Odisha 102 81 94 103 50 90 6 106 84 97 96 44 88 5Punjab 122 74 101 91 75 96 11 105 98 103 81 90 97 12Rajasthan 103 98 101 94 67 95 15 105 76 94 72 53 85 10Sikkim 113 178 131 91 67 111 4 116 114 116 126 84 112 7Tamil Nadu 99 94 97 106 66 93 17 97 88 93 114 88 96 15Telangana 105 94 101 101 73 95 24 112 73 94 117 76 95 12Tripura 104 110 106 103 64 101 10 100 120 107 100 66 102 2Uttar Pradesh 106 79 97 66 62 87 15 98 79 91 64 53 81 13Uttarakhand 106 104 105 96 72 99 24 106 102 104 86 67 96 10West Bengal 101 100 101 89 50 91 8 98 110 102 103 55 96 7A & N Islands 113 90 104 107 95 103 5 140 64 95 115 77 94 22Chandigarh 97 81 90 142 99 98 6 69 83 74 7 90 68 11Dadra & N. Haveli 101 108 103 72 3 93 3 109 61 94 39 23 79 4Daman & Diu 93 77 86 64 82 77 13 96 76 85 92 48 79 6Lakshadweep 86 90 88 182 126 114 6 66 139 101 122 248 117 6Puducherry 110 88 101 125 33 95 19 97 108 100 136 77 99 12all-India 102 91 98 86 63 91 12 100 88 96 84 58 88 9

State Tables Appendix A
NSS KI (71/25.2): Key Indicators of Social Consumption in India: Education A-9
Table 5: Gross attendance ratio for different levels of education for each State/UT urbanlevel of education
male femaleState/UT primary upper
primaryprimary
&upper
primary
secondary highersecondary
primary tohigher
secondary
abovehigher
secondary
primary upperprimary
primary&
upperprimary
secondary highersecondary
primary tohigher
secondary
abovehigher
secondary
(1) (2) (3) (4) (5) (6) (7) (8) (9) (10) (11) (12) (13) (14) (15)Andhra Pradesh 105 89 98 84 72 91 25 104 84 96 98 76 93 19Arunachal Pradesh 87 133 99 118 57 96 22 69 106 82 116 73 87 17Assam 102 136 114 88 168 113 21 87 129 101 134 86 104 21Bihar 103 103 103 71 74 92 22 106 94 102 79 66 93 20Chhattisgarh 110 99 106 77 50 89 19 107 91 102 91 61 95 14Delhi 95 98 96 65 103 92 19 93 100 95 101 84 94 20Goa 68 114 89 132 85 98 15 77 59 67 212 79 95 8Gujarat 100 93 97 101 61 92 14 104 98 102 80 71 93 13Haryana 104 88 99 60 91 92 23 94 88 92 95 63 87 16Himachal Pradesh 134 57 101 135 77 102 20 96 88 93 99 184 106 19Jammu & Kashmir 118 83 106 125 72 102 24 117 82 104 86 95 100 26Jharkhand 111 97 106 99 41 92 13 134 66 104 99 41 92 16Karnataka 105 87 98 97 63 92 13 101 90 97 100 76 95 12Kerala 106 89 99 113 101 102 19 90 102 94 100 98 96 24Madhya Pradesh 113 92 105 99 75 98 19 113 89 103 87 82 96 17Maharashtra 94 98 96 93 75 92 18 101 87 96 112 79 96 15Manipur 101 87 97 109 118 101 34 98 103 100 103 142 105 26Meghalaya 107 96 102 118 133 109 22 104 83 96 119 74 97 30Mizoram 102 109 104 151 139 115 19 100 116 106 105 107 106 15Nagaland 100 94 98 104 140 108 21 112 100 107 143 98 111 18Odisha 97 95 97 105 53 89 18 113 81 98 95 54 87 17Punjab 98 109 102 100 121 105 13 96 88 94 102 97 96 17Rajasthan 95 111 100 81 78 92 22 100 85 94 83 78 90 18Sikkim 101 105 102 194 92 110 11 114 115 114 101 192 121 12Tamil Nadu 109 91 101 94 63 94 20 102 82 94 123 82 96 21Telangana 111 105 109 73 101 100 23 119 81 104 102 77 99 15Tripura 104 119 109 108 84 104 15 112 108 110 124 57 104 9Uttar Pradesh 103 70 91 79 64 84 17 95 79 89 69 60 81 24Uttarakhand 102 104 103 145 46 98 29 111 104 108 61 97 97 26West Bengal 100 103 102 106 57 94 19 104 114 108 95 77 100 16A & N Islands 85 115 102 94 109 102 8 90 93 92 77 342 106 15Chandigarh 88 107 96 105 112 101 17 94 83 90 135 102 102 15Dadra & N. Haveli 67 115 83 147 60 90 10 89 55 75 199 48 85 12Daman & Diu 88 26 63 49 62 62 0 86 42 73 79 150 84 4Lakshadweep 90 122 100 90 177 111 5 100 86 94 112 147 100 14Puducherry 111 72 97 107 59 92 16 103 136 111 58 79 95 21all-India 102 93 99 90 73 93 18 102 88 97 94 75 93 18
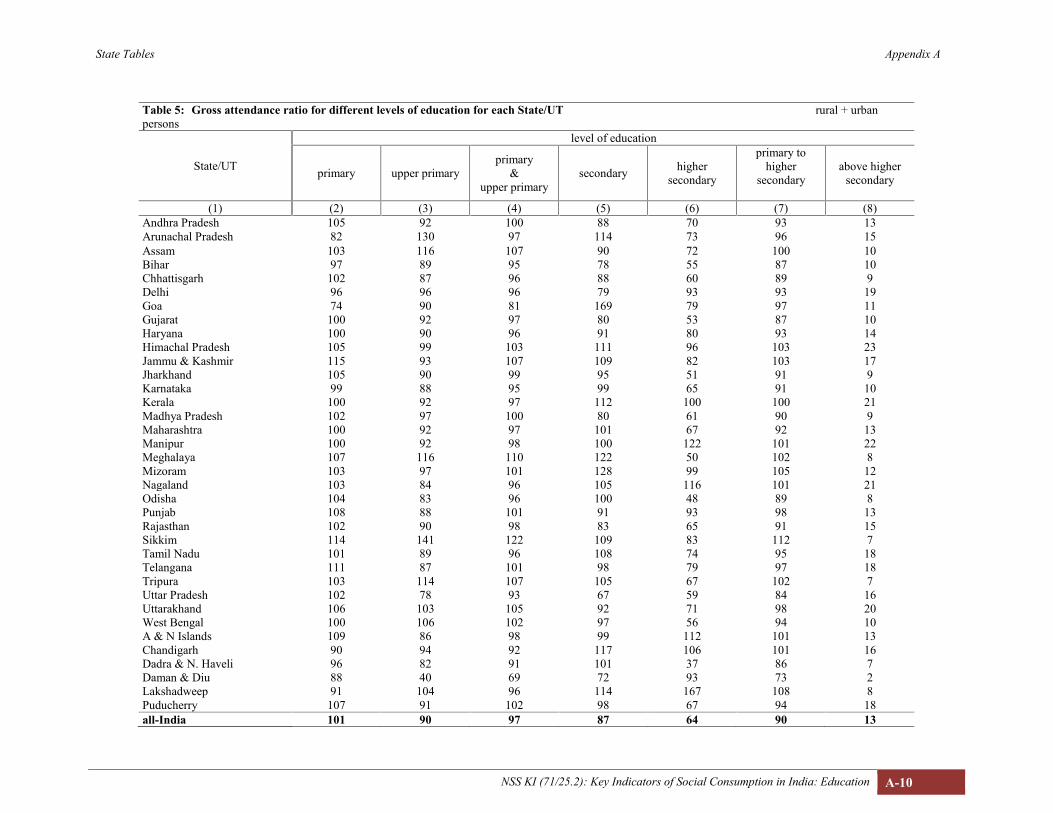
State Tables Appendix A
NSS KI (71/25.2): Key Indicators of Social Consumption in India: Education A-10
Table 5: Gross attendance ratio for different levels of education for each State/UT rural + urbanpersons
State/UT
level of education
primary upper primaryprimary
&upper primary
secondary highersecondary
primary tohigher
secondaryabove higher
secondary
(1) (2) (3) (4) (5) (6) (7) (8)Andhra Pradesh 105 92 100 88 70 93 13Arunachal Pradesh 82 130 97 114 73 96 15Assam 103 116 107 90 72 100 10Bihar 97 89 95 78 55 87 10Chhattisgarh 102 87 96 88 60 89 9Delhi 96 96 96 79 93 93 19Goa 74 90 81 169 79 97 11Gujarat 100 92 97 80 53 87 10Haryana 100 90 96 91 80 93 14Himachal Pradesh 105 99 103 111 96 103 23Jammu & Kashmir 115 93 107 109 82 103 17Jharkhand 105 90 99 95 51 91 9Karnataka 99 88 95 99 65 91 10Kerala 100 92 97 112 100 100 21Madhya Pradesh 102 97 100 80 61 90 9Maharashtra 100 92 97 101 67 92 13Manipur 100 92 98 100 122 101 22Meghalaya 107 116 110 122 50 102 8Mizoram 103 97 101 128 99 105 12Nagaland 103 84 96 105 116 101 21Odisha 104 83 96 100 48 89 8Punjab 108 88 101 91 93 98 13Rajasthan 102 90 98 83 65 91 15Sikkim 114 141 122 109 83 112 7Tamil Nadu 101 89 96 108 74 95 18Telangana 111 87 101 98 79 97 18Tripura 103 114 107 105 67 102 7Uttar Pradesh 102 78 93 67 59 84 16Uttarakhand 106 103 105 92 71 98 20West Bengal 100 106 102 97 56 94 10A & N Islands 109 86 98 99 112 101 13Chandigarh 90 94 92 117 106 101 16Dadra & N. Haveli 96 82 91 101 37 86 7Daman & Diu 88 40 69 72 93 73 2Lakshadweep 91 104 96 114 167 108 8Puducherry 107 91 102 98 67 94 18all-India 101 90 97 87 64 90 13

State Tables Appendix A
NSS KI (71/25.2): Key Indicators of Social Consumption in India: Education A-11
Table 6: Net attendance ratio for different levels of education for each State/UT rural
level of educationmale female
State/UT primary upperprimary
primary&
upperprimary
secondary highersecondary
above highersecondary
primary upperprimary
primary&
upperprimary
secondary highersecondary
above highersecondary
(1) (2) (3) (4) (5) (6) (7) (8) (9) (10) (11) (12) (13)Andhra Pradesh 87 71 91 55 47 11 91 71 91 44 49 5Arunachal Pradesh 64 64 82 43 29 17 76 77 87 61 31 9Assam 87 70 93 50 35 8 90 74 94 61 32 7Bihar 77 62 85 47 26 10 77 51 81 38 22 4Chhattisgarh 86 52 84 54 28 7 81 64 84 59 44 6Delhi 78 37 83 59 54 9 85 40 89 47 45 10Goa 52 65 84 100 35 7 76 65 83 79 66 10Gujarat 88 67 89 59 39 8 89 74 90 40 26 6Haryana 81 73 88 59 49 12 86 61 86 63 53 10Himachal Pradesh 87 83 93 71 63 25 91 79 92 62 69 19Jammu & Kashmir 90 69 93 39 36 14 93 53 92 50 36 15Jharkhand 81 62 85 43 31 8 79 57 85 43 21 7Karnataka 93 72 91 72 44 9 89 77 88 75 51 7Kerala 91 70 91 84 75 19 91 81 94 83 72 22Madhya Pradesh 84 71 88 42 35 8 82 67 84 43 24 4Maharashtra 89 73 91 61 39 12 89 69 90 57 41 8Manipur 88 58 94 58 56 26 85 58 88 59 49 10Meghalaya 87 55 91 40 8 6 84 58 89 32 7 3Mizoram 87 61 93 65 12 11 79 64 88 60 12 5Nagaland 83 74 85 75 77 24 91 56 93 79 74 19Odisha 89 64 88 69 31 6 87 65 85 66 32 5Punjab 89 54 90 51 43 11 85 62 89 51 53 12Rajasthan 85 63 88 50 30 15 82 48 83 38 19 10Sikkim 97 77 95 35 24 4 95 57 99 44 21 7Tamil Nadu 86 74 88 69 50 15 87 72 87 70 59 13Telangana 92 73 93 78 45 22 95 69 90 70 61 12Tripura 94 73 96 62 30 10 93 79 96 62 21 2Uttar Pradesh 79 49 84 34 33 14 75 46 79 35 25 12Uttarakhand 95 84 97 61 51 24 98 91 97 66 42 10West Bengal 85 71 90 49 21 8 86 74 90 55 27 7A & N Islands 90 56 85 51 78 5 100 58 85 60 34 22Chandigarh 66 31 77 54 0 6 64 43 64 4 37 11Dadra & N. Haveli 99 91 98 70 2 2 96 58 93 36 23 4Daman & Diu 93 69 86 64 82 10 96 75 85 63 25 6Lakshadweep 85 74 87 96 26 6 66 90 95 72 95 6Puducherry 100 87 95 10 24 14 96 96 100 97 75 11all-India 84 64 88 51 36 12 82 61 85 49 33 8
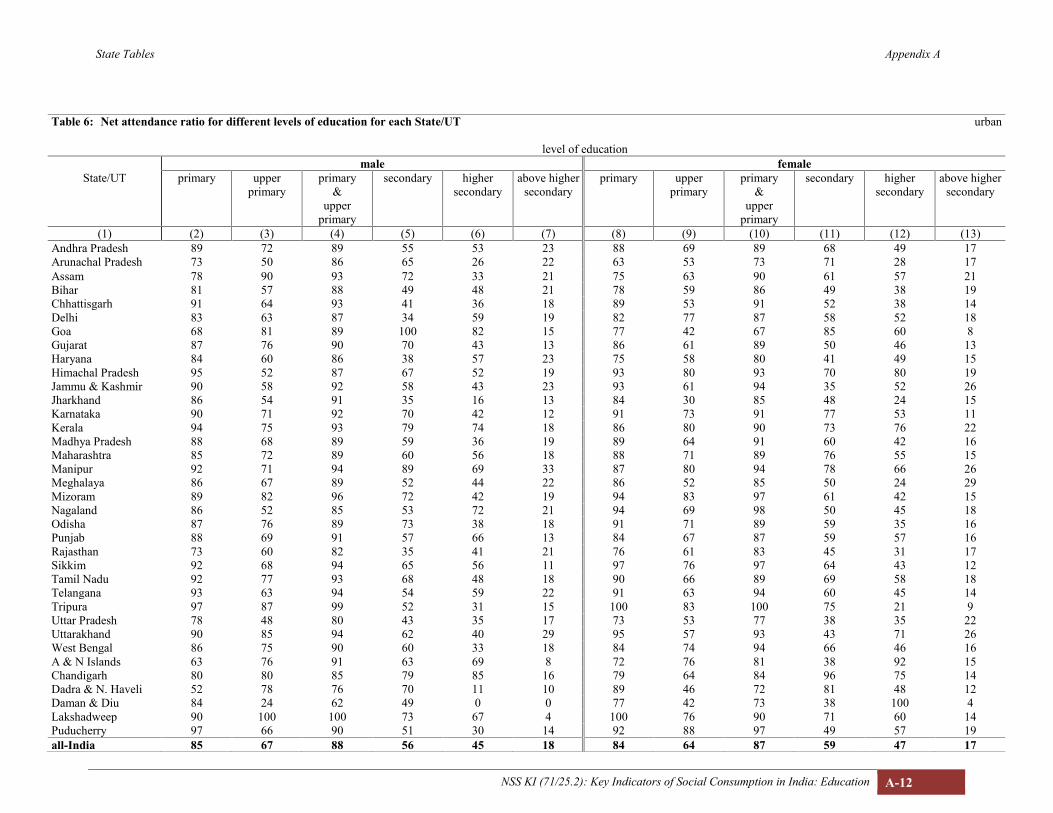
State Tables Appendix A
NSS KI (71/25.2): Key Indicators of Social Consumption in India: Education A-12
Table 6: Net attendance ratio for different levels of education for each State/UT urban
level of educationmale female
State/UT primary upperprimary
primary&
upperprimary
secondary highersecondary
above highersecondary
primary upperprimary
primary&
upperprimary
secondary highersecondary
above highersecondary
(1) (2) (3) (4) (5) (6) (7) (8) (9) (10) (11) (12) (13)Andhra Pradesh 89 72 89 55 53 23 88 69 89 68 49 17Arunachal Pradesh 73 50 86 65 26 22 63 53 73 71 28 17Assam 78 90 93 72 33 21 75 63 90 61 57 21Bihar 81 57 88 49 48 21 78 59 86 49 38 19Chhattisgarh 91 64 93 41 36 18 89 53 91 52 38 14Delhi 83 63 87 34 59 19 82 77 87 58 52 18Goa 68 81 89 100 82 15 77 42 67 85 60 8Gujarat 87 76 90 70 43 13 86 61 89 50 46 13Haryana 84 60 86 38 57 23 75 58 80 41 49 15Himachal Pradesh 95 52 87 67 52 19 93 80 93 70 80 19Jammu & Kashmir 90 58 92 58 43 23 93 61 94 35 52 26Jharkhand 86 54 91 35 16 13 84 30 85 48 24 15Karnataka 90 71 92 70 42 12 91 73 91 77 53 11Kerala 94 75 93 79 74 18 86 80 90 73 76 22Madhya Pradesh 88 68 89 59 36 19 89 64 91 60 42 16Maharashtra 85 72 89 60 56 18 88 71 89 76 55 15Manipur 92 71 94 89 69 33 87 80 94 78 66 26Meghalaya 86 67 89 52 44 22 86 52 85 50 24 29Mizoram 89 82 96 72 42 19 94 83 97 61 42 15Nagaland 86 52 85 53 72 21 94 69 98 50 45 18Odisha 87 76 89 73 38 18 91 71 89 59 35 16Punjab 88 69 91 57 66 13 84 67 87 59 57 16Rajasthan 73 60 82 35 41 21 76 61 83 45 31 17Sikkim 92 68 94 65 56 11 97 76 97 64 43 12Tamil Nadu 92 77 93 68 48 18 90 66 89 69 58 18Telangana 93 63 94 54 59 22 91 63 94 60 45 14Tripura 97 87 99 52 31 15 100 83 100 75 21 9Uttar Pradesh 78 48 80 43 35 17 73 53 77 38 35 22Uttarakhand 90 85 94 62 40 29 95 57 93 43 71 26West Bengal 86 75 90 60 33 18 84 74 94 66 46 16A & N Islands 63 76 91 63 69 8 72 76 81 38 92 15Chandigarh 80 80 85 79 85 16 79 64 84 96 75 14Dadra & N. Haveli 52 78 76 70 11 10 89 46 72 81 48 12Daman & Diu 84 24 62 49 0 0 77 42 73 38 100 4Lakshadweep 90 100 100 73 67 4 100 76 90 71 60 14Puducherry 97 66 90 51 30 14 92 88 97 49 57 19all-India 85 67 88 56 45 18 84 64 87 59 47 17
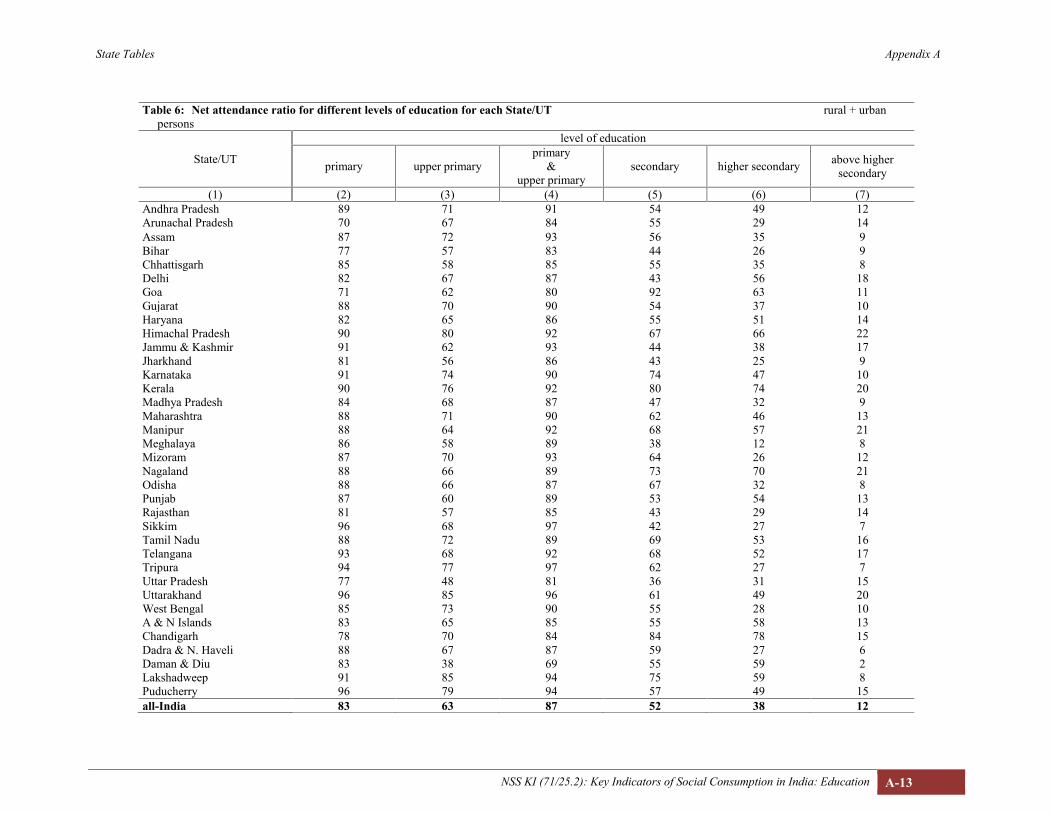
State Tables Appendix A
NSS KI (71/25.2): Key Indicators of Social Consumption in India: Education A-13
Table 6: Net attendance ratio for different levels of education for each State/UT rural + urban rural + urbanpersons
State/UT
level of education
primary upper primaryprimary
&upper primary
secondary higher secondary above highersecondary
(1) (2) (3) (4) (5) (6) (7)Andhra Pradesh 89 71 91 54 49 12Arunachal Pradesh 70 67 84 55 29 14Assam 87 72 93 56 35 9Bihar 77 57 83 44 26 9Chhattisgarh 85 58 85 55 35 8Delhi 82 67 87 43 56 18Goa 71 62 80 92 63 11Gujarat 88 70 90 54 37 10Haryana 82 65 86 55 51 14Himachal Pradesh 90 80 92 67 66 22Jammu & Kashmir 91 62 93 44 38 17Jharkhand 81 56 86 43 25 9Karnataka 91 74 90 74 47 10Kerala 90 76 92 80 74 20Madhya Pradesh 84 68 87 47 32 9Maharashtra 88 71 90 62 46 13Manipur 88 64 92 68 57 21Meghalaya 86 58 89 38 12 8Mizoram 87 70 93 64 26 12Nagaland 88 66 89 73 70 21Odisha 88 66 87 67 32 8Punjab 87 60 89 53 54 13Rajasthan 81 57 85 43 29 14Sikkim 96 68 97 42 27 7Tamil Nadu 88 72 89 69 53 16Telangana 93 68 92 68 52 17Tripura 94 77 97 62 27 7Uttar Pradesh 77 48 81 36 31 15Uttarakhand 96 85 96 61 49 20West Bengal 85 73 90 55 28 10A & N Islands 83 65 85 55 58 13Chandigarh 78 70 84 84 78 15Dadra & N. Haveli 88 67 87 59 27 6Daman & Diu 83 38 69 55 59 2Lakshadweep 91 85 94 75 59 8Puducherry 96 79 94 57 49 15all-India 83 63 87 52 38 12

State Tables Appendix A
NSS KI (71/25.2): Key Indicators of Social Consumption in India: Education A-14
Table 7: Age-specific attendance ratio by age-group for each State/UT rural
age-groupmale female
State/UT 6-13 14-17 18-23 24-29 6-13 14-17 18-23 24-29(1) (2) (3) (4) (5) (6) (7) (8) (9)
Andhra Pradesh 95 81 29 2 97 68 14 1Arunachal Pradesh 86 89 64 11 88 94 45 7Assam 96 76 33 2 97 78 20 1Bihar 86 72 32 5 84 69 20 2Chhattisgarh 87 76 29 2 85 83 24 1Delhi 84 100 35 5 91 46 21 0Goa 100 100 31 0 98 95 31 0Gujarat 92 75 19 2 92 52 15 2Haryana 90 87 38 5 89 79 26 2Himachal Pradesh 95 92 63 6 99 96 50 8Jammu & Kashmir 95 89 41 9 94 85 48 8Jharkhand 88 79 29 2 87 72 24 3Karnataka 96 75 28 2 92 77 16 0Kerala 98 96 52 5 99 95 48 3Madhya Pradesh 89 73 25 2 86 67 15 1Maharashtra 94 77 33 5 94 77 23 1Manipur 96 90 62 13 89 81 39 6Meghalaya 92 83 39 3 89 77 33 6Mizoram 95 81 41 5 90 85 32 3Nagaland 91 97 65 4 95 92 48 3Odisha 95 68 19 1 92 63 13 1Punjab 94 79 31 4 94 82 32 1Rajasthan 91 81 39 5 86 59 25 2Sikkim 96 95 42 1 99 94 53 1Tamil Nadu 97 83 34 1 98 89 33 1Telangana 96 85 44 4 98 78 26 2Tripura 98 90 38 3 99 93 11 1Uttar Pradesh 85 70 35 6 80 68 29 3Uttarakhand 99 83 46 5 98 73 31 0West Bengal 92 62 26 3 93 80 24 1A & N Islands 97 98 15 1 96 78 39 24Chandigarh 83 100 28 0 64 55 55 3Dadra & N. Haveli 98 76 9 1 94 34 7 0Daman & Diu 86 75 19 2 99 59 12 0Lakshadweep 100 75 39 17 100 99 41 0Puducherry 100 100 60 0 100 99 40 4all-India 90 75 32 4 88 72 24 2
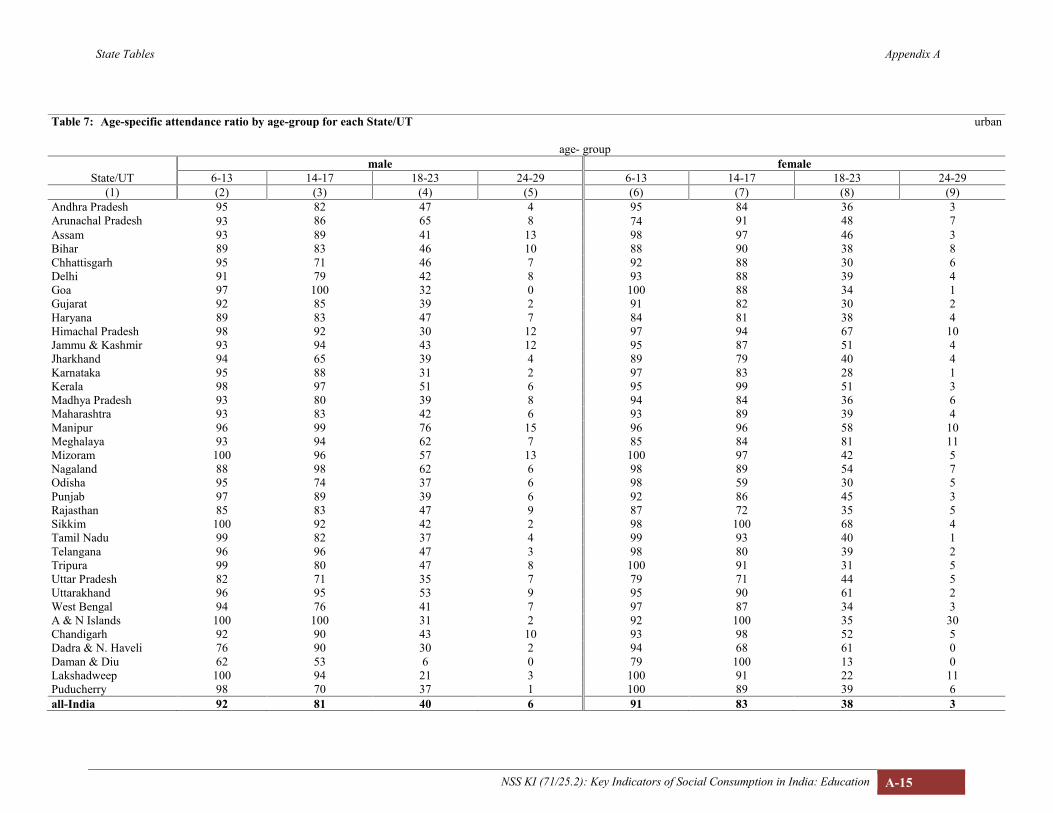
State Tables Appendix A
NSS KI (71/25.2): Key Indicators of Social Consumption in India: Education A-15
Table 7: Age-specific attendance ratio by age-group for each State/UT urban
age- groupmale female
State/UT 6-13 14-17 18-23 24-29 6-13 14-17 18-23 24-29(1) (2) (3) (4) (5) (6) (7) (8) (9)
Andhra Pradesh 95 82 47 4 95 84 36 3Arunachal Pradesh 93 86 65 8 74 91 48 7Assam 93 89 41 13 98 97 46 3Bihar 89 83 46 10 88 90 38 8Chhattisgarh 95 71 46 7 92 88 30 6Delhi 91 79 42 8 93 88 39 4Goa 97 100 32 0 100 88 34 1Gujarat 92 85 39 2 91 82 30 2Haryana 89 83 47 7 84 81 38 4Himachal Pradesh 98 92 30 12 97 94 67 10Jammu & Kashmir 93 94 43 12 95 87 51 4Jharkhand 94 65 39 4 89 79 40 4Karnataka 95 88 31 2 97 83 28 1Kerala 98 97 51 6 95 99 51 3Madhya Pradesh 93 80 39 8 94 84 36 6Maharashtra 93 83 42 6 93 89 39 4Manipur 96 99 76 15 96 96 58 10Meghalaya 93 94 62 7 85 84 81 11Mizoram 100 96 57 13 100 97 42 5Nagaland 88 98 62 6 98 89 54 7Odisha 95 74 37 6 98 59 30 5Punjab 97 89 39 6 92 86 45 3Rajasthan 85 83 47 9 87 72 35 5Sikkim 100 92 42 2 98 100 68 4Tamil Nadu 99 82 37 4 99 93 40 1Telangana 96 96 47 3 98 80 39 2Tripura 99 80 47 8 100 91 31 5Uttar Pradesh 82 71 35 7 79 71 44 5Uttarakhand 96 95 53 9 95 90 61 2West Bengal 94 76 41 7 97 87 34 3A & N Islands 100 100 31 2 92 100 35 30Chandigarh 92 90 43 10 93 98 52 5Dadra & N. Haveli 76 90 30 2 94 68 61 0Daman & Diu 62 53 6 0 79 100 13 0Lakshadweep 100 94 21 3 100 91 22 11Puducherry 98 70 37 1 100 89 39 6all-India 92 81 40 6 91 83 38 3
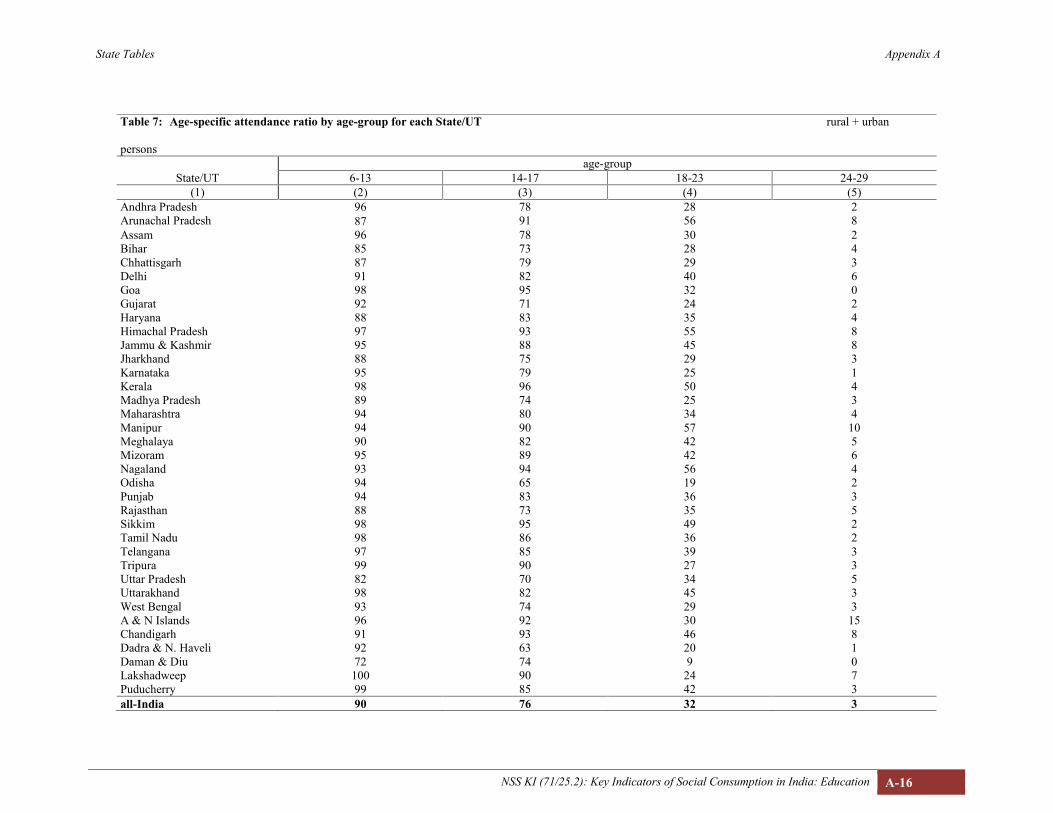
State Tables Appendix A
NSS KI (71/25.2): Key Indicators of Social Consumption in India: Education A-16
Table 7: Age-specific attendance ratio by age-group for each State/UT rural + urban urban
personsage-group
State/UT 6-13 14-17 18-23 24-29(1) (2) (3) (4) (5)
Andhra Pradesh 96 78 28 2Arunachal Pradesh 87 91 56 8Assam 96 78 30 2Bihar 85 73 28 4Chhattisgarh 87 79 29 3Delhi 91 82 40 6Goa 98 95 32 0Gujarat 92 71 24 2Haryana 88 83 35 4Himachal Pradesh 97 93 55 8Jammu & Kashmir 95 88 45 8Jharkhand 88 75 29 3Karnataka 95 79 25 1Kerala 98 96 50 4Madhya Pradesh 89 74 25 3Maharashtra 94 80 34 4Manipur 94 90 57 10Meghalaya 90 82 42 5Mizoram 95 89 42 6Nagaland 93 94 56 4Odisha 94 65 19 2Punjab 94 83 36 3Rajasthan 88 73 35 5Sikkim 98 95 49 2Tamil Nadu 98 86 36 2Telangana 97 85 39 3Tripura 99 90 27 3Uttar Pradesh 82 70 34 5Uttarakhand 98 82 45 3West Bengal 93 74 29 3A & N Islands 96 92 30 15Chandigarh 91 93 46 8Dadra & N. Haveli 92 63 20 1Daman & Diu 72 74 9 0Lakshadweep 100 90 24 7Puducherry 99 85 42 3all-India 90 76 32 3
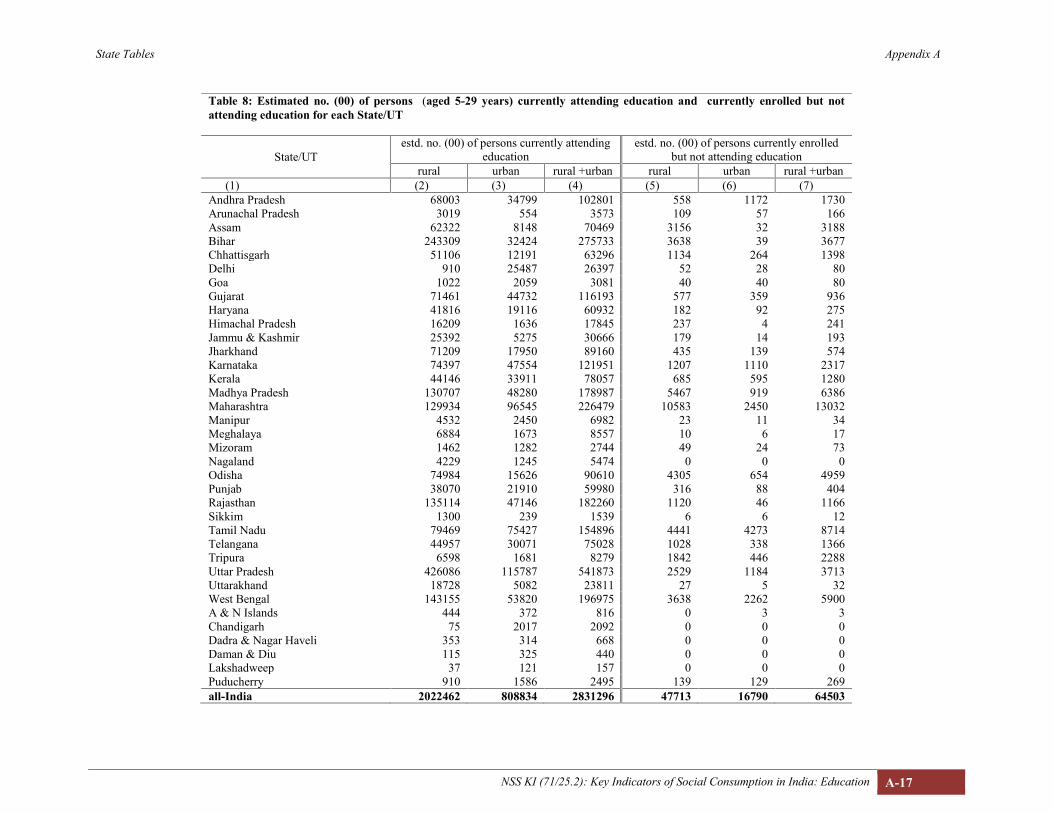
State Tables Appendix A
NSS KI (71/25.2): Key Indicators of Social Consumption in India: Education A-17
Table 8: Estimated no. (00) of persons (aged 5-29 years) currently attending education and currently enrolled but notattending education for each State/UT
State/UTestd. no. (00) of persons currently attending
educationestd. no. (00) of persons currently enrolled
but not attending educationrural urban rural +urban rural urban rural +urban
(1) (2) (3) (4) (5) (6) (7)Andhra Pradesh 68003 34799 102801 558 1172 1730Arunachal Pradesh 3019 554 3573 109 57 166Assam 62322 8148 70469 3156 32 3188Bihar 243309 32424 275733 3638 39 3677Chhattisgarh 51106 12191 63296 1134 264 1398Delhi 910 25487 26397 52 28 80Goa 1022 2059 3081 40 40 80Gujarat 71461 44732 116193 577 359 936Haryana 41816 19116 60932 182 92 275Himachal Pradesh 16209 1636 17845 237 4 241Jammu & Kashmir 25392 5275 30666 179 14 193Jharkhand 71209 17950 89160 435 139 574Karnataka 74397 47554 121951 1207 1110 2317Kerala 44146 33911 78057 685 595 1280Madhya Pradesh 130707 48280 178987 5467 919 6386Maharashtra 129934 96545 226479 10583 2450 13032Manipur 4532 2450 6982 23 11 34Meghalaya 6884 1673 8557 10 6 17Mizoram 1462 1282 2744 49 24 73Nagaland 4229 1245 5474 0 0 0Odisha 74984 15626 90610 4305 654 4959Punjab 38070 21910 59980 316 88 404Rajasthan 135114 47146 182260 1120 46 1166Sikkim 1300 239 1539 6 6 12Tamil Nadu 79469 75427 154896 4441 4273 8714Telangana 44957 30071 75028 1028 338 1366Tripura 6598 1681 8279 1842 446 2288Uttar Pradesh 426086 115787 541873 2529 1184 3713Uttarakhand 18728 5082 23811 27 5 32West Bengal 143155 53820 196975 3638 2262 5900A & N Islands 444 372 816 0 3 3Chandigarh 75 2017 2092 0 0 0Dadra & Nagar Haveli 353 314 668 0 0 0Daman & Diu 115 325 440 0 0 0Lakshadweep 37 121 157 0 0 0Puducherry 910 1586 2495 139 129 269all-India 2022462 808834 2831296 47713 16790 64503
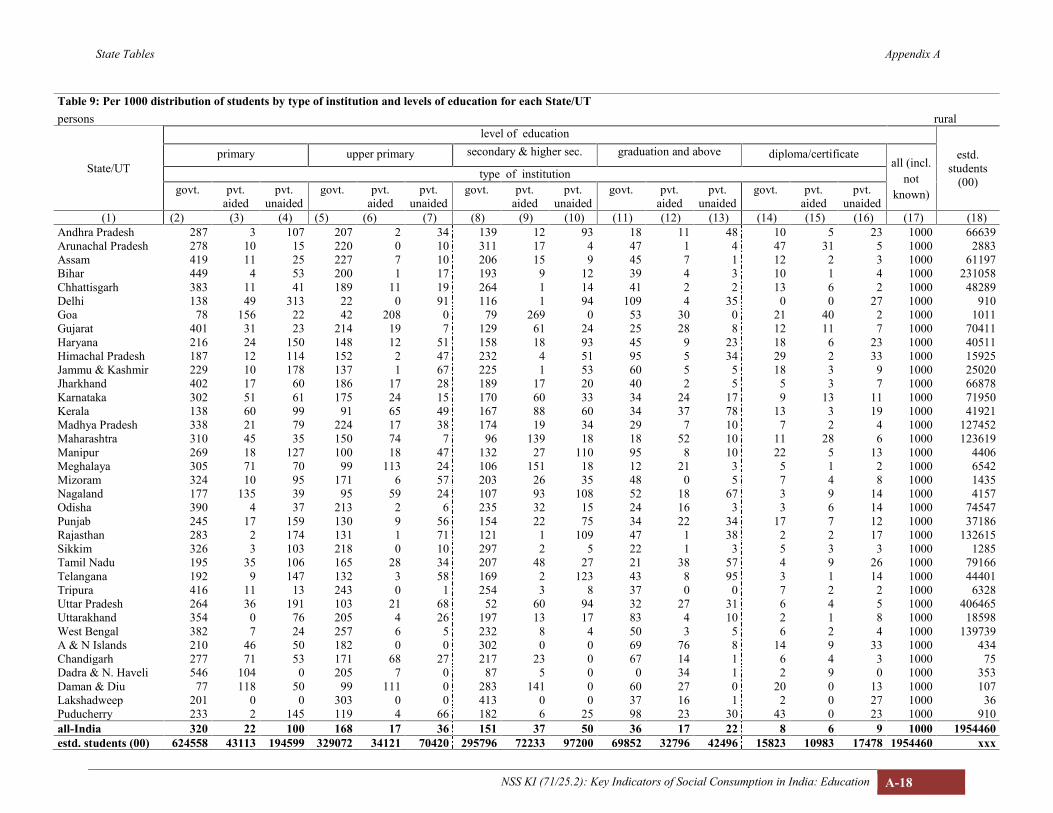
State Tables Appendix A
NSS KI (71/25.2): Key Indicators of Social Consumption in India: Education A-18
Table 9: Per 1000 distribution of students by type of institution and levels of education for each State/UTpersons rural
State/UT
level of education
estd.students
(00)
primary upper primary secondary & higher sec. graduation and above diploma/certificateall (incl.
notknown)
type of institutiongovt. pvt.
aidedpvt.
unaidedgovt. pvt.
aidedpvt.
unaidedgovt. pvt.
aidedpvt.
unaidedgovt. pvt.
aidedpvt.
unaidedgovt. pvt.
aidedpvt.
unaided(1) (2) (3) (4) (5) (6) (7) (8) (9) (10) (11) (12) (13) (14) (15) (16) (17) (18)
Andhra Pradesh 287 3 107 207 2 34 139 12 93 18 11 48 10 5 23 1000 66639Arunachal Pradesh 278 10 15 220 0 10 311 17 4 47 1 4 47 31 5 1000 2883Assam 419 11 25 227 7 10 206 15 9 45 7 1 12 2 3 1000 61197Bihar 449 4 53 200 1 17 193 9 12 39 4 3 10 1 4 1000 231058Chhattisgarh 383 11 41 189 11 19 264 1 14 41 2 2 13 6 2 1000 48289Delhi 138 49 313 22 0 91 116 1 94 109 4 35 0 0 27 1000 910Goa 78 156 22 42 208 0 79 269 0 53 30 0 21 40 2 1000 1011Gujarat 401 31 23 214 19 7 129 61 24 25 28 8 12 11 7 1000 70411Haryana 216 24 150 148 12 51 158 18 93 45 9 23 18 6 23 1000 40511Himachal Pradesh 187 12 114 152 2 47 232 4 51 95 5 34 29 2 33 1000 15925Jammu & Kashmir 229 10 178 137 1 67 225 1 53 60 5 5 18 3 9 1000 25020Jharkhand 402 17 60 186 17 28 189 17 20 40 2 5 5 3 7 1000 66878Karnataka 302 51 61 175 24 15 170 60 33 34 24 17 9 13 11 1000 71950Kerala 138 60 99 91 65 49 167 88 60 34 37 78 13 3 19 1000 41921Madhya Pradesh 338 21 79 224 17 38 174 19 34 29 7 10 7 2 4 1000 127452Maharashtra 310 45 35 150 74 7 96 139 18 18 52 10 11 28 6 1000 123619Manipur 269 18 127 100 18 47 132 27 110 95 8 10 22 5 13 1000 4406Meghalaya 305 71 70 99 113 24 106 151 18 12 21 3 5 1 2 1000 6542Mizoram 324 10 95 171 6 57 203 26 35 48 0 5 7 4 8 1000 1435Nagaland 177 135 39 95 59 24 107 93 108 52 18 67 3 9 14 1000 4157Odisha 390 4 37 213 2 6 235 32 15 24 16 3 3 6 14 1000 74547Punjab 245 17 159 130 9 56 154 22 75 34 22 34 17 7 12 1000 37186Rajasthan 283 2 174 131 1 71 121 1 109 47 1 38 2 2 17 1000 132615Sikkim 326 3 103 218 0 10 297 2 5 22 1 3 5 3 3 1000 1285Tamil Nadu 195 35 106 165 28 34 207 48 27 21 38 57 4 9 26 1000 79166Telangana 192 9 147 132 3 58 169 2 123 43 8 95 3 1 14 1000 44401Tripura 416 11 13 243 0 1 254 3 8 37 0 0 7 2 2 1000 6328Uttar Pradesh 264 36 191 103 21 68 52 60 94 32 27 31 6 4 5 1000 406465Uttarakhand 354 0 76 205 4 26 197 13 17 83 4 10 2 1 8 1000 18598West Bengal 382 7 24 257 6 5 232 8 4 50 3 5 6 2 4 1000 139739A & N Islands 210 46 50 182 0 0 302 0 0 69 76 8 14 9 33 1000 434Chandigarh 277 71 53 171 68 27 217 23 0 67 14 1 6 4 3 1000 75Dadra & N. Haveli 546 104 0 205 7 0 87 5 0 0 34 1 2 9 0 1000 353Daman & Diu 77 118 50 99 111 0 283 141 0 60 27 0 20 0 13 1000 107Lakshadweep 201 0 0 303 0 0 413 0 0 37 16 1 2 0 27 1000 36Puducherry 233 2 145 119 4 66 182 6 25 98 23 30 43 0 23 1000 910all-India 320 22 100 168 17 36 151 37 50 36 17 22 8 6 9 1000 1954460estd. students (00) 624558 43113 194599 329072 34121 70420 295796 72233 97200 69852 32796 42496 15823 10983 17478 1954460 xxx
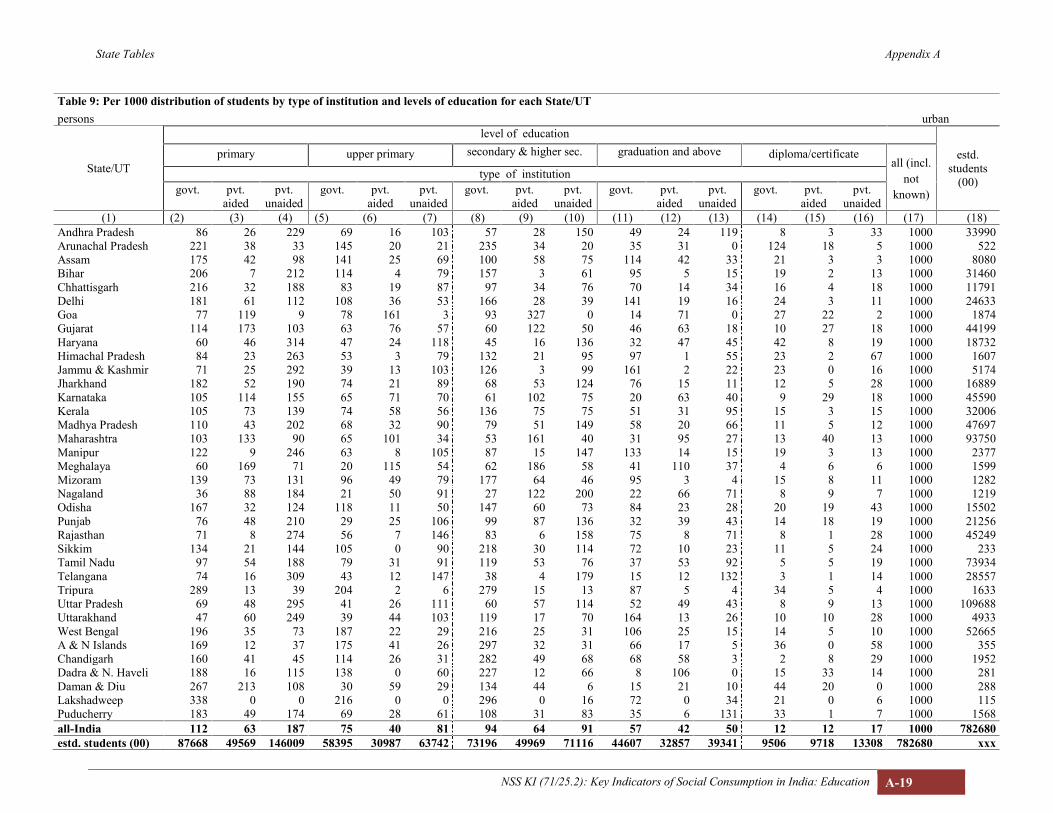
State Tables Appendix A
NSS KI (71/25.2): Key Indicators of Social Consumption in India: Education A-19
Table 9: Per 1000 distribution of students by type of institution and levels of education for each State/UTpersons urban
State/UT
level of education
estd.students
(00)
primary upper primary secondary & higher sec. graduation and above diploma/certificateall (incl.
notknown)
type of institutiongovt. pvt.
aidedpvt.
unaidedgovt. pvt.
aidedpvt.
unaidedgovt. pvt.
aidedpvt.
unaidedgovt. pvt.
aidedpvt.
unaidedgovt. pvt.
aidedpvt.
unaided(1) (2) (3) (4) (5) (6) (7) (8) (9) (10) (11) (12) (13) (14) (15) (16) (17) (18)
Andhra Pradesh 86 26 229 69 16 103 57 28 150 49 24 119 8 3 33 1000 33990Arunachal Pradesh 221 38 33 145 20 21 235 34 20 35 31 0 124 18 5 1000 522Assam 175 42 98 141 25 69 100 58 75 114 42 33 21 3 3 1000 8080Bihar 206 7 212 114 4 79 157 3 61 95 5 15 19 2 13 1000 31460Chhattisgarh 216 32 188 83 19 87 97 34 76 70 14 34 16 4 18 1000 11791Delhi 181 61 112 108 36 53 166 28 39 141 19 16 24 3 11 1000 24633Goa 77 119 9 78 161 3 93 327 0 14 71 0 27 22 2 1000 1874Gujarat 114 173 103 63 76 57 60 122 50 46 63 18 10 27 18 1000 44199Haryana 60 46 314 47 24 118 45 16 136 32 47 45 42 8 19 1000 18732Himachal Pradesh 84 23 263 53 3 79 132 21 95 97 1 55 23 2 67 1000 1607Jammu & Kashmir 71 25 292 39 13 103 126 3 99 161 2 22 23 0 16 1000 5174Jharkhand 182 52 190 74 21 89 68 53 124 76 15 11 12 5 28 1000 16889Karnataka 105 114 155 65 71 70 61 102 75 20 63 40 9 29 18 1000 45590Kerala 105 73 139 74 58 56 136 75 75 51 31 95 15 3 15 1000 32006Madhya Pradesh 110 43 202 68 32 90 79 51 149 58 20 66 11 5 12 1000 47697Maharashtra 103 133 90 65 101 34 53 161 40 31 95 27 13 40 13 1000 93750Manipur 122 9 246 63 8 105 87 15 147 133 14 15 19 3 13 1000 2377Meghalaya 60 169 71 20 115 54 62 186 58 41 110 37 4 6 6 1000 1599Mizoram 139 73 131 96 49 79 177 64 46 95 3 4 15 8 11 1000 1282Nagaland 36 88 184 21 50 91 27 122 200 22 66 71 8 9 7 1000 1219Odisha 167 32 124 118 11 50 147 60 73 84 23 28 20 19 43 1000 15502Punjab 76 48 210 29 25 106 99 87 136 32 39 43 14 18 19 1000 21256Rajasthan 71 8 274 56 7 146 83 6 158 75 8 71 8 1 28 1000 45249Sikkim 134 21 144 105 0 90 218 30 114 72 10 23 11 5 24 1000 233Tamil Nadu 97 54 188 79 31 91 119 53 76 37 53 92 5 5 19 1000 73934Telangana 74 16 309 43 12 147 38 4 179 15 12 132 3 1 14 1000 28557Tripura 289 13 39 204 2 6 279 15 13 87 5 4 34 5 4 1000 1633Uttar Pradesh 69 48 295 41 26 111 60 57 114 52 49 43 8 9 13 1000 109688Uttarakhand 47 60 249 39 44 103 119 17 70 164 13 26 10 10 28 1000 4933West Bengal 196 35 73 187 22 29 216 25 31 106 25 15 14 5 10 1000 52665A & N Islands 169 12 37 175 41 26 297 32 31 66 17 5 36 0 58 1000 355Chandigarh 160 41 45 114 26 31 282 49 68 68 58 3 2 8 29 1000 1952Dadra & N. Haveli 188 16 115 138 0 60 227 12 66 8 106 0 15 33 14 1000 281Daman & Diu 267 213 108 30 59 29 134 44 6 15 21 10 44 20 0 1000 288Lakshadweep 338 0 0 216 0 0 296 0 16 72 0 34 21 0 6 1000 115Puducherry 183 49 174 69 28 61 108 31 83 35 6 131 33 1 7 1000 1568all-India 112 63 187 75 40 81 94 64 91 57 42 50 12 12 17 1000 782680estd. students (00) 87668 49569 146009 58395 30987 63742 73196 49969 71116 44607 32857 39341 9506 9718 13308 782680 xxx
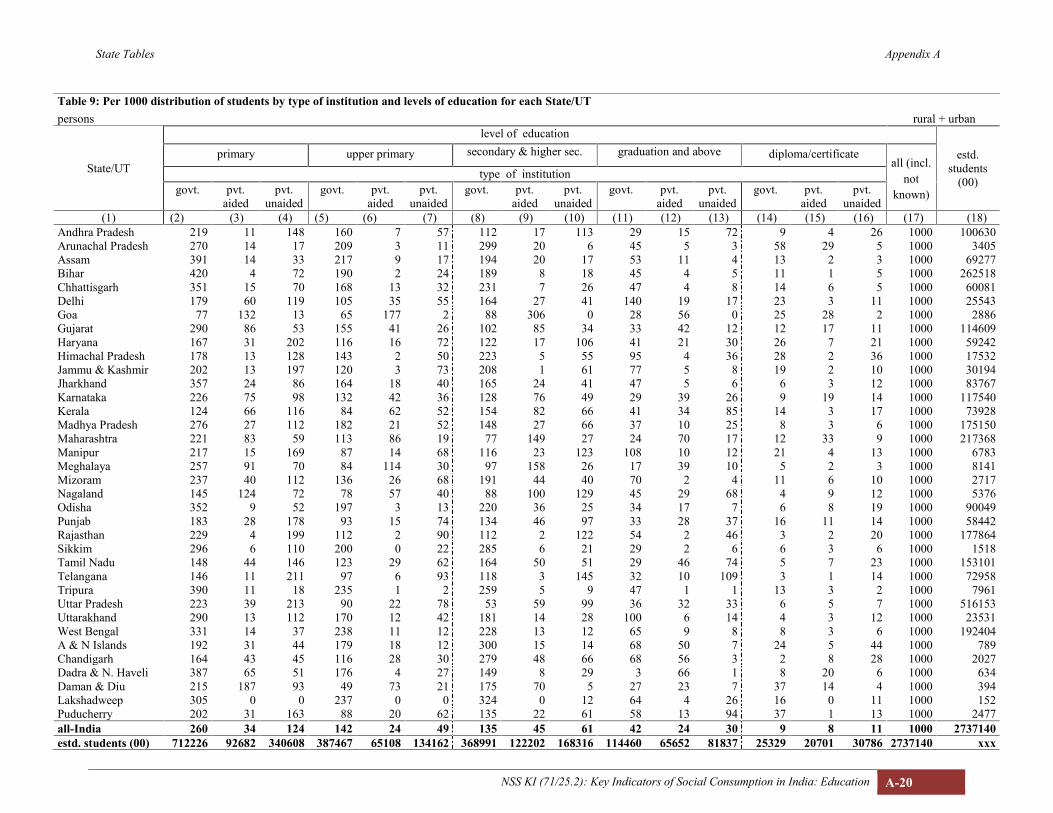
State Tables Appendix A
NSS KI (71/25.2): Key Indicators of Social Consumption in India: Education A-20
Table 9: Per 1000 distribution of students by type of institution and levels of education for each State/UTpersons rural + urban
State/UT
level of education
estd.students
(00)
primary upper primary secondary & higher sec. graduation and above diploma/certificateall (incl.
notknown)
type of institutiongovt. pvt.
aidedpvt.
unaidedgovt. pvt.
aidedpvt.
unaidedgovt. pvt.
aidedpvt.
unaidedgovt. pvt.
aidedpvt.
unaidedgovt. pvt.
aidedpvt.
unaided(1) (2) (3) (4) (5) (6) (7) (8) (9) (10) (11) (12) (13) (14) (15) (16) (17) (18)
Andhra Pradesh 219 11 148 160 7 57 112 17 113 29 15 72 9 4 26 1000 100630Arunachal Pradesh 270 14 17 209 3 11 299 20 6 45 5 3 58 29 5 1000 3405Assam 391 14 33 217 9 17 194 20 17 53 11 4 13 2 3 1000 69277Bihar 420 4 72 190 2 24 189 8 18 45 4 5 11 1 5 1000 262518Chhattisgarh 351 15 70 168 13 32 231 7 26 47 4 8 14 6 5 1000 60081Delhi 179 60 119 105 35 55 164 27 41 140 19 17 23 3 11 1000 25543Goa 77 132 13 65 177 2 88 306 0 28 56 0 25 28 2 1000 2886Gujarat 290 86 53 155 41 26 102 85 34 33 42 12 12 17 11 1000 114609Haryana 167 31 202 116 16 72 122 17 106 41 21 30 26 7 21 1000 59242Himachal Pradesh 178 13 128 143 2 50 223 5 55 95 4 36 28 2 36 1000 17532Jammu & Kashmir 202 13 197 120 3 73 208 1 61 77 5 8 19 2 10 1000 30194Jharkhand 357 24 86 164 18 40 165 24 41 47 5 6 6 3 12 1000 83767Karnataka 226 75 98 132 42 36 128 76 49 29 39 26 9 19 14 1000 117540Kerala 124 66 116 84 62 52 154 82 66 41 34 85 14 3 17 1000 73928Madhya Pradesh 276 27 112 182 21 52 148 27 66 37 10 25 8 3 6 1000 175150Maharashtra 221 83 59 113 86 19 77 149 27 24 70 17 12 33 9 1000 217368Manipur 217 15 169 87 14 68 116 23 123 108 10 12 21 4 13 1000 6783Meghalaya 257 91 70 84 114 30 97 158 26 17 39 10 5 2 3 1000 8141Mizoram 237 40 112 136 26 68 191 44 40 70 2 4 11 6 10 1000 2717Nagaland 145 124 72 78 57 40 88 100 129 45 29 68 4 9 12 1000 5376Odisha 352 9 52 197 3 13 220 36 25 34 17 7 6 8 19 1000 90049Punjab 183 28 178 93 15 74 134 46 97 33 28 37 16 11 14 1000 58442Rajasthan 229 4 199 112 2 90 112 2 122 54 2 46 3 2 20 1000 177864Sikkim 296 6 110 200 0 22 285 6 21 29 2 6 6 3 6 1000 1518Tamil Nadu 148 44 146 123 29 62 164 50 51 29 46 74 5 7 23 1000 153101Telangana 146 11 211 97 6 93 118 3 145 32 10 109 3 1 14 1000 72958Tripura 390 11 18 235 1 2 259 5 9 47 1 1 13 3 2 1000 7961Uttar Pradesh 223 39 213 90 22 78 53 59 99 36 32 33 6 5 7 1000 516153Uttarakhand 290 13 112 170 12 42 181 14 28 100 6 14 4 3 12 1000 23531West Bengal 331 14 37 238 11 12 228 13 12 65 9 8 8 3 6 1000 192404A & N Islands 192 31 44 179 18 12 300 15 14 68 50 7 24 5 44 1000 789Chandigarh 164 43 45 116 28 30 279 48 66 68 56 3 2 8 28 1000 2027Dadra & N. Haveli 387 65 51 176 4 27 149 8 29 3 66 1 8 20 6 1000 634Daman & Diu 215 187 93 49 73 21 175 70 5 27 23 7 37 14 4 1000 394Lakshadweep 305 0 0 237 0 0 324 0 12 64 4 26 16 0 11 1000 152Puducherry 202 31 163 88 20 62 135 22 61 58 13 94 37 1 13 1000 2477all-India 260 34 124 142 24 49 135 45 61 42 24 30 9 8 11 1000 2737140estd. students (00) 712226 92682 340608 387467 65108 134162 368991 122202 168316 114460 65652 81837 25329 20701 30786 2737140 xxx
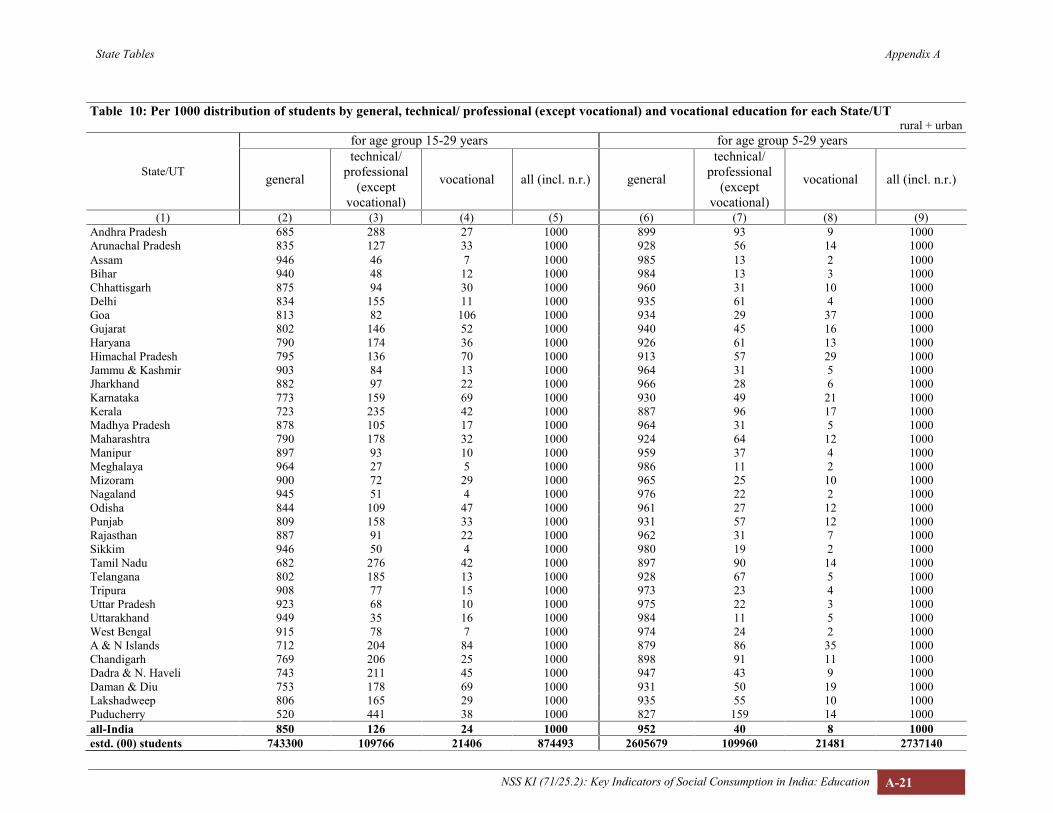
State Tables Appendix A
NSS KI (71/25.2): Key Indicators of Social Consumption in India: Education A-21
Table 10: Per 1000 distribution of students by general, technical/ professional (except vocational) and vocational education for each State/UTrural + urban
State/UT
for age group 15-29 years for age group 5-29 years
general
technical/professional
(exceptvocational)
vocational all (incl. n.r.) general
technical/professional
(exceptvocational)
vocational all (incl. n.r.)
(1) (2) (3) (4) (5) (6) (7) (8) (9)Andhra Pradesh 685 288 27 1000 899 93 9 1000Arunachal Pradesh 835 127 33 1000 928 56 14 1000Assam 946 46 7 1000 985 13 2 1000Bihar 940 48 12 1000 984 13 3 1000Chhattisgarh 875 94 30 1000 960 31 10 1000Delhi 834 155 11 1000 935 61 4 1000Goa 813 82 106 1000 934 29 37 1000Gujarat 802 146 52 1000 940 45 16 1000Haryana 790 174 36 1000 926 61 13 1000Himachal Pradesh 795 136 70 1000 913 57 29 1000Jammu & Kashmir 903 84 13 1000 964 31 5 1000Jharkhand 882 97 22 1000 966 28 6 1000Karnataka 773 159 69 1000 930 49 21 1000Kerala 723 235 42 1000 887 96 17 1000Madhya Pradesh 878 105 17 1000 964 31 5 1000Maharashtra 790 178 32 1000 924 64 12 1000Manipur 897 93 10 1000 959 37 4 1000Meghalaya 964 27 5 1000 986 11 2 1000Mizoram 900 72 29 1000 965 25 10 1000Nagaland 945 51 4 1000 976 22 2 1000Odisha 844 109 47 1000 961 27 12 1000Punjab 809 158 33 1000 931 57 12 1000Rajasthan 887 91 22 1000 962 31 7 1000Sikkim 946 50 4 1000 980 19 2 1000Tamil Nadu 682 276 42 1000 897 90 14 1000Telangana 802 185 13 1000 928 67 5 1000Tripura 908 77 15 1000 973 23 4 1000Uttar Pradesh 923 68 10 1000 975 22 3 1000Uttarakhand 949 35 16 1000 984 11 5 1000West Bengal 915 78 7 1000 974 24 2 1000A & N Islands 712 204 84 1000 879 86 35 1000Chandigarh 769 206 25 1000 898 91 11 1000Dadra & N. Haveli 743 211 45 1000 947 43 9 1000Daman & Diu 753 178 69 1000 931 50 19 1000Lakshadweep 806 165 29 1000 935 55 10 1000Puducherry 520 441 38 1000 827 159 14 1000all-India 850 126 24 1000 952 40 8 1000estd. (00) students 743300 109766 21406 874493 2605679 109960 21481 2737140
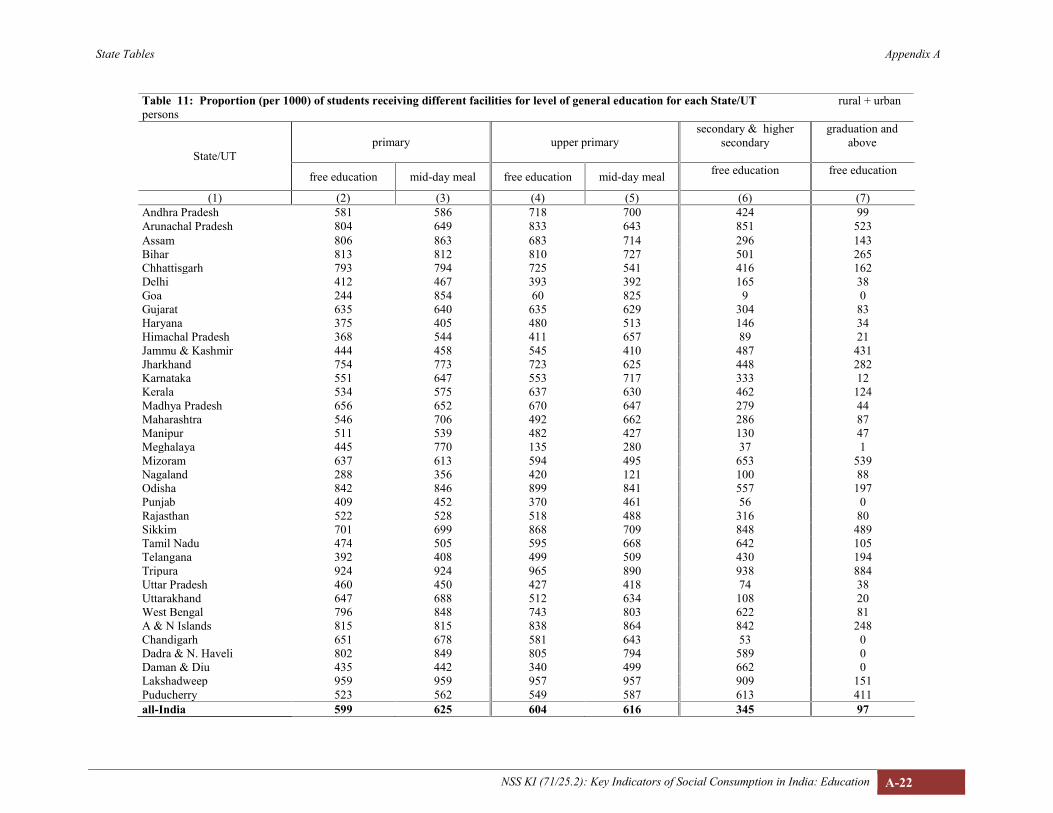
State Tables Appendix A
NSS KI (71/25.2): Key Indicators of Social Consumption in India: Education A-22
Table 11: Proportion (per 1000) of students receiving different facilities for level of general education for each State/UT rural + urbanpersons
State/UTprimary upper primary
secondary & highersecondary
graduation andabove
free education mid-day meal free education mid-day meal free education free education
(1) (2) (3) (4) (5) (6) (7)Andhra Pradesh 581 586 718 700 424 99Arunachal Pradesh 804 649 833 643 851 523Assam 806 863 683 714 296 143Bihar 813 812 810 727 501 265Chhattisgarh 793 794 725 541 416 162Delhi 412 467 393 392 165 38Goa 244 854 60 825 9 0Gujarat 635 640 635 629 304 83Haryana 375 405 480 513 146 34Himachal Pradesh 368 544 411 657 89 21Jammu & Kashmir 444 458 545 410 487 431Jharkhand 754 773 723 625 448 282Karnataka 551 647 553 717 333 12Kerala 534 575 637 630 462 124Madhya Pradesh 656 652 670 647 279 44Maharashtra 546 706 492 662 286 87Manipur 511 539 482 427 130 47Meghalaya 445 770 135 280 37 1Mizoram 637 613 594 495 653 539Nagaland 288 356 420 121 100 88Odisha 842 846 899 841 557 197Punjab 409 452 370 461 56 0Rajasthan 522 528 518 488 316 80Sikkim 701 699 868 709 848 489Tamil Nadu 474 505 595 668 642 105Telangana 392 408 499 509 430 194Tripura 924 924 965 890 938 884Uttar Pradesh 460 450 427 418 74 38Uttarakhand 647 688 512 634 108 20West Bengal 796 848 743 803 622 81A & N Islands 815 815 838 864 842 248Chandigarh 651 678 581 643 53 0Dadra & N. Haveli 802 849 805 794 589 0Daman & Diu 435 442 340 499 662 0Lakshadweep 959 959 957 957 909 151Puducherry 523 562 549 587 613 411all-India 599 625 604 616 345 97

State Tables Appendix A
NSS KI (71/25.2): Key Indicators of Social Consumption in India: Education A-23
Table 12: Proportion (per 1000) of students taking private coaching for levels of school education for each State/UTrural + urban
State/UT primary upper primary secondary and highersecondary
male female male female male female(1) (2) (3) (4) (5) (6) (7)
Andhra Pradesh 135 71 137 128 126 68Arunachal Pradesh 99 49 28 25 122 93Assam 91 81 164 169 411 382Bihar 468 397 557 429 672 631Chhattisgarh 57 64 76 35 155 101Delhi 322 366 406 421 425 488Goa 136 155 274 200 324 367Gujarat 192 152 180 121 324 293Haryana 117 88 186 120 242 200Himachal Pradesh 38 27 89 48 151 119Jammu & Kashmir 315 283 275 286 367 385Jharkhand 293 277 363 337 542 429Karnataka 116 166 147 86 139 147Kerala 227 206 299 269 411 422Madhya Pradesh 132 92 179 105 377 340Maharashtra 216 192 244 194 342 356Manipur 344 287 335 396 547 508Meghalaya 52 19 48 58 75 147Mizoram 17 17 25 9 44 14Nagaland 34 14 14 51 87 73Odisha 450 424 436 472 634 594Punjab 216 182 221 233 288 233Rajasthan 54 35 66 64 194 200Sikkim 56 75 92 66 365 173Tamil Nadu 228 211 187 192 204 205Telangana 68 31 93 32 67 21Tripura 783 765 891 768 870 914Uttar Pradesh 122 90 137 109 346 183Uttarakhand 186 144 207 39 253 127West Bengal 711 625 890 846 890 920A & N Islands 186 318 349 217 405 286Chandigarh 494 456 483 433 691 696Dadra & Nagar Haveli 124 234 157 276 36 317Daman & Diu 588 769 476 558 265 459Lakshadweep 0 50 96 230 11 273Puducherry 362 247 281 230 269 157all-India 231 201 280 246 378 347

State Tables Appendix A
NSS KI (71/25.2): Key Indicators of Social Consumption in India: Education A-24
Table 13: Proportion of students (per 1000) taking private coaching for levels of higher education for eachState/UT rural + urban
persons
State/UTdiploma(incl. alllevels)
graduation post graduate andabove
proportion (per 1000) ofstudents taking private
coaching (schooleducation and higher
education)(1) (2) (3) (4) (5)
Andhra Pradesh 49 47 100 103Arunachal Pradesh 101 99 233 78Assam 364 289 161 196Bihar 481 423 72 495Chhattisgarh 57 135 65 81Delhi 214 154 97 340Goa 42 0 0 231Gujarat 147 129 128 194Haryana 114 174 118 150Himachal Pradesh 39 89 54 76Jammu & Kashmir 70 145 5 292Jharkhand 223 358 322 350Karnataka 97 76 23 127Kerala 44 69 69 261Madhya Pradesh 244 232 65 189Maharashtra 229 254 157 250Manipur 210 155 60 355Meghalaya 32 36 0 61Mizoram 4 0 8 19Nagaland 2 0 0 38Odisha 234 364 303 479Punjab 74 172 95 213Rajasthan 133 172 165 100Sikkim 144 244 45 137Tamil Nadu 22 24 36 174Telangana 31 18 84 50Tripura 435 763 468 812Uttar Pradesh 209 158 95 152Uttarakhand 341 72 181 162West Bengal 457 786 539 784A & N Islands 0 0 0 240Chandigarh 0 172 0 500Dadra & Nagar Haveli 164 441 0 206Daman & Diu 0 147 0 508Lakshadweep 42 18 0 87Puducherry 44 40 0 224all-India 183 203 130 259

State Tables Appendix A
NSS KI (71/25.2): Key Indicators of Social Consumption in India: Education A-25
Table 14: Average expenditure (`) per student in current academic session by type ofeducation rural + urban
State/UT
type of education
general technical/professional(except vocational) vocational
(1) (2) (3) (4)Andhra Pradesh 7358 43400 14927Arunachal Pradesh 5917 43632 46810Assam 4152 41632 16736Bihar 4251 75629 36693Chhattisgarh 2993 35522 12578Delhi 19491 67537 33799Goa 8465 54798 15128Gujarat 7442 60491 22423Haryana 13905 74260 33450Himachal Pradesh 8367 78886 23534Jammu & Kashmir 7311 60699 29548Jharkhand 4543 39084 35177Karnataka 7863 59803 20811Kerala 9326 82232 19646Madhya Pradesh 4894 55192 28504Maharashtra 9292 69181 31179Manipur 10012 81152 24195Meghalaya 7037 49363 13135Mizoram 10041 59649 32665Nagaland 11501 60751 20518Odisha 4584 66159 34740Punjab 12600 69520 39139Rajasthan 6804 47822 35852Sikkim 5853 104922 29691Tamil Nadu 9773 79689 35469Telangana 9600 47788 14744Tripura 6174 51610 15861Uttar Pradesh 5074 58567 28073Uttarakhand 5893 96342 30177West Bengal 6692 58436 21104A & N Islands 8191 39897 11684Chandigarh 18426 81480 29364Dadra & Nagar Haveli 7092 75212 15423Daman & Diu 11926 43074 12274Lakshadweep 2504 35796 3357Puducherry 11436 59629 9366all-India 6788 62841 27676

State Tables Appendix A
NSS KI (71/25.2): Key Indicators of Social Consumption in India: Education A-26
Table 15: Average expenditure (`) per student pursuing general education during current academic session for levels of education foreach State/UT
persons rurallevel of general education estd. (00) students
pursuing generaleducationState/UT
primary upperprimary
secondaryhigher
secondary graduate
post-graduate
and abovediploma
(1) (2) (3) (4) (5) (6) (7) (8) (9)Andhra Pradesh 3177 2611 5529 11107 15412 17267 8233 61989Arunachal Pradesh 2907 3787 5219 7889 7476 0 22798 2697Assam 1640 2259 3860 7005 9354 23319 7855 60516Bihar 2178 2917 4573 9227 9575 13134 14122 228298Chhattisgarh 979 1091 1853 3639 6430 4962 4207 46707Delhi 9356 15240 23408 16467 14497 0 10345 873Goa 6705 3852 6045 9717 12377 0 0 940Gujarat 2251 3130 5613 12168 10446 13407 33188 67797Haryana 6899 5203 9613 14589 14786 21039 16671 38174Himachal Pradesh 6137 5315 6976 8890 12441 25999 20986 14591Jammu & Kashmir 4704 4477 5874 10295 13257 18886 13102 24393Jharkhand 2093 3031 3888 7193 9969 15563 8685 65036Karnataka 3045 3112 3512 10877 11231 31952 12438 68719Kerala 7073 7126 8248 9595 13567 14326 12009 37462Madhya Pradesh 2096 2280 3673 6580 10093 10946 9427 124864Maharashtra 3413 3034 4627 10330 13330 15275 14141 117813Manipur 4503 5741 11037 14190 15657 18161 7932 4250Meghalaya 2754 3892 6535 14358 19116 33137 27200 6473Mizoram 3285 5435 9787 17129 16049 41597 42871 1402Nagaland 4835 5765 9550 18809 25992 16885 13239 4071Odisha 1797 1708 3778 9218 8057 11543 18330 72884Punjab 8181 7105 11216 11944 23107 19547 23482 35250Rajasthan 3080 3595 6405 12334 14292 8421 29209 128985Sikkim 3424 2503 4735 7328 15311 14626 11924 1267Tamil Nadu 6399 5098 4945 7560 21349 51573 6630 72406Telangana 5228 5642 4739 11482 12616 18740 7911 42085Tripura 3499 3909 7151 7179 13647 24346 10361 6201Uttar Pradesh 2070 2486 4890 6817 8289 7550 10694 399740Uttarakhand 2286 3627 5119 7029 8114 15384 21500 18412West Bengal 2159 4058 5990 8309 12486 10787 19383 137344A & N Islands 6890 1901 5349 3424 14314 9055 6200 381Chandigarh 13652 16579 15753 12529 29039 12650 0 73Dadra & N. Haveli 2591 1274 1676 6190 7782 0 0 342Daman & Diu 20170 11210 9104 11304 7477 0 0 103Lakshadweep 196 227 293 301 6028 3000 0 34Puducherry 7289 7557 1935 15169 6984 0 0 744all-India 2811 3242 5100 9031 11527 14604 13422 1893318
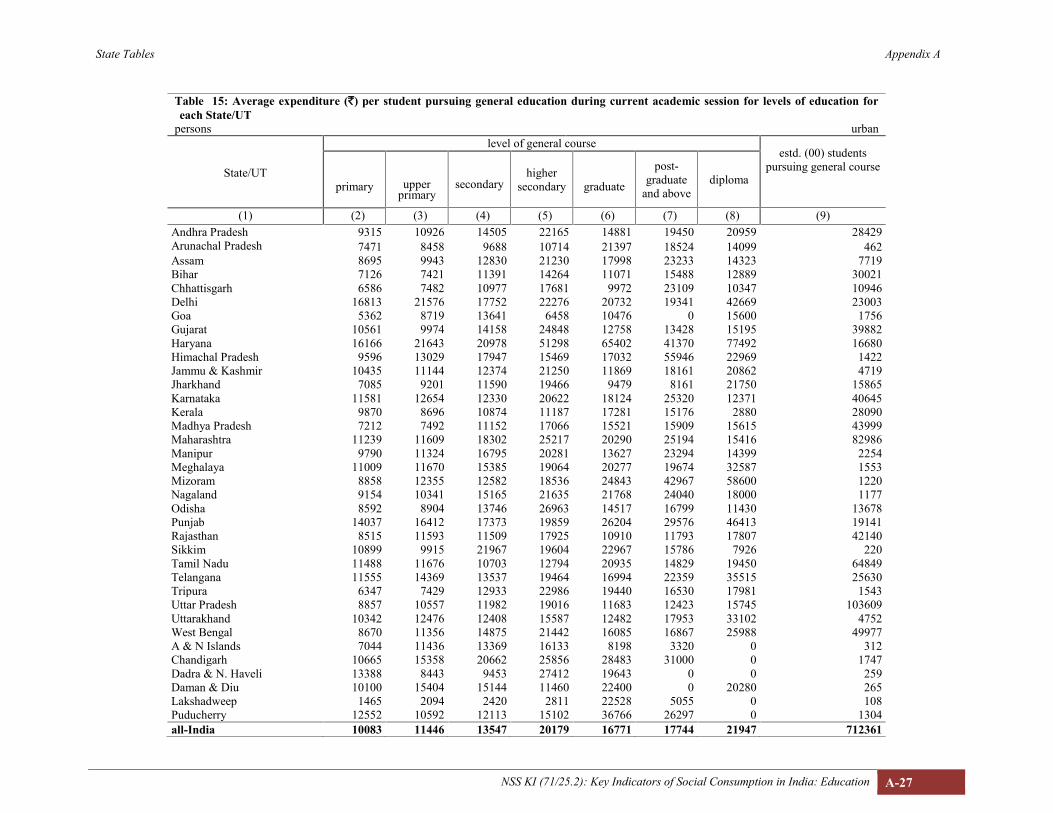
State Tables Appendix A
NSS KI (71/25.2): Key Indicators of Social Consumption in India: Education A-27
Table 15: Average expenditure (`) per student pursuing general education during current academic session for levels of education foreach State/UT
persons urbanlevel of general course
estd. (00) studentspursuing general courseState/UT
primary upperprimary
secondaryhigher
secondary graduate
post-graduate
and abovediploma
(1) (2) (3) (4) (5) (6) (7) (8) (9)Andhra Pradesh 9315 10926 14505 22165 14881 19450 20959 28429Arunachal Pradesh 7471 8458 9688 10714 21397 18524 14099 462Assam 8695 9943 12830 21230 17998 23233 14323 7719Bihar 7126 7421 11391 14264 11071 15488 12889 30021Chhattisgarh 6586 7482 10977 17681 9972 23109 10347 10946Delhi 16813 21576 17752 22276 20732 19341 42669 23003Goa 5362 8719 13641 6458 10476 0 15600 1756Gujarat 10561 9974 14158 24848 12758 13428 15195 39882Haryana 16166 21643 20978 51298 65402 41370 77492 16680Himachal Pradesh 9596 13029 17947 15469 17032 55946 22969 1422Jammu & Kashmir 10435 11144 12374 21250 11869 18161 20862 4719Jharkhand 7085 9201 11590 19466 9479 8161 21750 15865Karnataka 11581 12654 12330 20622 18124 25320 12371 40645Kerala 9870 8696 10874 11187 17281 15176 2880 28090Madhya Pradesh 7212 7492 11152 17066 15521 15909 15615 43999Maharashtra 11239 11609 18302 25217 20290 25194 15416 82986Manipur 9790 11324 16795 20281 13627 23294 14399 2254Meghalaya 11009 11670 15385 19064 20277 19674 32587 1553Mizoram 8858 12355 12582 18536 24843 42967 58600 1220Nagaland 9154 10341 15165 21635 21768 24040 18000 1177Odisha 8592 8904 13746 26963 14517 16799 11430 13678Punjab 14037 16412 17373 19859 26204 29576 46413 19141Rajasthan 8515 11593 11509 17925 10910 11793 17807 42140Sikkim 10899 9915 21967 19604 22967 15786 7926 220Tamil Nadu 11488 11676 10703 12794 20935 14829 19450 64849Telangana 11555 14369 13537 19464 16994 22359 35515 25630Tripura 6347 7429 12933 22986 19440 16530 17981 1543Uttar Pradesh 8857 10557 11982 19016 11683 12423 15745 103609Uttarakhand 10342 12476 12408 15587 12482 17953 33102 4752West Bengal 8670 11356 14875 21442 16085 16867 25988 49977A & N Islands 7044 11436 13369 16133 8198 3320 0 312Chandigarh 10665 15358 20662 25856 28483 31000 0 1747Dadra & N. Haveli 13388 8443 9453 27412 19643 0 0 259Daman & Diu 10100 15404 15144 11460 22400 0 20280 265Lakshadweep 1465 2094 2420 2811 22528 5055 0 108Puducherry 12552 10592 12113 15102 36766 26297 0 1304all-India 10083 11446 13547 20179 16771 17744 21947 712361

State Tables Appendix A
NSS KI (71/25.2): Key Indicators of Social Consumption in India: Education A-28
Table 15: Average expenditure (`) per student pursuing general education during current academic session for levels of education foreach State/UTpersons rural + urban
level of general courseestd. (00) students
pursuing general courseState/UTprimary upper
primarysecondary
highersecondary graduate
post-graduate
and abovediploma
(1) (2) (3) (4) (5) (6) (7) (8) (9)Andhra Pradesh 5044 4960 8509 14691 15194 18782 14300 90418Arunachal Pradesh 3599 4411 5883 8225 10418 18524 21246 3159Assam 2232 3124 4891 8747 11383 23252 8707 68235Bihar 2687 3409 5369 9951 9913 13972 13945 258319Chhattisgarh 2093 2213 3089 6445 7749 9880 5530 57654Delhi 16442 21444 17925 22072 20527 19341 41095 23876Goa 5905 6977 11361 7525 11198 0 15600 2695Gujarat 5163 5445 8916 17580 11636 13416 24114 107680Haryana 9960 9991 12236 24752 32736 29549 41369 54854Himachal Pradesh 6505 5803 7848 9431 12698 32655 21591 16013Jammu & Kashmir 5632 5382 6748 11997 12847 18671 14414 29112Jharkhand 3003 4062 5673 9481 9795 12262 10702 80901Karnataka 6164 6728 6737 14434 14050 29351 12409 109363Kerala 8330 7771 9296 10268 15430 14608 10690 65551Madhya Pradesh 3297 3341 5928 10199 12618 13408 12383 168863Maharashtra 6448 6446 10279 17212 16871 20420 14666 200799Manipur 6251 7787 13190 15928 14788 19891 9761 6504Meghalaya 3921 5170 8079 15867 19759 25123 29508 8026Mizoram 5611 8624 11035 17939 21556 42726 43880 2623Nagaland 5716 6729 10644 19712 24973 23493 13622 5248Odisha 2714 2742 5285 13180 10010 14131 15974 86562Punjab 10014 10121 13479 15824 24182 23942 27855 54392Rajasthan 4209 5677 7503 14340 13180 9752 26332 171125Sikkim 4258 3497 7272 10035 19345 14713 10371 1487Tamil Nadu 8872 8075 7560 9894 21112 37812 7328 137255Telangana 7912 9142 7478 14231 14029 19227 18141 67714Tripura 3973 4558 8300 12394 15756 20779 15278 7744Uttar Pradesh 3323 4095 6513 9730 9117 9485 11795 503349Uttarakhand 3740 5166 6381 8950 9593 16466 28392 23164West Bengal 3573 5890 8580 12492 14030 14626 22522 187322A & N Islands 6946 6858 8994 10213 12016 6738 6200 694Chandigarh 10841 15426 20583 25470 28511 30976 0 1820Dadra & N. Haveli 5625 4336 7123 25329 16950 0 0 601Daman & Diu 11450 13741 11447 11408 11203 0 20280 367Lakshadweep 1264 1521 1738 2142 20969 4999 0 142Puducherry 10701 9348 8599 15127 24829 26297 0 2048all-India 4610 5386 7459 12619 13478 15999 15997 2605679

State Tables Appendix A
NSS KI (71/25.2): Key Indicators of Social Consumption in India: Education A-29
Table 16: Average expenditure (`) per student pursuing technical/professional education during current academic session for various courses and types ofinstitutions for each State/UTpersons rural + urban
State/UT
technical/professional education
medicine engineering law managementtype of institution type of institution type of institution type of institution
govt. pvt. aided pvt.unaided
govt. pvt. aided pvt.unaided
govt. pvt. aided pvt.unaided
govt. pvt. aided pvt.unaided
(1) (2) (3) (4) (5) (6) (7) (8) (9) (10) (11) (12) (13)Andhra Pradesh 44001 11750 82079 24307 40983 51999 0 54000 35700 33330 24210 36324Arunachal Pradesh 59950 69000 0 45359 83865 102705 0 51200 0 30607 46500 0Assam 50498 86442 358252 64114 86403 132036 62589 43000 65669 61769 45228 260976Bihar 77743 131373 157053 73146 98290 113741 15293 44800 0 71743 51792 74007Chhattisgarh 52943 95526 85590 32631 19946 78041 4163 33000 0 8000 14068 62275Delhi 61240 168964 129997 70927 68216 112376 24326 73291 93000 91814 71840 102590Goa 78152 65000 0 37021 58675 0 0 0 0 36660 40763 100000Gujarat 108222 145796 183180 29223 56655 72311 14573 32768 0 20087 70790 70063Haryana 62142 125515 126813 25853 104948 100036 79599 0 112507 69161 32427 81867Himachal Pradesh 48386 115352 256991 33729 61000 97598 30866 0 0 52372 115000 67925Jammu & Kashmir 60056 78619 75547 41419 63712 105196 31283 0 52100 148723 224000 100968Jharkhand 60620 90114 56196 116223 177026 131900 0 0 0 108513 61700 119163Karnataka 28348 43948 62606 29341 55811 77013 0 34716 30500 23320 46098 115545Kerala 58711 107802 123371 52129 89992 109145 18602 0 44100 40564 81131 112985Madhya Pradesh 84395 63567 140574 44307 62065 83165 23484 19808 59926 48340 61067 73897Maharashtra 57532 72952 110218 33834 75559 85639 17614 39322 80956 149284 65623 334514Manipur 44466 86187 117538 139906 75884 64575 17200 0 225649 60681 48000 52345Meghalaya 65781 65252 108788 48150 39199 154985 0 0 107000 60000 27415 208512Mizoram 72283 275234 71434 67008 43848 0 42265 0 0 53200 0 0Nagaland 55765 0 106226 58143 90574 118789 24073 55253 0 98000 77688 103255Odisha 49473 126000 92941 35180 93752 82578 17520 10100 33300 42947 22200 74732Punjab 139090 64035 98829 51056 84843 70835 44248 78300 0 49732 63517 66135Rajasthan 37639 18148 72527 56069 62952 66259 37191 0 23328 48741 31500 78774Sikkim 87006 77948 129693 93485 113824 135498 10609 0 14980 17287 167405 75160Tamil Nadu 78704 136063 147259 39235 71470 80437 18023 16445 0 19404 75930 128007Telangana 74000 73000 140154 27127 46884 45790 0 0 47800 15391 25450 60719Tripura 72363 29909 283023 56331 111826 100390 224474 0 0 59613 0 54830Uttar Pradesh 53353 129293 139385 57417 75910 109460 58842 18701 66400 44176 67622 88783Uttarakhand 91500 105437 115461 87571 33089 118213 6500 66000 165000 8800 0 98556West Bengal 47897 18367 73611 45756 95762 93215 67238 52366 19517 157912 101794 211384A & N Islands 24000 0 74487 32283 155820 50712 0 0 0 0 33640 71000Chandigarh 113700 167494 129800 30000 132962 171419 61688 0 0 43000 45876 28750Dadra & N. Haveli 10000 49775 68579 79600 122059 0 0 26650 0 0 0 42700Daman & Diu 120000 203831 123000 9742 61110 80007 0 0 0 0 0 0Lakshadweep 85199 0 79840 33221 0 0 0 0 0 6062 0 0Puducherry 43312 32100 157265 19881 61165 70951 0 0 0 21450 0 36648all-India 64968 90205 118657 42401 69696 78227 39193 31984 67392 44519 62124 105188
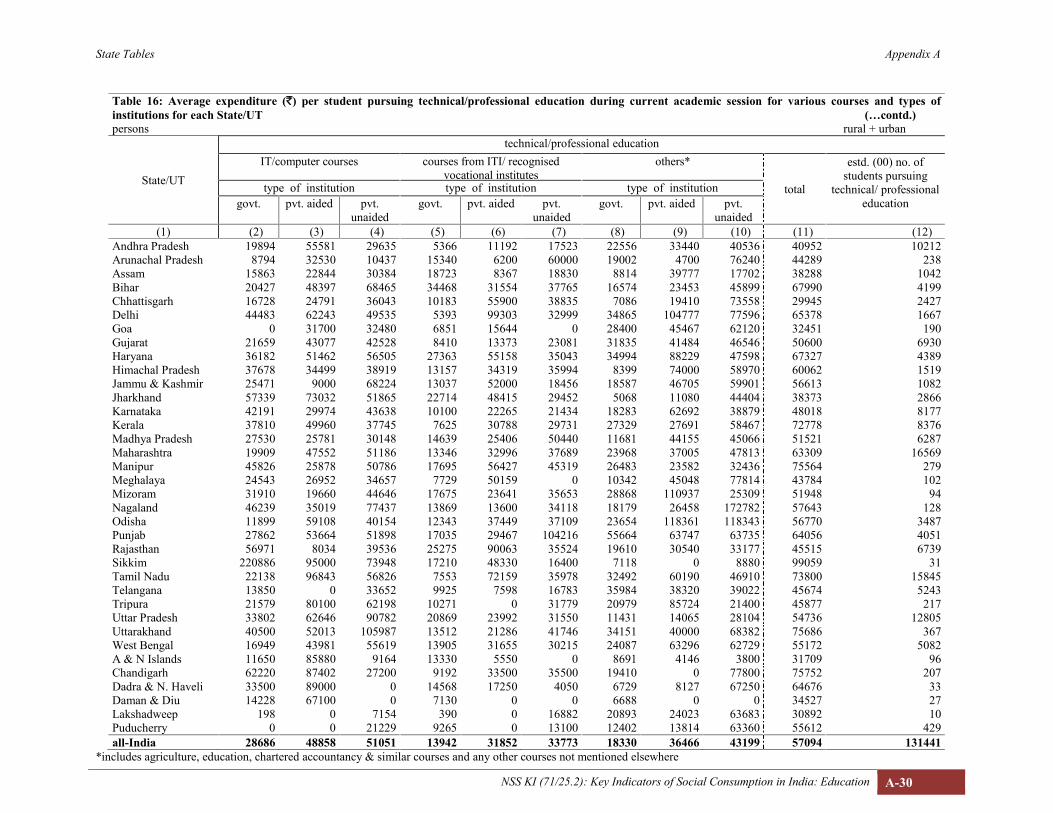
State Tables Appendix A
NSS KI (71/25.2): Key Indicators of Social Consumption in India: Education A-30
Table 16: Average expenditure (`) per student pursuing technical/professional education during current academic session for various courses and types ofinstitutions for each State/UT (…contd.)persons rural + urban
State/UT
technical/professional educationIT/computer courses courses from ITI/ recognised
vocational institutesothers*
total
estd. (00) no. ofstudents pursuing
technical/ professionaleducation
type of institution type of institution type of institutiongovt. pvt. aided pvt.
unaidedgovt. pvt. aided pvt.
unaidedgovt. pvt. aided pvt.
unaided(1) (2) (3) (4) (5) (6) (7) (8) (9) (10) (11) (12)
Andhra Pradesh 19894 55581 29635 5366 11192 17523 22556 33440 40536 40952 10212Arunachal Pradesh 8794 32530 10437 15340 6200 60000 19002 4700 76240 44289 238Assam 15863 22844 30384 18723 8367 18830 8814 39777 17702 38288 1042Bihar 20427 48397 68465 34468 31554 37765 16574 23453 45899 67990 4199Chhattisgarh 16728 24791 36043 10183 55900 38835 7086 19410 73558 29945 2427Delhi 44483 62243 49535 5393 99303 32999 34865 104777 77596 65378 1667Goa 0 31700 32480 6851 15644 0 28400 45467 62120 32451 190Gujarat 21659 43077 42528 8410 13373 23081 31835 41484 46546 50600 6930Haryana 36182 51462 56505 27363 55158 35043 34994 88229 47598 67327 4389Himachal Pradesh 37678 34499 38919 13157 34319 35994 8399 74000 58970 60062 1519Jammu & Kashmir 25471 9000 68224 13037 52000 18456 18587 46705 59901 56613 1082Jharkhand 57339 73032 51865 22714 48415 29452 5068 11080 44404 38373 2866Karnataka 42191 29974 43638 10100 22265 21434 18283 62692 38879 48018 8177Kerala 37810 49960 37745 7625 30788 29731 27329 27691 58467 72778 8376Madhya Pradesh 27530 25781 30148 14639 25406 50440 11681 44155 45066 51521 6287Maharashtra 19909 47552 51186 13346 32996 37689 23968 37005 47813 63309 16569Manipur 45826 25878 50786 17695 56427 45319 26483 23582 32436 75564 279Meghalaya 24543 26952 34657 7729 50159 0 10342 45048 77814 43784 102Mizoram 31910 19660 44646 17675 23641 35653 28868 110937 25309 51948 94Nagaland 46239 35019 77437 13869 13600 34118 18179 26458 172782 57643 128Odisha 11899 59108 40154 12343 37449 37109 23654 118361 118343 56770 3487Punjab 27862 53664 51898 17035 29467 104216 55664 63747 63735 64056 4051Rajasthan 56971 8034 39536 25275 90063 35524 19610 30540 33177 45515 6739Sikkim 220886 95000 73948 17210 48330 16400 7118 0 8880 99059 31Tamil Nadu 22138 96843 56826 7553 72159 35978 32492 60190 46910 73800 15845Telangana 13850 0 33652 9925 7598 16783 35984 38320 39022 45674 5243Tripura 21579 80100 62198 10271 0 31779 20979 85724 21400 45877 217Uttar Pradesh 33802 62646 90782 20869 23992 31550 11431 14065 28104 54736 12805Uttarakhand 40500 52013 105987 13512 21286 41746 34151 40000 68382 75686 367West Bengal 16949 43981 55619 13905 31655 30215 24087 63296 62729 55172 5082A & N Islands 11650 85880 9164 13330 5550 0 8691 4146 3800 31709 96Chandigarh 62220 87402 27200 9192 33500 35500 19410 0 77800 75752 207Dadra & N. Haveli 33500 89000 0 14568 17250 4050 6729 8127 67250 64676 33Daman & Diu 14228 67100 0 7130 0 0 6688 0 0 34527 27Lakshadweep 198 0 7154 390 0 16882 20893 24023 63683 30892 10Puducherry 0 0 21229 9265 0 13100 12402 13814 63360 55612 429all-India 28686 48858 51051 13942 31852 33773 18330 36466 43199 57094 131441
*includes agriculture, education, chartered accountancy & similar courses and any other courses not mentioned elsewhere

State Tables Appendix A
NSS KI (71/25.2): Key Indicators of Social Consumption in India: Education A-31
Table 17: Proportion (per 1000) of persons (age 5-29 years) dropping out/discontinuance and never-enrolled for each State/UT
State/UTrural urban rural + urban
dropping-out/discontinuance never enrolled dropping-
out/discontinuance never enrolled dropping-out/discontinuance never enrolled
male female male female male female male female male female male female(1) (2) (3) (4) (5) (6) (7) (8) (9) (10) (11) (12) (13)
Andhra Pradesh 389 399 73 120 392 414 28 49 390 404 59 97Arunachal Pradesh 217 216 71 130 217 331 33 39 217 234 65 115Assam 356 394 40 84 364 372 57 64 357 391 42 82Bihar 224 204 151 242 269 237 72 126 229 207 143 229Chhattisgarh 344 316 63 91 355 330 46 72 346 319 60 87Delhi 438 550 54 83 409 389 39 67 411 396 40 68Goa 544 361 84 37 385 271 0 62 435 312 27 51Gujarat 394 420 58 100 451 442 24 58 416 429 45 84Haryana 344 354 49 75 350 358 66 99 346 355 55 82Himachal Pradesh 296 326 13 19 441 380 0 24 313 331 12 19Jammu & Kashmir 280 242 39 81 350 334 41 39 293 259 40 73Jharkhand 279 247 86 186 412 338 22 59 305 266 73 160Karnataka 404 435 63 83 453 458 25 46 423 444 48 69Kerala 323 347 3 8 359 382 0 1 339 363 2 5Madhya Pradesh 372 309 76 189 394 363 32 61 378 322 65 158Maharashtra 373 438 39 51 405 473 32 24 387 453 36 40Manipur 265 394 28 64 207 296 25 32 247 361 27 54Meghalaya 368 390 39 39 318 275 1 70 359 370 32 45Mizoram 331 339 41 73 282 373 13 14 309 354 28 47Nagaland 283 364 31 33 356 376 1 20 300 367 24 30Odisha 423 424 58 99 403 366 73 122 420 414 60 103Punjab 394 380 42 57 404 375 20 62 398 378 34 59Rajasthan 278 275 93 221 311 303 75 153 286 282 89 203Sikkim 314 324 10 13 556 337 5 25 362 326 9 15Tamil Nadu 368 416 12 31 421 417 10 15 394 416 11 23Telangana 336 355 48 124 323 457 23 31 331 398 39 85Tripura 279 453 49 52 389 462 19 47 302 455 42 51Uttar Pradesh 285 258 112 189 326 285 119 147 294 264 114 180Uttarakhand 282 385 14 30 312 346 34 52 288 375 18 35West Bengal 389 362 79 98 406 429 37 52 394 380 67 85A & N Islands 533 368 14 52 358 313 26 12 458 348 19 37Chandigarh 424 359 102 135 421 349 16 96 420 350 20 98Dadra & N. Haveli 413 328 210 202 539 446 5 0 469 375 118 121Daman & Diu 461 436 18 66 597 584 203 2 580 551 180 16Lakshadweep 429 452 0 0 522 496 11 0 509 479 9 0Puducherry 470 497 24 0 431 456 41 50 446 470 34 33all-India 327 325 81 140 382 385 46 67 343 342 71 119
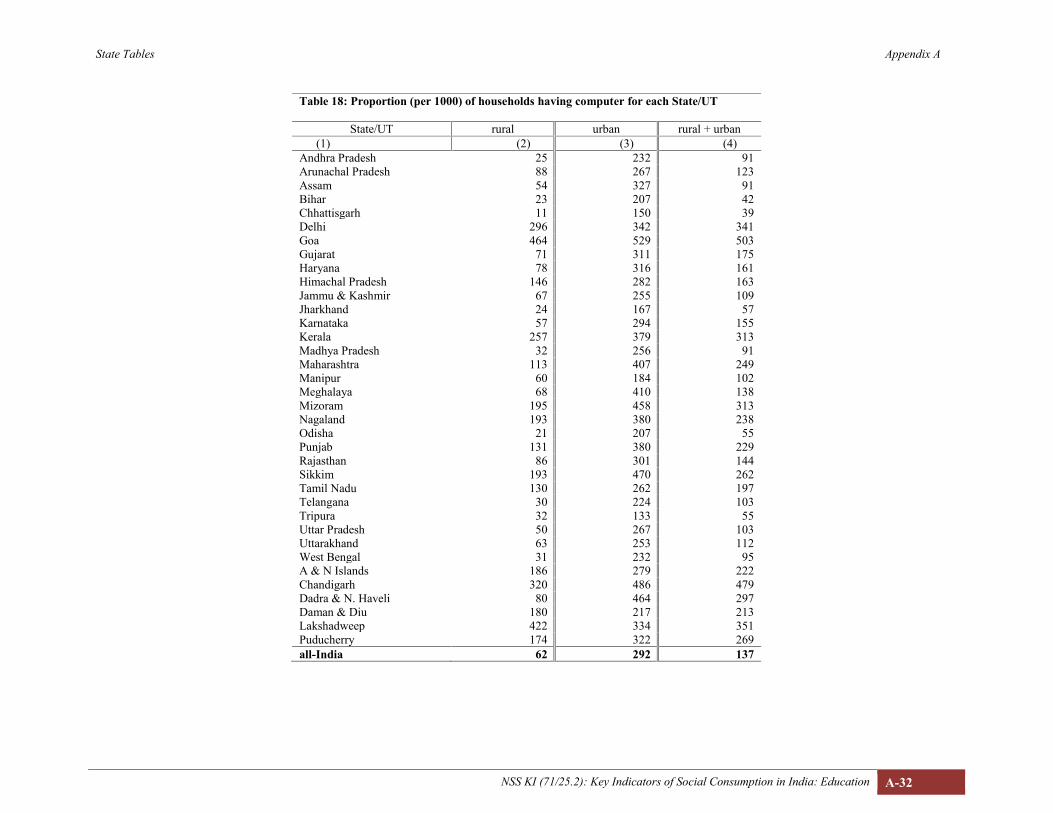
State Tables Appendix A
NSS KI (71/25.2): Key Indicators of Social Consumption in India: Education A-32
Table 18: Proportion (per 1000) of households having computer for each State/UT
State/UT rural urban rural + urban(1) (2) (3) (4)
Andhra Pradesh 25 232 91Arunachal Pradesh 88 267 123Assam 54 327 91Bihar 23 207 42Chhattisgarh 11 150 39Delhi 296 342 341Goa 464 529 503Gujarat 71 311 175Haryana 78 316 161Himachal Pradesh 146 282 163Jammu & Kashmir 67 255 109Jharkhand 24 167 57Karnataka 57 294 155Kerala 257 379 313Madhya Pradesh 32 256 91Maharashtra 113 407 249Manipur 60 184 102Meghalaya 68 410 138Mizoram 195 458 313Nagaland 193 380 238Odisha 21 207 55Punjab 131 380 229Rajasthan 86 301 144Sikkim 193 470 262Tamil Nadu 130 262 197Telangana 30 224 103Tripura 32 133 55Uttar Pradesh 50 267 103Uttarakhand 63 253 112West Bengal 31 232 95A & N Islands 186 279 222Chandigarh 320 486 479Dadra & N. Haveli 80 464 297Daman & Diu 180 217 213Lakshadweep 422 334 351Puducherry 174 322 269all-India 62 292 137

State Tables Appendix A
NSS KI (71/25.2): Key Indicators of Social Consumption in India: Education A-33
Table 19: Proportion (per 1000) of households (with at least one member of age 14 yearsand above) having access to internet facility for each State/UT
State/UT rural urban rural + urban(1) (2) (3) (4)
Andhra Pradesh 335 551 404Arunachal Pradesh 200 265 213Assam 99 395 139Bihar 57 295 81Chhattisgarh 25 249 70Delhi 429 484 483Goa 486 526 510Gujarat 171 413 276Haryana 214 503 315Himachal Pradesh 256 408 276Jammu & Kashmir 196 412 244Jharkhand 47 280 101Karnataka 158 487 293Kerala 513 621 562Madhya Pradesh 64 356 141Maharashtra 214 646 414Manipur 116 224 153Meghalaya 125 491 199Mizoram 224 450 325Nagaland 449 612 488Odisha 87 376 140Punjab 230 448 316Rajasthan 190 523 281Sikkim 250 608 339Tamil Nadu 342 559 452Telangana 132 400 233Tripura 57 145 77Uttar Pradesh 143 491 228Uttarakhand 146 526 245West Bengal 81 360 170A & N Islands 382 711 509Chandigarh 358 602 593Dadra & N. Haveli 101 532 345Daman & Diu 422 309 322Lakshadweep 561 759 719Puducherry 580 637 616all-India 161 487 267
Appendix BConcepts & Definitions

NSS KI (71/25.2): Key Indicators of Social Consumption in India: Education B-1
Appendix B
Concepts and Definitions
In order to ensure that uniform concepts are followed while collecting data of survey on ‘SocialConsumption: Education’, concepts and definitions for the items of enquiry were formulated.Important terms which are used in this document are explained below.
Students’ Hostel: A hostel is meant for providing accommodation to students, irrespective ofwhether run by any educational institution or not. A hostel, as distinct from a mess, is notmanaged by the students on a cooperative basis.
Household: A group of persons normally living together and taking food from a commonkitchen constitutes a household. It includes temporary stay-aways (those whose total period ofabsence from the household is expected to be less than 6 months) but excludes temporary visitorsand guests (expected total period of stay less than 6 months).
Exceptions
(a) Students residing in students’ hostels are considered as members of the household to which theybelonged before moving to the hostel irrespective of the period of absence from the householdthey belonged. Hence, they are not regarded as forming single-member households unlikeprevious rounds.
(b) Any woman who has undergone childbirth during last 365 days is considered a member of thehousehold which incurred the cost of childbirth irrespective of her place of residence during thelast 365 days.
(c) A child aged less than 1 year is considered a member of the household to which its motherbelongs.
Even though the determination of the actual composition of a household was left to the judgmentof the head of the household, the following procedures were adopted as guidelines.
(i) Each inmate (including residential staff) of a hostel, mess, hotel, boarding andlodging house, etc., constitutes a single-member household except students residingin students’ hostels. If, however, a group of persons among them normally pool theirincome for spending, they together are treated as forming a single household.
(ii) More emphasis is given on 'normally living together (with the exception of studentsstaying in students' hostels)’ than on 'ordinarily taking food from a common kitchen'.In case the place of residence of a person is different from the place of boarding, he orshe is treated as a member of the household with whom he or she resides.
(iii) A resident employee, or domestic servant, or a paying guest (but not just a tenant inthe household) is included in the employer’s/host’s household. However, in specialcase of a person taking food with his family but sleeping elsewhere (say, in a shop or

Concepts and Definitions
B-2 NSS KI (71/25.2): Key Indicators of Social Consumption in India: Education
a different house) due to space shortage, he has to be counted as a member of thehousehold formed by other members of his family.
(iv) If a member of a family (say, a son or a daughter of the head of the family) stayselsewhere for reasons other than study (i.e. other than student staying in students’hostel), he/she is not be considered as a member of his/her parent's household.
Household size: The size of a household is the total number of persons in the household,keeping in mind the exception for member of the household residing in a students’ hostel for thepurpose of study and any woman who has undergone childbirth during last 365 days. A childaged less than 1 year is considered a member of the household to which its mother belongs.
Household’s usual consumer expenditure (`) in a month: Household’s usual consumerexpenditure is the sum total of monetary values of all goods and services usually consumed (outof purchase or procured otherwise) by the household on domestic account during a month. Thishas the following components which are given below:
A. Usual expenditure for household purposes in a month.B. Purchase value of any household durables (mobile phones, TV sets, fridge, fans, cooler,
AC, vehicles, computers, furniture, kitchen equipment, etc.) purchased during the lastone year and the expenditure per month obtained by dividing by 12.
C. If any household consumption (usually) from (a) wages in kind (b) home-grown stock (c)free collection was there, then the approximate monthly value of the amount usuallyconsumed in a month was imputed.
Then the sum of A+B+C is taken as household’s usual consumer expenditure in a month inwhole number of rupees. Usual monthly per capita consumer expenditure (UMPCE) for ahousehold is the household’s usual consumer expenditure in a month divided by that householdsize.
Quintile class of UMPCE: A single set of UMPCE distribution (separately for rural and urban)was generated for each State/UT and at all-India level based on all the members of thehousehold. UMPCE quintile distribution, for a part of the population, say, persons with agegroup 5-29, 14 years and above, students etc. in a particular State/UT in rural/urban sector, wasassumed to be same as the UMPCE distribution of the entire population of that State inrural/urban sector. UMPCE distribution of households is same as the UMPCE distribution of thepersons belonging to those households.
Education: The term ‘education’ generally refers to developing knowledge, skill or character ofindividuals through a process of learning such as self-study, attendance in formal or informaleducational institutions, etc. For the purpose of this survey, ‘education’ covered the following:

Appendix B
NSS KI (71/25.2): Key Indicators of Social Consumption in India: Education B-3
I. School education commencing from class I to X or XII, as the case may be,irrespective of the recognition status of the educational institution,
II. Higher secondary / Pre-university education leading to certificate/ diploma/degree etc. It also included enrolment in private unrecognised institutions, whichhad regular classes and following the syllabus and pattern of the education as inrecognised schools or colleges and which sponsored students for publicexaminations as private or external candidates,
III. General University education, whether full time or part time, leading tocertificate/ diploma/ degree etc. The Universities not recognised by UniversityGrant Commission were not covered,
IV. Correspondence courses conducted by Universities, Deemed Universities orInstitutions authorised by competent authorities for awarding regular degrees ordiplomas or certificates,
V. Higher secondary / Pre-university / Under-graduate/ Post-graduate / Professional/Technical education leading to certificate/diploma/degree etc. conducted byrecognised open university/schools,
VI. Technical or Professional courses, leading to degree/diploma/certificates,conducted by Universities, Deemed Universities or institutes like, NationalInstitute of Fashion Technology, National School of Drama, Satyajit Ray Filmand Television Institute, Film and Television Institute of India,LokNayakJayaprakash Narayan National Institute of Criminology and ForensicScience, etc. or Institutions, authorised by competent authorities like All IndiaCouncil of Technical Education (AICTE), Medical Council of India (MCI) etc.,
VII. Professional courses conducted by Institutes like The Institute of CharteredAccountants of India, The Institute of Cost and Works Accountants of India, TheInstitute of Company Secretaries of India, Actuarial Society of India, etc.,
VIII. All types of courses of duration three months or more, conducted by Institutionslike Industrial Training Institute (ITI), National Vocational Training Institute,Regional Vocational Training Institutes, etc., authorised by competent authorities,
IX. All the courses at primary level and above, whether recognised or not, conductedby recognised educational institutions and not covered under above-mentionedcategories.
The following courses were specifically excluded from detailed canvassing:
Art, music and similar type of courses conducted by individuals in their houses orunrecognised/ unaffiliated institutions,Classes taken by Private tutors,Education in Nursery/Kindergartens/Preparatory levels except for their enrolment statusand dropout / discontinuance status,
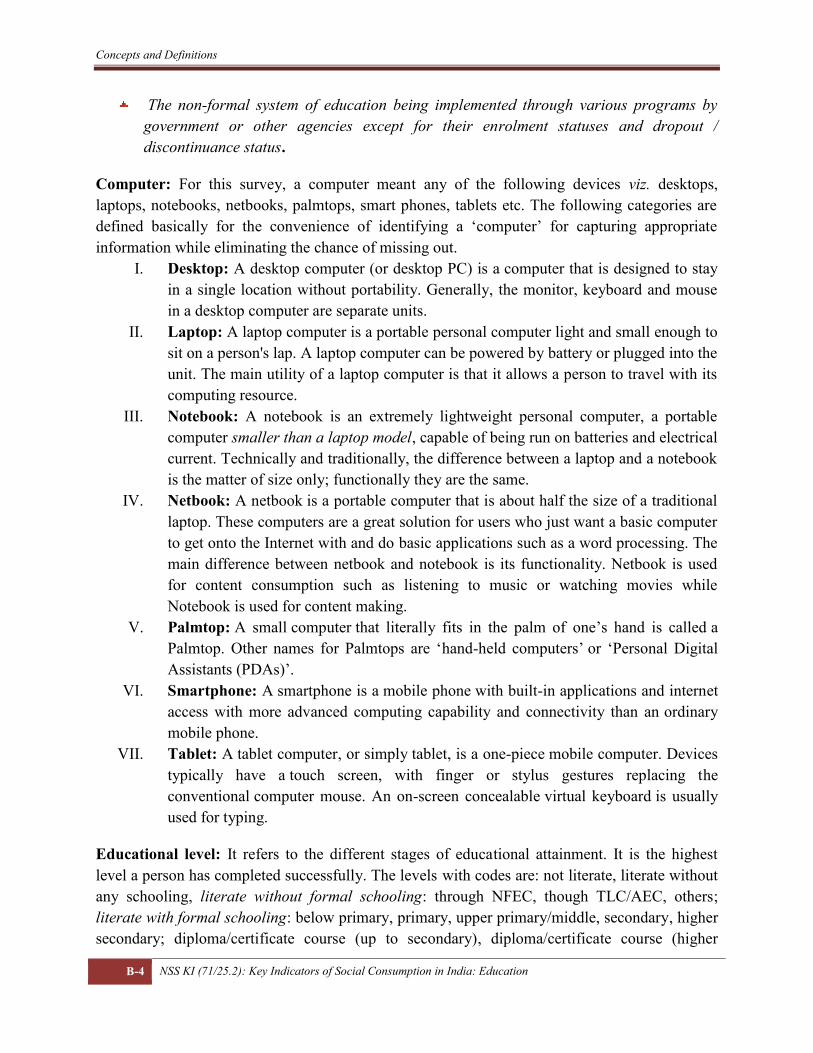
Concepts and Definitions
B-4 NSS KI (71/25.2): Key Indicators of Social Consumption in India: Education
The non-formal system of education being implemented through various programs bygovernment or other agencies except for their enrolment statuses and dropout /discontinuance status.
Computer: For this survey, a computer meant any of the following devices viz. desktops,laptops, notebooks, netbooks, palmtops, smart phones, tablets etc. The following categories aredefined basically for the convenience of identifying a ‘computer’ for capturing appropriateinformation while eliminating the chance of missing out.
I. Desktop: A desktop computer (or desktop PC) is a computer that is designed to stayin a single location without portability. Generally, the monitor, keyboard and mousein a desktop computer are separate units.
II. Laptop: A laptop computer is a portable personal computer light and small enough tosit on a person's lap. A laptop computer can be powered by battery or plugged into theunit. The main utility of a laptop computer is that it allows a person to travel with itscomputing resource.
III. Notebook: A notebook is an extremely lightweight personal computer, a portablecomputer smaller than a laptop model, capable of being run on batteries and electricalcurrent. Technically and traditionally, the difference between a laptop and a notebookis the matter of size only; functionally they are the same.
IV. Netbook: A netbook is a portable computer that is about half the size of a traditionallaptop. These computers are a great solution for users who just want a basic computerto get onto the Internet with and do basic applications such as a word processing. Themain difference between netbook and notebook is its functionality. Netbook is usedfor content consumption such as listening to music or watching movies whileNotebook is used for content making.
V. Palmtop: A small computer that literally fits in the palm of one’s hand is called aPalmtop. Other names for Palmtops are ‘hand-held computers’ or ‘Personal DigitalAssistants (PDAs)’.
VI. Smartphone: A smartphone is a mobile phone with built-in applications and internetaccess with more advanced computing capability and connectivity than an ordinarymobile phone.
VII. Tablet: A tablet computer, or simply tablet, is a one-piece mobile computer. Devicestypically have a touch screen, with finger or stylus gestures replacing theconventional computer mouse. An on-screen concealable virtual keyboard is usuallyused for typing.
Educational level: It refers to the different stages of educational attainment. It is the highestlevel a person has completed successfully. The levels with codes are: not literate, literate withoutany schooling, literate without formal schooling: through NFEC, though TLC/AEC, others;literate with formal schooling: below primary, primary, upper primary/middle, secondary, highersecondary; diploma/certificate course (up to secondary), diploma/certificate course (higher

Appendix B
NSS KI (71/25.2): Key Indicators of Social Consumption in India: Education B-5
secondary), diploma/certificate course (graduation & above), graduate, postgraduate and above.If a person has successfully passed the final year of a given level, then and only then he/she wasconsidered to have attained that level of education. For example, for a person studying in ClassIX the educational level will be upper primary and not secondary.
Level of current attendance: In this case, the current educational level where a student ispursuing his current education is considered. Here the levels are: never attended, ever attendedbut currently not attending, currently attending in: NFEC, TLC/AEC, other non-formaleducation, pre-primary (nursery/ Kindergarten, etc., primary (class I to V), upperprimary/middle, secondary, higher secondary, diploma/certificate course (up to secondary),diploma/certificate course (higher secondary), diploma/certificate course (graduation & above),graduate, postgraduate and above.
Literate: A person is considered literate if he/she can read and write a simple message in at leastone language with understanding.
School education levels: A uniform pattern across the country for the number of years ofschooling at primary level, upper primary/middle level, secondary level and a higher secondarylevel is yet to be achieved. However, for this survey, the primary level refers to Classes I-V, theupper primary/middle to Classes VI-VIII, the secondary to Classes IX-X and the highersecondary to Classes XI-XII.
Type of Education: Education was broadly divided into two categories: (i) general educationand (ii) technical / professional education.
General education: In this survey, it included general school education from the primary to thehigher secondary level, normal university education for a degree.
Technical/professional education: Technical/professional courses involve the hands on trainingin addition to theoretical classes. Education in engineering, medicine, agriculture, management,chartered accountancy, cost accountancy, art, music, driving, pilot training etc are examples oftechnical/ professional courses.
Vocational Courses: For the purpose of this survey, vocational courses were not definedseparately from the technical/professional courses. Any technical/ professional course with thelevel of current attendance as secondary or below or diploma/certificate course (up tosecondary) was considered as vocational course. However, courses offered by IndustrialTraining Institute (ITI), National Vocational Training Institute, Regional Vocational TrainingInstitutes etc. were considered as vocational courses.
Student: For the purpose of this survey, a household member was considered as student if hewas aged between 5 to 29 years and currently attending a course at primary level and above.

Concepts and Definitions
B-6 NSS KI (71/25.2): Key Indicators of Social Consumption in India: Education
Course: A course is (i) a structured educational programme having a specified syllabus,duration, level, etc. and (ii) necessarily involves appearing in some kind ofexamination/performance appraisal for getting the degree/diploma/certificate or advancing to thenext class/level. Depending upon the subjects covered and the mode of instruction, the courseswere categorised broadly as (a) general and (b) technical/professional. For the purpose of thissurvey, only those courses covered under the definition of ‘education’ in earlier paragraph wereconsidered.
Basic course: When a particular student was undertaking more than one course, the basic coursewas identified as per following criteria –
If an individual was pursuing more than one course then the course, which was inthe highest level, was considered as the basic course.If all the courses simultaneously pursued currently were in the same level then thecourse of the general education was the basic courseIn absence of any general education, the course, which involved higher cost, wastaken as the basic course.If a person was enrolled both in regular course and course through distance learningthen regular course was treated as the basic course irrespective of the cost involved.
Academic session: The academic session was defined in relation to the duration of the basiccourse in which he/she was enrolled and attending in the following manner –
i) If duration of the course was less than one year, the academic session covered fullduration of the course,
ii) If duration of the course was equal to or more than one year, then the academicsession was considered as one-year.
iii) For the educational institutions pursuing three to six months semester system,academic session was still taken as one year if the duration of the course wasequal to or more than one year.
Current academic session: This referred to the academic session relating to the basic course,the student was currently attending.
Type of institution: This referred to the type of management by which the institution was run.It may be run by Government (Central/State/Local) or a private body either receiving or notreceiving government aid. Thus, the types were: (a) Government, (b) Private aided and (c)Private unaided. It may be noted that a government institution may be run either by thegovernment directly or through a governing body/managing committee, etc. set-up by thegovernment. A private aided institution was one, which was run by an individual or a privateorganisation and received maintenance grant from a government. A private unaided institution
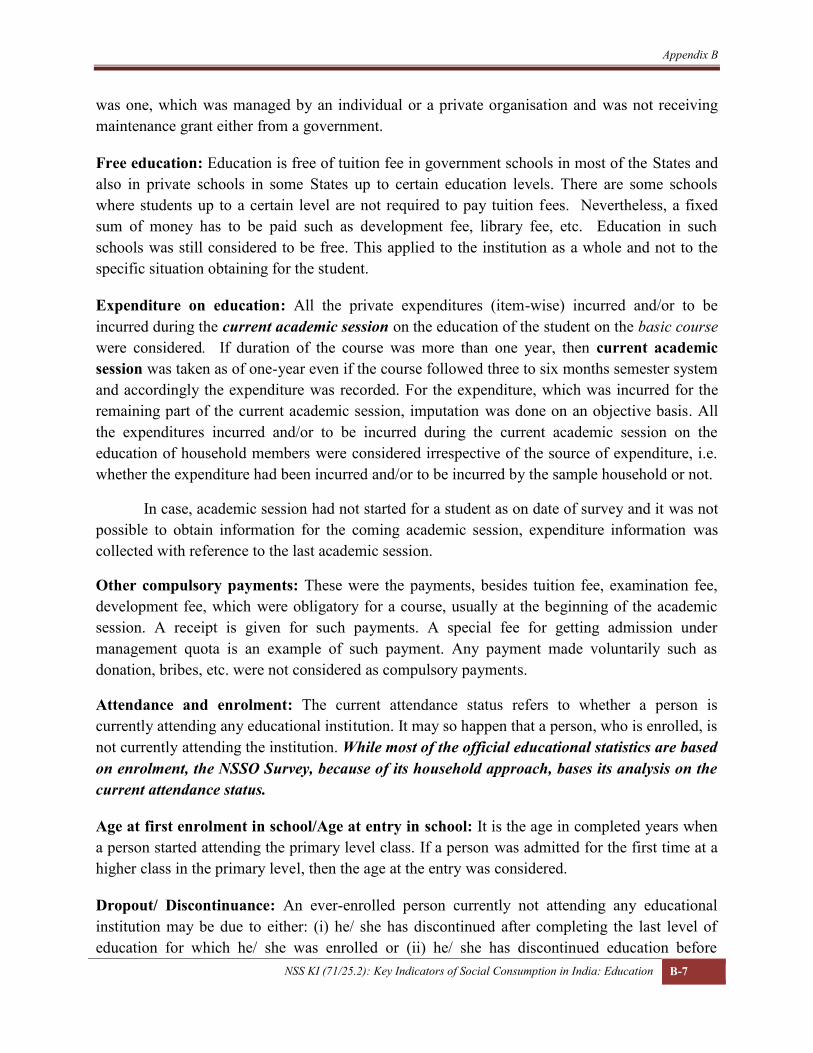
Appendix B
NSS KI (71/25.2): Key Indicators of Social Consumption in India: Education B-7
was one, which was managed by an individual or a private organisation and was not receivingmaintenance grant either from a government.
Free education: Education is free of tuition fee in government schools in most of the States andalso in private schools in some States up to certain education levels. There are some schoolswhere students up to a certain level are not required to pay tuition fees. Nevertheless, a fixedsum of money has to be paid such as development fee, library fee, etc. Education in suchschools was still considered to be free. This applied to the institution as a whole and not to thespecific situation obtaining for the student.
Expenditure on education: All the private expenditures (item-wise) incurred and/or to beincurred during the current academic session on the education of the student on the basic coursewere considered. If duration of the course was more than one year, then current academicsession was taken as of one-year even if the course followed three to six months semester systemand accordingly the expenditure was recorded. For the expenditure, which was incurred for theremaining part of the current academic session, imputation was done on an objective basis. Allthe expenditures incurred and/or to be incurred during the current academic session on theeducation of household members were considered irrespective of the source of expenditure, i.e.whether the expenditure had been incurred and/or to be incurred by the sample household or not.
In case, academic session had not started for a student as on date of survey and it was notpossible to obtain information for the coming academic session, expenditure information wascollected with reference to the last academic session.
Other compulsory payments: These were the payments, besides tuition fee, examination fee,development fee, which were obligatory for a course, usually at the beginning of the academicsession. A receipt is given for such payments. A special fee for getting admission undermanagement quota is an example of such payment. Any payment made voluntarily such asdonation, bribes, etc. were not considered as compulsory payments.
Attendance and enrolment: The current attendance status refers to whether a person iscurrently attending any educational institution. It may so happen that a person, who is enrolled, isnot currently attending the institution. While most of the official educational statistics are basedon enrolment, the NSSO Survey, because of its household approach, bases its analysis on thecurrent attendance status.
Age at first enrolment in school/Age at entry in school: It is the age in completed years whena person started attending the primary level class. If a person was admitted for the first time at ahigher class in the primary level, then the age at the entry was considered.
Dropout/ Discontinuance: An ever-enrolled person currently not attending any educationalinstitution may be due to either: (i) he/ she has discontinued after completing the last level ofeducation for which he/ she was enrolled or (ii) he/ she has discontinued education before

Concepts and Definitions
B-8 NSS KI (71/25.2): Key Indicators of Social Consumption in India: Education
attaining a specific level. For the first category, for example, if a person had completed themiddle level but did not enrol for the next higher level of education, he/ she was not consideredas a dropout. It was considered as a case of discontinuation. However, if the person enrolled forthe secondary level but did not complete it, then he/ she was considered a dropout. For thepurpose of this survey, both the types were treated alike for recording information.
In block 7 of the schedule, the level refers to the last enrolment level of the householdmember.
Some concepts/ indicators used in the KI document:
Literacy rate: Percentage of literates in a population is taken as its literacy rate.
Gross attendance ratio (GAR): For each class-group, this is the ratio of the number of personsin the class-group to the number persons in the corresponding official age-group. For example,for Class group I-V the ratio (in %), corresponding to normative age-group of 6-10, is
= Number of persons attending Classes I-V × 100Estimated population in the age-group 6-10 years
For the remaining class-groups of school education, i.e. VI-VIII, IX-X and XI-XII, thecorresponding official age-groups were taken as 11-13, 14-15 and 16-17 respectively.
Age-specific attendance ratio: For each age-group this measure gives an idea of proportion ofpersons of a particular age-group currently attending educational institutions, irrespective of thelevel or class in which they are studying. For example, for age-group 6-10, this attendance ratiois
= Number of persons in age-group 6-10 currently attending educational institutions × 100Estimated population in the age-group 6-10 years
Net attendance ratio: For each education class-group, this is the ratio of the number of personsin the official age-group attending a particular class-group to the total number persons in the age-group. For example, for Class group I-V the ratio (in %) is
= Number of persons of age 6-10 years currently attending Classes I-V × 100Estimated population in the age-group 6-10 years
Similarly it can be obtained for the remaining class-groups of school education, i.e. VI-VIII, IX-X and XI-XII, with the corresponding official age-groups as 11-13, 14-15 and 16-17respectively.

Appendix CNote on Sample Design and Estimation
Procedure

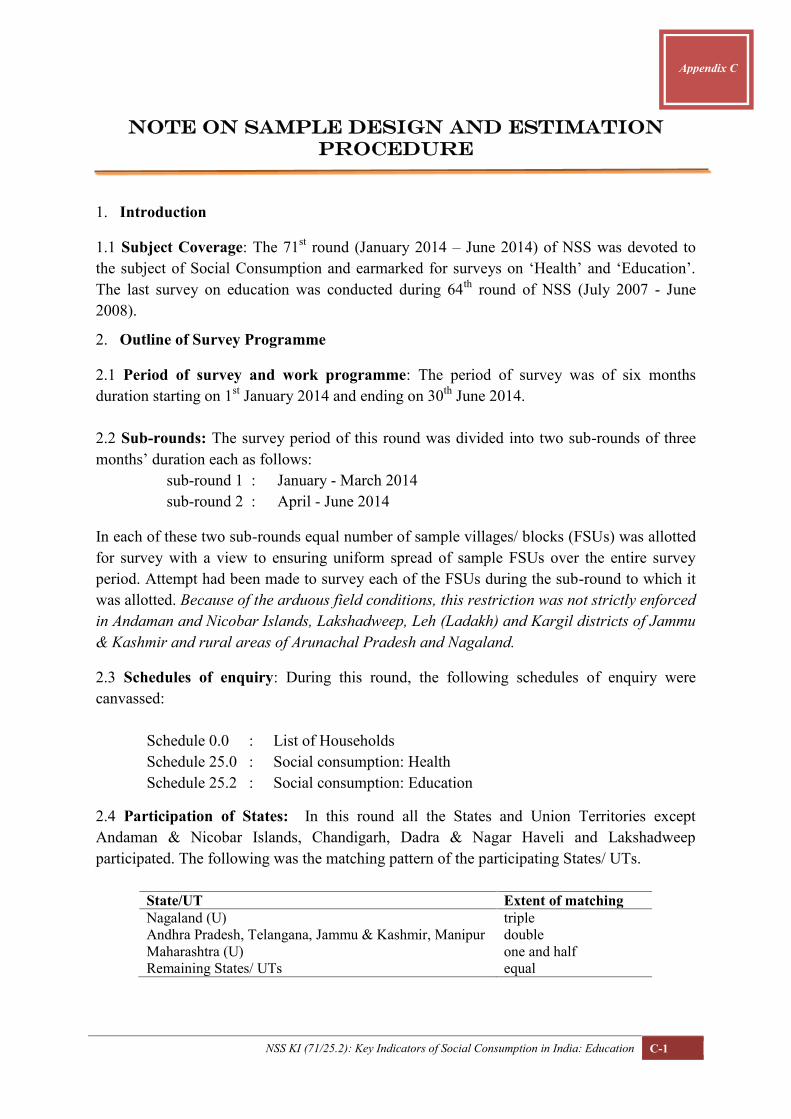
NSS KI (71/25.2): Key Indicators of Social Consumption in India: Education C-1
Appendix C
Note on Sample Design and EstimationProcedure
1. Introduction
1.1 Subject Coverage: The 71st round (January 2014 – June 2014) of NSS was devoted tothe subject of Social Consumption and earmarked for surveys on ‘Health’ and ‘Education’.The last survey on education was conducted during 64th round of NSS (July 2007 - June2008).
2. Outline of Survey Programme
2.1 Period of survey and work programme: The period of survey was of six monthsduration starting on 1st January 2014 and ending on 30th June 2014.
2.2 Sub-rounds: The survey period of this round was divided into two sub-rounds of threemonths’ duration each as follows:
sub-round 1 : January - March 2014sub-round 2 : April - June 2014
In each of these two sub-rounds equal number of sample villages/ blocks (FSUs) was allottedfor survey with a view to ensuring uniform spread of sample FSUs over the entire surveyperiod. Attempt had been made to survey each of the FSUs during the sub-round to which itwas allotted. Because of the arduous field conditions, this restriction was not strictly enforcedin Andaman and Nicobar Islands, Lakshadweep, Leh (Ladakh) and Kargil districts of Jammu& Kashmir and rural areas of Arunachal Pradesh and Nagaland.
2.3 Schedules of enquiry: During this round, the following schedules of enquiry werecanvassed:
Schedule 0.0 : List of HouseholdsSchedule 25.0 : Social consumption: HealthSchedule 25.2 : Social consumption: Education
2.4 Participation of States: In this round all the States and Union Territories exceptAndaman & Nicobar Islands, Chandigarh, Dadra & Nagar Haveli and Lakshadweepparticipated. The following was the matching pattern of the participating States/ UTs.
State/UT Extent of matchingNagaland (U) tripleAndhra Pradesh, Telangana, Jammu & Kashmir, Manipur doubleMaharashtra (U) one and halfRemaining States/ UTs equal

Notes on Sample Design and Estimation Procedure
C-2 NSS KI (71/25.2): Key Indicators of Social Consumption in India: Education
3. Sample Design
3.1 Outline of sample design: A stratified multi-stage design was adopted for the 71st roundsurvey. The first stage units (FSU) were the census villages (Panchayat wards in case ofKerala) in the rural sector and Urban Frame Survey (UFS) blocks in the urban sector. Theultimate stage units (USU) were households in both the sectors. In case of large FSUs, oneintermediate stage of sampling was the selection of two hamlet-groups (hgs)/ sub-blocks (sbs)from each rural/ urban FSU.
3.2 Sampling Frame for First Stage Units: For the rural sector, the list of 2011 censusvillages (henceforth the term ‘village’ would mean Panchayat wards for Kerala) constitutedthe sampling frame. In case of Kerala, due to non-availability of Panchayat wards based onCensus 2011, the available list of Panchayat wards based on Census 2001 was used as therural frame. For the urban sector, the latest updated list of UFS blocks (phase 2007-12) wasconsidered as the sampling frame.
3.3 Stratification: Stratum had been formed at district level. Within each district of aState/UT, generally speaking, two basic strata were formed: (i) rural stratum comprising ofall rural areas of the district and (ii) urban stratum comprising of all the urban areas of thedistrict. However, within the urban areas of a district, if there were one or more towns withpopulation of 1 lakh or more as per Census 2011, each of them formed a separate basicstratum and the remaining urban areas of the district had been considered as another basicstratum.
3.3.1Special stratum in the rural sector: There are some villages in Nagaland andAndaman & Nicobar Islands which remain difficult to access. As in earlier rounds, a specialstratum was formed at State/UT level comprising these villages.
3.4 Sub-stratification:
3.4.1 Rural sector: If ‘r’ be the sample size allocated for a rural stratum, the number of sub-strata formed was ‘r/2’. The villages within a district as per frame were first arranged inascending order of population. Then sub-strata 1 to ‘r/2’ were demarcated in such a way thateach sub-stratum comprised a group of villages of the arranged frame and had more or lessequal population.
3.4.2 Urban sector: If ‘u’ be the sample size allocated for an urban stratum, the number ofsub-strata formed was ‘u/2’. For all strata, if u/2 >1, implying formation of 2 or more sub-strata, all the UFS blocks within the stratum were first arranged in ascending order of totalnumber of households in the UFS Blocks as per UFS phase 2007-12. Then sub-strata 1 to‘u/2’ were demarcated in such a way that each sub-stratum had more or less equal number ofhouseholds.
3.5 Total sample size (FSUs): 8300 FSUs were allocated for the central sample at all-Indialevel.
3.6 Allocation of total sample to States and UTs: The total number of sample FSUs wereallocated to the States and UTs in proportion to population as per Census 2011 subject to a

Appendix C
NSS KI (71/25.2): Key Indicators of Social Consumption in India: Education C-3
minimum sample allocation to each State/ UT. While doing so, the resource availability interms of number of field investigators was kept in view.
3.7 Allocation of State/ UT level sample to rural and urban sectors: State/UT levelsample size was allocated between two sectors in proportion to population as per Census2011 with double weightage to urban sector subject to the restriction that urban sample sizefor bigger states like Maharashtra, Tamil Nadu etc. did not exceed the rural sample size. Aminimum of 16 FSUs (minimum 8 each for rural and urban sector separately) were allocatedto each State/ UT.
3.8 Allocation to strata: Within each sector of a State/ UT, the respective sample size wasallocated to the different strata in proportion to the population as per Census 2011. Stratumlevel allocation was adjusted to multiples of 2 with a minimum sample size of 2.
For special strata in the rural areas of Nagaland and A & N Islands, 4 FSUs were allocated toeach.
3.9 Allocation to sub-strata: Allocation for each sub-stratum was 2 in both rural and urbansectors.
3.10 Selection of FSUs:
For the rural sector, from each stratum/sub-stratum, required number of sample villages wasselected by Probability Proportional to Size With Replacement (PPSWR), size being thepopulation of the village as per Census 2011.
For the urban sector, from each stratum/sub-stratum, FSUs were selected by ProbabilityProportional to Size With Replacement (PPSWR), size being the number of households of theUFS Blocks.
Both rural and urban samples were drawn in the form of two independent sub-samples andequal number of samples was allocated among the two sub rounds.
3.11 Selection of hamlet-groups/ sub-blocks - important steps
3.11.1 Criterion for hamlet-group/ sub-block formation: After identification of theboundaries of the FSU, it was determined whether listing will be done in the whole sampleFSU or not. In case the approximate present population of the selected FSU was found to be1200 or more, it was divided into a suitable number (say, D) of ‘hamlet-groups’ in the ruralsector and ‘sub-blocks’ in the urban sector by more or less equalising the population as statedbelow.
approximate present population of the sample FSU no. of hg’s/sb’s to be formed
less than 1200 (no hamlet-groups/sub-blocks) 11200 to 1799 31800 to 2399 42400 to 2999 53000 to 3599 6.......and so on -

Notes on Sample Design and Estimation Procedure
C-4 NSS KI (71/25.2): Key Indicators of Social Consumption in India: Education
For rural areas of Himachal Pradesh, Sikkim, Uttarakhand (except four districts Dehradun,Nainital, Hardwar and Udham Singh Nagar),Poonch, Rajouri, Udhampur, Reasi, Doda,Kistwar, Ramban, Leh (Ladakh), Kargil districts of Jammu and Kashmir and Idukki districtof Kerala, the number of hamlet-groups were formed as follows:
approximate present population of the sample village no. of hg’s to be formed
less than 600 (no hamlet-groups) 1600 to 899 3900 to 1199 41200 to 1499 51500 to 1799 6.…..and so on -
3.11.2 Formation and selection of hamlet-groups/ sub-blocks: In case hamlet-groups/ sub-blocks are to be formed in the sample FSU, the same was done by more or less equalizingpopulation. Note that while doing so, it was ensured that the hamlet-groups/ sub-blocksformed were clearly identifiable in terms of physical landmarks.Two hamlet-groups (hg)/ sub-blocks (sb) were selected from a large FSU wherever hamlet-groups/ sub-blocks were formed in the following manner – one hg/ sb with maximumpercentage share of population was always selected and termed as hg/ sb1; one more hg/ sbwas selected from the remaining hg’s/ sb’s by simple random sampling (SRS) and termed ashg/ sb2. Listing and selection of the households was done independently in the two selectedhamlet-groups/ sub-blocks. The FSUs without hg/ sb formation was treated as sample hg/ sbnumber 1.
3.12 Formation of second stage strata and allocation of households:
Three SSS were formed for Schedule 25.2 as per following criteria:
SSS composition of SSS within a sample FSU
number of households surveyed
FSU withouthg/sb formation
FSU with hg/sbformation
(for each hg/sb)
SSS 1 households with at least one student receivingtechnical/professional education
2 1
SSS 2 from the remaining, households having at leastone student receiving general education
4 2
SSS 3 other households 2 1
3.13 Selection of households: From each SSS, the sample households were selected bySRSWOR.

Appendix C
NSS KI (71/25.2): Key Indicators of Social Consumption in India: Education C-5
4. Estimation Procedure
4.1 Notations:s = subscript for s-th stratumt = subscript for t-th sub-stratumm = subscript for sub-sample (m =1, 2)i = subscript for i-th FSU [village (panchayat ward)/ block]d = subscript for a hamlet-group/ sub-block (d = 1, 2)j = subscript for j-th second stage stratum in an FSU/ hg/sb [ j = 1, 2 or 3]
k = subscript for k-th sample household under a particular second stage stratum within anFSU/ hg/sb
D = total number of hg’s/ sb’s formed in the sample FSU
D* = (D – 1) for FSUs with D ≥ 1
Z = total size of a rural/urban sub-stratum (= sum of sizes for all the FSUs of a sub-stratum)z = size of sample village/UFS block used for selection.n = number of sample FSUs surveyed including ‘uninhabitated’ and ‘zero cases’ but
excluding casualty for a particular sub-sample and sub-stratum.H = total number of households listed in a second-stage stratum of an FSU / hamlet-group or
sub-block of sample FSUh = number of households surveyed in a second-stage stratum of an FSU / hamlet-group or
sub-block of sample FSUx, y = observed value of characteristics x, y under estimation
X , Y = estimate of population total X, Y for the characteristics x, y
Under the above symbols,
ystmidjk = observed value of the characteristic y for the k-th household in the j-th second stagestratum of the d-th hg/ sb (d = 1, 2) of the i-th FSU belonging to the m-th sub-sample for thet-th sub-stratum of s-th stratum.
However, for ease of understanding, a few symbols have been suppressed in followingparagraphs where they are obvious.
4.2 Formulae for Estimation of Aggregates for a particular sub-sample and stratum sub-stratum:
4.2.1 Schedule 25.2:4.2.1.1 Rural/ Urban:
(i) For j-th second-stage stratum of a stratum sub-stratum:
j
i
h
kjki
ji
jii
h
kjki
ji
ji
ijj
ny
hH
DyhH
znZY
jiji
1 12
2
2*
11
1
1211ˆ

Notes on Sample Design and Estimation Procedure
C-6 NSS KI (71/25.2): Key Indicators of Social Consumption in India: Education
(ii) For all second-stage strata combined:
j
jYY ˆˆ
4.3 Overall Estimate for Aggregates for a sub-stratum:
Overall estimate for aggregates for a sub-stratum ( stY ) based on two sub-samples in a sub-
stratum is obtained as:
2 ˆ
21ˆ
1mstmst YY
4.4 Overall Estimate for Aggregates for a stratum:
Overall estimate for a stratum ( sY ) will be obtained as
t
sts YY ˆˆ
4.5 Overall Estimate of Aggregates at State/UT/all-India level:
The overall estimate Y at the State/ UT/ all-India level is obtained by summing the
stratum estimates sY over all strata belonging to the State/ UT/ all-India.
4.6 Estimates of Ratios:
Let Y and X be the overall estimates of the aggregates Y and X for two
characteristics y and x respectively at the State/ UT/ all-India level.
Then the combined ratio estimate )ˆ(R of the ratio )(XYR will be obtained as
XY
R ˆˆ
ˆ .
4.7 Estimates of Error: The estimated variances of the above estimates will be as follows:
4.7.1For aggregateY :
s t
sts
s YraVYraVYraV )ˆ(ˆ)ˆ(ˆ)ˆ(ˆ where )ˆ(ˆ stYraV is given by
221ˆˆ
41ˆˆ ststst YYYrVa , where 1stY and 2stY are the estimates for sub-sample 1 and
sub-sample 2 respectively for stratum ‘s’ and sub-stratum ‘t’.
4.7.2 For ratio R :
s tstststststststst XXYYRXXRYY
XRESM 2121
2
2122
212ˆˆˆˆˆ2ˆˆˆˆˆ
ˆ41)ˆ(ˆ
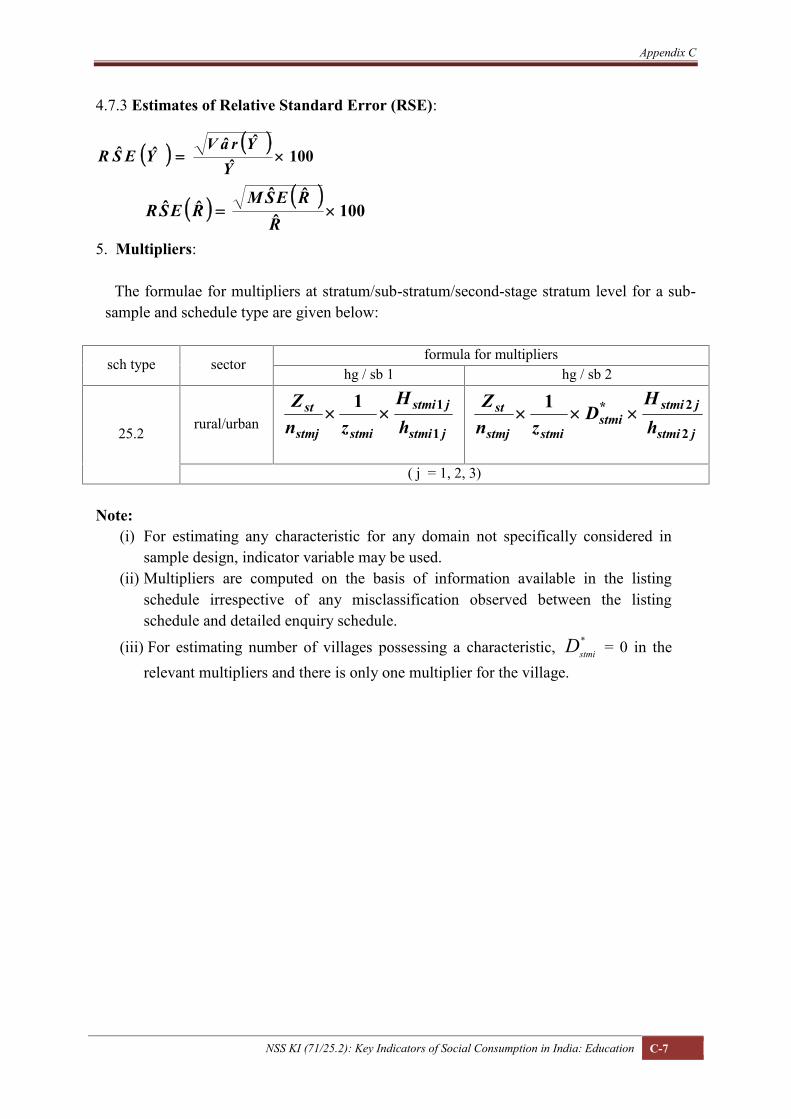
Appendix C
NSS KI (71/25.2): Key Indicators of Social Consumption in India: Education C-7
4.7.3 Estimates of Relative Standard Error (RSE):
100ˆ
ˆˆˆˆ Y
YraVYESR
100ˆ
ˆˆˆˆ
RRESM
RESR
5. Multipliers:
The formulae for multipliers at stratum/sub-stratum/second-stage stratum level for a sub-sample and schedule type are given below:
sch type sectorformula for multipliers
hg / sb 1 hg / sb 2
25.2rural/urban
jstmi
jstmi
stmistmj
sthH
znZ
1
11
jstmi
jstmistmi
stmistmj
sthH
Dzn
Z2
2*1
( j = 1, 2, 3)
Note:(i) For estimating any characteristic for any domain not specifically considered in
sample design, indicator variable may be used.(ii) Multipliers are computed on the basis of information available in the listing
schedule irrespective of any misclassification observed between the listingschedule and detailed enquiry schedule.
(iii) For estimating number of villages possessing a characteristic, *stmiD = 0 in the
relevant multipliers and there is only one multiplier for the village.
Appendix DSchedule 25.2: Social Consumption: Education

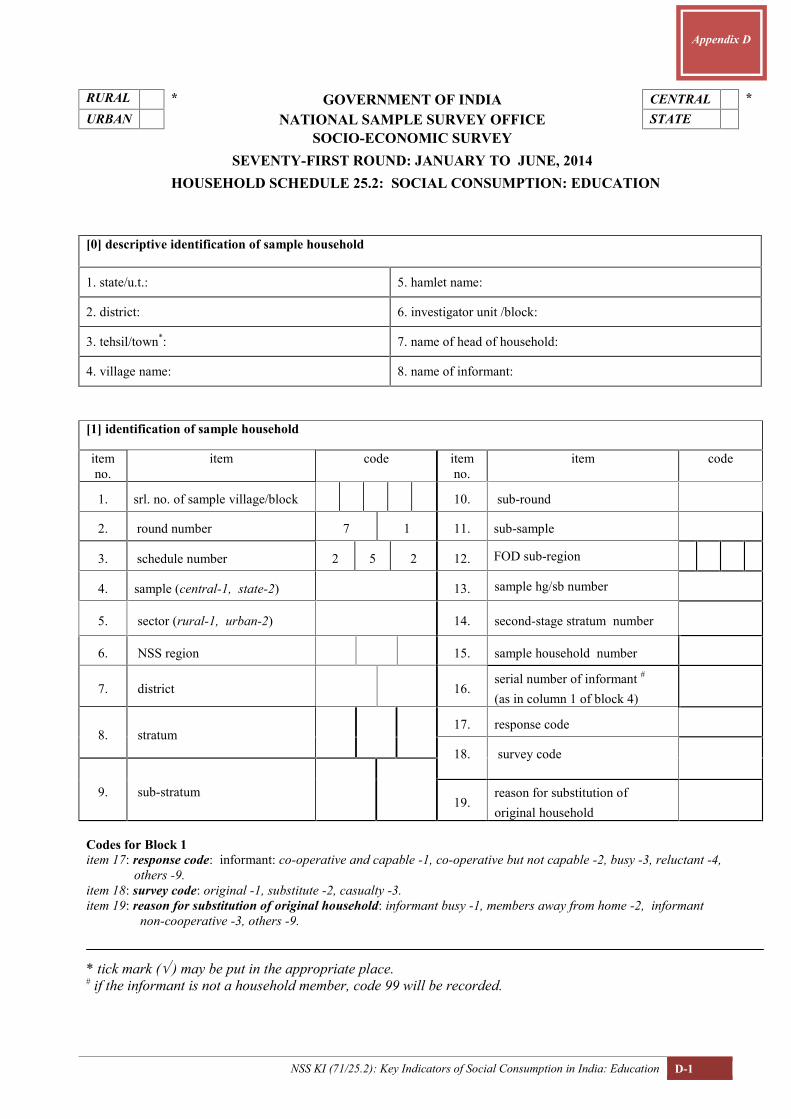
NSS KI (71/25.2): Key Indicators of Social Consumption in India: Education D-1
Appendix D
[1] identification of sample household
itemno.
item code itemno.
item code
1. srl. no. of sample village/block 10. sub-round
2. round number 7 1 11. sub-sample
3. schedule number 2 5 2 12. FOD sub-region
4. sample (central-1, state-2) 13. sample hg/sb number
5. sector (rural-1, urban-2) 14. second-stage stratum number
6. NSS region 15. sample household number
7. district 16.serial number of informant #
(as in column 1 of block 4)
8. stratum17. response code
18. survey code
9. sub-stratum19.
reason for substitution oforiginal household
Codes for Block 1item 17: response code: informant: co-operative and capable -1, co-operative but not capable -2, busy -3, reluctant -4,
others -9.item 18: survey code: original -1, substitute -2, casualty -3.item 19: reason for substitution of original household: informant busy -1, members away from home -2, informant
non-cooperative -3, others -9.
* tick mark ( ) may be put in the appropriate place.# if the informant is not a household member, code 99 will be recorded.
RURAL * GOVERNMENT OF INDIA CENTRAL *URBAN NATIONAL SAMPLE SURVEY OFFICE STATE
SOCIO-ECONOMIC SURVEYSEVENTY-FIRST ROUND: JANUARY TO JUNE, 2014
HOUSEHOLD SCHEDULE 25.2: SOCIAL CONSUMPTION: EDUCATION
[0] descriptive identification of sample household
1. state/u.t.: 5. hamlet name:
2. district: 6. investigator unit /block:
3. tehsil/town*: 7. name of head of household:
4. village name: 8. name of informant:
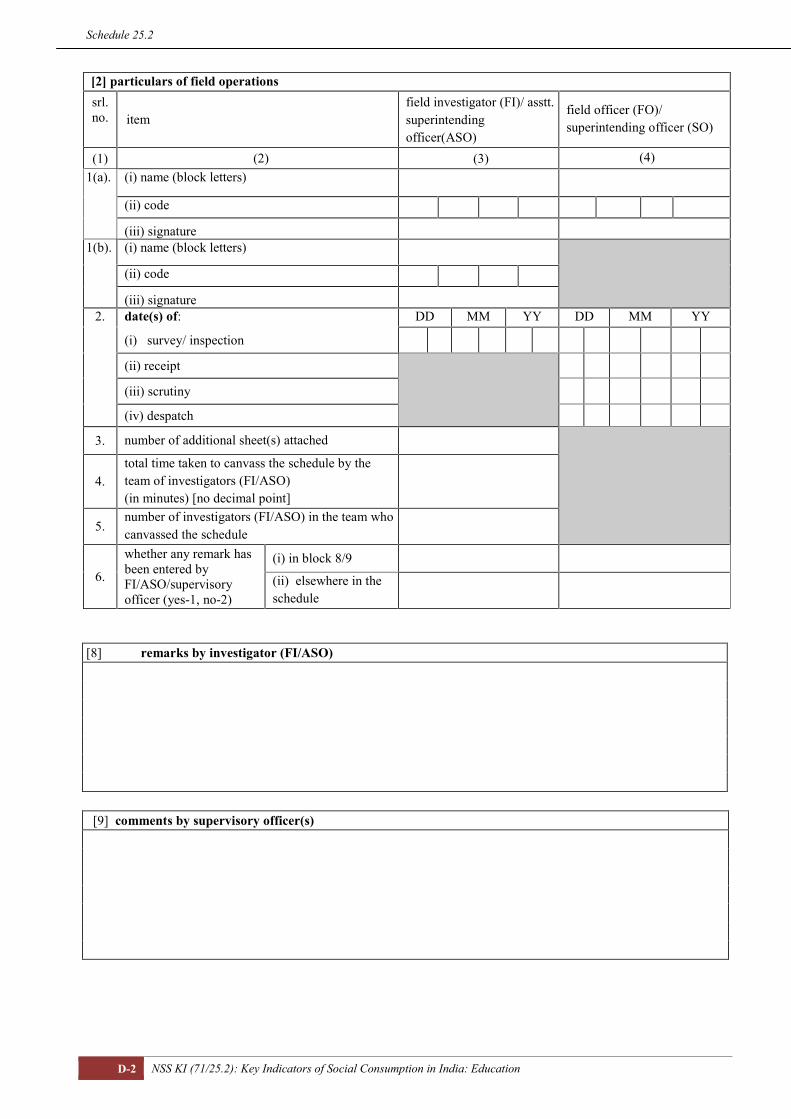
Schedule 25.2
D-2 NSS KI (71/25.2): Key Indicators of Social Consumption in India: Education
[2] particulars of field operationssrl.no. item
field investigator (FI)/ asstt.superintendingofficer(ASO)
field officer (FO)/superintending officer (SO)
(1) (2) (3) (4)1(a). (i) name (block letters)
(ii) code
(iii) signature1(b). (i) name (block letters)
(ii) code
(iii) signature2. date(s) of: DD MM YY DD MM YY
(i) survey/ inspection
(ii) receipt
(iii) scrutiny
(iv) despatch
3. number of additional sheet(s) attached
4.total time taken to canvass the schedule by theteam of investigators (FI/ASO)(in minutes) [no decimal point]
5.number of investigators (FI/ASO) in the team whocanvassed the schedule
6.
whether any remark hasbeen entered byFI/ASO/supervisoryofficer (yes-1, no-2)
(i) in block 8/9
(ii) elsewhere in theschedule
[8] remarks by investigator (FI/ASO)
[9] comments by supervisory officer(s)

Appendix D
NSS KI (71/25.2): Key Indicators of Social Consumption in India: Education D-3
[3] household characteristics1. household size 6. social group (code)
2. principal industry(NIC – 2008)
description 7. distance(d) to nearest school having primarylevel classes(code)
code (5-digit) 8. distance(d) to nearest school having upperprimary level classes(code)
3.principaloccupation(NCO-2004)
description 9. distance(d) to nearest school havingsecondary level classes(code)
code (3-digit) 10. whether the household has a computer @
(yes-1, no-2)
4. household type (code) 11.whether any member of the household (aged14 & above) has access to use internet facility(yes-1, no-2)
5. religion (code) 12. household’s usual consumer expenditure (`)in a month
CODES FOR BLOCK 3
item4 : household type:for rural areas:self-employed in agriculture-1,self-employed in non-agriculture-2,
regular wage/salary earning-3,casual labour in agriculture-4,casual labour in non-agriculture-5,others-9.
for urban areas:self-employed-1,regular wage/salary earning-2,casual labour-3,others-9.
item 5: religion : Hinduism-1, Islam-2, Christianity –3, Sikhism-4, Jainism-5, Buddhism-6, Zoroastrianism-7, others-9
item 6: social group : scheduled tribe-1, scheduled caste-2, other backward class-3, others-9
item 7/8/9: distance(d) to nearest school having primary/upper primary//secondary level classes :
d<1km - 11kmd < 2 kms - 2
2kms d < 3 kms - 33kms d < 5 kms - 4
d5 kms - 5
@ computer includes desktop, laptop, palmtop, notebook, netbook ,smartphone , tablets etc.
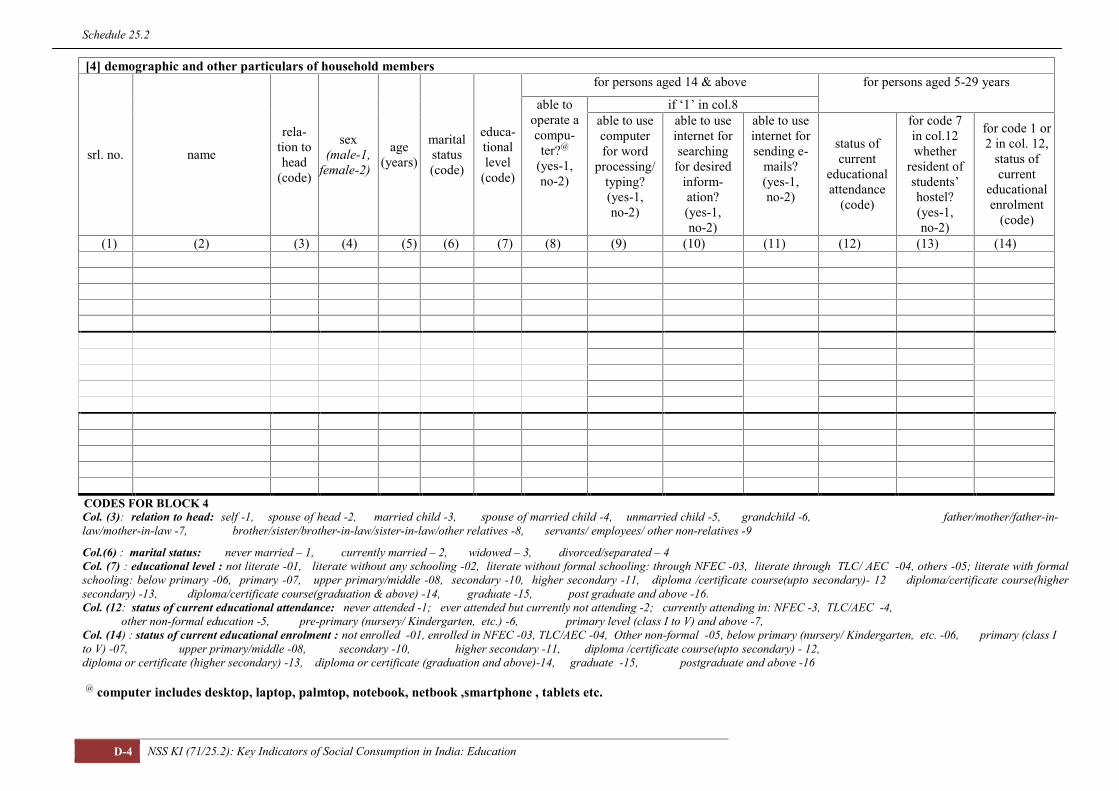
Schedule 25.2
D-4 NSS KI (71/25.2): Key Indicators of Social Consumption in India: Education
[4] demographic and other particulars of household members
srl. no. name
rela-tion tohead
(code)
sex(male-1,
female-2)
age(years)
maritalstatus(code)
educa-tionallevel
(code)
for persons aged 14 & above for persons aged 5-29 years
able tooperate acompu-ter?@
(yes-1,no-2)
if ‘1’ in col.8able to usecomputerfor word
processing/typing?(yes-1,no-2)
able to useinternet forsearching
for desiredinform-ation?(yes-1,no-2)
able to useinternet forsending e-
mails?(yes-1,no-2)
status ofcurrent
educationalattendance
(code)
for code 7in col.12whether
resident ofstudents’hostel?(yes-1,no-2)
for code 1 or2 in col. 12,
status ofcurrent
educationalenrolment
(code)
(1) (2) (3) (4) (5) (6) (7) (8) (9) (10) (11) (12) (13) (14)
CODES FOR BLOCK 4Col. (3): relation to head: self -1, spouse of head -2, married child -3, spouse of married child -4, unmarried child -5, grandchild -6, father/mother/father-in-law/mother-in-law -7, brother/sister/brother-in-law/sister-in-law/other relatives -8, servants/ employees/ other non-relatives -9
Col.(6) : marital status: never married – 1, currently married – 2, widowed – 3, divorced/separated – 4Col. (7) : educational level : not literate -01, literate without any schooling -02, literate without formal schooling: through NFEC -03, literate through TLC/ AEC -04, others -05; literate with formalschooling: below primary -06, primary -07, upper primary/middle -08, secondary -10, higher secondary -11, diploma /certificate course(upto secondary)- 12 diploma/certificate course(highersecondary) -13, diploma/certificate course(graduation & above) -14, graduate -15, post graduate and above -16.Col. (12: status of current educational attendance: never attended -1; ever attended but currently not attending -2; currently attending in: NFEC -3, TLC/AEC -4,
other non-formal education -5, pre-primary (nursery/ Kindergarten, etc.) -6, primary level (class I to V) and above -7,Col. (14) : status of current educational enrolment : not enrolled -01, enrolled in NFEC -03, TLC/AEC -04, Other non-formal -05, below primary (nursery/ Kindergarten, etc. -06, primary (class Ito V) -07, upper primary/middle -08, secondary -10, higher secondary -11, diploma /certificate course(upto secondary) - 12,diploma or certificate (higher secondary) -13, diploma or certificate (graduation and above)-14, graduate -15, postgraduate and above -16
@ computer includes desktop, laptop, palmtop, notebook, netbook ,smartphone , tablets etc.
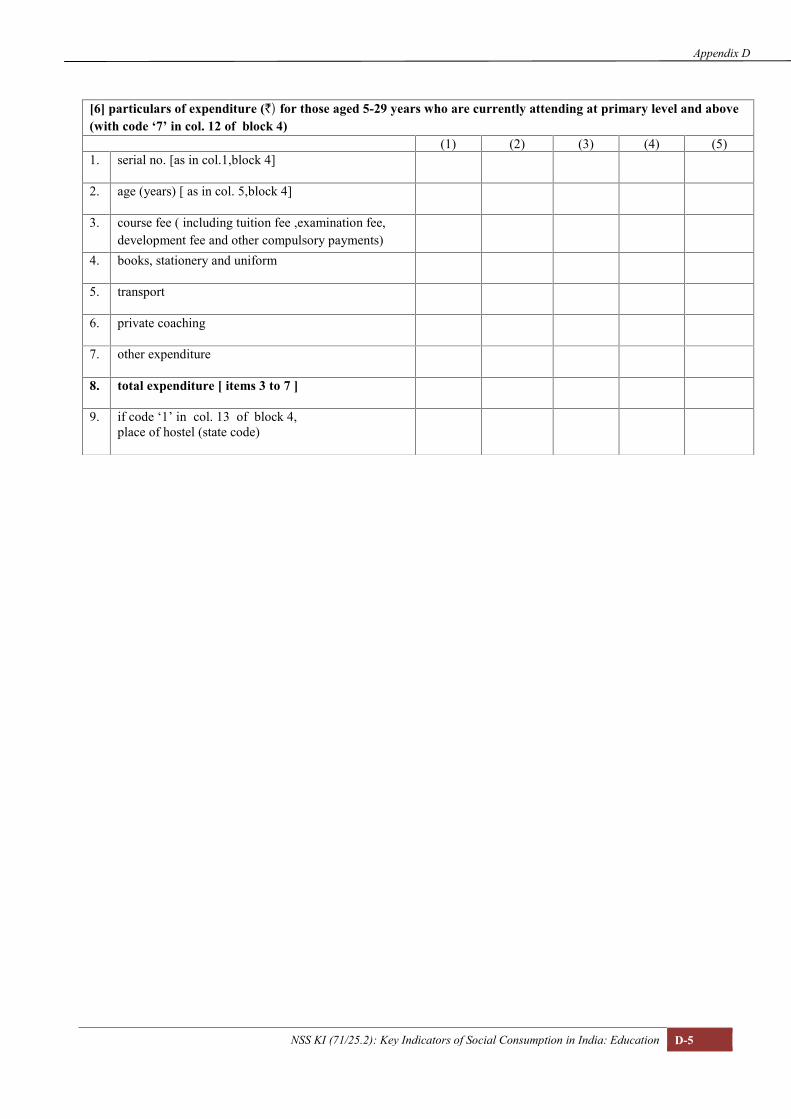
Appendix D
NSS KI (71/25.2): Key Indicators of Social Consumption in India: Education D-5
[6] particulars of expenditure (`) for those aged 5-29 years who are currently attending at primary level and above(with code ‘7’ in col. 12 of block 4)
(1) (2) (3) (4) (5)1. serial no. [as in col.1,block 4]
2. age (years) [ as in col. 5,block 4]
3. course fee ( including tuition fee ,examination fee,development fee and other compulsory payments)
4. books, stationery and uniform
5. transport
6. private coaching
7. other expenditure
8. total expenditure [ items 3 to 7 ]
9. if code ‘1’ in col. 13 of block 4,place of hostel (state code)
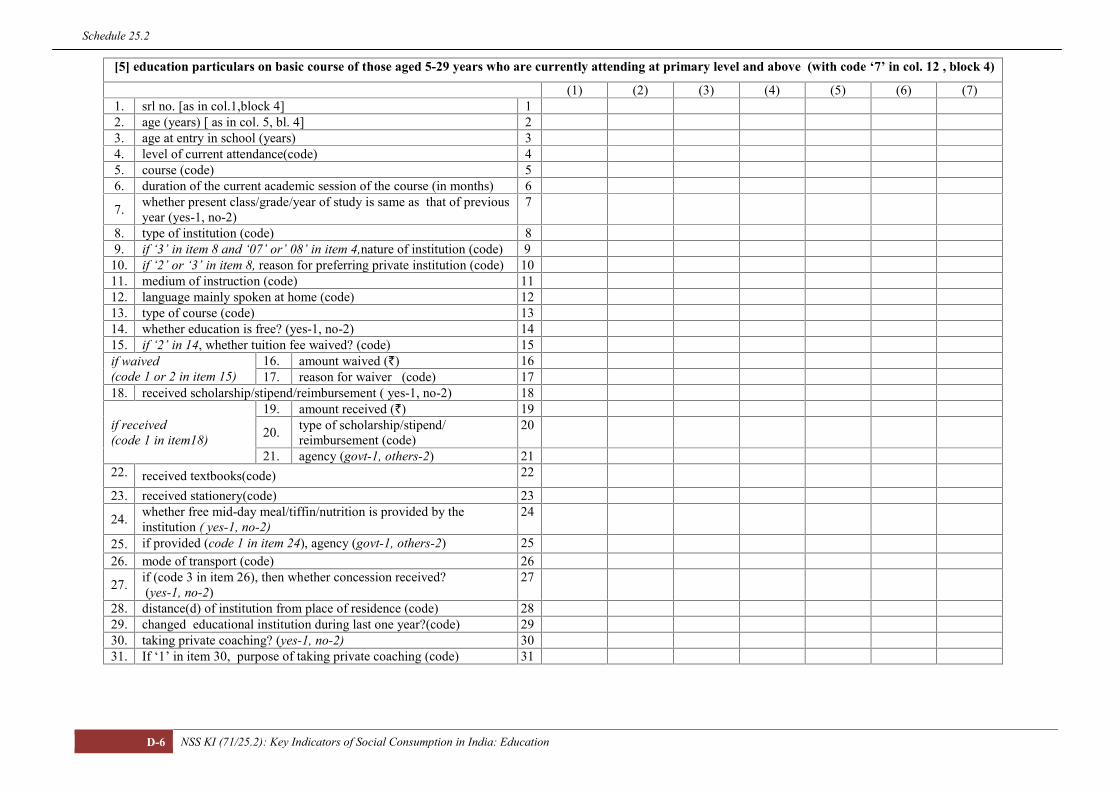
Schedule 25.2
D-6 NSS KI (71/25.2): Key Indicators of Social Consumption in India: Education
[5] education particulars on basic course of those aged 5-29 years who are currently attending at primary level and above (with code ‘7’ in col. 12 , block 4)
(1) (2) (3) (4) (5) (6) (7)1. srl no. [as in col.1,block 4] 12. age (years) [ as in col. 5, bl. 4] 23. age at entry in school (years) 34. level of current attendance(code) 45. course (code) 56. duration of the current academic session of the course (in months) 6
7. whether present class/grade/year of study is same as that of previousyear (yes-1, no-2)
7
8. type of institution (code) 89. if ‘3’ in item 8 and ‘07’ or’ 08’ in item 4,nature of institution (code) 9
10. if ‘2’ or ‘3’ in item 8, reason for preferring private institution (code) 1011. medium of instruction (code) 1112. language mainly spoken at home (code) 1213. type of course (code) 1314. whether education is free? (yes-1, no-2) 1415. if ‘2’ in 14, whether tuition fee waived? (code) 15if waived(code 1 or 2 in item 15)
16. amount waived (`) 1617. reason for waiver (code) 17
18. received scholarship/stipend/reimbursement ( yes-1, no-2) 18
if received(code 1 in item18)
19. amount received (`) 19
20. type of scholarship/stipend/reimbursement (code)
20
21. agency (govt-1, others-2) 2122. received textbooks(code) 22
23. received stationery(code) 23
24. whether free mid-day meal/tiffin/nutrition is provided by theinstitution ( yes-1, no-2)
24
25. if provided (code 1 in item 24), agency (govt-1, others-2) 2526. mode of transport (code) 26
27. if (code 3 in item 26), then whether concession received?(yes-1, no-2)
27
28. distance(d) of institution from place of residence (code) 2829. changed educational institution during last one year?(code) 2930. taking private coaching? (yes-1, no-2) 3031. If ‘1’ in item 30, purpose of taking private coaching (code) 31
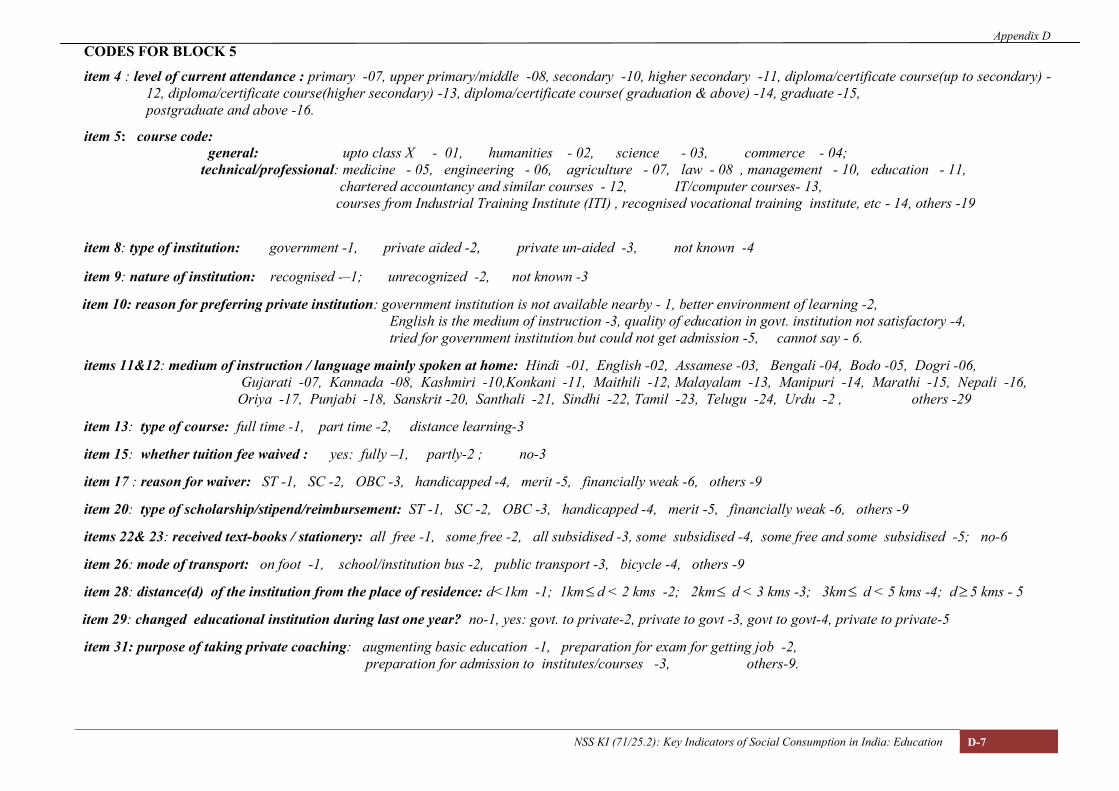
Appendix D
NSS KI (71/25.2): Key Indicators of Social Consumption in India: Education D-7
CODES FOR BLOCK 5
item 4 : level of current attendance : primary -07, upper primary/middle -08, secondary -10, higher secondary -11, diploma/certificate course(up to secondary) -12, diploma/certificate course(higher secondary) -13, diploma/certificate course( graduation & above) -14, graduate -15,postgraduate and above -16.
item 5: course code:general: upto class X - 01, humanities - 02, science - 03, commerce - 04;
technical/professional: medicine - 05, engineering - 06, agriculture - 07, law - 08 , management - 10, education - 11,chartered accountancy and similar courses - 12, IT/computer courses- 13,
courses from Industrial Training Institute (ITI) , recognised vocational training institute, etc - 14, others -19
item 8: type of institution: government -1, private aided -2, private un-aided -3, not known -4
item 9: nature of institution: recognised -–1; unrecognized -2, not known -3
item 10: reason for preferring private institution: government institution is not available nearby - 1, better environment of learning -2,English is the medium of instruction -3, quality of education in govt. institution not satisfactory -4,tried for government institution but could not get admission -5, cannot say - 6.
items 11&12: medium of instruction / language mainly spoken at home: Hindi -01, English -02, Assamese -03, Bengali -04, Bodo -05, Dogri -06,Gujarati -07, Kannada -08, Kashmiri -10,Konkani -11, Maithili -12, Malayalam -13, Manipuri -14, Marathi -15, Nepali -16,Oriya -17, Punjabi -18, Sanskrit -20, Santhali -21, Sindhi -22, Tamil -23, Telugu -24, Urdu -2 , others -29
item 13: type of course: full time -1, part time -2, distance learning-3
item 15: whether tuition fee waived : yes: fully –1, partly-2 ; no-3
item 17 : reason for waiver: ST -1, SC -2, OBC -3, handicapped -4, merit -5, financially weak -6, others -9
item 20: type of scholarship/stipend/reimbursement: ST -1, SC -2, OBC -3, handicapped -4, merit -5, financially weak -6, others -9
items 22& 23: received text-books / stationery: all free -1, some free -2, all subsidised -3, some subsidised -4, some free and some subsidised -5; no-6
item 26: mode of transport: on foot -1, school/institution bus -2, public transport -3, bicycle -4, others -9
item 28: distance(d) of the institution from the place of residence: d<1km -1; 1km d < 2 kms -2; 2km d < 3 kms -3; 3km d < 5 kms -4; d 5 kms - 5
item 29: changed educational institution during last one year? no-1, yes: govt. to private-2, private to govt -3, govt to govt-4, private to private-5
item 31: purpose of taking private coaching: augmenting basic education -1, preparation for exam for getting job -2,preparation for admission to institutes/courses -3, others-9.
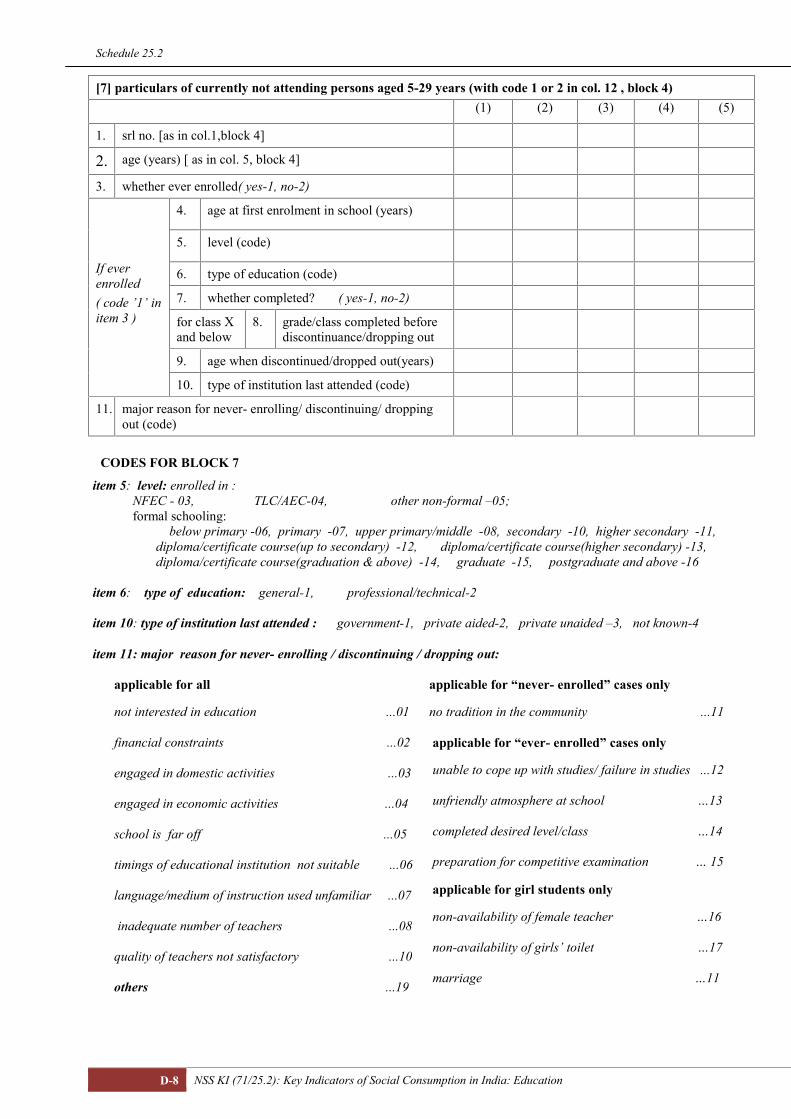
Schedule 25.2
D-8 NSS KI (71/25.2): Key Indicators of Social Consumption in India: Education
[7] particulars of currently not attending persons aged 5-29 years (with code 1 or 2 in col. 12 , block 4)(1) (2) (3) (4) (5)
1. srl no. [as in col.1,block 4]
2. age (years) [ as in col. 5, block 4]
3. whether ever enrolled( yes-1, no-2)
If everenrolled( code ’1’ initem 3 )
4. age at first enrolment in school (years)
5. level (code)
6. type of education (code)
7. whether completed? ( yes-1, no-2)
for class Xand below
8. grade/class completed beforediscontinuance/dropping out
9. age when discontinued/dropped out(years)
10. type of institution last attended (code)
11. major reason for never- enrolling/ discontinuing/ droppingout (code)
CODES FOR BLOCK 7
item 5: level: enrolled in :NFEC - 03, TLC/AEC-04, other non-formal –05;formal schooling:
below primary -06, primary -07, upper primary/middle -08, secondary -10, higher secondary -11,diploma/certificate course(up to secondary) -12, diploma/certificate course(higher secondary) -13,diploma/certificate course(graduation & above) -14, graduate -15, postgraduate and above -16
item 6: type of education: general-1, professional/technical-2
item 10: type of institution last attended : government-1, private aided-2, private unaided –3, not known-4
item 11: major reason for never- enrolling / discontinuing / dropping out:
applicable for all
not interested in education ...01
financial constraints ...02
engaged in domestic activities ...03
engaged in economic activities ...04
school is far off ...05
timings of educational institution not suitable ...06
language/medium of instruction used unfamiliar ...07
inadequate number of teachers ...08
quality of teachers not satisfactory ...10
others ...19
applicable for “never- enrolled” cases only
no tradition in the community ...11
applicable for “ever- enrolled” cases only
unable to cope up with studies/ failure in studies ...12
unfriendly atmosphere at school …13
completed desired level/class …14
preparation for competitive examination … 15
applicable for girl students only
non-availability of female teacher …16
non-availability of girls’ toilet …17
marriage …11

1
List of NSS Reports available for sale
Sl.No.
ReportNo. Title of the Report
PriceHard Copy Soft Copy (CD)
US$ Pound-Sterling
US$ Pound-Sterling
(1) (2) (3) (4) (5) (6) (7) (8) (9)Unorganised Trade, NSS 46th Round
1 403 Small Trading Units in India 150 11 7 380 27 172 403/1 State Level results on small trading units in India:
Vol.-I250 18 11 710 51 32
3 403/1 State Level results on small trading units in India:Vol.-II
250 18 11 710 51 32
Land & livestock holdings and Debt &investment, NSS 48th Round
4 407 Operational land holdings in India, 1991-92: Salientfeatures
250 18 11 710 51 32
5 408 Live-stock and Agricultural implements in House-hold operational holdings, 1991-92
150 11 7 380 27 17
6 414 Seasonal variation in the operation of land holdingsin India, 1991-92
250 18 11 710 51 32
7 419 Household Assets and Liabilities as on 30.6.91 250 17 11 1140 75 468 420 Indebtedness of Rural Households as on 30.6.1991 250 15 9 1370 82 509 421 Indebtedness of Urban Households as on 30.6.1991 250 15 9 1370 82 5010 431
(Part I)Household Borrowings and Repayments during1.7.91 to 30.6.92
250 15 9 1140 68 42
11 431(Part-II)
Household Borrowings and Repayments during1.7.91 to 30.6.92
250 15 9 1140 68 42
12 432(Part-I)
Households Assets and Indebtedness of SocialGroups as on 30.6.91
250 15 9 1140 68 42
13 432(Part-II)
Households Assets and Indebtedness of SocialGroups as on 30.6.91
250 15 9 710 43 26
14 437 Household capital expenditure during 1.7.91 to30.6.92.
250 15 9 1370 82 50
Housing Conditions and Migration with specialemphasis on slum dwellers, NSS 49th round
15 417 Slums in India 150 11 7 380 27 1716 429 Housing Conditions in India 150 11 7 380 25 1617 430 Migration in India 250 15 9 710 42 26
Employment & Unemployment, NSS 50th Round18 406 Key Results on Employment & Unemployment 150 11 7 610 44 2619 409 Employment & Unemployment in India, 1993-94 250 18 11 710 51 3220 411 Employment & Unemployment situation in cities
and Towns in India, 1993-94150 11 7 380 27 17
21 412 Economic activities and school attendance bychildren in India, 1993-94
150 11 7 380 27 17
22 416 Participation of Indian women in household workand other specified activities, 1993-94
150 11 7 380 27 17
23 418 Unemployed in India, 1993-94: Salient Features 150 11 7 380 27 1724 425 Employment & Unemployment situation among
social groups in India, 1993-94250 17 10 480 32 19
25 438 Employment & Unemployment situation amongreligious groups in India, 1993-94
150 10 7 610 37 23
Consumer Expenditure, NSS 50th Round26 401 Key results on Household Consumer Expenditure,
1993-94150 11 7 380 28 17
27 402 Level and Pattern of Consumer Expenditure 250 19 12 710 52 3228 404 Consumption of some important commodities in India 250 18 11 710 51 32
Continued..
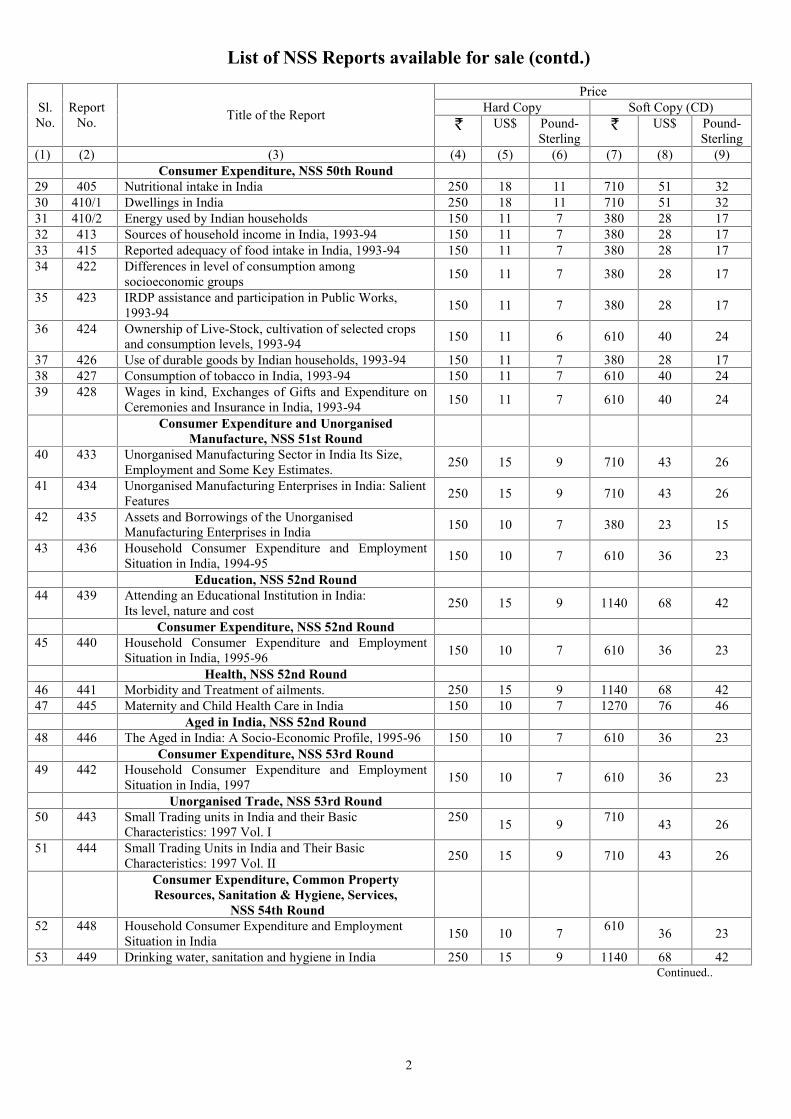
2
List of NSS Reports available for sale (contd.)
Sl.No.
ReportNo. Title of the Report
PriceHard Copy Soft Copy (CD)
US$ Pound-Sterling
US$ Pound-Sterling
(1) (2) (3) (4) (5) (6) (7) (8) (9)Consumer Expenditure, NSS 50th Round
29 405 Nutritional intake in India 250 18 11 710 51 3230 410/1 Dwellings in India 250 18 11 710 51 3231 410/2 Energy used by Indian households 150 11 7 380 28 1732 413 Sources of household income in India, 1993-94 150 11 7 380 28 1733 415 Reported adequacy of food intake in India, 1993-94 150 11 7 380 28 1734 422 Differences in level of consumption among
socioeconomic groups 150 11 7 380 28 17
35 423 IRDP assistance and participation in Public Works,1993-94 150 11 7 380 28 17
36 424 Ownership of Live-Stock, cultivation of selected cropsand consumption levels, 1993-94 150 11 6 610 40 24
37 426 Use of durable goods by Indian households, 1993-94 150 11 7 380 28 1738 427 Consumption of tobacco in India, 1993-94 150 11 7 610 40 2439 428 Wages in kind, Exchanges of Gifts and Expenditure on
Ceremonies and Insurance in India, 1993-94 150 11 7 610 40 24
Consumer Expenditure and UnorganisedManufacture, NSS 51st Round
40 433 Unorganised Manufacturing Sector in India Its Size,Employment and Some Key Estimates. 250 15 9 710 43 26
41 434 Unorganised Manufacturing Enterprises in India: SalientFeatures 250 15 9 710 43 26
42 435 Assets and Borrowings of the UnorganisedManufacturing Enterprises in India 150 10 7 380 23 15
43 436 Household Consumer Expenditure and EmploymentSituation in India, 1994-95 150 10 7 610 36 23
Education, NSS 52nd Round44 439 Attending an Educational Institution in India:
Its level, nature and cost 250 15 9 1140 68 42
Consumer Expenditure, NSS 52nd Round45 440 Household Consumer Expenditure and Employment
Situation in India, 1995-96 150 10 7 610 36 23
Health, NSS 52nd Round46 441 Morbidity and Treatment of ailments. 250 15 9 1140 68 4247 445 Maternity and Child Health Care in India 150 10 7 1270 76 46
Aged in India, NSS 52nd Round48 446 The Aged in India: A Socio-Economic Profile, 1995-96 150 10 7 610 36 23
Consumer Expenditure, NSS 53rd Round49 442 Household Consumer Expenditure and Employment
Situation in India, 1997 150 10 7 610 36 23
Unorganised Trade, NSS 53rd Round50 443 Small Trading units in India and their Basic
Characteristics: 1997 Vol. I250 15 9 710 43 26
51 444 Small Trading Units in India and Their BasicCharacteristics: 1997 Vol. II 250 15 9 710 43 26
Consumer Expenditure, Common PropertyResources, Sanitation & Hygiene, Services,
NSS 54th Round52 448 Household Consumer Expenditure and Employment
Situation in India 150 10 7 610 36 23
53 449 Drinking water, sanitation and hygiene in India 250 15 9 1140 68 42Continued..

3
List of NSS Reports available for sale (contd.)
Sl.No.
ReportNo. Title of the Report
PriceHard Copy Soft Copy (CD)
US$ Pound-Sterling
US$ Pound-Sterling
(1) (2) (3) (4) (5) (6) (7) (8) (9)Consumer Expenditure, Common PropertyResources, Sanitation & Hygiene, Services,
NSS 54th Round54 450 Travel and Use of Mass Media and Financial Services
by Indian Households 150 10 7 610 10 7
55 451 Cultivation Practices in India 250 15 9 1370 82 5056 452 Common Property Resources 250 15 9 1370 82 50
Choice of Reference Period for Consumption Data,NSS 51st, 52nd, 53rd & 54th Round
57 447 Choice of Reference Period for Consumption Data 150 10 7 1700 102 64Consumer Expenditure, NSS 55th Round
(July’99 to June 2000)58 453 Household Consumer Expenditure in India (July –
December 1999) - Key Results 150 10 7 610 36 23
59 454 Household Consumer Expenditure in India, 1999–2000- Key Results 150 10 7 610 36 23
60 457 Level and Pattern of Consumer Expenditure in India,1999 - 2000 250 15 10 1520 81 57
61 461 Consumption of some important Commodities in India,1999-2000 250 15 10 1370 73 52
62 463 Sources of household income in India, 1999-2000 150 10 7 380 28 1763 464 Energy Used by Indian Households, 1999-2000 150 10 7 610 36 2364 466 Reported Adequacy of Food Intake in India, 1999 -
2000 150 10 7 610 36 23
65 467 IRDP Assistance and Participation in Public Works:1999-2000 150 10 7 610 36 23
66 471 Nutritional Intake in India, 1999-2000 250 15 10 710 43 2667 472 Differences in the level of consumption among socio
economic groups, 1999-2000 250 15 10 480 32 19
68 473 Literacy and Levels of Education in India, 1999 - 2000 250 15 10 610 36 2369 474 Sources of household consumption in India, 1999 - 2000 250 15 10 710 43 26
Employment & Unemployment, NSS 55th Round(July’99 to June 2000)
70 455 Employment and Unemployment in India, 1999-2000- Key Results 150 10 7 610 36 23
71 458(Part-I)
Employment and Unemployment Situation in India,1999 - 2000 250 15 10 750 40 28
72 458(Part-II)
Employment and Unemployment Situation in India,1999 - 2000 250 15 10 1370 73 52
73 460 Non agricultural workers in Informal Sector based onEmployment and Unemployment Survey, 1999-2000 150 10 7 610 36 23
74 462 Employment and Unemployment situation in Cities andTowns of India, 1999-2000 150 10 7 610 36 23
75 465 Participation of Indian Women in Household work andother specified activities, 1999-2000 150 10 7 610 36 23
76 468 Employment and Unemployment among religiousgroups in India, 1999-2000 150 10 7 610 36 23
77 469 Employment and Unemployment among social groupsin India, 1999-2000 250 15 10 2950 156 110
78 470 Migration in India, 1999-2000 250 15 10 1140 68 42Continued..

4
List of NSS Reports available for sale (contd.)
Sl.No.
ReportNo. Title of the Report
PriceHard Copy Soft Copy (CD)
US$ Pound-Sterling
US$ Pound-Sterling
(1) (2) (3) (4) (5) (6) (7) (8) (9)Non-agricultural Enterprises in Informal Sector 1999-
2000, NSS 55th Round (July’99 to June 2000)79 456 Non-agricultural Enterprises in the Informal Sector in India,
1999-2000 - Key Results 150 10 7 610 36 23
80 459 Informal Sector in India, 1999 - 2000 - Salient Features 250 15 10 1600 85 60Consumer Expenditure,
NSS 56th Round (July 2000 - June 2001)81 476 Household Consumer Expenditure and Employment -
Unemployment Situation in India, 2000 - 2001 150 10 7 1040 66 41
Unorganised Manufacturing,NSS 56th Round (July 2000 - June 2001)
82 477 Unorganised Manufacturing Sector in India 2000-2001 -Key Results 250 15 10 710 52 32
83 478 Unorganised Manufacturing Sector in India 2000-2001 -Characteristics of Enterprises 250 15 10 1370 82 50
84 479 Unorganised Manufacturing Sector in India, 2000 – 2001:Employment, Assets and Borrowings 250 15 10 1370 82 50
85 480 Unorganised Manufacturing Sector in India, 2000 – 2001:Input, Output and Value added 250 15 10 1370 82 50
Pilot Survey on Suitability of Reference Period forMeasuring Household Consumption
86 475 Results of a Pilot Survey on Suitability of DifferentReference Periods for Measuring Household Consumption 150 10 7 610 36 23
Consumer Expenditure,NSS 57th Round (July 2001 - June 2002)
87 481 Household Consumer Expenditure and Employment -Unemployment Situation in India, 2001 - 2002 250 15 10 2680 158 105
Unorganised Service Sector,NSS 57th Round (July 2001 - June 2002)
88 482 Unorganised Service Sector in India 2001 - 02 SalientFeatures 250 15 10 1925 98 65
89 483 Unorganised Service Sector in India 2001 - 02Characteristics of Enterprises 250 15 10 1370 82 55
Consumer Expenditure,NSS 58th Round (July 2002 - December 2002)
90 484 Household Consumer Expenditure and Employment -Unemployment Situation in India, 2002 - 2003 150 8 4 2380 129 70
Disability, NSS 58th Round91 485 Disabled Persons in India, July-December 2002 250 14 7 7080 385 208
Urban Slums,NSS 58th Round (July 2002 - December 2002)
92 486 Condition of Urban Slums, 2002: Salient Features 250 14 7 2080 112 62Village facilities,
NSS 58th Round (July 2002 - December 2002)93 487 Report on village facilities, July-December 2002 150 8 4 980 53 29
Housing Condition,NSS 58th Round (July 2002 - December 2002)
94 488 Housing Condition in India, 2002: Housing stock andconstructions 250 15 10 9280 548 350
95 489 Housing Condition in India, 2002: Household Amenitiesand Other Characteristics 250 15 10 9220 524 285
Continued..
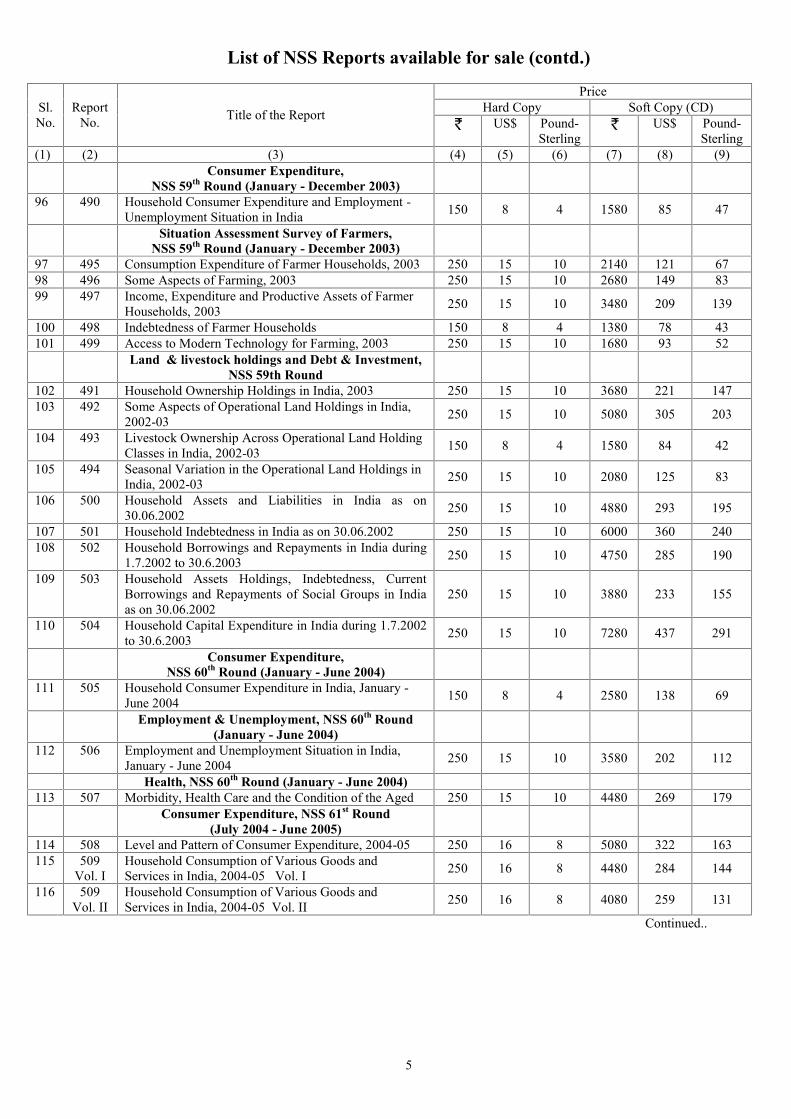
5
List of NSS Reports available for sale (contd.)
Sl.No.
ReportNo. Title of the Report
PriceHard Copy Soft Copy (CD)
US$ Pound-Sterling
US$ Pound-Sterling
(1) (2) (3) (4) (5) (6) (7) (8) (9)Consumer Expenditure,
NSS 59th Round (January - December 2003)96 490 Household Consumer Expenditure and Employment -
Unemployment Situation in India 150 8 4 1580 85 47
Situation Assessment Survey of Farmers,NSS 59th Round (January - December 2003)
97 495 Consumption Expenditure of Farmer Households, 2003 250 15 10 2140 121 6798 496 Some Aspects of Farming, 2003 250 15 10 2680 149 8399 497 Income, Expenditure and Productive Assets of Farmer
Households, 2003 250 15 10 3480 209 139
100 498 Indebtedness of Farmer Households 150 8 4 1380 78 43101 499 Access to Modern Technology for Farming, 2003 250 15 10 1680 93 52
Land & livestock holdings and Debt & Investment,NSS 59th Round
102 491 Household Ownership Holdings in India, 2003 250 15 10 3680 221 147103 492 Some Aspects of Operational Land Holdings in India,
2002-03 250 15 10 5080 305 203
104 493 Livestock Ownership Across Operational Land HoldingClasses in India, 2002-03 150 8 4 1580 84 42
105 494 Seasonal Variation in the Operational Land Holdings inIndia, 2002-03 250 15 10 2080 125 83
106 500 Household Assets and Liabilities in India as on30.06.2002 250 15 10 4880 293 195
107 501 Household Indebtedness in India as on 30.06.2002 250 15 10 6000 360 240108 502 Household Borrowings and Repayments in India during
1.7.2002 to 30.6.2003 250 15 10 4750 285 190
109 503 Household Assets Holdings, Indebtedness, CurrentBorrowings and Repayments of Social Groups in Indiaas on 30.06.2002
250 15 10 3880 233 155
110 504 Household Capital Expenditure in India during 1.7.2002to 30.6.2003 250 15 10 7280 437 291
Consumer Expenditure,NSS 60th Round (January - June 2004)
111 505 Household Consumer Expenditure in India, January -June 2004 150 8 4 2580 138 69
Employment & Unemployment, NSS 60th Round(January - June 2004)
112 506 Employment and Unemployment Situation in India,January - June 2004 250 15 10 3580 202 112
Health, NSS 60th Round (January - June 2004)113 507 Morbidity, Health Care and the Condition of the Aged 250 15 10 4480 269 179
Consumer Expenditure, NSS 61st Round(July 2004 - June 2005)
114 508 Level and Pattern of Consumer Expenditure, 2004-05 250 16 8 5080 322 163115 509
Vol. IHousehold Consumption of Various Goods andServices in India, 2004-05 Vol. I 250 16 8 4480 284 144
116 509Vol. II
Household Consumption of Various Goods andServices in India, 2004-05 Vol. II 250 16 8 4080 259 131
Continued..

6
List of NSS Reports available for sale (contd.)
Sl.No.
ReportNo. Title of the Report
PriceHard Copy Soft Copy (CD)
US$ Pound-Sterling
US$ Pound-Sterling
(1) (2) (3) (4) (5) (6) (7) (8) (9)Consumer Expenditure, NSS 61st Round
(July 2004 - June 2005)117 510
Vol. IPublic Distribution System and Other Sources ofHousehold Consumption, 2004-05 Vol. I 250 16 8 3880 246 124
118 510Vol. II
Public Distribution System and Other Sources ofHousehold Consumption, 2004-05 Vol. II 250 16 8 3680 234 118
119 511 Energy Sources of Indian Households for Cookingand Lighting, 2004-05 250 16 8 2480 157 79
120 512 Perceived Adequacy of Food Consumption in IndianHouseholds 2004-2005 150 10 5 1780 113 57
121 513 Nutritional intake in India, 2004-2005 250 16 8 3680 234 118122 514 Household Consumer Expenditure among Socio-
Economic Groups: 2004 - 2005 250 16 8 2880 183 92
Employment & Unemployment,NSS 61st Round (July 2004 - June 2005)
123 515(Part-I)
Employment and Unemployment Situation in India,2004-05 (Part-I) 250 16 8 4680 297 150
124 515(Part-II)
Employment and Unemployment Situation in India,2004-05 (Part-II) 250 16 8 4680 297 150
125 516 Employment and Unemployment Situation AmongSocial Groups in India, 2004-05 250 16 8 3680 234 118
126 517 Status of Education and Vocational Training in India2004-2005 250 16 8 2680 170 86
127 518 Participation of Women in Specified Activities alongwith Domestic Duties 150 10 5 1380 88 44
128 519(Part-I)
Informal Sector and Conditions of Employment in India,2004-05(Part-I) 250 16 8 3880 246 124
129 519(Part-II)
Informal Sector and Conditions of Employment in India,2004-05(Part-II) 250 16 8 4480 284 144
130 520 Employment and Unemployment Situation in Citiesand Towns in India, 2004-2005 150 10 5 1570 100 50
131 521 Employment and Unemployment Situation amongMajor Religious Groups in India, 2004-05 250 16 8 2480 157 79
Employment & Unemployment,NSS 62nd Round (July 2005 - June 2006)
132 522 Employment and Unemployment Situation in India,2005-06 250 16 8 4480 284 144
Consumer Expenditure,NSS 62nd Round (July 2005 - June 2006)
133 523 Household Consumer Expenditure in India, 2005-06 150 10 5 1380 88 44Unorganised Manufacturing Enterprises,NSS 62nd Round (July 2005 - June 2006)
134 524 Operational Characteristics of UnorganisedManufacturing Enterprises in India, 2005-06 250 16 8 4880 310 156
135 525 Unorganised Manufacturing Sector in India, 2005-06 –Employment, Assets and Borrowings 250 16 8 2880 183 92
136 526 Unorganised Manufacturing Sector in India, 2005-06 –Input, Output and Value Added 250 16 8 4280 272 137
Consumer Expenditure, NSS 63rd Round(July 2006 - June 2007)
137 527 Household Consumer Expenditure in India, 2006 - 07 150 7 5 1380 69 48Continued..
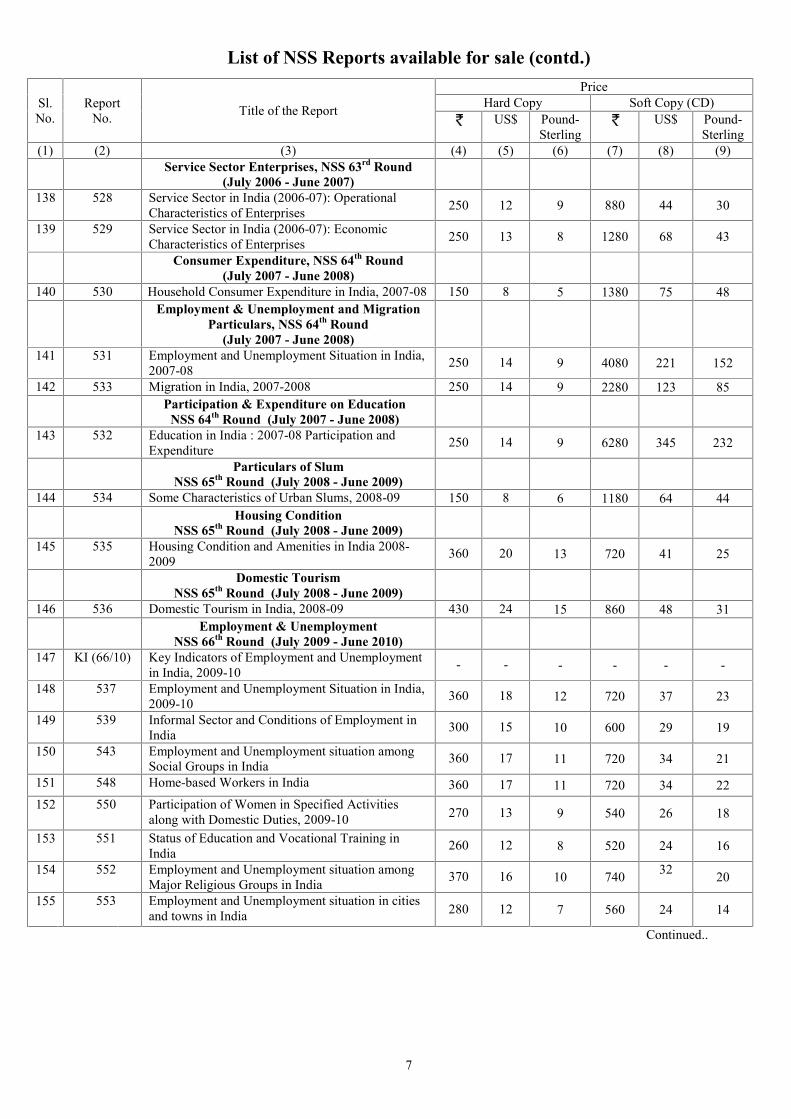
7
List of NSS Reports available for sale (contd.)
Sl.No.
ReportNo. Title of the Report
PriceHard Copy Soft Copy (CD)
US$ Pound-Sterling
US$ Pound-Sterling
(1) (2) (3) (4) (5) (6) (7) (8) (9)Service Sector Enterprises, NSS 63rd Round
(July 2006 - June 2007)138 528 Service Sector in India (2006-07): Operational
Characteristics of Enterprises 250 12 9 880 44 30
139 529 Service Sector in India (2006-07): EconomicCharacteristics of Enterprises 250 13 8 1280 68 43
Consumer Expenditure, NSS 64th Round(July 2007 - June 2008)
140 530 Household Consumer Expenditure in India, 2007-08 150 8 5 1380 75 48Employment & Unemployment and Migration
Particulars, NSS 64th Round(July 2007 - June 2008)
141 531 Employment and Unemployment Situation in India,2007-08 250 14 9 4080 221 152
142 533 Migration in India, 2007-2008 250 14 9 2280 123 85Participation & Expenditure on Education
NSS 64th Round (July 2007 - June 2008)143 532 Education in India : 2007-08 Participation and
Expenditure 250 14 9 6280 345 232
Particulars of SlumNSS 65th Round (July 2008 - June 2009)
144 534 Some Characteristics of Urban Slums, 2008-09 150 8 6 1180 64 44Housing Condition
NSS 65th Round (July 2008 - June 2009)145 535 Housing Condition and Amenities in India 2008-
2009 360 20 13 720 41 25
Domestic TourismNSS 65th Round (July 2008 - June 2009)
146 536 Domestic Tourism in India, 2008-09 430 24 15 860 48 31Employment & Unemployment
NSS 66th Round (July 2009 - June 2010)147 KI (66/10) Key Indicators of Employment and Unemployment
in India, 2009-10 - - - - - -
148 537 Employment and Unemployment Situation in India,2009-10 360 18 12 720 37 23
149 539 Informal Sector and Conditions of Employment inIndia 300 15 10 600 29 19
150 543 Employment and Unemployment situation amongSocial Groups in India 360 17 11 720 34 21
151 548 Home-based Workers in India 360 17 11 720 34 22152 550 Participation of Women in Specified Activities
along with Domestic Duties, 2009-10 270 13 9 540 26 18
153 551 Status of Education and Vocational Training inIndia 260 12 8 520 24 16
154 552 Employment and Unemployment situation amongMajor Religious Groups in India 370 16 10 740 32 20
155 553 Employment and Unemployment situation in citiesand towns in India 280 12 7 560 24 14
Continued..

8
List of NSS Reports available for sale (contd.)
Sl.No.
ReportNo. Title of the Report
PriceHard Copy Soft Copy (CD)
US$ Pound-Sterling
US$ Pound-Sterling
(1) (2) (3) (4) (5) (6) (7) (8) (9)Consumer Expenditure
NSS 66th Round (July 2009 - June 2010)156 KI (66/1.0) Key Indicators of Household Consumer
Expenditure in India, 2009-10 - - - - - -
157 538 Level and Pattern of Consumer Expenditure 250 12 8 500 24 15158 540 Nutritional Intake in India 240 12 8 480 23 15159 541 Household Consumption of Various Goods and
Services in India 230 12 7 460 23 15
160 542 Energy Sources of Indian Households for Cookingand Lighting 340 16 10 680 32 20
161 544 Household Consumer Expenditure across Socio-Economic Groups 410 19 12 820 38 24
162 545 Public Distribution System and Other Sources ofHousehold Consumption 200 10 6 400 20 12
163 547 Perceived Adequacy of Food Consumption inIndian Households 250 12 8 500 24 16
Unincorporated Non-agricultural Enterprises(Excluding Construction)
NSS 67th Round (July 2010 - June 2011)164 KI (67/2.34) Key Results of Survey on Unincorporated Non-
agricultural Enterprises (Excluding Construction)in India
- - - - - -
165 546 Operational Characteristics of Unincorporated Non-agricultural Enterprises (Excluding Construction)in India
280 13 8 560 26 16
166 549 Economic Characteristics of Unincorporated Non-agricultural Enterprises (Excluding Construction) inIndia
330 16 10 660 32 20
Household Consumer ExpenditureNSS 68th Round (July 2011 - June 2012)
167 KI (68/1.0) Key Indicator of Household Consumer Expenditurein India. - - - - - -
168 555 Level and Pattern of Consumer Expenditure,2011-12 250 10 6 500 20 12
169 558 Household Consumption of Various Goods andServices in India, 2011-12 260 11 7 520 22 14
170 560 Nutritional Intake in India, 2011-12 380 15 10 760 30 20
171 562 Household Consumer Expenditure across Socio-Economic Groups, 2011-12 440 18 12 880 36 24
Employment & UnemploymentNSS 68th Round (July 2011 - June 2012)
172 KI (68/10) Key Indicator of Employment and Unemploymentin India, 2011-12 - - - - - -
173 554 Employment and Unemployment Situation in India,2011-12 390 16 10 780 32 20
174 557 Informal Sector and Conditions of Employment inIndia 330 14 8 660 28 16
175 559 Participation of Women in Specified Activitiesalong with Domestic Duties 290 12 7 580 24 14
176 563 Employment and Unemployment situation amongSocial Groups in India 390 16 10 780 32 20
177 564 Employment and Unemployment situation in Cities& Towns in India 280 11 7 560 22 14
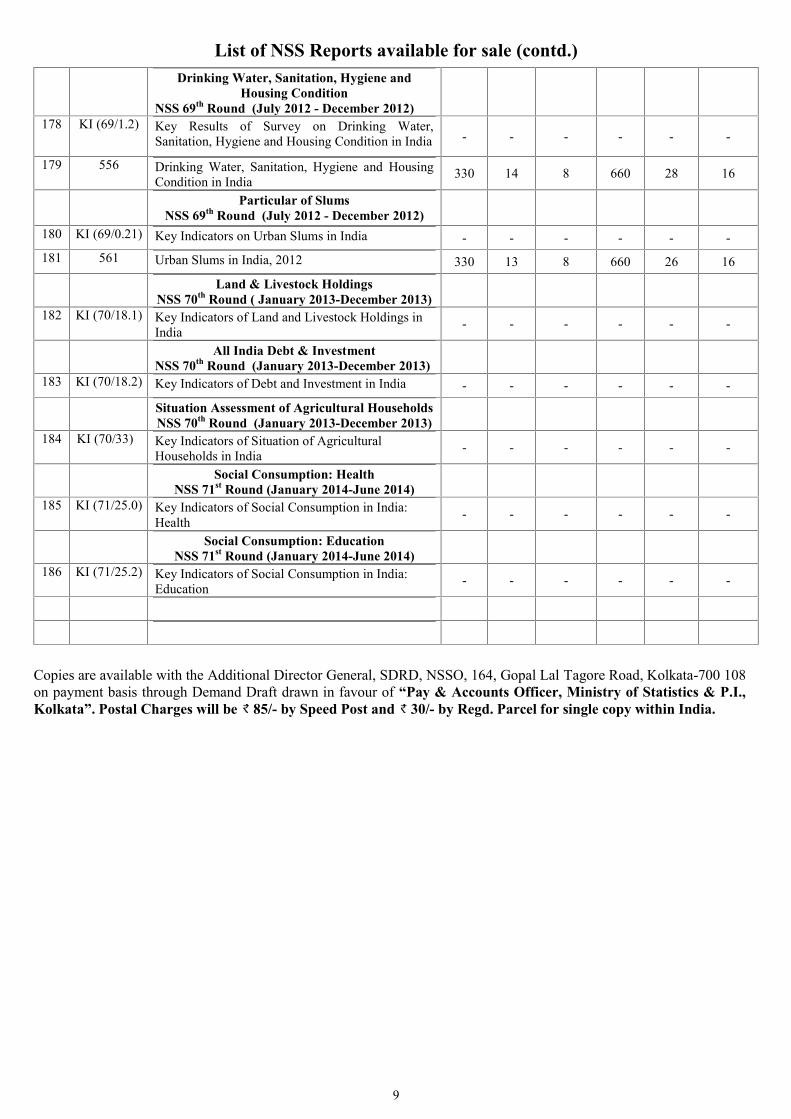
9
List of NSS Reports available for sale (contd.)
Copies are available with the Additional Director General, SDRD, NSSO, 164, Gopal Lal Tagore Road, Kolkata-700 108on payment basis through Demand Draft drawn in favour of “Pay & Accounts Officer, Ministry of Statistics & P.I.,Kolkata”. Postal Charges will be 85/- by Speed Post and 30/- by Regd. Parcel for single copy within India.
Drinking Water, Sanitation, Hygiene andHousing Condition
NSS 69th Round (July 2012 - December 2012)178 KI (69/1.2) Key Results of Survey on Drinking Water,
Sanitation, Hygiene and Housing Condition in India - - - - - -
179 556 Drinking Water, Sanitation, Hygiene and HousingCondition in India 330 14 8 660 28 16
Particular of SlumsNSS 69th Round (July 2012 - December 2012)
180 KI (69/0.21) Key Indicators on Urban Slums in India - - - - - -181 561 Urban Slums in India, 2012 330 13 8 660 26 16
Land & Livestock HoldingsNSS 70th Round ( January 2013-December 2013)
182 KI (70/18.1) Key Indicators of Land and Livestock Holdings inIndia - - - - - -
All India Debt & InvestmentNSS 70th Round (January 2013-December 2013)
183 KI (70/18.2) Key Indicators of Debt and Investment in India - - - - - -
Situation Assessment of Agricultural HouseholdsNSS 70th Round (January 2013-December 2013)
184 KI (70/33) Key Indicators of Situation of AgriculturalHouseholds in India - - - - - -
Social Consumption: HealthNSS 71st Round (January 2014-June 2014)
185 KI (71/25.0) Key Indicators of Social Consumption in India:Health - - - - - -
Social Consumption: EducationNSS 71st Round (January 2014-June 2014)
186 KI (71/25.2) Key Indicators of Social Consumption in India:Education - - - - - -
FEEDBACK FORM
1. Name (optional):
2. email id (optional) :
3. Your field of Work : (please tick() the relevant )
(a) Govt Sector (b) Corporate Sector (c) Research (d) Civil Services
(e) NGO (f) Education (g) Art & Culture (h) Media
(i) Business (j) Student
4. Please mention the report/publication you are commenting on :
____________________________________________________________
CONTENT
5. How useful/relevant is the report for your professional interests (please tick() the relevant )
(a) very useful (b) Moderately Useful (c) not at all useful
6. How useful/relevant is the report for your personal interests(please tick() the relevant )
(a) very useful (b) Moderately Useful (c) not at all useful
PRESENTATION
7. How do you find style of presentation of information of the report ? (please tick() the relevant )
(a) Excellent (b) Very Good (c) fair (d) not good at all
ACCESSIBILITY
5. How easy was it to collect a copy of the Report (soft/hard copy) ?
(a) Very easy (b) Moderately easy (c) difficult
6. ADDITIONAL COMMENTS Please note: These comments may be used for internal and external promotional purposes but will not be
attributed to the person making them, unless explicitly agreed to this in writing. (please add extra sheet if
required)
Thank you for completing our feedback form!
Please send your valuable feedback to
Additional Director General, NSSO(SDRD), 164, GLT Road, Kolkata-108 or email us at [email protected]
Related Documents