STRUCTURED FINANCE SECTOR IN-DEPTH 12 April 2018 TABLE OF CONTENTS Summary 1 NATIONAL PERFORMANCE 2 PERFORMANCE BY REGION 7 PERFORMANCE BY POSTCODE 9 STATES IN FOCUS 11 Moody’s related publications 17 Contacts Alena Chen +61.2.9270.8131 VP-Senior Analyst [email protected] CLIENT SERVICES Americas 1-212-553-1653 Asia Pacific 852-3551-3077 Japan 81-3-5408-4100 EMEA 44-20-7772-5454 RMBS - Australia Mortgage delinquency map - Home loan arrears will increase moderately on housing slowdown Summary Australian mortgage delinquencies will increase moderately through 2018 on softer housing market conditions, following a decline in home loan arrears over the year to November 2017. » Mortgage delinquencies have declined. The proportion of Australian residential mortgages that were more than 30 days in arrears (30-plus delinquency rate) was 1.45% in November 2017, compared with 1.52% in November 2016. Delinquencies declined in all states except New South Wales (NSW) over the year. Despite an increase, delinquencies in NSW remained low compared to most other states and territories. Delinquency rates were lower in capital cities than other regions of each state or territory. » Delinquencies will increase moderately through 2018. Softening housing market conditions, particularly in the key states of NSW and Victoria, will drive delinquencies moderately higher. Less favourable income dynamics and ongoing volatility in the resources sector will also weigh on mortgage performance. » Western Australia and Queensland dominate the list of worst-performing regions. Nine of the 10 regions with the highest 30-plus delinquency rates in November 2017 were in either Western Australia or Queensland, and many of these regions are exposed to employment industries directly or indirectly related to mining and resources. Postcode 4680 (Barney Point) in Queensland had the highest 30-plus delinquency rate in Australia. » Sydney regions are performing strongly. Eight of the 10 regions with the lowest mortgage delinquency rates in November 2017 were in NSW and seven of these were in Sydney. Ten of the 20 postcodes with the lowest mortgage delinquencies in Australia were in Sydney, while six were in Melbourne. Our semi-annual delinquency map report provides a detailed analysis of the rate of residential mortgage arrears at a national, regional and postcode level in Australia. The report is based on the data contained in our supplementary excel report, titled “Australian residential mortgage delinquency map — November 2017 ” published on 12 April 2018.

Welcome message from author
This document is posted to help you gain knowledge. Please leave a comment to let me know what you think about it! Share it to your friends and learn new things together.
Transcript

STRUCTURED FINANCE
SECTOR IN-DEPTH12 April 2018
TABLE OF CONTENTSSummary 1NATIONAL PERFORMANCE 2PERFORMANCE BY REGION 7PERFORMANCE BY POSTCODE 9STATES IN FOCUS 11Moody’s related publications 17
Contacts
Alena Chen +61.2.9270.8131VP-Senior [email protected]
CLIENT SERVICES
Americas 1-212-553-1653
Asia Pacific 852-3551-3077
Japan 81-3-5408-4100
EMEA 44-20-7772-5454
RMBS - Australia
Mortgage delinquency map - Home loanarrears will increase moderately on housingslowdownSummaryAustralian mortgage delinquencies will increase moderately through 2018 on softer housingmarket conditions, following a decline in home loan arrears over the year to November 2017.
» Mortgage delinquencies have declined. The proportion of Australian residentialmortgages that were more than 30 days in arrears (30-plus delinquency rate) was1.45% in November 2017, compared with 1.52% in November 2016. Delinquenciesdeclined in all states except New South Wales (NSW) over the year. Despite an increase,delinquencies in NSW remained low compared to most other states and territories.Delinquency rates were lower in capital cities than other regions of each state or territory.
» Delinquencies will increase moderately through 2018. Softening housing marketconditions, particularly in the key states of NSW and Victoria, will drive delinquenciesmoderately higher. Less favourable income dynamics and ongoing volatility in theresources sector will also weigh on mortgage performance.
» Western Australia and Queensland dominate the list of worst-performing regions.Nine of the 10 regions with the highest 30-plus delinquency rates in November 2017were in either Western Australia or Queensland, and many of these regions are exposedto employment industries directly or indirectly related to mining and resources. Postcode4680 (Barney Point) in Queensland had the highest 30-plus delinquency rate in Australia.
» Sydney regions are performing strongly. Eight of the 10 regions with the lowestmortgage delinquency rates in November 2017 were in NSW and seven of these werein Sydney. Ten of the 20 postcodes with the lowest mortgage delinquencies in Australiawere in Sydney, while six were in Melbourne.
Our semi-annual delinquency map report provides a detailed analysis of the rate ofresidential mortgage arrears at a national, regional and postcode level in Australia. Thereport is based on the data contained in our supplementary excel report, titled “Australianresidential mortgage delinquency map — November 2017” published on 12 April 2018.

MOODY'S INVESTORS SERVICE STRUCTURED FINANCE
NATIONAL PERFORMANCEDelinquencies down, but will increase through 2018 on property market slowdownThe 30-plus delinquency rate for Australian residential mortgages decreased to 1.45% in November 2017 from 1.52% in November2016.1 Despite this improvement, we expect Australian mortgage delinquencies to increase moderately on average over 2018, becauseof softening housing market conditions, particularly in the key states of NSW and Victoria. Less favourable income dynamics andongoing volatility in the resources sector will also weigh on mortgage performance.
Mortgage delinquencies declined in all states except NSW over the year to November 2017 (Exhibit 1). Delinquencies in NSW remainedlow compared to most other states and territories, despite the increase over the year to November 2017. Western Australia, SouthAustralia and the Northern Territory, where 30-plus delinquency rates declined from record highs, remained the worst performingstates or territories in Australia.2
Exhibit 1
30-plus delinquency rate for Australian states and territories
State/Territory 2011 2012 Nov-13 Nov-14 Nov-15 Nov-16 Nov-17
Nov-17 - Nov-16
change (% pts)
Western Australia 2.14% 1.82% 1.38% 1.23% 1.71% 2.76% 2.50% -0.26
South Australia 1.42% 1.58% 1.43% 1.54% 1.63% 2.16% 1.89% -0.27
Northern Territory 0.94% 0.75% 0.88% 0.49% 0.98% 2.23% 1.81% -0.42
Queensland 2.17% 1.98% 1.36% 1.41% 1.37% 1.75% 1.69% -0.06
Victoria 1.43% 1.51% 1.10% 1.18% 1.19% 1.43% 1.28% -0.15
Tasmania 1.60% 1.44% 1.17% 1.12% 1.68% 1.84% 1.26% -0.58
New South Wales 2.02% 1.99% 1.24% 1.02% 0.85% 0.94% 1.00% 0.06
Australian Capital Territory 1.00% 0.83% 0.68% 0.76% 0.82% 0.91% 0.76% -0.15
Australia 1.87% 1.81% 1.24% 1.19% 1.20% 1.52% 1.45% -0.07
Sources: Moody's Investors Service, periodic investor/servicer reports
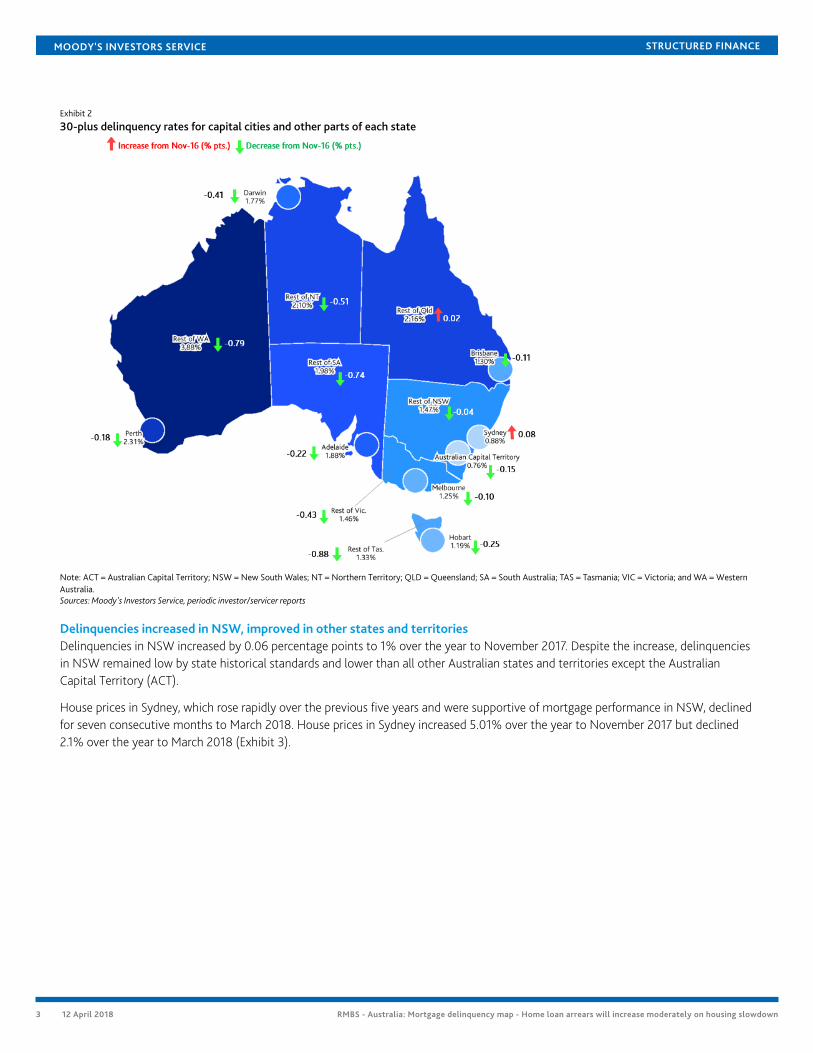
Delinquency rates were lower in capital cities than other regions of each state or territory, reflecting the higher levels of economicdiversity and employment stability in city areas (Exhibit 2). Delinquencies declined in most capital cities and the areas outside capitalcities in most states. Sydney was the only capital city exception; delinquencies increased slightly but remained very low compared tothe rest of Australia. Delinquencies also increased on average in Queensland areas outside of Brisbane.
This publication does not announce a credit rating action. For any credit ratings referenced in this publication, please see the ratings tab on the issuer/entity page onwww.moodys.com for the most updated credit rating action information and rating history.
2 12 April 2018 RMBS - Australia: Mortgage delinquency map - Home loan arrears will increase moderately on housing slowdown
MOODY'S INVESTORS SERVICE STRUCTURED FINANCE
Exhibit 2
30-plus delinquency rates for capital cities and other parts of each state
Note: ACT = Australian Capital Territory; NSW = New South Wales; NT = Northern Territory; QLD = Queensland; SA = South Australia; TAS = Tasmania; VIC = Victoria; and WA = WesternAustralia.Sources: Moody's Investors Service, periodic investor/servicer reports
Delinquencies increased in NSW, improved in other states and territoriesDelinquencies in NSW increased by 0.06 percentage points to 1% over the year to November 2017. Despite the increase, delinquenciesin NSW remained low by state historical standards and lower than all other Australian states and territories except the AustralianCapital Territory (ACT).
House prices in Sydney, which rose rapidly over the previous five years and were supportive of mortgage performance in NSW, declinedfor seven consecutive months to March 2018. House prices in Sydney increased 5.01% over the year to November 2017 but declined2.1% over the year to March 2018 (Exhibit 3).
3 12 April 2018 RMBS - Australia: Mortgage delinquency map - Home loan arrears will increase moderately on housing slowdown

MOODY'S INVESTORS SERVICE STRUCTURED FINANCE
Exhibit 3
Australian house prices changes
-10%
-5%
0%
5%
10%
15%
20%
25%
30%
Ja
n-1
0
Mar-
10
May-1
0
Ju
l-10
Se
p-1
0
No
v-1
0
Ja
n-1
1
Mar-
11
May-1
1
Ju
l-11
Se
p-1
1
No
v-1
1
Ja
n-1
2
Mar-
12
May-1
2
Ju
l-12
Se
p-1
2
No
v-1
2
Ja
n-1
3
Mar-
13
May-1
3
Ju
l-13
Se
p-1
3
No
v-1
3
Ja
n-1
4
Mar-
14
May-1
4
Ju
l-14
Se
p-1
4
No
v-1
4
Ja
n-1
5
Mar-
15
May-1
5
Ju
l-15
Se
p-1
5
No
v-1
5
Ja
n-1
6
Mar-
16
May-1
6
Ju
l-16
Se
p-1
6
No
v-1
6
Ja
n-1
7
Mar-
17
May-1
7
Ju
l-17
Se
p-1
7
No
v-1
7
Ja
n-1
8
Mar-
18
Yo
y %
ch
an
ge
Australia Sydney Melbourne Brisbane Perth Adelaide
Source: CoreLogic
The housing market has slowed in NSW, but mortgage performance continues to benefit from relatively good economic and labourmarket conditions in the state. Low interest rates and a low Australian dollar have resulted in strong household consumption, privateand public investment and a pickup in the education and tourism sectors. NSW final demand (a measure of domestic economic growththat excludes exports) increased 2.9% over the year to December 2017 (Exhibit 4). NSW also has the lowest unemployment rate(4.84% in February 2018 and 4.66% in November 2017) of any state or territory in the country.
Exhibit 4
Change in state final demand (year to December 2017)
4.7% 4.5% 4.5%
3.9%
3.0% 2.9%
-1.8%
-3%
-2%
-1%
0%
1%
2%
3%
4%
5%
Victoria Northern Territory South Australia Tasmania Queensland New South Wales Western Australia
Yo
y %
ch
an
ge
in
fin
al d
em
an
d
Australia-wide average
Note: State final demand is a subset of Gross State Product (GSP) and includes 1) general government final consumption expenditure, 2) household final consumption expenditure 3)private gross capital formation and 4) public gross capital formation. It differs from GSP in that it excludes exports and imports.Source: Australian Bureau of Statistics
In Victoria, the 30-plus delinquency rate declined 0.15 percentage points to 1.28% over the year to November 2017. Like NSW,Victoria's diverse economy benefited from a low Australian dollar and supportive interest rate environment. The housing market inMelbourne has also cooled but to a lesser extent than Sydney. House prices in Melbourne declined for four consecutive months toMarch 2018, but still increased by 10.09% over the year to November 2017 and 5.33% over the year to March 2018.
The ACT had the lowest 30-plus delinquency rate (0.76%) of any state or territory in Australia in November 2017. A high proportion ofborrowers in the ACT are employed by the government, which offers more secure and stable employment compared with jobs in theprivate sector.3
4 12 April 2018 RMBS - Australia: Mortgage delinquency map - Home loan arrears will increase moderately on housing slowdown
MOODY'S INVESTORS SERVICE STRUCTURED FINANCE
The 30-plus delinquency rate in Tasmania improved 0.58 percentage points to 1.26% over the year to November 2017, the biggestimprovement of any state or territory in Australia.
Mortgage delinquency rates in the resource sector-reliant states and territories of Western Australia, the Northern Territory andQueensland declined over the year November 2017, but remain among the highest in the country. The resource sector benefittedfrom higher prices and an improved balance between supply and demand in 2017. Favorable economic growth globally will supportsolid fundamentals again in 2018 but the same level of upward trend in prices is not anticipated. Conditions in the resource sector willremain volatile and subject to downside and environmental risks.
In Western Australia, the 30-plus delinquency rate fell 0.26 percentage points over the year to November 2017. However, at 2.5%, themortgage delinquency rate in Western Australia remains the highest in the country.
The Western Australian economy has benefitted from healthy export volumes for key commodities in 2017. However, excludingexports, Western Australia's final demand fell by 1.8% over the year to December 2017 because of declines in business investment(Exhibit 4). We expect Western Australia's economy to remain soft over the three years to 2021.4
House prices in Perth have declined year-on-year since December 2014, though the rate of decline has slowed over the last two years.Prices in Perth fell by 2.62% over the year to November 2017 and 2.41% over the year to March 2018. The underemployment rate (ameasure of employed persons who want to work more hours than are available to them) in Western Australia was 9.12% in November2017, higher than the national average of 8.34%.5
In the Northern Territory, the 30-plus delinquency rate fell 0.42 percentage points to 1.81% over the year to November 2017. TheNorthern Territory's final demand grew strongly at 4.5% over the year to December 2017, driven by business development in themining and energy sectors, including the Ichthys Liquified Natural Gas project. We expect the Northern Territory's final demand growthto moderate in 2018 and 2019 following completion of the construction phase of Ichthys.6 House prices in Darwin fell 5.47% over theyear to November 2017 and 7.52% over the year to March 2018.
In Queensland, the 30-plus delinquency rate improved marginally by 0.06 percentage points to 1.69% over the year to November2017. Queensland's final demand increased 3% over the year to December 2017. Queensland's economy is relatively more diversifiedand less reliant on resources compared to Western Australia.
In South Australia, the 30-plus delinquency rate fell 0.27 percentage points to 1.89% over the year to November 2017, with mortgageperformance benefitting from economic expansion, which was supported by growth in service-based industries. South Australia's finaldemand grew 4.5% over 2017.
Despite the decline, the delinquency rate in South Australia is the second highest in the country behind Western Australia. Theunemployment and underemployment rates in South Australia were 6.3% and 9.58% in February 2018, the highest and the secondhighest rates in Australia respectively. We expect the cessation of auto manufacturing in South Australia in 2017 will weigh on the stateeconomy in 2018.7
Delinquencies will increase moderately through 2018We expect mortgage delinquencies to increase moderately in 2018, because of softening housing market conditions, particularly in thekey states of NSW and Victoria. Less favourable income dynamics and continued volatility in the resources sector will also weigh onmortgage performance.
NSW and Victoria are the two states most susceptible to a slowdown in the housing market, given that house prices in both statesincreased considerably over the five years before prices declined in recent months. On average across Australia, house prices declinedover six consecutive months to March 2018, driven by declines in Sydney and, to a lesser extent, in Melbourne.
Strong mortgage performance in NSW and Victoria over the last three years, supported by rapidly rising house prices, has offset risingdelinquency rates in resource sector reliant states. However, as the housing market cools, weaker mortgage performance in NSW andVictoria will drive the Australia-wide mortgage delinquency rate up. NSW and Victoria account for the largest proportions (31.41% and25.17% respectively) of mortgage loans in our residential mortgage-backed securities (RMBS) portfolio.
5 12 April 2018 RMBS - Australia: Mortgage delinquency map - Home loan arrears will increase moderately on housing slowdown

MOODY'S INVESTORS SERVICE STRUCTURED FINANCE
In addition, average weekly earnings in Australia have increased just 10%8 over the five years to March 2018, a period over which houseprices have increased by an average of 40%. As a result, households have accumulated record levels of mortgage debt in the past fewyears. Household debt as a proportion of disposable income was 188% in September 2017 compared with 161% in September 2012.9
This increase in household leverage poses a downside risk for mortgage performance. Higher debt levels make households morevulnerable to economic or housing market shocks, and make meeting mortgage repayments more difficult, increasing the risk ofdelinquencies.
Persistently high underemployment could also lead to higher mortgage delinquencies in 2018. Australia's unemployment rate was5.56% in February 2018, slightly below the 5.79% average for the last five years. However, the underemployment rate is much higherat 8.37%, and is above the 8.23% average for the last five years (Exhibit 5). Underemployment results in lower income and reducedcapacity to make mortgage repayments, increasing the risk of delinquencies and defaults.
Exhibit 5
Australian unemployment and underemployment rates
4.5%
5.0%
5.5%
6.0%
6.5%
7.0%
7.5%
8.0%
8.5%
9.0%
Feb
-13
May-1
3
Au
g-1
3
No
v-1
3
Feb
-14
May-1
4
Au
g-1
4
No
v-1
4
Feb
-15
May-1
5
Au
g-1
5
No
v-1
5
Feb
-16
May-1
6
Au
g-1
6
No
v-1
6
Feb
-17
May-1
7
Au
g-1
7
No
v-1
7
Feb
-18
Underemployment rate 2013-2018 average underemployment rate Unemployment rate 2013-2018 average unemployment rate
Source: Australian Bureau of Statistics
The unwinding of the mining investment boom has weighed on mortgage performance in resource-reliant states such as WesternAustralia, the Northern Territory and Queensland, over the last three years. The bulk of the economic adjustment from the unwindingof the mining investment boom has now occurred, but we expect ongoing volatility in the resources sector will continue to weigh onmortgage performance for some time.
6 12 April 2018 RMBS - Australia: Mortgage delinquency map - Home loan arrears will increase moderately on housing slowdown

MOODY'S INVESTORS SERVICE STRUCTURED FINANCE
PERFORMANCE BY REGIONMortgage performance varied significantly between different regions in Australia over the year to November 2017. The 30-plusdelinquency rate increased in 32 regions over the year and fell in 55 regions.
Worst regions: Western Australia and Queensland continue to underperformRegions with exposure to the resource and mining sectors dominated the list of areas with the highest delinquencies in November2017. Nine of the 10 regions with the highest 30-plus delinquency rates were in either Western Australia or Queensland, and many ofthese regions are exposed to employment industries directly or indirectly related to mining and resources.
Six of the 10 worst regions — Western Australia Outback, Queensland Outback, Mackay, Western Australia Wheat Belt, Mandurah andFitzroy — have consistently been among the worst performing regions in the country over the last three to four years. Among theseworst performing regions, Fitzroy recorded the biggest increase in delinquencies over the year to November 2017.
The weighted average current loan to value ratios for the worst performing regions were typically higher than the national average of63.2%.
Exhibit 6
Australia's 10 worst performing regions
Region State/Territory WACLTV
Nov-16
30-plus delinquency
Nov-17
30-plus delinquency
Nov-17 - Nov-16
change (% pts)
Western Australia - Outback Western Australia 66.2% 6.54% 5.33% -1.21
Western Australia - Wheat Belt Western Australia 62.9% 3.80% 4.37% 0.57
Queensland - Outback Queensland 68.4% 5.51% 4.23% -1.28
Mackay Queensland 67.4% 4.24% 3.91% -0.33
Fitzroy Queensland 67.6% 2.82% 3.53% 0.71
Mandurah Western Australia 67.6% 3.46% 3.08% -0.38
Townsville Queensland 67.0% 3.14% 2.76% -0.38
Darling Downs - Maranoa Queensland 65.5% 2.71% 2.69% -0.02
South Australia - Outback South Australia 67.3% 3.55% 2.66% -0.89
Perth - North East Western Australia 66.2% 2.97% 2.62% -0.35
Note: WACLTV — Weighted average current loan to value ratio, weighted by current balanceSources: Moody's Investors Service, periodic investor/servicer reports
Best regions: Sydney regions performing stronglyEight of the 10 regions with the lowest mortgage delinquency rates over the year to November 2017 were in NSW and seven of thesewere in Sydney.
The South East region in Tasmania was also among the best performing and most improved regions in the country. However, there areonly a limited number of loans (523) from this region in our RMBS portfolio. The small sample makes performance trends in the regionrelatively more volatile compared to regions with thousands of loans.
The main industries for the top performing regions are professional services industries, characteristic of metropolitan areas. Theseoccupations tend to earn higher wages and have more stable economic and employment conditions compared to mining- andconstruction-related employment.
The weighted average current loan to value ratios for the best-performing regions were typically lower than the national average of63.2%.
7 12 April 2018 RMBS - Australia: Mortgage delinquency map - Home loan arrears will increase moderately on housing slowdown

MOODY'S INVESTORS SERVICE STRUCTURED FINANCE
Exhibit 7
Australia's 10 best performing regions
Region State/Territory WACLTV
Nov-16
30-plus delinquency
Nov-17
30-plus delinquency
Nov-17 - Nov-16
change (% pts)
Sydney - Northern Beaches New South Wales 54.8% 0.68% 0.34% -0.34
Sydney - Eastern Suburbs New South Wales 54.8% 0.43% 0.36% -0.07
Melbourne - Inner East Victoria 59.4% 0.71% 0.47% -0.24
Sydney - Ryde New South Wales 58.3% 0.48% 0.53% 0.05
Sydney - North Sydney and Hornsby New South Wales 56.1% 0.36% 0.58% 0.22
South East Tasmania 62.2% 2.28% 0.62% -1.66
Sydney - Baulkham Hills and Hawkesbury New South Wales 57.9% 0.75% 0.71% -0.04
Sydney - City and Inner South New South Wales 61.3% 0.62% 0.73% 0.11
Coffs Harbour - Grafton New South Wales 64.0% 1.45% 0.73% -0.72
Sydney - Inner West New South Wales 58.2% 0.75% 0.75% 0.00
Note: WACLTV — Weighted average current loan to value ratio, weighted by current balanceSources: Moody's Investors Service, periodic investor/servicer reports
8 12 April 2018 RMBS - Australia: Mortgage delinquency map - Home loan arrears will increase moderately on housing slowdown

MOODY'S INVESTORS SERVICE STRUCTURED FINANCE
PERFORMANCE BY POSTCODE10
Worst postcodes: Queensland and Western Australian suburbs have highest delinquenciesPostcode 4680 (Barney Point) in Queensland had the highest 30-plus delinquency rate (4.95%) in Australia in November2017, followed by postcodes 4825 (Alpurrurulam) in Queensland and 6066 (Ballajura) in Western Australia. In postcode 4825(Alpurrurulam), the delinquency rate declined significantly (3.45 percentage points) over the year to November 2017, but remainedamong the highest in the country.
The 30-plus delinquency rate in each of the 20 worst-performing postcodes exceeded 2.8%, compared with the national average of1.45%. Delinquency rates in four of the 20 worst-performing postcodes deteriorated by more than one percentage point over the yearto November 2017. Six of the 20 worst-performing postcodes were in Queensland and nine were in Western Australia.
The weighted average current loan to value ratios for the worst performing postcodes were typically higher than the national averageof 63.2%.
Exhibit 8
Australia's 20 worst performing postcodes
Postcode Locality Region State/Territory WACLTV
Nov-16
30-plus
delinquency
Nov-17
30-plus
delinquency
Nov-17 - Nov-16
change (% pts)
4680 Barney Point Fitzroy Queensland 69.1% 3.00% 4.95% 1.95
4825 Alpurrurulam Queensland - Outback Queensland 72.5% 7.76% 4.31% -3.45
6066 Ballajura Perth - North East Western Australia 65.8% 4.78% 4.00% -0.78
6056 Baskerville Perth - North East Western Australia 64.8% 4.25% 3.72% -0.53
6030 Clarkson Perth - North West Western Australia 70.2% 2.96% 3.69% 0.73
4114 Kingston Logan - Beaudesert Queensland 71.1% 3.53% 3.69% 0.16
6430 Binduli Western Australia - Outback Western Australia 71.5% 3.42% 3.49% 0.07
6330 Albany Western Australia - Wheat Belt Western Australia 61.9% 2.84% 3.45% 0.61
4815 Condon Townsville Queensland 70.0% 4.10% 3.35% -0.75
6230 Bunbury Bunbury Western Australia 66.8% 3.52% 3.23% -0.29
6076 Bickley Perth - South East Western Australia 58.8% 3.16% 3.11% -0.05
3020 Albion Melbourne - West Victoria 64.8% 2.73% 3.03% 0.30
3840 Driffield Latrobe - Gippsland Victoria 66.6% 2.63% 3.03% 0.40
6210 Coodanup Mandurah Western Australia 67.2% 3.44% 3.01% -0.43
6064 Alexander Heights Perth - North West Western Australia 68.1% 2.83% 2.99% 0.16
4019 Clontarf Moreton Bay - North Queensland 67.0% 1.39% 2.95% 1.56
4817 Alice River Townsville Queensland 66.7% 3.20% 2.93% -0.27
2759 Erskine Park Sydney - Outer West and Blue New South Wales 62.6% 0.66% 2.90% 2.24
3023 Burnside Melbourne - West Victoria 66.2% 3.50% 2.88% -0.62
3173 Keysborough Melbourne - South East Victoria 63.6% 1.14% 2.88% 1.74
Note: WACLTV — Weighted average current loan to value ratio, weighted by current balanceSources: Moody's Investors Service, periodic investor/servicer reports
Best postcodes: Sydney suburbs strongSix postcodes had zero mortgage delinquencies in November 2017, making them the best performing in the country. Ten of the 20best-performing postcodes in Australia were in Sydney, while six were in Melbourne.
Most best-performing postcodes were located in capital city regions where employment is concentrated in professional services.
The weighted average current loan to value ratios for the best performing regions were typically lower than the national average of63.2%.
9 12 April 2018 RMBS - Australia: Mortgage delinquency map - Home loan arrears will increase moderately on housing slowdown

MOODY'S INVESTORS SERVICE STRUCTURED FINANCE
Exhibit 9
Australia's 20 best performing postcodes
Postcode Locality Region State/Territory WACLTV
Nov-16
30-plus
delinquency
Nov-17
30-plus
delinquency
Nov-17 - Nov-16
change (% pts)
2065 Crows Nest Sydney - North Sydney and Hornsby New South Wales 57.8% 0.00% 0.00% 0.00
2088 Mosman Sydney - North Sydney and Hornsby New South Wales 49.2% 0.27% 0.00% -0.27
2118 Carlingford Sydney - Parramatta New South Wales 60.4% 0.79% 0.00% -0.79
3146 Glen Iris Melbourne - Inner East Victoria 55.6% 0.94% 0.00% -0.94
3204 Bentleigh Melbourne - Inner South Victoria 59.2% 0.97% 0.00% -0.97
4160 Ormiston Brisbane - East Queensland 61.8% 1.20% 0.00% -1.20
2010 Darlinghurst Sydney - City and Inner South New South Wales 59.5% 0.02% 0.02% 0.00
3084 Banyule Melbourne - North East Victoria 55.2% 0.00% 0.10% 0.10
2093 Balgowlah Sydney - Northern Beaches New South Wales 53.7% 0.95% 0.13% -0.82
3131 Brentford Square Melbourne - Outer East Victoria 61.9% 0.17% 0.17% 0.00
4210 Guanaba Gold Coast Queensland 68.1% 1.54% 0.18% -1.36
2160 Merrylands Sydney - Parramatta New South Wales 61.3% 0.28% 0.20% -0.08
2067 Chatswood Sydney - North Sydney and Hornsby New South Wales 60.3% 0.10% 0.20% 0.10
4109 Macgregor Brisbane - South Queensland 63.7% 0.68% 0.22% -0.46
2210 Lugarno Sydney - Inner South West New South Wales 58.6% 0.28% 0.23% -0.05
3040 Aberfeldie Melbourne - Inner Victoria 58.5% 1.02% 0.24% -0.78
2460 Alumy Creek Coffs Harbour - Grafton New South Wales 64.5% 1.78% 0.25% -1.53
2122 Eastwood Sydney - Ryde New South Wales 60.8% 0.18% 0.25% 0.07
2200 Bankstown Sydney - Inner South West New South Wales 61.2% 0.98% 0.26% -0.72
3133 Vermont Melbourne - Outer East Victoria 59.2% 0.16% 0.26% 0.10
Note: WACLTV — Weighted average current loan to value ratio, weighted by current balanceSources: Moody's Investors Service, periodic investor/servicer reports
10 12 April 2018 RMBS - Australia: Mortgage delinquency map - Home loan arrears will increase moderately on housing slowdown

MOODY'S INVESTORS SERVICE STRUCTURED FINANCE
STATES IN FOCUSNSW
Exhibit 10
30-plus delinquency rates for NSW regions
Region WACLTV
Nov-16
30-plus delinquency
Nov-17
30-plus delinquency
Nov-17 - Nov-16
change (% pts)
Far West and Orana 68.3% 4.55% 2.53% -2.02
Central West 66.5% 2.07% 2.47% 0.40
New England and North West 66.1% 1.40% 2.04% 0.64
Hunter Valley exc Newcastle 68.4% 1.62% 1.81% 0.19
Richmond - Tweed 61.0% 1.43% 1.64% 0.21
Sydney - Blacktown 63.3% 1.21% 1.53% 0.32
Capital Region 62.8% 1.93% 1.52% -0.41
Sydney - Outer West and Blue Mountains 62.6% 1.03% 1.44% 0.41
Murray 66.4% 1.21% 1.42% 0.21
Sydney - Sutherland 56.2% 0.81% 1.39% 0.58
Sydney - South West 60.8% 1.19% 1.35% 0.16
Southern Highlands and Shoalhaven 59.9% 1.16% 1.32% 0.16
Mid North Coast 64.2% 1.95% 1.31% -0.64
Riverina 65.3% 1.51% 1.24% -0.27
Newcastle and Lake Macquarie 64.6% 1.01% 1.24% 0.23
Sydney - Outer South West 63.4% 1.18% 1.23% 0.05
Central Coast 63.5% 1.55% 1.16% -0.39
Illawarra 60.5% 1.17% 1.07% -0.10
Sydney - Parramatta 63.1% 0.95% 0.91% -0.04
Sydney - Inner South West 59.6% 0.83% 0.89% 0.06
Sydney - Inner West 58.2% 0.75% 0.75% 0.00
Coffs Harbour - Grafton 64.0% 1.45% 0.73% -0.72
Sydney - City and Inner South 61.3% 0.62% 0.73% 0.11
Sydney - Baulkham Hills and Hawkesbury 57.9% 0.75% 0.71% -0.04
Sydney - North Sydney and Hornsby 56.1% 0.36% 0.58% 0.22
Sydney - Ryde 58.3% 0.48% 0.53% 0.05
Sydney - Eastern Suburbs 54.8% 0.43% 0.36% -0.07
Sydney - Northern Beaches 54.8% 0.68% 0.34% -0.34
Note: WACLTV — Weighted average current loan to value ratio, weighted by current balanceSources: Moody's Investors Service, periodic investor/servicer reports
Exhibit 11
NSW' 10 worst performing postcodes
Postcode Locality Region WACLTV
Nov-16
30-plus delinquency
Nov-17
30-plus delinquency
Nov-17 - Nov-16
change (% pts)
2759 Erskine Park Sydney - Outer West and Blue
Mountains
62.6% 0.66% 2.90% 2.24
2770 Bidwill Sydney - Blacktown 66.7% 1.81% 2.71% 0.90
2290 Bennetts Green Newcastle and Lake Macquarie 64.4% 0.76% 2.58% 1.82
2320 Aberglasslyn Hunter Valley exc Newcastle 69.8% 1.61% 2.45% 0.84
2795 Abercrombie Central West 64.1% 1.61% 2.34% 0.73
2760 Colyton Sydney - Outer West and Blue
Mountains
69.0% 0.71% 2.34% 1.63
2480 Bentley Richmond - Tweed 63.1% 1.66% 2.21% 0.55
2800 Belgravia Central West 68.8% 2.53% 2.21% -0.32
2168 Ashcroft Sydney - South West 62.6% 2.53% 2.18% -0.35
2234 Alfords Point Sydney - Sutherland 55.9% 0.17% 2.11% 1.94
Note: WACLTV — Weighted average current loan to value ratio, weighted by current balanceSources: Moody's Investors Service, periodic investor/servicer reports
11 12 April 2018 RMBS - Australia: Mortgage delinquency map - Home loan arrears will increase moderately on housing slowdown
MOODY'S INVESTORS SERVICE STRUCTURED FINANCE
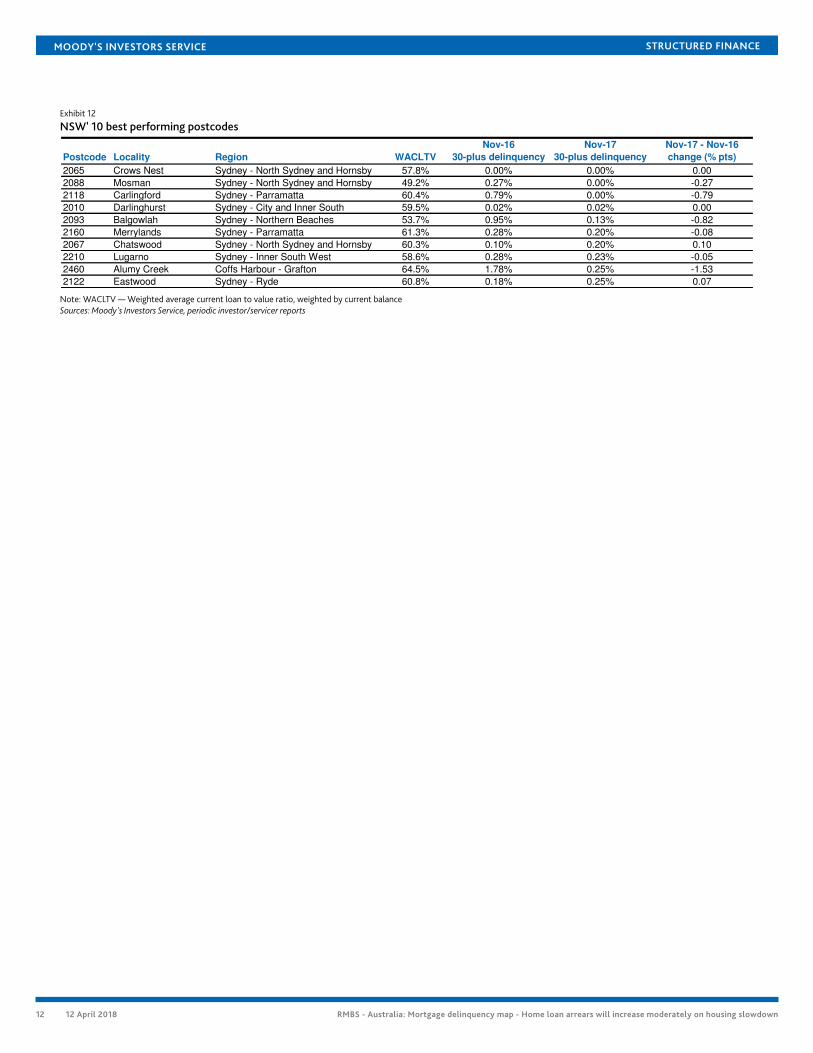
Exhibit 12
NSW' 10 best performing postcodes
Postcode Locality Region WACLTV
Nov-16
30-plus delinquency
Nov-17
30-plus delinquency
Nov-17 - Nov-16
change (% pts)
2065 Crows Nest Sydney - North Sydney and Hornsby 57.8% 0.00% 0.00% 0.00
2088 Mosman Sydney - North Sydney and Hornsby 49.2% 0.27% 0.00% -0.27
2118 Carlingford Sydney - Parramatta 60.4% 0.79% 0.00% -0.79
2010 Darlinghurst Sydney - City and Inner South 59.5% 0.02% 0.02% 0.00
2093 Balgowlah Sydney - Northern Beaches 53.7% 0.95% 0.13% -0.82
2160 Merrylands Sydney - Parramatta 61.3% 0.28% 0.20% -0.08
2067 Chatswood Sydney - North Sydney and Hornsby 60.3% 0.10% 0.20% 0.10
2210 Lugarno Sydney - Inner South West 58.6% 0.28% 0.23% -0.05
2460 Alumy Creek Coffs Harbour - Grafton 64.5% 1.78% 0.25% -1.53
2122 Eastwood Sydney - Ryde 60.8% 0.18% 0.25% 0.07
Note: WACLTV — Weighted average current loan to value ratio, weighted by current balanceSources: Moody's Investors Service, periodic investor/servicer reports
12 12 April 2018 RMBS - Australia: Mortgage delinquency map - Home loan arrears will increase moderately on housing slowdown

MOODY'S INVESTORS SERVICE STRUCTURED FINANCE
Victoria
Exhibit 13
30-plus delinquency rates for Victorian regions
Region WACLTV
Nov-16
30-plus delinquency
Nov-17
30-plus delinquency
Nov-17 - Nov-16
change (% pts)
Warrnambool and South West 63.7% 1.74% 1.95% 0.21
Bendigo 63.1% 1.65% 1.84% 0.19
Melbourne - West 66.4% 1.96% 1.77% -0.19
Melbourne - South East 64.9% 1.53% 1.64% 0.11
Latrobe - Gippsland 64.0% 2.36% 1.63% -0.73
Melbourne - North West 64.9% 2.07% 1.61% -0.46
Mornington Peninsula 62.6% 1.87% 1.55% -0.32
Shepparton 65.4% 2.35% 1.41% -0.94
Melbourne - North East 63.2% 1.47% 1.39% -0.08
North West 67.0% 1.71% 1.38% -0.33
Geelong 63.1% 1.36% 1.25% -0.11
Ballarat 66.2% 1.86% 1.23% -0.63
Hume 66.0% 2.88% 1.19% -1.69
Melbourne - Outer East 60.9% 1.26% 1.13% -0.13
Melbourne - Inner 63.2% 0.85% 0.95% 0.10
Melbourne - Inner South 57.9% 1.12% 0.77% -0.35
Melbourne - Inner East 59.4% 0.71% 0.47% -0.24
Note: WACLTV — Weighted average current loan to value ratio, weighted by current balanceSources: Moody's Investors Service, periodic investor/servicer reports
Exhibit 14
Victoria's 10 worst performing postcodes
Postcode Locality Region WACLTV
Nov-16
30-plus delinquency
Nov-17
30-plus delinquency
Nov-17 - Nov-16
change (% pts)
3020 Albion Melbourne - West 64.8% 2.73% 3.03% 0.30
3840 Driffield Latrobe - Gippsland 66.6% 2.63% 3.03% 0.40
3023 Burnside Melbourne - West 66.2% 3.50% 2.88% -0.62
3173 Keysborough Melbourne - South East 63.6% 1.14% 2.88% 1.74
3021 Albanvale Melbourne - West 64.3% 2.48% 2.47% -0.01
3024 Mambourin Melbourne - West 71.3% 1.55% 2.44% 0.89
3064 Craigieburn Melbourne - North West 70.2% 3.14% 2.36% -0.78
3172 Dingley Village Melbourne - South East 60.1% 1.20% 2.29% 1.09
3037 Calder Park Melbourne - West 63.4% 2.38% 2.19% -0.19
3429 Sunbury Melbourne - North West 66.3% 1.64% 2.12% 0.48
Note: WACLTV — Weighted average current loan to value ratio, weighted by current balanceSources: Moody's Investors Service, periodic investor/servicer reports
Exhibit 15
Victoria's 10 best performing postcodes
Postcode Locality Region WACLTV
Nov-16
30-plus delinquency
Nov-17
30-plus delinquency
Nov-17 - Nov-16
change (% pts)
3146 Glen Iris Melbourne - Inner East 55.6% 0.94% 0.00% -0.94
3204 Bentleigh Melbourne - Inner South 59.2% 0.97% 0.00% -0.97
3084 Banyule Melbourne - North East 55.2% 0.00% 0.10% 0.10
3131 Brentford Square Melbourne - Outer East 61.9% 0.17% 0.17% 0.00
3040 Aberfeldie Melbourne - Inner 58.5% 1.02% 0.24% -0.78
3133 Vermont Melbourne - Outer East 59.2% 0.16% 0.26% 0.10
3070 Northcote Melbourne - Inner 57.0% 0.67% 0.27% -0.40
3006 South Wharf Melbourne - Inner 69.5% 0.51% 0.36% -0.15
3130 Blackburn Melbourne - Inner East 59.0% 0.84% 0.36% -0.48
3056 Brunswick Melbourne - Inner 63.5% 0.02% 0.42% 0.40
Note: WACLTV — Weighted average current loan to value ratio, weighted by current balanceSources: Moody's Investors Service, periodic investor/servicer reports
13 12 April 2018 RMBS - Australia: Mortgage delinquency map - Home loan arrears will increase moderately on housing slowdown

MOODY'S INVESTORS SERVICE STRUCTURED FINANCE
Queensland
Exhibit 16
30-plus delinquency rates for Queensland regions
Region WACLTV
Nov-16
30-plus delinquency
Nov-17
30-plus delinquency
Nov-17 - Nov-16
change (% pts)
Queensland - Outback 68.4% 5.51% 4.23% -1.28
Mackay 67.4% 4.24% 3.91% -0.33
Fitzroy 67.6% 2.82% 3.53% 0.71
Townsville 67.0% 3.14% 2.76% -0.38
Darling Downs - Maranoa 65.5% 2.71% 2.69% -0.02
Wide Bay 65.8% 2.20% 1.96% -0.24
Logan - Beaudesert 68.1% 2.48% 1.93% -0.55
Ipswich 69.3% 1.85% 1.93% 0.08
Cairns 64.7% 1.76% 1.82% 0.06
Moreton Bay - North 67.3% 2.07% 1.75% -0.32
Gold Coast 66.6% 1.52% 1.69% 0.17
Sunshine Coast 63.4% 1.75% 1.57% -0.18
Toowoomba 67.3% 1.40% 1.53% 0.13
Moreton Bay - South 66.6% 1.36% 1.30% -0.06
Brisbane - West 60.9% 1.04% 1.17% 0.13
Brisbane - East 64.1% 1.37% 1.07% -0.30
Brisbane - South 63.6% 1.04% 0.93% -0.11
Brisbane - North 65.5% 0.79% 0.89% 0.10
Brisbane Inner City 64.0% 0.86% 0.88% 0.02
Note: WACLTV — Weighted average current loan to value ratio, weighted by current balanceSources: Moody's Investors Service, periodic investor/servicer reports
Exhibit 17
Queensland's 10 worst performing postcodes
Postcode Locality Region WACLTV
Nov-16
30-plus delinquency
Nov-17
30-plus delinquency
Nov-17 - Nov-16
change (% pts)
4680 Barney Point Fitzroy 69.1% 3.00% 4.95% 1.95
4825 Alpurrurulam Queensland - Outback 72.5% 7.76% 4.31% -3.45
4114 Kingston Logan - Beaudesert 71.1% 3.53% 3.69% 0.16
4815 Condon Townsville 70.0% 4.10% 3.35% -0.75
4019 Clontarf Moreton Bay - North 67.0% 1.39% 2.95% 1.56
4817 Alice River Townsville 66.7% 3.20% 2.93% -0.27
4818 Beach Holm Townsville 72.4% 3.04% 2.77% -0.27
4740 Alexandra Mackay 67.3% 4.06% 2.77% -1.29
4123 Rochedale Logan - Beaudesert 65.3% 1.37% 2.73% 1.36
4812 Currajong Townsville 65.7% 3.02% 2.63% -0.39
Note: WACLTV — Weighted average current loan to value ratio, weighted by current balanceSources: Moody's Investors Service, periodic investor/servicer reports
Exhibit 18
Queensland's 10 best performing postcodes
Postcode Locality Region WACLTV
Nov-16
30-plus delinquency
Nov-17
30-plus delinquency
Nov-17 - Nov-16
change (% pts)
4160 Ormiston Brisbane - East 61.8% 1.20% 0.00% -1.20
4210 Guanaba Gold Coast 68.1% 1.54% 0.18% -1.36
4109 Macgregor Brisbane - South 63.7% 0.68% 0.22% -0.46
4032 Chermside Brisbane - North 67.9% 0.81% 0.27% -0.54
4105 Moorooka Brisbane - South 64.2% 1.01% 0.40% -0.61
4051 Alderley Brisbane Inner City 62.3% 0.65% 0.43% -0.22
4573 Coolum Beach Sunshine Coast 64.2% 0.47% 0.46% -0.01
4171 Balmoral Brisbane Inner City 63.0% 1.77% 0.50% -1.27
4000 Brisbane Adelaide Brisbane Inner City 65.7% 0.50% 0.52% 0.02
4068 Chelmer Brisbane - West 60.6% 0.30% 0.52% 0.22
Note: WACLTV — Weighted average current loan to value ratio, weighted by current balanceSources: Moody's Investors Service, periodic investor/servicer reports
14 12 April 2018 RMBS - Australia: Mortgage delinquency map - Home loan arrears will increase moderately on housing slowdown

MOODY'S INVESTORS SERVICE STRUCTURED FINANCE
Western Australia
Exhibit 19
30-plus delinquency rates for Western Australian regions
Region WACLTV
Nov-16
30-plus delinquency
Nov-17
30-plus delinquency
Nov-17 - Nov-16
change (% pts)
Western Australia - Outback 66.2% 6.54% 5.33% -1.21
Western Australia - Wheat Belt 62.9% 3.80% 4.37% 0.57
Mandurah 67.6% 3.46% 3.08% -0.38
Perth - North East 66.2% 2.97% 2.62% -0.35
Perth - South East 66.4% 2.51% 2.33% -0.18
Perth - North West 65.5% 2.46% 2.33% -0.13
Bunbury 65.1% 3.04% 2.22% -0.82
Perth - South West 65.9% 2.64% 2.21% -0.43
Perth - Inner 57.6% 1.33% 1.66% 0.33
Note: WACLTV — Weighted average current loan to value ratio, weighted by current balanceSources: Moody's Investors Service, periodic investor/servicer reports
Exhibit 20
Western Australia's 10 worst performing postcodes
Postcode Locality Region WACLTV
Nov-16
30-plus delinquency
Nov-17
30-plus delinquency
Nov-17 - Nov-16
change (% pts)
6066 Ballajura Perth - North East 65.8% 4.78% 4.00% -0.78
6056 Baskerville Perth - North East 64.8% 4.25% 3.72% -0.53
6030 Clarkson Perth - North West 70.2% 2.96% 3.69% 0.73
6430 Binduli Western Australia - Outback 71.5% 3.42% 3.49% 0.07
6330 Albany Western Australia - Wheat Belt 61.9% 2.84% 3.45% 0.61
6230 Bunbury Bunbury 66.8% 3.52% 3.23% -0.29
6076 Bickley Perth - South East 58.8% 3.16% 3.11% -0.05
6210 Coodanup Mandurah 67.2% 3.44% 3.01% -0.43
6064 Alexander Heights Perth - North West 68.1% 2.83% 2.99% 0.16
6054 Ashfield Perth - North East 64.1% 1.41% 2.87% 1.46
Note: WACLTV — Weighted average current loan to value ratio, weighted by current balanceSources: Moody's Investors Service, periodic investor/servicer reports
Exhibit 21
Western Australia's 10 best performing postcodes
Postcode Locality Region WACLTV
Nov-16
30-plus delinquency
Nov-17
30-plus delinquency
Nov-17 - Nov-16
change (% pts)
6019 Scarborough Perth - North West 62.4% 0.62% 0.76% 0.14
6152 Como Perth - South East 59.7% 0.96% 0.88% -0.08
6060 Joondanna Perth - North West 65.5% 2.22% 0.94% -1.28
6062 Embleton Perth - North East 62.6% 1.89% 1.11% -0.78
6028 Burns Beach Perth - North West 62.9% 1.54% 1.12% -0.42
6018 Churchlands Perth - North West 61.0% 0.47% 1.32% 0.85
6171 Baldivis Perth - South West 74.7% 2.20% 1.53% -0.67
6155 Canning Vale Perth - South East 62.1% 1.27% 1.60% 0.33
6069 Aveley Perth - North East 72.1% 2.88% 1.71% -1.17
6055 Brabham Perth - North East 71.9% 4.15% 1.76% -2.39
Note: WACLTV — Weighted average current loan to value ratio, weighted by current balanceSources: Moody's Investors Service, periodic investor/servicer reports
15 12 April 2018 RMBS - Australia: Mortgage delinquency map - Home loan arrears will increase moderately on housing slowdown

MOODY'S INVESTORS SERVICE STRUCTURED FINANCE
South Australia
Exhibit 22
30-plus delinquency rates for South Australian regions
Region WACLTV
Nov-16
30-plus delinquency
Nov-17
30-plus delinquency
Nov-17 - Nov-16
change (% pts)
South Australia - Outback 67.3% 3.55% 2.66% -0.89
Adelaide - North 67.3% 2.77% 2.24% -0.53
Adelaide - Central and Hills 61.6% 1.75% 1.90% 0.15
Barossa - Yorke - Mid North 64.7% 2.79% 1.85% -0.94
South Australia - South East 65.2% 2.33% 1.76% -0.57
Adelaide - South 63.8% 1.98% 1.73% -0.25
Adelaide - West 62.6% 1.69% 1.48% -0.21
Note: WACLTV — Weighted average current loan to value ratio, weighted by current balanceSources: Moody's Investors Service, periodic investor/servicer reports
Exhibit 23
30-plus delinquency rates for South Australian postcodes
Postcode Locality Region WACLTV
Nov-16
30-plus delinquency
Nov-17
30-plus delinquency
Nov-17 - Nov-16
change (% pts)
5159 Aberfoyle Park Adelaide - South 63.5% 2.63% 2.70% 0.07
5125 Golden Grove Adelaide - North 63.0% 1.54% 2.52% 0.98
5109 Brahma Lodge Adelaide - North 65.8% 4.00% 2.46% -1.54
5162 Morphett Vale Adelaide - South 67.1% 2.28% 2.16% -0.12
5108 Paralowie Adelaide - North 69.1% 4.11% 1.99% -2.12
5114 Andrews Farm Adelaide - North 70.4% 2.79% 1.66% -1.13
5095 Mawson Lakes Adelaide - North 69.7% 2.38% 1.23% -1.15
5158 Hallett Cove Adelaide - South 63.9% 1.15% 0.87% -0.28
Note: WACLTV — Weighted average current loan to value ratio, weighted by current balanceSources: Moody's Investors Service, periodic investor/servicer reports
16 12 April 2018 RMBS - Australia: Mortgage delinquency map - Home loan arrears will increase moderately on housing slowdown

MOODY'S INVESTORS SERVICE STRUCTURED FINANCE
Moody’s related publicationsSector Comments:
» Heard from the market: Global structured finance conference 2018 February 2018
» RMBS - Australia: Deeper market for green deals will be credit positive February 2018
» Mitigating factors will minimize risks posed by aging populations January 2018
» Delinquencies rising, issuance strong September 2017
» Rising defaults in Western Australia underscore housing investment loan risks, August 2017
» Structured finance - Australia: Bank downgrades have limited impact on structured finance, June 2017
» Australia's RMBS Will Benefit from Proposal to Expand Regulator's Powers over Mortgage Lending, May 2017
» New Limits on Interest-Only Mortgages Will Curb Riskier Lending, April 2017
» Alt-Doc Mortgages Subject to Stricter Underwriting than Pre-2008 Low-Doc Mortgages, March 2017
» Housing Market Imbalances Growing in Some States, March 2017
» Heard from the Market: Global Structured Finance Conference 2017, March 2017
» Rising Housing Prices Provide Equity Cushion to Absorb Losses, January 2017
Outlook:
» Australia : 2018 outlook - Delinquencies will increase moderately from low levels, November 2017
Performance:
» Global Structured Finance Collateral Performance Review
» Australian RMBS Performnce Update - Q4 2017 - Excel Data
Rating Methodology:
» Moody's Approach to Rating RMBS Using the MILAN Framework
» RMBS Rating Methodology Supplement - Australia
To access any of these reports, click on the entry above. Note that these references are current as of the date of publication of thisreport and that more recent reports may be available. All research may not be available to all clients.
17 12 April 2018 RMBS - Australia: Mortgage delinquency map - Home loan arrears will increase moderately on housing slowdown

MOODY'S INVESTORS SERVICE STRUCTURED FINANCE
Endnotes1 This report compares delinquencies between November 2017 and November 2016 rather than May 2017 (the period for our previous mortgage
delinquency map report) to avoid differences caused by seasonal fluctuations.
2 Our records began in 2005. See Australian Residential Mortgage Delinquency Map — November 2017 for all historical 30-plus delinquency rates.
3 The populations in the ACT, the Northern Territory, South Australia, and Tasmania are all relatively small. Mortgages from these states and territoriesaccount for just 2.2% (ACT), 0.76% (the Northern Territory), 4.71% (South Australia) and 1.04% (Tasmania) of the loans in our RMBS portfolio. SeeAustralian Residential Mortgage Delinquency Map — November 2017, Appendix 1.
4 See (State of), Western Australia: Update to discussion of key credit factors, 3 November 2017.
5 Source: Australian Bureau of Statistics.
6 See Northern Territory of Australia: Update to Discussion of Key Credit Factors, 31 July 2017.
7 See South Australia (State of): Update to discussion of key credit factors, 5 October 2017.
8 Source: Australian Bureau of Statistics.
9 Source: Reserve Bank of Australia. The household debt level is based on gross household debt and does not account for deposits in mortgage offsetaccounts.
10 Postcode analysis has several deficiencies, including the fact that it is difficult to apply meaningful analytical judgment at such a granular level. To ensurethat results are meaningful, we have excluded postcodes with less than 400 loans.
18 12 April 2018 RMBS - Australia: Mortgage delinquency map - Home loan arrears will increase moderately on housing slowdown

MOODY'S INVESTORS SERVICE STRUCTURED FINANCE
© 2018 Moody’s Corporation, Moody’s Investors Service, Inc., Moody’s Analytics, Inc. and/or their licensors and affiliates (collectively, “MOODY’S”). All rights reserved.
CREDIT RATINGS ISSUED BY MOODY'S INVESTORS SERVICE, INC. AND ITS RATINGS AFFILIATES (“MIS”) ARE MOODY’S CURRENT OPINIONS OF THE RELATIVE FUTURE CREDITRISK OF ENTITIES, CREDIT COMMITMENTS, OR DEBT OR DEBT-LIKE SECURITIES, AND MOODY’S PUBLICATIONS MAY INCLUDE MOODY’S CURRENT OPINIONS OF THERELATIVE FUTURE CREDIT RISK OF ENTITIES, CREDIT COMMITMENTS, OR DEBT OR DEBT-LIKE SECURITIES. MOODY’S DEFINES CREDIT RISK AS THE RISK THAT AN ENTITYMAY NOT MEET ITS CONTRACTUAL, FINANCIAL OBLIGATIONS AS THEY COME DUE AND ANY ESTIMATED FINANCIAL LOSS IN THE EVENT OF DEFAULT. CREDIT RATINGSDO NOT ADDRESS ANY OTHER RISK, INCLUDING BUT NOT LIMITED TO: LIQUIDITY RISK, MARKET VALUE RISK, OR PRICE VOLATILITY. CREDIT RATINGS AND MOODY’SOPINIONS INCLUDED IN MOODY’S PUBLICATIONS ARE NOT STATEMENTS OF CURRENT OR HISTORICAL FACT. MOODY’S PUBLICATIONS MAY ALSO INCLUDE QUANTITATIVEMODEL-BASED ESTIMATES OF CREDIT RISK AND RELATED OPINIONS OR COMMENTARY PUBLISHED BY MOODY’S ANALYTICS, INC. CREDIT RATINGS AND MOODY’SPUBLICATIONS DO NOT CONSTITUTE OR PROVIDE INVESTMENT OR FINANCIAL ADVICE, AND CREDIT RATINGS AND MOODY’S PUBLICATIONS ARE NOT AND DO NOTPROVIDE RECOMMENDATIONS TO PURCHASE, SELL, OR HOLD PARTICULAR SECURITIES. NEITHER CREDIT RATINGS NOR MOODY’S PUBLICATIONS COMMENT ON THESUITABILITY OF AN INVESTMENT FOR ANY PARTICULAR INVESTOR. MOODY’S ISSUES ITS CREDIT RATINGS AND PUBLISHES MOODY’S PUBLICATIONS WITH THE EXPECTATIONAND UNDERSTANDING THAT EACH INVESTOR WILL, WITH DUE CARE, MAKE ITS OWN STUDY AND EVALUATION OF EACH SECURITY THAT IS UNDER CONSIDERATION FORPURCHASE, HOLDING, OR SALE.
MOODY’S CREDIT RATINGS AND MOODY’S PUBLICATIONS ARE NOT INTENDED FOR USE BY RETAIL INVESTORS AND IT WOULD BE RECKLESS AND INAPPROPRIATE FORRETAIL INVESTORS TO USE MOODY’S CREDIT RATINGS OR MOODY’S PUBLICATIONS WHEN MAKING AN INVESTMENT DECISION. IF IN DOUBT YOU SHOULD CONTACTYOUR FINANCIAL OR OTHER PROFESSIONAL ADVISER. ALL INFORMATION CONTAINED HEREIN IS PROTECTED BY LAW, INCLUDING BUT NOT LIMITED TO, COPYRIGHT LAW,AND NONE OF SUCH INFORMATION MAY BE COPIED OR OTHERWISE REPRODUCED, REPACKAGED, FURTHER TRANSMITTED, TRANSFERRED, DISSEMINATED, REDISTRIBUTEDOR RESOLD, OR STORED FOR SUBSEQUENT USE FOR ANY SUCH PURPOSE, IN WHOLE OR IN PART, IN ANY FORM OR MANNER OR BY ANY MEANS WHATSOEVER, BY ANYPERSON WITHOUT MOODY’S PRIOR WRITTEN CONSENT.
CREDIT RATINGS AND MOODY’S PUBLICATIONS ARE NOT INTENDED FOR USE BY ANY PERSON AS A BENCHMARK AS THAT TERM IS DEFINED FOR REGULATORY PURPOSESAND MUST NOT BE USED IN ANY WAY THAT COULD RESULT IN THEM BEING CONSIDERED A BENCHMARK.
All information contained herein is obtained by MOODY’S from sources believed by it to be accurate and reliable. Because of the possibility of human or mechanical error as wellas other factors, however, all information contained herein is provided “AS IS” without warranty of any kind. MOODY'S adopts all necessary measures so that the information ituses in assigning a credit rating is of sufficient quality and from sources MOODY'S considers to be reliable including, when appropriate, independent third-party sources. However,MOODY’S is not an auditor and cannot in every instance independently verify or validate information received in the rating process or in preparing the Moody’s publications.
To the extent permitted by law, MOODY’S and its directors, officers, employees, agents, representatives, licensors and suppliers disclaim liability to any person or entity for anyindirect, special, consequential, or incidental losses or damages whatsoever arising from or in connection with the information contained herein or the use of or inability to use anysuch information, even if MOODY’S or any of its directors, officers, employees, agents, representatives, licensors or suppliers is advised in advance of the possibility of such losses ordamages, including but not limited to: (a) any loss of present or prospective profits or (b) any loss or damage arising where the relevant financial instrument is not the subject of aparticular credit rating assigned by MOODY’S.
To the extent permitted by law, MOODY’S and its directors, officers, employees, agents, representatives, licensors and suppliers disclaim liability for any direct or compensatorylosses or damages caused to any person or entity, including but not limited to by any negligence (but excluding fraud, willful misconduct or any other type of liability that, for theavoidance of doubt, by law cannot be excluded) on the part of, or any contingency within or beyond the control of, MOODY’S or any of its directors, officers, employees, agents,representatives, licensors or suppliers, arising from or in connection with the information contained herein or the use of or inability to use any such information.
NO WARRANTY, EXPRESS OR IMPLIED, AS TO THE ACCURACY, TIMELINESS, COMPLETENESS, MERCHANTABILITY OR FITNESS FOR ANY PARTICULAR PURPOSE OF ANY SUCHRATING OR OTHER OPINION OR INFORMATION IS GIVEN OR MADE BY MOODY’S IN ANY FORM OR MANNER WHATSOEVER.
Moody’s Investors Service, Inc., a wholly-owned credit rating agency subsidiary of Moody’s Corporation (“MCO”), hereby discloses that most issuers of debt securities (includingcorporate and municipal bonds, debentures, notes and commercial paper) and preferred stock rated by Moody’s Investors Service, Inc. have, prior to assignment of any rating,agreed to pay to Moody’s Investors Service, Inc. for appraisal and rating services rendered by it fees ranging from $1,500 to approximately $2,500,000. MCO and MIS also maintainpolicies and procedures to address the independence of MIS’s ratings and rating processes. Information regarding certain affiliations that may exist between directors of MCO andrated entities, and between entities who hold ratings from MIS and have also publicly reported to the SEC an ownership interest in MCO of more than 5%, is posted annually atwww.moodys.com under the heading “Investor Relations — Corporate Governance — Director and Shareholder Affiliation Policy.”
Additional terms for Australia only: Any publication into Australia of this document is pursuant to the Australian Financial Services License of MOODY’S affiliate, Moody’s InvestorsService Pty Limited ABN 61 003 399 657AFSL 336969 and/or Moody’s Analytics Australia Pty Ltd ABN 94 105 136 972 AFSL 383569 (as applicable). This document is intendedto be provided only to “wholesale clients” within the meaning of section 761G of the Corporations Act 2001. By continuing to access this document from within Australia, yourepresent to MOODY’S that you are, or are accessing the document as a representative of, a “wholesale client” and that neither you nor the entity you represent will directly orindirectly disseminate this document or its contents to “retail clients” within the meaning of section 761G of the Corporations Act 2001. MOODY’S credit rating is an opinion asto the creditworthiness of a debt obligation of the issuer, not on the equity securities of the issuer or any form of security that is available to retail investors. It would be recklessand inappropriate for retail investors to use MOODY’S credit ratings or publications when making an investment decision. If in doubt you should contact your financial or otherprofessional adviser.
Additional terms for Japan only: Moody's Japan K.K. (“MJKK”) is a wholly-owned credit rating agency subsidiary of Moody's Group Japan G.K., which is wholly-owned by Moody’sOverseas Holdings Inc., a wholly-owned subsidiary of MCO. Moody’s SF Japan K.K. (“MSFJ”) is a wholly-owned credit rating agency subsidiary of MJKK. MSFJ is not a NationallyRecognized Statistical Rating Organization (“NRSRO”). Therefore, credit ratings assigned by MSFJ are Non-NRSRO Credit Ratings. Non-NRSRO Credit Ratings are assigned by anentity that is not a NRSRO and, consequently, the rated obligation will not qualify for certain types of treatment under U.S. laws. MJKK and MSFJ are credit rating agencies registeredwith the Japan Financial Services Agency and their registration numbers are FSA Commissioner (Ratings) No. 2 and 3 respectively.
MJKK or MSFJ (as applicable) hereby disclose that most issuers of debt securities (including corporate and municipal bonds, debentures, notes and commercial paper) and preferredstock rated by MJKK or MSFJ (as applicable) have, prior to assignment of any rating, agreed to pay to MJKK or MSFJ (as applicable) for appraisal and rating services rendered by it feesranging from JPY200,000 to approximately JPY350,000,000.
MJKK and MSFJ also maintain policies and procedures to address Japanese regulatory requirements.
REPORT NUMBER 1118979
19 12 April 2018 RMBS - Australia: Mortgage delinquency map - Home loan arrears will increase moderately on housing slowdown

MOODY'S INVESTORS SERVICE STRUCTURED FINANCE
CLIENT SERVICES
Americas 1-212-553-1653
Asia Pacific 852-3551-3077
Japan 81-3-5408-4100
EMEA 44-20-7772-5454
20 12 April 2018 RMBS - Australia: Mortgage delinquency map - Home loan arrears will increase moderately on housing slowdown
Related Documents


