Welcome message from author
This document is posted to help you gain knowledge. Please leave a comment to let me know what you think about it! Share it to your friends and learn new things together.
Transcript


Mortality over Time
Population Density Declines through Mortality

Experimental Evidence: Self Thinning
Lo
g m
ean
pla
nt
wei
gh
t (w
)
Log density (N)Low High
Low
HighChange during
one time interval

Experimental Evidence: Self Thinning
Lo
g m
ean
pla
nt
wei
gh
t (w
)
Log density (N)Low High
Low
HighChange during
one time interval

Experimental Evidence: Self Thinning
Lo
g m
ean
pla
nt
wei
gh
t (w
)
Log density (N)Low High
Low
HighChange during
one time interval

Experimental Evidence: Self Thinning
Lo
g m
ean
pla
nt
wei
gh
t (w
)
Log density (N)Low High
Low
HighChange during
one time interval

Experimental Evidence: Self Thinning
Lo
g m
ea
n p
lan
t w
eig
ht
(w )
Log density (N)
General pattern
1. Unimpeded growth
2. Mortality begins
3. Similar trajectories exhibited
once thinning starts
4. At some point thinning slows
1
1
1
1
2
2
2
34

Self Thinning in Thirty Species
Similar slope to thinning line across a range
of species

Attempts to Explain the
Thinning Line

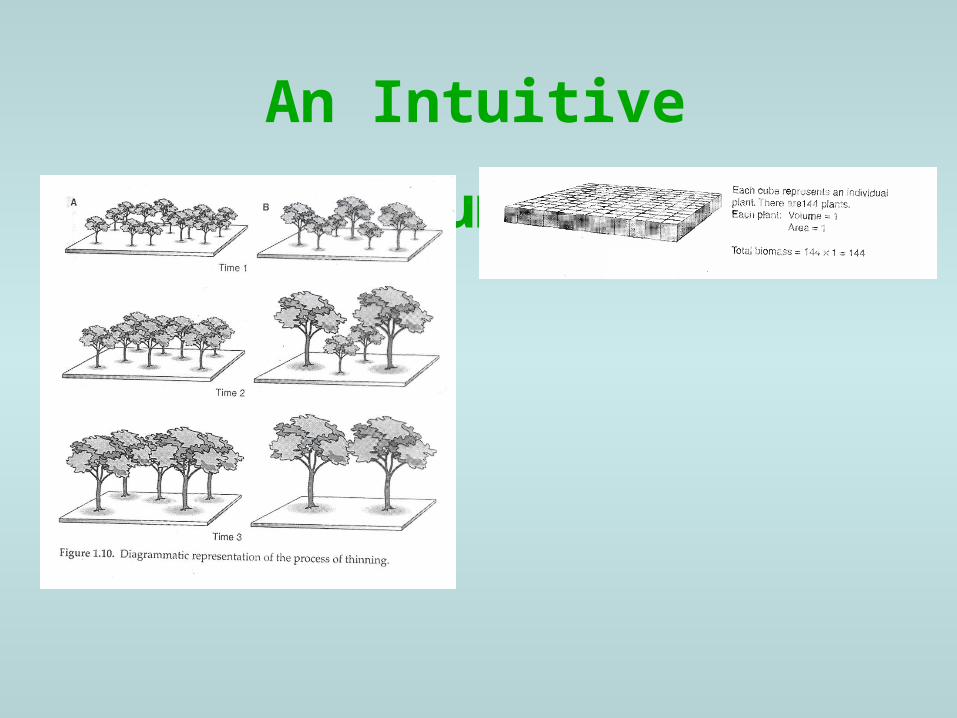
An Intuitive Argument
Two stands of trees starting at different densities

An Intuitive Argument
Two stands of trees starting at different densities
Thinning occurs as trees increase in size.
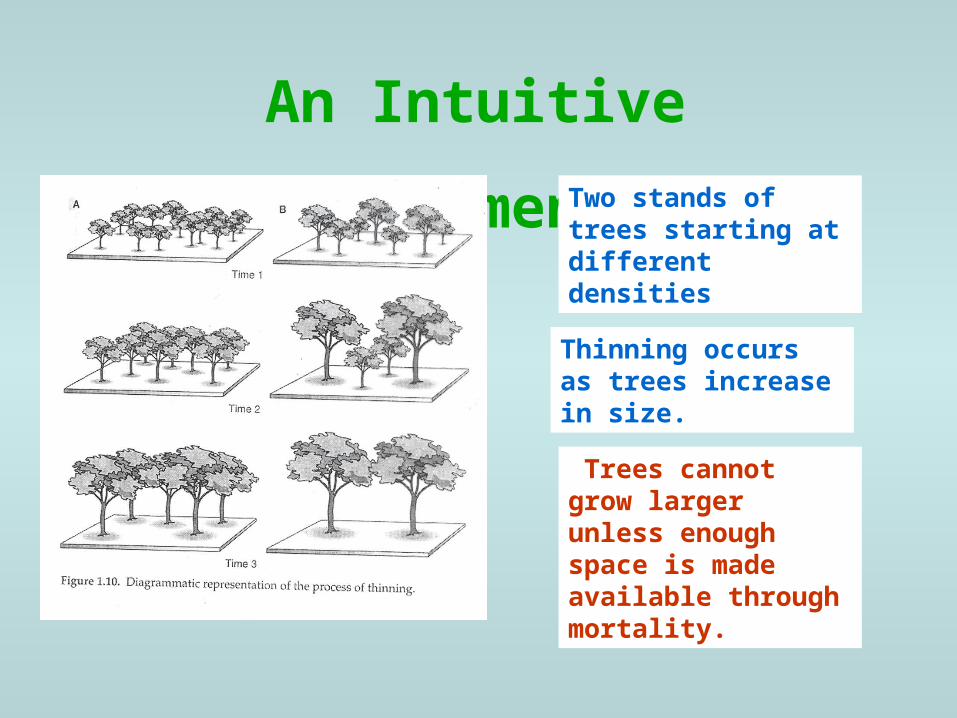
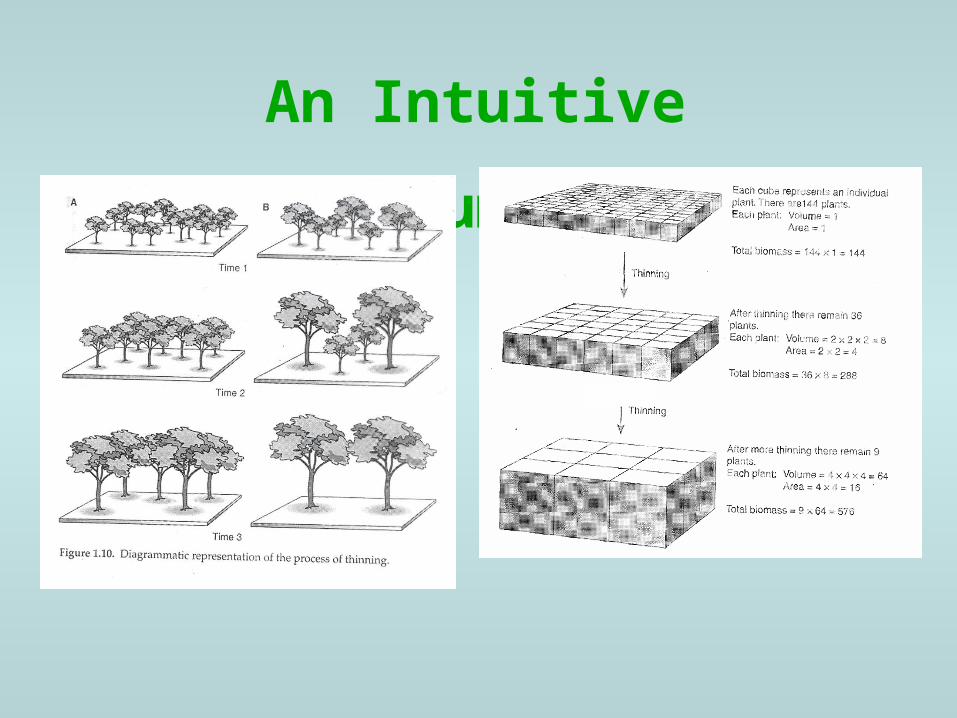
An Intuitive Argument
Two stands of trees starting at different densities
Thinning occurs as trees increase in size.
Trees cannot grow larger unless enough space is made available through mortality.
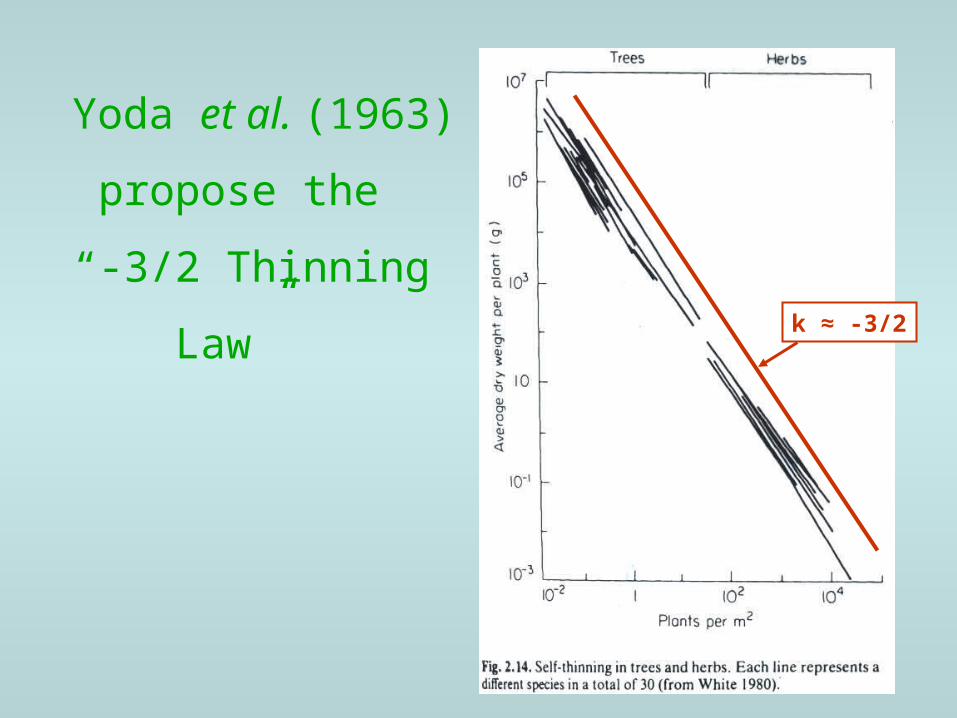
Yoda et al. (1963)
propose the
“-3/2 Thinning Law” k ≈ -3/2

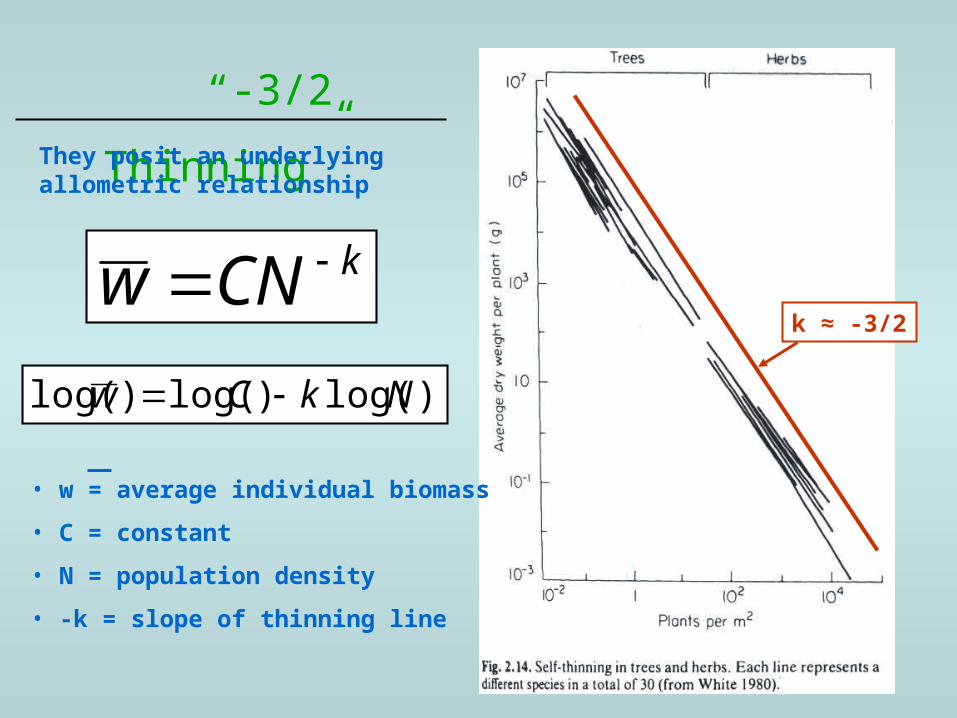
“-3/2 Thinning”
k ≈ -3/2Allometric relationships: those that scale with
body mass
They posit an underlying allometric relationship
“-3/2 Thinning”
k ≈ -3/2
They posit an underlying allometric relationship
kCNw
• w = average individual biomass
• C = constant
• N = population density
• -k = slope of thinning line
)log()log()log( NkCw

“-3/2 Thinning”
k ≈ -3/2
They posit an underlying allometric relationship
kCNw )log()log()log( NkCw
Why 3/2?

An Intuitive Argument
An Intuitive Argument

An Intuitive Argument
An Intuitive Argument

An Intuitive Argument
Biomass
Density
Volume –> m3
Area m2

An Intuitive Argument
Biomass
Density
Volume –> m3
Area m2

An Intuitive Argument
Biomass
Density
Volume –> m3
Area m2

An Intuitive Argument
Biomass
Density
Volume –> m3
Area m2
kCNw
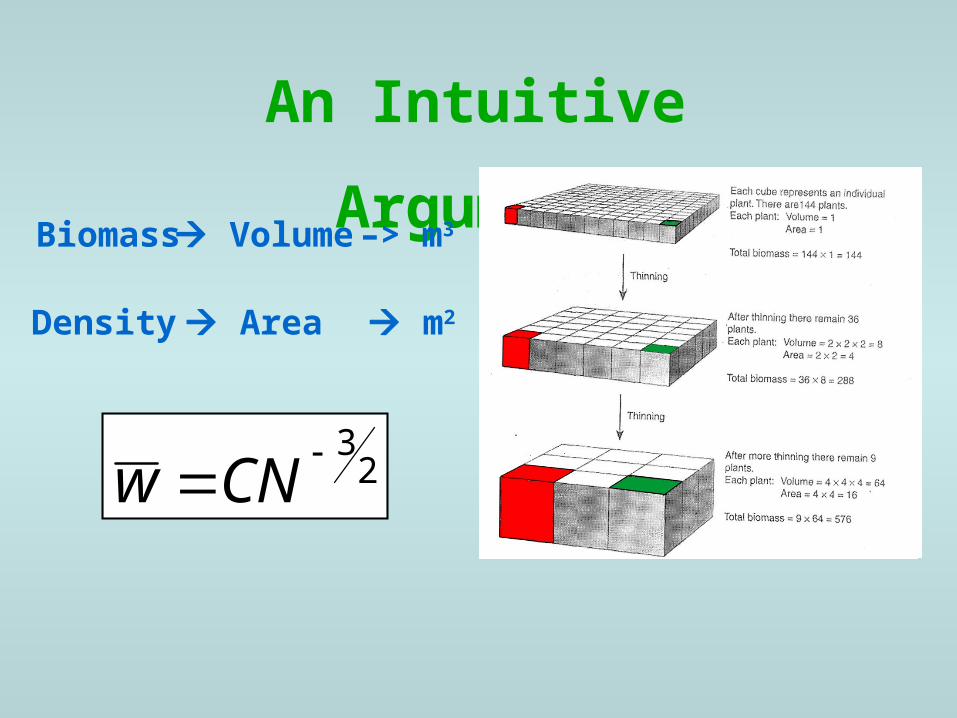
An Intuitive Argument
Biomass
Density
Volume –> m3
Area m2
23CNw

k ≈ -3/2k ≈ -4/3
Revisiting the
“-3/2 Thinning Law”
X

k ≈ -3/2k ≈ -4/3
A Revised View of the
Allometric Relationship
34
Nw
Same as the scaling relationship of body mass to maximum density in animals!
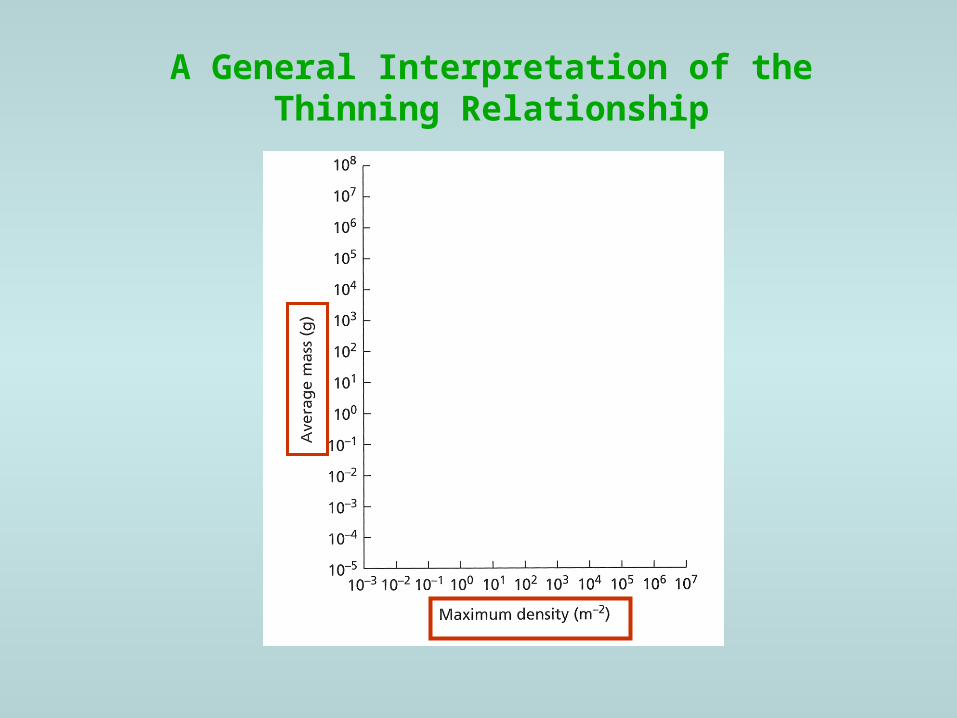
A General Interpretation of the Thinning Relationship

Lemna
Sequoia
A General Interpretation of the Thinning Relationship

A General Interpretation of the Thinning Relationship
Permitted combinations
Prohibited combinations

Self Thinning RevisitedL
og
me
an
pla
nt
we
igh
t (w
)
Log density (N)
General pattern
1. Unimpeded growth
2. Mortality begins
3. Similar trajectories exhibited
once thinning starts
4. At some point thinning slows
4
?

Self Thinning RevisitedL
og
me
an
pla
nt
we
igh
t (w
)
Log density (N)
Growth limited by space
Growth limited by resources

Self Thinning RevisitedL
og
me
an
pla
nt
we
igh
t (w
)
Log density (N)
Growth limited by resources
Resource limitation regulating growth leads to the “Law of Constant Yield”
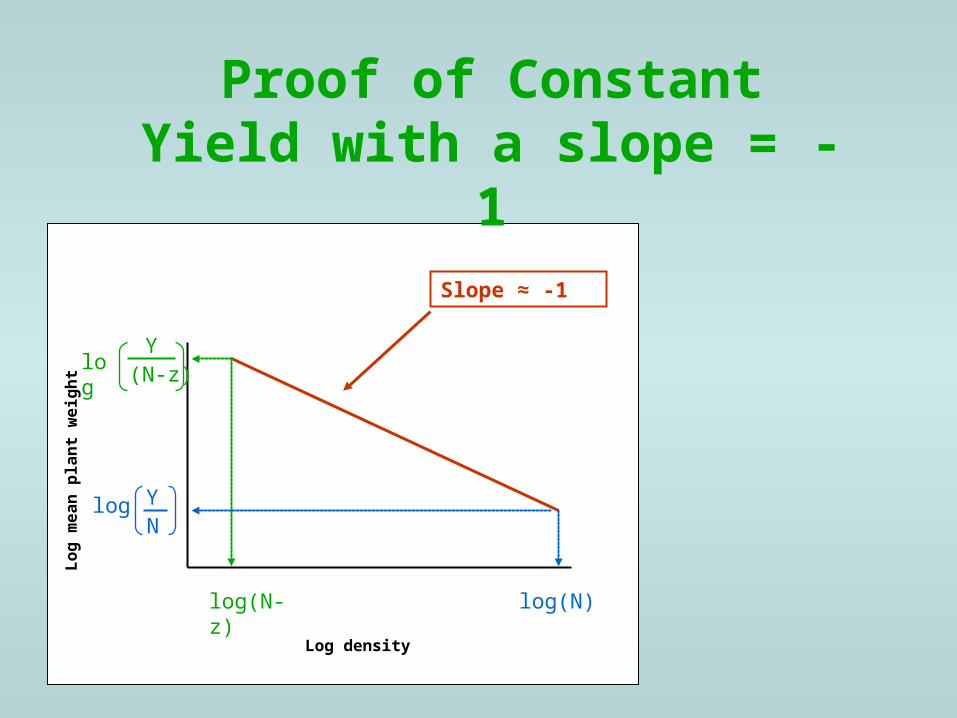
Proof of Constant Yield with a slope = -1
Lo
g m
ea
n p
lan
t w
eig
ht
Log density
Slope ≈ -1
log(N)log(N-z)
log YN
Ylog
(N-z)

Proof of Constant Yield with a slope = -1
Lo
g m
ea
n p
lan
t w
eig
ht
Log density
Slope ≈ -1
log(N)log(N-z)
log YN
Ylog
(N-z)
Calculation of slope
x
yslope

Proof of Constant Yield with a slope = -1
Lo
g m
ea
n p
lan
t w
eig
ht
Log density
log(N)log(N-z)
log YN
Ylog
(N-z)
Calculation of slope
)log()log(
loglog
zNN
zNY
NY
slope
x
yslope
X X

Proof of Constant Yield with a slope = -1
Lo
g m
ea
n p
lan
t w
eig
ht
Log density
log(N)log(N-z)
log YN
Ylog
(N-z)
Calculation of slope
)log()log(
loglog
zNN
NzNslope
x
yslope
= -1
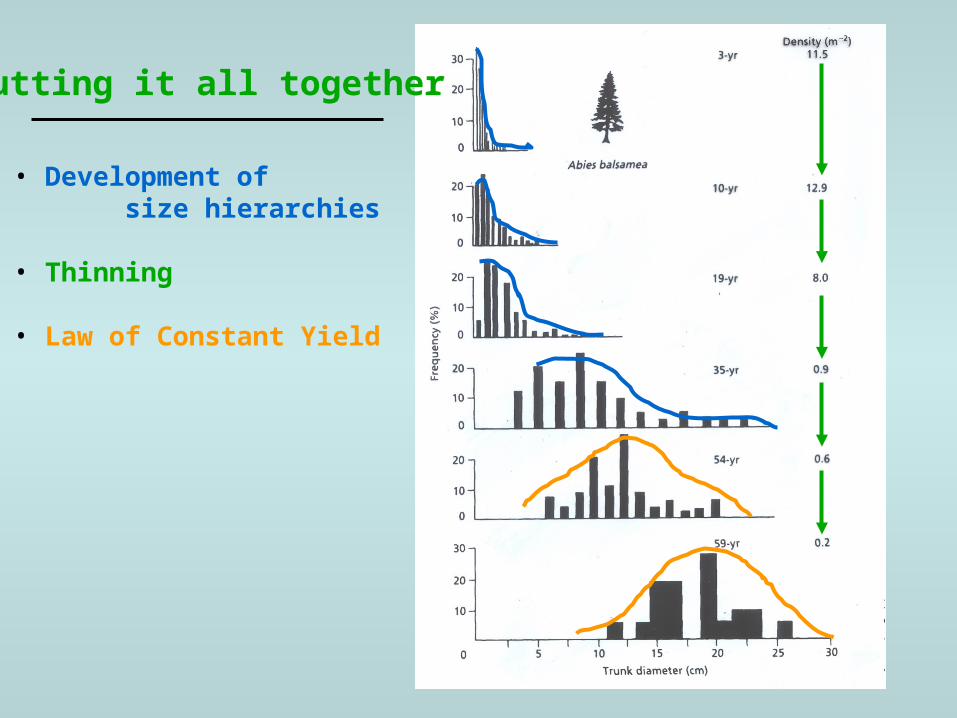
Putting it all together
• Development of size hierarchies
• Thinning
• Law of Constant Yield

Related Documents