International healthhow Australia compares 86 Mortality, males, cardiovascular disease (ICD 390—459)

Welcome message from author
This document is posted to help you gain knowledge. Please leave a comment to let me know what you think about it! Share it to your friends and learn new things together.
Transcript
International healthÑhow Australia compares
86
Mortality, males, cardiovascular disease (ICD 390Ð459)
International healthÑhow Australia compares
87
¥ Cardiovascular disease (CVD), including heartattack, stroke, angina (chest pain), heart failureand other forms of heart and blood vesseldisease, is AustraliaÕs greatest health problem.In 1996, 53,989 persons died from CVDÑ42%of all deaths in Australia. It is the primarycause of over 400,000 hospital episodes everyyear, and is the greatest cause of direct healthcare costs, estimated at $3.7 billion in 1993Ð94.
¥ In 1992, AustraliaÕs death rate for CVD amongmales was 226 per 100,000 population. Despitemarked declines in mortality over the past twodecades, Australia still compares unfavourablywith many developed countries. Australiaranked 12th among 20 comparison countriesfor CVD death rates in 1992. The death rate,although almost three-quarters of the rate inIreland, was 60% more than the rate observedin Hong Kong. Besides Hong Kong, France,Japan and Spain also have rates lower than 200deaths per 100,000 population (Figure 1).
¥ Death rates for CVD declined in all comparisoncountries during the period 1950Ð54 to 1992(Figure 2). Rates in Australia declined by 54%,the decline being exceeded only by Canada.Relatively smaller declines were noted in theScandinavian countries, Germany, theNetherlands and Ireland.
¥ Along with the United States, Australia hadthe highest CVD death rates of all the 20
countries compared here until the early 1980s.A rapid decline in CVD mortality commencedduring the early 1960s in the United States andCanada, in the late 1960s in Australia and NewZealand, and in the early 1970s in Israel, theNetherlands and Norway (Waters & Bennett1995b). Rates remain high in Eastern Europe.Consistent patterns of decline in death ratesover time (Figure 3) and their age-specificdistribution (Figure 4) have been observed inAustralia, Japan, the United Kingdom and theUnited States.
¥ Trends in death rates for CVD are correlatedwith a number of risk factors, includingcigarette smoking, high blood cholesterol,high blood pressure, obesity and a sedentarylife style (Rose 1989, Waters & Bennett 1995a).Newly rich societies, experiencing changes indiet and lifestyle, usually experienceepidemics of cardiovascular disease.
For more information, see:
Waters A-M, Bennett S 1995. Mortality from cardiovascular disease in Australia. Canberra: AIHW.Gajanayake I, Bennett S 1997. Surveillance of cardiovascular mortality in Australia 1983Ð1994. Canberra: AIHW.
Death rates
(a)
, males, cardiovascular disease (per 100,000 population)
(a) Age-standardised to the World Standard Population.
Sources: WHO 1988, 1994, 1995a, 1996d.
Country 1950Ð54 1960Ð64 1970Ð74 1980Ð84 1992 1993 1994% change
1950Ð54 to 1992
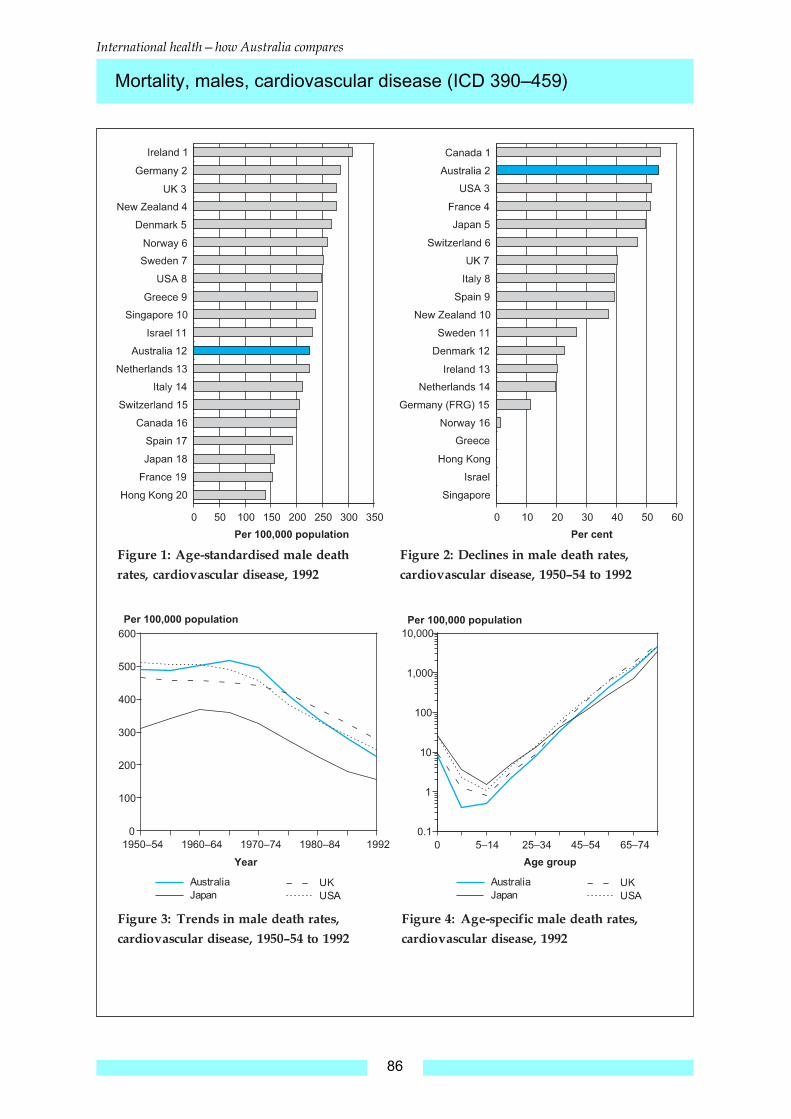
Australia 491.0 501.8 494.9 341.7 225.8 213.1 212.8 Ð54.0Canada 441.3 431.7 391.9 299.7 200.7 200.7 Ð54.5Denmark 345.3 366.6 359.0 326.4 267.6 257.8 Ð22.5France 314.6 292.6 272.2 219.1 153.5 152.9 Ð51.2Germany (FRG) 321.5 360.7 386.6 356.2 284.7 282.9 271.8 Ð11.4Greece Ñ 189.0 211.8 241.6 239.6 227.0 227.8 ÑHong Kong Ñ 279.3 227.5 176.4 140.1 124.9 123.8 ÑIreland 385.2 429.2 448.2 417.1 307.9 Ð20.1Israel Ñ Ñ Ñ 292.7 230.3 225.2 ÑItaly 347.9 365.4 343.0 299.8 211.7 Ð39.1Japan 311.0 367.8 326.7 226.1 157.4 154.5 139.9 Ð49.4Netherlands 279.8 310.3 326.6 287.8 224.7 233.0 218.9 Ð19.7New Zealand 442.0 447.0 448.1 366.0 277.7 258.0 Ð37.2Norway 263.7 334.4 353.1 312.0 259.9 254.6 Ð1.4Singapore Ñ Ñ 309.3 299.9 237.1 221.5 223.2 ÑSpain 314.2 281.2 307.8 255.7 191.5 Ð39.1Sweden 343.7 354.8 348.3 333.6 251.9 250.1 Ð26.7Switzerland 387.4 364.7 306.4 275.9 206.2 201.8 190.4 Ð46.8UK 464.1 458.2 441.3 371.2 277.8 277.6 257.0 Ð40.1USA 511.3 503.9 455.4 335.4 247.6 Ð51.6
Mortality, males, cardiovascular disease (ICD 390Ð459)
International healthÑhow Australia compares
88
Mortality, females, cardiovascular disease (ICD 390Ð459)

International healthÑhow Australia compares
89
¥ In most countries around the world, femaleshave lower death rates than males forcardiovascular disease. In 1992, the Australianfemale rate of 141 per 100,000 population was38% lower than the male rate of 226 per100,000 population. In previous decades, therewas less disparity between male and femalerates in AustraliaÑthe female rate for 1950Ð54was 30% lower than the male rate.
¥ In 1992, the differential between male andfemale death rates for CVD varied somewhatfrom country to countryÑthe Norwegianfemale rate was only 52% of the male rate,whereas the Greek and Hong Kong femalerates were 71% and 72% of the male rates.
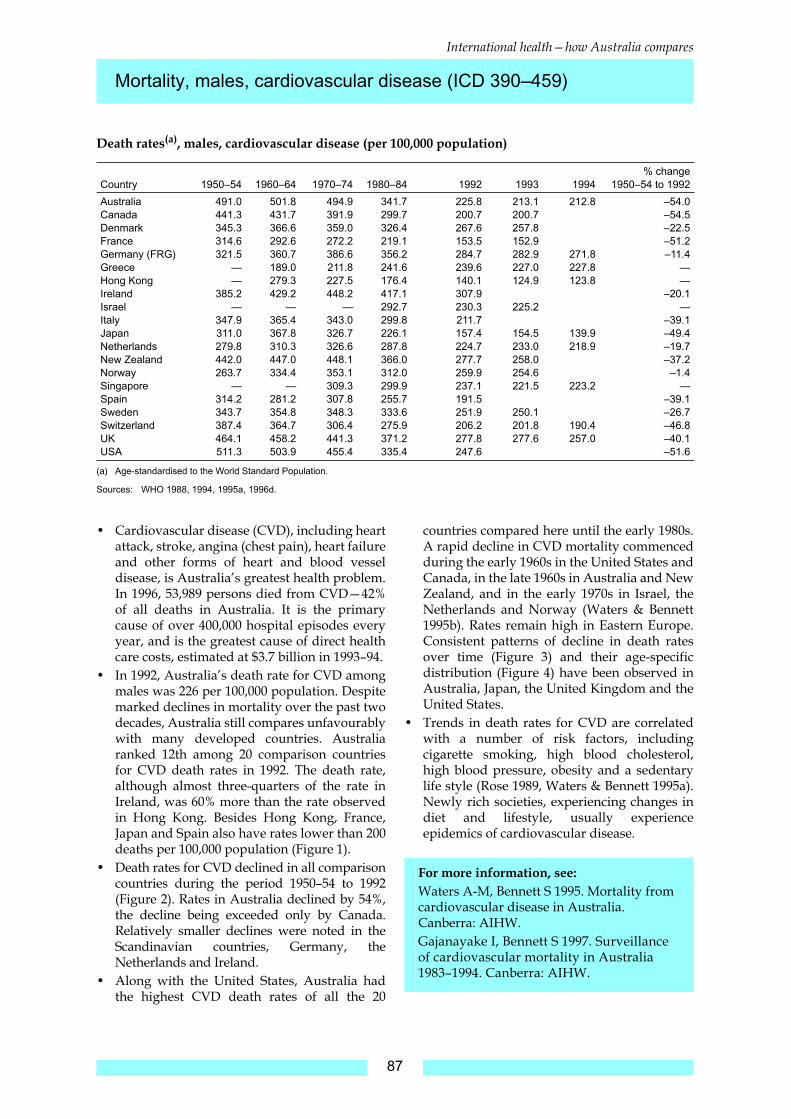
¥ The Australian female death rate of 141ranked 10th among 20 developed countries in1992 (Figure 1). Ireland (175), Greece (170) andGermany (170) had higher rates, and France(85), Hong Kong (100) and Japan (101) lowerrates among the comparison countries.
¥ The female CVD death rate has also declinedover the past several decades. In fact, femaleshave shown even larger falls in post-war CVDmortality than males. The Australian rate fell59% between 1950Ð54 and 1992 (Figure 2),compared to a fall of 54% for males over thesame time period. Canada, Switzerland andFrance had the largest declinesÑeach over60%, and Germany, Norway and Ireland the
smallest declines among the comparisoncountriesÑless than 50%.
¥ Female death rates in Australia had shownonly a small net fall until the late 1960s, whenthe decline began to accelerate rapidly. TheAustralian pattern of female CVD mortalitymore closely resembles the Japanese pattern(Figure 3). Declines were much more uniformin the United Kingdom and United States.
¥ Similar patterns of age-specific death rateswere noted in Japan, the United Kingdom, theUnited States and Australia (Figure 4). Thepatterns are also similar to those for males,except that the rates are consistently lower forall age groups.
¥ International comparisons of trends incirculatory system mortality may becomplicated by differing coding practicesbetween countries (Murray & Lopez 1997), butthe consistency of declining trends isnoteworthy.
For more information, see:
dÕEspaignet ET 1993. Trends in Australian mortalityÐdiseases of the circulatory system, 1950Ð1991. AIHW Mortality Series No. 2. Canberra: AGPS.
Death rates
(a)
, females, cardiovascular disease (per 100,000 population)
(a) Age-standardised to the World Standard Population.
Sources: WHO 1988, 1994, 1995a, 1996d.
Country 1950Ð54 1960Ð64 1970Ð74 1980Ð84 1992 1993 1994% change
1950Ð54 to 1992
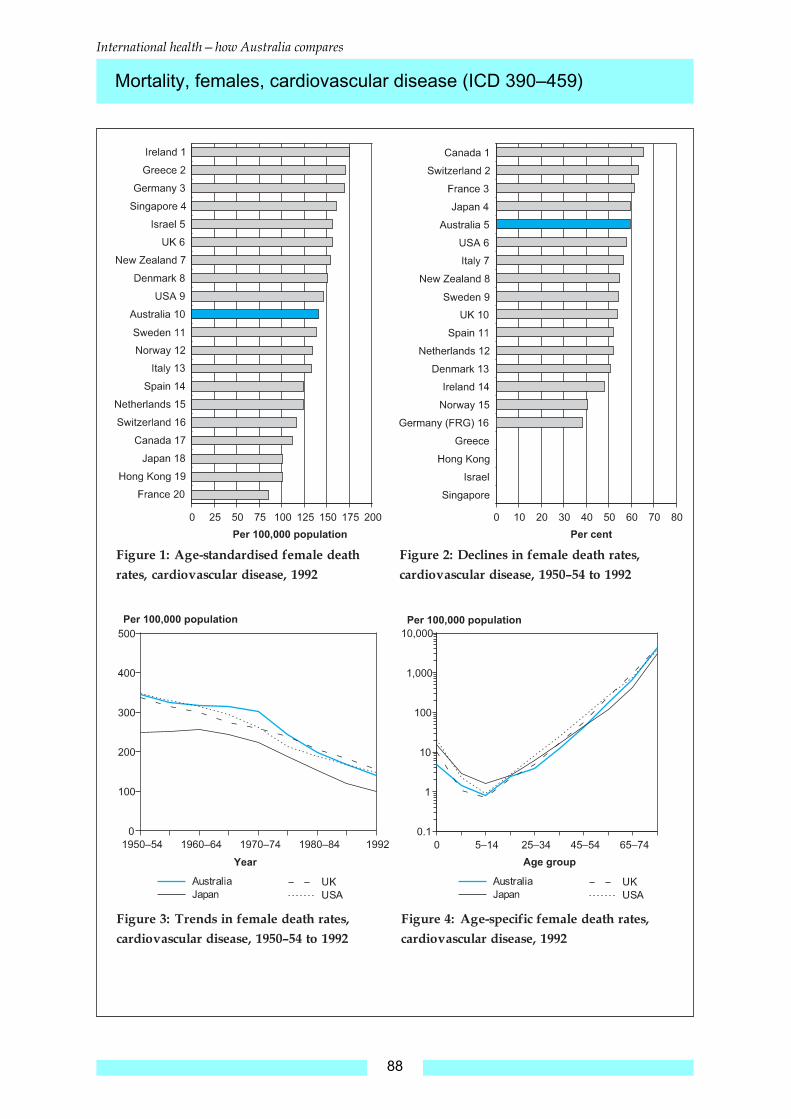
Australia 346.2 317.0 300.8 198.1 140.6 129.9 129.8 Ð59.4Canada 323.3 277.7 217.9 162.8 111.7 112.1 Ð65.5Denmark 305.4 258.3 215.3 175.5 151.0 162.5 Ð50.6France 220.8 184.9 159.4 124.1 85.0 83.8 Ð61.5Germany (FRG) 274.8 254.0 247.5 208.3 169.9 168.2 162.6 Ð38.2Greece Ñ 168.9 170.8 183.9 170.3 162.4 170.2 ÑHong Kong Ñ 159.8 142.4 121.7 100.4 91.3 86.7 ÑIreland 334.8 326.8 300.9 248.2 174.5 Ð47.9Israel Ñ Ñ Ñ 228.8 156.2 158.8 ÑItaly 306.8 280.2 241.4 192.7 133.1 Ð56.6Japan 248.8 256.2 223.0 153.5 100.6 98.4 88.2 Ð59.6Netherlands 256.5 228.2 198.9 151.3 123.5 126.9 119.3 Ð51.9New Zealand 342.1 294.6 270.8 210.4 154.5 156.1 Ð54.8Norway 226.0 240.9 204.5 159.0 134.0 133.3 Ð40.7Singapore Ñ Ñ 200.5 214.9 160.0 163.0 156.7 ÑSpain 259.4 233.3 229.8 177.1 124.5 Ð52.0Sweden 301.3 263.7 210.4 177.0 137.9 135.8 Ð54.2Switzerland 316.7 266.9 205.4 160.2 116.1 112.9 110.1 Ð63.3UK 337.5 299.1 259.3 207.3 156.2 157.1 146.5 Ð53.7USA 347.6 314.4 261.9 189.5 146.5 Ð57.9
Mortality, females, cardiovascular disease (ICD 390Ð459)

International healthÑhow Australia compares
90
Mortality, males, ischaemic heart disease (ICD 410Ð414)

International healthÑhow Australia compares
91
¥ Ischaemic heart disease (or coronary heartdisease) is the single most important cause ofdeath in Australia. In 1996, 16,092 males and13,545 females died from ischaemic heartdiseaseÑ23% of all deaths.
¥ In 1992, the age-standardised ischaemic heartdisease (IHD) death rate for Australian maleswas 143 deaths per 100,000 population. Thisrate placed Australia in the top half of the 20developed countries included here (Figure 1).Ireland, the United Kingdom and NewZealand had high death rates; Japan, HongKong, France and the Mediterranean countries(Spain, Italy and Greece) had comparativelymuch lower rates.
¥ During the period 1950Ð54 to 1992, IHDmortality more than halved in five countriesÑthe United States, Switzerland, Canada, Japanand Australia. Death rates increased inNorway and France in contrast (Figure 2).
¥ Male mortality from IHD has fallendramatically in Australia since the late 1960s,with an average fall of 3.4% per year in the tenyears between 1980Ð84 and 1992. This fall hasbeen largely responsible for the overall declinein mortality in Australia during this time. Thetrend in Australian male IHD death rates mostclosely resembles that for the United States(Figure 3). Rates for the United Kingdom andJapan show a slow but consistent decline since
the early 1960s. The disparity between thetrend in Japanese rates and those for Australia,the United Kingdom and the United States isnoteworthy.
¥ Age-specific death rates begin to rise fromearly adulthood (Figure 4). Again, Japaneserates are substantially lower for all age groups.
¥ Coding of IHD mortality has been variable,both over time and between countries. Murray& Lopez (1997) note significant miscoding innumerous developed countries, includingSpain, Italy, Japan and France. Even afterrecoding, though, these countries are stillfound to have low death rates.
¥ The amelioration of risk factors, most notablydecreases in blood pressure and smokingprevalence (Bennett & Magnus 1994), andimprovements in medical care havecontributed to declines in mortality.
For more information, see:
Thom TJ 1989. International mortality from heart disease: rates and trends. Int J Epidemiol 18 (Supp. 1): S20ÐS28.
Death rates
(a)
, males, ischaemic heart disease (per 100,000 population)
(a) Age-standardised to the World Standard Population.
Sources: WHO 1988, 1994, 1995a, 1996d.
Country 1950Ð54 1960Ð64 1970Ð74 1980Ð84 1992 1993 1994% change
1950Ð54 to 1992
Australia 288.0 317.4 309.1 216.2 142.9 133.3 130.9 Ð50.4Canada 272.6 296.7 268.8 199.7 126.6 125.8 Ð53.6Denmark 175.7 219.5 244.6 226.2 165.2 Ð6.0France 43.2 73.1 73.2 71.0 54.5 53.7 26.2Germany (FRG) 141.1 179.6 166.1 164.2 139.7 140.4 134.7 Ð1.0Greece Ñ 72.1 70.4 81.7 88.1 84.8 80.7 ÑHong Kong Ñ 68.5 54.7 56.5 54.2 50.6 50.5 ÑIreland 233.7 252.6 251.8 250.8 195.4 Ð16.4Israel Ñ Ñ Ñ 166.8 121.4 120.5 ÑItaly 147.4 172.0 123.9 108.5 81.1 Ð45.0Japan 59.2 72.4 48.7 40.0 28.1 27.7 30.2 Ð52.5Netherlands 148.4 181.8 187.4 161.2 109.9 113.0 Ð25.9New Zealand 270.3 287.8 287.8 239.1 180.8 165.8 Ð33.1Norway 116.2 197.2 215.0 195.5 156.1 146.8 34.3Singapore Ñ Ñ 114.6 165.5 134.1 126.8 126.9 ÑSpain 75.8 69.6 66.6 74.0 67.6 Ð10.8Sweden 173.0 218.5 244.9 231.8 151.0 149.4 Ð12.7Switzerland 208.9 200.1 106.3 114.9 95.7 93.5 88.0 Ð54.2UK 268.4 272.1 259.2 239.3 184.4 182.3 166.8 Ð31.3USA 311.1 333.6 316.1 204.8 138.7 Ð55.4
Mortality, males, ischaemic heart disease (ICD 410Ð414)

International healthÑhow Australia compares
92
Mortality, females, ischaemic heart disease (ICD 410Ð414)
International healthÑhow Australia compares
93
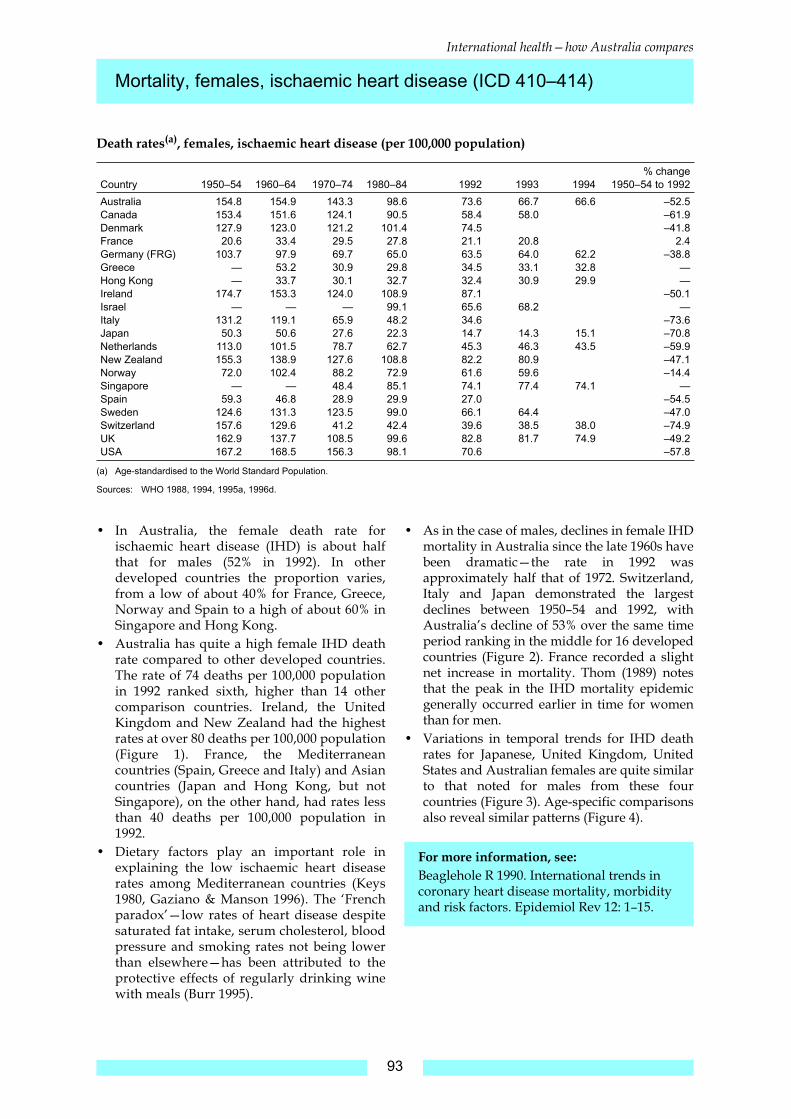
¥ In Australia, the female death rate forischaemic heart disease (IHD) is about halfthat for males (52% in 1992). In otherdeveloped countries the proportion varies,from a low of about 40% for France, Greece,Norway and Spain to a high of about 60% inSingapore and Hong Kong.
¥ Australia has quite a high female IHD deathrate compared to other developed countries.The rate of 74 deaths per 100,000 populationin 1992 ranked sixth, higher than 14 othercomparison countries. Ireland, the UnitedKingdom and New Zealand had the highestrates at over 80 deaths per 100,000 population(Figure 1). France, the Mediterraneancountries (Spain, Greece and Italy) and Asiancountries (Japan and Hong Kong, but notSingapore), on the other hand, had rates lessthan 40 deaths per 100,000 population in1992.
¥ Dietary factors play an important role inexplaining the low ischaemic heart diseaserates among Mediterranean countries (Keys1980, Gaziano & Manson 1996). The ÔFrenchparadoxÕÑlow rates of heart disease despitesaturated fat intake, serum cholesterol, bloodpressure and smoking rates not being lowerthan elsewhereÑhas been attributed to theprotective effects of regularly drinking winewith meals (Burr 1995).
¥ As in the case of males, declines in female IHDmortality in Australia since the late 1960s havebeen dramaticÑthe rate in 1992 wasapproximately half that of 1972. Switzerland,Italy and Japan demonstrated the largestdeclines between 1950Ð54 and 1992, withAustraliaÕs decline of 53% over the same timeperiod ranking in the middle for 16 developedcountries (Figure 2). France recorded a slightnet increase in mortality. Thom (1989) notesthat the peak in the IHD mortality epidemicgenerally occurred earlier in time for womenthan for men.
¥ Variations in temporal trends for IHD deathrates for Japanese, United Kingdom, UnitedStates and Australian females are quite similarto that noted for males from these fourcountries (Figure 3). Age-specific comparisonsalso reveal similar patterns (Figure 4).
For more information, see:
Beaglehole R 1990. International trends in coronary heart disease mortality, morbidity and risk factors. Epidemiol Rev 12: 1Ð15.
Death rates
(a)
, females, ischaemic heart disease (per 100,000 population)
(a) Age-standardised to the World Standard Population.
Sources: WHO 1988, 1994, 1995a, 1996d.
Country 1950Ð54 1960Ð64 1970Ð74 1980Ð84 1992 1993 1994% change
1950Ð54 to 1992
Australia 154.8 154.9 143.3 98.6 73.6 66.7 66.6 Ð52.5Canada 153.4 151.6 124.1 90.5 58.4 58.0 Ð61.9Denmark 127.9 123.0 121.2 101.4 74.5 Ð41.8France 20.6 33.4 29.5 27.8 21.1 20.8 2.4Germany (FRG) 103.7 97.9 69.7 65.0 63.5 64.0 62.2 Ð38.8Greece Ñ 53.2 30.9 29.8 34.5 33.1 32.8 ÑHong Kong Ñ 33.7 30.1 32.7 32.4 30.9 29.9 ÑIreland 174.7 153.3 124.0 108.9 87.1 Ð50.1Israel Ñ Ñ Ñ 99.1 65.6 68.2 ÑItaly 131.2 119.1 65.9 48.2 34.6 Ð73.6Japan 50.3 50.6 27.6 22.3 14.7 14.3 15.1 Ð70.8Netherlands 113.0 101.5 78.7 62.7 45.3 46.3 43.5 Ð59.9New Zealand 155.3 138.9 127.6 108.8 82.2 80.9 Ð47.1Norway 72.0 102.4 88.2 72.9 61.6 59.6 Ð14.4Singapore Ñ Ñ 48.4 85.1 74.1 77.4 74.1 ÑSpain 59.3 46.8 28.9 29.9 27.0 Ð54.5Sweden 124.6 131.3 123.5 99.0 66.1 64.4 Ð47.0Switzerland 157.6 129.6 41.2 42.4 39.6 38.5 38.0 Ð74.9UK 162.9 137.7 108.5 99.6 82.8 81.7 74.9 Ð49.2USA 167.2 168.5 156.3 98.1 70.6 Ð57.8
Mortality, females, ischaemic heart disease (ICD 410Ð414)

International healthÑhow Australia compares
94
Mortality, males, stroke (ICD 430Ð438)
International healthÑhow Australia compares
95
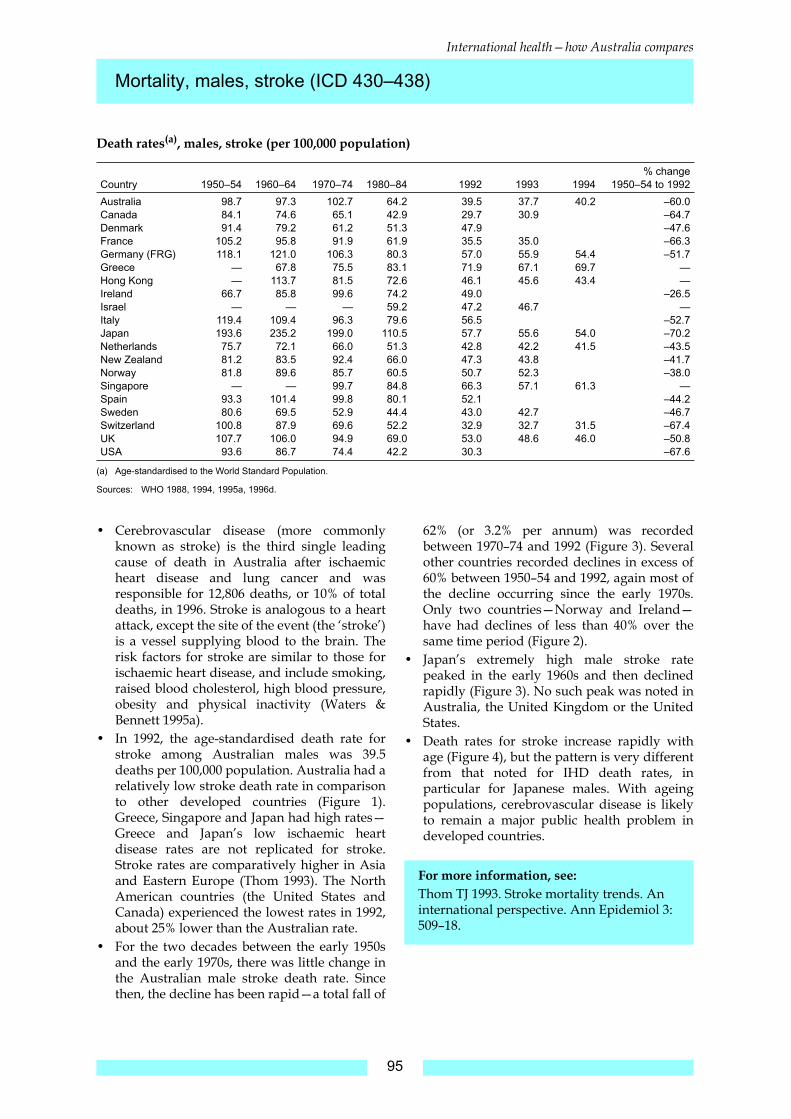
¥ Cerebrovascular disease (more commonlyknown as stroke) is the third single leadingcause of death in Australia after ischaemicheart disease and lung cancer and wasresponsible for 12,806 deaths, or 10% of totaldeaths, in 1996. Stroke is analogous to a heartattack, except the site of the event (the ÔstrokeÕ)is a vessel supplying blood to the brain. Therisk factors for stroke are similar to those forischaemic heart disease, and include smoking,raised blood cholesterol, high blood pressure,obesity and physical inactivity (Waters &Bennett 1995a).
¥ In 1992, the age-standardised death rate forstroke among Australian males was 39.5deaths per 100,000 population. Australia had arelatively low stroke death rate in comparisonto other developed countries (Figure 1).Greece, Singapore and Japan had high ratesÑGreece and JapanÕs low ischaemic heartdisease rates are not replicated for stroke.Stroke rates are comparatively higher in Asiaand Eastern Europe (Thom 1993). The NorthAmerican countries (the United States andCanada) experienced the lowest rates in 1992,about 25% lower than the Australian rate.
¥ For the two decades between the early 1950sand the early 1970s, there was little change inthe Australian male stroke death rate. Sincethen, the decline has been rapidÑa total fall of
62% (or 3.2% per annum) was recordedbetween 1970Ð74 and 1992 (Figure 3). Severalother countries recorded declines in excess of60% between 1950Ð54 and 1992, again most ofthe decline occurring since the early 1970s.Only two countriesÑNorway and IrelandÑhave had declines of less than 40% over thesame time period (Figure 2).
¥ JapanÕs extremely high male stroke ratepeaked in the early 1960s and then declinedrapidly (Figure 3). No such peak was noted inAustralia, the United Kingdom or the UnitedStates.
¥ Death rates for stroke increase rapidly withage (Figure 4), but the pattern is very differentfrom that noted for IHD death rates, inparticular for Japanese males. With ageingpopulations, cerebrovascular disease is likelyto remain a major public health problem indeveloped countries.
For more information, see:
Thom TJ 1993. Stroke mortality trends. An international perspective. Ann Epidemiol 3: 509Ð18.
Death rates
(a)
, males, stroke (per 100,000 population)
(a) Age-standardised to the World Standard Population.
Sources: WHO 1988, 1994, 1995a, 1996d.
Country 1950Ð54 1960Ð64 1970Ð74 1980Ð84 1992 1993 1994% change
1950Ð54 to 1992
Australia 98.7 97.3 102.7 64.2 39.5 37.7 40.2 Ð60.0Canada 84.1 74.6 65.1 42.9 29.7 30.9 Ð64.7Denmark 91.4 79.2 61.2 51.3 47.9 Ð47.6France 105.2 95.8 91.9 61.9 35.5 35.0 Ð66.3Germany (FRG) 118.1 121.0 106.3 80.3 57.0 55.9 54.4 Ð51.7Greece Ñ 67.8 75.5 83.1 71.9 67.1 69.7 ÑHong Kong Ñ 113.7 81.5 72.6 46.1 45.6 43.4 ÑIreland 66.7 85.8 99.6 74.2 49.0 Ð26.5Israel Ñ Ñ Ñ 59.2 47.2 46.7 ÑItaly 119.4 109.4 96.3 79.6 56.5 Ð52.7Japan 193.6 235.2 199.0 110.5 57.7 55.6 54.0 Ð70.2Netherlands 75.7 72.1 66.0 51.3 42.8 42.2 41.5 Ð43.5New Zealand 81.2 83.5 92.4 66.0 47.3 43.8 Ð41.7Norway 81.8 89.6 85.7 60.5 50.7 52.3 Ð38.0Singapore Ñ Ñ 99.7 84.8 66.3 57.1 61.3 ÑSpain 93.3 101.4 99.8 80.1 52.1 Ð44.2Sweden 80.6 69.5 52.9 44.4 43.0 42.7 Ð46.7Switzerland 100.8 87.9 69.6 52.2 32.9 32.7 31.5 Ð67.4UK 107.7 106.0 94.9 69.0 53.0 48.6 46.0 Ð50.8USA 93.6 86.7 74.4 42.2 30.3 Ð67.6
Mortality, males, stroke (ICD 430Ð438)
International healthÑhow Australia compares
96
Mortality, females, stroke (ICD 430Ð438)
International healthÑhow Australia compares
97
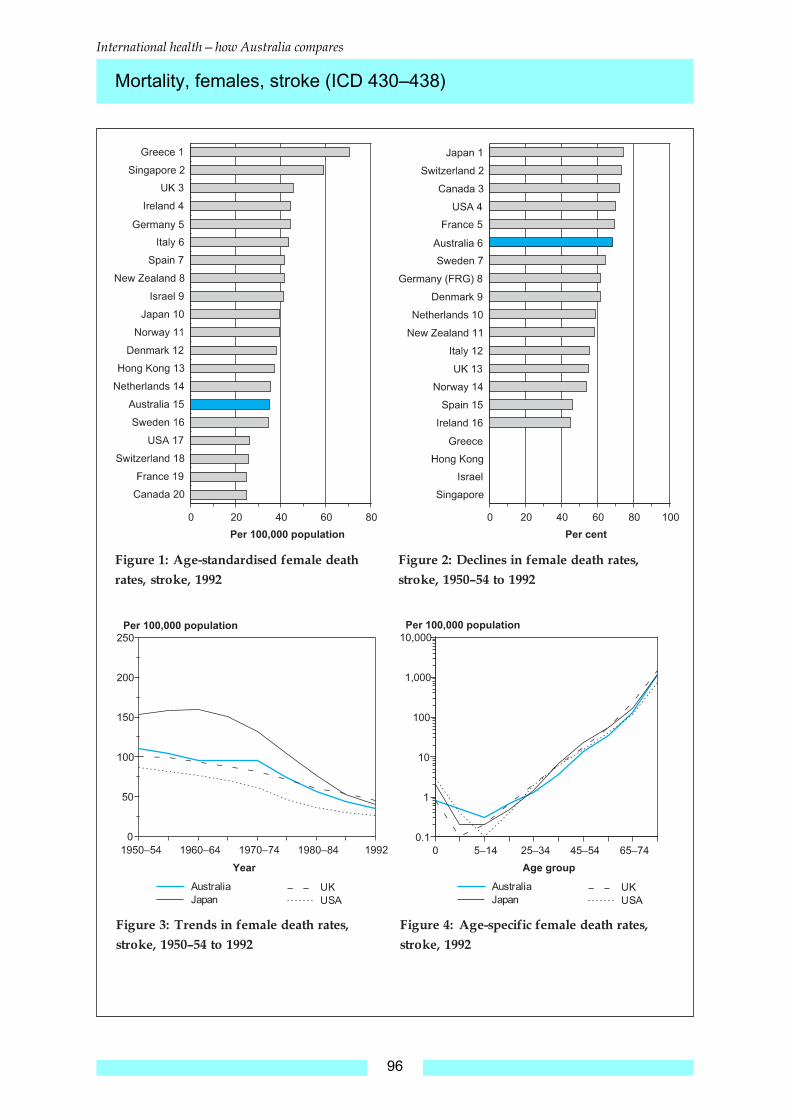
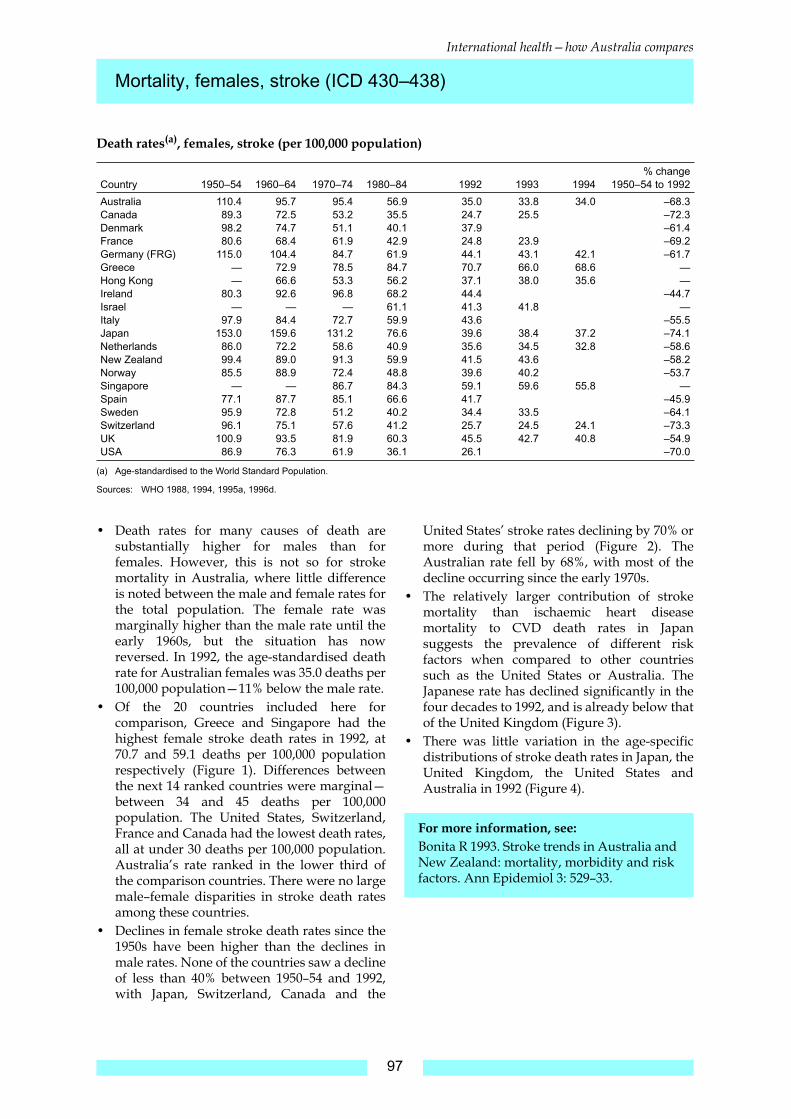
¥ Death rates for many causes of death aresubstantially higher for males than forfemales. However, this is not so for strokemortality in Australia, where little differenceis noted between the male and female rates forthe total population. The female rate wasmarginally higher than the male rate until theearly 1960s, but the situation has nowreversed. In 1992, the age-standardised deathrate for Australian females was 35.0 deaths per100,000 populationÑ11% below the male rate.
¥ Of the 20 countries included here forcomparison, Greece and Singapore had thehighest female stroke death rates in 1992, at70.7 and 59.1 deaths per 100,000 populationrespectively (Figure 1). Differences betweenthe next 14 ranked countries were marginalÑbetween 34 and 45 deaths per 100,000population. The United States, Switzerland,France and Canada had the lowest death rates,all at under 30 deaths per 100,000 population.AustraliaÕs rate ranked in the lower third ofthe comparison countries. There were no largemaleÐfemale disparities in stroke death ratesamong these countries.
¥ Declines in female stroke death rates since the1950s have been higher than the declines inmale rates. None of the countries saw a declineof less than 40% between 1950Ð54 and 1992,with Japan, Switzerland, Canada and the
United StatesÕ stroke rates declining by 70% ormore during that period (Figure 2). TheAustralian rate fell by 68%, with most of thedecline occurring since the early 1970s.
¥ The relatively larger contribution of strokemortality than ischaemic heart diseasemortality to CVD death rates in Japansuggests the prevalence of different riskfactors when compared to other countriessuch as the United States or Australia. TheJapanese rate has declined significantly in thefour decades to 1992, and is already below thatof the United Kingdom (Figure 3).
¥ There was little variation in the age-specificdistributions of stroke death rates in Japan, theUnited Kingdom, the United States andAustralia in 1992 (Figure 4).
For more information, see:
Bonita R 1993. Stroke trends in Australia and New Zealand: mortality, morbidity and risk factors. Ann Epidemiol 3: 529Ð33.
Death rates
(a)
, females, stroke (per 100,000 population)
(a) Age-standardised to the World Standard Population.
Sources: WHO 1988, 1994, 1995a, 1996d.
Country 1950Ð54 1960Ð64 1970Ð74 1980Ð84 1992 1993 1994% change
1950Ð54 to 1992
Australia 110.4 95.7 95.4 56.9 35.0 33.8 34.0 Ð68.3Canada 89.3 72.5 53.2 35.5 24.7 25.5 Ð72.3Denmark 98.2 74.7 51.1 40.1 37.9 Ð61.4France 80.6 68.4 61.9 42.9 24.8 23.9 Ð69.2Germany (FRG) 115.0 104.4 84.7 61.9 44.1 43.1 42.1 Ð61.7Greece Ñ 72.9 78.5 84.7 70.7 66.0 68.6 ÑHong Kong Ñ 66.6 53.3 56.2 37.1 38.0 35.6 ÑIreland 80.3 92.6 96.8 68.2 44.4 Ð44.7Israel Ñ Ñ Ñ 61.1 41.3 41.8 ÑItaly 97.9 84.4 72.7 59.9 43.6 Ð55.5Japan 153.0 159.6 131.2 76.6 39.6 38.4 37.2 Ð74.1Netherlands 86.0 72.2 58.6 40.9 35.6 34.5 32.8 Ð58.6New Zealand 99.4 89.0 91.3 59.9 41.5 43.6 Ð58.2Norway 85.5 88.9 72.4 48.8 39.6 40.2 Ð53.7Singapore Ñ Ñ 86.7 84.3 59.1 59.6 55.8 ÑSpain 77.1 87.7 85.1 66.6 41.7 Ð45.9Sweden 95.9 72.8 51.2 40.2 34.4 33.5 Ð64.1Switzerland 96.1 75.1 57.6 41.2 25.7 24.5 24.1 Ð73.3UK 100.9 93.5 81.9 60.3 45.5 42.7 40.8 Ð54.9USA 86.9 76.3 61.9 36.1 26.1 Ð70.0
Mortality, females, stroke (ICD 430Ð438)
Related Documents