Mortality in Iraq Associated with the 2003–2011 War and Occupation: Findings from a National Cluster Sample Survey by the University Collaborative Iraq Mortality Study Amy Hagopian 1 *, Abraham D. Flaxman 2 , Tim K. Takaro 3 , Sahar A. Esa Al Shatari 4 , Julie Rajaratnam 5 , Stan Becker 6 , Alison Levin-Rector 2 , Lindsay Galway 3 , Berq J. Hadi Al-Yasseri 7 , William M. Weiss 6 , Christopher J. Murray 2 , Gilbert Burnham 6 1 Health Alliance International, Department of Global Health, University of Washington, Seattle, Washington, United States of America, 2 Institute for Health Metrics and Evaluation, Department of Global Health, University of Washington, Seattle, Washington, United States of America, 3 Simon Fraser University, Burnaby, British Columbia, Canada, 4 Human Resources Development and Training Center, Iraq Ministry of Health, Baghdad, Iraq, 5 Harborview Medical Center, Department of Global Health, University of Washington, Seattle, Washington, United States of America, 6 Johns Hopkins University, Baltimore, Maryland, United States of America, 7 Iraq Ministry of Health, Baghdad, Iraq Abstract Background: Previous estimates of mortality in Iraq attributable to the 2003 invasion have been heterogeneous and controversial, and none were produced after 2006. The purpose of this research was to estimate direct and indirect deaths attributable to the war in Iraq between 2003 and 2011. Methods and Findings: We conducted a survey of 2,000 randomly selected households throughout Iraq, using a two-stage cluster sampling method to ensure the sample of households was nationally representative. We asked every household head about births and deaths since 2001, and all household adults about mortality among their siblings. We used secondary data sources to correct for out-migration. From March 1, 2003, to June 30, 2011, the crude death rate in Iraq was 4.55 per 1,000 person-years (95% uncertainty interval 3.74–5.27), more than 0.5 times higher than the death rate during the 26-mo period preceding the war, resulting in approximately 405,000 (95% uncertainty interval 48,000–751,000) excess deaths attributable to the conflict. Among adults, the risk of death rose 0.7 times higher for women and 2.9 times higher for men between the pre-war period (January 1, 2001, to February 28, 2003) and the peak of the war (2005–2006). We estimate that more than 60% of excess deaths were directly attributable to violence, with the rest associated with the collapse of infrastructure and other indirect, but war-related, causes. We used secondary sources to estimate rates of death among emigrants. Those estimates suggest we missed at least 55,000 deaths that would have been reported by households had the households remained behind in Iraq, but which instead had migrated away. Only 24 households refused to participate in the study. An additional five households were not interviewed because of hostile or threatening behavior, for a 98.55% response rate. The reliance on outdated census data and the long recall period required of participants are limitations of our study. Conclusions: Beyond expected rates, most mortality increases in Iraq can be attributed to direct violence, but about a third are attributable to indirect causes (such as from failures of health, sanitation, transportation, communication, and other systems). Approximately a half million deaths in Iraq could be attributable to the war. Please see later in the article for the Editors’ Summary. Citation: Hagopian A, Flaxman AD, Takaro TK, Esa Al Shatari SA, Rajaratnam J, et al. (2013) Mortality in Iraq Associated with the 2003–2011 War and Occupation: Findings from a National Cluster Sample Survey by the University Collaborative Iraq Mortality Study. PLoS Med 10(10): e1001533. doi:10.1371/ journal.pmed.1001533 Academic Editor: Edward J. Mills, University of Ottawa, Canada Received April 21, 2013; Accepted September 3, 2013; Published October 15, 2013 Copyright: ß 2013 Hagopian et al. This is an open-access article distributed under the terms of the Creative Commons Attribution License, which permits unrestricted use, distribution, and reproduction in any medium, provided the original author and source are credited. Funding: Support for this study came from pooled internal resources by the American and Canadian researchers without external funding. No funding bodies had any role in study design, data collection and analysis, decision to publish, or preparation of the manuscript. Competing Interests: The authors have declared that no competing interests exist. Abbreviations: COSIT, Iraqi Central Statistical Organization; ICSS, improved corrected sibling survival; IFHS, Iraq Family Health Survey; IMIRA, Iraq Multiple Indicator Rapid Assessment; PY, person-years; UI, uncertainty interval. * E-mail: [email protected] PLOS Medicine | www.plosmedicine.org 1 October 2013 | Volume 10 | Issue 10 | e1001533

Welcome message from author
This document is posted to help you gain knowledge. Please leave a comment to let me know what you think about it! Share it to your friends and learn new things together.
Transcript
Mortality in Iraq Associated with the 2003–2011 War andOccupation: Findings from a National Cluster SampleSurvey by the University Collaborative Iraq MortalityStudyAmy Hagopian1*, Abraham D. Flaxman2, Tim K. Takaro3, Sahar A. Esa Al Shatari4, Julie Rajaratnam5,
Stan Becker6, Alison Levin-Rector2, Lindsay Galway3, Berq J. Hadi Al-Yasseri7, William M. Weiss6,
Christopher J. Murray2, Gilbert Burnham6
1 Health Alliance International, Department of Global Health, University of Washington, Seattle, Washington, United States of America, 2 Institute for Health Metrics and
Evaluation, Department of Global Health, University of Washington, Seattle, Washington, United States of America, 3 Simon Fraser University, Burnaby, British Columbia,
Canada, 4 Human Resources Development and Training Center, Iraq Ministry of Health, Baghdad, Iraq, 5 Harborview Medical Center, Department of Global Health,
University of Washington, Seattle, Washington, United States of America, 6 Johns Hopkins University, Baltimore, Maryland, United States of America, 7 Iraq Ministry of
Health, Baghdad, Iraq
Abstract
Background: Previous estimates of mortality in Iraq attributable to the 2003 invasion have been heterogeneous andcontroversial, and none were produced after 2006. The purpose of this research was to estimate direct and indirect deathsattributable to the war in Iraq between 2003 and 2011.
Methods and Findings: We conducted a survey of 2,000 randomly selected households throughout Iraq, using a two-stagecluster sampling method to ensure the sample of households was nationally representative. We asked every householdhead about births and deaths since 2001, and all household adults about mortality among their siblings. We used secondarydata sources to correct for out-migration. From March 1, 2003, to June 30, 2011, the crude death rate in Iraq was 4.55 per1,000 person-years (95% uncertainty interval 3.74–5.27), more than 0.5 times higher than the death rate during the 26-moperiod preceding the war, resulting in approximately 405,000 (95% uncertainty interval 48,000–751,000) excess deathsattributable to the conflict. Among adults, the risk of death rose 0.7 times higher for women and 2.9 times higher for menbetween the pre-war period (January 1, 2001, to February 28, 2003) and the peak of the war (2005–2006). We estimate thatmore than 60% of excess deaths were directly attributable to violence, with the rest associated with the collapse ofinfrastructure and other indirect, but war-related, causes. We used secondary sources to estimate rates of death amongemigrants. Those estimates suggest we missed at least 55,000 deaths that would have been reported by households hadthe households remained behind in Iraq, but which instead had migrated away. Only 24 households refused to participatein the study. An additional five households were not interviewed because of hostile or threatening behavior, for a 98.55%response rate. The reliance on outdated census data and the long recall period required of participants are limitations of ourstudy.
Conclusions: Beyond expected rates, most mortality increases in Iraq can be attributed to direct violence, but about a thirdare attributable to indirect causes (such as from failures of health, sanitation, transportation, communication, and othersystems). Approximately a half million deaths in Iraq could be attributable to the war.
Please see later in the article for the Editors’ Summary.
Citation: Hagopian A, Flaxman AD, Takaro TK, Esa Al Shatari SA, Rajaratnam J, et al. (2013) Mortality in Iraq Associated with the 2003–2011 War and Occupation:Findings from a National Cluster Sample Survey by the University Collaborative Iraq Mortality Study. PLoS Med 10(10): e1001533. doi:10.1371/journal.pmed.1001533
Academic Editor: Edward J. Mills, University of Ottawa, Canada
Received April 21, 2013; Accepted September 3, 2013; Published October 15, 2013
Copyright: � 2013 Hagopian et al. This is an open-access article distributed under the terms of the Creative Commons Attribution License, which permitsunrestricted use, distribution, and reproduction in any medium, provided the original author and source are credited.
Funding: Support for this study came from pooled internal resources by the American and Canadian researchers without external funding. No funding bodieshad any role in study design, data collection and analysis, decision to publish, or preparation of the manuscript.
Competing Interests: The authors have declared that no competing interests exist.
Abbreviations: COSIT, Iraqi Central Statistical Organization; ICSS, improved corrected sibling survival; IFHS, Iraq Family Health Survey; IMIRA, Iraq MultipleIndicator Rapid Assessment; PY, person-years; UI, uncertainty interval.
* E-mail: [email protected]
PLOS Medicine | www.plosmedicine.org 1 October 2013 | Volume 10 | Issue 10 | e1001533
Introduction
Estimates of the number of Iraqi deaths after the US-led
invasion in 2003 have varied considerably and are contested [1–
24]. Measuring deaths during war is complex, and methods vary,
yet assessing the public health consequences of armed conflict is
important [25].
There are several approaches to measuring mortality during a
period of conflict, including registration of vital events, passive
surveillance, and population-based surveys [26]. Iraq’s last
complete census was in 1987, with a partial census in 1997, after
which Iraq experienced a period of extensive demographic
change, including internal and external migration. With regard
to vital events, death certificates continued to be issued during the
conflict, though aggregation and tabulation were affected [27].
To date, five population-based surveys have attempted to
estimate war-related deaths in Iraq. None of these were conducted
after 2006, the peak of the conflict and subsequent migration [4].
Two of these studies reported only the violent death rate [28,29],
and three estimated both violent-only and all-cause death rates
[30–32]. These studies reported widely varying rates of mortality.
All attracted various criticisms, including potential bias in sample
selection, wide ranges of uncertainty intervals (UIs) related to
relatively small sample sizes, and disputes related to statistical
methods, the choice of reference populations for calculating rates,
and the plausibility of results [4].
There has been substantial demographic change in Iraq as a
result of both internal and cross-border migration throughout the
course of the long conflict. Our study builds on lessons from
previous mortality studies in conflict settings and, to our
knowledge, provides the first estimates for mortality in Iraq during
the years 2006–2011. We used both the standard household
demographic method (reported household deaths) and the
improved corrected sibling survival (ICSS) method [33], the latter
to increase sample size, correct for survival bias [33–35], and
reduce migration bias. We analyzed data from both methods to
produce nationally representative estimates of conflict-related
mortality for both the general population (household survey) and
for Iraqi adults, defined [36] as those aged 15–60 y (sibling
survey). Additional analyses of secondary data were performed to
adjust these estimates to account for migration.
Methods
In mid-2011 we conducted a nationally representative cross-
sectional survey of all adults living in 2,000 randomly selected
households in 100 clusters across Iraq. In retrospective cluster
sample mortality surveys, the idea is to use random selection to
generate a predetermined number of ‘‘clusters,’’ or geographically
proximate household groups, across the area in question. These
representative households are then queried about their composi-
tion and mortality events over a given time period, to allow
researchers to generate crude death rates; these rates are then
multiplied by the country’s population total to calculate a death
estimate [37]. We used a questionnaire that asked all adults in the
household about the births and deaths of their siblings, as well as
all births and deaths in the household since 2001. The
questionnaire is provided as Questionnaire S1.
Setting and Sample SelectionWe employed a two-stage cluster sampling method. We used a
commercial software product (LandScan) that contained gridded
population data at the 1-km2 level in a geographic information
system, and we linked it to Google Earth imagery. In the first stage
of cluster selection, we randomly selected 100 1-km2 areas using a
probability-proportional-to-size approach. After those areas were
selected, we superimposed a smaller grid (10 m610 m) onto each
of the selected areas, and randomly selected one grid cell in each of
the 100 clusters. In each small grid cell, we examined the Google
Earth image and selected the residential rooftop that most fully fit
in the square to serve as the start household [38]. Details are in
Figure S1, Text S2, and Questionnaire S1. Our field manual (see
Manual S1) established protocols for selecting 19 dwellings
adjacent to the starting household.
Our sample size was established building on experience derived
from previous studies. By doubling the number of clusters used in
two previous mortality studies [30,31], we were able to reduce the
possibility of missing pockets of unusually high or low conflict-
related mortality, and by halving the number of households per
cluster we were able to keep the operational complexity of
conducting the survey manageable, and still visit a reasonable
number of households per cluster.
Processes and TimelineWe recruited study collaborators and drafted questionnaires in
early 2011. Lead researchers from three North American
universities and two Iraqi team leaders met in northern Iraq in
March 2011 to revise data collection instruments and survey
processes, finalize the field manual, and gain experience finding
start households using Google maps. The two Iraqi team leaders
recruited eight medical doctors with experience in community
surveys as interviewers. Author W. M. W. conducted training for
data collectors in Iraq in March 2011. Weekly (or more frequent)
teleconferences were held between the North American team and
the lead Iraqi investigator during the design and implementation
phases. The entire team met again in Iraq in September 2011 to
review and interpret preliminary findings.
Data Collection and EntryFour two-person teams along with their supervisors (for a total
of ten surveyors) surveyed 100 clusters of 20 households between
May 13 and July 2, 2011. The supervisor returned to one
randomly selected household in each cluster (where he or she had
not previously visited) to repeat the survey as a quality check.
When in governorates outside Baghdad, persons familiar with
locations and local security issues joined the teams to help obtain
local approvals and find designated clusters.
An Iraqi events calendar and an age/birth-year chart were
created to assist with recalling dates of birth or death. Interviewers
asked for causes of death, and coded these from a brief listing of
common causes. For war-related deaths, we asked for specific
causes (such as gunshots or explosions) and perceived responsible
parties (such as coalition forces or criminals). We trained
interviewers to probe for sensitive information about missing or
disappeared persons, and about events distant in time among
siblings and household members. We compiled qualitative
observations about the remoteness and other characteristics of
each cluster.
We needed to replace only one cluster (in Kerbela; governorate
names per the Iraqi Central Statistical Organization [COSIT];
http://www.cosit.gov.iq/AAS/AAS2012/section_10/1.htm) for
security reasons. We were obliged, however, to drop two remote
clusters where our teams were strongly advised by community
leaders not to visit dwellings (for cultural reasons); instead,
household members were invited to a central location for
Iraq Mortality Study
PLOS Medicine | www.plosmedicine.org 2 October 2013 | Volume 10 | Issue 10 | e1001533
interviews. As this violated the study protocol, these households
were dropped from the analysis.
InstrumentsEach paper questionnaire contained a household and a sibling
component. After obtaining verbal consent following our human
subjects protocol, we interviewed the head of household (or the most
senior member present) to complete a household listing. A household
was defined as a group of people, not necessarily related, who
regularly eat and sleep together in a building with a separate
entrance and who share a kitchen. For the household component,
household births and deaths between January 1, 2001, and the
interview date were recorded. When deaths were reported,
interviewers requested to see death certificates. We recorded whether
interviewers were shown the certificate, whether the certificate was
reported to be present but not seen, or whether it was absent.
The second component of the questionnaire was a sibling
history module (commonly used in Demographic and Health
Surveys in developing countries) [33]. By asking all adults in the
household to recall and report on each of their siblings (defined as
persons born to the same biological mother), we were able to
estimate probabilities of death for adults across several decades.
Respondents to the sibling history module included all
household members aged 18 y and older, and any married people
under 18 y. Where necessary, telephone interviews of absent adult
household members were conducted while the interviewers were
in the household. We allowed limited proxy reporting for siblings.
The mother of adult siblings in the home was allowed to report
about her own children. If an adult in the home was incapable of
responding (because of absence, disability, or refusal), his or her
relatives reported on that person’s siblings, but only if they said
they were fully knowledgeable. Otherwise, the person’s response
was marked as missing. If two or more siblings lived together in the
same home, we interviewed only one (whichever one was actually
present, or, if all were present, the sibling with the nearest next
birthday to the date of our visit).
Data were recorded on paper forms, and then entered using
EpiData soon after collection (see full dataset at http://ghdx.
healthmetricsandevaluation.org/record/mortality-iraq-associated-
2003-2011-invasion-and-occupation). Data were immediately
uploaded to a website ‘‘dashboard’’ to allow all investigators to
monitor data collection. We employed algorithms to scan for
systematic interviewer error [39], and observed none. All data
records were rechecked against the paper record to identify and
correct discrepancies.
AnalysisHousehold analysis. We estimated crude death rates for the
time periods January 1, 2001–February 28, 2003 and March 1,
2003–June 30, 2011 by counting deaths occurring in all
households in each time period and dividing by the person-years
lived within the time period. We collected month and year of birth
and death information and month and year of household
formation. When the value was missing for month of death (7%,
n = 26), we used June (except for 2011, where we used March for
the one case with the month missing).
We calculated UIs at the 95% level for crude death rates for
each time period using a bootstrapping method. Uncertainty
intervals can be interpreted similarly to confidence intervals. To
account for clustering, we first sampled (with replacement) the 98
existing clusters 1,000 times, so that each time we selected 98
clusters—with some of the original clusters sampled more than
once, and some not sampled at all. Next, for each of the 1,000 sets
of clusters, we resampled the original number of households (with
replacement) within each of the 98 sampled clusters. For each of
these 1,000 replicates, we calculated annual crude death rates. The
2.5th and 97.5th percentiles of these 1,000 values served as our
lower and upper bounds, respectively [40,41].
To estimate excess deaths caused by conflict, we calculated the
war-related death rate to be the difference between the crude
death rate for each time period and the crude rate during the
baseline time period (January 1, 2001, to February 28, 2003). To
create a war-related death count for the total population, we used
the yearly United Nations Population Division estimates [42] for
Iraq multiplied by the war-related crude death rate. To estimate
upper and lower uncertainty bounds, we used the bootstrapping
method described above. Because the bootstrap process randomly
chooses 1,000 possible scenarios, and we did not limit the
assumptions otherwise, the occasional random selection could (and
did) show a protective effect of conflict (which served to lower our
final death rates).
To assess the effects of clustering on our data (‘‘design effects’’),
we compared our two-stage bootstrap estimates of crude mortality
to a naıve bootstrap: the ratio of the confidence interval of the larger
to the smaller constitutes an estimate of the square root of the design
effect. These effects of cluster sampling were not particularly large,
ranging from 1.19 to 1.54 for each sex by year [43].
Sibling analysis. Data about adult mortality using the sibling
report method are subject to predictable biases. Sibships that
experience a higher mortality risk are underrepresented at the
time of the survey, because these siblings are less likely to survive to
be able to report (survival bias). Additionally, larger sibships are
overrepresented in the sample, because there are more siblings in
the sampling frame. We used the ICSS method to adjust for these
biases [33]. Further details are in Text S1.
We calculated mortality rates for 5-y age groups between the
ages of 15 and 59 y for the time periods January 1, 2001–February
28, 2003; March 1, 2003–December 31, 2004; the full years 2005–
2006, 2007–2008, 2009–2010; and January 1–June 30, 2011. Our
summary metric of adult mortality is 45q15, which is the risk that an
individual will die before his or her 60th birthday given that he or
she has lived to age 15 y. For example, male 45q15 ranges from
below 0.05 in a few countries to above 0.45 in a handful of high-
mortality African nations [44]. Uncertainty intervals were
calculated using the same bootstrapping method as in the
household analysis. Bootstrapping is appropriate for complex
methods such as ICSS, where there is no alternative to calculating
UIs. We used Stata/IC 12.0 and Python 2.6 for all analyses.
Migration AdjustmentUnlike the adult sibling survival method, there is no accepted
method for adjusting household figures to account for households
entirely destroyed subsequent to the death of all members, or lost
to migration out of the country, especially for households that
experienced a death. The Iraq Family Health Survey (IFHS) study
acknowledges this shortcoming in its work as well [32]. There is
evidence that the killings in Iraq were disproportionately targeted
towards the higher-income intelligentsia, a group typically in a
better position to migrate to a safer setting if under attack [45]. We
therefore reviewed a number of secondary data sources to estimate
the number of Iraqis who migrated out of the country over the
course of the war, to arrive at a total estimate of the missing
households that left the country (and were therefore no longer
available in our sampling frame). We then divided this total by an
estimated household size, and multiplied total households by the
average fraction of deaths per household [46] to estimate the total
deaths our household survey would have missed, and added this
number to our total death count.
Iraq Mortality Study
PLOS Medicine | www.plosmedicine.org 3 October 2013 | Volume 10 | Issue 10 | e1001533
Ta
ble
1.
Sam
ple
size
and
cou
nts
of
ho
use
ho
ldm
em
be
rsan
dsi
blin
gs
inth
eU
niv
ers
ity
Co
llab
ora
tive
Iraq
Mo
rtal
ity
Stu
dy,
by
go
vern
ora
te.
Go
ve
rno
rate
Est
ima
ted
20
09
CO
SIT
Po
pu
lati
on
Pro
po
rtio
no
fT
ota
lIr
aq
Po
pu
lati
on
Nu
mb
er
of
Clu
ste
rs
Pro
po
rtio
no
fS
am
ple
Nu
mb
er
of
Ad
ult
sR
ep
ort
ing
on
Sib
lin
gs
Nu
mb
er
of
Un
iqu
eS
ibli
ng
sR
ep
ort
ed
Nu
mb
er
of
Ho
use
ho
ldH
ea
ds
Re
po
rtin
go
nH
ou
seh
old
Me
mb
ers
Ho
use
ho
ldM
em
be
rsa
tT
ime
of
Su
rve
y
Pe
rce
nt
of
Sib
lin
gs
Mis
sin
gC
au
seo
fD
ea
tha
Al-
An
bar
1,4
83
,35
90
.04
57
0.0
73
75
2,5
40
14
09
90
0.1
2%
Al-
Bas
rah
2,4
05
,43
40
.08
08
0.0
83
35
1,9
08
16
08
84
0.0
5%
Al-
Mu
than
na
68
3,1
26
0.0
22
10
.01
61
37
12
01
42
0.2
7%
Al-
Naj
af1
,22
1,2
28
0.0
37
20
.02
68
39
84
02
00
0.5
1%
Al-
Qad
isiy
a1
,07
7,6
14
0.0
35
40
.04
23
41
,36
68
05
80
0.1
5%
Al-
Sula
iman
iya
1,7
84
,85
30
.04
87
0.0
72
91
1,8
22
13
96
63
0.2
2%
Bab
ylo
n1
,72
9,6
66
0.0
54
30
.03
15
48
77
61
35
30
.23
%
Bag
hd
ad6
,70
2,5
38
0.2
24
23
0.2
31
,06
65
,44
24
60
2,3
47
0.1
7%
Dia
la1
,37
1,0
35
0.0
43
50
.05
18
31
,05
01
00
46
30
.19
%
Du
ho
uk
1,0
72
,32
40
.03
02
0.0
29
86
06
40
28
40
.00
%
Erb
il1
,53
2,0
81
0.0
46
90
.09
35
72
,05
51
80
80
30
.10
%
Ke
rbe
la1
,01
3,2
54
0.0
31
20
.02
10
96
07
40
22
10
.33
%
Kir
kuk
1,3
25
,85
30
.04
02
0.0
29
85
02
40
20
10
.00
%
May
san
92
2,8
90
0.0
31
30
.03
11
87
04
60
31
10
.00
%
Nin
eva
h3
,10
6,9
48
0.1
01
13
0.1
34
67
2,8
46
26
01
,29
80
.04
%
Sala
hA
l-D
ee
n1
,33
7,7
86
0.0
39
30
.03
11
16
69
60
31
20
.30
%
Th
iQ
ar1
,74
4,3
98
0.0
58
30
.03
10
56
72
60
30
80
.00
%
Was
it1
,15
0,0
79
0.0
36
30
.03
12
07
30
60
31
00
.00
%
All
go
vern
ora
tes
32
,10
4,9
88
10
0%
10
01
00
%4
,35
02
5,1
65
2,0
00
10
,67
00
.13
%
Po
pu
lati
on
dat
afr
om
CO
SIT
.aA
sa
che
cko
fva
lidit
y.d
oi:1
0.1
37
1/j
ou
rnal
.pm
ed
.10
01
53
3.t
00
1
Iraq Mortality Study
PLOS Medicine | www.plosmedicine.org 4 October 2013 | Volume 10 | Issue 10 | e1001533
Ethical ReviewWe had review board approval from each participating
institution in the study. Methods were reviewed to ensure they
complied with the ethical guidelines for epidemiological research
set out by the Council for International Organizations of Medical
Sciences and other guidance, including the professional respon-
sibility code of the American Association for Public Opinion
Research [47–49]. An ethicist experienced in international
research associated with the Institute of Translational Health
Sciences at the University of Washington, Benjamin Wilfond,
further reviewed the protocols to ensure the safety of participants
and interviewers was adequately protected.
Results
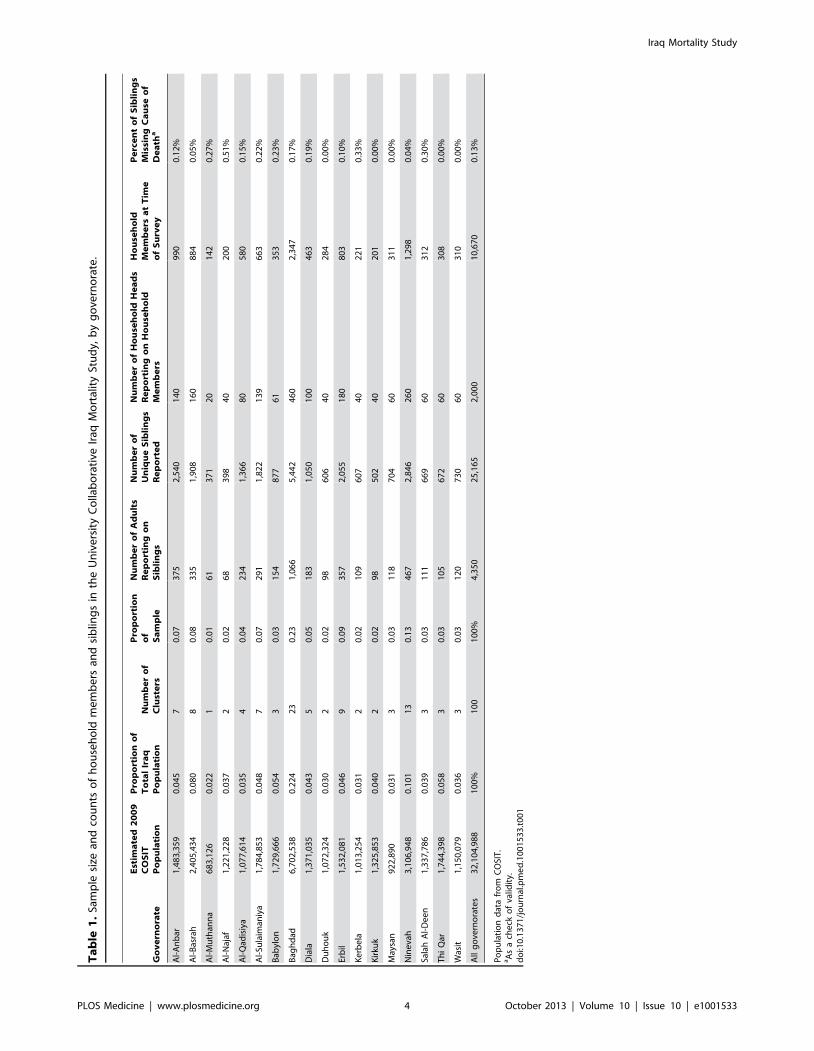
We collected data from 2,000 households in 100 clusters,
distributed across Iraq’s 18 governorates. After removing the two
clusters previously mentioned, the total household count was
1,960, with an average of 5.34 members per household. The study
population was distributed similarly to Iraq’s estimated total 2009
population as reported by COSIT, which based its estimate on
projections from the 1997 census for the 15 southern governorates
and on the 1987 census for the three Kurdish governorates. We
compared the proportion of our sample to the proportion of the
total population in each governorate as reported by COSIT, and
derived an index of dissimilarity of 14% [50]. The percent of
recorded deaths with missing ‘‘cause of death’’ data is small. See
Table 1.
Interviewers reported that 24 households refused to participate
in the study, and five households were not interviewed because of
hostile or threatening behavior (resulting in a 98.55% response
rate). This low refusal rate is not uncommon for surveys in similar
countries [51]. An additional 188 buildings were occupied by a
business or other establishment, rather than a household, and four
previously selected start dwellings were found to have been
destroyed. In all these cases, replacement households were chosen
using our established study protocol, to ensure total households
numbered 20 per cluster.
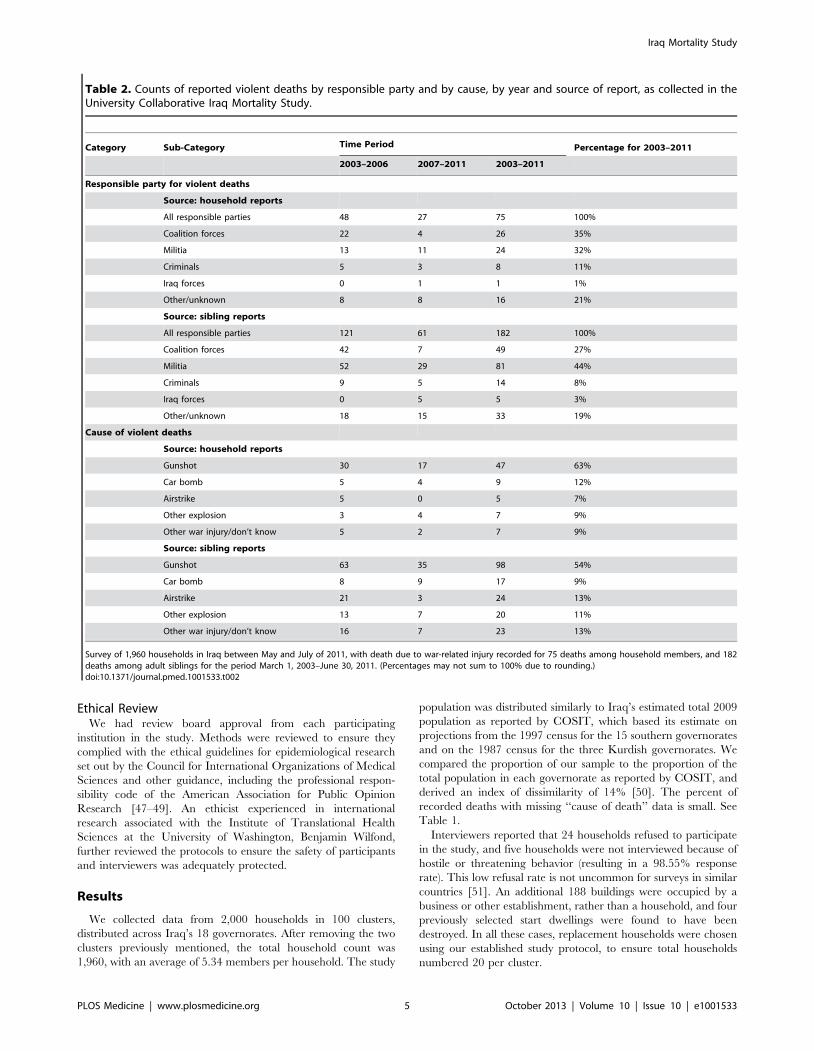
Table 2. Counts of reported violent deaths by responsible party and by cause, by year and source of report, as collected in theUniversity Collaborative Iraq Mortality Study.
Category Sub-Category Time Period Percentage for 2003–2011
2003–2006 2007–2011 2003–2011
Responsible party for violent deaths
Source: household reports
All responsible parties 48 27 75 100%
Coalition forces 22 4 26 35%
Militia 13 11 24 32%
Criminals 5 3 8 11%
Iraq forces 0 1 1 1%
Other/unknown 8 8 16 21%
Source: sibling reports
All responsible parties 121 61 182 100%
Coalition forces 42 7 49 27%
Militia 52 29 81 44%
Criminals 9 5 14 8%
Iraq forces 0 5 5 3%
Other/unknown 18 15 33 19%
Cause of violent deaths
Source: household reports
Gunshot 30 17 47 63%
Car bomb 5 4 9 12%
Airstrike 5 0 5 7%
Other explosion 3 4 7 9%
Other war injury/don’t know 5 2 7 9%
Source: sibling reports
Gunshot 63 35 98 54%
Car bomb 8 9 17 9%
Airstrike 21 3 24 13%
Other explosion 13 7 20 11%
Other war injury/don’t know 16 7 23 13%
Survey of 1,960 households in Iraq between May and July of 2011, with death due to war-related injury recorded for 75 deaths among household members, and 182deaths among adult siblings for the period March 1, 2003–June 30, 2011. (Percentages may not sum to 100% due to rounding.)doi:10.1371/journal.pmed.1001533.t002
Iraq Mortality Study
PLOS Medicine | www.plosmedicine.org 5 October 2013 | Volume 10 | Issue 10 | e1001533
Household Survey ResultsThe majority of the heads of the 1,960 households were male
(85%). At the beginning of the first time period (January 2001),
1,313 of these households were already established, and contained
approximately 6,455 members. A total of 2,735 births and 383
deaths were reported during the study period. Sex and cause of
death were reported for 98.4% of deaths (n = 377). Of 10,467
household members at the survey date, 50% were male, and 42%
were children under the age of 18 y. On average, households had
existed as a unit for a mean of 19.9 y (and a median of 17 y) at the
time of interview. The crude birth rate was 35.5 per 1,000 persons
in 2001, and 32.7 in 2010. Estimated wartime crude death rates
ranged from 2.0 per 1,000 person-years (PY) for females in 2011 to
7.9 for males in 2005–2006; pre-war crude death rates (2001–
February 2003) were 2.1 per 1,000 PY for females and 3.7 for
males.
Respondents attributed 19% of household deaths to war-related
violence (n = 72) and named a responsible entity for 79% (n = 59)
of those deaths. See Table 2 for violent deaths reported by type
and responsible party.
Despite receiving the most press coverage, explosive devices
were not the leading proximate cause of death among war
casualties—rather, gunshots were [52,53]. Gunshots were reported
to cause 63% of violent deaths; car bombs, 12%; and other
explosions, 9%. Gunshot deaths were most common for the period
March 1, 2003–December 31, 2008, and dropped precipitously
thereafter.
US-led coalition forces were reported to be responsible for the
largest proportion of war-related violent deaths (35%), followed by
militia (32%). While militia were reportedly responsible for the
most adult male deaths in the sibling survey, coalition forces were
reportedly responsible for killing the most women.
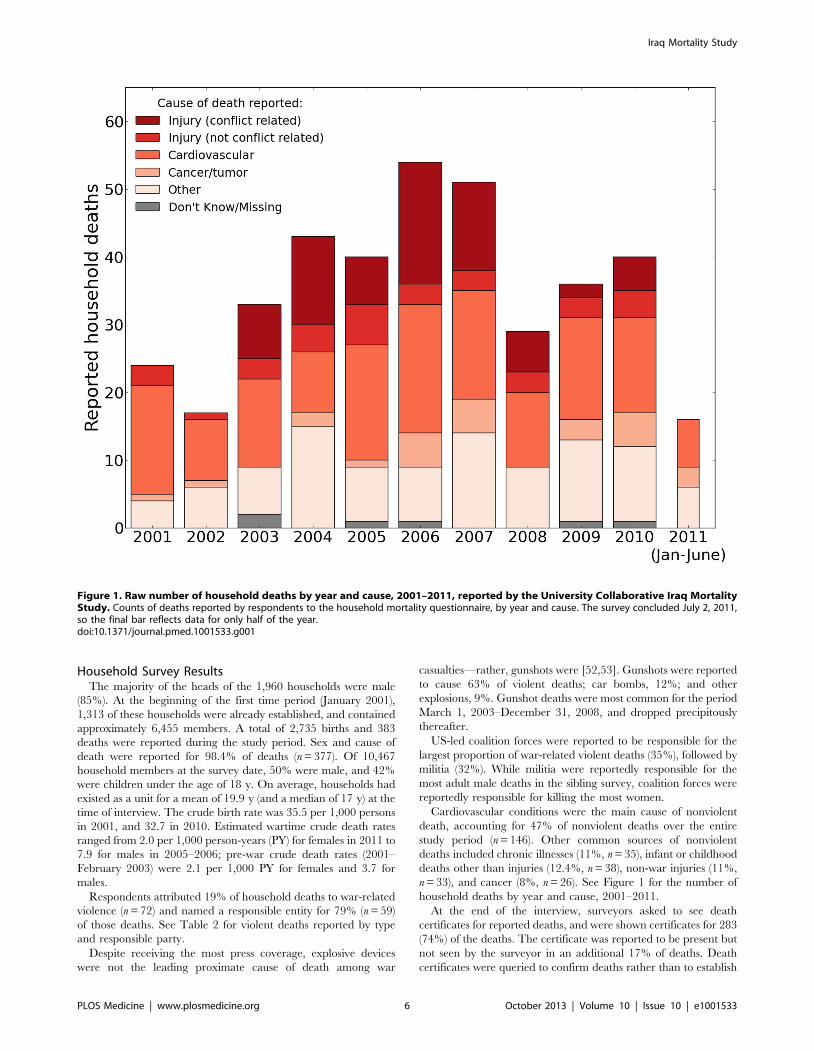
Cardiovascular conditions were the main cause of nonviolent
death, accounting for 47% of nonviolent deaths over the entire
study period (n = 146). Other common sources of nonviolent
deaths included chronic illnesses (11%, n = 35), infant or childhood
deaths other than injuries (12.4%, n = 38), non-war injuries (11%,
n = 33), and cancer (8%, n = 26). See Figure 1 for the number of
household deaths by year and cause, 2001–2011.
At the end of the interview, surveyors asked to see death
certificates for reported deaths, and were shown certificates for 283
(74%) of the deaths. The certificate was reported to be present but
not seen by the surveyor in an additional 17% of deaths. Death
certificates were queried to confirm deaths rather than to establish
Figure 1. Raw number of household deaths by year and cause, 2001–2011, reported by the University Collaborative Iraq MortalityStudy. Counts of deaths reported by respondents to the household mortality questionnaire, by year and cause. The survey concluded July 2, 2011,so the final bar reflects data for only half of the year.doi:10.1371/journal.pmed.1001533.g001
Iraq Mortality Study
PLOS Medicine | www.plosmedicine.org 6 October 2013 | Volume 10 | Issue 10 | e1001533
the cause of death. Iraqi team members believed family cause-of-
death reports were likely to be more accurate than cause of death
on certificates, as the true cause of death was often not given
during times of intense insecurity. The percentage of violent
deaths reported by households with death certificates available did
not differ substantially from those without. The percentage of
households reporting deaths that had death certificates, either
shown or claimed (91%), was identical in the 2006 and 2011
studies, indicating that the availability of death certificates
remained high throughout the war.
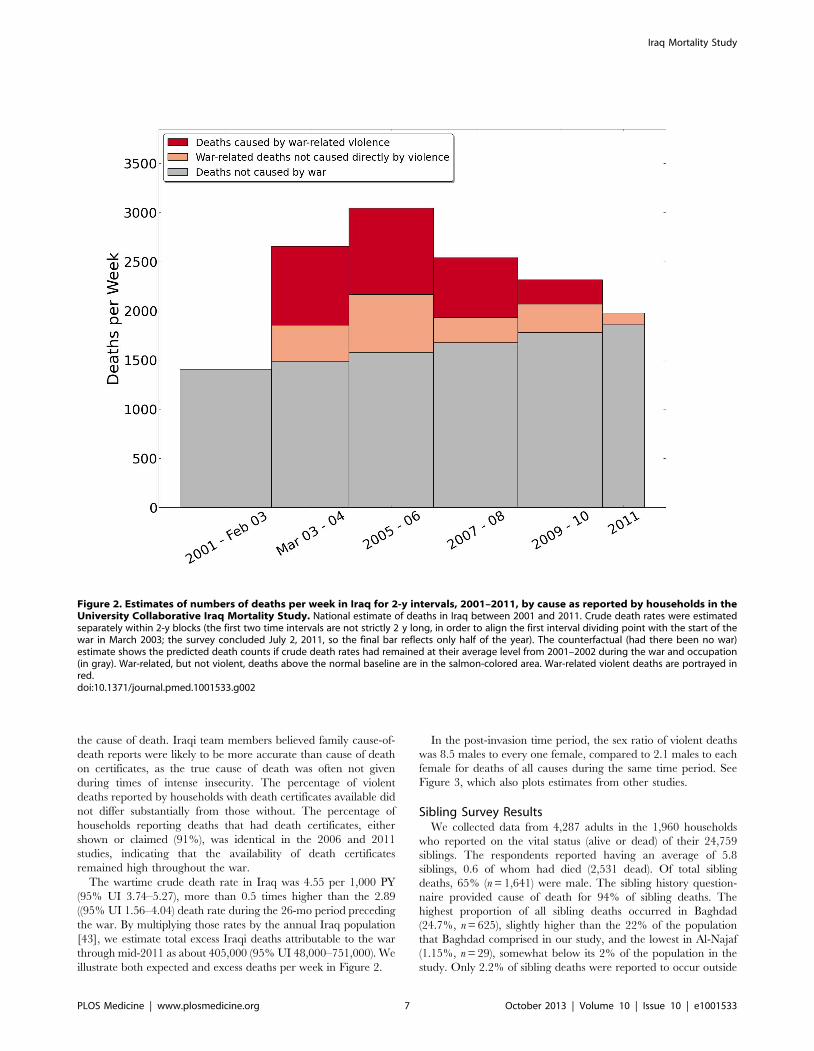
The wartime crude death rate in Iraq was 4.55 per 1,000 PY
(95% UI 3.74–5.27), more than 0.5 times higher than the 2.89
((95% UI 1.56–4.04) death rate during the 26-mo period preceding
the war. By multiplying those rates by the annual Iraq population
[43], we estimate total excess Iraqi deaths attributable to the war
through mid-2011 as about 405,000 (95% UI 48,000–751,000). We
illustrate both expected and excess deaths per week in Figure 2.
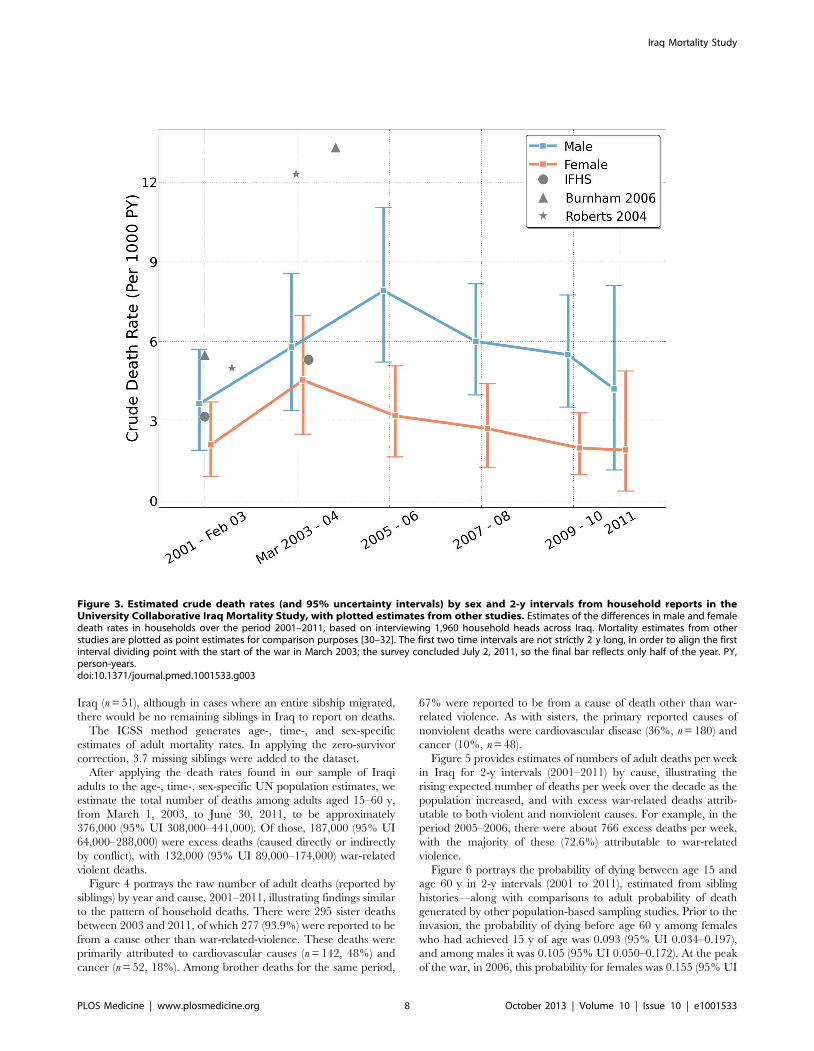
In the post-invasion time period, the sex ratio of violent deaths
was 8.5 males to every one female, compared to 2.1 males to each
female for deaths of all causes during the same time period. See
Figure 3, which also plots estimates from other studies.
Sibling Survey ResultsWe collected data from 4,287 adults in the 1,960 households
who reported on the vital status (alive or dead) of their 24,759
siblings. The respondents reported having an average of 5.8
siblings, 0.6 of whom had died (2,531 dead). Of total sibling
deaths, 65% (n = 1,641) were male. The sibling history question-
naire provided cause of death for 94% of sibling deaths. The
highest proportion of all sibling deaths occurred in Baghdad
(24.7%, n = 625), slightly higher than the 22% of the population
that Baghdad comprised in our study, and the lowest in Al-Najaf
(1.15%, n = 29), somewhat below its 2% of the population in the
study. Only 2.2% of sibling deaths were reported to occur outside
Figure 2. Estimates of numbers of deaths per week in Iraq for 2-y intervals, 2001–2011, by cause as reported by households in theUniversity Collaborative Iraq Mortality Study. National estimate of deaths in Iraq between 2001 and 2011. Crude death rates were estimatedseparately within 2-y blocks (the first two time intervals are not strictly 2 y long, in order to align the first interval dividing point with the start of thewar in March 2003; the survey concluded July 2, 2011, so the final bar reflects only half of the year). The counterfactual (had there been no war)estimate shows the predicted death counts if crude death rates had remained at their average level from 2001–2002 during the war and occupation(in gray). War-related, but not violent, deaths above the normal baseline are in the salmon-colored area. War-related violent deaths are portrayed inred.doi:10.1371/journal.pmed.1001533.g002
Iraq Mortality Study
PLOS Medicine | www.plosmedicine.org 7 October 2013 | Volume 10 | Issue 10 | e1001533
Iraq (n = 51), although in cases where an entire sibship migrated,
there would be no remaining siblings in Iraq to report on deaths.
The ICSS method generates age-, time-, and sex-specific
estimates of adult mortality rates. In applying the zero-survivor
correction, 3.7 missing siblings were added to the dataset.
After applying the death rates found in our sample of Iraqi
adults to the age-, time-, sex-specific UN population estimates, we
estimate the total number of deaths among adults aged 15–60 y,
from March 1, 2003, to June 30, 2011, to be approximately
376,000 (95% UI 308,000–441,000). Of those, 187,000 (95% UI
64,000–288,000) were excess deaths (caused directly or indirectly
by conflict), with 132,000 (95% UI 89,000–174,000) war-related
violent deaths.
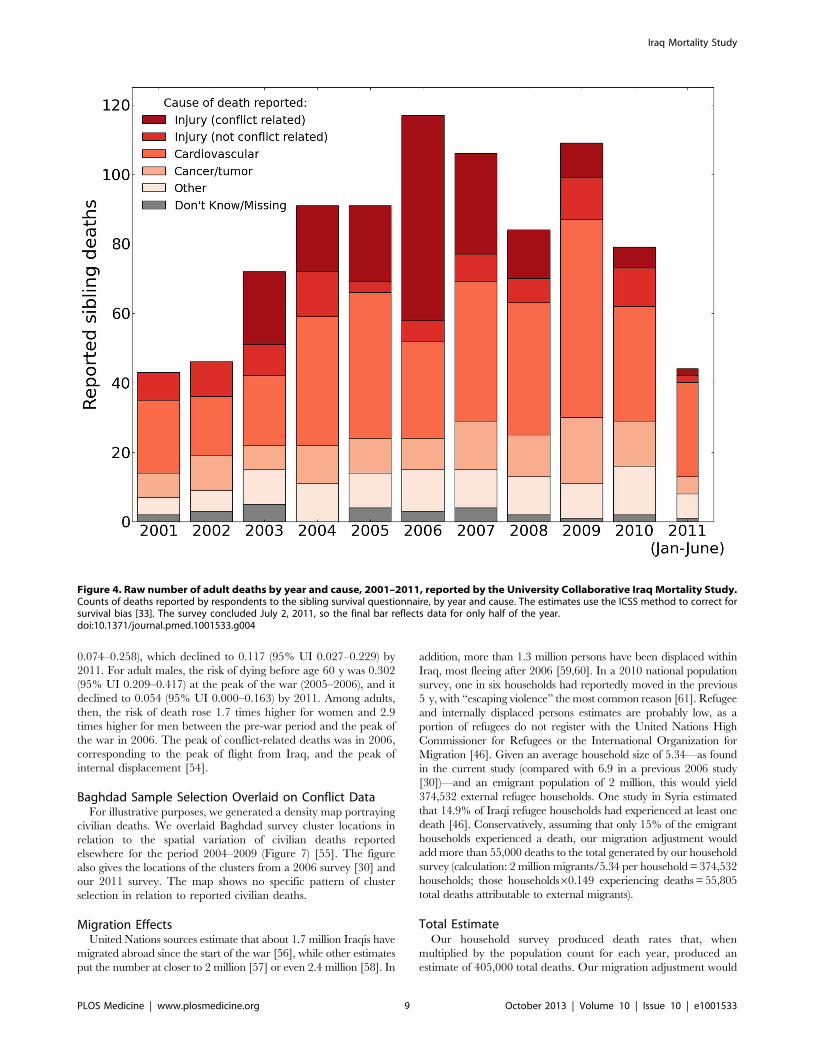
Figure 4 portrays the raw number of adult deaths (reported by
siblings) by year and cause, 2001–2011, illustrating findings similar
to the pattern of household deaths. There were 295 sister deaths
between 2003 and 2011, of which 277 (93.9%) were reported to be
from a cause other than war-related-violence. These deaths were
primarily attributed to cardiovascular causes (n = 142, 48%) and
cancer (n = 52, 18%). Among brother deaths for the same period,
67% were reported to be from a cause of death other than war-
related violence. As with sisters, the primary reported causes of
nonviolent deaths were cardiovascular disease (36%, n = 180) and
cancer (10%, n = 48).
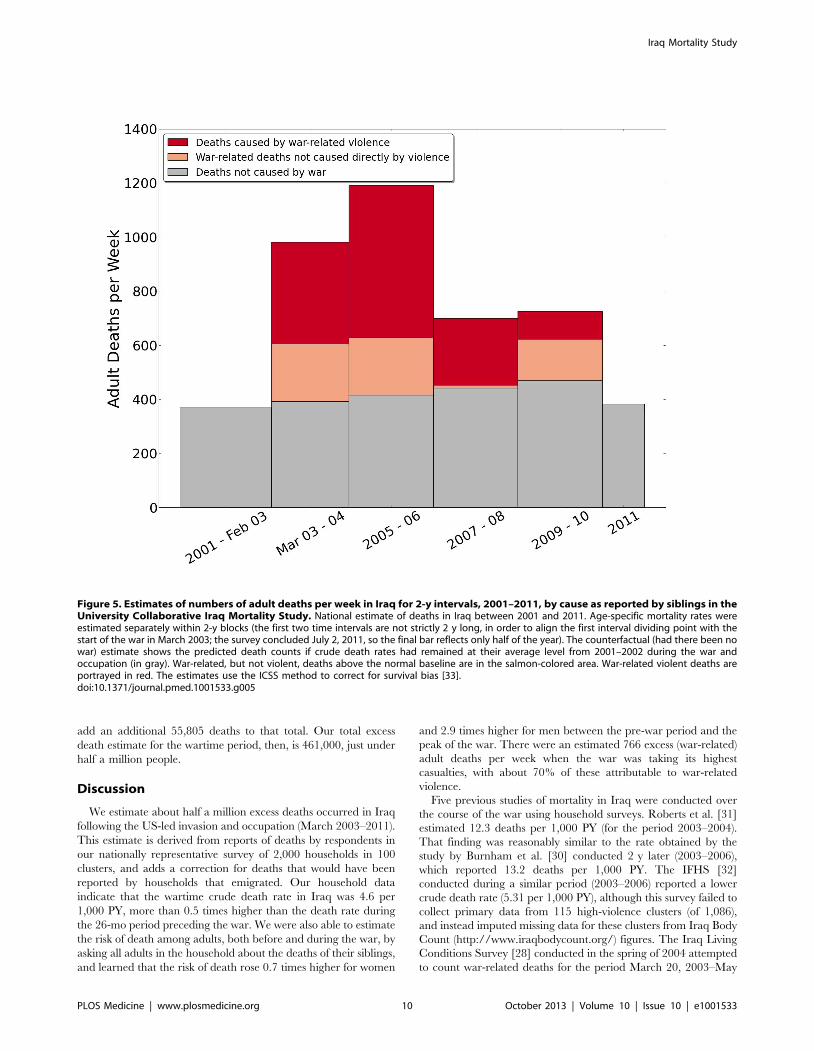
Figure 5 provides estimates of numbers of adult deaths per week
in Iraq for 2-y intervals (2001–2011) by cause, illustrating the
rising expected number of deaths per week over the decade as the
population increased, and with excess war-related deaths attrib-
utable to both violent and nonviolent causes. For example, in the
period 2005–2006, there were about 766 excess deaths per week,
with the majority of these (72.6%) attributable to war-related
violence.
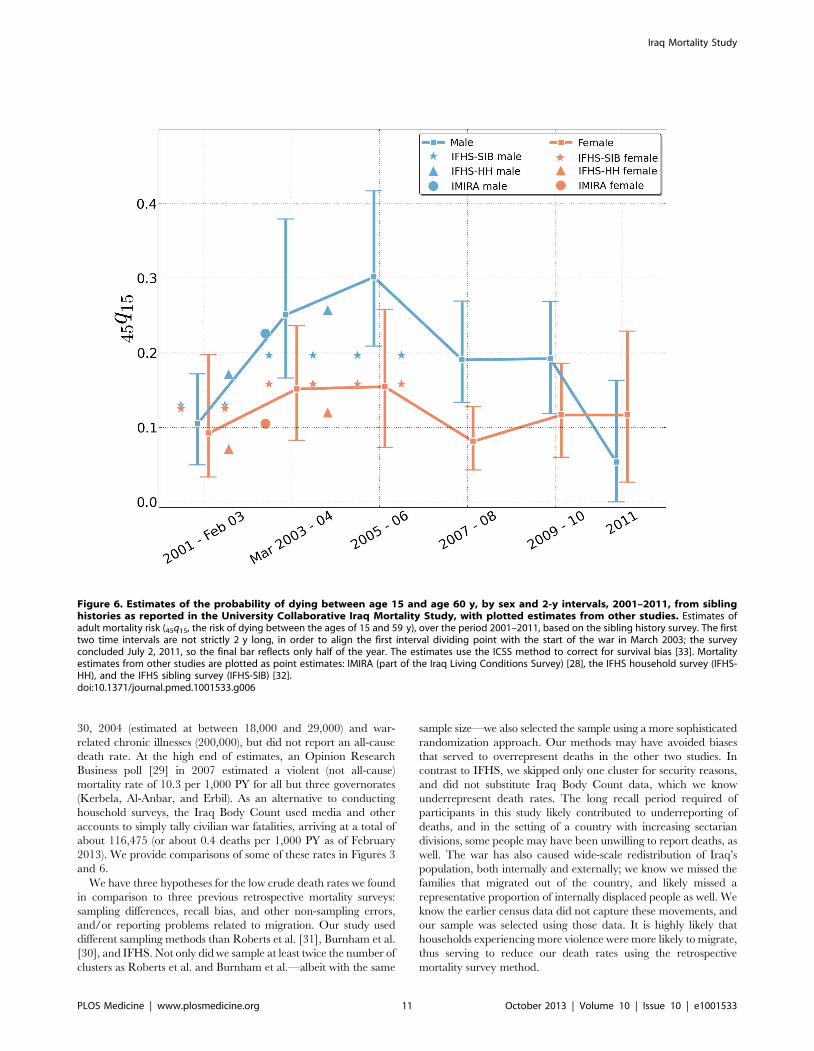
Figure 6 portrays the probability of dying between age 15 and
age 60 y in 2-y intervals (2001 to 2011), estimated from sibling
histories—along with comparisons to adult probability of death
generated by other population-based sampling studies. Prior to the
invasion, the probability of dying before age 60 y among females
who had achieved 15 y of age was 0.093 (95% UI 0.034–0.197),
and among males it was 0.105 (95% UI 0.050–0.172). At the peak
of the war, in 2006, this probability for females was 0.155 (95% UI
Figure 3. Estimated crude death rates (and 95% uncertainty intervals) by sex and 2-y intervals from household reports in theUniversity Collaborative Iraq Mortality Study, with plotted estimates from other studies. Estimates of the differences in male and femaledeath rates in households over the period 2001–2011, based on interviewing 1,960 household heads across Iraq. Mortality estimates from otherstudies are plotted as point estimates for comparison purposes [30–32]. The first two time intervals are not strictly 2 y long, in order to align the firstinterval dividing point with the start of the war in March 2003; the survey concluded July 2, 2011, so the final bar reflects only half of the year. PY,person-years.doi:10.1371/journal.pmed.1001533.g003
Iraq Mortality Study
PLOS Medicine | www.plosmedicine.org 8 October 2013 | Volume 10 | Issue 10 | e1001533
0.074–0.258), which declined to 0.117 (95% UI 0.027–0.229) by
2011. For adult males, the risk of dying before age 60 y was 0.302
(95% UI 0.209–0.417) at the peak of the war (2005–2006), and it
declined to 0.054 (95% UI 0.000–0.163) by 2011. Among adults,
then, the risk of death rose 1.7 times higher for women and 2.9
times higher for men between the pre-war period and the peak of
the war in 2006. The peak of conflict-related deaths was in 2006,
corresponding to the peak of flight from Iraq, and the peak of
internal displacement [54].
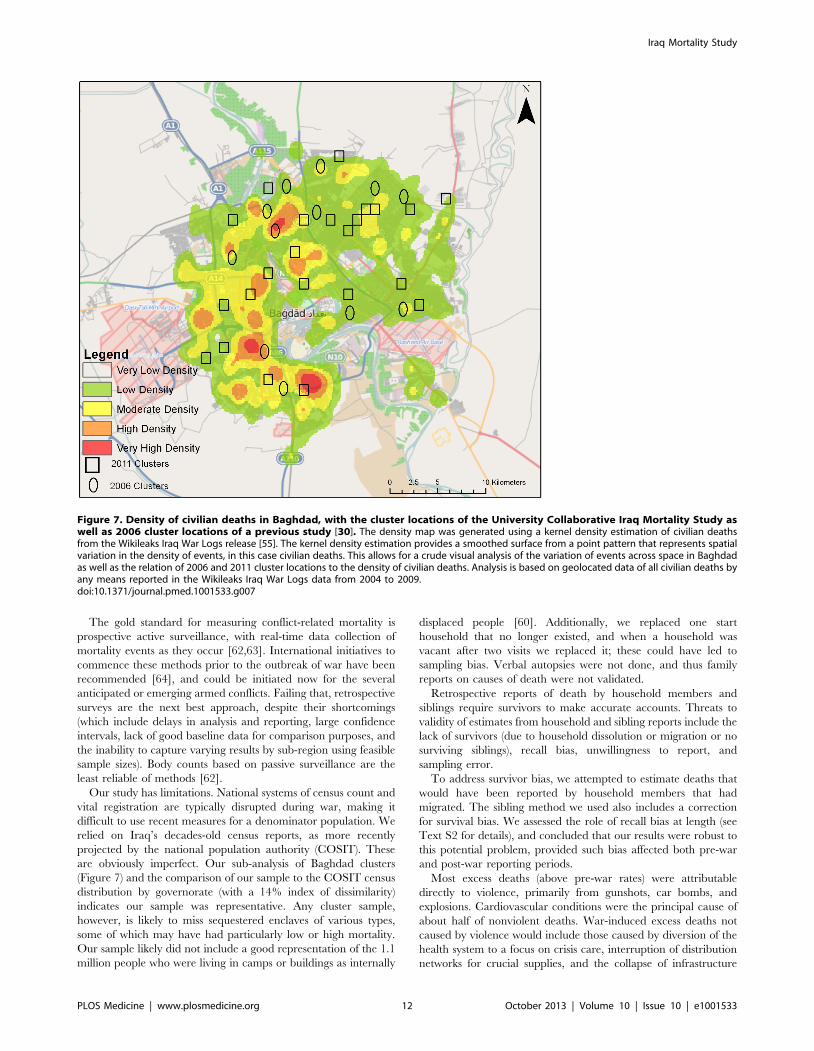
Baghdad Sample Selection Overlaid on Conflict DataFor illustrative purposes, we generated a density map portraying
civilian deaths. We overlaid Baghdad survey cluster locations in
relation to the spatial variation of civilian deaths reported
elsewhere for the period 2004–2009 (Figure 7) [55]. The figure
also gives the locations of the clusters from a 2006 survey [30] and
our 2011 survey. The map shows no specific pattern of cluster
selection in relation to reported civilian deaths.
Migration EffectsUnited Nations sources estimate that about 1.7 million Iraqis have
migrated abroad since the start of the war [56], while other estimates
put the number at closer to 2 million [57] or even 2.4 million [58]. In
addition, more than 1.3 million persons have been displaced within
Iraq, most fleeing after 2006 [59,60]. In a 2010 national population
survey, one in six households had reportedly moved in the previous
5 y, with ‘‘escaping violence’’ the most common reason [61]. Refugee
and internally displaced persons estimates are probably low, as a
portion of refugees do not register with the United Nations High
Commissioner for Refugees or the International Organization for
Migration [46]. Given an average household size of 5.34—as found
in the current study (compared with 6.9 in a previous 2006 study
[30])—and an emigrant population of 2 million, this would yield
374,532 external refugee households. One study in Syria estimated
that 14.9% of Iraqi refugee households had experienced at least one
death [46]. Conservatively, assuming that only 15% of the emigrant
households experienced a death, our migration adjustment would
add more than 55,000 deaths to the total generated by our household
survey (calculation: 2 million migrants/5.34 per household = 374,532
households; those households60.149 experiencing deaths = 55,805
total deaths attributable to external migrants).
Total EstimateOur household survey produced death rates that, when
multiplied by the population count for each year, produced an
estimate of 405,000 total deaths. Our migration adjustment would
Figure 4. Raw number of adult deaths by year and cause, 2001–2011, reported by the University Collaborative Iraq Mortality Study.Counts of deaths reported by respondents to the sibling survival questionnaire, by year and cause. The estimates use the ICSS method to correct forsurvival bias [33]. The survey concluded July 2, 2011, so the final bar reflects data for only half of the year.doi:10.1371/journal.pmed.1001533.g004
Iraq Mortality Study
PLOS Medicine | www.plosmedicine.org 9 October 2013 | Volume 10 | Issue 10 | e1001533
add an additional 55,805 deaths to that total. Our total excess
death estimate for the wartime period, then, is 461,000, just under
half a million people.
Discussion
We estimate about half a million excess deaths occurred in Iraq
following the US-led invasion and occupation (March 2003–2011).
This estimate is derived from reports of deaths by respondents in
our nationally representative survey of 2,000 households in 100
clusters, and adds a correction for deaths that would have been
reported by households that emigrated. Our household data
indicate that the wartime crude death rate in Iraq was 4.6 per
1,000 PY, more than 0.5 times higher than the death rate during
the 26-mo period preceding the war. We were also able to estimate
the risk of death among adults, both before and during the war, by
asking all adults in the household about the deaths of their siblings,
and learned that the risk of death rose 0.7 times higher for women
and 2.9 times higher for men between the pre-war period and the
peak of the war. There were an estimated 766 excess (war-related)
adult deaths per week when the war was taking its highest
casualties, with about 70% of these attributable to war-related
violence.
Five previous studies of mortality in Iraq were conducted over
the course of the war using household surveys. Roberts et al. [31]
estimated 12.3 deaths per 1,000 PY (for the period 2003–2004).
That finding was reasonably similar to the rate obtained by the
study by Burnham et al. [30] conducted 2 y later (2003–2006),
which reported 13.2 deaths per 1,000 PY. The IFHS [32]
conducted during a similar period (2003–2006) reported a lower
crude death rate (5.31 per 1,000 PY), although this survey failed to
collect primary data from 115 high-violence clusters (of 1,086),
and instead imputed missing data for these clusters from Iraq Body
Count (http://www.iraqbodycount.org/) figures. The Iraq Living
Conditions Survey [28] conducted in the spring of 2004 attempted
to count war-related deaths for the period March 20, 2003–May
Figure 5. Estimates of numbers of adult deaths per week in Iraq for 2-y intervals, 2001–2011, by cause as reported by siblings in theUniversity Collaborative Iraq Mortality Study. National estimate of deaths in Iraq between 2001 and 2011. Age-specific mortality rates wereestimated separately within 2-y blocks (the first two time intervals are not strictly 2 y long, in order to align the first interval dividing point with thestart of the war in March 2003; the survey concluded July 2, 2011, so the final bar reflects only half of the year). The counterfactual (had there been nowar) estimate shows the predicted death counts if crude death rates had remained at their average level from 2001–2002 during the war andoccupation (in gray). War-related, but not violent, deaths above the normal baseline are in the salmon-colored area. War-related violent deaths areportrayed in red. The estimates use the ICSS method to correct for survival bias [33].doi:10.1371/journal.pmed.1001533.g005
Iraq Mortality Study
PLOS Medicine | www.plosmedicine.org 10 October 2013 | Volume 10 | Issue 10 | e1001533
30, 2004 (estimated at between 18,000 and 29,000) and war-
related chronic illnesses (200,000), but did not report an all-cause
death rate. At the high end of estimates, an Opinion Research
Business poll [29] in 2007 estimated a violent (not all-cause)
mortality rate of 10.3 per 1,000 PY for all but three governorates
(Kerbela, Al-Anbar, and Erbil). As an alternative to conducting
household surveys, the Iraq Body Count used media and other
accounts to simply tally civilian war fatalities, arriving at a total of
about 116,475 (or about 0.4 deaths per 1,000 PY as of February
2013). We provide comparisons of some of these rates in Figures 3
and 6.
We have three hypotheses for the low crude death rates we found
in comparison to three previous retrospective mortality surveys:
sampling differences, recall bias, and other non-sampling errors,
and/or reporting problems related to migration. Our study used
different sampling methods than Roberts et al. [31], Burnham et al.
[30], and IFHS. Not only did we sample at least twice the number of
clusters as Roberts et al. and Burnham et al.—albeit with the same
sample size—we also selected the sample using a more sophisticated
randomization approach. Our methods may have avoided biases
that served to overrepresent deaths in the other two studies. In
contrast to IFHS, we skipped only one cluster for security reasons,
and did not substitute Iraq Body Count data, which we know
underrepresent death rates. The long recall period required of
participants in this study likely contributed to underreporting of
deaths, and in the setting of a country with increasing sectarian
divisions, some people may have been unwilling to report deaths, as
well. The war has also caused wide-scale redistribution of Iraq’s
population, both internally and externally; we know we missed the
families that migrated out of the country, and likely missed a
representative proportion of internally displaced people as well. We
know the earlier census data did not capture these movements, and
our sample was selected using those data. It is highly likely that
households experiencing more violence were more likely to migrate,
thus serving to reduce our death rates using the retrospective
mortality survey method.
Figure 6. Estimates of the probability of dying between age 15 and age 60 y, by sex and 2-y intervals, 2001–2011, from siblinghistories as reported in the University Collaborative Iraq Mortality Study, with plotted estimates from other studies. Estimates ofadult mortality risk (45q15, the risk of dying between the ages of 15 and 59 y), over the period 2001–2011, based on the sibling history survey. The firsttwo time intervals are not strictly 2 y long, in order to align the first interval dividing point with the start of the war in March 2003; the surveyconcluded July 2, 2011, so the final bar reflects only half of the year. The estimates use the ICSS method to correct for survival bias [33]. Mortalityestimates from other studies are plotted as point estimates: IMIRA (part of the Iraq Living Conditions Survey) [28], the IFHS household survey (IFHS-HH), and the IFHS sibling survey (IFHS-SIB) [32].doi:10.1371/journal.pmed.1001533.g006
Iraq Mortality Study
PLOS Medicine | www.plosmedicine.org 11 October 2013 | Volume 10 | Issue 10 | e1001533
The gold standard for measuring conflict-related mortality is
prospective active surveillance, with real-time data collection of
mortality events as they occur [62,63]. International initiatives to
commence these methods prior to the outbreak of war have been
recommended [64], and could be initiated now for the several
anticipated or emerging armed conflicts. Failing that, retrospective
surveys are the next best approach, despite their shortcomings
(which include delays in analysis and reporting, large confidence
intervals, lack of good baseline data for comparison purposes, and
the inability to capture varying results by sub-region using feasible
sample sizes). Body counts based on passive surveillance are the
least reliable of methods [62].
Our study has limitations. National systems of census count and
vital registration are typically disrupted during war, making it
difficult to use recent measures for a denominator population. We
relied on Iraq’s decades-old census reports, as more recently
projected by the national population authority (COSIT). These
are obviously imperfect. Our sub-analysis of Baghdad clusters
(Figure 7) and the comparison of our sample to the COSIT census
distribution by governorate (with a 14% index of dissimilarity)
indicates our sample was representative. Any cluster sample,
however, is likely to miss sequestered enclaves of various types,
some of which may have had particularly low or high mortality.
Our sample likely did not include a good representation of the 1.1
million people who were living in camps or buildings as internally
displaced people [60]. Additionally, we replaced one start
household that no longer existed, and when a household was
vacant after two visits we replaced it; these could have led to
sampling bias. Verbal autopsies were not done, and thus family
reports on causes of death were not validated.
Retrospective reports of death by household members and
siblings require survivors to make accurate accounts. Threats to
validity of estimates from household and sibling reports include the
lack of survivors (due to household dissolution or migration or no
surviving siblings), recall bias, unwillingness to report, and
sampling error.
To address survivor bias, we attempted to estimate deaths that
would have been reported by household members that had
migrated. The sibling method we used also includes a correction
for survival bias. We assessed the role of recall bias at length (see
Text S2 for details), and concluded that our results were robust to
this potential problem, provided such bias affected both pre-war
and post-war reporting periods.
Most excess deaths (above pre-war rates) were attributable
directly to violence, primarily from gunshots, car bombs, and
explosions. Cardiovascular conditions were the principal cause of
about half of nonviolent deaths. War-induced excess deaths not
caused by violence would include those caused by diversion of the
health system to a focus on crisis care, interruption of distribution
networks for crucial supplies, and the collapse of infrastructure
Figure 7. Density of civilian deaths in Baghdad, with the cluster locations of the University Collaborative Iraq Mortality Study aswell as 2006 cluster locations of a previous study [30]. The density map was generated using a kernel density estimation of civilian deathsfrom the Wikileaks Iraq War Logs release [55]. The kernel density estimation provides a smoothed surface from a point pattern that represents spatialvariation in the density of events, in this case civilian deaths. This allows for a crude visual analysis of the variation of events across space in Baghdadas well as the relation of 2006 and 2011 cluster locations to the density of civilian deaths. Analysis is based on geolocated data of all civilian deaths byany means reported in the Wikileaks Iraq War Logs data from 2004 to 2009.doi:10.1371/journal.pmed.1001533.g007
Iraq Mortality Study
PLOS Medicine | www.plosmedicine.org 12 October 2013 | Volume 10 | Issue 10 | e1001533
that protects clean water, nutrition, transportation, waste man-
agement, and energy. Further, war contributes to a climate of fear,
humiliation, and interruption of livelihoods that undermines
health [65–68].
The pattern of mortality we observed with both our household
and sibling methods correlates with media accounts of how the
violence rose and ebbed over the years of the war. Deaths
increased to twice expected levels at the onset of the war,
plateaued briefly at the end of 2003, then rose again to a new peak
in 2006. Thereafter, deaths dropped until 2008, when they leveled
off, and then rose again slightly just before the time of our data
collection in 2011.
The number of events recorded by the households we visited
was relatively small, yet it generated rates that appear large when
magnified to the national population; that is the nature of this
method. On the other hand, we did not adjust for world secular
trends of declining mortality, therefore probably understating the
number of excess deaths over this long conflict.
Although the US military initially denied tracking civilian
deaths, 2011 Wikileaks documents revealed that coalition forces
did track some noncombatant deaths. The emergence of the
Wikileaks ‘‘Iraq War Logs’’ reports in October 2010 [69]
prompted the Iraq Body Count team to add to its count, but a
recent comparison of recorded incidents between the two
databases revealed that the Iraq Body Count captured fewer than
one in four of the Iraq War Logs deaths [70]. One important
reason for the discrepancy is that small incidents are often missed
in press reports. For example, when asked why the assassination of
a medical school dean in Baghdad did not merit reporting, Tim
Arango (of the New York Times) stated in personal correspondence
to AH in April 2011, ‘‘Unfortunately there are numerous
assassinations every day, and we cannot cover them all.’’
The deaths of citizens swept up in the conflict are seldom
commemorated [71], and yet memorializing and reconciling these
casualties has been found to be important for creating a peaceful
post-conflict society [72–74]. Those who attempted to predict the
mortality consequences of an impending invasion of Iraq in 2002
under-projected the death count [75], because methods for this
type of assessment remain too crude. Estimates of mortality in the
final stages of this protracted war suffer from methodological
problems as well, because of complex population shifts [54]. Our
contribution has been to use one nationally representative sample
to collect both household and adult sibling mortality data.
Researchers should continue to refine methods to count the
mortality effects of conflicts.
The American Public Health Association has adopted a policy
encouraging governments to conduct health impact assessments
prior to making policy decisions, such as entering into war [76].
When researchers can refine methods to project death counts in
advance, as well as to measure total deaths incurred as wars
conclude, the public can make wiser decisions about the costs of
entering into armed conflict. An authoritative worldwide body
could assemble scholars to perfect these methods.
Supporting Information
Figure S1 Figure illustrating sample selection.(DOCX)
Manual S1 Field manual for data collection personnel.(DOC)
Questionnaire S1 Questionnaire used by data collectionpersonnel.(DOCX)
Text S1 Additional methods.(DOCX)
Acknowledgments
We express gratitude to our interviewers, who visited more than 2,000
Iraqi households at personal risk, and to co-authors who requested
anonymity. We are thankful to Johan von Schreeb and Skip Burkle, who
reviewed the manuscript. The bioethicist we consulted, Benjamin Wilfond,
was a member of the University of Washington’s Institute of Translational
Health Sciences—Regulatory Support and Bioethics Core, supported by
the National Center for Advancing Translational Sciences of the National
Institutes of Health (UL1TR000423). University of Washington adminis-
trators Craig Johnson and Sally Weatherford helped with logistics.
Shannon Doocy and Linnea Zimmerman at Johns Hopkins University
provided consultations on data, and Ben Birnbaum set up the website
dashboard to monitor incoming field data. We are grateful to Les Roberts
for his encouragement.
Author Contributions
Conceived and designed the experiments: AH ADF TT SAS JR SB LG
BHA WW CJM GB. Performed the experiments: AH ADF TT SAS JR SB
ALR LG BHA WW CJM GB. Analyzed the data: AH ADF TT JR SB
ALR LG GB. Wrote the first draft of the manuscript: AH. Contributed to
the writing of the manuscript: AH ADF TT SAS JR SB ALR LG BHA
WW CJM GB. ICMJE criteria for authorship read and met: AH ADF TT
SAS JR SB ALR LG BHA WW CJM GB. Agree with manuscript results
and conclusions: AH ADF TT SAS JR SB ALR LG BHA WW CJM GB.
References
1. Bird SM (2004) Military and public-health sciences need to ally. Lancet 364: 1831–1833.
2. Greer B (2009) Estimating Iraqi deaths: a case study with implications formathematics education. ZDM 41: 105–116.
3. Karagiozakis M (2009) Counting excess civilian casualties of the Iraq War:
science or politics? The Journal of Humanitarian Assistance. Available: http://sites.tufts.edu/jha/archives/559. Accessed 10 September 2013.
4. Tapp C, Burkle FM Jr, Wilson K, Takaro T, Guyatt GH, et al. (2008) Iraq Warmortality estimates: a systematic review. Confl Health 2: 1.
5. Johnson NF, Gourley S, Onnela J-P, Reinert G (2008) Bias in epidemiological
studies of conflict mortality. J Peace Res 45: 653–663.6. Daponte BO (2007 December) Wartime estimates of Iraqi civilian casualties.
Rev Int Croix Rouge 89: 943–957.7. Abad-Franch F (2005) Mortality in Iraq. Lancet 365: 1134.
8. Al-Rubeyi BI (2004) Mortality before and after the invasion of Iraq in 2003.Lancet 364: 1834–1835.
9. Burkle FM Jr, Greenough PG (2007) Mortality in Iraq. Lancet 369: 104.
10. Burnham G, Lafta R, Doocy S, Roberts L (2007) Mortality in Iraq—authors’reply. Lancet 369: 103–104.
11. Dougherty J (2007) Mortality in Iraq. Lancet 369: 102–103.12. Garfield R (2008) Measuring deaths from conflict. BMJ 336: 1446–1447.
13. Giles J (2007) Death toll in Iraq: survey team takes on its critics. Nature 446: 6–7.
14. Guha-Sapir D, Degomme O, Pedersen J (2007) Mortality in Iraq. Lancet 369: 102.
15. Hicks MH (2007) Mortality in Iraq. Lancet 369: 101–102.
16. Horton R (2004) The war in Iraq: civilian casualties, political responsibilities.Lancet 364: 1831.
17. Jha P, Gajalakshmi V, Dhingra N, Jacob B (2007) Mortality in Iraq. Lancet 369:
101.18. LeVine M (2007) Mortality in Iraq. Lancet 369: 105.
19. Raisman G (2005) Does medicine have a moral message? Lancet 365: 1134–1135.
20. Roberts I, Renton F (2003) War in Iraq: medical journals and the manufacture
of consent. J Natl Med Assoc 95: 628–629.21. Roberts L, Burnham G, Garfield R (2005) Mortality in Iraq—authors’ reply.
Lancet 365: 1133–1134.22. Spagat M (2008 Jul 3) Inconsistent comparisons and unsound conclusions. BMJ
Rapid Response. Available: http://www.bmj.com/rapid-response/2011/11/02/inconsistent-comparisons-and-unsound-conclusions. Accessed 10 September 2013.
23. Spagat M (2009) Iraq study failed replication test. Science 324: 590.
24. von Schreeb J, Rosling H, Garfield R (2007) Mortality in Iraq. Lancet 369: 101.25. Levy BS, Sidel VW (2013) Adverse health consequences of the Iraq War. Lancet
381: 949–958.26. Mills EJ, Checchi F, Orbinski JJ, Schull MJ, Burkle FM Jr, et al. (2008) Users’
guides to the medical literature: how to use an article about mortality in a
humanitarian emergency. Confl Health 2: 9.
Iraq Mortality Study
PLOS Medicine | www.plosmedicine.org 13 October 2013 | Volume 10 | Issue 10 | e1001533
27. United Nations Department of Economic and Social Affairs, United Nations
Statistics Division Demographic and Social Statistics Branch (2009 Mar 30)Technical report on the status of civil registration and vital statistics in ESCWA
region. Available: http://unstats.un.org/unsd/demographic/CRVS/
Technical%20report%20ESCWA%20Final.pdf. Accessed 10 September 2013.28. Central Organization for Statistics and Information Technology, Ministry of
Planning and Development Cooperation, (2005) Iraq Living Conditions Survey2004. Baghdad: Central Organization for Statistics and Information Technol-
ogy.
29. Opinion Research Business (2007 September) More than 1,000,000 Iraqismurdered. London: Opinion Research Business.
30. Burnham G, Lafta R, Doocy S, Roberts L (2006) Mortality after the 2003invasion of Iraq: a cross-sectional cluster sample survey. Lancet 368: 1421–1428.
31. Roberts L, Lafta R, Garfield R, Khudhairi J, Burnham G (2004) Mortalitybefore and after the 2003 invasion of Iraq: cluster sample survey. Lancet 364:
1857–1864.
32. Alkhuzai AH, Ahmad IJ, Hweel MJ, Ismail TW, Hasan HH, et al. (2008)Violence-related mortality in Iraq from 2002 to 2006. N Engl J Med 358: 484–
493.33. Levin-Rector A, Rajaratnam J, Wang H, Schumacher A, Levitz C, et al. (2012)
Improved analysis of sibling survival data taking into account survivor bias, zero-
surviving reporters and recall bias. In: Murray C, Lopez A, Wang H, editors.Mortality estimation for national populations: methods and applications. Seattle:
University of Washington Press.34. Obermeyer Z, Rajaratnam JK, Park CH, Gakidou E, Hogan MC, et al. (2010)
Measuring adult mortality using sibling survival: a new analytical method andnew results for 44 countries, 1974–2006. PLoS Med 7: e1000260. doi:10.1371/
journal.pmed.1000260
35. Gakidou E, King G (2006) Death by survey: estimating adult mortality withoutselection bias from sibling survival data. Demography 43: 569–585.
36. Bonita R, Beaglehole R, Kjellstrom T (2006) Basic epidemiology, 2nd edition.Geneva: World Health Organization.
37. Checchi F, Roberts L (2005) Interpreting and using mortality data in
humanitarian emergencies: a primer for non-epidemiologists. HumanitarianPractice Network Paper, Number 52. London: Overseas Development Institute.
38 p.38. Galway LP, Bell N, Al Shatari SA, Hagopian A, Burnham G, et al. (2012) A two-
stage cluster sampling method using gridded population data, a GIS, and GoogleEarthTM imagery in a population-based mortality survey in Iraq. Int J Health
Geogr 11: 12.
39. Birnbaum B, DeRenzi B, Flaxman AD, Lesh N (2012) Automated qualityassurance for mobile data collection. In: ACM Dev ’12: Proceedings of the 2nd
ACM Symposium on Computing for Development. Article No. 1. doi: 10.1145/2160601.2160603
40. Efron B (1982) The jackknife, the bootstrap and other resampling plans.
Philadelphia: Society for Industrial and Applied Mathematics.41. Rao J, Wu C (1988) Resampling inference with complex survey data. J Am Stat
Assoc 83: 231–241.42. United Nations Population Division (2011) World population prospects: the
2010 revision. ST/ESA/SER.A/313. New York: United Nations PopulationDivision.
43. Carlin JB, Hocking J (1999) Design of cross-sectional surveys using cluster
sampling: an overview with Australian case studies. Aust N Z J Public Health 23:546–551.
44. Rajaratnam JK, Marcus JR, Levin-Rector A, Chalupka AN, Wang H, et al.(2010) Worldwide mortality in men and women aged 15–59 years from 1970 to
2010: a systematic analysis. Lancet 375: 1704–1720.
45. Butler D (2006) Scientists become targets in Iraq. Nature 441: 1036–1037.46. Doocy S, Burnham G (May, 2009) The Iraqi population in Syria. Baltimore
(Maryland): International Catholic Migration Commission and Johns HopkinsUniversity.
47. American Association for Public Opinion Research (2010) The code of
professional ethics and practices (revised May, 2010). Deerfield (Illinois):American Association for Public Opinion Research.
48. Council for International Organizations of Medical Sciences (2008) Interna-tional ethical guidelines for epidemiological studies. Geneva: Council for
International Organizations of Medical Sciences.49. Ford N, Mills EJ, Zachariah R, Upshur R (2009) Ethics of conducting research
in conflict settings. Confl Health 3: 7.
50. Preston S, Heuveline P, Guillot M (2001) Demography: measuring andmodeling population processes. London: Blackwell Publishers.
51. Vaessen M, Thiam M, Le T (2005) The Demographic and Health Surveys. In:
Household sample surveys in developing and transition countries. pp. 495–522.
Available: http://unstats.un.org/unsd/hhsurveys/pdf/Chapter_22.pdf.; New
York: United Nations Statistics Division.
52. Gregory D (2008) The Biopolitics of Baghdad: counterinsurgency and the
counter-city. Hum Geogr 1: 6–27.
53. Gregory D (2010) Seeing red: Baghdad and the event-ful city. Polit Geogr 29:
266–279.
54. International Organization for Migration (2011 February) Review of displace-
ment and return in Iraq, February 2011. Geneva: International Organization for
M i g r a t i o n . A v a i l a b l e : h t tp ://w ww. iomi raq .ne t/Documen t s/
Five%20Years%20of%20post-Samarra%20Displacement%20in%20Iraq,%20Feb%
202011%20EN.pdf. Accessed 18 September 2013.
55. The Guardian Datablog (2010) Wikileaks Iraq: data journalism maps every
death. Available: http://www.guardian.co.uk/news/datablog/2010/oct/23/
wikileaks-iraq-data-journalism#data. Accessed 14 February 2013.
56. United Nations High Commissioner for Refugees (2011) UNHCR Statistical
Online Population Database [database]. Geneva: United Nations High
Commissioner for Refugees.
57. Doocy S, Sirois A, Anderson J, Tileva M, Biermann E, et al. (2011) Food
security and humanitarian assistance among displaced Iraqi populations in
Jordan and Syria. Soc Sci Med 72: 273–282.
58. Lischer SK (2008) Security and displacement in Iraq: responding to the forced
migration crisis. Int Secur 33: 95–119.
59. United Nations High Commissioner for Refugees (2013) UNHCR country
operations profile—Iraq. Geneva: United Nations High Commissioner for
Refugees.
60. United Nations High Commissioner for Refugees (2011) UNHCR Iraq fact
sheet—December 2011. Geneva: United Nations High Commissioner for
Refugees.
61. Burnham G, Hoe C, Hung YW, Ferati A, Dyer A, et al. (2011) Perceptions and
utilization of primary health care services in Iraq: findings from a national
household survey. BMC Int Health Hum Rights 11: 15.
62. Checchi F, Roberts L (2008) Documenting mortality in crises: what keeps us
from doing better. PLoS Med 5: e146. doi:10.1371/journal.pmed.0050146
63. Burkle F Jr, Garfield R (2013) Civilian mortality after the 2003 invasion of Iraq.
Lancet 381: 877–879.
64. Setel PW, Macfarlane SB, Szreter S, Mikkelsen L, Jha P, et al. (2007) A scandal
of invisibility: making everyone count by counting everyone. Lancet 370: 1569–
1577.
65. Apfelroth S (2005) Mortality in Iraq. Lancet 365: 1133.
66. Levy B, Sidel V (2008) War and public health. New York: Oxford University
Press.
67. Murray C, Lopez A (1996) The global burden of disease: a comprehensive
assessment of mortality and disability from diseases, injuries, and risk factors in
1990 and projected to 2020. Boston: Harvard School of Public Health.
68. Daponte BO (1993) A case study in estimating casualties from war and its
aftermath: the 1991 Persian Gulf War. PSR Q 3: 57–66.
69. Wikileaks (2010 Oct 22) The Iraq war logs [archive]. Available: http://wikileaks.
org/irq/. Accessed 10 September 2013.
70. Carpenter D, Fuller T, Roberts L (2013) WikiLeaks and Iraq Body Count: the
sum of parts may not add up to the whole—a comparison of two tallies of Iraqi
civilian deaths. Prehosp Disaster Med 28: 223–229.
71. Tirman J (2011) The deaths of others: the fate of civilians in America’s wars.
New York: Oxford University Press.
72. Stein DJ, Seedat S, Kaminer D, Moomal H, Herman A, et al. (2008) The impact
of the Truth and Reconciliation Commission on psychological distress and
forgiveness in South Africa. Soc Psychiatry Psychiatr Epidemiol 43: 462–468.
73. Laplante LJ, Holguin MR (2006) The Peruvian Truth Commission’s mental
health reparations: empowering survivors of political violence to impact public
health policy. Health Hum Rights 9: 136–163.
74. Ui S, Leng K, Aoyama A (2007) Building peace through participatory health
training: a case from Cambodia. Glob Public Health 2: 281–293.
75. Medact (2002) Collateral damage: the health and environmental costs of war on
Iraq. Available: http://www.medact.org/article_health.php?articleID = 620.
Accessed 10 September 2013.
76. American Public Health Association (2012) Promoting health impact assessment
to achieve health in all policies. Available: http://www.apha.org/advocacy/
policy/policysearch/default.htm?id = 1444. Accessed 10 September 2013.
Iraq Mortality Study
PLOS Medicine | www.plosmedicine.org 14 October 2013 | Volume 10 | Issue 10 | e1001533
Editors’ Summary
Background. War is a major public health problem. Itshealth effects include violent deaths among soldiers andcivilians as well as indirect increases in mortality andmorbidity caused by conflict. Unlike those of other causesof death and disability, however, the consequences of waron population health are rarely studied scientifically. Inconflict situations, deaths and diseases are not reliablymeasured and recorded, and estimating the proportioncaused, directly or indirectly, by a war or conflict ischallenging. Population-based mortality survey methods—asking representative survivors about deaths they knowabout—were developed by public health researchers toestimate death rates. By comparing death rate estimates forperiods before and during a conflict, researchers can derivethe number of excess deaths that are attributable to theconflict.
Why Was This Study Done? A number of earlier studieshave estimated the death toll in Iraq since the beginning ofthe war in March 2003. The previous studies covereddifferent periods from 2003 to 2006 and derived differentrates of overall deaths and excess deaths attributable to thewar and conflict. All of them have been controversial, andtheir methodologies have been criticized. For this study,based on a population-based mortality survey, the research-ers modified and improved their methodology in responseto critiques of earlier surveys. The study covers the periodfrom the beginning of the war in March 2003 until June2011, including a period of high violence from 2006 to 2008.It provides population-based estimates for excess deaths inthe years after 2006 and covers most of the period of the warand subsequent occupation.
What Did the Researchers Do and Find? Interviewerstrained by the researchers conducted the survey betweenMay 2011 and July 2011 and collected data from 2,000randomly selected households in 100 geographical clusters,distributed across Iraq’s 18 governorates. The interviewersasked the head of each household about deaths amonghousehold members from 2001 to the time of the interview,including a pre-war period from January 2001 to March 2003and the period of the war and occupation. They also askedall adults in the household about deaths among theirsiblings during the same period. From the first set of data,the researchers calculated the crude death rates (i.e., thenumber of deaths during a year per 1,000 individuals) beforeand during the war. They found the wartime crude deathrate in Iraq to be 4.55 per 1,000, more than 50% higher thanthe death rate of 2.89 during the two-year period precedingthe war. By multiplying those rates by the annual Iraqpopulation, the authors estimate the total excess Iraqi deathsattributable to the war through mid-2011 to be about405,000. The researchers also estimated that an additional56,000 deaths were not counted due to migration. Includingthis number, their final estimate is that approximately half amillion people died in Iraq as a result of the war andsubsequent occupation from March 2003 to June 2011.The risk of death at the peak of the conflict in 2006 almosttripled for men and rose by 70% for women. Respondents
attributed 20% of household deaths to war-related violence.Violent deaths were attributed primarily to coalition forces(35%) and militia (32%). The majority (63%) of violent deathswere from gunshots. Twelve percent were attributed to carbombs. Based on the responses from adults in the surveyedhouseholds who reported on the alive-or-dead status of theirsiblings, the researchers estimated the total number ofdeaths among adults aged 15–60 years, from March 2003 toJune 2011, to be approximately 376,000; 184,000 of thesedeaths were attributed to the conflict, and of those, theauthors estimate that 132,000 were caused directly by war-related violence.
What Do These Findings Mean? These findings providethe most up-to-date estimates of the death toll of the Iraqwar and subsequent conflict. However, given the difficultcircumstances, the estimates are associated with substantialuncertainties. The researchers extrapolated from a smallrepresentative sample of households to estimate Iraq’snational death toll. In addition, respondents were asked torecall events that occurred up to ten years prior, which canlead to inaccuracies. The researchers also had to rely onoutdated census data (the last complete population censusin Iraq dates back to 1987) for their overall populationfigures. Thus, to accompany their estimate of 460,000excess deaths from March 2003 to mid-2011, the authorsused statistical methods to determine the likely range of thetrue estimate. Based on the statistical methods, theresearchers are 95% confident that the true number ofexcess deaths lies between 48,000 and 751,000—a largerange. More than two years past the end of the periodcovered in this study, the conflict in Iraq is far from over andcontinues to cost lives at alarming rates. As discussed in anaccompanying Perspective by Salman Rawaf, violence andlawlessness continue to the present day. In addition, post-war Iraq has limited capacity to re-establish and maintain itsbattered public health and safety infrastructure.
Additional Information. Please access these websites viathe online version of this summary at http://dx.doi.org/10.1371/journal.pmed.1001533
N This study is further discussed in a PLOS MedicinePerspective by Salman Rawaf.
N The Geneva Declaration on Armed Violence andDevelopment website provides information on the globalburden of armed violence.
N The International Committee of the Red Cross providesinformation about war and international humanitarian law(in several languages).
N Medact, a global health charity, has information on healthand conflict.
N Columbia University has a program on forced migrationand health.
N Johns Hopkins University runs the Center for Refugee andDisaster Response.
N University of Washington’s Health Alliance Internationalwebsite also has information about war and conflict.
Iraq Mortality Study
PLOS Medicine | www.plosmedicine.org 15 October 2013 | Volume 10 | Issue 10 | e1001533
Related Documents